Embed Size (px)
Citation preview
1
Statistics of Income Tabulations: High Incomes, Gender, Age, Earnings Split, and Non-filers
Emmanuel Saez, UC Berkeley and NBER
December 2016
Abstract: This paper uses internal tax data since 1979 to produce a series of statistics of income tabulations aiming at supplementing the existing official tabulations produced by the Statistics of Income Division (SOI) of the Internal Revenue Service. We produce five types of tabulations. (1) Statistics of tax filers with Adjusted Gross Income (AGI) above $10m since 1996. (2) Statistics on the gender of single filers by size of AGI and share of wage income in AGI. (3) Statistics on the age of tax filers by size of AGI and share of wage income in AGI. (4) Statistics on the earnings split between spouses for married tax filers by size of family earnings. (5) Statistics on non-filers since 1999. Most of these statistics had already been produced by the Statistics of Income but typically for isolated years. To test the value of these tabulations, we use them (along with other publicly available data such as the Public Use files of individual income tax data) to compute various time series of distributional income and tax statistics. We compare these statistics with the same statistics directly produced from internal SOI data (the economic substance of the series created is presented in detail in our companion paper, Piketty, Saez, and Zucman, 2016). Emmanuel Saez, Professor of Economics, University of California, Berkeley, California. [email protected]. This paper was developed in the context of the external research contract TIRNO-15-P-00060 with the Statistics of Income (SOI) Division at the US Internal Revenue Service under the supervision of Mike Weber at SOI. I am grateful to Victoria Bryant, Barry Johnson, and Mike Weber at SOI for helpful comments and guidance in using the tax data. This project benefitted from discussions with Gerry Auten at the Office of Tax Analysis at the US Treasury and David Splinter at the Joint Committee on Taxation. All the statistics created in this project as well as any possible error are the sole responsibility of the author. I thank Kaveh Danesh, Sam Karlin, and Carl McPherson for outstanding research assistance.
2
1. Introduction and Motivation
This paper use internal tax data since 1979 to produce a series of statistics of
income tabulations aiming at supplementing the existing official tabulations produced by
the Statistics of Income Division of the Internal Revenue Service. We produce five types
of tabulations. (1) Statistics of tax filers with Adjusted Gross Income above $10m since
1996. (2) Statistics on the gender of single filers by size of income. (3) Statistics on the
age of tax filers by size of income. (4) Statistics on the earnings split between spouses
for married tax filers. (5) Statistics on non-filers since 1999. Most of these statistics have
already been produced by the Statistics of Income but typically for isolated years. In all
cases and to protect confidentiality, tabulated statistics are based on cells containing
each at least 10 records. These statistics are useful to supplement existing public use
files (PUF) of individual tax returns, which do not contain information on age, gender,
earnings split, or records for non-filers.1 These tabulations are all gathered in the
companion excel sheet outsheetsoi.xlsx. The first sheet provides a detailed explanation
of the content of each sheet in the file.
Next, to illustrate the value of these tabulations, we use them (along with other
publicly available data such as the PUFs) to compute various time series of
distributional income and tax statistics and compare them with the same statistics
directly produced from internal data. The economic substance of the series is presented
in more detail in the companion paper Piketty, Saez, and Zucman (2016). In particular,
the statistics we produce cover the full population (and not only tax filers), they provide
details up to the very top fractiles of the distribution (the top .001%), they are based on
the individual adult unit (instead of the tax unit), and they provide basic demographic
breakdowns by age and gender. These statistics are extended back to earlier periods
(using SOI tabulated data starting with tax year 1913).
The extensive income and tax statistics comparing the enhanced PUFs to the
internal data are gathered in the large companion worksheet Outsheets.xlsx. These
1 See US Treasury, IRS, SOI (2016) for a detailed description of the most recent 2010 tax year PUF dataset. The PUF are not fully representative at the top either since 1996 as they exclude some extreme records from their sampling for confidentiality. In 2009, SOI did introduce additional gender, age, and earnings split information (see Bryant et al. 2014 for a detailed presentation of the 2009 PUF redesign).
3
statistics are always national distributional statistics with detailed fractiles at the very
top. They are always based on a fairly large number of records (hundreds at a
minimum). Any percentile threshold has been rounded to protect confidentiality. The first
sheet of the excel file outsheets.xlsx is called “Explanations” and provides a detailed
explanation of the information includes in each of the subsequent excel worksheets.
These worksheets were directly produced from the underlying tax data both externally
(combining the public use files and other publicly available data with the tabulations
produced in this paper) and internally (using the exact internal individual income tax files
created by SOI). Our programs are available upon request to interested researchers.
It is important to note that there is a long and vibrant tradition at SOI of publishing
special studies that have provided valuable information on age and gender statistics by
size of income, wage earnings split among couples, among many others. These special
studies have been published over the years in the Statistics of Income Bulletin and are
also gathered online systematically at https://www.irs.gov/uac/soi-tax-stats-special-
studies-on-individual-tax-return-data. The analysis we are providing in this document
builds upon these earlier efforts and attempts to produce statistics across all available
years in a consistent format. In each section and subsection, we cite the relevant SOI
studies before we carry out our analysis.
This paper is organized as follows. Section 2 discusses the tabulations on
taxpayers with AGI above $10m. Section 3 discusses the tabulations by age, gender,
and earnings split within married couples. Section 4 discusses non-filers. Finally,
Section 5 compares income and tax statistics produced with internal data vs. the same
statistics produced using public use data supplemented with the tabulations produced
here.
2. Statistics on high income earners (AGI above $10m)
SOI produces detailed official statistics of income each year in Publication 1304.
These statistics provide information on various income components, taxes, credits, and
filer status by size of Adjusted Gross Income up to a top bracket with Adjusted Gross
Income above $10m. In this paper, we extend these statistics for the top bracket of tax
4
filers with AGI above $10m by providing income information for a larger number of
variables than in the official SOI publication. The variables are chosen to match the
variables supplied in the Public Use File. This tabulation is useful to supplement the
PUF because, starting in 1996, the PUF has excluded extreme records from its
sampling so that it is no longer fully representative at the very top. For example, in
2007, total AGI reported by tax filers with AGI above $10m is $562bn in the official SOI
series (US Treasury, Statistics of Income, Publication 1304) but only $423bn in the
PUF, a deficit of 25%.
The statistics for all years from 1996 to 2014 are presented in a sheet in the
excel file outsheetsoi.xls using the NBER convention developed by Daniel Feenberg for
naming variables in the PUF. Note that the statistics are based on thousands of records
(ranging from a low of 3706 in 1996 to a high of 18394 in 2007) so that this tabulation
does not create any disclosure risk.
3. Age, gender, and earnings split tabulations
We create a very basic set of tabulations on gender, age, and earnings split
within married couples using the SOI individual income tax files. These tabulations are a
useful complement to the PUF, which do not contain any such information (except for
an indicator for age 65+ and some information for isolated years).
Note that SOI has already produced over the years a number of similar
tabulations that provide age, gender, and earnings split tabulations. But these special
tabulations have typically been done for isolated years. Sailer, Yau, and Rehula (2001)
present a comprehensive analysis for tax year 1998. Yau, Gurka, Sailer (2003) present
an analysis of wages by gender for 1969, 1979, 1989, 1999. Curry and Dent (2011)
analyze the age distribution of tax filers for years 1997 and 2007. Lowrey (2005)
analyzes the gender composition of sole proprietorship income for 1985-2000. More
recently, SOI has been posting systematic tables providing extra demographic
information for wages income and AGI. For W2 wage earnings, detailed tables by
gender, age, and marital status are available for years 2008-2010 (US Treasury, SOI
Tax Stats - Individual Information Return Form W-2: Wage Statistics). For AGI, detailed
5
tables by age and marital status and size of AGI have been produced since tax year
2006 in the official Statistics of Income: Individual Income Tax Returns Publication 1304
(Tables 1.5 and 1.6).
Our proposed tabulations build upon these previous studies, they are geared at
providing systematic information across all years available.
Individual SOI files start in 1979 and have age and gender information since
1979. Wage earnings within married couples are available through matching with the
SOI DATABANK individual W2 information starting in 1999. Hence, we can produce the
following tabulations to impute age and gender starting in 1979 and wage earnings
splits starting in 1999. To keep the size of tables small, we consider only 3 very basic
age breakdowns: less than 45, 45-64, and 65+. All these tabulations are reported in the
companion excel sheet outsheetsoi.xls. All tabulations are based on cells including at
least 10 records (and combining smaller cells together before computing fractions
whenever necessary).
Age and gender or single filers (1979-2014): Single filers are defined as all filers
excluding married joint filers. In this case, there is no earnings split issue, and we only
impute gender and age, starting in 1979. We impute age and gender simultaneously to
capture the correct correlations between age and gender.
Cells are defined by 11 AGI fractiles (negative AGI, and ten fractiles for returns
with positive AGI: the bottom 4 quintiles, P80-90, P90-95, P95-99, P99-99.9, P99.9-
99.99, P99.99-100). We consider 6 bins for share of wage income in AGI: less than
10%, 10% to 25%, 25% to 50%, 50% to 75%, 75% to 95%, over 95%. We consider an
indicator for being aged 65+, less than 65 with dependent children, and less than 65
with no dependent children. Effectively, this means that we produce three tabulations by
(AGI fractile)*(share of wage income in AGI) for (1) single filers aged 65+ (in which case
we only provide gender breakdown as age 65+ is already set), (2) single filers aged less
than 65 and with dependent children (in which case, for each cell we provide the 4
probabilities for female*(age<45), female*(age 45-64), male*(age<45), male*(age 45-
6
64), the 4 probabilities for each cell naturally sum to one), (3) single filers aged less than
65 and with no dependent children (again we provide the 4 probabilities in that case).
Age of married filers (1979-2014): For married joint filers, we impute age of both
spouses simultaneously. We consider again the basic breakdown age<45, age 45-64,
age 65+. Cells are defined by the 11 AGI fractiles, 6 categories for share of wage
income in AGI, and an indicator for each spouse being aged 65+. Hence, we only need
to impute age<45 vs. age 45-64 for the person whenever the person is not aged 65+.
Effectively, this means that we produce three tabulations by (AGI fractile)*(share of
wage income in AGI): (1) Married filers with husband aged 65+ and wife aged less than
65, we then provide the fraction of wives aged 45-64 (the rest will be aged <45). (2)
Married filers with wife aged 65+ and husband aged less than 65, we provide the
fraction of husbands aged 45-64 (the rest will be aged <45). (3) Married filers with both
spouses aged less than 65. In that case, we provide the four probabilities for (<45,<45),
(<45,45-64), (45-64,<45), (45-64,45-64) for the ages of husband and wife respectively.
These 4 probabilities sum to one. Note that, for some cells, probabilities are zero or one
(as cases with wife much older than the husband are rare). A probability of zero means
that no such record exists in the SOI individual sample but it is well possible that such a
record could exist in the full population (as the SOI individual sample is a small fraction
of the total population).
SOI has already produced a number of tabulations of age by size of adjusted gross
income and marital status (Tables 1.5 and 1.6 in Publication 1304). SOI provides finer
age breakdown (7 categories instead of 3 only here). But here, we tabulate not only by
size of AGI but also by share of wage income in AGI (and jointly with gender as well in
the case of single filers).
Wage earnings split of married filers with positive wages (1999-2014): Wage
earnings split can be done starting in 1999 (when we can merge databank W2 individual
wage income information to the SOI individual files). For married joint filers with positive
family wage income (on the 1040 tax return), we compute the share of female W2 wage
7
earnings (relative to total wages on the 1040 tax return). We define cells by fractile of
1040 wage income (14 fractiles: the bottom 9 deciles, and P90-95, P95-99, P99-99.9,
P99.9-99.99, P99.99-100). We then report the probabilities that the share of female W2
wage earnings in total wages falls in 7 groups: 0%, (0%,5%], (5%,25%], (25%,50%],
(50%,75%], (75%,100%), 100%. The sum of the 7 probabilities is naturally one. We
have checked that all cells include at least 10 records.
Note that we define the share of female wages using W2 wage earnings for the
female spouse but using 1040 wages for the family wages (instead of the sum of W2
wages across spouses). We do so because there is sometimes a gap between the sum
of W2 wages across spouses and 1040 total wages (due for example to foreign wages,
tips not reported on W2 forms, etc.).
For same sex couples, female W2 wage earnings are defined as the W2 wage
earnings of the secondary filer on the 1040 (regardless of gender). Because of sample
size limitation and the disclosure risk it can create, we unfortunately cannot provide
statistics specifically for same-sex couples. The recent study by the Office of Tax
Analysis at Treasury, Fisher, Gee, and Looney (2016) provides extremely valuable and
comprehensive evidence on same sex couples in individual tax statistics for 2013 and
2014 using the universe of tax returns (instead of the smaller SOI sample we use
here).2 In future work, the study of Fisher, Gee, and Looney (2016) could be extended
to provide information on earnings split within same sex couples.3
Note that this table showing the wage earnings split in married couples follows a long
tradition of similar tabulations published by SOI over the years.4 These tables have
been published in the Statistics of Income Bulleting and most of them have been
gathered online https://www.irs.gov/uac/soi-tax-stats-individual-information-return-form-
w2-statistics For years 2008-2010, SOI has already published tables very similar to the
2 Since 2013, same-sex couples, legally married in jurisdictions that recognize their marriages, are treated as married for federal tax purposes by the IRS and Treasury. 3 Developing better earnings statistics on same sex couples using tax data fits with the interagency working group led by the Office of Management and Budget (OMB) entitled “Improving Measurement of Sexual Orientation and Gender Identity in Federal Surveys”. See US Office of Management and Budget (2016). 4 Indeed, over 40 years ago, the PUF for 1969 and 1974 included W2 individual earnings for each spouse. See Yau, Gurka, and Sailer (2002) for an analysis at SOI of the 1969 individual wage data (along with more recent 1979, 1989, and 1999 extracts of individual wage earnings).
8
ones we have produced here, except that SOI considers dollar brackets of wages
(instead of fractiles).
Self-employment earnings split of married filers with positive self-employment earnings (1979-2014): Self-employment earnings of each spouse are reported
separately on Schedule SE of form 1040. These variables are available uncapped in all
years since 1979 in the SOI internal files (the variables are only available capped in the
PUF).
For married joint filers with positive self-employment earnings (on the 1040 tax
return), we compute the share of female self-employment earnings (relative to total self-
employment earnings on the 1040 tax return). We define cells by fractile of 1040 self-
employment earnings (10 fractiles: the bottom 4 quintiles, and P80-90, P90-95, P95-99,
P99-99.9, P99.9-99.99, P99.99-100). We then report the probabilities that the share of
female self-employment earnings in total self-employment earnings falls in 7 groups:
0%, (0%,5%], (5%,25%], (25%,50%], (50%,75%], (75%,100%), 100%. The sum of the 7
probabilities is naturally one. We have checked that all cells include at least 10 records.
For same sex couples, female self-employment earnings are defined as the self-
employment earnings of the secondary earner regardless of gender (paralleling our
analysis of wage earnings split within couples).
4. Non-filers SOI official individual income tax statistics by definition cover only the tax filing
population and hence exclude all non-filers. Non-filers are defined as adult individuals
who are not a primary or secondary filer on any individual tax return. Non-filers are
generally individuals whose reportable income is below the filing requirement. A number
of tax filers are dependents of other filers (for example, full time students aged 19-24
who are supported by their parents). Many non-filers are also elderly who have small
incomes outside of Social Security benefits (which can be excluded from taxable
income for low income earners).
Excluding non-filers is a significant drawback as, for many research purposes, it
is important to cover the full US population. For example, distributional tax tables make
9
most sense when they cover the full population regardless of whether the person filed a
tax return or not. This issue is particularly important when there are changes in the
fraction of non-filers due to changes in tax law for example.
The SOI databank, which gathers tax information for the full population
regardless of tax filing status, can be used to create a representative sample of non-
filers starting in 1999. From the databank, we can extract W2 wage information, Social
security benefits, unemployment insurance benefits, college student dummy (presence
of a 1098-T form), and basic age and gender information. These variables capture the
most common forms of information returns received by non-filers. The tabulation on
non-filers that we have created will be publicly disclosed at a later date. In this section,
we just describe our current efforts at creating statistics on non-filers.
Non-filer data Using a simple SAS program (available upon request), we have extracted from the SOI
databank table all individual records from 1999 to 2014 tax years, which meet the
following criteria:
1) non-filer: the person is not a primary or secondary filer on a 1040 form (variable
tin_pe missing)
2) age: person is aged 18 to 110, and not deceased till the end of the tax year (year of
death (if it exists) is larger than the tax year).
3) zip5 information OR dependent: the variable super_zip5 is not missing which
means that the person received at least one information return with a valid US zip5
information (it could be any information return such as a W2 form, 1099 form, etc.) OR
the person was claimed as a dependent on a 1040 return. This criterion ensures that
the person is likely to be a US resident. At the same time, this procedure eliminates
residents who do not receive any information return during the year and are not claimed
as a dependent, and hence misses some valid non-filers.
This sample includes about 30m-40m records per year representing approximately the
population of US resident adult non-filers. As mentioned, we include several variables in
the sample: age, gender, social security income (from 1099-SSA forms), wage income
10
(from W2 forms), unemployment insurance income, whether the person is claimed on a
1040 return (as a dependent), whether the person is a higher education student
(presence of a 1098-T form).
Analysis The first step is to assess whether combining non-filers with the SOI filers sample
produces the correct population totals relative to Census estimates. We tabulate the
SOI individual tax sample by age bins adding primary and secondary filers (but
excluding dependents).
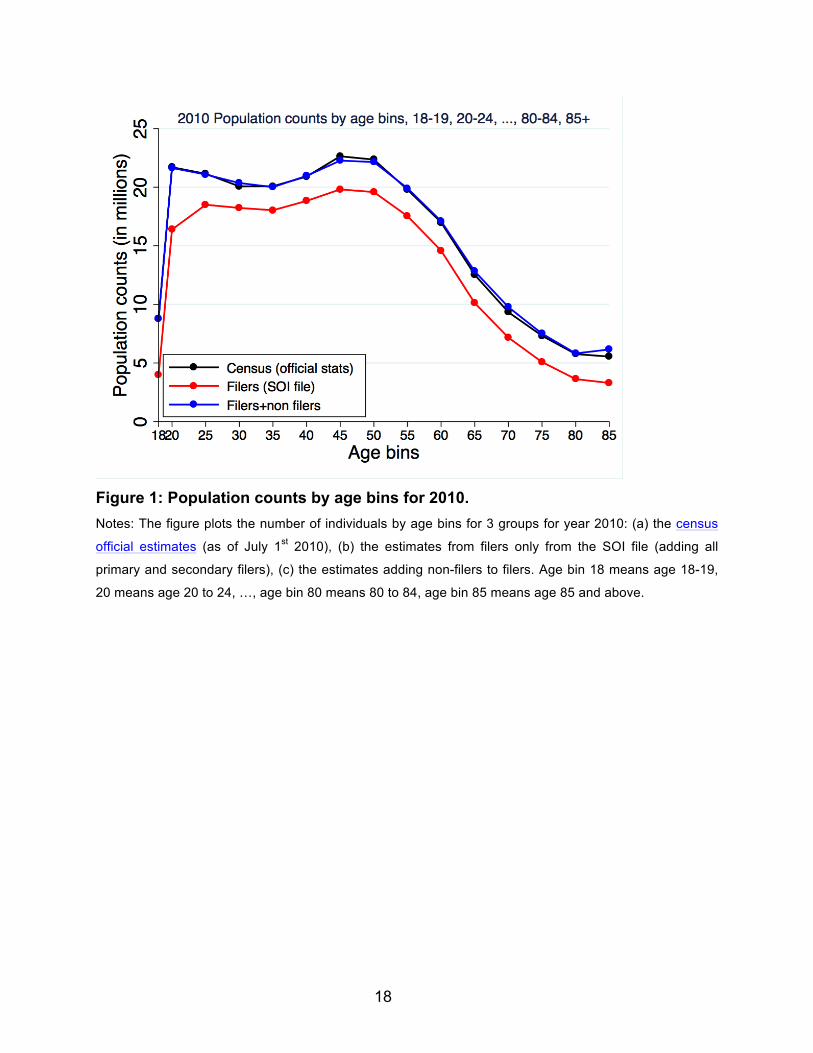
Figure 1 plots the number of individuals by age bins for 3 groups for year 2010: (a) the
census official estimates (as of July 1st 2010) in black, (b) the estimates from filers only
in red using the SOI individual files, (c) the estimates adding non-filers to filers in blue.
The first age bin is 18-19, the other age bins are by 5-year intervals (20-24,…,80-84),
with a top age bin 85+. We choose such age bins because Census official estimates are
typically presented using such 5-year age bin intervals.
Two important findings emerge from this figure. First, there is indeed a significant
gap for all age groups between the number of filers from SOI files (red line) and the
Census official statistics (black line). This gap is larger for the young (groups aged 18-
19 and 20-24) and is larger in relative terms for the elderly. Second, when we add the
non-filers (and without any extra adjustment), we match almost perfectly the Census
official statistics for all age groups except for the very old (85+), where we have a slight
surplus.
We have repeated this graph for all years 1999 to 2013. Overall, the pattern
showed for 2010 in Figure 1 is robust for other years. There is typically a slight surplus
for the very old. In 1999 and 2000, there is also a deficit of young people due to the fact
that the dependent file (linking dependents to filers) is highly incomplete. Hence, our
non-filers sample misses a number of dependents, who do not receive any information
return on their own. In 2007, there are many more filers than usual (due to the 2008 tax
11
rebate) and our number of non-filers is correspondingly smaller (although we find an
overall slight surplus in 2007 when adding filers and non-filers).
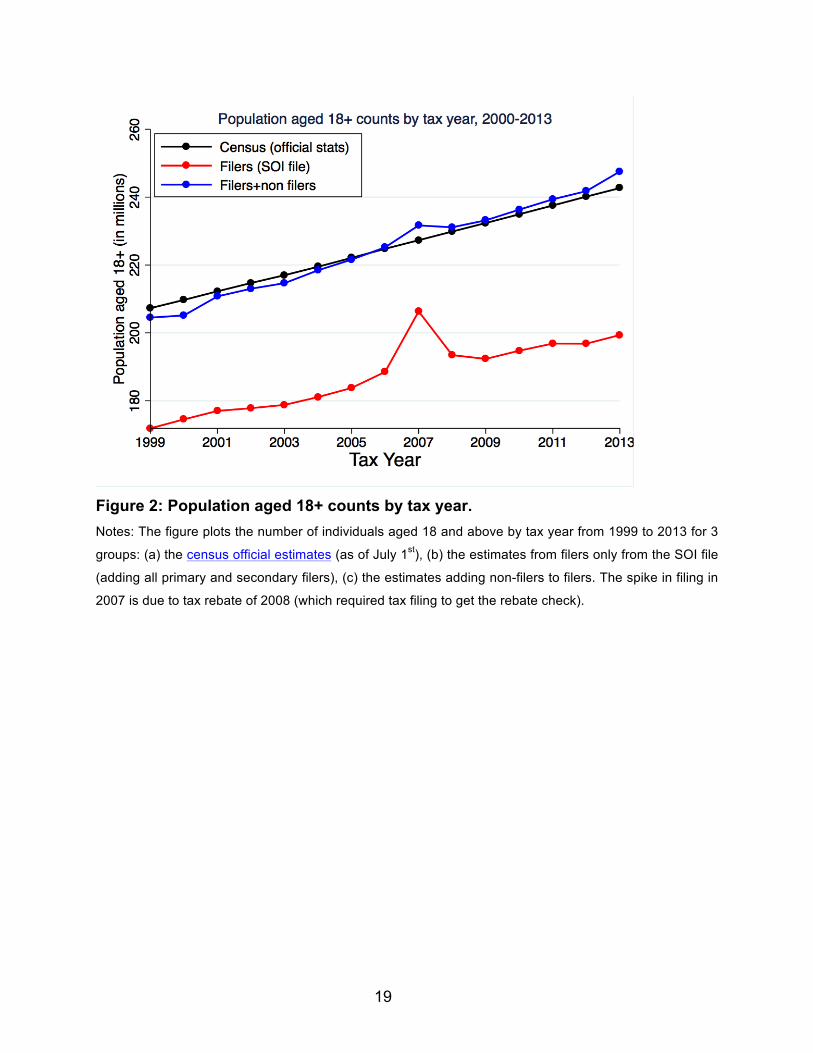
Figure 2 depicts the time series by showing statistics of the full population aged 18 and
above across all years 1999 to 2013. Again, it plots official census statistics (in black),
filers from the SOI files (in red), and the sum of filers and non-filers (in blue). It shows
that the filers statistics (in red) capture slightly more than 80% of the Census population
(and around 90% in 2007). Adding non-filers brings the series pretty close to the official
census statistics. Our filers plus non-filers statistics are slightly below Census figures in
1999 and 2000 and slightly above in the most recent years, hereby creating a slight
differential time trend. In 2001, the first year with complete dependent information, our
filers plus non-filers series comes just .7% short of the Census statistics. In 2012, our
filers plus non-filers series comes .7% above the Census statistics. Years 1999 and
2000 have a larger deficit because dependents cannot be linked to filers systematically
due to data limitations. 2007 has a larger surplus (1.9% above Census statistics) due to
the fact that there were many more filers that year (and possibly a number of these
extra filers would not have met the criteria for inclusion in our non-filer sample). 2013
has also a slightly larger surplus (2.0% above Census statistics).
Matching Census statistics: The census statistics are designed to include all US residents, including undocumented
immigrants. Our filer plus non-filer population however is defined as individuals either
filing taxes (in the SOI sample) or individuals in the databank (i.e., included in the Death
Master DM1 file) with at least one information return with a US valid zip 5 address in the
year or dependent on a 1040 return. Hence, there can be discrepancies between
Census counts and our filer plus non-filer counts.
Groups of people in Census statistics but not in our filer plus non-filer sample: 1) Recent undocumented immigrants who do not have a Social Security Number or ITIN
and hence are not in yet included in DM1 (and hence not in databank).
12
2) Economically inactive people who do not receive any information return in the tax
year and are not claimed as dependents (e.g., people who do not work for pay,
institutionalized people with no earnings).
Groups of people in our filer plus non-filer sample but not in Census statistics: 1) US citizens living abroad (and hence not US residents) filing a tax return. The SOI
files show that the number of US citizens abroad (defined as people filing with an
address abroad) is very small (about 1 million).
2) Non US residents who either file a 1040 tax return or receive an information return
with a US address. It is possible that many non-residents file taxes using a US address
(if they own US property or if they live part-time in the US). A number of US non-
residents (such as recent legal immigrants on VISAs) receive information returns but file
1040-NR forms (that are not in the SOI or PUF files).
3) Filers dying before July 1st of the tax year (July 1st is the date for Census official
population statistics)
Therefore, it is not surprising that the two counts do not match perfectly. Falling within
1% of Census (as is the case for all years except 1999, 2000, 2007, and 2013) is an
excellent outcome. It should be possible to match the Census statistics exactly by
adjusting weights by age group very slightly. We would recommend this adjustment only
for 1999, 2000, 2007, and 2013 where the discrepancy with Census is largest.
Treatment of 2007 tax year: in 2007, there were many extra filers because of the 2008
tax rebate which required beneficiaries to file a tax return. The internal SOI file for 2007
includes all these extra filers. However, the extra filers were removed from the 2007
PUF file.
5. Comparing with internal data The tabulated data we have created can be combined with other publicly
available data such as the PUF to create time series distributional statistics of income
and taxes. To assess their value, we can then compare these statistics with the same
13
statistics computed using directly the internal SOI data. We have created income
distribution statistics as in Piketty and Saez (2003) with improvements along a number
of dimensions. (1) series disaggregated at the individual level (instead of tax unit level),
(2) series are broken down by age groups (<45, 45-64, 65+), and by gender groups, (3)
we consider a wider set of income definitions (including both pre-tax and post-tax
income) and trying to systematically impute incomes not reported on tax returns to
match National Income from National Accounts, (4) we do not focus solely on the top
10% income groups (and smaller groups within the top 10%) but consider instead the
full distribution of income.5 All these extensions rely on the tabulations that we have
created and discussed earlier in this study: high income statistics, age/gender/earnings
split tabulation. Therefore, this creates a comprehensive set of baseline statistics to test
the quality of the data produced using external sources for distributional analysis.
We refer the reader to the companion paper Piketty, Saez, Zucman (2016) for a
detailed analysis and description of the results. In this section, we only illustrate the
quality of statistics produced with public use sources (combined with the tabulations
created in this paper) by comparing them with the statistics produced using the internal
data along several dimensions.
The extensive income and tax statistics comparing the external to the internal
data are gathered in the large companion worksheet outsheets.xlsx. These statistics are
always national distributional statistics with detailed fractiles at the very top. They are
always based on a fairly large number of records (hundreds at a minimum). The only
threshold levels we compute are medians and they are rounded to avoid disclosing any
individual information. The first sheet of the excel file outsheets.xlsx is called “readme”
and provides a detailed explanation of the information included in each of the
subsequent excel worksheets. These worksheets were directly produced from the
underlying tax data both externally (using public use files and the tabulations presented
5 Auten and Splinter (2016) have also produced income concentration statistics that try to improve upon the Piketty and Saez (2003) series. Their work aims at distributing Personal Income from National Accounts and hence is highly complementary to the paper Piketty, Saez, Zucman (2016) where we aim at distributing National Income from National Accounts. We have benefitted from joint discussions and comments.
14
earlier in this paper) and internally (using the SOI individual files).6 Our programs are
available upon request to interested researchers.
The following figures are organized as follows. The top panel reports the
computations using the internal SOI files while the bottom panel reports the same
computations using public use data supplemented with our newly created tabulations.
The SOI files based statistics go up to year 2014 while public use based statistics go up
to year 2010, the latest year the PUF is currently available. The substantive results from
the figures are described in detail in Piketty, Saez, and Zucman (2016). The figures
depicted here are chosen to test and illustrate the value of the tabulations we have
created along each of the dimensions discussed.
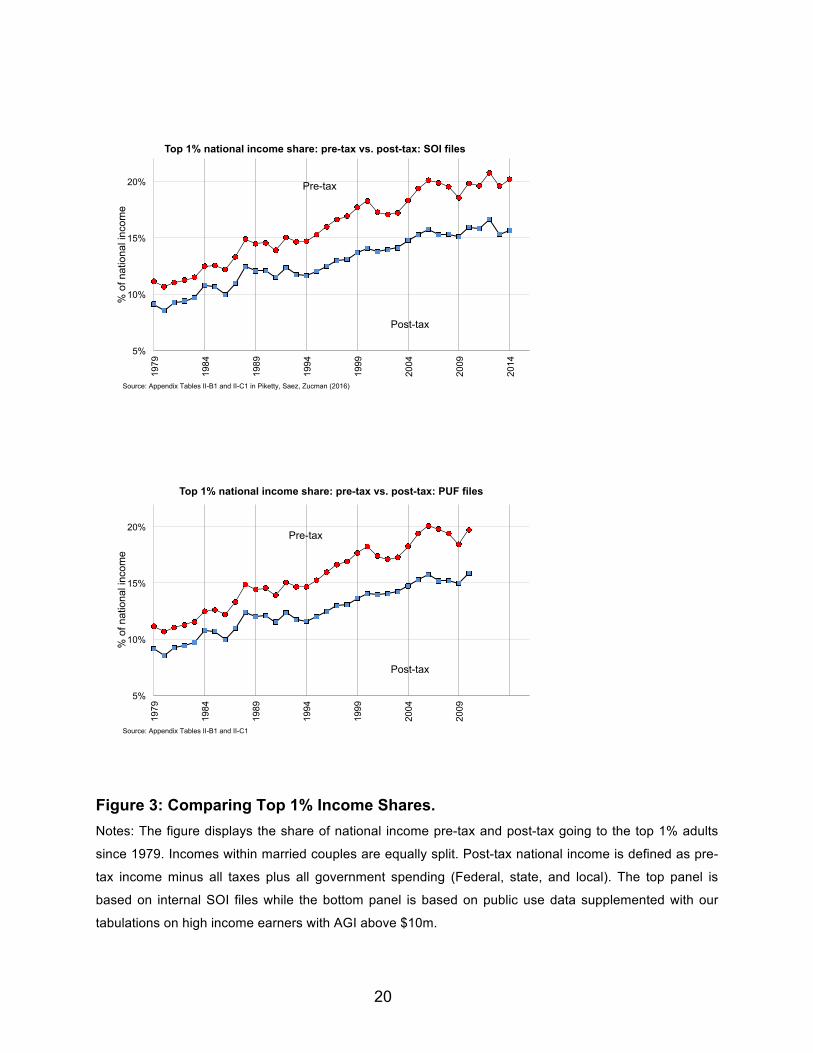
Statistics of $10m+ AGI tax filers to correct the PUF representativeness at the top: Figure 3 compares top 1% income shares using the external public use files
(supplemented with our tabulated statistics on incomes above $10m) vs. using the SOI
individual files. The figure displays the share of national income pre-tax and post-tax
going to the top 1% adults since 1979. Incomes within married couples are equally split.
Post-tax income is defined as pre-tax income minus all taxes plus all government
spending (Federal, state, and local). The top panel is based on internal SOI files while
the bottom panel is based on public use data. The two series are virtually identical.
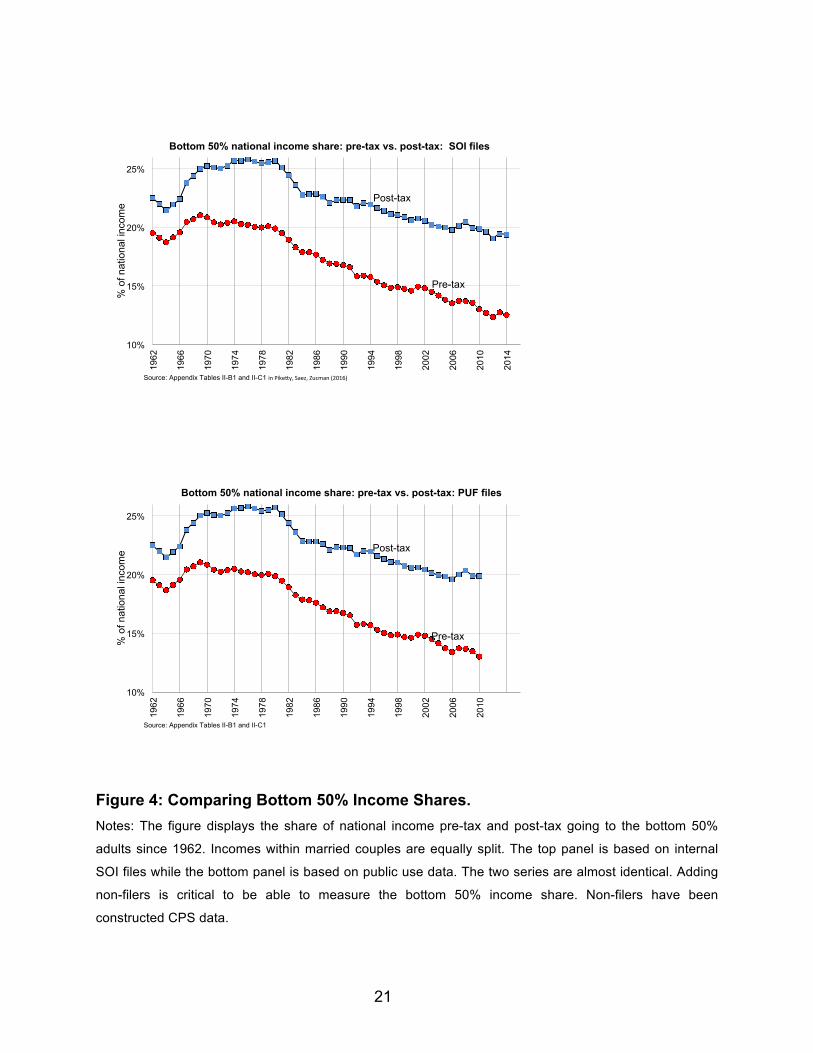
Non-filers to capture bottom 50% income shares: Adding non-filers is critical to capture accurately the incomes of the bottom 50% (as
about 10-15% of US adults do not file income tax returns as primary or secondary
filers). Hence, in order to construct non-filers over the long-run, Piketty, Saez, and
Zucman (2016) use Current Population Survey data using filing thresholds to identify
non-filers following a methodology developed by the Tax Policy Center tax simulator
(see Rohaly, Carasso, and Adeel Saleem, 2015). However, this CPS method generates
too little wage income among non-filers than what we have obtained in this study.
6 A very small number of tabulations reporting average age by income groups was produced solely using internal data as the very coarse age bins in the our tabulations described earlier (<45, 45-64, 65+) are not sufficient to produce reliable average age statistics by income groups (see Figure 6 below for an illustration).
15
Hence, in the CPS sample of non-filers, we have adjusted upward both the number of
wage earners (by giving them higher weight) and we have increased the wages of wage
earners (by a multiplicative factor) in order to match the statistics on non-filers obtained
in this study. We have applied the same correction retrospectively back to year 1962.
Figure 4 illustrates the use of adding non-filers by comparing the bottom 50% income
shares using the PUF vs. the SOI files both enhanced by adding non-filers. Both
datasets generate very similar series for the bottom 50% income share.
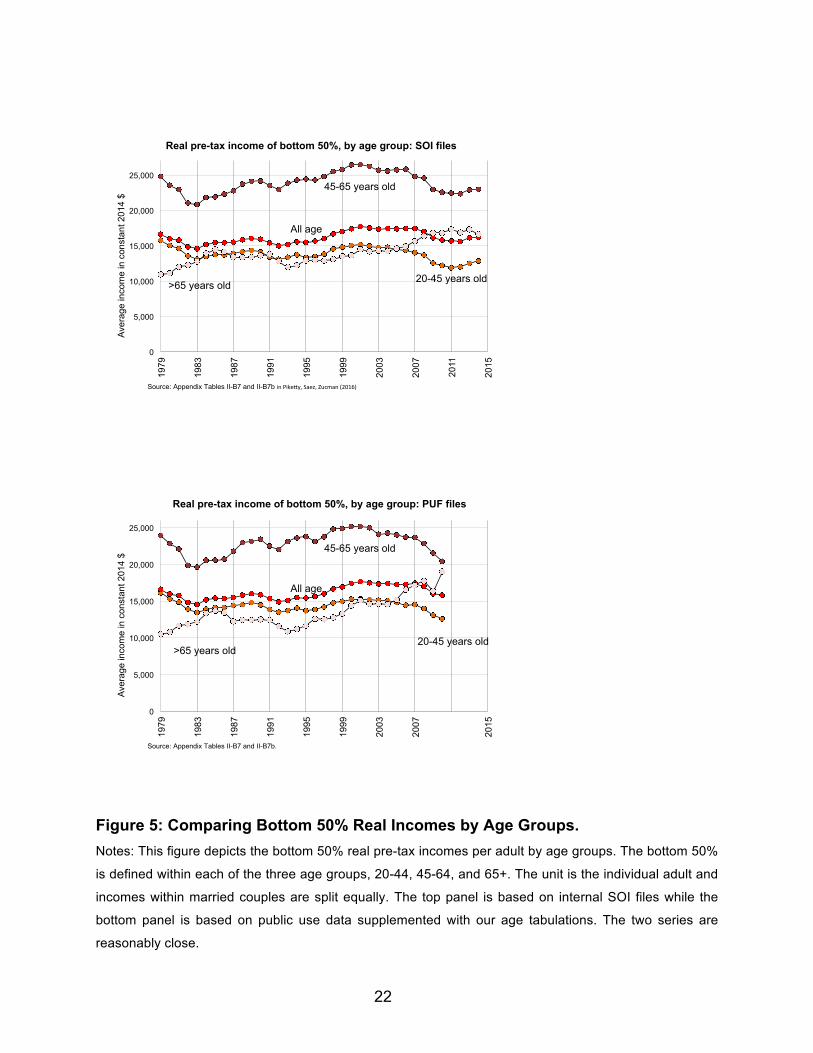
Age breakdown: Figure 5 compares bottom 50% real incomes by age groups. It depicts the bottom 50%
real pre-tax incomes per adult by age groups. The bottom 50% is defined within each of
the three age groups, 20-44, 45-64, and 65+. The unit is the individual adult and
incomes within married couples are split equally. The top panel is based on internal SOI
files while the bottom panel is based on the publicly available data supplemented with
our tabulations by age presented earlier. The two series are reasonably close.
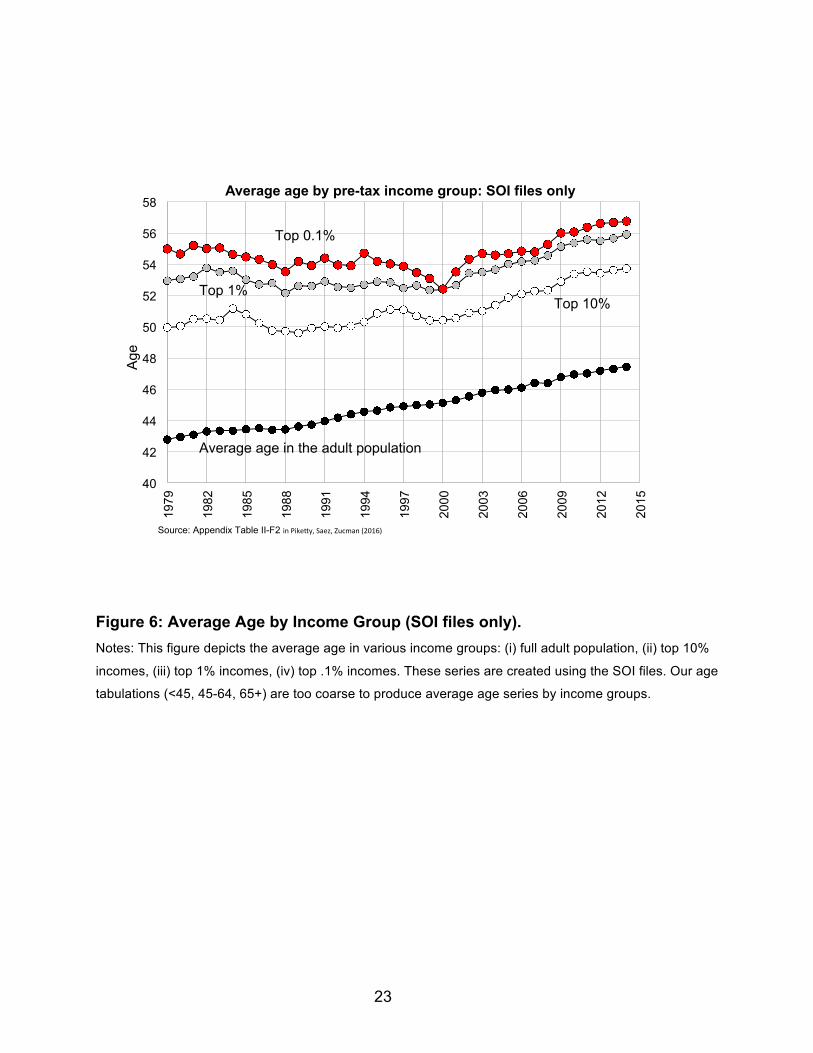
Figure 6 further depicts the average age in various income groups: (i) full adult
population, (ii) top 10% incomes, (iii) top 1% incomes, (iv) top .1% incomes. These
series are created using the SOI files only. Our tabulation by age (<45, 45-64, 65+) is
too coarse to produce average age series by income groups.
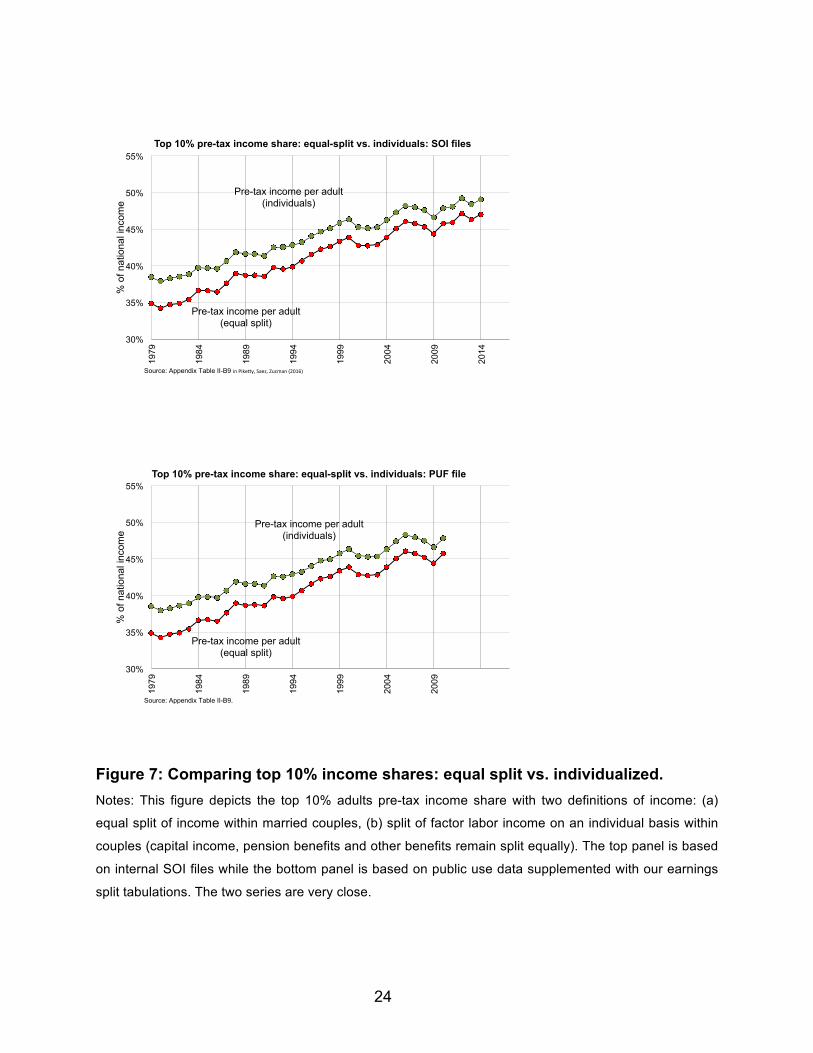
Earnings split within married couples: The series presented so far split income within married couples 50/50 regardless of who
earns the income in the couple. However, the earnings split for wage earnings and self-
employment income can be used to split labor income as it is earned (rather than
50/50). This allows us to compute income share series using individualized incomes.
Figure 7 illustrates these results by comparing top 10% income shares estimated using
equal split within couples vs. individualized labor income within couples. The series are
estimated both in the SOI data and with public data supplemented with the earnings
split tabulations created in this paper. The two series are very close.
Gender:
16
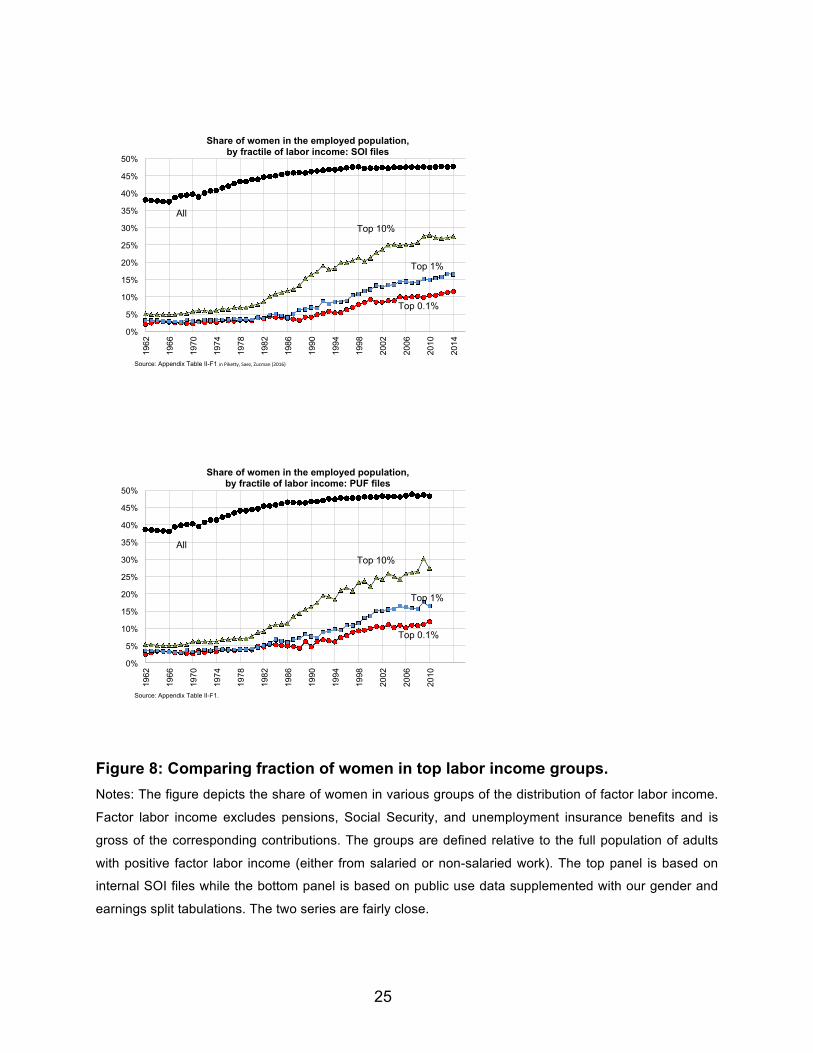
Finally, the gender tabulations for single filers that we have created can be combined
with the earnings split tabulations within couples to estimate labor earnings gender gap
statistics. Figure 8 compares the fraction of women in top labor income groups in the
SOI files vs. public use data. The figure depicts the share of women in various groups of
the distribution of factor labor income. Factor labor income excludes pensions, Social
Security, and unemployment insurance benefits and is gross of the corresponding
contributions. The groups are defined relative to the full population of adults with
positive factor labor income (either from salaried or non-salaried work). The top panel is
based on internal SOI files while the bottom panel is based on public data
supplemented with our gender and earnings split tabulations presented earlier. The two
series are fairly close. The public data series have been created using the earnings split
information for wage earnings and self-employment income as well as gender
information for single filers tabulations presented earlier in this paper. For the period
before 1999 (when no wage earnings split exists), we have combined CPS data with
earlier PUF data for 1969, 1974, and the early 1980s that provide some information on
wage earnings split across spouses.
References Auten, Gerald and David Splinter (2016) “Using Tax Data to Measure Income Inequality: Effects of Base Broadening Tax Reform,” U.S. Department of the Treasury, Office of Tax Analysis, unpublished mimeo. Bryant, Victoria L. John L. Czajka, Georgia Ivsin, and Jim Nunns. 2014. “Design Changes to the SOI Public Use File (PUF)”, Prepared for the “New Resources for Microdata-Based Tax Analysis” Session, 2014 Annual Conference on Taxation, National Tax Association Santa Fe, New Mexico. Cilke, James. 2014. “The Case of the Missing Strangers: What we Know and Don’t Know About Non-Filers”, Joint Committee on Taxation unpublished mimeo. Curry, Jeff and Jonathan Dent. “Individual Income Tax Returns, by Age of Primary Taxpayer, Tax Years 1997 and 2007”, Statistics of Income Bulletin Spring 2011, 55-173 (Washington, DC).

17
Fisher, Robin, Geof Gee, and Adam Looney. 2016. “Joint Filing by Same-Sex Couples after Windsor: Characteristics of Married Tax Filers in 2013 and 2014,” Office of Tax Analysis Working Paper 108. Lowrey, Ying. “U.S. Sole Proprietorships: A Gender Comparison, 1985-2000.” Statistics of Income Bulletin Spring 2005, (Washington, DC). Piketty, Thomas and Emmanuel Saez (2003). "Income Inequality in the United States, 1913-1998." Quarterly Journal of Economics 118(1): 1-39. Piketty, Thomas, Emmanuel Saez, and Gabriel Zucman. (2016) “Distributional National Accounts: Methods and Estimates for the United States”, NBER Working Paper. Rohaly, Jeffrey, Adam Carasso, Mohammed Adeel Saleem. 2005. “The Urban- Brookings Tax Policy Center Microsimulation Model: Documentation and Methodology for Version 0304", Tax Policy Center Working Paper. Sailer, Peter , Ellen Yau, and Victor Rehula (2002). “Income by Gender and Age From Information Returns, 1998”, Statistics of Income Bulletin Winter 2001/2002, 83-102 (Washington, DC). U.S. Office of Management and Budget. Federal Interagency Working Group on Improving Measurement of Sexual Orientation and Gender Identity in Federal Surveys (2016). “Evaluations of Sexual Orientation and Gender Identity Survey Measures: What Have We Learned?” (Washington DC). U.S. Treasury Department, Internal Revenue Service, Statistics of Income: Individual Income Tax Returns (Washington, DC: annual 1916–2009). U.S. Treasury Department, Internal Revenue Service, Statistics of Income Bulletin (Washington, DC: Quarterly since 1981). U.S. Treasury Department, Internal Revenue Service, SOI Tax Stats - Individual Information Return Form W-2: Wage Statistics, 2008-2010, online at https://www.irs.gov/uac/soi-tax-stats-individual-information-return-form-w2-wage-statistics U.S. Treasury Department, Internal Revenue Service, Statistics of Income Division “General Description Booklet For the Public Use Tax File” (Washington: DC). Annual 1960-2010, Available online at http://users.nber.org/~taxsim/gdb/ Yau, Ellen, Kurt Gurka, and Peter Sailer (2003) “Comparing Salaries and Wages of Women Shown on Forms W-2 to Those of Men, 1969-1999,” Statistics of Income Bulletin Fall 2003, 274-283 (Washington, DC).
18
Figure 1: Population counts by age bins for 2010. Notes: The figure plots the number of individuals by age bins for 3 groups for year 2010: (a) the census
official estimates (as of July 1st 2010), (b) the estimates from filers only from the SOI file (adding all
primary and secondary filers), (c) the estimates adding non-filers to filers. Age bin 18 means age 18-19,
20 means age 20 to 24, …, age bin 80 means 80 to 84, age bin 85 means age 85 and above.
19
Figure 2: Population aged 18+ counts by tax year. Notes: The figure plots the number of individuals aged 18 and above by tax year from 1999 to 2013 for 3
groups: (a) the census official estimates (as of July 1st), (b) the estimates from filers only from the SOI file
(adding all primary and secondary filers), (c) the estimates adding non-filers to filers. The spike in filing in
2007 is due to tax rebate of 2008 (which required tax filing to get the rebate check).
20
5%
10%
15%
20%
1979
1984
1989
1994
1999
2004
2009
2014
% o
f nat
iona
l inc
ome
Top 1% national income share: pre-tax vs. post-tax: SOI files
Pre-tax
Post-tax
Source: Appendix Tables II-B1 and II-C1 in Piketty, Saez, Zucman (2016)
5%
10%
15%
20%
1979
1984
1989
1994
1999
2004
2009
% o
f nat
iona
l inc
ome
Top 1% national income share: pre-tax vs. post-tax: PUF files
Pre-tax
Post-tax
Source: Appendix Tables II-B1 and II-C1
Figure 3: Comparing Top 1% Income Shares. Notes: The figure displays the share of national income pre-tax and post-tax going to the top 1% adults
since 1979. Incomes within married couples are equally split. Post-tax national income is defined as pre-
tax income minus all taxes plus all government spending (Federal, state, and local). The top panel is
based on internal SOI files while the bottom panel is based on public use data supplemented with our
tabulations on high income earners with AGI above $10m.
21
10%
15%
20%
25%
1962
1966
1970
1974
1978
1982
1986
1990
1994
1998
2002
2006
2010
2014
% o
f nat
iona
l inc
ome
Bottom 50% national income share: pre-tax vs. post-tax: SOI files
Pre-tax
Post-tax
Source: Appendix Tables II-B1 and II-C1 inPike'y,Saez,Zucman(2016)
10%
15%
20%
25%
1962
1966
1970
1974
1978
1982
1986
1990
1994
1998
2002
2006
2010
% o
f nat
iona
l inc
ome
Bottom 50% national income share: pre-tax vs. post-tax: PUF files
Pre-tax
Post-tax
Source: Appendix Tables II-B1 and II-C1
Figure 4: Comparing Bottom 50% Income Shares. Notes: The figure displays the share of national income pre-tax and post-tax going to the bottom 50%
adults since 1962. Incomes within married couples are equally split. The top panel is based on internal
SOI files while the bottom panel is based on public use data. The two series are almost identical. Adding
non-filers is critical to be able to measure the bottom 50% income share. Non-filers have been
constructed CPS data.
22
0
5,000
10,000
15,000
20,000
25,000
1979
1983
1987
1991
1995
1999
2003
2007
2011
2015
Ave
rage
inco
me
in c
onst
ant 2
014
$
Real pre-tax income of bottom 50%, by age group: SOI files
Source: Appendix Tables II-B7 and II-B7b inPike'y,Saez,Zucman(2016)
All age
20-45 years old
45-65 years old
>65 years old
0
5,000
10,000
15,000
20,000
25,000
1979
1983
1987
1991
1995
1999
2003
2007
2015
Ave
rage
inco
me
in c
onst
ant 2
014
$
Real pre-tax income of bottom 50%, by age group: PUF files
Source: Appendix Tables II-B7 and II-B7b.
All age
20-45 years old
45-65 years old
>65 years old
Figure 5: Comparing Bottom 50% Real Incomes by Age Groups. Notes: This figure depicts the bottom 50% real pre-tax incomes per adult by age groups. The bottom 50%
is defined within each of the three age groups, 20-44, 45-64, and 65+. The unit is the individual adult and
incomes within married couples are split equally. The top panel is based on internal SOI files while the
bottom panel is based on public use data supplemented with our age tabulations. The two series are
reasonably close.
23
40
42
44
46
48
50
52
54
56
58
1979
1982
1985
1988
1991
1994
1997
2000
2003
2006
2009
2012
2015
Age
Average age by pre-tax income group: SOI files only
Top 0.1%
Top 1% Top 10%
Average age in the adult population
Source: Appendix Table II-F2 inPike'y,Saez,Zucman(2016)
Figure 6: Average Age by Income Group (SOI files only). Notes: This figure depicts the average age in various income groups: (i) full adult population, (ii) top 10%
incomes, (iii) top 1% incomes, (iv) top .1% incomes. These series are created using the SOI files. Our age
tabulations (<45, 45-64, 65+) are too coarse to produce average age series by income groups.
24
30%
35%
40%
45%
50%
55% 19
79
1984
1989
1994
1999
2004
2009
2014
% o
f nat
iona
l inc
ome
Top 10% pre-tax income share: equal-split vs. individuals: SOI files
Pre-tax income per adult (individuals)
Source: Appendix Table II-B9 inPike'y,Saez,Zucman(2016)
Pre-tax income per adult (equal split)
30%
35%
40%
45%
50%
55%
1979
1984
1989
1994
1999
2004
2009
% o
f nat
iona
l inc
ome
Top 10% pre-tax income share: equal-split vs. individuals: PUF file
Pre-tax income per adult (individuals)
Source: Appendix Table II-B9.
Pre-tax income per adult (equal split)
Figure 7: Comparing top 10% income shares: equal split vs. individualized. Notes: This figure depicts the top 10% adults pre-tax income share with two definitions of income: (a)
equal split of income within married couples, (b) split of factor labor income on an individual basis within
couples (capital income, pension benefits and other benefits remain split equally). The top panel is based
on internal SOI files while the bottom panel is based on public use data supplemented with our earnings
split tabulations. The two series are very close.
25
0%
5%
10%
15%
20%
25%
30%
35%
40%
45%
50% 19
62
1966
1970
1974
1978
1982
1986
1990
1994
1998
2002
2006
2010
2014
Share of women in the employed population, by fractile of labor income: SOI files
Source: Appendix Table II-F1 inPike'y,Saez,Zucman(2016)
Top 10%
Top 0.1%
Top 1%
All
0%
5%
10%
15%
20%
25%
30%
35%
40%
45%
50%
1962
1966
1970
1974
1978
1982
1986
1990
1994
1998
2002
2006
2010
Share of women in the employed population, by fractile of labor income: PUF files
Source: Appendix Table II-F1.
Top 10%
Top 0.1%
Top 1%
All
Figure 8: Comparing fraction of women in top labor income groups. Notes: The figure depicts the share of women in various groups of the distribution of factor labor income.
Factor labor income excludes pensions, Social Security, and unemployment insurance benefits and is
gross of the corresponding contributions. The groups are defined relative to the full population of adults
with positive factor labor income (either from salaried or non-salaried work). The top panel is based on
internal SOI files while the bottom panel is based on public use data supplemented with our gender and
earnings split tabulations. The two series are fairly close.