Embed Size (px)
Citation preview
III–1
CHAPTER III
STATISTICS OF OILSEEDS, FATS, AND OILS
This chapter includes information on cottonseed, flaxseed, olive oil, peanuts, soybeans, and fats and oils. Most butter statistics are included in the chapter on dairy and poultry statistics. Lard data are mostly in the chapter on livestock.
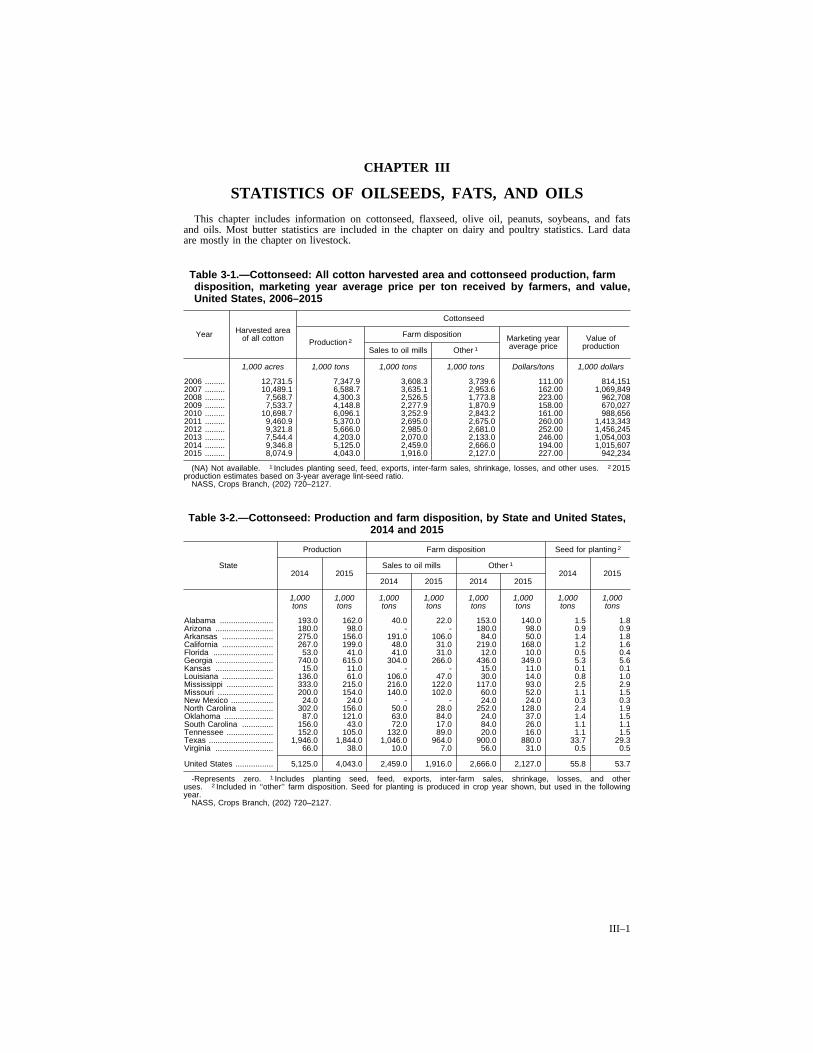
Table 3-1.—Cottonseed: All cotton harvested area and cottonseed production, farm disposition, marketing year average price per ton received by farmers, and value, United States, 2006–2015
Year Harvested area of all cotton
Cottonseed
Production 2 Farm disposition Marketing year
average price Value of
production Sales to oil mills Other 1
1,000 acres 1,000 tons 1,000 tons 1,000 tons Dollars/tons 1,000 dollars
2006 ......... 12,731.5 7,347.9 3,608.3 3,739.6 111.00 814,151 2007 ......... 10,489.1 6,588.7 3,635.1 2,953.6 162.00 1,069,849 2008 ......... 7,568.7 4,300.3 2,526.5 1,773.8 223.00 962,708 2009 ......... 7,533.7 4,148.8 2,277.9 1,870.9 158.00 670,027 2010 ......... 10,698.7 6,096.1 3,252.9 2,843.2 161.00 988,656 2011 ......... 9,460.9 5,370.0 2,695.0 2,675.0 260.00 1,413,343 2012 ......... 9,321.8 5,666.0 2,985.0 2,681.0 252.00 1,456,245 2013 ......... 7,544.4 4,203.0 2,070.0 2,133.0 246.00 1,054,003 2014 ......... 9,346.8 5,125.0 2,459.0 2,666.0 194.00 1,015,607 2015 ......... 8,074.9 4,043.0 1,916.0 2,127.0 227.00 942,234
(NA) Not available. 1 Includes planting seed, feed, exports, inter-farm sales, shrinkage, losses, and other uses. 2 2015 production estimates based on 3-year average lint-seed ratio.
NASS, Crops Branch, (202) 720–2127.
Table 3-2.—Cottonseed: Production and farm disposition, by State and United States, 2014 and 2015
State
Production Farm disposition Seed for planting 2
2014 2015 Sales to oil mills Other 1
2014 2015 2014 2015 2014 2015
1,000 1,000 1,000 1,000 1,000 1,000 1,000 1,000 tons tons tons tons tons tons tons tons
Alabama ........................ 193.0 162.0 40.0 22.0 153.0 140.0 1.5 1.8 Arizona .......................... 180.0 98.0 - - 180.0 98.0 0.9 0.9 Arkansas ....................... 275.0 156.0 191.0 106.0 84.0 50.0 1.4 1.8 California ....................... 267.0 199.0 48.0 31.0 219.0 168.0 1.2 1.6 Florida ........................... 53.0 41.0 41.0 31.0 12.0 10.0 0.5 0.4 Georgia .......................... 740.0 615.0 304.0 266.0 436.0 349.0 5.3 5.6 Kansas .......................... 15.0 11.0 - - 15.0 11.0 0.1 0.1 Louisiana ....................... 136.0 61.0 106.0 47.0 30.0 14.0 0.8 1.0 Mississippi ..................... 333.0 215.0 216.0 122.0 117.0 93.0 2.5 2.9 Missouri ......................... 200.0 154.0 140.0 102.0 60.0 52.0 1.1 1.5 New Mexico ................... 24.0 24.0 - - 24.0 24.0 0.3 0.3 North Carolina ............... 302.0 156.0 50.0 28.0 252.0 128.0 2.4 1.9 Oklahoma ...................... 87.0 121.0 63.0 84.0 24.0 37.0 1.4 1.5 South Carolina .............. 156.0 43.0 72.0 17.0 84.0 26.0 1.1 1.1 Tennessee ..................... 152.0 105.0 132.0 89.0 20.0 16.0 1.1 1.5 Texas ............................. 1,946.0 1,844.0 1,046.0 964.0 900.0 880.0 33.7 29.3 Virginia .......................... 66.0 38.0 10.0 7.0 56.0 31.0 0.5 0.5
United States ................. 5,125.0 4,043.0 2,459.0 1,916.0 2,666.0 2,127.0 55.8 53.7
-Represents zero. 1 Includes planting seed, feed, exports, inter-farm sales, shrinkage, losses, and other uses. 2 Included in ‘‘other’’ farm disposition. Seed for planting is produced in crop year shown, but used in the following year.
NASS, Crops Branch, (202) 720–2127.
III–2 OILSEEDS, FATS, AND OILS
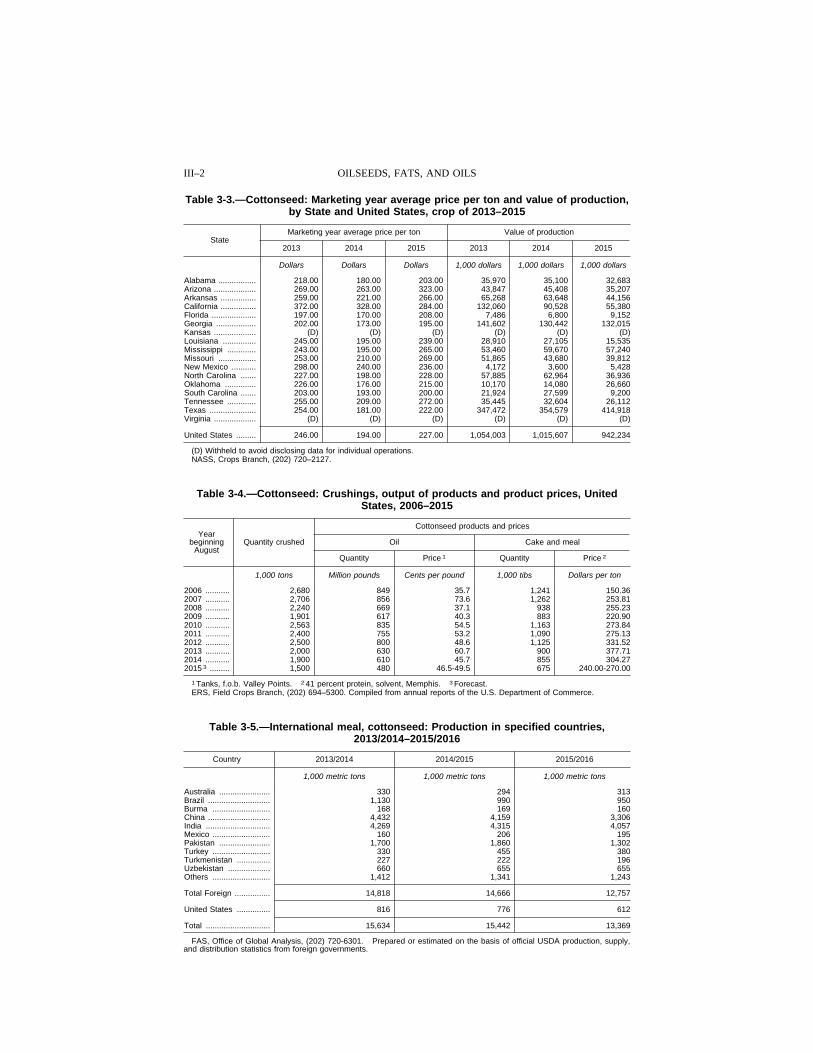
Table 3-3.—Cottonseed: Marketing year average price per ton and value of production, by State and United States, crop of 2013–2015
State Marketing year average price per ton Value of production
2013 2014 2015 2013 2014 2015
Dollars Dollars Dollars 1,000 dollars 1,000 dollars 1,000 dollars
Alabama ................. 218.00 180.00 203.00 35,970 35,100 32,683 Arizona ................... 269.00 263.00 323.00 43,847 45,408 35,207 Arkansas ................ 259.00 221.00 266.00 65,268 63,648 44,156 California ................ 372.00 328.00 284.00 132,060 90,528 55,380 Florida .................... 197.00 170.00 208.00 7,486 6,800 9,152 Georgia .................. 202.00 173.00 195.00 141,602 130,442 132,015 Kansas ................... (D) (D) (D) (D) (D) (D) Louisiana ............... 245.00 195.00 239.00 28,910 27,105 15,535 Mississippi ............. 243.00 195.00 265.00 53,460 59,670 57,240 Missouri ................. 253.00 210.00 269.00 51,865 43,680 39,812 New Mexico ........... 298.00 240.00 236.00 4,172 3,600 5,428 North Carolina ....... 227.00 198.00 228.00 57,885 62,964 36,936 Oklahoma .............. 226.00 176.00 215.00 10,170 14,080 26,660 South Carolina ....... 203.00 193.00 200.00 21,924 27,599 9,200 Tennessee ............. 255.00 209.00 272.00 35,445 32,604 26,112 Texas ..................... 254.00 181.00 222.00 347,472 354,579 414,918 Virginia ................... (D) (D) (D) (D) (D) (D)
United States ......... 246.00 194.00 227.00 1,054,003 1,015,607 942,234
(D) Withheld to avoid disclosing data for individual operations. NASS, Crops Branch, (202) 720–2127.
Table 3-4.—Cottonseed: Crushings, output of products and product prices, United States, 2006–2015
Year beginning
August Quantity crushed
Cottonseed products and prices
Oil Cake and meal
Quantity Price 1 Quantity Price 2
1,000 tons Million pounds Cents per pound 1,000 tibs Dollars per ton
2006 ........... 2,680 849 35.7 1,241 150.36 2007 ........... 2,706 856 73.6 1,262 253.81 2008 ........... 2,240 669 37.1 938 255.23 2009 ........... 1,901 617 40.3 883 220.90 2010 ........... 2,563 835 54.5 1,163 273.84 2011 ........... 2,400 755 53.2 1,090 275.13 2012 ........... 2,500 800 48.6 1,125 331.52 2013 ........... 2,000 630 60.7 900 377.71 2014 ........... 1,900 610 45.7 855 304.27 2015 3 ......... 1,500 480 46.5-49.5 675 240.00-270.00
1 Tanks, f.o.b. Valley Points. 2 41 percent protein, solvent, Memphis. 3 Forecast. ERS, Field Crops Branch, (202) 694–5300. Compiled from annual reports of the U.S. Department of Commerce.
Table 3-5.—International meal, cottonseed: Production in specified countries, 2013/2014–2015/2016
Country 2013/2014 2014/2015 2015/2016
1,000 metric tons 1,000 metric tons 1,000 metric tons
Australia ....................... 330 294 313 Brazil ............................ 1,130 990 950 Burma .......................... 168 169 160 China ............................ 4,432 4,159 3,306 India ............................. 4,269 4,315 4,057 Mexico .......................... 160 206 195 Pakistan ....................... 1,700 1,860 1,302 Turkey .......................... 330 455 380 Turkmenistan ............... 227 222 196 Uzbekistan ................... 660 655 655 Others .......................... 1,412 1,341 1,243
Total Foreign ................ 14,818 14,666 12,757
United States ............... 816 776 612
Total ............................. 15,634 15,442 13,369
FAS, Office of Global Analysis, (202) 720-6301. Prepared or estimated on the basis of official USDA production, supply, and distribution statistics from foreign governments.
III–3 AGRICULTURAL STATISTICS 2016
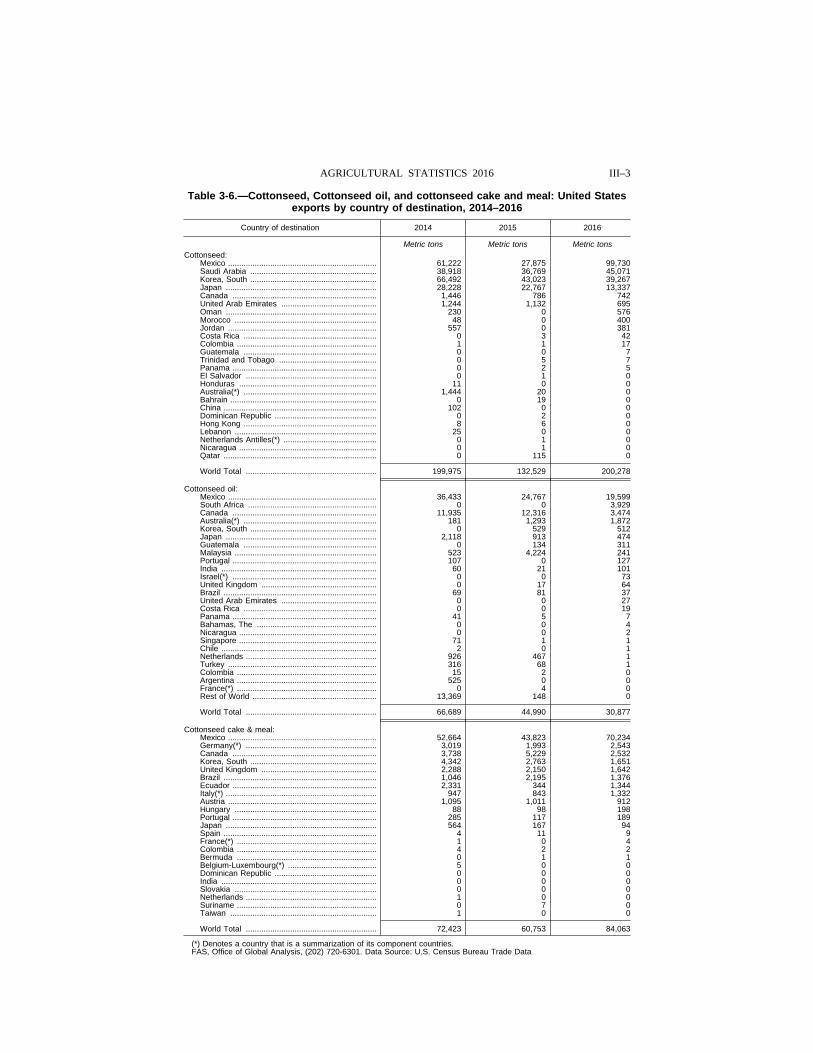
Table 3-6.—Cottonseed, Cottonseed oil, and cottonseed cake and meal: United States exports by country of destination, 2014–2016
Country of destination 2014 2015 2016
Metric tons Metric tons Metric tons Cottonseed:
Mexico ................................................................... 61,222 27,875 99,730 Saudi Arabia ......................................................... 38,918 36,769 45,071 Korea, South ......................................................... 66,492 43,023 39,267 Japan .................................................................... 28,228 22,767 13,337 Canada ................................................................. 1,446 786 742 United Arab Emirates ........................................... 1,244 1,132 695 Oman .................................................................... 230 0 576 Morocco ................................................................ 48 0 400 Jordan ................................................................... 557 0 381 Costa Rica ............................................................ 0 3 42 Colombia ............................................................... 1 1 17 Guatemala ............................................................ 0 0 7 Trinidad and Tobago ............................................ 0 5 7 Panama ................................................................. 0 2 5 El Salvador ........................................................... 0 1 0 Honduras .............................................................. 11 0 0 Australia(*) ............................................................ 1,444 20 0 Bahrain .................................................................. 0 19 0 China ..................................................................... 102 0 0 Dominican Republic .............................................. 0 2 0 Hong Kong ............................................................ 8 6 0 Lebanon ................................................................ 25 0 0 Netherlands Antilles(*) .......................................... 0 1 0 Nicaragua .............................................................. 0 1 0 Qatar ..................................................................... 0 115 0
World Total ........................................................... 199,975 132,529 200,278
Cottonseed oil: Mexico ................................................................... 36,433 24,767 19,599 South Africa .......................................................... 0 0 3,929 Canada ................................................................. 11,935 12,316 3,474 Australia(*) ............................................................ 181 1,293 1,872 Korea, South ......................................................... 0 529 512 Japan .................................................................... 2,118 913 474 Guatemala ............................................................ 0 134 311 Malaysia ................................................................ 523 4,224 241 Portugal ................................................................. 107 0 127 India ...................................................................... 60 21 101 Israel(*) ................................................................. 0 0 73 United Kingdom .................................................... 0 17 64 Brazil ..................................................................... 69 81 37 United Arab Emirates ........................................... 0 0 27 Costa Rica ............................................................ 0 0 19 Panama ................................................................. 41 5 7 Bahamas, The ...................................................... 0 0 4 Nicaragua .............................................................. 0 0 2 Singapore .............................................................. 71 1 1 Chile ...................................................................... 2 0 1 Netherlands ........................................................... 926 467 1 Turkey ................................................................... 316 68 1 Colombia ............................................................... 15 2 0 Argentina ............................................................... 525 0 0 France(*) ............................................................... 0 4 0 Rest of World ........................................................ 13,369 148 0
World Total ........................................................... 66,689 44,990 30,877
Cottonseed cake & meal: Mexico ................................................................... 52,664 43,823 70,234 Germany(*) ........................................................... 3,019 1,993 2,543 Canada ................................................................. 3,738 5,229 2,532 Korea, South ......................................................... 4,342 2,763 1,651 United Kingdom .................................................... 2,288 2,150 1,642 Brazil ..................................................................... 1,046 2,195 1,376 Ecuador ................................................................. 2,331 344 1,344 Italy(*) .................................................................... 947 843 1,332 Austria ................................................................... 1,095 1,011 912 Hungary ................................................................ 88 98 198 Portugal ................................................................. 285 117 189 Japan .................................................................... 564 167 94 Spain ..................................................................... 4 11 9 France(*) ............................................................... 1 0 4 Colombia ............................................................... 4 2 2 Bermuda ............................................................... 0 1 1 Belgium-Luxembourg(*) ........................................ 5 0 0 Dominican Republic .............................................. 0 0 0 India ...................................................................... 0 0 0 Slovakia ................................................................ 0 0 0 Netherlands ........................................................... 1 0 0 Suriname ............................................................... 0 7 0 Taiwan .................................................................. 1 0 0
World Total ........................................................... 72,423 60,753 84,063
(*) Denotes a country that is a summarization of its component countries. FAS, Office of Global Analysis, (202) 720-6301. Data Source: U.S. Census Bureau Trade Data
III–4 OILSEEDS, FATS, AND OILS
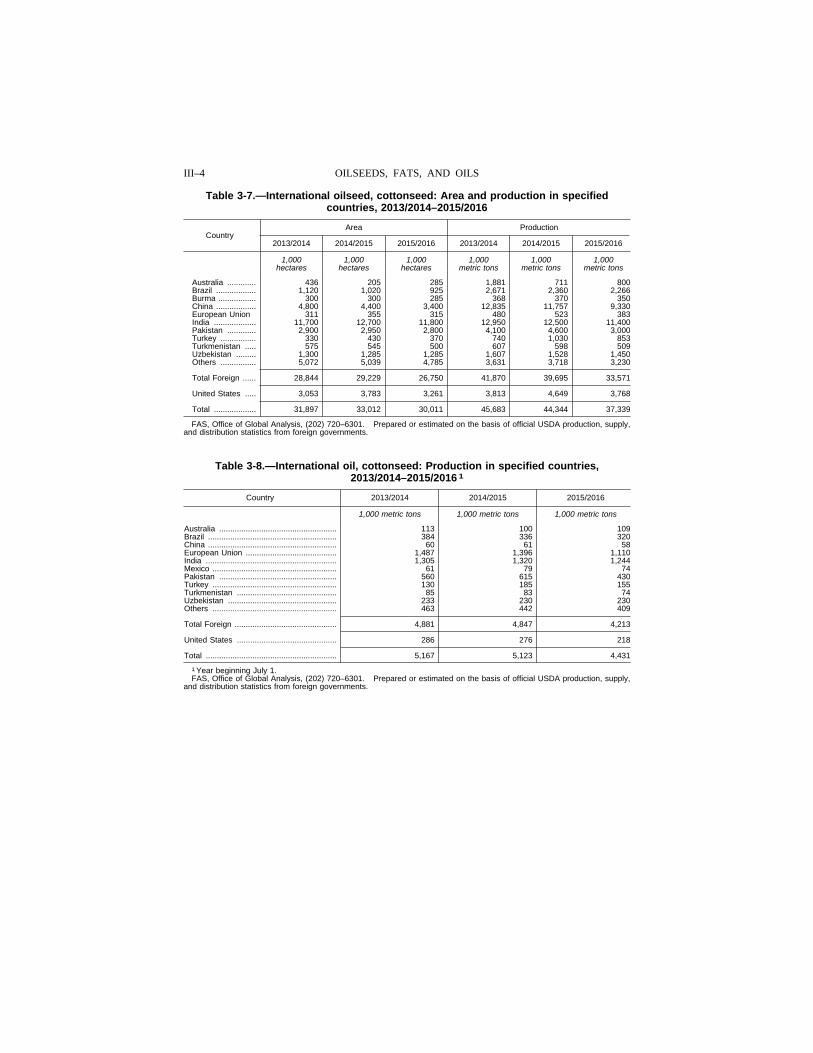
Table 3-7.—International oilseed, cottonseed: Area and production in specified countries, 2013/2014–2015/2016
Country Area Production
2013/2014 2014/2015 2015/2016 2013/2014 2014/2015 2015/2016
1,000 1,000 1,000 1,000 1,000 1,000 hectares hectares hectares metric tons metric tons metric tons
Australia ............. 436 205 285 1,881 711 800 Brazil .................. 1,120 1,020 925 2,671 2,360 2,266 Burma ................. 300 300 285 368 370 350 China .................. 4,800 4,400 3,400 12,835 11,757 9,330 European Union 311 355 315 480 523 383 India ................... 11,700 12,700 11,800 12,950 12,500 11,400 Pakistan ............. 2,900 2,950 2,800 4,100 4,600 3,000 Turkey ................ 330 430 370 740 1,030 853 Turkmenistan ..... 575 545 500 607 598 509 Uzbekistan ......... 1,300 1,285 1,285 1,607 1,528 1,450 Others ................ 5,072 5,039 4,785 3,631 3,718 3,230
Total Foreign ...... 28,844 29,229 26,750 41,870 39,695 33,571
United States ..... 3,053 3,783 3,261 3,813 4,649 3,768
Total ................... 31,897 33,012 30,011 45,683 44,344 37,339
FAS, Office of Global Analysis, (202) 720–6301. Prepared or estimated on the basis of official USDA production, supply, and distribution statistics from foreign governments.
Table 3-8.—International oil, cottonseed: Production in specified countries, 2013/2014–2015/2016 1
Country 2013/2014 2014/2015 2015/2016
1,000 metric tons 1,000 metric tons 1,000 metric tons
Australia ..................................................... 113 100 109 Brazil .......................................................... 384 336 320 China .......................................................... 60 61 58 European Union ......................................... 1,487 1,396 1,110 India ........................................................... 1,305 1,320 1,244 Mexico ........................................................ 61 79 74 Pakistan ..................................................... 560 615 430 Turkey ........................................................ 130 185 155 Turkmenistan ............................................. 85 83 74 Uzbekistan ................................................. 233 230 230 Others ........................................................ 463 442 409
Total Foreign .............................................. 4,881 4,847 4,213
United States ............................................. 286 276 218
Total ........................................................... 5,167 5,123 4,431
1 Year beginning July 1. FAS, Office of Global Analysis, (202) 720–6301. Prepared or estimated on the basis of official USDA production, supply,
and distribution statistics from foreign governments.
III–5 AGRICULTURAL STATISTICS 2016
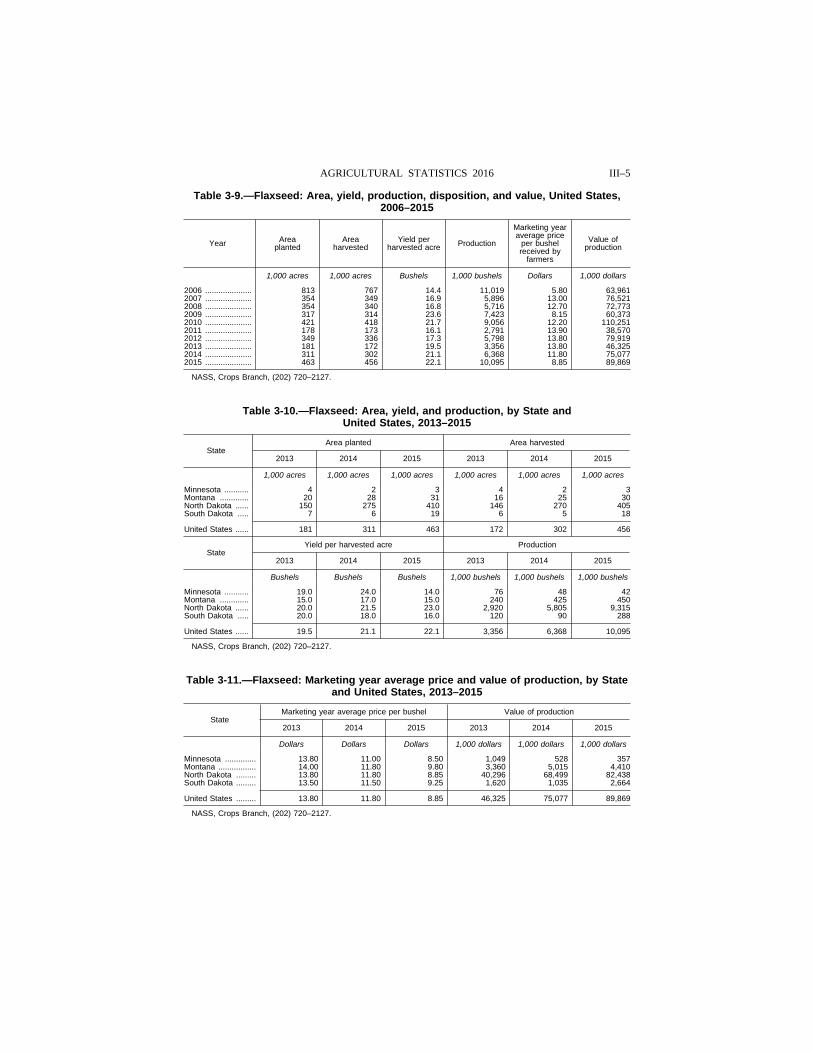
Table 3-9.—Flaxseed: Area, yield, production, disposition, and value, United States, 2006–2015
Year Area planted
Area harvested
Yield per harvested acre Production
Marketing year average price
per bushel received by
farmers
Value of production
1,000 acres 1,000 acres Bushels 1,000 bushels Dollars 1,000 dollars
2006 ..................... 813 767 14.4 11,019 5.80 63,961 2007 ..................... 354 349 16.9 5,896 13.00 76,521 2008 ..................... 354 340 16.8 5,716 12.70 72,773 2009 ..................... 317 314 23.6 7,423 8.15 60,373 2010 ..................... 421 418 21.7 9,056 12.20 110,251 2011 ..................... 178 173 16.1 2,791 13.90 38,570 2012 ..................... 349 336 17.3 5,798 13.80 79,919 2013 ..................... 181 172 19.5 3,356 13.80 46,325 2014 ..................... 311 302 21.1 6,368 11.80 75,077 2015 ..................... 463 456 22.1 10,095 8.85 89,869
NASS, Crops Branch, (202) 720–2127.
Table 3-10.—Flaxseed: Area, yield, and production, by State and United States, 2013–2015
State Area planted Area harvested
2013 2014 2015 2013 2014 2015
1,000 acres 1,000 acres 1,000 acres 1,000 acres 1,000 acres 1,000 acres
Minnesota ........... 4 2 3 4 2 3 Montana ............. 20 28 31 16 25 30 North Dakota ...... 150 275 410 146 270 405 South Dakota ..... 7 6 19 6 5 18
United States ...... 181 311 463 172 302 456
State Yield per harvested acre Production
2013 2014 2015 2013 2014 2015
Bushels Bushels Bushels 1,000 bushels 1,000 bushels 1,000 bushels
Minnesota ........... 19.0 24.0 14.0 76 48 42 Montana ............. 15.0 17.0 15.0 240 425 450 North Dakota ...... 20.0 21.5 23.0 2,920 5,805 9,315 South Dakota ..... 20.0 18.0 16.0 120 90 288
United States ...... 19.5 21.1 22.1 3,356 6,368 10,095
NASS, Crops Branch, (202) 720–2127.
Table 3-11.—Flaxseed: Marketing year average price and value of production, by State and United States, 2013–2015
State Marketing year average price per bushel Value of production
2013 2014 2015 2013 2014 2015
Dollars Dollars Dollars 1,000 dollars 1,000 dollars 1,000 dollars
Minnesota .............. 13.80 11.00 8.50 1,049 528 357 Montana ................. 14.00 11.80 9.80 3,360 5,015 4,410 North Dakota ......... 13.80 11.80 8.85 40,296 68,499 82,438 South Dakota ......... 13.50 11.50 9.25 1,620 1,035 2,664
United States ......... 13.80 11.80 8.85 46,325 75,077 89,869
NASS, Crops Branch, (202) 720–2127.
III–6 OILSEEDS, FATS, AND OILS
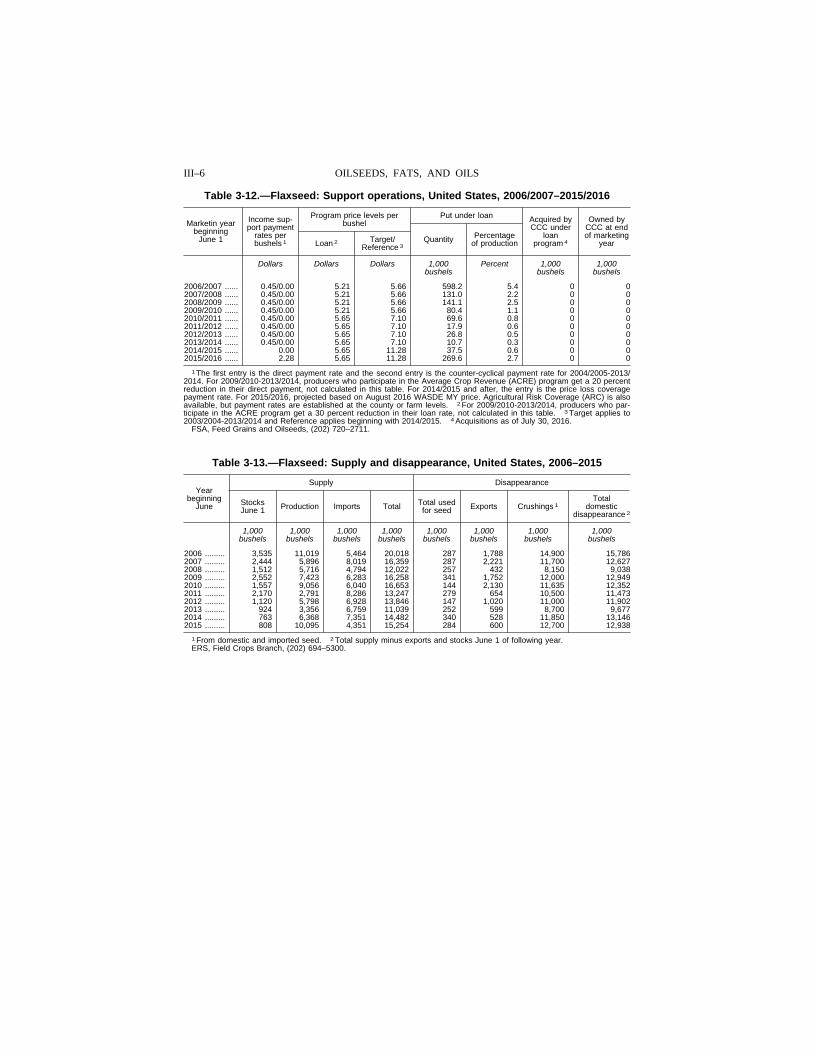
Table 3-12.—Flaxseed: Support operations, United States, 2006/2007–2015/2016
Marketin year beginning
June 1
Income sup-port payment
rates per bushels 1
Program price levels per bushel
Put under loan Acquired by CCC under
loan program 4
Owned by CCC at end of marketing
year Loan 2 Target/ Reference 3
Quantity Percentage of production
Dollars Dollars Dollars 1,000 Percent 1,000 1,000 bushels bushels bushels
2006/2007 ...... 0.45/0.00 5.21 5.66 598.2 5.4 0 0 2007/2008 ...... 0.45/0.00 5.21 5.66 131.0 2.2 0 0 2008/2009 ...... 0.45/0.00 5.21 5.66 141.1 2.5 0 0 2009/2010 ...... 0.45/0.00 5.21 5.66 80.4 1.1 0 0 2010/2011 ...... 0.45/0.00 5.65 7.10 69.6 0.8 0 0 2011/2012 ...... 0.45/0.00 5.65 7.10 17.9 0.6 0 0 2012/2013 ...... 0.45/0.00 5.65 7.10 26.8 0.5 0 0 2013/2014 ...... 0.45/0.00 5.65 7.10 10.7 0.3 0 0 2014/2015 ...... 0.00 5.65 11.28 37.5 0.6 0 0 2015/2016 ...... 2.28 5.65 11.28 269.6 2.7 0 0
1 The first entry is the direct payment rate and the second entry is the counter-cyclical payment rate for 2004/2005-2013/ 2014. For 2009/2010-2013/2014, producers who participate in the Average Crop Revenue (ACRE) program get a 20 percent reduction in their direct payment, not calculated in this table. For 2014/2015 and after, the entry is the price loss coverage payment rate. For 2015/2016, projected based on August 2016 WASDE MY price. Agricultural Risk Coverage (ARC) is also available, but payment rates are established at the county or farm levels. 2 For 2009/2010-2013/2014, producers who par-ticipate in the ACRE program get a 30 percent reduction in their loan rate, not calculated in this table. 3 Target applies to 2003/2004-2013/2014 and Reference applies beginning with 2014/2015. 4 Acquisitions as of July 30, 2016.
FSA, Feed Grains and Oilseeds, (202) 720–2711.
Table 3-13.—Flaxseed: Supply and disappearance, United States, 2006–2015
Year beginning
June
Supply Disappearance
Stocks June 1 Production Imports Total Total used
for seed Exports Crushings 1 Total
domestic disappearance 2
1,000 1,000 1,000 1,000 1,000 1,000 1,000 1,000 bushels bushels bushels bushels bushels bushels bushels bushels
2006 ......... 3,535 11,019 5,464 20,018 287 1,788 14,900 15,786 2007 ......... 2,444 5,896 8,019 16,359 287 2,221 11,700 12,627 2008 ......... 1,512 5,716 4,794 12,022 257 432 8,150 9,038 2009 ......... 2,552 7,423 6,283 16,258 341 1,752 12,000 12,949 2010 ......... 1,557 9,056 6,040 16,653 144 2,130 11,635 12,352 2011 ......... 2,170 2,791 8,286 13,247 279 654 10,500 11,473 2012 ......... 1,120 5,798 6,928 13,846 147 1,020 11,000 11,902 2013 ......... 924 3,356 6,759 11,039 252 599 8,700 9,677 2014 ......... 763 6,368 7,351 14,482 340 528 11,850 13,146 2015 ......... 808 10,095 4,351 15,254 284 600 12,700 12,938
1 From domestic and imported seed. 2 Total supply minus exports and stocks June 1 of following year. ERS, Field Crops Branch, (202) 694–5300.
III–7 AGRICULTURAL STATISTICS 2016
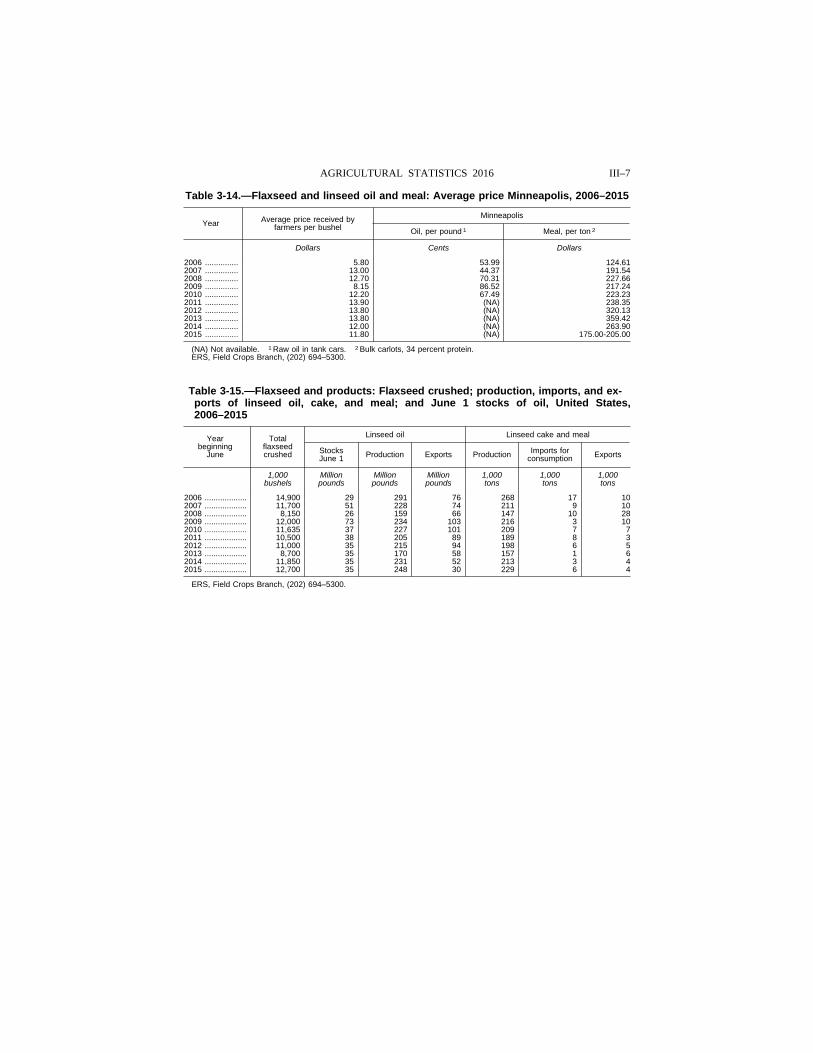
Table 3-14.—Flaxseed and linseed oil and meal: Average price Minneapolis, 2006–2015
Year Average price received by farmers per bushel
Minneapolis
Oil, per pound 1 Meal, per ton 2
Dollars Cents Dollars
2006 ............... 5.80 53.99 124.61 2007 ............... 13.00 44.37 191.54 2008 ............... 12.70 70.31 227.66 2009 ............... 8.15 86.52 217.24 2010 ............... 12.20 67.49 223.23 2011 ............... 13.90 (NA) 238.35 2012 ............... 13.80 (NA) 320.13 2013 ............... 13.80 (NA) 359.42 2014 ............... 12.00 (NA) 263.90 2015 ............... 11.80 (NA) 175.00-205.00
(NA) Not available. 1 Raw oil in tank cars. 2 Bulk carlots, 34 percent protein. ERS, Field Crops Branch, (202) 694–5300.
Table 3-15.—Flaxseed and products: Flaxseed crushed; production, imports, and ex-ports of linseed oil, cake, and meal; and June 1 stocks of oil, United States, 2006–2015
Year beginning
June
Total flaxseed crushed
Linseed oil Linseed cake and meal
Stocks June 1 Production Exports Production Imports for
consumption Exports
1,000 Million Million Million 1,000 1,000 1,000 bushels pounds pounds pounds tons tons tons
2006 ................... 14,900 29 291 76 268 17 10 2007 ................... 11,700 51 228 74 211 9 10 2008 ................... 8,150 26 159 66 147 10 28 2009 ................... 12,000 73 234 103 216 3 10 2010 ................... 11,635 37 227 101 209 7 7 2011 ................... 10,500 38 205 89 189 8 3 2012 ................... 11,000 35 215 94 198 6 5 2013 ................... 8,700 35 170 58 157 1 6 2014 ................... 11,850 35 231 52 213 3 4 2015 ................... 12,700 35 248 30 229 6 4
ERS, Field Crops Branch, (202) 694–5300.
III–8 OILSEEDS, FATS, AND OILS
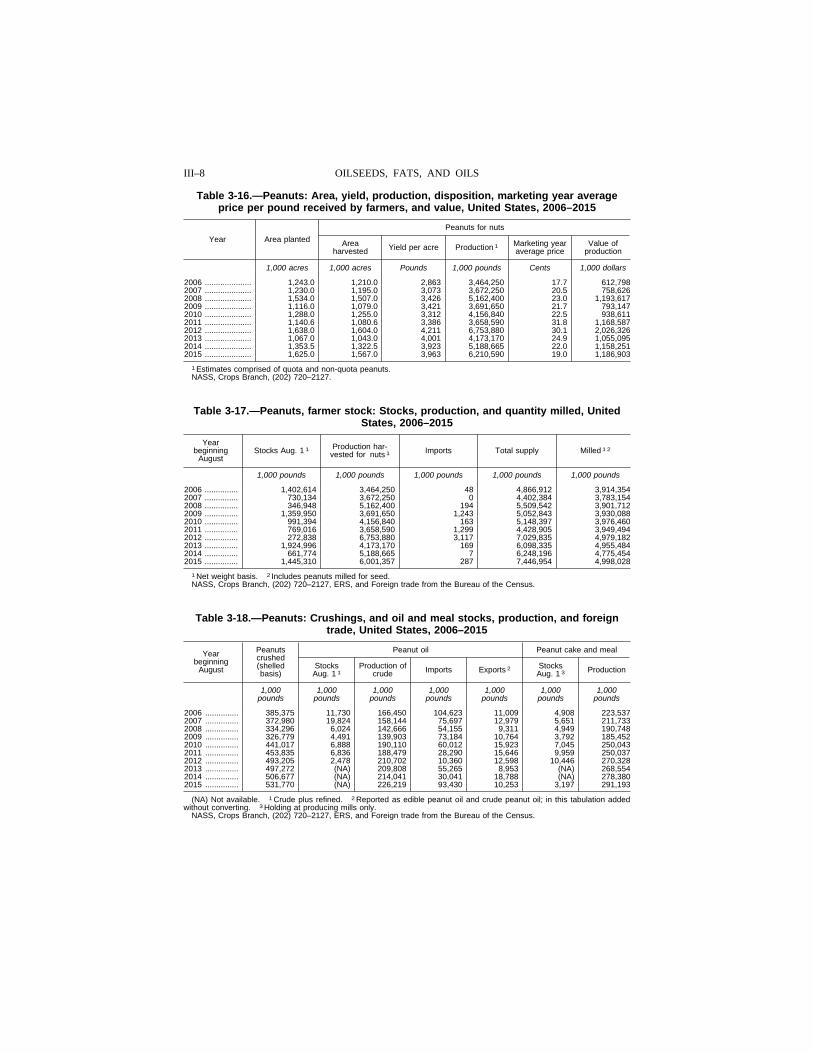
Table 3-16.—Peanuts: Area, yield, production, disposition, marketing year average price per pound received by farmers, and value, United States, 2006–2015
Year Area planted
Peanuts for nuts
Area harvested Yield per acre Production 1 Marketing year
average price Value of
production
1,000 acres 1,000 acres Pounds 1,000 pounds Cents 1,000 dollars
2006 ..................... 1,243.0 1,210.0 2,863 3,464,250 17.7 612,798 2007 ..................... 1,230.0 1,195.0 3,073 3,672,250 20.5 758,626 2008 ..................... 1,534.0 1,507.0 3,426 5,162,400 23.0 1,193,617 2009 ..................... 1,116.0 1,079.0 3,421 3,691,650 21.7 793,147 2010 ..................... 1,288.0 1,255.0 3,312 4,156,840 22.5 938,611 2011 ..................... 1,140.6 1,080.6 3,386 3,658,590 31.8 1,168,587 2012 ..................... 1,638.0 1,604.0 4,211 6,753,880 30.1 2,026,326 2013 ..................... 1,067.0 1,043.0 4,001 4,173,170 24.9 1,055,095 2014 ..................... 1,353.5 1,322.5 3,923 5,188,665 22.0 1,158,251 2015 ..................... 1,625.0 1,567.0 3,963 6,210,590 19.0 1,186,903
1 Estimates comprised of quota and non-quota peanuts. NASS, Crops Branch, (202) 720–2127.
Table 3-17.—Peanuts, farmer stock: Stocks, production, and quantity milled, United States, 2006–2015
Year beginning
August Stocks Aug. 1 1 Production har-
vested for nuts 1 Imports Total supply Milled 1 2
1,000 pounds 1,000 pounds 1,000 pounds 1,000 pounds 1,000 pounds
2006 ............... 1,402,614 3,464,250 48 4,866,912 3,914,354 2007 ............... 730,134 3,672,250 0 4,402,384 3,783,154 2008 ............... 346,948 5,162,400 194 5,509,542 3,901,712 2009 ............... 1,359,950 3,691,650 1,243 5,052,843 3,930,088 2010 ............... 991,394 4,156,840 163 5,148,397 3,976,460 2011 ............... 769,016 3,658,590 1,299 4,428,905 3,949,494 2012 ............... 272,838 6,753,880 3,117 7,029,835 4,979,182 2013 ............... 1,924,996 4,173,170 169 6,098,335 4,955,484 2014 ............... 661,774 5,188,665 7 6,248,196 4,775,454 2015 ............... 1,445,310 6,001,357 287 7,446,954 4,998,028
1 Net weight basis. 2 Includes peanuts milled for seed. NASS, Crops Branch, (202) 720–2127, ERS, and Foreign trade from the Bureau of the Census.
Table 3-18.—Peanuts: Crushings, and oil and meal stocks, production, and foreign trade, United States, 2006–2015
Year beginning
August
Peanuts crushed (shelled basis)
Peanut oil Peanut cake and meal
Stocks Aug. 1 1
Production of crude Imports Exports 2 Stocks
Aug. 1 3 Production
1,000 1,000 1,000 1,000 1,000 1,000 1,000 pounds pounds pounds pounds pounds pounds pounds
2006 ............... 385,375 11,730 166,450 104,623 11,009 4,908 223,537 2007 ............... 372,980 19,824 158,144 75,697 12,979 5,651 211,733 2008 ............... 334,296 6,024 142,666 54,155 9,311 4,949 190,748 2009 ............... 326,779 4,491 139,903 73,184 10,764 3,792 185,452 2010 ............... 441,017 6,888 190,110 60,012 15,923 7,045 250,043 2011 ............... 453,835 6,836 188,479 28,290 15,646 9,959 250,037 2012 ............... 493,205 2,478 210,702 10,360 12,598 10,446 270,328 2013 ............... 497,272 (NA) 209,808 55,265 8,953 (NA) 268,554 2014 ............... 506,677 (NA) 214,041 30,041 18,788 (NA) 278,380 2015 ............... 531,770 (NA) 226,219 93,430 10,253 3,197 291,193
(NA) Not available. 1 Crude plus refined. 2 Reported as edible peanut oil and crude peanut oil; in this tabulation added without converting. 3 Holding at producing mills only.
NASS, Crops Branch, (202) 720–2127, ERS, and Foreign trade from the Bureau of the Census.
III–9 AGRICULTURAL STATISTICS 2016
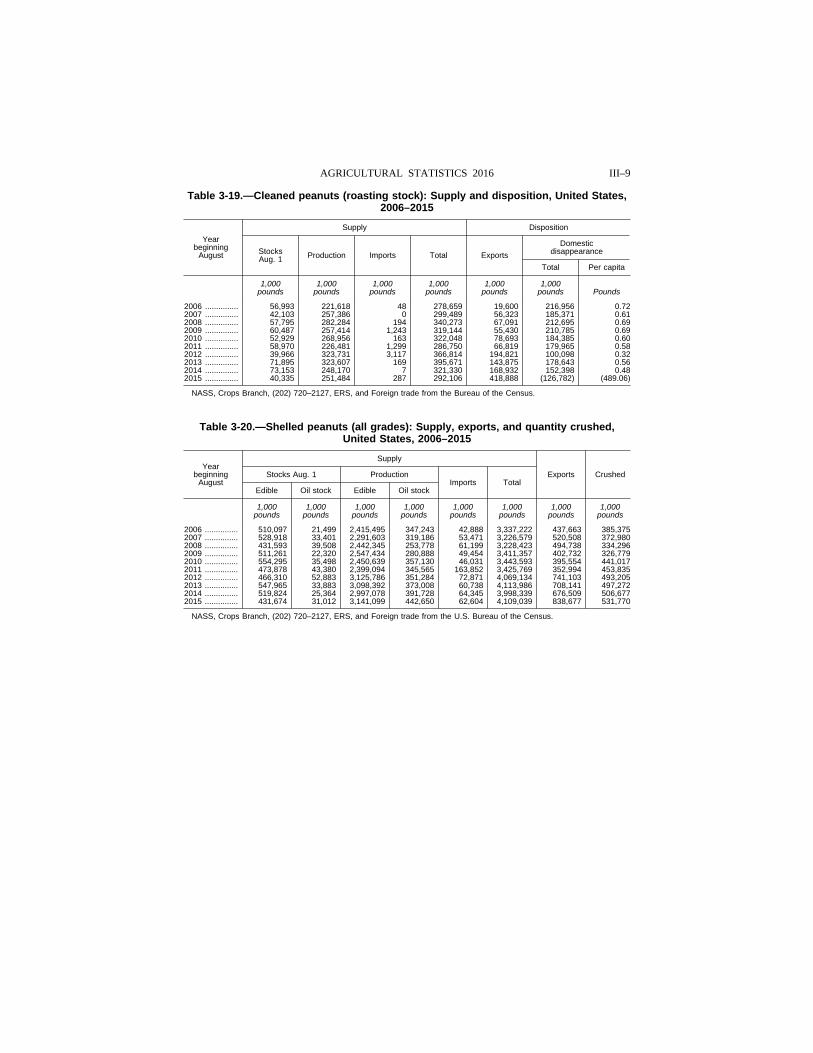
Table 3-19.—Cleaned peanuts (roasting stock): Supply and disposition, United States, 2006–2015
Year beginning
August
Supply Disposition
Stocks Aug. 1 Production Imports Total Exports
Domestic disappearance
Total Per capita
1,000 1,000 1,000 1,000 1,000 1,000 pounds pounds pounds pounds pounds pounds Pounds
2006 ............... 56,993 221,618 48 278,659 19,600 216,956 0.72 2007 ............... 42,103 257,386 0 299,489 56,323 185,371 0.61 2008 ............... 57,795 282,284 194 340,273 67,091 212,695 0.69 2009 ............... 60,487 257,414 1,243 319,144 55,430 210,785 0.69 2010 ............... 52,929 268,956 163 322,048 78,693 184,385 0.60 2011 ............... 58,970 226,481 1,299 286,750 66,819 179,965 0.58 2012 ............... 39,966 323,731 3,117 366,814 194,821 100,098 0.32 2013 ............... 71,895 323,607 169 395,671 143,875 178,643 0.56 2014 ............... 73,153 248,170 7 321,330 168,932 152,398 0.48 2015 ............... 40,335 251,484 287 292,106 418,888 (126,782) (489.06)
NASS, Crops Branch, (202) 720–2127, ERS, and Foreign trade from the Bureau of the Census.
Table 3-20.—Shelled peanuts (all grades): Supply, exports, and quantity crushed, United States, 2006–2015
Year beginning
August
Supply
Exports Crushed Stocks Aug. 1 Production Imports Total
Edible Oil stock Edible Oil stock
1,000 1,000 1,000 1,000 1,000 1,000 1,000 1,000 pounds pounds pounds pounds pounds pounds pounds pounds
2006 ............... 510,097 21,499 2,415,495 347,243 42,888 3,337,222 437,663 385,375 2007 ............... 528,918 33,401 2,291,603 319,186 53,471 3,226,579 520,508 372,980 2008 ............... 431,593 39,508 2,442,345 253,778 61,199 3,228,423 494,738 334,296 2009 ............... 511,261 22,320 2,547,434 280,888 49,454 3,411,357 402,732 326,779 2010 ............... 554,295 35,498 2,450,639 357,130 46,031 3,443,593 395,554 441,017 2011 ............... 473,878 43,380 2,399,094 345,565 163,852 3,425,769 352,994 453,835 2012 ............... 466,310 52,883 3,125,786 351,284 72,871 4,069,134 741,103 493,205 2013 ............... 547,965 33,883 3,098,392 373,008 60,738 4,113,986 708,141 497,272 2014 ............... 519,824 25,364 2,997,078 391,728 64,345 3,998,339 676,509 506,677 2015 ............... 431,674 31,012 3,141,099 442,650 62,604 4,109,039 838,677 531,770
NASS, Crops Branch, (202) 720–2127, ERS, and Foreign trade from the U.S. Bureau of the Census.
III–10 OILSEEDS, FATS, AND OILS
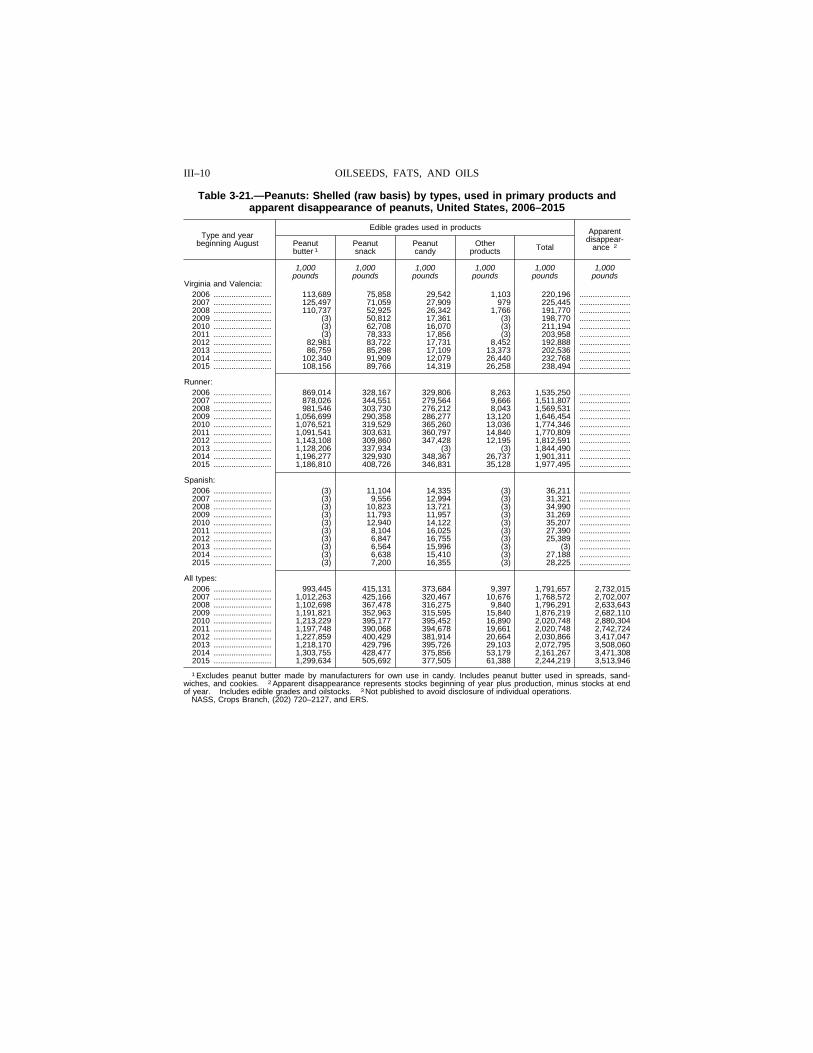
Table 3-21.—Peanuts: Shelled (raw basis) by types, used in primary products and apparent disappearance of peanuts, United States, 2006–2015
Type and year beginning August
Edible grades used in products Apparent disappear-
ance 2 Peanut butter 1
Peanut snack
Peanut candy
Other products Total
1,000 1,000 1,000 1,000 1,000 1,000 pounds pounds pounds pounds pounds pounds
Virginia and Valencia: 2006 .......................... 113,689 75,858 29,542 1,103 220,196 .......................2007 .......................... 125,497 71,059 27,909 979 225,445 .......................2008 .......................... 110,737 52,925 26,342 1,766 191,770 .......................2009 .......................... (3) 50,812 17,361 (3) 198,770 .......................2010 .......................... (3) 62,708 16,070 (3) 211,194 .......................2011 .......................... (3) 78,333 17,856 (3) 203,958 .......................2012 .......................... 82,981 83,722 17,731 8,452 192,888 .......................2013 .......................... 86,759 85,298 17,109 13,373 202,536 .......................2014 .......................... 102,340 91,909 12,079 26,440 232,768 .......................2015 .......................... 108,156 89,766 14,319 26,258 238,494 .......................
Runner: 2006 .......................... 869,014 328,167 329,806 8,263 1,535,250 .......................2007 .......................... 878,026 344,551 279,564 9,666 1,511,807 .......................2008 .......................... 981,546 303,730 276,212 8,043 1,569,531 .......................2009 .......................... 1,056,699 290,358 286,277 13,120 1,646,454 .......................2010 .......................... 1,076,521 319,529 365,260 13,036 1,774,346 .......................2011 .......................... 1,091,541 303,631 360,797 14,840 1,770,809 .......................2012 .......................... 1,143,108 309,860 347,428 12,195 1,812,591 .......................2013 .......................... 1,128,206 337,934 (3) (3) 1,844,490 .......................2014 .......................... 1,196,277 329,930 348,367 26,737 1,901,311 .......................2015 .......................... 1,186,810 408,726 346,831 35,128 1,977,495 .......................
Spanish: 2006 .......................... (3) 11,104 14,335 (3) 36,211 .......................2007 .......................... (3) 9,556 12,994 (3) 31,321 .......................2008 .......................... (3) 10,823 13,721 (3) 34,990 .......................2009 .......................... (3) 11,793 11,957 (3) 31,269 .......................2010 .......................... (3) 12,940 14,122 (3) 35,207 .......................2011 .......................... (3) 8,104 16,025 (3) 27,390 .......................2012 .......................... (3) 6,847 16,755 (3) 25,389 .......................2013 .......................... (3) 6,564 15,996 (3) (3) .......................2014 .......................... (3) 6,638 15,410 (3) 27,188 .......................2015 .......................... (3) 7,200 16,355 (3) 28,225 .......................
All types: 2006 .......................... 993,445 415,131 373,684 9,397 1,791,657 2,732,015 2007 .......................... 1,012,263 425,166 320,467 10,676 1,768,572 2,702,007 2008 .......................... 1,102,698 367,478 316,275 9,840 1,796,291 2,633,643 2009 .......................... 1,191,821 352,963 315,595 15,840 1,876,219 2,682,110 2010 .......................... 1,213,229 395,177 395,452 16,890 2,020,748 2,880,304 2011 .......................... 1,197,748 390,068 394,678 19,661 2,020,748 2,742,724 2012 .......................... 1,227,859 400,429 381,914 20,664 2,030,866 3,417,047 2013 .......................... 1,218,170 429,796 395,726 29,103 2,072,795 3,508,060 2014 .......................... 1,303,755 428,477 375,856 53,179 2,161,267 3,471,308 2015 .......................... 1,299,634 505,692 377,505 61,388 2,244,219 3,513,946
1 Excludes peanut butter made by manufacturers for own use in candy. Includes peanut butter used in spreads, sand-wiches, and cookies. 2 Apparent disappearance represents stocks beginning of year plus production, minus stocks at end of year. Includes edible grades and oilstocks. 3 Not published to avoid disclosure of individual operations.
NASS, Crops Branch, (202) 720–2127, and ERS.
III–11 AGRICULTURAL STATISTICS 2016
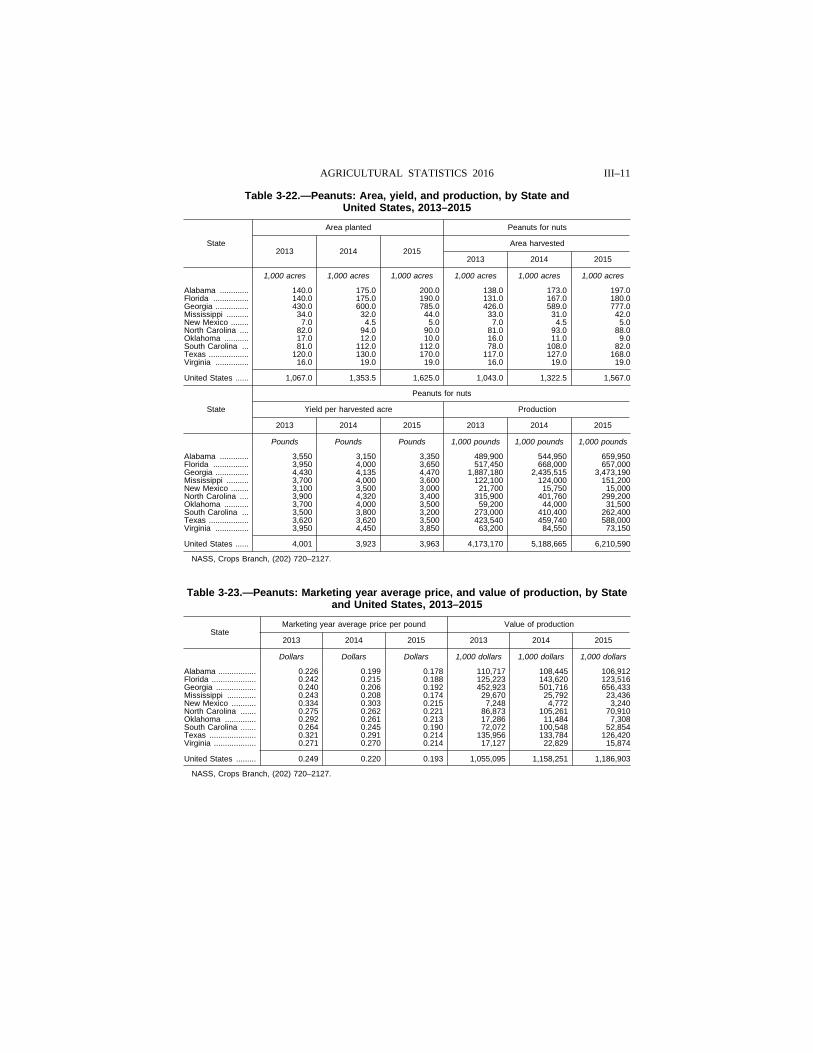
Table 3-22.—Peanuts: Area, yield, and production, by State and United States, 2013–2015
State
Area planted Peanuts for nuts
2013 2014 2015 Area harvested
2013 2014 2015
1,000 acres 1,000 acres 1,000 acres 1,000 acres 1,000 acres 1,000 acres
Alabama ............. 140.0 175.0 200.0 138.0 173.0 197.0 Florida ................ 140.0 175.0 190.0 131.0 167.0 180.0 Georgia ............... 430.0 600.0 785.0 426.0 589.0 777.0 Mississippi .......... 34.0 32.0 44.0 33.0 31.0 42.0 New Mexico ........ 7.0 4.5 5.0 7.0 4.5 5.0 North Carolina .... 82.0 94.0 90.0 81.0 93.0 88.0 Oklahoma ........... 17.0 12.0 10.0 16.0 11.0 9.0 South Carolina ... 81.0 112.0 112.0 78.0 108.0 82.0 Texas .................. 120.0 130.0 170.0 117.0 127.0 168.0 Virginia ............... 16.0 19.0 19.0 16.0 19.0 19.0
United States ...... 1,067.0 1,353.5 1,625.0 1,043.0 1,322.5 1,567.0
State
Peanuts for nuts
Yield per harvested acre Production
2013 2014 2015 2013 2014 2015
Pounds Pounds Pounds 1,000 pounds 1,000 pounds 1,000 pounds
Alabama ............. 3,550 3,150 3,350 489,900 544,950 659,950 Florida ................ 3,950 4,000 3,650 517,450 668,000 657,000 Georgia ............... 4,430 4,135 4,470 1,887,180 2,435,515 3,473,190 Mississippi .......... 3,700 4,000 3,600 122,100 124,000 151,200 New Mexico ........ 3,100 3,500 3,000 21,700 15,750 15,000 North Carolina .... 3,900 4,320 3,400 315,900 401,760 299,200 Oklahoma ........... 3,700 4,000 3,500 59,200 44,000 31,500 South Carolina ... 3,500 3,800 3,200 273,000 410,400 262,400 Texas .................. 3,620 3,620 3,500 423,540 459,740 588,000 Virginia ............... 3,950 4,450 3,850 63,200 84,550 73,150
United States ...... 4,001 3,923 3,963 4,173,170 5,188,665 6,210,590
NASS, Crops Branch, (202) 720–2127.
Table 3-23.—Peanuts: Marketing year average price, and value of production, by State and United States, 2013–2015
State Marketing year average price per pound Value of production
2013 2014 2015 2013 2014 2015
Dollars Dollars Dollars 1,000 dollars 1,000 dollars 1,000 dollars
Alabama ................. 0.226 0.199 0.178 110,717 108,445 106,912 Florida .................... 0.242 0.215 0.188 125,223 143,620 123,516 Georgia .................. 0.240 0.206 0.192 452,923 501,716 656,433 Mississippi ............. 0.243 0.208 0.174 29,670 25,792 23,436 New Mexico ........... 0.334 0.303 0.215 7,248 4,772 3,240 North Carolina ....... 0.275 0.262 0.221 86,873 105,261 70,910 Oklahoma .............. 0.292 0.261 0.213 17,286 11,484 7,308 South Carolina ....... 0.264 0.245 0.190 72,072 100,548 52,854 Texas ..................... 0.321 0.291 0.214 135,956 133,784 126,420 Virginia ................... 0.271 0.270 0.214 17,127 22,829 15,874
United States ......... 0.249 0.220 0.193 1,055,095 1,158,251 1,186,903
NASS, Crops Branch, (202) 720–2127.
III–12 OILSEEDS, FATS, AND OILS
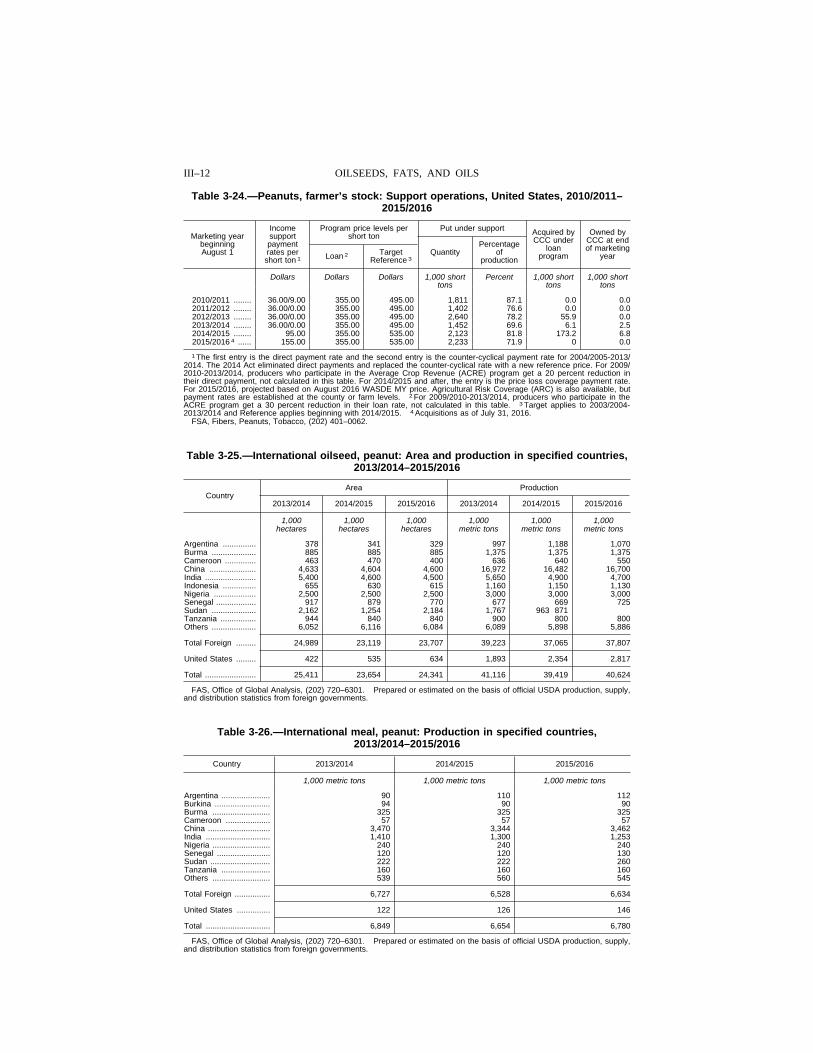
Table 3-24.—Peanuts, farmer’s stock: Support operations, United States, 2010/2011– 2015/2016
Marketing year beginning August 1
Income support payment rates per short ton 1
Program price levels per short ton
Put under support Acquired by CCC under
loan program
Owned by CCC at end of marketing
year Loan 2 Target Reference 3
Quantity Percentage
of production
Dollars Dollars Dollars 1,000 short tons
Percent 1,000 short tons
1,000 short tons
2010/2011 ........ 36.00/9.00 355.00 495.00 1,811 87.1 0.0 0.0 2011/2012 ........ 36.00/0.00 355.00 495.00 1,402 76.6 0.0 0.0 2012/2013 ........ 36.00/0.00 355.00 495.00 2,640 78.2 55.9 0.0 2013/2014 ........ 36.00/0.00 355.00 495.00 1,452 69.6 6.1 2.5 2014/2015 ........ 95.00 355.00 535.00 2,123 81.8 173.2 6.8 2015/2016 4 ...... 155.00 355.00 535.00 2,233 71.9 0 0.0
1 The first entry is the direct payment rate and the second entry is the counter-cyclical payment rate for 2004/2005-2013/ 2014. The 2014 Act eliminated direct payments and replaced the counter-cyclical rate with a new reference price. For 2009/ 2010-2013/2014, producers who participate in the Average Crop Revenue (ACRE) program get a 20 percent reduction in their direct payment, not calculated in this table. For 2014/2015 and after, the entry is the price loss coverage payment rate. For 2015/2016, projected based on August 2016 WASDE MY price. Agricultural Risk Coverage (ARC) is also available, but payment rates are established at the county or farm levels. 2 For 2009/2010-2013/2014, producers who participate in the ACRE program get a 30 percent reduction in their loan rate, not calculated in this table. 3 Target applies to 2003/2004- 2013/2014 and Reference applies beginning with 2014/2015. 4 Acquisitions as of July 31, 2016.
FSA, Fibers, Peanuts, Tobacco, (202) 401–0062.
Table 3-25.—International oilseed, peanut: Area and production in specified countries, 2013/2014–2015/2016
Country Area Production
2013/2014 2014/2015 2015/2016 2013/2014 2014/2015 2015/2016
1,000 1,000 1,000 1,000 1,000 1,000 hectares hectares hectares metric tons metric tons metric tons
Argentina ............... 378 341 329 997 1,188 1,070 Burma .................... 885 885 885 1,375 1,375 1,375 Cameroon .............. 463 470 400 636 640 550 China ..................... 4,633 4,604 4,600 16,972 16,482 16,700 India ....................... 5,400 4,600 4,500 5,650 4,900 4,700 Indonesia ............... 655 630 615 1,160 1,150 1,130 Nigeria ................... 2,500 2,500 2,500 3,000 3,000 3,000 Senegal .................. 917 879 770 677 669 725 Sudan .................... 2,162 1,254 2,184 1,767 963 871 Tanzania ................ 944 840 840 900 800 800 Others .................... 6,052 6,116 6,084 6,089 5,898 5,886
Total Foreign ......... 24,989 23,119 23,707 39,223 37,065 37,807
United States ......... 422 535 634 1,893 2,354 2,817
Total ....................... 25,411 23,654 24,341 41,116 39,419 40,624
FAS, Office of Global Analysis, (202) 720–6301. Prepared or estimated on the basis of official USDA production, supply, and distribution statistics from foreign governments.
Table 3-26.—International meal, peanut: Production in specified countries, 2013/2014–2015/2016
Country 2013/2014 2014/2015 2015/2016
1,000 metric tons 1,000 metric tons 1,000 metric tons
Argentina ...................... 90 110 112 Burkina ......................... 94 90 90 Burma .......................... 325 325 325 Cameroon .................... 57 57 57 China ............................ 3,470 3,344 3,462 India ............................. 1,410 1,300 1,253 Nigeria .......................... 240 240 240 Senegal ........................ 120 120 130 Sudan ........................... 222 222 260 Tanzania ...................... 160 160 160 Others .......................... 539 560 545
Total Foreign ................ 6,727 6,528 6,634
United States ............... 122 126 146
Total ............................. 6,849 6,654 6,780
FAS, Office of Global Analysis, (202) 720–6301. Prepared or estimated on the basis of official USDA production, supply, and distribution statistics from foreign governments.
III–13 AGRICULTURAL STATISTICS 2016
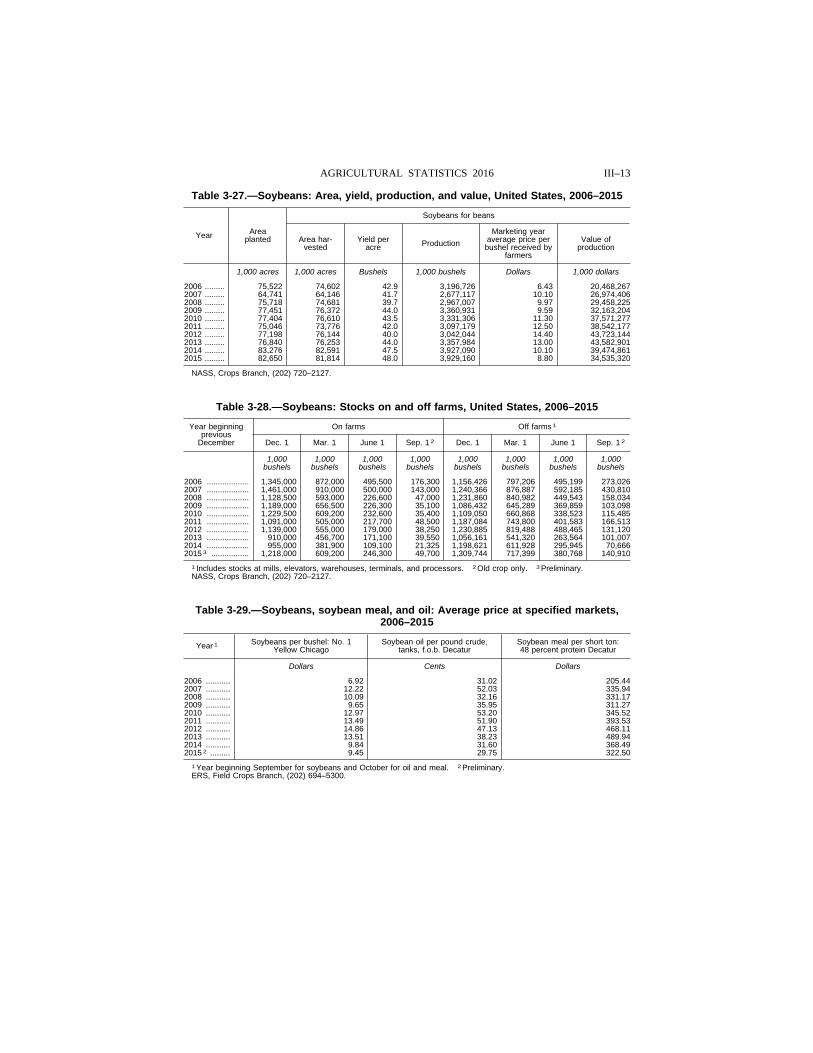
Table 3-27.—Soybeans: Area, yield, production, and value, United States, 2006–2015
Year Area planted
Soybeans for beans
Area har-vested
Yield per acre Production
Marketing year average price per bushel received by
farmers
Value of production
1,000 acres 1,000 acres Bushels 1,000 bushels Dollars 1,000 dollars
2006 ......... 75,522 74,602 42.9 3,196,726 6.43 20,468,267 2007 ......... 64,741 64,146 41.7 2,677,117 10.10 26,974,406 2008 ......... 75,718 74,681 39.7 2,967,007 9.97 29,458,225 2009 ......... 77,451 76,372 44.0 3,360,931 9.59 32,163,204 2010 ......... 77,404 76,610 43.5 3,331,306 11.30 37,571,277 2011 ......... 75,046 73,776 42.0 3,097,179 12.50 38,542,177 2012 ......... 77,198 76,144 40.0 3,042,044 14.40 43,723,144 2013 ......... 76,840 76,253 44.0 3,357,984 13.00 43,582,901 2014 ......... 83,276 82,591 47.5 3,927,090 10.10 39,474,861 2015 ......... 82,650 81,814 48.0 3,929,160 8.80 34,535,320
NASS, Crops Branch, (202) 720–2127.
Table 3-28.—Soybeans: Stocks on and off farms, United States, 2006–2015
Year beginning previous
December
On farms Off farms 1
Dec. 1 Mar. 1 June 1 Sep. 1 2 Dec. 1 Mar. 1 June 1 Sep. 1 2
1,000 1,000 1,000 1,000 1,000 1,000 1,000 1,000 bushels bushels bushels bushels bushels bushels bushels bushels
2006 ................... 1,345,000 872,000 495,500 176,300 1,156,426 797,206 495,199 273,026 2007 ................... 1,461,000 910,000 500,000 143,000 1,240,366 876,887 592,185 430,810 2008 ................... 1,128,500 593,000 226,600 47,000 1,231,860 840,982 449,543 158,034 2009 ................... 1,189,000 656,500 226,300 35,100 1,086,432 645,289 369,859 103,098 2010 ................... 1,229,500 609,200 232,600 35,400 1,109,050 660,868 338,523 115,485 2011 ................... 1,091,000 505,000 217,700 48,500 1,187,084 743,800 401,583 166,513 2012 ................... 1,139,000 555,000 179,000 38,250 1,230,885 819,488 488,465 131,120 2013 ................... 910,000 456,700 171,100 39,550 1,056,161 541,320 263,564 101,007 2014 ................... 955,000 381,900 109,100 21,325 1,198,621 611,928 295,945 70,666 2015 3 ................. 1,218,000 609,200 246,300 49,700 1,309,744 717,399 380,768 140,910
1 Includes stocks at mills, elevators, warehouses, terminals, and processors. 2 Old crop only. 3 Preliminary. NASS, Crops Branch, (202) 720–2127.
Table 3-29.—Soybeans, soybean meal, and oil: Average price at specified markets, 2006–2015
Year 1 Soybeans per bushel: No. 1 Yellow Chicago
Soybean oil per pound crude, tanks, f.o.b. Decatur
Soybean meal per short ton: 48 percent protein Decatur
Dollars Cents Dollars
2006 ........... 6.92 31.02 205.44 2007 ........... 12.22 52.03 335.94 2008 ........... 10.09 32.16 331.17 2009 ........... 9.65 35.95 311.27 2010 ........... 12.97 53.20 345.52 2011 ........... 13.49 51.90 393.53 2012 ........... 14.86 47.13 468.11 2013 ........... 13.51 38.23 489.94 2014 ........... 9.84 31.60 368.49 2015 2 ......... 9.45 29.75 322.50
1 Year beginning September for soybeans and October for oil and meal. 2 Preliminary. ERS, Field Crops Branch, (202) 694–5300.
III–14 OILSEEDS, FATS, AND OILS
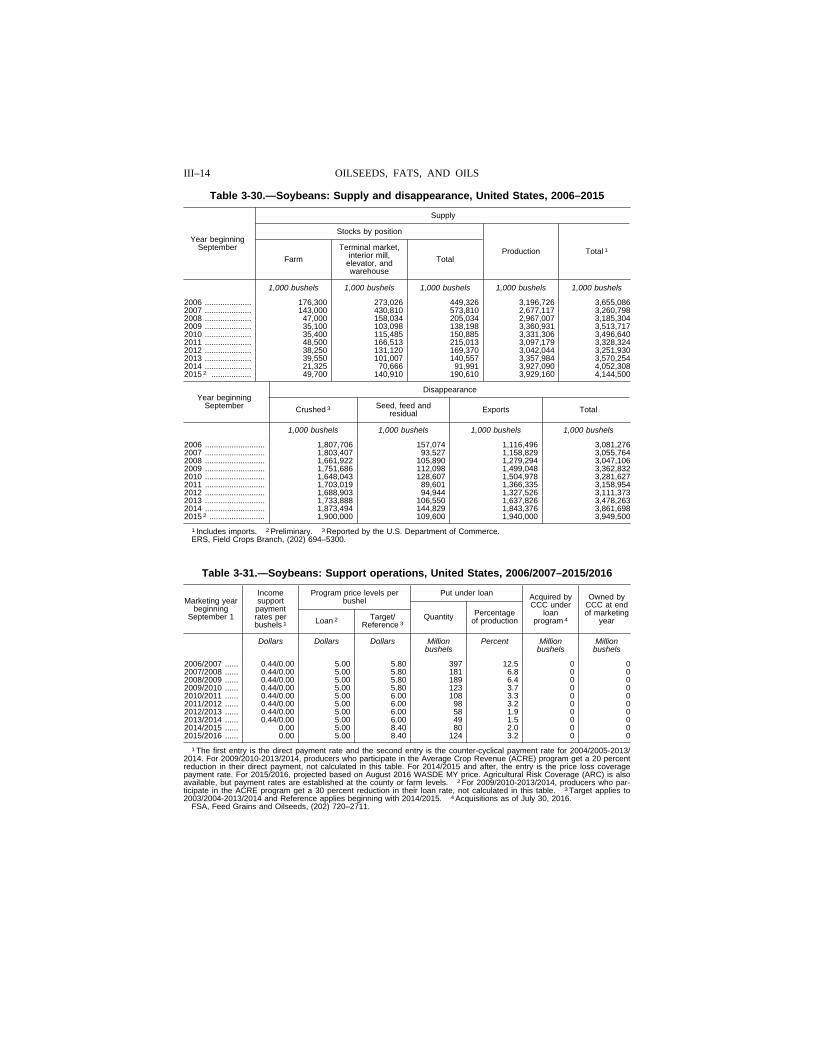
Table 3-30.—Soybeans: Supply and disappearance, United States, 2006–2015
Year beginning September
Supply
Stocks by position
Production Total 1 Farm
Terminal market, interior mill,
elevator, and warehouse
Total
1,000 bushels 1,000 bushels 1,000 bushels 1,000 bushels 1,000 bushels
2006 ..................... 176,300 273,026 449,326 3,196,726 3,655,086 2007 ..................... 143,000 430,810 573,810 2,677,117 3,260,798 2008 ..................... 47,000 158,034 205,034 2,967,007 3,185,304 2009 ..................... 35,100 103,098 138,198 3,360,931 3,513,717 2010 ..................... 35,400 115,485 150,885 3,331,306 3,496,640 2011 ..................... 48,500 166,513 215,013 3,097,179 3,328,324 2012 ..................... 38,250 131,120 169,370 3,042,044 3,251,930 2013 ..................... 39,550 101,007 140,557 3,357,984 3,570,254 2014 ..................... 21,325 70,666 91,991 3,927,090 4,052,308 2015 2 .................. 49,700 140,910 190,610 3,929,160 4,144,500
Year beginning September
Disappearance
Crushed 3 Seed, feed and residual Exports Total
1,000 bushels 1,000 bushels 1,000 bushels 1,000 bushels
2006 ........................... 1,807,706 157,074 1,116,496 3,081,276 2007 ........................... 1,803,407 93,527 1,158,829 3,055,764 2008 ........................... 1,661,922 105,890 1,279,294 3,047,106 2009 ........................... 1,751,686 112,098 1,499,048 3,362,832 2010 ........................... 1,648,043 128,607 1,504,978 3,281,627 2011 ........................... 1,703,019 89,601 1,366,335 3,158,954 2012 ........................... 1,688,903 94,944 1,327,526 3,111,373 2013 ........................... 1,733,888 106,550 1,637,826 3,478,263 2014 ........................... 1,873,494 144,829 1,843,376 3,861,698 2015 2 ......................... 1,900,000 109,600 1,940,000 3,949,500
1 Includes imports. 2 Preliminary. 3 Reported by the U.S. Department of Commerce. ERS, Field Crops Branch, (202) 694–5300.
Table 3-31.—Soybeans: Support operations, United States, 2006/2007–2015/2016
Marketing year beginning
September 1
Income support payment rates per bushels 1
Program price levels per bushel
Put under loan Acquired by CCC under
loan program 4
Owned by CCC at end of marketing
year Loan 2 Target/ Reference 3
Quantity Percentage of production
Dollars Dollars Dollars Million Percent Million Million bushels bushels bushels
2006/2007 ...... 0.44/0.00 5.00 5.80 397 12.5 0 0 2007/2008 ...... 0.44/0.00 5.00 5.80 181 6.8 0 0 2008/2009 ...... 0.44/0.00 5.00 5.80 189 6.4 0 0 2009/2010 ...... 0.44/0.00 5.00 5.80 123 3.7 0 0 2010/2011 ...... 0.44/0.00 5.00 6.00 108 3.3 0 0 2011/2012 ...... 0.44/0.00 5.00 6.00 98 3.2 0 0 2012/2013 ...... 0.44/0.00 5.00 6.00 58 1.9 0 0 2013/2014 ...... 0.44/0.00 5.00 6.00 49 1.5 0 0 2014/2015 ...... 0.00 5.00 8.40 80 2.0 0 0 2015/2016 ...... 0.00 5.00 8.40 124 3.2 0 0
1 The first entry is the direct payment rate and the second entry is the counter-cyclical payment rate for 2004/2005-2013/ 2014. For 2009/2010-2013/2014, producers who participate in the Average Crop Revenue (ACRE) program get a 20 percent reduction in their direct payment, not calculated in this table. For 2014/2015 and after, the entry is the price loss coverage payment rate. For 2015/2016, projected based on August 2016 WASDE MY price. Agricultural Risk Coverage (ARC) is also available, but payment rates are established at the county or farm levels. 2 For 2009/2010-2013/2014, producers who par-ticipate in the ACRE program get a 30 percent reduction in their loan rate, not calculated in this table. 3 Target applies to 2003/2004-2013/2014 and Reference applies beginning with 2014/2015. 4 Acquisitions as of July 30, 2016.
FSA, Feed Grains and Oilseeds, (202) 720–2711.
III–15 AGRICULTURAL STATISTICS 2016
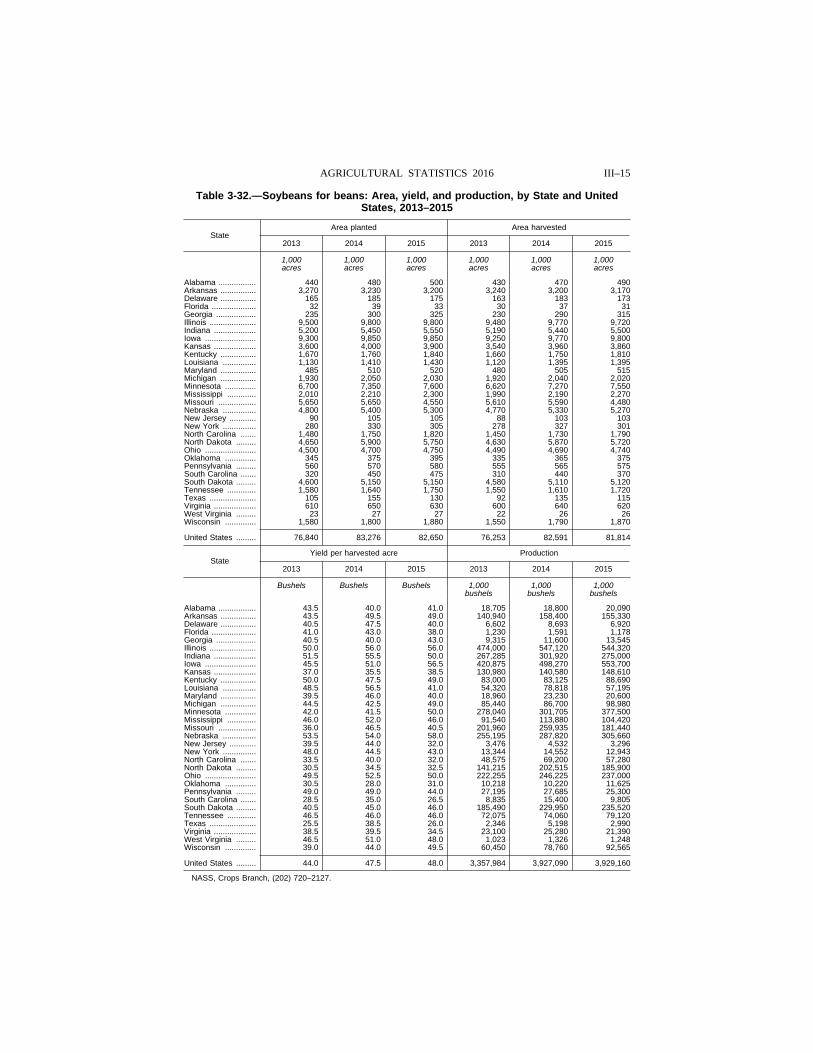
Table 3-32.—Soybeans for beans: Area, yield, and production, by State and United States, 2013–2015
State Area planted Area harvested
2013 2014 2015 2013 2014 2015
1,000 1,000 1,000 1,000 1,000 1,000 acres acres acres acres acres acres
Alabama ................. 440 480 500 430 470 490 Arkansas ................ 3,270 3,230 3,200 3,240 3,200 3,170 Delaware ................ 165 185 175 163 183 173 Florida .................... 32 39 33 30 37 31 Georgia .................. 235 300 325 230 290 315 Illinois ..................... 9,500 9,800 9,800 9,480 9,770 9,720 Indiana ................... 5,200 5,450 5,550 5,190 5,440 5,500 Iowa ....................... 9,300 9,850 9,850 9,250 9,770 9,800 Kansas ................... 3,600 4,000 3,900 3,540 3,960 3,860 Kentucky ................ 1,670 1,760 1,840 1,660 1,750 1,810 Louisiana ............... 1,130 1,410 1,430 1,120 1,395 1,395 Maryland ................ 485 510 520 480 505 515 Michigan ................ 1,930 2,050 2,030 1,920 2,040 2,020 Minnesota .............. 6,700 7,350 7,600 6,620 7,270 7,550 Mississippi ............. 2,010 2,210 2,300 1,990 2,190 2,270 Missouri ................. 5,650 5,650 4,550 5,610 5,590 4,480 Nebraska ............... 4,800 5,400 5,300 4,770 5,330 5,270 New Jersey ............ 90 105 105 88 103 103 New York ............... 280 330 305 278 327 301 North Carolina ....... 1,480 1,750 1,820 1,450 1,730 1,790 North Dakota ......... 4,650 5,900 5,750 4,630 5,870 5,720 Ohio ....................... 4,500 4,700 4,750 4,490 4,690 4,740 Oklahoma .............. 345 375 395 335 365 375 Pennsylvania ......... 560 570 580 555 565 575 South Carolina ....... 320 450 475 310 440 370 South Dakota ......... 4,600 5,150 5,150 4,580 5,110 5,120 Tennessee ............. 1,580 1,640 1,750 1,550 1,610 1,720 Texas ..................... 105 155 130 92 135 115 Virginia ................... 610 650 630 600 640 620 West Virginia ......... 23 27 27 22 26 26 Wisconsin .............. 1,580 1,800 1,880 1,550 1,790 1,870
United States ......... 76,840 83,276 82,650 76,253 82,591 81,814
State Yield per harvested acre Production
2013 2014 2015 2013 2014 2015
Bushels Bushels Bushels 1,000 1,000 1,000 bushels bushels bushels
Alabama ................. 43.5 40.0 41.0 18,705 18,800 20,090 Arkansas ................ 43.5 49.5 49.0 140,940 158,400 155,330 Delaware ................ 40.5 47.5 40.0 6,602 8,693 6,920 Florida .................... 41.0 43.0 38.0 1,230 1,591 1,178 Georgia .................. 40.5 40.0 43.0 9,315 11,600 13,545 Illinois ..................... 50.0 56.0 56.0 474,000 547,120 544,320 Indiana ................... 51.5 55.5 50.0 267,285 301,920 275,000 Iowa ....................... 45.5 51.0 56.5 420,875 498,270 553,700 Kansas ................... 37.0 35.5 38.5 130,980 140,580 148,610 Kentucky ................ 50.0 47.5 49.0 83,000 83,125 88,690 Louisiana ............... 48.5 56.5 41.0 54,320 78,818 57,195 Maryland ................ 39.5 46.0 40.0 18,960 23,230 20,600 Michigan ................ 44.5 42.5 49.0 85,440 86,700 98,980 Minnesota .............. 42.0 41.5 50.0 278,040 301,705 377,500 Mississippi ............. 46.0 52.0 46.0 91,540 113,880 104,420 Missouri ................. 36.0 46.5 40.5 201,960 259,935 181,440 Nebraska ............... 53.5 54.0 58.0 255,195 287,820 305,660 New Jersey ............ 39.5 44.0 32.0 3,476 4,532 3,296 New York ............... 48.0 44.5 43.0 13,344 14,552 12,943 North Carolina ....... 33.5 40.0 32.0 48,575 69,200 57,280 North Dakota ......... 30.5 34.5 32.5 141,215 202,515 185,900 Ohio ....................... 49.5 52.5 50.0 222,255 246,225 237,000 Oklahoma .............. 30.5 28.0 31.0 10,218 10,220 11,625 Pennsylvania ......... 49.0 49.0 44.0 27,195 27,685 25,300 South Carolina ....... 28.5 35.0 26.5 8,835 15,400 9,805 South Dakota ......... 40.5 45.0 46.0 185,490 229,950 235,520 Tennessee ............. 46.5 46.0 46.0 72,075 74,060 79,120 Texas ..................... 25.5 38.5 26.0 2,346 5,198 2,990 Virginia ................... 38.5 39.5 34.5 23,100 25,280 21,390 West Virginia ......... 46.5 51.0 48.0 1,023 1,326 1,248 Wisconsin .............. 39.0 44.0 49.5 60,450 78,760 92,565
United States ......... 44.0 47.5 48.0 3,357,984 3,927,090 3,929,160
NASS, Crops Branch, (202) 720–2127.
III–16 OILSEEDS, FATS, AND OILS
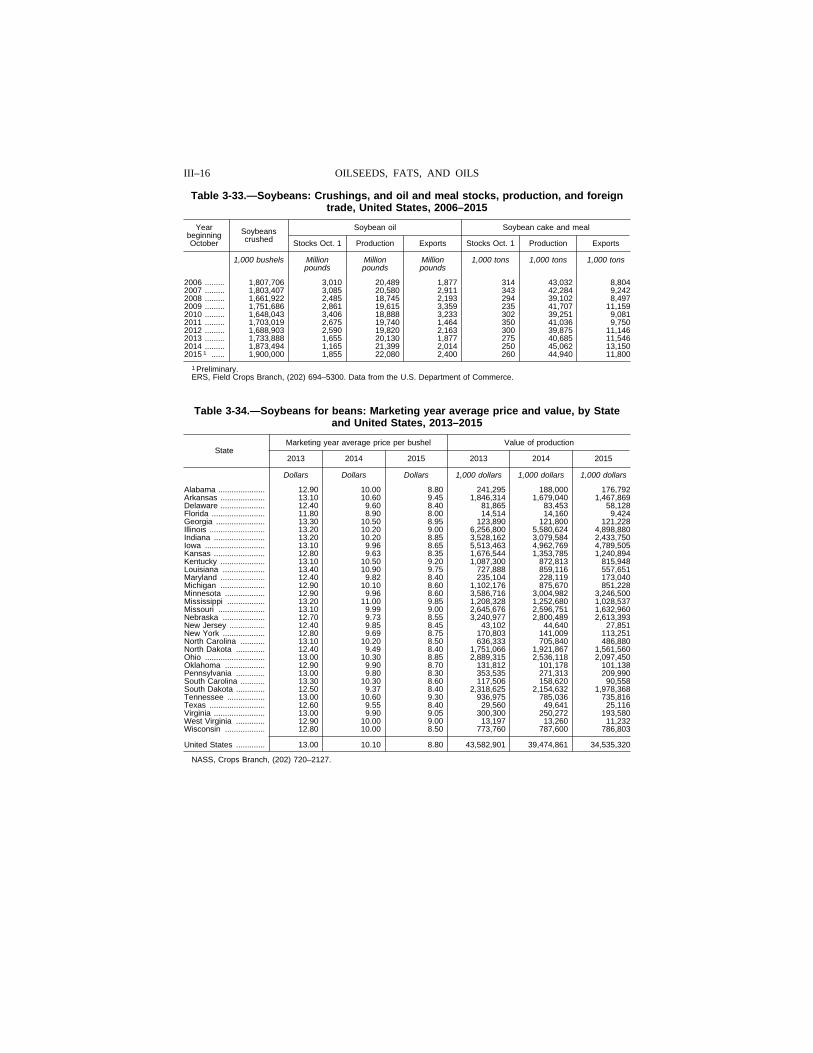
Table 3-33.—Soybeans: Crushings, and oil and meal stocks, production, and foreign trade, United States, 2006–2015
Year beginning October
Soybeans crushed
Soybean oil Soybean cake and meal
Stocks Oct. 1 Production Exports Stocks Oct. 1 Production Exports
1,000 bushels Million pounds
Million pounds
Million pounds
1,000 tons 1,000 tons 1,000 tons
2006 ......... 1,807,706 3,010 20,489 1,877 314 43,032 8,804 2007 ......... 1,803,407 3,085 20,580 2,911 343 42,284 9,242 2008 ......... 1,661,922 2,485 18,745 2,193 294 39,102 8,497 2009 ......... 1,751,686 2,861 19,615 3,359 235 41,707 11,159 2010 ......... 1,648,043 3,406 18,888 3,233 302 39,251 9,081 2011 ......... 1,703,019 2,675 19,740 1,464 350 41,036 9,750 2012 ......... 1,688,903 2,590 19,820 2,163 300 39,875 11,146 2013 ......... 1,733,888 1,655 20,130 1,877 275 40,685 11,546 2014 ......... 1,873,494 1,165 21,399 2,014 250 45,062 13,150 2015 1 ...... 1,900,000 1,855 22,080 2,400 260 44,940 11,800
1 Preliminary. ERS, Field Crops Branch, (202) 694–5300. Data from the U.S. Department of Commerce.
Table 3-34.—Soybeans for beans: Marketing year average price and value, by State and United States, 2013–2015
State Marketing year average price per bushel Value of production
2013 2014 2015 2013 2014 2015
Dollars Dollars Dollars 1,000 dollars 1,000 dollars 1,000 dollars
Alabama ..................... 12.90 10.00 8.80 241,295 188,000 176,792 Arkansas .................... 13.10 10.60 9.45 1,846,314 1,679,040 1,467,869 Delaware .................... 12.40 9.60 8.40 81,865 83,453 58,128 Florida ........................ 11.80 8.90 8.00 14,514 14,160 9,424 Georgia ...................... 13.30 10.50 8.95 123,890 121,800 121,228 Illinois ......................... 13.20 10.20 9.00 6,256,800 5,580,624 4,898,880 Indiana ....................... 13.20 10.20 8.85 3,528,162 3,079,584 2,433,750 Iowa ........................... 13.10 9.96 8.65 5,513,463 4,962,769 4,789,505 Kansas ....................... 12.80 9.63 8.35 1,676,544 1,353,785 1,240,894 Kentucky .................... 13.10 10.50 9.20 1,087,300 872,813 815,948 Louisiana ................... 13.40 10.90 9.75 727,888 859,116 557,651 Maryland .................... 12.40 9.82 8.40 235,104 228,119 173,040 Michigan .................... 12.90 10.10 8.60 1,102,176 875,670 851,228 Minnesota .................. 12.90 9.96 8.60 3,586,716 3,004,982 3,246,500 Mississippi ................. 13.20 11.00 9.85 1,208,328 1,252,680 1,028,537 Missouri ..................... 13.10 9.99 9.00 2,645,676 2,596,751 1,632,960 Nebraska ................... 12.70 9.73 8.55 3,240,977 2,800,489 2,613,393 New Jersey ................ 12.40 9.85 8.45 43,102 44,640 27,851 New York ................... 12.80 9.69 8.75 170,803 141,009 113,251 North Carolina ........... 13.10 10.20 8.50 636,333 705,840 486,880 North Dakota ............. 12.40 9.49 8.40 1,751,066 1,921,867 1,561,560 Ohio ........................... 13.00 10.30 8.85 2,889,315 2,536,118 2,097,450 Oklahoma .................. 12.90 9.90 8.70 131,812 101,178 101,138 Pennsylvania ............. 13.00 9.80 8.30 353,535 271,313 209,990 South Carolina ........... 13.30 10.30 8.60 117,506 158,620 90,558 South Dakota ............. 12.50 9.37 8.40 2,318,625 2,154,632 1,978,368 Tennessee ................. 13.00 10.60 9.30 936,975 785,036 735,816 Texas ......................... 12.60 9.55 8.40 29,560 49,641 25,116 Virginia ....................... 13.00 9.90 9.05 300,300 250,272 193,580 West Virginia ............. 12.90 10.00 9.00 13,197 13,260 11,232 Wisconsin .................. 12.80 10.00 8.50 773,760 787,600 786,803
United States ............. 13.00 10.10 8.80 43,582,901 39,474,861 34,535,320
NASS, Crops Branch, (202) 720–2127.
III–17 AGRICULTURAL STATISTICS 2016
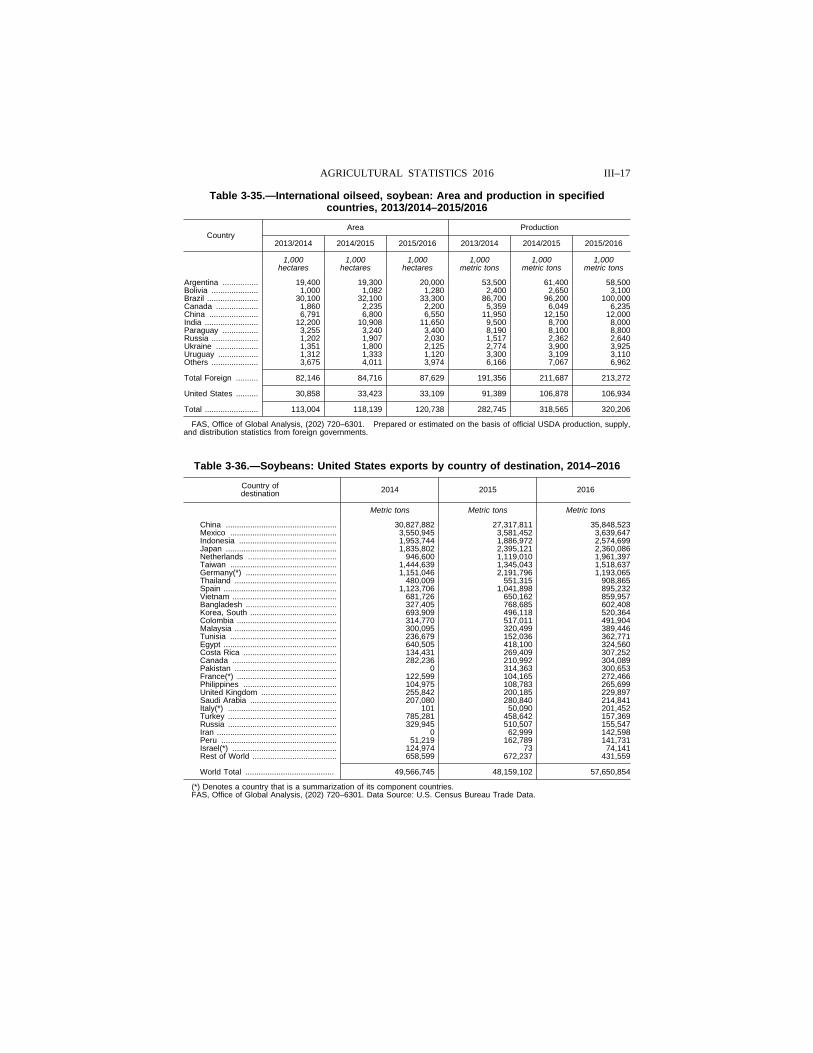
Table 3-35.—International oilseed, soybean: Area and production in specified countries, 2013/2014–2015/2016
Country Area Production
2013/2014 2014/2015 2015/2016 2013/2014 2014/2015 2015/2016
1,000 1,000 1,000 1,000 1,000 1,000 hectares hectares hectares metric tons metric tons metric tons
Argentina ................ 19,400 19,300 20,000 53,500 61,400 58,500 Bolivia ..................... 1,000 1,082 1,280 2,400 2,650 3,100 Brazil ....................... 30,100 32,100 33,300 86,700 96,200 100,000 Canada ................... 1,860 2,235 2,200 5,359 6,049 6,235 China ...................... 6,791 6,800 6,550 11,950 12,150 12,000 India ........................ 12,200 10,908 11,650 9,500 8,700 8,000 Paraguay ................ 3,255 3,240 3,400 8,190 8,100 8,800 Russia ..................... 1,202 1,907 2,030 1,517 2,362 2,640 Ukraine ................... 1,351 1,800 2,125 2,774 3,900 3,925 Uruguay .................. 1,312 1,333 1,120 3,300 3,109 3,110 Others ..................... 3,675 4,011 3,974 6,166 7,067 6,962
Total Foreign .......... 82,146 84,716 87,629 191,356 211,687 213,272
United States .......... 30,858 33,423 33,109 91,389 106,878 106,934
Total ........................ 113,004 118,139 120,738 282,745 318,565 320,206
FAS, Office of Global Analysis, (202) 720–6301. Prepared or estimated on the basis of official USDA production, supply, and distribution statistics from foreign governments.
Table 3-36.—Soybeans: United States exports by country of destination, 2014–2016
Country of destination 2014 2015 2016
Metric tons Metric tons Metric tons
China .................................................. 30,827,882 27,317,811 35,848,523 Mexico ................................................ 3,550,945 3,581,452 3,639,647 Indonesia ............................................ 1,953,744 1,886,972 2,574,699 Japan .................................................. 1,835,802 2,395,121 2,360,086 Netherlands ........................................ 946,600 1,119,010 1,961,397 Taiwan ................................................ 1,444,639 1,345,043 1,518,637 Germany(*) ......................................... 1,151,046 2,191,796 1,193,065 Thailand .............................................. 480,009 551,315 908,865 Spain ................................................... 1,123,706 1,041,898 895,232 Vietnam ............................................... 681,726 650,162 859,957 Bangladesh ......................................... 327,405 768,685 602,408 Korea, South ....................................... 693,909 496,118 520,364 Colombia ............................................. 314,770 517,011 491,904 Malaysia .............................................. 300,095 320,499 389,446 Tunisia ................................................ 236,679 152,036 362,771 Egypt ................................................... 640,505 418,100 324,560 Costa Rica .......................................... 134,431 269,409 307,252 Canada ............................................... 282,236 210,992 304,089 Pakistan .............................................. 0 314,363 300,653 France(*) ............................................. 122,599 104,165 272,466 Philippines .......................................... 104,975 108,783 265,699 United Kingdom .................................. 255,842 200,185 229,897 Saudi Arabia ....................................... 207,080 280,840 214,841 Italy(*) ................................................. 101 50,090 201,452 Turkey ................................................. 785,281 458,642 157,369 Russia ................................................. 329,945 510,507 155,547 Iran ...................................................... 0 62,999 142,598 Peru .................................................... 51,219 162,789 141,731 Israel(*) ............................................... 124,974 73 74,141 Rest of World ...................................... 658,599 672,237 431,559
World Total ........................................ 49,566,745 48,159,102 57,650,854
(*) Denotes a country that is a summarization of its component countries. FAS, Office of Global Analysis, (202) 720–6301. Data Source: U.S. Census Bureau Trade Data.
III–18 OILSEEDS, FATS, AND OILS
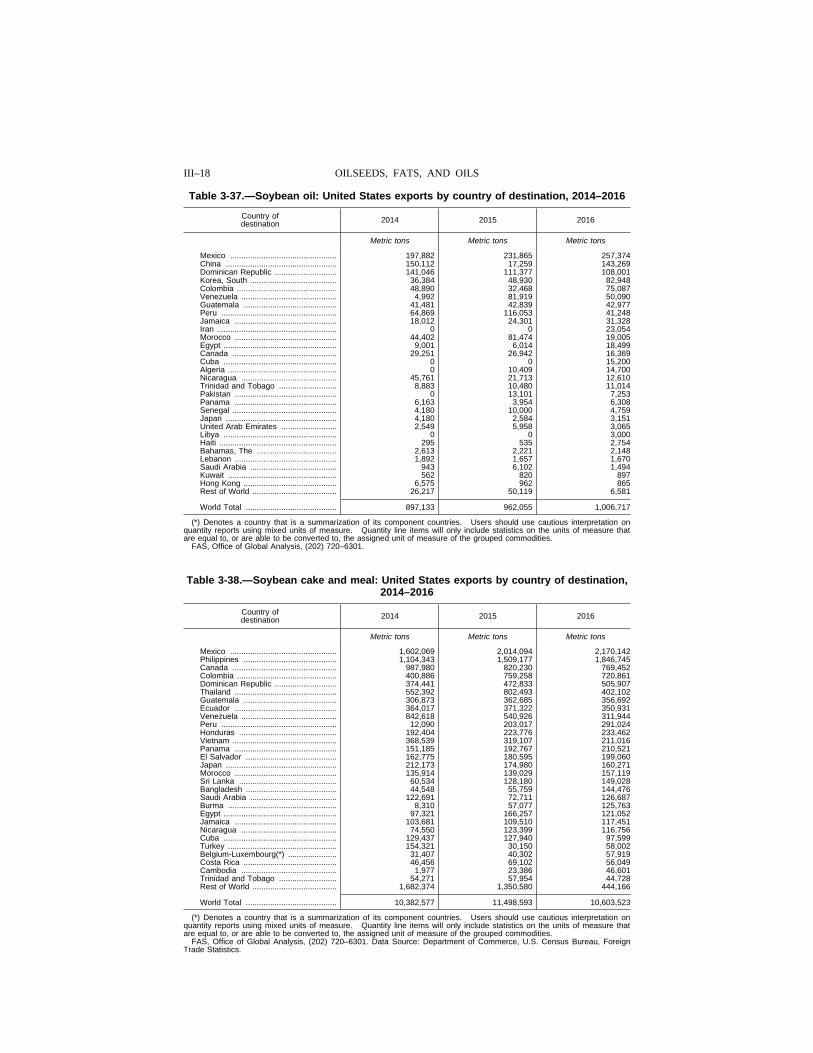
Table 3-37.—Soybean oil: United States exports by country of destination, 2014–2016
Country of destination 2014 2015 2016
Metric tons Metric tons Metric tons
Mexico ................................................ 197,882 231,865 257,374 China .................................................. 150,112 17,259 143,269 Dominican Republic ............................ 141,046 111,377 108,001 Korea, South ....................................... 36,384 48,930 82,948 Colombia ............................................. 48,890 32,468 75,087 Venezuela ........................................... 4,992 81,919 50,090 Guatemala .......................................... 41,481 42,839 42,977 Peru .................................................... 64,869 116,053 41,248 Jamaica .............................................. 18,012 24,301 31,328 Iran ...................................................... 0 0 23,054 Morocco .............................................. 44,402 81,474 19,005 Egypt ................................................... 9,001 6,014 18,499 Canada ............................................... 29,251 26,942 16,369 Cuba ................................................... 0 0 15,200 Algeria ................................................. 0 10,409 14,700 Nicaragua ........................................... 45,761 21,713 12,610 Trinidad and Tobago .......................... 8,883 10,480 11,014 Pakistan .............................................. 0 13,101 7,253 Panama .............................................. 6,163 3,954 6,308 Senegal ............................................... 4,180 10,000 4,759 Japan .................................................. 4,180 2,584 3,151 United Arab Emirates ......................... 2,549 5,958 3,065 Libya ................................................... 0 0 3,000 Haiti ..................................................... 295 535 2,754 Bahamas, The .................................... 2,613 2,221 2,148 Lebanon .............................................. 1,892 1,657 1,670 Saudi Arabia ....................................... 943 6,102 1,494 Kuwait ................................................. 562 820 897 Hong Kong .......................................... 6,575 962 865 Rest of World ...................................... 26,217 50,119 6,581
World Total ......................................... 897,133 962,055 1,006,717
(*) Denotes a country that is a summarization of its component countries. Users should use cautious interpretation on quantity reports using mixed units of measure. Quantity line items will only include statistics on the units of measure that are equal to, or are able to be converted to, the assigned unit of measure of the grouped commodities.
FAS, Office of Global Analysis, (202) 720–6301.
Table 3-38.—Soybean cake and meal: United States exports by country of destination, 2014–2016
Country of destination 2014 2015 2016
Metric tons Metric tons Metric tons
Mexico ................................................ 1,602,069 2,014,094 2,170,142 Philippines .......................................... 1,104,343 1,509,177 1,846,745 Canada ............................................... 987,980 820,230 769,452 Colombia ............................................. 400,886 759,258 720,861 Dominican Republic ............................ 374,441 472,833 505,907 Thailand .............................................. 552,392 802,493 402,102 Guatemala .......................................... 306,873 362,685 356,692 Ecuador .............................................. 364,017 371,322 350,931 Venezuela ........................................... 842,618 540,926 311,944 Peru .................................................... 12,090 203,017 291,024 Honduras ............................................ 192,404 223,776 233,462 Vietnam ............................................... 368,539 319,107 211,016 Panama .............................................. 151,185 192,767 210,521 El Salvador ......................................... 162,775 180,595 199,060 Japan .................................................. 212,173 174,980 160,271 Morocco .............................................. 135,914 139,029 157,119 Sri Lanka ............................................ 60,534 128,180 149,028 Bangladesh ......................................... 44,548 55,759 144,476 Saudi Arabia ....................................... 122,691 72,711 126,687 Burma ................................................. 8,310 57,077 125,763 Egypt ................................................... 97,321 166,257 121,052 Jamaica .............................................. 103,681 109,510 117,451 Nicaragua ........................................... 74,550 123,399 116,756 Cuba ................................................... 129,437 127,940 97,599 Turkey ................................................. 154,321 30,150 58,002 Belgium-Luxembourg(*) ...................... 31,407 40,302 57,919 Costa Rica .......................................... 46,456 69,102 56,049 Cambodia ........................................... 1,977 23,386 46,601 Trinidad and Tobago .......................... 54,271 57,954 44,728 Rest of World ...................................... 1,682,374 1,350,580 444,166
World Total ......................................... 10,382,577 11,498,593 10,603,523
(*) Denotes a country that is a summarization of its component countries. Users should use cautious interpretation on quantity reports using mixed units of measure. Quantity line items will only include statistics on the units of measure that are equal to, or are able to be converted to, the assigned unit of measure of the grouped commodities.
FAS, Office of Global Analysis, (202) 720–6301. Data Source: Department of Commerce, U.S. Census Bureau, Foreign Trade Statistics.
III–19 AGRICULTURAL STATISTICS 2016
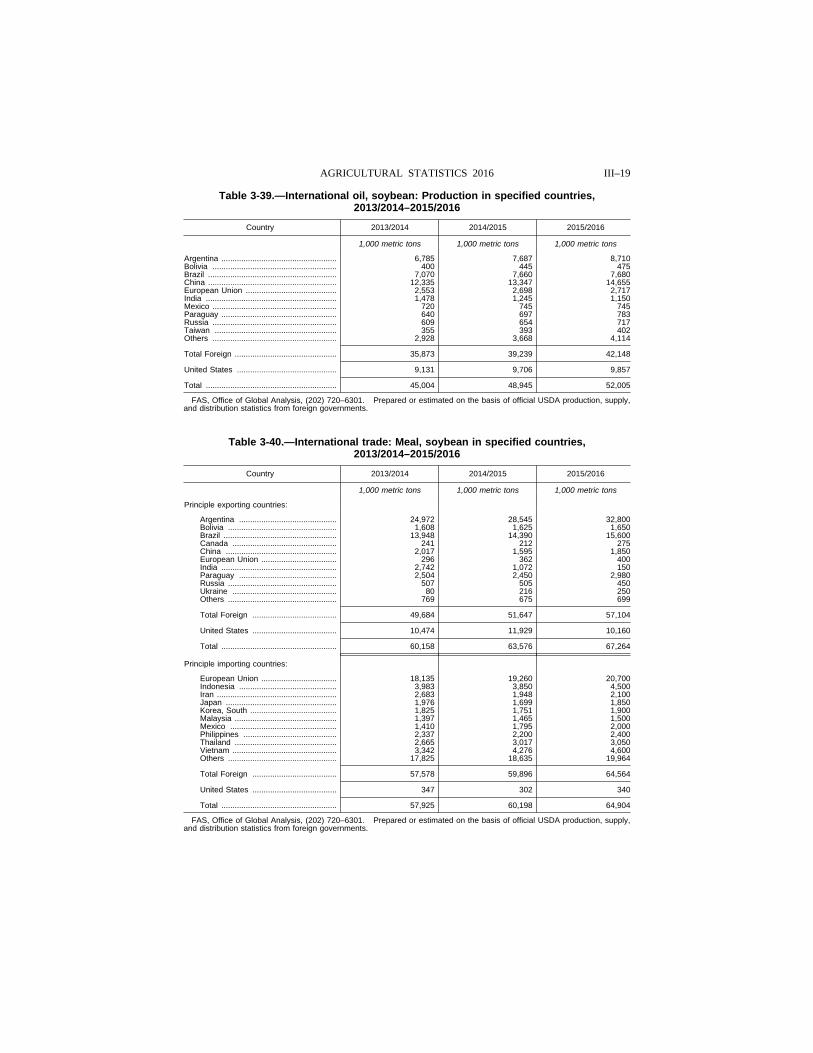
Table 3-39.—International oil, soybean: Production in specified countries, 2013/2014–2015/2016
Country 2013/2014 2014/2015 2015/2016
1,000 metric tons 1,000 metric tons 1,000 metric tons
Argentina .................................................... 6,785 7,687 8,710 Bolivia ........................................................ 400 445 475 Brazil .......................................................... 7,070 7,660 7,680 China .......................................................... 12,335 13,347 14,655 European Union ......................................... 2,553 2,698 2,717 India ........................................................... 1,478 1,245 1,150 Mexico ........................................................ 720 745 745 Paraguay .................................................... 640 697 783 Russia ........................................................ 609 654 717 Taiwan ....................................................... 355 393 402 Others ........................................................ 2,928 3,668 4,114
Total Foreign .............................................. 35,873 39,239 42,148
United States ............................................. 9,131 9,706 9,857
Total ........................................................... 45,004 48,945 52,005
FAS, Office of Global Analysis, (202) 720–6301. Prepared or estimated on the basis of official USDA production, supply, and distribution statistics from foreign governments.
Table 3-40.—International trade: Meal, soybean in specified countries, 2013/2014–2015/2016
Country 2013/2014 2014/2015 2015/2016
1,000 metric tons 1,000 metric tons 1,000 metric tons
Principle exporting countries:
Argentina ............................................ 24,972 28,545 32,800 Bolivia ................................................. 1,608 1,625 1,650 Brazil ................................................... 13,948 14,390 15,600 Canada ............................................... 241 212 275 China .................................................. 2,017 1,595 1,850 European Union .................................. 296 362 400 India .................................................... 2,742 1,072 150 Paraguay ............................................ 2,504 2,450 2,980 Russia ................................................. 507 505 450 Ukraine ............................................... 80 216 250 Others ................................................. 769 675 699
Total Foreign ...................................... 49,684 51,647 57,104
United States ...................................... 10,474 11,929 10,160
Total .................................................... 60,158 63,576 67,264
Principle importing countries:
European Union .................................. 18,135 19,260 20,700 Indonesia ............................................ 3,983 3,850 4,500 Iran ...................................................... 2,683 1,948 2,100 Japan .................................................. 1,976 1,699 1,850 Korea, South ....................................... 1,825 1,751 1,900 Malaysia .............................................. 1,397 1,465 1,500 Mexico ................................................ 1,410 1,795 2,000 Philippines .......................................... 2,337 2,200 2,400 Thailand .............................................. 2,665 3,017 3,050 Vietnam ............................................... 3,342 4,276 4,600 Others ................................................. 17,825 18,635 19,964
Total Foreign ...................................... 57,578 59,896 64,564
United States ...................................... 347 302 340
Total .................................................... 57,925 60,198 64,904
FAS, Office of Global Analysis, (202) 720–6301. Prepared or estimated on the basis of official USDA production, supply, and distribution statistics from foreign governments.
III–20 OILSEEDS, FATS, AND OILS
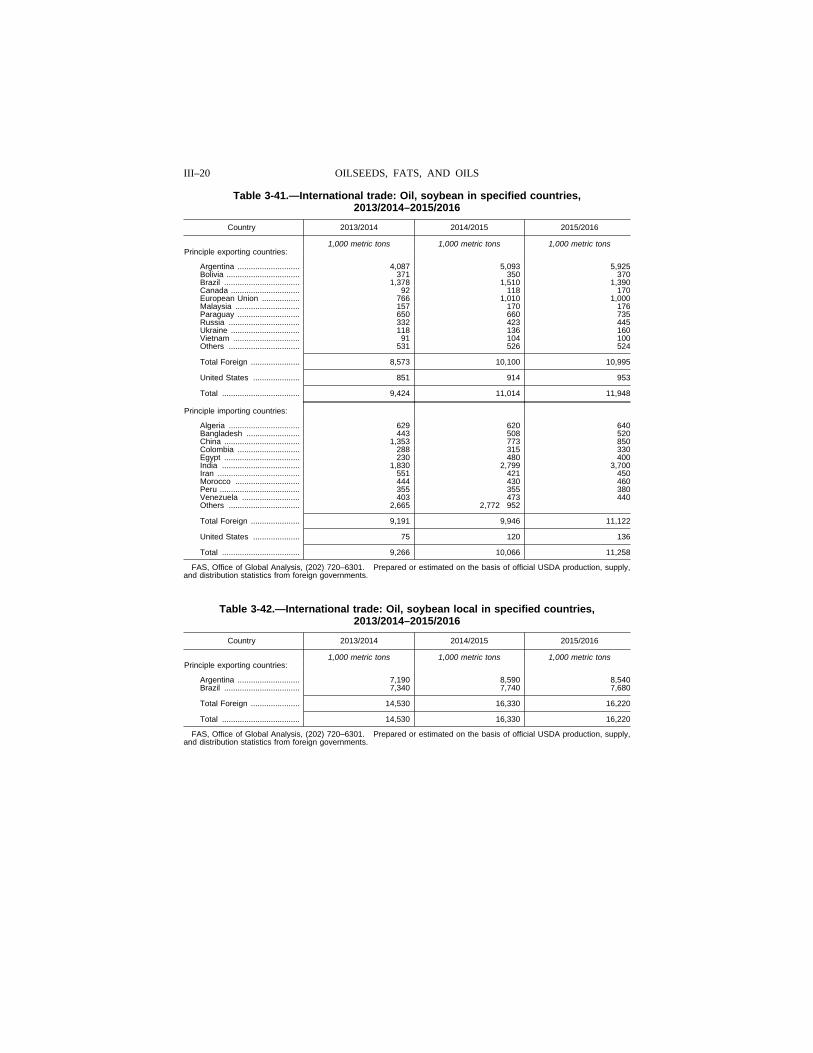
Table 3-41.—International trade: Oil, soybean in specified countries, 2013/2014–2015/2016
Country 2013/2014 2014/2015 2015/2016
1,000 metric tons 1,000 metric tons 1,000 metric tons Principle exporting countries:
Argentina ............................ 4,087 5,093 5,925 Bolivia ................................. 371 350 370 Brazil .................................. 1,378 1,510 1,390 Canada ............................... 92 118 170 European Union ................. 766 1,010 1,000 Malaysia ............................. 157 170 176 Paraguay ............................ 650 660 735 Russia ................................ 332 423 445 Ukraine ............................... 118 136 160 Vietnam .............................. 91 104 100 Others ................................ 531 526 524
Total Foreign ...................... 8,573 10,100 10,995
United States ..................... 851 914 953
Total ................................... 9,424 11,014 11,948
Principle importing countries:
Algeria ................................ 629 620 640 Bangladesh ........................ 443 508 520 China .................................. 1,353 773 850 Colombia ............................ 288 315 330 Egypt .................................. 230 480 400 India ................................... 1,830 2,799 3,700 Iran ..................................... 551 421 450 Morocco ............................. 444 430 460 Peru .................................... 355 355 380 Venezuela .......................... 403 473 440 Others ................................ 2,665 2,772 952
Total Foreign ...................... 9,191 9,946 11,122
United States ..................... 75 120 136
Total ................................... 9,266 10,066 11,258
FAS, Office of Global Analysis, (202) 720–6301. Prepared or estimated on the basis of official USDA production, supply, and distribution statistics from foreign governments.
Table 3-42.—International trade: Oil, soybean local in specified countries, 2013/2014–2015/2016
Country 2013/2014 2014/2015 2015/2016
1,000 metric tons 1,000 metric tons 1,000 metric tons Principle exporting countries:
Argentina ............................ 7,190 8,590 8,540 Brazil .................................. 7,340 7,740 7,680
Total Foreign ...................... 14,530 16,330 16,220
Total ................................... 14,530 16,330 16,220
FAS, Office of Global Analysis, (202) 720–6301. Prepared or estimated on the basis of official USDA production, supply, and distribution statistics from foreign governments.
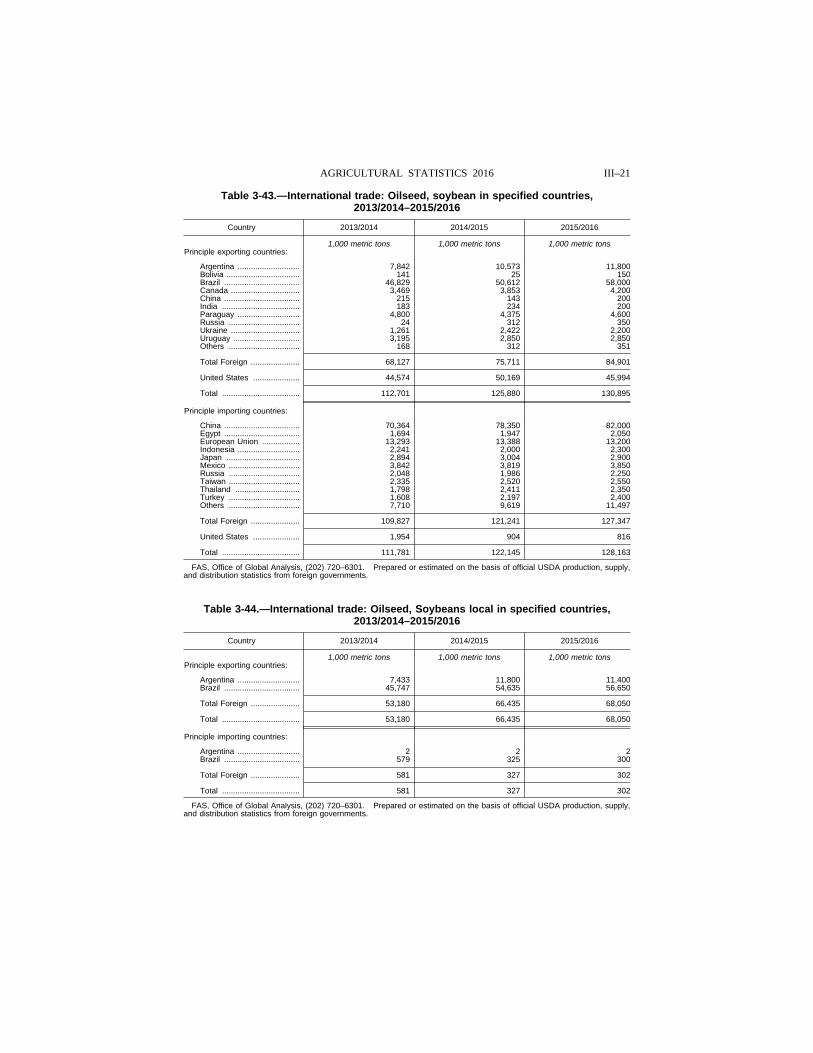
III–21 AGRICULTURAL STATISTICS 2016
Table 3-43.—International trade: Oilseed, soybean in specified countries, 2013/2014–2015/2016
Country 2013/2014 2014/2015 2015/2016
1,000 metric tons 1,000 metric tons 1,000 metric tons Principle exporting countries:
Argentina ............................ 7,842 10,573 11,800 Bolivia ................................. 141 25 150 Brazil .................................. 46,829 50,612 58,000 Canada ............................... 3,469 3,853 4,200 China .................................. 215 143 200 India ................................... 183 234 200 Paraguay ............................ 4,800 4,375 4,600 Russia ................................ 24 312 350 Ukraine ............................... 1,261 2,422 2,200 Uruguay .............................. 3,195 2,850 2,850 Others ................................ 168 312 351
Total Foreign ...................... 68,127 75,711 84,901
United States ..................... 44,574 50,169 45,994
Total ................................... 112,701 125,880 130,895
Principle importing countries:
China .................................. 70,364 78,350 82,000 Egypt .................................. 1,694 1,947 2,050 European Union ................. 13,293 13,388 13,200 Indonesia ............................ 2,241 2,000 2,300 Japan ................................. 2,894 3,004 2,900 Mexico ................................ 3,842 3,819 3,850 Russia ................................ 2,048 1,986 2,250 Taiwan ................................ 2,335 2,520 2,550 Thailand ............................. 1,798 2,411 2,350 Turkey ................................ 1,608 2,197 2,400 Others ................................ 7,710 9,619 11,497
Total Foreign ...................... 109,827 121,241 127,347
United States ..................... 1,954 904 816
Total ................................... 111,781 122,145 128,163
FAS, Office of Global Analysis, (202) 720–6301. Prepared or estimated on the basis of official USDA production, supply, and distribution statistics from foreign governments.
Table 3-44.—International trade: Oilseed, Soybeans local in specified countries, 2013/2014–2015/2016
Country 2013/2014 2014/2015 2015/2016
1,000 metric tons 1,000 metric tons 1,000 metric tons Principle exporting countries:
Argentina ............................ 7,433 11,800 11,400 Brazil .................................. 45,747 54,635 56,650
Total Foreign ...................... 53,180 66,435 68,050
Total ................................... 53,180 66,435 68,050
Principle importing countries:
Argentina ............................ 2 2 2 Brazil .................................. 579 325 300
Total Foreign ...................... 581 327 302
Total ................................... 581 327 302
FAS, Office of Global Analysis, (202) 720–6301. Prepared or estimated on the basis of official USDA production, supply, and distribution statistics from foreign governments.
III–22 OILSEEDS, FATS, AND OILS
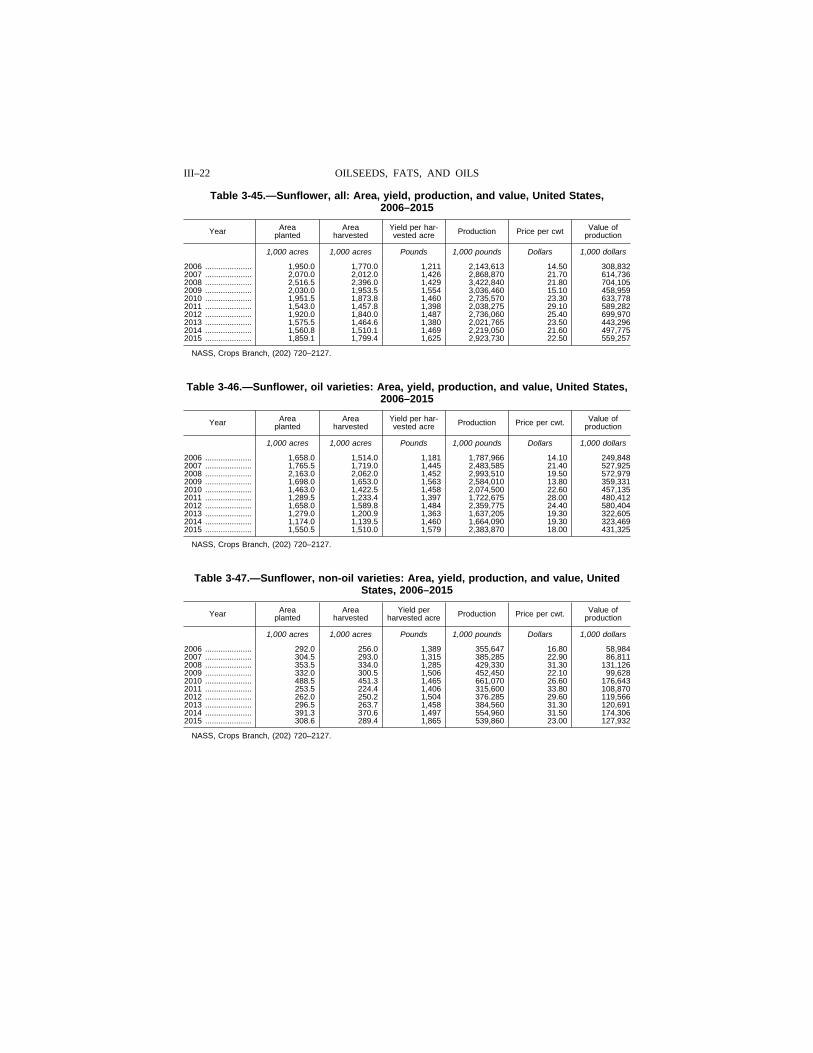
Table 3-45.—Sunflower, all: Area, yield, production, and value, United States, 2006–2015
Year Area planted
Area harvested
Yield per har-vested acre Production Price per cwt Value of
production
1,000 acres 1,000 acres Pounds 1,000 pounds Dollars 1,000 dollars
2006 ..................... 1,950.0 1,770.0 1,211 2,143,613 14.50 308,832 2007 ..................... 2,070.0 2,012.0 1,426 2,868,870 21.70 614,736 2008 ..................... 2,516.5 2,396.0 1,429 3,422,840 21.80 704,105 2009 ..................... 2,030.0 1,953.5 1,554 3,036,460 15.10 458,959 2010 ..................... 1,951.5 1,873.8 1,460 2,735,570 23.30 633,778 2011 ..................... 1,543.0 1,457.8 1,398 2,038,275 29.10 589,282 2012 ..................... 1,920.0 1,840.0 1,487 2,736,060 25.40 699,970 2013 ..................... 1,575.5 1,464.6 1,380 2,021,765 23.50 443,296 2014 ..................... 1,560.8 1,510.1 1,469 2,219,050 21.60 497,775 2015 ..................... 1,859.1 1,799.4 1,625 2,923,730 22.50 559,257
NASS, Crops Branch, (202) 720–2127.
Table 3-46.—Sunflower, oil varieties: Area, yield, production, and value, United States, 2006–2015
Year Area planted
Area harvested
Yield per har-vested acre Production Price per cwt. Value of
production
1,000 acres 1,000 acres Pounds 1,000 pounds Dollars 1,000 dollars
2006 ..................... 1,658.0 1,514.0 1,181 1,787,966 14.10 249,848 2007 ..................... 1,765.5 1,719.0 1,445 2,483,585 21.40 527,925 2008 ..................... 2,163.0 2,062.0 1,452 2,993,510 19.50 572,979 2009 ..................... 1,698.0 1,653.0 1,563 2,584,010 13.80 359,331 2010 ..................... 1,463.0 1,422.5 1,458 2,074,500 22.60 457,135 2011 ..................... 1,289.5 1,233.4 1,397 1,722,675 28.00 480,412 2012 ..................... 1,658.0 1,589.8 1,484 2,359,775 24.40 580,404 2013 ..................... 1,279.0 1,200.9 1,363 1,637,205 19.30 322,605 2014 ..................... 1,174.0 1,139.5 1,460 1,664,090 19.30 323,469 2015 ..................... 1,550.5 1,510.0 1,579 2,383,870 18.00 431,325
NASS, Crops Branch, (202) 720–2127.
Table 3-47.—Sunflower, non-oil varieties: Area, yield, production, and value, United States, 2006–2015
Year Area planted
Area harvested
Yield per harvested acre Production Price per cwt. Value of
production
1,000 acres 1,000 acres Pounds 1,000 pounds Dollars 1,000 dollars
2006 ..................... 292.0 256.0 1,389 355,647 16.80 58,984 2007 ..................... 304.5 293.0 1,315 385,285 22.90 86,811 2008 ..................... 353.5 334.0 1,285 429,330 31.30 131,126 2009 ..................... 332.0 300.5 1,506 452,450 22.10 99,628 2010 ..................... 488.5 451.3 1,465 661,070 26.60 176,643 2011 ..................... 253.5 224.4 1,406 315,600 33.80 108,870 2012 ..................... 262.0 250.2 1,504 376.285 29.60 119,566 2013 ..................... 296.5 263.7 1,458 384,560 31.30 120,691 2014 ..................... 391.3 370.6 1,497 554,960 31.50 174,306 2015 ..................... 308.6 289.4 1,865 539,860 23.00 127,932
NASS, Crops Branch, (202) 720–2127.
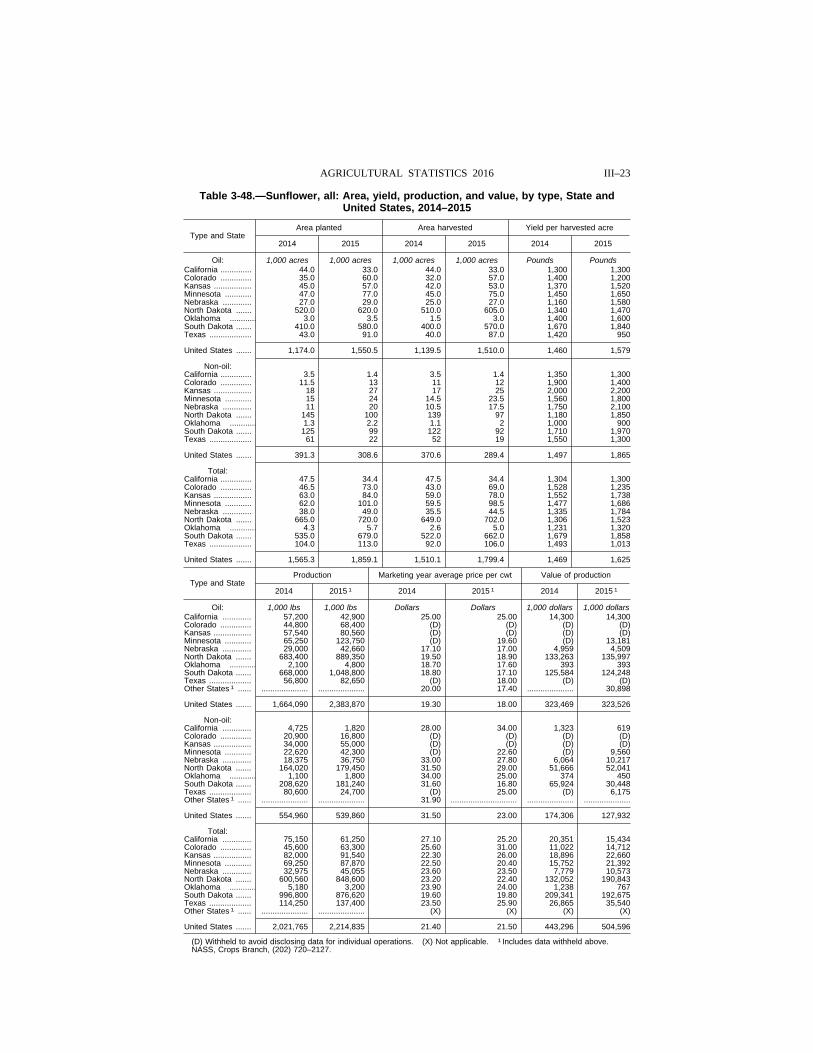
III–23 AGRICULTURAL STATISTICS 2016
Table 3-48.—Sunflower, all: Area, yield, production, and value, by type, State and United States, 2014–2015
Type and State Area planted Area harvested Yield per harvested acre
2014 2015 2014 2015 2014 2015
Oil: 1,000 acres 1,000 acres 1,000 acres 1,000 acres Pounds Pounds California .............. 44.0 33.0 44.0 33.0 1,300 1,300 Colorado .............. 35.0 60.0 32.0 57.0 1,400 1,200 Kansas ................. 45.0 57.0 42.0 53.0 1,370 1,520 Minnesota ............ 47.0 77.0 45.0 75.0 1,450 1,650 Nebraska ............. 27.0 29.0 25.0 27.0 1,160 1,580 North Dakota ....... 520.0 620.0 510.0 605.0 1,340 1,470 Oklahoma ............ 3.0 3.5 1.5 3.0 1,400 1,600 South Dakota ....... 410.0 580.0 400.0 570.0 1,670 1,840 Texas ................... 43.0 91.0 40.0 87.0 1,420 950
United States ....... 1,174.0 1,550.5 1,139.5 1,510.0 1,460 1,579
Non-oil: California .............. 3.5 1.4 3.5 1.4 1,350 1,300 Colorado .............. 11.5 13 11 12 1,900 1,400 Kansas ................. 18 27 17 25 2,000 2,200 Minnesota ............ 15 24 14.5 23.5 1,560 1,800 Nebraska ............. 11 20 10.5 17.5 1,750 2,100 North Dakota ....... 145 100 139 97 1,180 1,850 Oklahoma ............ 1.3 2.2 1.1 2 1,000 900 South Dakota ....... 125 99 122 92 1,710 1,970 Texas ................... 61 22 52 19 1,550 1,300
United States ....... 391.3 308.6 370.6 289.4 1,497 1,865
Total: California .............. 47.5 34.4 47.5 34.4 1,304 1,300 Colorado .............. 46.5 73.0 43.0 69.0 1,528 1,235 Kansas ................. 63.0 84.0 59.0 78.0 1,552 1,738 Minnesota ............ 62.0 101.0 59.5 98.5 1,477 1,686 Nebraska ............. 38.0 49.0 35.5 44.5 1,335 1,784 North Dakota ....... 665.0 720.0 649.0 702.0 1,306 1,523 Oklahoma ............ 4.3 5.7 2.6 5.0 1,231 1,320 South Dakota ....... 535.0 679.0 522.0 662.0 1,679 1,858 Texas ................... 104.0 113.0 92.0 106.0 1,493 1,013
United States ....... 1,565.3 1,859.1 1,510.1 1,799.4 1,469 1,625
Type and State Production Marketing year average price per cwt Value of production
2014 2015 1 2014 2015 1 2014 2015 1
Oil: 1,000 lbs 1,000 lbs Dollars Dollars 1,000 dollars 1,000 dollars California ............. 57,200 42,900 25.00 25.00 14,300 14,300 Colorado .............. 44,800 68,400 (D) (D) (D) (D) Kansas ................. 57,540 80,560 (D) (D) (D) (D) Minnesota ............ 65,250 123,750 (D) 19.60 (D) 13,181 Nebraska ............. 29,000 42,660 17.10 17.00 4,959 4,509 North Dakota ....... 683,400 889,350 19.50 18.90 133,263 135,997 Oklahoma ............ 2,100 4,800 18.70 17.60 393 393 South Dakota ....... 668,000 1,048,800 18.80 17.10 125,584 124,248 Texas ................... 56,800 82,650 (D) 18.00 (D) (D) Other States 1 ...... ..................... ..................... 20.00 17.40 ..................... 30,898
United States ....... 1,664,090 2,383,870 19.30 18.00 323,469 323,526
Non-oil: California ............. 4,725 1,820 28.00 34.00 1,323 619 Colorado .............. 20,900 16,800 (D) (D) (D) (D) Kansas ................. 34,000 55,000 (D) (D) (D) (D) Minnesota ............ 22,620 42,300 (D) 22.60 (D) 9,560 Nebraska ............. 18,375 36,750 33.00 27.80 6,064 10,217 North Dakota ....... 164,020 179,450 31.50 29.00 51,666 52,041 Oklahoma ............ 1,100 1,800 34.00 25.00 374 450 South Dakota ....... 208,620 181,240 31.60 16.80 65,924 30,448 Texas ................... 80,600 24,700 (D) 25.00 (D) 6,175 Other States 1 ...... ..................... ..................... 31.90 .............................. ..................... .....................
United States ....... 554,960 539,860 31.50 23.00 174,306 127,932
Total: California ............. 75,150 61,250 27.10 25.20 20,351 15,434 Colorado .............. 45,600 63,300 25.60 31.00 11,022 14,712 Kansas ................. 82,000 91,540 22.30 26.00 18,896 22,660 Minnesota ............ 69,250 87,870 22.50 20.40 15,752 21,392 Nebraska ............. 32,975 45,055 23.60 23.50 7,779 10,573 North Dakota ....... 600,560 848,600 23.20 22.40 132,052 190,843 Oklahoma ............ 5,180 3,200 23.90 24.00 1,238 767 South Dakota ....... 996,800 876,620 19.60 19.80 209,341 192,675 Texas ................... 114,250 137,400 23.50 25.90 26,865 35,540 Other States 1 ...... ..................... ..................... (X) (X) (X) (X)
United States ....... 2,021,765 2,214,835 21.40 21.50 443,296 504,596
(D) Withheld to avoid disclosing data for individual operations. (X) Not applicable. 1 Includes data withheld above. NASS, Crops Branch, (202) 720–2127.
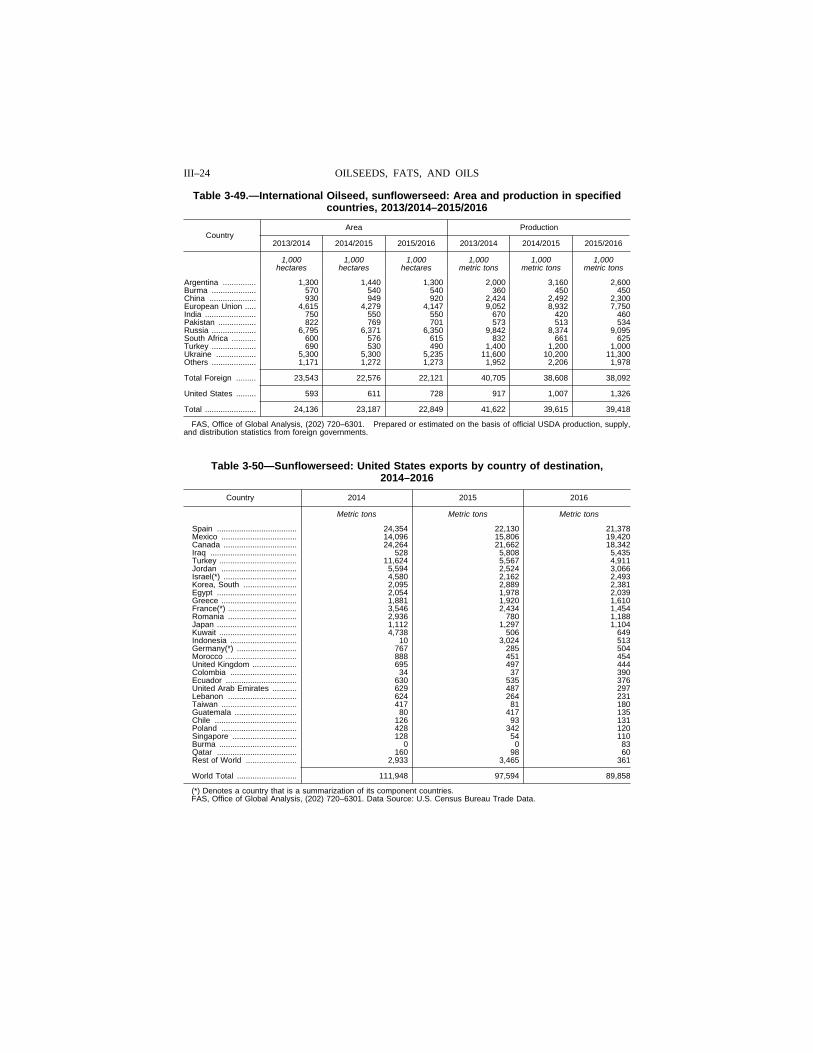
III–24 OILSEEDS, FATS, AND OILS
Table 3-49.—International Oilseed, sunflowerseed: Area and production in specified countries, 2013/2014–2015/2016
Country Area Production
2013/2014 2014/2015 2015/2016 2013/2014 2014/2015 2015/2016
1,000 hectares
1,000 hectares
1,000 hectares
1,000 metric tons
1,000 metric tons
1,000 metric tons
Argentina ............... 1,300 1,440 1,300 2,000 3,160 2,600 Burma .................... 570 540 540 360 450 450 China ..................... 930 949 920 2,424 2,492 2,300 European Union ..... 4,615 4,279 4,147 9,052 8,932 7,750 India ....................... 750 550 550 670 420 460 Pakistan ................. 822 769 701 573 513 534 Russia .................... 6,795 6,371 6,350 9,842 8,374 9,095 South Africa ........... 600 576 615 832 661 625 Turkey .................... 690 530 490 1,400 1,200 1,000 Ukraine .................. 5,300 5,300 5,235 11,600 10,200 11,300 Others .................... 1,171 1,272 1,273 1,952 2,206 1,978
Total Foreign ......... 23,543 22,576 22,121 40,705 38,608 38,092
United States ......... 593 611 728 917 1,007 1,326
Total ....................... 24,136 23,187 22,849 41,622 39,615 39,418
FAS, Office of Global Analysis, (202) 720–6301. Prepared or estimated on the basis of official USDA production, supply, and distribution statistics from foreign governments.
Table 3-50—Sunflowerseed: United States exports by country of destination, 2014–2016
Country 2014 2015 2016
Metric tons Metric tons Metric tons
Spain .................................... 24,354 22,130 21,378 Mexico .................................. 14,096 15,806 19,420 Canada ................................. 24,264 21,662 18,342 Iraq ....................................... 528 5,808 5,435 Turkey ................................... 11,624 5,567 4,911 Jordan .................................. 5,594 2,524 3,066 Israel(*) ................................. 4,580 2,162 2,493 Korea, South ........................ 2,095 2,889 2,381 Egypt .................................... 2,054 1,978 2,039 Greece .................................. 1,881 1,920 1,610 France(*) ............................... 3,546 2,434 1,454 Romania ............................... 2,936 780 1,188 Japan .................................... 1,112 1,297 1,104 Kuwait ................................... 4,738 506 649 Indonesia .............................. 10 3,024 513 Germany(*) ........................... 767 285 504 Morocco ................................ 888 451 454 United Kingdom .................... 695 497 444 Colombia .............................. 34 37 390 Ecuador ................................ 630 535 376 United Arab Emirates ........... 629 487 297 Lebanon ............................... 624 264 231 Taiwan .................................. 417 81 180 Guatemala ............................ 80 417 135 Chile ..................................... 126 93 131 Poland .................................. 428 342 120 Singapore ............................. 128 54 110 Burma ................................... 0 0 83 Qatar .................................... 160 98 60 Rest of World ....................... 2,933 3,465 361
World Total ........................... 111,948 97,594 89,858
(*) Denotes a country that is a summarization of its component countries. FAS, Office of Global Analysis, (202) 720–6301. Data Source: U.S. Census Bureau Trade Data.
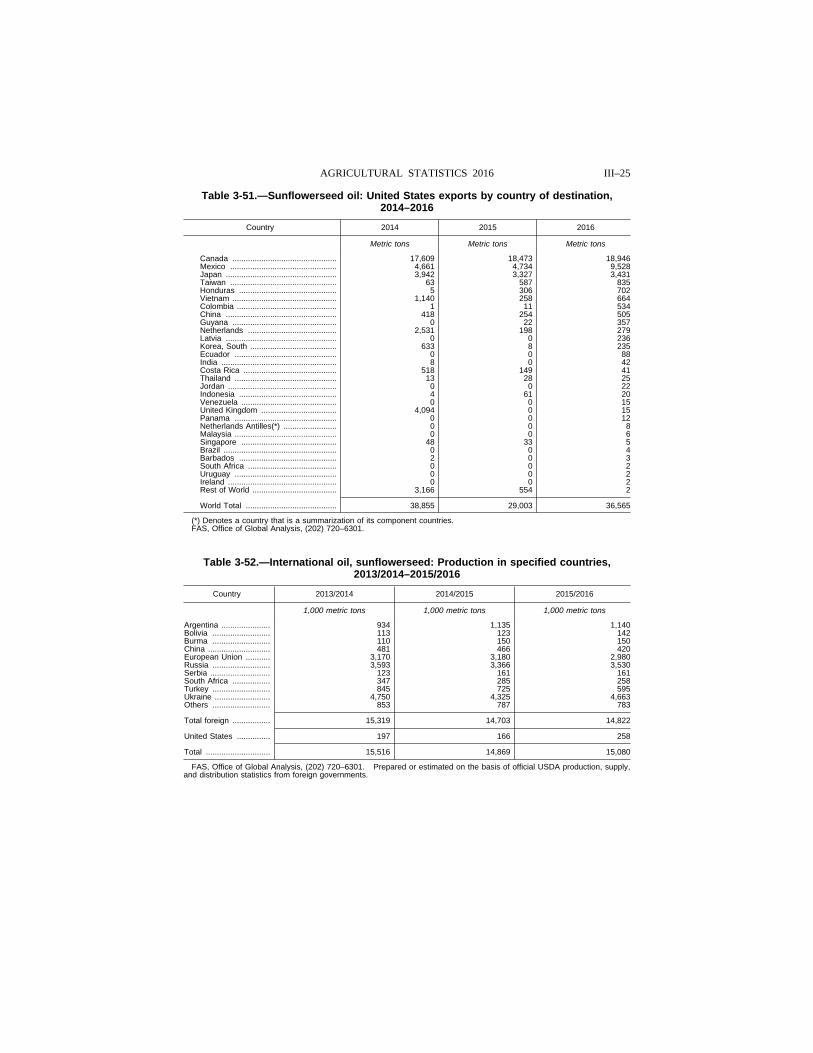
III–25 AGRICULTURAL STATISTICS 2016
Table 3-51.—Sunflowerseed oil: United States exports by country of destination, 2014–2016
Country 2014 2015 2016
Metric tons Metric tons Metric tons
Canada ............................................... 17,609 18,473 18,946 Mexico ................................................ 4,661 4,734 9,528 Japan .................................................. 3,942 3,327 3,431 Taiwan ................................................ 63 587 835 Honduras ............................................ 5 306 702 Vietnam ............................................... 1,140 258 664 Colombia ............................................. 1 11 534 China .................................................. 418 254 505 Guyana ............................................... 0 22 357 Netherlands ........................................ 2,531 198 279 Latvia .................................................. 0 0 236 Korea, South ....................................... 633 8 235 Ecuador .............................................. 0 0 88 India .................................................... 8 0 42 Costa Rica .......................................... 518 149 41 Thailand .............................................. 13 28 25 Jordan ................................................. 0 0 22 Indonesia ............................................ 4 61 20 Venezuela ........................................... 0 0 15 United Kingdom .................................. 4,094 0 15 Panama .............................................. 0 0 12 Netherlands Antilles(*) ........................ 0 0 8 Malaysia .............................................. 0 0 6 Singapore ........................................... 48 33 5 Brazil ................................................... 0 0 4 Barbados ............................................ 2 0 3 South Africa ........................................ 0 0 2 Uruguay .............................................. 0 0 2 Ireland ................................................. 0 0 2 Rest of World ...................................... 3,166 554 2
World Total ......................................... 38,855 29,003 36,565
(*) Denotes a country that is a summarization of its component countries. FAS, Office of Global Analysis, (202) 720–6301.
Table 3-52.—International oil, sunflowerseed: Production in specified countries, 2013/2014–2015/2016
Country 2013/2014 2014/2015 2015/2016
1,000 metric tons 1,000 metric tons 1,000 metric tons
Argentina ...................... 934 1,135 1,140 Bolivia .......................... 113 123 142 Burma .......................... 110 150 150 China ............................ 481 466 420 European Union ........... 3,170 3,180 2,980 Russia .......................... 3,593 3,366 3,530 Serbia ........................... 123 161 161 South Africa ................. 347 285 258 Turkey .......................... 845 725 595 Ukraine ......................... 4,750 4,325 4,663 Others .......................... 853 787 783
Total foreign ................. 15,319 14,703 14,822
United States ............... 197 166 258
Total ............................. 15,516 14,869 15,080
FAS, Office of Global Analysis, (202) 720–6301. Prepared or estimated on the basis of official USDA production, supply, and distribution statistics from foreign governments.
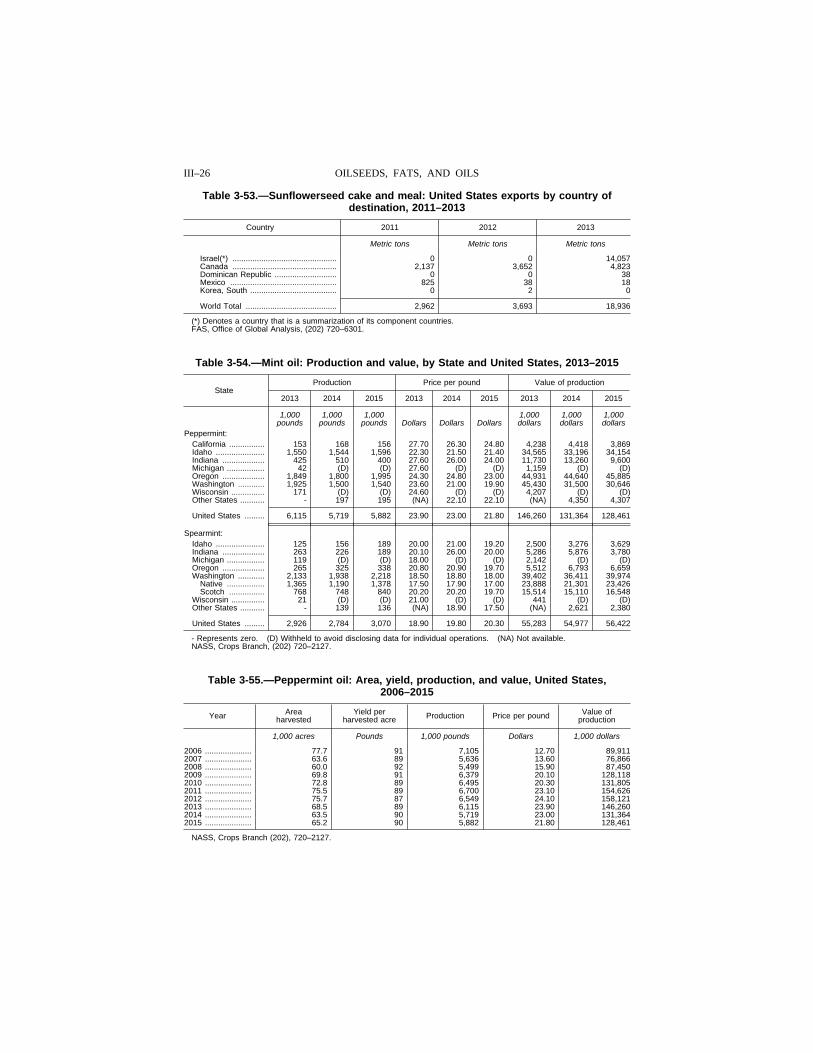
III–26 OILSEEDS, FATS, AND OILS
Table 3-53.—Sunflowerseed cake and meal: United States exports by country of destination, 2011–2013
Country 2011 2012 2013
Metric tons Metric tons Metric tons
Israel(*) ............................................... 0 0 14,057 Canada ............................................... 2,137 3,652 4,823 Dominican Republic ............................ 0 0 38 Mexico ................................................ 825 38 18 Korea, South ....................................... 0 2 0
World Total ......................................... 2,962 3,693 18,936
(*) Denotes a country that is a summarization of its component countries. FAS, Office of Global Analysis, (202) 720–6301.
Table 3-54.—Mint oil: Production and value, by State and United States, 2013–2015
State Production Price per pound Value of production
2013 2014 2015 2013 2014 2015 2013 2014 2015
1,000 1,000 1,000 1,000 1,000 1,000 pounds pounds pounds Dollars Dollars Dollars dollars dollars dollars
Peppermint: California ................ 153 168 156 27.70 26.30 24.80 4,238 4,418 3,869 Idaho ...................... 1,550 1,544 1,596 22.30 21.50 21.40 34,565 33,196 34,154 Indiana ................... 425 510 400 27.60 26.00 24.00 11,730 13,260 9,600 Michigan ................. 42 (D) (D) 27.60 (D) (D) 1,159 (D) (D) Oregon ................... 1,849 1,800 1,995 24.30 24.80 23.00 44,931 44,640 45,885 Washington ............ 1,925 1,500 1,540 23.60 21.00 19.90 45,430 31,500 30,646 Wisconsin ............... 171 (D) (D) 24.60 (D) (D) 4,207 (D) (D) Other States ........... - 197 195 (NA) 22.10 22.10 (NA) 4,350 4,307
United States ......... 6,115 5,719 5,882 23.90 23.00 21.80 146,260 131,364 128,461
Spearmint: Idaho ...................... 125 156 189 20.00 21.00 19.20 2,500 3,276 3,629 Indiana ................... 263 226 189 20.10 26.00 20.00 5,286 5,876 3,780 Michigan ................. 119 (D) (D) 18.00 (D) (D) 2,142 (D) (D) Oregon ................... 265 325 338 20.80 20.90 19.70 5,512 6,793 6,659 Washington ............ 2,133 1,938 2,218 18.50 18.80 18.00 39,402 36,411 39,974
Native ................. 1,365 1,190 1,378 17.50 17.90 17.00 23,888 21,301 23,426 Scotch ................ 768 748 840 20.20 20.20 19.70 15,514 15,110 16,548
Wisconsin ............... 21 (D) (D) 21.00 (D) (D) 441 (D) (D) Other States ........... - 139 136 (NA) 18.90 17.50 (NA) 2,621 2,380
United States ......... 2,926 2,784 3,070 18.90 19.80 20.30 55,283 54,977 56,422
- Represents zero. (D) Withheld to avoid disclosing data for individual operations. (NA) Not available. NASS, Crops Branch, (202) 720–2127.
Table 3-55.—Peppermint oil: Area, yield, production, and value, United States, 2006–2015
Year Area harvested
Yield per harvested acre Production Price per pound Value of
production
1,000 acres Pounds 1,000 pounds Dollars 1,000 dollars
2006 ..................... 77.7 91 7,105 12.70 89,911 2007 ..................... 63.6 89 5,636 13.60 76,866 2008 ..................... 60.0 92 5,499 15.90 87,450 2009 ..................... 69.8 91 6,379 20.10 128,118 2010 ..................... 72.8 89 6,495 20.30 131,805 2011 ..................... 75.5 89 6,700 23.10 154,626 2012 ..................... 75.7 87 6,549 24.10 158,121 2013 ..................... 68.5 89 6,115 23.90 146,260 2014 ..................... 63.5 90 5,719 23.00 131,364 2015 ..................... 65.2 90 5,882 21.80 128,461
NASS, Crops Branch (202), 720–2127.
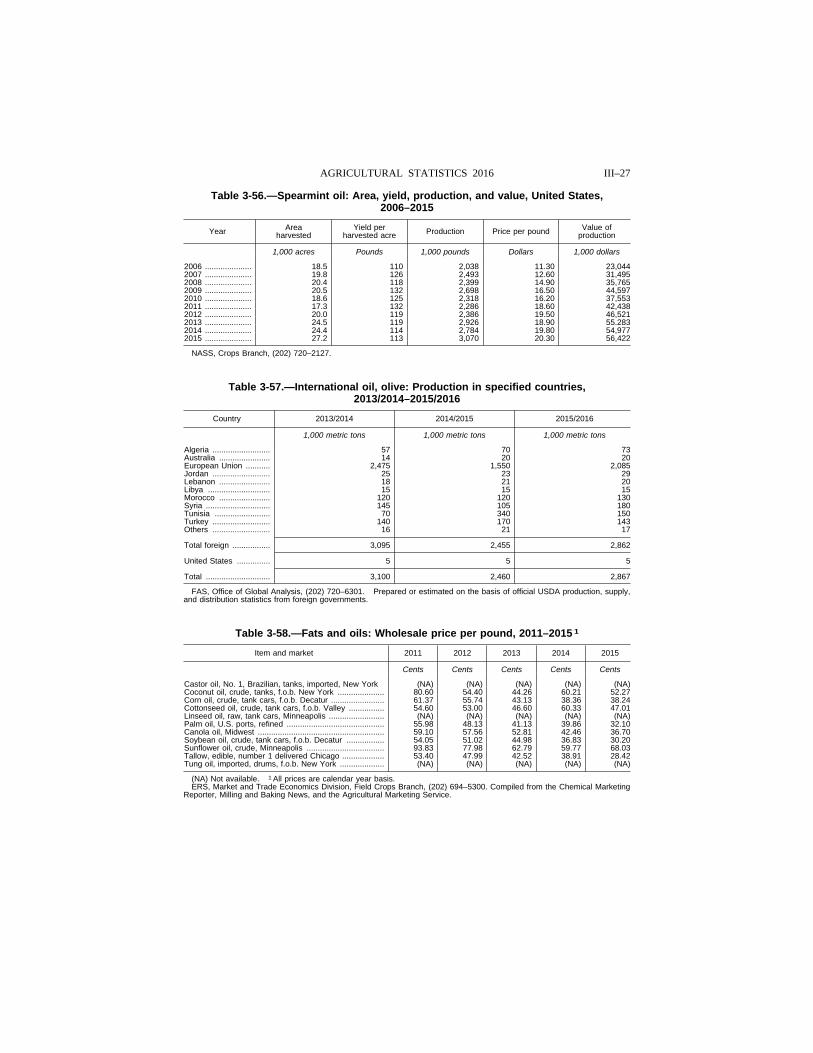
III–27 AGRICULTURAL STATISTICS 2016
Table 3-56.—Spearmint oil: Area, yield, production, and value, United States, 2006–2015
Year Area harvested
Yield per harvested acre Production Price per pound Value of
production
1,000 acres Pounds 1,000 pounds Dollars 1,000 dollars
2006 ..................... 18.5 110 2,038 11.30 23,044 2007 ..................... 19.8 126 2,493 12.60 31,495 2008 ..................... 20.4 118 2,399 14.90 35,765 2009 ..................... 20.5 132 2,698 16.50 44,597 2010 ..................... 18.6 125 2,318 16.20 37,553 2011 ..................... 17.3 132 2,286 18.60 42,438 2012 ..................... 20.0 119 2,386 19.50 46,521 2013 ..................... 24.5 119 2,926 18.90 55.283 2014 ..................... 24.4 114 2,784 19.80 54,977 2015 ..................... 27.2 113 3,070 20.30 56,422
NASS, Crops Branch, (202) 720–2127.
Table 3-57.—International oil, olive: Production in specified countries, 2013/2014–2015/2016
Country 2013/2014 2014/2015 2015/2016
1,000 metric tons 1,000 metric tons 1,000 metric tons
Algeria .......................... 57 70 73 Australia ....................... 14 20 20 European Union ........... 2,475 1,550 2,085 Jordan .......................... 25 23 29 Lebanon ....................... 18 21 20 Libya ............................ 15 15 15 Morocco ....................... 120 120 130 Syria ............................. 145 105 180 Tunisia ......................... 70 340 150 Turkey .......................... 140 170 143 Others .......................... 16 21 17
Total foreign ................. 3,095 2,455 2,862
United States ............... 5 5 5
Total ............................. 3,100 2,460 2,867
FAS, Office of Global Analysis, (202) 720–6301. Prepared or estimated on the basis of official USDA production, supply, and distribution statistics from foreign governments.
Table 3-58.—Fats and oils: Wholesale price per pound, 2011–2015 1
Item and market 2011 2012 2013 2014 2015
Cents Cents Cents Cents Cents
Castor oil, No. 1, Brazilian, tanks, imported, New York (NA) (NA) (NA) (NA) (NA) Coconut oil, crude, tanks, f.o.b. New York ..................... 80.60 54.40 44.26 60.21 52.27 Corn oil, crude, tank cars, f.o.b. Decatur ........................ 61.37 55.74 43.13 38.36 38.24 Cottonseed oil, crude, tank cars, f.o.b. Valley ................ 54.60 53.00 46.60 60.33 47.01 Linseed oil, raw, tank cars, Minneapolis ......................... (NA) (NA) (NA) (NA) (NA) Palm oil, U.S. ports, refined ............................................ 55.98 48.13 41.13 39.86 32.10 Canola oil, Midwest ......................................................... 59.10 57.56 52.81 42.46 36.70 Soybean oil, crude, tank cars, f.o.b. Decatur ................. 54.05 51.02 44.98 36.83 30.20 Sunflower oil, crude, Minneapolis ................................... 93.83 77.98 62.79 59.77 68.03 Tallow, edible, number 1 delivered Chicago ................... 53.40 47.99 42.52 38.91 28.42 Tung oil, imported, drums, f.o.b. New York .................... (NA) (NA) (NA) (NA) (NA)
(NA) Not available. 1 All prices are calendar year basis. ERS, Market and Trade Economics Division, Field Crops Branch, (202) 694–5300. Compiled from the Chemical Marketing
Reporter, Milling and Baking News, and the Agricultural Marketing Service.