Embed Size (px)
Citation preview

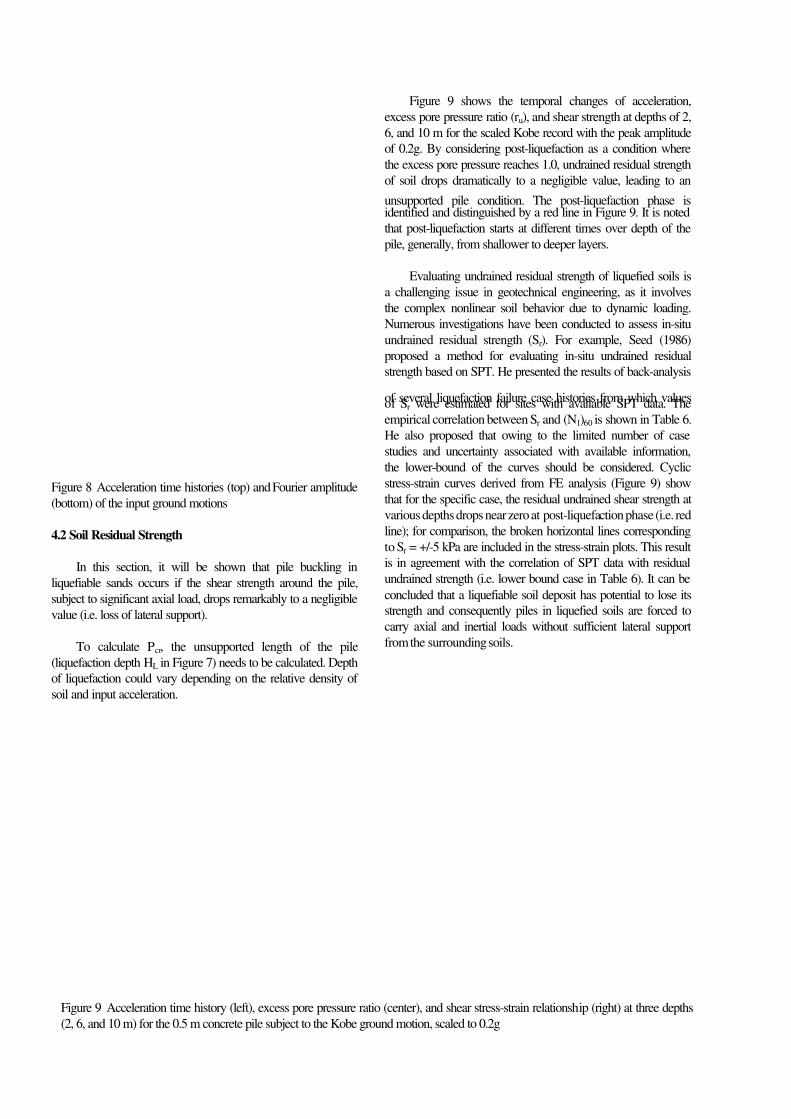
1
Statistics on Work-Related Musculoskeletal Disorders
2016

2
Disclaimer
The information provided in this document can only assist you in the most general way. This document does not replace any statutory requirements under any relevant jurisdictional legislation. Safe Work Australia is not liable for any loss resulting from any action taken or reliance made by you on the information or material contained in this document. Before relying on the material, users should carefully make their own assessment as to its accuracy, currency, completeness and relevance for their purposes, and should obtain any appropriate professional advice relevant to their particular circumstances.
To the extent that the material on this document includes views or recommendations of third parties, such views or recommendations do not necessarily reflect the views of Safe Work Australia or indicate its commitment to a particular course of action.
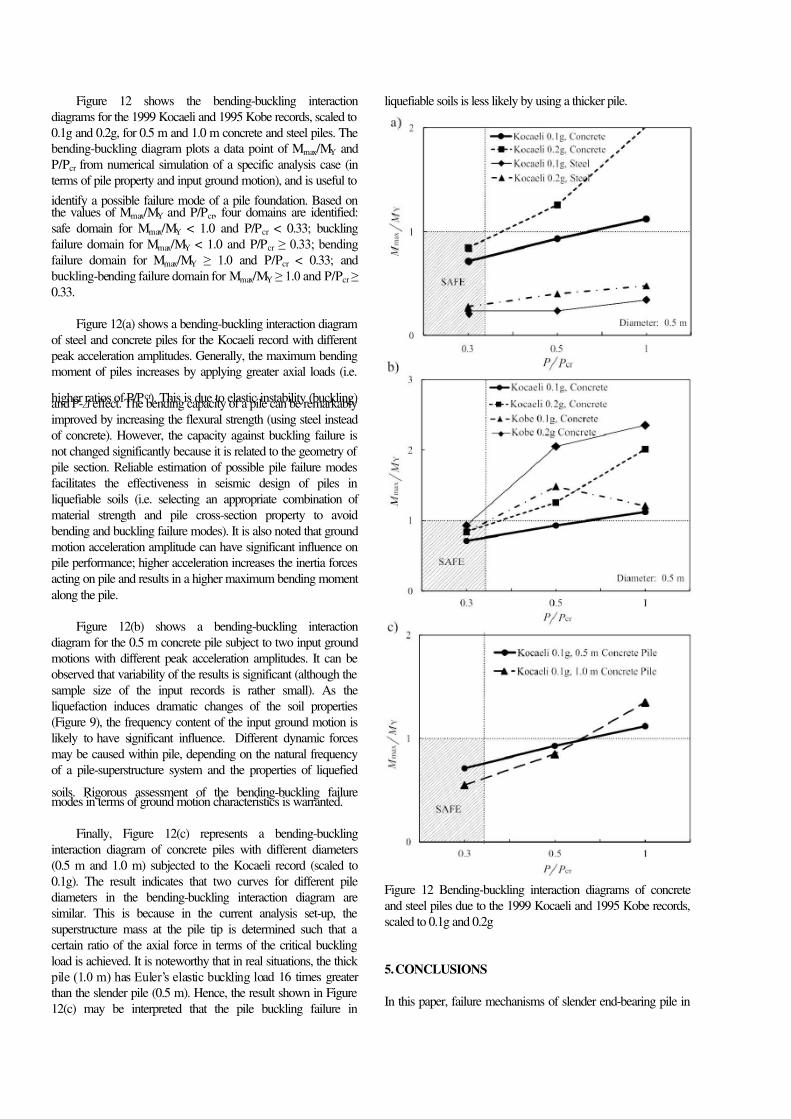
Creative Commons
ISBN: 978-1-76028-825-9 (online pdf) ISBN: 978-1-76028-826-6 (online docx)
With the exception of the Safe Work Australia logo and the cover image, this report is licensed by Safe Work Australia under a Creative Commons 3.0 Australia Licence. To view a copy of this licence, visit http://creativecommons.org/licenses/by/3.0/au/deed.en
In essence, you are free to copy, communicate and adapt the work, as long as you attribute the work to Safe Work Australia and abide by the other licensing terms.
Enquiries regarding the licence and any use of the report are welcome at:
Copyright Officer Stakeholder Engagement Safe Work Australia GPO Box 641 Canberra ACT 2601
Email: [email protected]

3
ContentsIntroduction .....................................................................................................................4
Source of data ..................................................................................................................... 4Scope of MSDs ................................................................................................................... 4
Workers’ compensation data .........................................................................................5Types of work-related MSDs ............................................................................................... 5Magnitude of MSDs over time ............................................................................................. 5Trends in frequency rates of MSDs ..................................................................................... 6Sex and age group .............................................................................................................. 7Occupation .......................................................................................................................... 7Occupation and breakdown agency of MSDs ..................................................................... 8Occupation and mechanism of MSDs ................................................................................. 9Industry ............................................................................................................................. 10Bodily location of MSDs .....................................................................................................11
Further information ......................................................................................................12Explanatory notes ............................................................................................................. 12References ........................................................................................................................ 12

4
IntroductionMusculoskeletal disorders (MSDs) are a range of conditions that affect joints (arthropathies), spinal vertebrae and intervertebral discs (dorsopathies), the synovium, muscles, tendons and related tissues, soft tissues, and connective tissues. MSDs were identified as priority disorders in the Australian Work Health and Safety Strategy 2012–2022 (the Australian Strategy), which was developed through consultation with governments, industry, unions and the public. Priority disorders were based on the severity of consequences for workers, the number of workers estimated to be affected or the existence of known prevention options. The other priority disorders in the Australian Strategy are mental disorders, cancers (including skin cancer), asthma, contact dermatitis and noise-induced hearing loss.
The aim of the Australian Strategy is to focus attention on priority areas so that causes of workplace injuries, diseases and fatalities can be identified and minimised through appropriate prevention strategies. The statistics in this report highlight the characteristics of work-related MSDs, including their causes and the groups of workers who are at elevated risk of MSDs.
Source of dataThe statistics in this report come from Safe Work Australia’s National Data Set for Compensation-Based Statistics (NDS). The NDS is a collection of workers’ compensation statistics from each Australian jurisdiction. The primary strength of NDS data is that all cases are work-related and the information that is recorded allows detailed analyses to be undertaken on the circumstances surrounding work-related injuries and diseases. The data also provide a measurable means of comparing the risks faced by different groups of employees and assessing changes in risks over time. Below are the primary limitations of the NDS data in this report:
• Only serious claims are presented. A serious claim is an accepted workers’ compensation claim that involves one or more weeks away from work and excludes all fatalities, and all injuries experienced while travelling to or from work or while on a break away from the workplace.
• Work-related injuries and diseases of self-employed workers are under-represented because workers’ compensation schemes do not generally cover self-employed workers. Around 10 per cent of Australian workers are self-employed.
• Some workers who are eligible for workers’ compensation do not lodge a claim after a work-related injury or disease.
• Diseases are under-represented because many diseases result from long-term exposure to agents or have long latency periods and this makes the link between the work-related disease and the workplace difficult to establish.
• NDS data for 2013–14 are preliminary (denoted by ‘p’ in tables and figures) and are subject to revision.
Scope of MSDsIn the NDS, information regarding the injury or diseases is coded using the third edition of the Type of Occurrence Classification System (TOOCS). Cases of MSDs were identified using the TOOCS codes that are used to record the nature of an employee’s injury or disease. The table below shows the injuries and diseases that comprise MSDs.
Table 1: Injuries and diseases in the TOOCS that comprise MSDs
Nature of injury or disease Included conditions
Traumatic joint/ligament and muscle/tendon injury (referred to as "MSD injuries" in this report)
Residual soft tissue disorders due to traumaTrauma to joints and ligamentsTrauma to muscles and tendons
Musculoskeletal and connective tissue diseases (referred to as "MSD diseases" in this report)
Diseases involving the synovium and related tissueDiseases of the muscle, tendon and related tissueJoint diseases (arthropathies) and other articular cartilage diseasesSpinal vertebrae and intervertebral disc diseases (dorsopathies)

5
Workers’ compensation dataTypes of work-related MSDsOver the five-year period between 2009–10 and 2013–14, there were 360 180 serious MSD claims, which equates to 60 per cent of all serious claims for the period. Injuries accounted for 76 per cent of MSD claims, while diseases accounted for 24 per cent. Common types of MSD injuries were soft tissue disorders (29 per cent), trauma to muscles or tendons (21 per cent), and trauma to joints or ligaments (14 per cent).
Table 2: Serious MSD claims by nature of injury or disease, 2009–10 to 2013–14p combined
Nature of MSD Number PercentageMSD injuries
Soft tissue disorders due to trauma or unknown mechanisms 102 850 28.6%Trauma to muscles and tendons 74 170 20.6%Trauma to joints and ligaments 50 770 14.1%Trauma to muscles 24 685 6.9%Dislocation 9 335 2.6%Total: MSD injuries 272 840 75.8%
MSD diseasesBack pain, lumbago, and sciatica 23 065 6.4%Tendinitis 11 810 3.3%Disc displacement, prolapse, degeneration or hernia 11 140 3.1%Muscle or tendon strain (non-traumatic) 10 680 3.0%Occupational overuse syndrome 4 700 1.3%Bursitis 4 465 1.2%Epicondylitis 3 765 1.0%Total: MSD diseases 87 340 24.2%
Total: MSD injuries and diseases 360 180 100.0%
Magnitude of MSDs over timeOver the 14-year period between 2000–01 and 2013–14, the percentage of serious claims that involved MSDs remained stable at between 59 and 61 per cent.
Figure 1: Percentage of serious claims that involved MSDs, 2000–01 to 2013–14p
0%
10%
20%
30%
40%
50%
60%
70%
Per
cent
age
of s
erio
us c
laim
s th
at in
volv
ed M
SD
s
6
Trends in frequency rates of MSDsBetween 2000–01 and 2012–13, the frequency rate of serious MSD claims declined by 31 per cent from 5.7 claims per million hours worked to 4.0. Over the same period, the frequency rate for all serious claims also declined by 31 per cent. Data for 2013–14 are preliminary and are excluded when calculating the percentage change over time. Figure 2 shows that the trend for serious MSD claims mirrored the trend for all serious claims. This is unsurprising because the majority of serious claims over the period (between 59 and 61 per cent) involved MSDs.
Figure 2: Frequency rates of serious MSD claims and all serious claims, 2000–01 to 2013–14p
Trends in time lost from work and amounts of compensationBetween 2000–01 and 2012–13, the median time lost from work for serious MSD claims increased by 35 per cent from 4.3 working weeks to 5.8. Over the same period, the median time lost for all serious claims increased by 29 per cent. The median amount of compensation for serious MSD claims increased by 59 per cent from $5 600 in 2000–01 to $8 900 in 2012–13. Over the same period, the median amount of compensation for all serious claims increased by 71 per cent. Data for 2013–14 are preliminary and are excluded when reporting time lost from work or compensation paid.
Figure 3: Median time lost from work and median compensation paid for serious MSD claims, 2000–01 to 2012–13
0.0
1.0
2.0
3.0
4.0
5.0
6.0
7.0
8.0
9.0
10.0
Serio
us c
laim
s pe
r milli
on h
ours
wor
ked
Serious MSD claims per million hours worked
Serious claims per million hours worked
0.0
1.0
2.0
3.0
4.0
5.0
6.0
7.0
$0
$2 000
$4 000
$6 000
$8 000
$10 000
$12 000
Med
ian
time
lost
from
wor
k (w
orki
ng w
eeks
)
Med
ian
com
pens
atio
n pa
id
Median compensation paid (left axis)
Median time lost from work (right axis)

7
Sex and age groupBetween 2009–10 and 2013–14, the frequency rate of serious MSD claims was 4.2 claims per million hours worked. There were no notable differences in the frequency rates of female and male employees (4.0 for female employees versus 4.3 for male employees). However, there were notable differences in the frequency rates of different age groups. Table 3 shows that younger employees had lower frequency rates than older employees and this was true for both female and male employees. Frequency rates of serious MSD claims generally increased as age group increased.
Table 3: Frequency rates of serious MSD claims by age group and sex, 2009–10 to 2013–14p combined
Age groupSerious MSD claims per million hours worked
Female Male All employees15–19 years 2.4 3.3 2.920–24 years 2.5 3.6 3.125–29 years 2.3 3.4 2.930–34 years 2.9 3.7 3.435–39 years 3.7 4.2 4.040–44 years 4.7 4.6 4.645–49 years 5.4 4.8 5.150–54 years 5.8 4.9 5.355–59 years 5.4 5.0 5.260–64 years 5.2 5.4 5.4Total 4.0 4.3 4.2
OccupationBetween 2009–10 and 2013–14, labourers accounted for the highest percentage (24 per cent) of serious MSD claims and the occupation also had the highest frequency rate (11.3 claims per million hours worked), which was almost three times higher than the rate for all employees (4.2). Other major occupations that had high frequency rates were community and personal service workers (9.5), and machinery operators and drivers (8.4).
Among community and personal service workers, some subgroups had frequency rates that were more than three times higher than the rate for all employees (4.2). They include health and welfare support workers (15.8), defence force members, fire fighters and police (15.0), and personal carers and assistants (14.7).
Table 4: Serious MSD claims by occupation, 2009–10 to 2013–14p combined
Occupation Number of claims
Percentage of claims
Number of claims per
million hours worked
Labourers 85 750 23.8% 11.3Food process workers 6 180 7.2% 12.0Cleaners and laundry workers 15 115 17.6% 10.5Farm, forestry and garden workers 7 150 8.3% 9.6Construction and mining labourers 10 875 12.7% 8.3Food preparation assistants 5 175 6.0% 6.1
Community and personal service workers 66 480 18.5% 9.5Health and welfare support workers 13 225 19.9% 15.8Defence force members, fire fighters and police 8 805 13.2% 15.0Personal carers and assistants 22 815 34.3% 14.7Prison and security officers 5 390 8.1% 9.1
8
Occupation Number of claims
Percentage of claims
Number of claims per
million hours worked
Hospitality workers 5 405 8.1% 3.7Machinery operators and drivers 56 920 15.8% 8.4
Storepersons 11 440 20.1% 11.1Machine operators 5 505 9.7% 10.5Truck drivers 17 970 31.6% 10.3Mobile plant operators 8 170 14.4% 6.1Stationary plant operators 5 935 10.4% 5.2
Technicians and trades workers 57 370 15.9% 4.4Fabrication engineering trades workers 5 410 9.4% 6.4Bricklayers, and carpenters and joiners 6 060 10.6% 6.4Mechanical engineering trades workers 5 745 10.0% 4.1Food trades workers 5 675 9.9% 4.0
Sales workers 22 185 6.2% 3.3Professionals 35 595 9.9% 1.7
Midwifery and nursing professionals 11 975 33.7% 6.2School teachers 7 335 20.6% 2.3
Clerical and administrative workers 20 000 5.6% 1.6Managers 14 125 3.9% 1.1Total 360 180 100.0% 4.2
Occupation and breakdown agency of MSDsUnder the TOOCS, the breakdown agency identifies “the object, substance or circumstance that was principally involved in, or most closely associated with, the point at which things started to go wrong and which ultimately led to the most serious injury or disease” (ASCC 2008). Table 5 outlines the breakdown agencies of MSDs for all occupations and for the four occupations that collectively accounted for almost three-quarters (74 per cent) of serious MSD claims between 2009–10 and 2013–14.
The table shows a number of pronounced occupational differences, which reflect the hazards that are more common in some occupations. The most pronounced occupational difference is that the percentage of serious MSD claims that arose from animal, human and biological agencies was almost three times higher among community and personal service workers (34 per cent versus 12 per cent in all occupations). Almost all (97 per cent) of these claims were attributed to contact with other people and this reflects the high degree of contact that community and personal service workers have with other people.
The percentage of serious MSD claims that arose from mobile plant and transport was more than two times higher among machinery operators and drivers (23 per cent versus 10 per cent in all occupations). Just over half (51 per cent) of these claims were associated with trucks, semi-trailers or lorries, which are more commonly used by machinery operators and drivers than employees in other occupations.
9
Table 5: Serious MSD claims by breakdown agency of MSD and occupation, 2009–10 to 2013–14p combined
Breakdown agency of MSD
Labo
urer
s
Com
mun
ity a
nd
pers
onal
ser
vice
w
orke
rs
Tech
nici
ans
and
trad
es w
orke
rs
Mac
hine
ry
oper
ator
s an
d dr
iver
s
All
occu
patio
ns
Non-powered handtools, appliances and equipment 30.3% 20.8% 25.2% 29.4% 27.3%Crates, cartons, boxes, cases, drums, kegs, barrels 22.9% 11.1% 13.1% 36.6% 25.3%Bags, bundles and bales 7.2% 6.6% 3.2% 5.9% 6.3%Storage equipment 6.2% 3.7% 5.6% 5.8% 5.6%Sitting furniture 2.5% 10.6% 2.5% 2.6% 5.4%Ladders 4.7% 1.4% 14.6% 2.9% 5.1%
Environmental agencies 16.4% 17.2% 17.2% 13.6% 16.8%Traffic and ground surfaces other 26.9% 26.9% 25.7% 33.7% 26.6%Steps and stairways 10.9% 13.6% 11.6% 11.6% 13.2%
Materials and substances 15.2% 4.4% 18.6% 13.0% 11.8%Ferrous and non-ferrous metal 20.0% 5.2% 26.6% 20.1% 18.2%Sawn or dressed timber 10.9% 3.0% 11.2% 7.3% 8.5%
Animal, human and biological agencies 5.2% 34.1% 3.9% 1.9% 11.5%Other person 19.7% 94.8% 23.8% 29.4% 77.8%Condition of affected person 11.9% 1.7% 15.9% 28.4% 5.8%
Mobile plant and transport 8.5% 5.9% 8.4% 22.8% 9.8%Trucks, semi-trailers, lorries 19.5% 7.2% 18.4% 50.5% 27.6%Cars, station wagons, vans, utilities 17.6% 46.8% 30.2% 9.2% 23.3%Trolleys, handcarts 22.5% 20.5% 9.2% 5.2% 13.9%
Powered equipment, tools and appliances 5.0% 2.7% 5.2% 2.0% 4.5%Computers and keyboards 2.0% 17.9% 6.1% 2.5% 29.2%Cleaning equipment 44.0% 35.8% 3.4% 6.1% 18.0%
Machinery and (mainly) fixed plant 3.9% 1.0% 6.1% 6.2% 3.6%Forklift trucks 18.4% 3.1% 7.7% 47.0% 21.9%
Other 15.4% 14.0% 15.4% 11.1% 14.7%Total 100.0% 100.0% 100.0% 100.0% 100.0%
Occupation and mechanism of MSDsUnder the TOOCS, the mechanism identifies “the action, exposure or event that best describes the circumstances that resulted in the most serious injury or disease” (ASCC 2008). Work-related MSDs can arise from exposure to a single, primary mechanism or multiple, secondary mechanisms over long periods of time. When workers’ compensation data are coded, only the primary mechanism of each injury or disease is coded and this means that secondary mechanisms are not captured. It is important to consider this limitation when interpreting the statistics on the mechanisms of MSDs because they only reflect the primary mechanisms of MSDs.
Table 6 outlines the mechanisms of MSDs for all occupations and for the four occupations that collectively accounted for almost three-quarters (74 per cent) of serious MSD claims between 2009–10 and 2013–14. Unlike the breakdown agencies of MSDs, there are less pronounced occupational differences in the mechanisms of MSDs. The majority (63 per cent) of serious MSD claims were due to body stressing. Body stressing occurs when muscles, tendons, ligaments or bones are placed under stress and this can arise from a single traumatic event or multiple events over time. Most (79 per cent) body stressing claims resulted from muscular stress while lifting, carrying, putting down or handling objects.
10
Around a quarter (23 per cent) of serious MSD claims were due to falls, trips or slips of a person. The majority (66 per cent) of these claims were due to falls on the same level, while 24 per cent were due to falls from a height.
Table 6: Serious MSD claims by mechanism of MSD and occupation, 2009–10 to 2013–14p combined
Mechanism of MSD
Labo
urer
s
Com
mun
ity a
nd
pers
onal
ser
vice
w
orke
rs
Tech
nici
ans
and
trad
es w
orke
rs
Mac
hine
ry
oper
ator
s an
d dr
iver
s
All
occu
patio
ns
Body stressing 64.9% 62.0% 63.3% 62.0% 62.9%Muscular stress while lifting, carrying, or putting down objects 43.0% 31.8% 43.1% 44.8% 40.6%
Muscular stress while handling objects other than lifting, carrying or putting down objects 40.0% 47.0% 37.2% 40.4% 38.7%
Muscular stress with no objects being handled 10.7% 17.7% 13.9% 10.7% 13.9%Repetitive movement, low muscle loading 6.3% 3.6% 5.9% 4.1% 6.8%
Falls, trips and slips of a person 21.9% 21.2% 24.0% 23.6% 22.9%Falls on the same level 66.6% 74.6% 57.6% 56.1% 65.9%Falls from a height 23.9% 17.3% 28.9% 31.9% 24.0%
Being hit by moving objects 5.5% 9.5% 5.1% 5.4% 6.3%Vehicle incidents and other 5.1% 5.3% 4.5% 6.5% 5.5%Hitting objects with a part of the body 2.5% 1.9% 3.0% 2.4% 2.3%Total 100.0% 100.0% 100.0% 100.0% 100.0%
IndustryBetween 2009–10 and 2013–14, the health care and social assistance industry accounted for the highest percentage (18 per cent) of serious MSD claims and the industry also had the highest frequency rate (7.1 claims per million hours worked). Within this industry, the frequency rate for employees in residential care services (15.3) was over three times higher than the rate for all employees (4.2).
Other major industries that had high frequency rates and high percentages of serious MSD claims were transport, postal and warehousing (frequency rate was 7.0 and percentage of MSD claims was 10 per cent), and manufacturing (frequency rate was 5.4 and percentage of MSD claims was 12 per cent).
Table 7: Serious MSD claims by industry, 2009–10 to 2013–14p combined
Industry Number of claims Percentage of claims
Number of claims per million hours
workedHealth care and social assistance 65 995 18.3% 7.1
Residential care services 22 385 33.9% 15.3Hospitals 25 695 38.9% 8.5Child care services 3 875 5.9% 5.3
Transport, postal and warehousing 34 065 9.5% 7.0Warehousing and storage services 4 105 12.0% 10.1Road freight transport 11 925 35.0% 8.9Postal and courier pick-up and delivery services 3 985 11.7% 4.5
Manufacturing 44 645 12.4% 5.4Structural metal product manufacturing 3 085 6.9% 13.6Meat and meat product manufacturing 5 785 13.0% 11.8Motor vehicle and motor vehicle part manufacturing 2 475 5.5% 5.3

11
Industry Number of claims Percentage of claims
Number of claims per million hours
workedAgriculture, forestry and fishing 8 960 2.5% 5.0Administrative and support services 16 550 4.6% 4.9Public administration and safety 29 165 8.1% 4.8Construction 33 710 9.4% 4.6Wholesale trade 16 595 4.6% 4.6Arts and recreation services 5 935 1.6% 4.6Retail trade 32 000 8.9% 3.9Accommodation and food services 16 610 4.6% 3.4Mining 8 615 2.4% 3.4Other services 9 840 2.7% 3.1Electricity, gas, water and waste services 4 115 1.1% 3.1Education and training 18 860 5.2% 2.7Rental, hiring and real estate services 3 330 0.9% 2.1Information media and telecommunications 2 090 0.6% 1.2Professional, scientific and technical services 5 535 1.5% 0.8Financial and insurance services 2 550 0.7% 0.7Total 360 180 100.0% 4.2
Bodily location of MSDsAround one in three (35 per cent) serious MSD claims between 2009–10 and 2013–14 involved the back. This bodily location was involved in a higher percentage of MSD diseases (43 per cent) and a lower percentage of MSD injuries (33 per cent). Other bodily locations that were commonly involved in serious MSD claims were the shoulder (16 per cent), the knee (13 per cent) and the ankle (6 per cent).
Table 8: Serious MSD claims by bodily location of MSD and nature of MSD, 2009–10 to 2013–14p combined
Bodily location of MSD MSD injuries MSD diseases All MSDsBack 32.5% 43.3% 35.1%Shoulder 15.2% 18.8% 16.1%Knee 14.6% 8.7% 13.2%Ankle 7.5% 1.2% 6.0%Wrist 4.0% 5.5% 4.3%Hand, fingers and thumb 3.3% 3.4% 3.3%Neck 2.7% 4.5% 3.2%Elbow 1.9% 6.0% 2.9%Foot and toes 1.7% 1.3% 1.6%Neck and shoulder 1.6% 0.7% 1.4%Lower leg 1.7% 0.5% 1.4%Other 13.3% 6.2% 11.6%Total 100.0% 100.0% 100.0%

12
Further informationExplanatory notesExplanatory notes for the NDS are available on the following website: http://www.safeworkaustralia.gov.au/sites/swa/about/publications/pages/explanatory-notes-datasets
ReferencesAustralian Safety and Compensation Council (ASCC) 2008. Type of Occurrence Classification System, Third Edition, Revision One. Canberra: ASCC. Accessed on 2 September 2014: http://www.safeworkaustralia.gov.au/sites/swa/about/publications/pages/sr20080501toocs3rdeditionrevision
Safe Work Australia (SWA) 2012. Australian Work Health and Safety Strategy 2012–2022. Canberra: SWA. Accessed on 21 September 2015: http://www.safeworkaustralia.gov.au/sites/swa/about/publications/pages/australian-work-health-and-safety-strategy-2012-2022