Embed Size (px)
Citation preview
U.S. International Trade CommissionPublication 4951 September 2019
Washington, DC 20436
Steel Racks from China
Investigation Nos. 701-TA-608 and 731-TA-1420 (Final)
U.S. International Trade Commission
COMMISSIONERS
David S. Johanson, Chairman Rhonda K. Schmidtlein
Jason E. Kearns Randolph J. Stayin
Amy A. Karpel
Catherine DeFilippo
Staff assigned
Address all communications to Secretary to the Commission
United States International Trade Commission Washington, DC 20436
Director of Operations
Stamen Borisson, Investigator Karl Tsuji, Industry Analyst
Cindy Cohen, Economist Jennifer Brinckhaus, Accountant
Cynthia Payne, Statistician Darlene Smith, Statistician
Karen Veninga Driscoll, Attorney Elizabeth Haines, Supervisory Investigator
U.S. International Trade CommissionWashington, DC 20436
www.usitc.gov
Publication 4951 September 2019
Steel Racks from China
Investigation Nos. 701-TA-608 and 731-TA-1420 (Final)

CONTENTS Page
i
Determinations ............................................................................................................................... 1
Views of the Commission ............................................................................................................... 3
Part I: Introduction ................................................................................................................ I‐1
Background ................................................................................................................................ I‐1
Statutory criteria and organization of the report ..................................................................... I‐2
Statutory criteria ................................................................................................................... I‐2
Organization of report ........................................................................................................... I‐3
Market summary ....................................................................................................................... I‐3
Summary data and data sources ............................................................................................... I‐4
Section 301 proceedings ....................................................................................................... I‐5
Section 232 presidential proclamations ................................................................................ I‐5
Nature and extent of subsidies and sales at LTFV .................................................................... I‐6
Subsidies ................................................................................................................................ I‐6
Sales at LTFV .......................................................................................................................... I‐7
The subject merchandise .......................................................................................................... I‐9
Commerce’s scope ................................................................................................................ I‐9
Tariff treatment ................................................................................................................... I‐14
Section 301 tariff treatment ................................................................................................ I‐14
Section 232 tariff treatment ................................................................................................ I‐15
The product ............................................................................................................................. I‐16
Description and applications ............................................................................................... I‐16
Manufacturing processes .................................................................................................... I‐23
Domestic like product issues ................................................................................................... I‐24
Part II: Conditions of competition in the U.S. market ............................................................ II‐1
U.S. market characteristics ....................................................................................................... II‐1
U.S. purchasers ......................................................................................................................... II‐2
Channels of distribution ........................................................................................................... II‐3
CONTENTS Page
ii
Geographic distribution ........................................................................................................... II‐5
Supply and demand considerations ......................................................................................... II‐6
U.S. supply ............................................................................................................................ II‐6
U.S. demand ......................................................................................................................... II‐9
Substitutability issues ............................................................................................................. II‐10
Lead times .......................................................................................................................... II‐11
Knowledge of country sources ........................................................................................... II‐12
Factors affecting purchasing decisions............................................................................... II‐12
Comparisons of domestic products, subject imports, and nonsubject imports ................ II‐15
Comparison of U.S.‐produced and imported steel racks ................................................... II‐15
Elasticity estimates ................................................................................................................. II‐19
U.S. supply elasticity ........................................................................................................... II‐19
U.S. demand elasticity ........................................................................................................ II‐19
Substitution elasticity ......................................................................................................... II‐19
Part III: U.S. producers’ production, shipments, and employment ....................................... III‐1
U.S. producers ......................................................................................................................... III‐1
U.S. production, capacity, and capacity utilization ................................................................. III‐3
Alternative products ............................................................................................................ III‐4
U.S. producers’ U.S. shipments and exports ........................................................................... III‐4
U.S. producers’ shipments by type ...................................................................................... III‐4
U.S. producers’ inventories ..................................................................................................... III‐5
U.S. producers’ imports and purchases .................................................................................. III‐5
U.S. employment, wages, and productivity ............................................................................ III‐6
Part IV: U.S. imports, apparent U.S. consumption, and market shares ................................ IV‐1
U.S. importers.......................................................................................................................... IV‐1
U.S. imports ............................................................................................................................. IV‐2
Negligibility .............................................................................................................................. IV‐3
U.S. Importers’ U.S. Shipments by type .................................................................................. IV‐4
CONTENTS Page
iii
Apparent U.S. consumption and market share ....................................................................... IV‐5
Part V: Pricing data ............................................................................................................... V‐1
Factors affecting prices ............................................................................................................ V‐1
Raw material costs ............................................................................................................... V‐1
U.S. inland transportation costs ........................................................................................... V‐2
Pricing practices ....................................................................................................................... V‐2
Pricing methods .................................................................................................................... V‐2
Sales terms and discounts .................................................................................................... V‐4
Price leadership .................................................................................................................... V‐4
Price data .................................................................................................................................. V‐5
Price trends ......................................................................................................................... V‐10
Price comparisons .............................................................................................................. V‐10
Lost sales and lost revenue .................................................................................................... V‐11
Part VI: Financial experience of U.S. producers .................................................................... VI‐1
Background .............................................................................................................................. VI‐1
Operations on steel racks ........................................................................................................ VI‐1
Net sales .............................................................................................................................. VI‐4
Cost of goods sold and gross profit or (loss) ....................................................................... VI‐4
SG&A expenses and operating income ............................................................................... VI‐5
All other expenses and net income ..................................................................................... VI‐6
Variance analysis ................................................................................................................. VI‐6
Capital expenditures and research and development expenses ............................................ VI‐8
Assets and return on assets .................................................................................................... VI‐9
Capital and investment ......................................................................................................... VI‐10
Part VII: Threat considerations and information on nonsubject countries .......................... VII‐1
The industry in china .............................................................................................................. VII‐3
Changes in operations ........................................................................................................ VII‐3
Operations on steel racks ................................................................................................... VII‐3
CONTENTS Page
iv
Alternative products ........................................................................................................... VII‐4
U.S. inventories of imported merchandise ............................................................................ VII‐5
U.S. importers’ outstanding orders ........................................................................................ VII‐5
Antidumping or countervailing duty orders in third‐country markets .................................. VII‐6
Information on nonsubject countries .................................................................................... VII‐7
Appendixes
A. Federal Register notices .................................................................................................. A‐1
B. List of hearing witnesses ................................................................................................. B‐1
C. Summary data ................................................................................................................. C‐1
D. Nonsubject country price data ....................................................................................... D‐1
Note.—Information that would reveal confidential operations of individual concerns may not
be published. Such information is identified by brackets in confidential reports and is deleted
and replaced with asterisks (***) in public reports.
UNITED STATES INTERNATIONAL TRADE COMMISSION
Investigation Nos. 701‐TA‐608 and 731‐TA‐1420 (Final)
Steel Racks from China
DETERMINATIONS
On the basis of the record1 developed in the subject investigations, the United States International Trade Commission (“Commission”) determines, pursuant to the Tariff Act of 1930 (“the Act”), that an industry in the United States is materially injured by reason of imports of steel racks from China, provided for in subheadings 7326.90.86, 9403.20.00, and 9403.90.80 of the Harmonized Tariff Schedule of the United States, that have been found by the U.S. Department of Commerce (“Commerce”) to be sold in the United States at less than fair value (“LTFV”), and to be subsidized by the government of China.2
BACKGROUND
The Commission, pursuant to sections 705(b) and 735(b) of the Act (19 U.S.C. 1671d(b) and 19 U.S.C. 1673d(b)), instituted these investigations effective June 20, 2018, following receipt of petitions filed with the Commission and Commerce by the Coalition for Fair Rack Imports and its members. The final phase of the investigations was scheduled by the Commission following notification of a preliminary determinations by Commerce that imports of steel racks from China were subsidized within the meaning of section 703(b) of the Act (19 U.S.C. 1671b(b)) and sold at LTFV within the meaning of 733(b) of the Act (19 U.S.C. 1673b(b)). Notice of the scheduling of the final phase of the Commission’s investigations and of a public hearing to be held in connection therewith was given by posting copies of the notice in the Office of the Secretary, U.S. International Trade Commission, Washington, DC, and by publishing the notice in the Federal Register on March 28, 2019 (84 FR 11835). The hearing was held in Washington, DC, on July 16, 2019, and all persons who requested the opportunity were permitted to appear in person or by counsel.
1 The record is defined in sec. 207.2(f) of the Commission’s Rules of Practice and Procedure (19 CFR 207.2(f)).
2 Commissioners Randolph J. Stayin and Amy A. Karpel were not members of the Commission at the time of the vote.
1

3
Views of the Commission
Based on the record in the final phase of these investigations, we determine that an industry in the United States is materially injured by reason of imports of steel racks from China found by the U.S. Department of Commerce (“Commerce”) to be sold in the United States at less than fair value and subsidized by the government of China.1
I. Background
The petitions in these investigations were filed on June 20, 2018 by The Coalition for Fair Rack Imports (“Coalition” or “Petitioner”), a trade association whose members are U.S. producers of steel racks.2 Representatives of the Coalition appeared at the hearing accompanied by counsel and the Coalition submitted prehearing and posthearing briefs and final comments. Respondent United Material Handling, Inc. (“UMH” or “Respondent”), an importer of subject merchandise, appeared at the hearing accompanied by counsel and submitted prehearing and posthearing briefs and final comments. Commerce aligned its final antidumping and countervailing duty investigations of steel racks from China,3 and issued its final affirmative determinations on July 24, 2019.4
U.S. Industry data are based on the questionnaire responses from 11 domestic producers that accounted for the majority of domestic production of steel racks in 2018.5 Steel racks enter the United States under several basket categories which limits the usefulness of official import statistics. Thus, U.S. import data are based on the questionnaire responses of 17 U.S. importers, six Chinese producers, and ***.6 The quantity of U.S. imports of steel racks from China are based on export data from six
1 Commissioners Randolph J. Stayin and Amy A. Karpel were not members of the Commission at
the time of the vote. 2 Petitioner’s members are Bulldog Rack Company, Weirton, West Virginia; Elite Storage
Solutions, Monroe, Georgia (“Elite”); Hannibal Industries, Inc., Los Angeles, California; Husky Rack and Wire, Denver, North Carolina; Ridg‐U‐Rak, Inc., North East, Pennsylvania; SpaceRAK, a Division of Heartland Steel Products, Inc., Marysville, Michigan; Speedrack Products Group, Ltd., Sparta, Michigan; Steel King Industries, Inc., Stevens Point, Wisconsin; Tri‐Boro Shelving & Partition Corp., Farmville, Virginia; and UNARCO Material Handling, Inc., Springfield, Tennessee. CR/PR at I‐1 n.1. The Coalition states that members of the petitioning producers accounted for ***. Coalition Posthearing Brief, Answers to Commissioner Questions at 19.
3 Certain Steel Racks From the People’s Republic of China: Preliminary Affirmative Countervailing Duty Determination, and Alignment of Final Determination With Final Antidumping Duty Determination, 83 Fed. Reg. 62297 (Dec. 3, 2018).
4 Certain Steel Racks and Parts Thereof From the People’s Republic of China: Final Affirmative Countervailing Duty Determination, 84 Fed. Reg. 35592 (July 24, 2019); Certain Steel Racks and Parts Thereof From the People’s Republic of China: Final Affirmative Determination of Sales at Less Than Fair Value, 84 Fed. Reg. 35595 (July 24, 2019).
5 Confidential Report, Memorandum INV‐RR‐076 (“CR”) at I‐5, Public Report (“PR”) at I‐4. Domestic producer/importer Frazier International (“Frazier”) provided a partial response via email with estimates of certain data. See CR/PR at III‐1 n.2 and CR/PR at Table III‐1.
6 CR at I‐5, PR at I‐4. While Frazier provided estimates of the quantity and value of its imports from Mexico via email, the Commission used *** to measure Frazier’s imports from Mexico rather than its estimates. CR at I‐6 n.12, PR at I‐5 n.12.
4
responding Chinese producers’ exports to the United States.7 The value of U.S. imports of steel racks from China is derived from the average unit values (“AUV”s) of responding U.S. importers’ imports of steel racks from China.8 U.S. import data for nonsubject sources are based on importer questionnaire responses from U.S. importers of steel racks and ***. Data concerning the subject industry in China are based on questionnaire responses from six foreign producers that estimated that their production accounted for approximately *** percent of overall production of steel racks in China and *** percent of total Chinese exports of steel racks to the United States.9
II. Domestic Like Product
A. In General
In determining whether an industry in the United States is materially injured or threatened with material injury by reason of imports of subject merchandise, the Commission first defines the “domestic like product” and the “industry.”10 Section 771(4)(A) of the Tariff Act of 1930, as amended (“the Tariff Act”), defines the relevant domestic industry as the “producers as a whole of a domestic like product, or those producers whose collective output of a domestic like product constitutes a major proportion of the total domestic production of the product.”11 In turn, the Tariff Act defines “domestic like product” as “a product which is like, or in the absence of like, most similar in characteristics and uses with, the article subject to an investigation.”12
The decision regarding the appropriate domestic like product in an investigation is a factual determination, and the Commission has applied the statutory standard of “like” or “most similar in characteristics and uses” on a case‐by‐case basis.13 No single factor is dispositive, and the Commission
7 CR at I‐6, PR at I‐4 and CR/PR at Table IV‐2. The Commission used data from the foreign
producer questionnaires to calculate subject import volume rather than the import data contained in the responses to the importer questionnaires because it provided the most comprehensive dataset in terms of volume. CR at I‐6 n.10, PR at I‐4 n.10.
The Coalition contends that subject import volume is substantially understated in the Commission’s report due to a lack of importer and foreign participation; it states that subject import volume is likely *** as what has been reported to the Commission based on the large number of submissions in Commerce’s dumping and subsidy investigations on steel racks. Coalition Prehearing Brief at 1, 3‐4; Coalition Posthearing Brief, Answers to Commissioner Questions at 11‐13. UMH contends that the number of responding firms in Commerce’s investigations has minimal relevance to the coverage of these investigations because Commerce’s initial, broad scope of investigation drew many Chinese producers/exporters into Commerce’s investigations whose products were ultimately determined to be nonsubject merchandise. UMH Posthearing Brief at 1, Response to Commission Questions at 3‐7. We consider the report’s compilation of import volume, as calculated based on foreign producer questionnaire responses, to be the most reliable and representative data available to the Commission.
8 CR at I‐6, PR at I‐4‐5. 9 CR at VII‐3, PR at VII‐3. 10 19 U.S.C. § 1677(4)(A). 11 19 U.S.C. § 1677(4)(A). 12 19 U.S.C. § 1677(10). 13 See, e.g., Cleo Inc. v. United States, 501 F.3d 1291, 1299 (Fed. Cir. 2007); NEC Corp. v.
Department of Commerce, 36 F. Supp. 2d 380, 383 (Ct. Int’l Trade 1998); Nippon Steel Corp. v. United (Continued...)
5
may consider other factors it deems relevant based on the facts of a particular investigation.14 The Commission looks for clear dividing lines among possible like products and disregards minor variations.15 Although the Commission must accept Commerce’s determination as to the scope of the imported merchandise that is subsidized or sold at less than fair value,16 the Commission determines what domestic product is like the imported articles Commerce has identified.17
B. Product Description
Commerce defined the scope of the imported merchandise under investigation as follows: {S}teel racks and parts thereof, assembled, to any extent, or unassembled, including but not limited to, vertical components (e.g., uprights, posts, or columns), horizontal or diagonal components (e.g., arms or beams), braces, frames, locking devices (e.g., end plates and beam connectors), and accessories (including, but not limited to, rails, skid channels, skid rails, drum/coil beds, fork clearance bars, pallet supports, row spacers, and wall ties). Subject steel racks and parts thereof are made of steel, including, but not limited to, cold and/or hot‐formed steel, regardless of the type of steel used to produce the components and may, or may not, include locking tabs, slots, or bolted, clamped, or welded connections. Subject steel racks have the following physical characteristics:
(…Continued) States, 19 CIT 450, 455 (1995); Torrington Co. v. United States, 747 F. Supp. 744, 749 n.3 (Ct. Int’l Trade 1990), aff’d, 938 F.2d 1278 (Fed. Cir. 1991) (“every like product determination ‘must be made on the particular record at issue’ and the ‘unique facts of each case’”). The Commission generally considers a number of factors, including the following: (1) physical characteristics and uses; (2) interchangeability; (3) channels of distribution; (4) customer and producer perceptions of the products; (5) common manufacturing facilities, production processes, and production employees; and, where appropriate, (6) price. See Nippon, 19 CIT at 455 n.4; Timken Co. v. United States, 913 F. Supp. 580, 584 (Ct. Int’l Trade 1996).
14 See, e.g., S. Rep. No. 96‐249 at 90‐91 (1979). 15 Nippon, 19 CIT at 455; Torrington, 747 F. Supp. at 748‐49; see also S. Rep. No. 96‐249 at 90‐91
(Congress has indicated that the like product standard should not be interpreted in “such a narrow fashion as to permit minor differences in physical characteristics or uses to lead to the conclusion that the product and article are not ‘like’ each other, nor should the definition of ‘like product’ be interpreted in such a fashion as to prevent consideration of an industry adversely affected by the imports under consideration.”).
16 See, e.g., USEC, Inc. v. United States, 34 Fed. Appx. 725, 730 (Fed. Cir. 2002) (“The ITC may not modify the class or kind of imported merchandise examined by Commerce.”); Algoma Steel Corp. v. United States, 688 F. Supp. 639, 644 (Ct. Int’l Trade 1988), aff’d, 865 F.3d 240 (Fed. Cir.), cert. denied, 492 U.S. 919 (1989).
17 Hosiden Corp. v. Advanced Display Mfrs., 85 F.3d 1561, 1568 (Fed. Cir. 1996) (the Commission may find a single like product corresponding to several different classes or kinds defined by Commerce); Cleo, 501 F.3d at 1298 n.1 (“Commerce’s {scope} finding does not control the Commission’s {like product} determination.”); Torrington, 747 F. Supp. at 748‐52 (affirming the Commission’s determination defining six like products in investigations in which Commerce found five classes or kinds).
6
(1) Each steel vertical and horizontal load bearing member (e.g., arms, beams, posts, and columns) is composed of steel that is at least 0.044 inches thick; (2) Each steel vertical and horizontal load bearing member (e.g., arms, beams, posts, and columns) is composed of steel that has a yield strength equal to or greater than 36,000 pounds per square inch; (3) The width of each steel vertical load bearing member (e.g., posts and columns) exceeds two inches; and (4) The overall depth of each steel roll‐formed horizontal load bearing member (e.g., beams) exceeds two inches. In the case of steel horizontal load bearing members other than roll‐formed (e.g., structural beams, Z‐beams, or cantilever arms), only the criteria in subparagraphs (1) and (2) apply to these horizontal load bearing members. The depth limitation in subparagraph (4) does not apply to steel horizontal load bearing members that are not roll‐formed. Steel rack components can be assembled into structures of various dimensions and configurations by welding, bolting, clipping, or with the use of devices such as clips, end plates, and beam connectors, including, but not limited to the following configurations: (1) Racks with upright frames perpendicular to the aisles that are independently adjustable, with positive‐locking beams parallel to the aisle spanning the upright frames with braces; and (2) cantilever racks with vertical components parallel to the aisle and cantilever beams or arms connected to the vertical components perpendicular to the aisle. Steel racks may be referred to as pallet racks, storage racks, stacker racks, retail racks, pick modules, selective racks, or cantilever racks and may incorporate moving components and be referred to as pallet‐flow racks, carton‐flow racks, push‐back racks, movable‐shelf racks, drive‐in racks, and drive‐through racks. While steel racks may be made to ANSI MH16.l or ANSI MH16.3 standards, all steel racks and parts thereof meeting the description set out herein are covered by the scope of this investigation, whether or not produced according to a particular standard. The scope includes all steel racks and parts thereof meeting the description above, regardless of (1) other dimensions, weight, or load rating; (2) vertical components or frame type (including structural, roll‐form, or other); (3) horizontal support or beam/brace type (including but not limited to structural, roll‐form, slotted, unslotted, Z‐beam, C‐beam, L‐beam, step beam, and cantilever beam); (4) number of supports; (5) number of levels;
7
(6) surface coating, if any (including but not limited to paint, epoxy, powder coating, zinc, or other metallic coatings); (7) rack shape (including but not limited to rectangular, square, corner, and cantilever); (8) the method by which the vertical and horizontal supports connect (including but not limited to locking tabs or slots, bolting, clamping, and welding); and (9) whether or not the steel rack has moving components (including but not limited to rails, wheels, rollers, tracks, channels, carts, and conveyors). Subject merchandise includes merchandise matching the above description that has been finished or packaged in a third country. Finishing includes, but is not limited to, coating, painting, or assembly, including attaching the merchandise to another product, or any other finishing or assembly operation that would not remove the merchandise from the scope of the investigation if performed in the country of manufacture of the steel racks and parts thereof. Packaging includes packaging the merchandise with or without another product or any other packaging operation that would not remove the merchandise from the scope of the investigation if performed in the country of manufacture of the steel racks and parts thereof. Steel racks and parts thereof are included in the scope of this investigation whether or not imported attached to, or included with, other parts or accessories such as wire decking, nuts, and bolts. If steel racks and parts thereof are imported attached to, or included with, such non‐subject merchandise, only the steel racks and parts thereof are included in the scope. The scope of this investigation does not cover: (1) Decks, i.e., shelving that sits on or fits into the horizontal supports to provide the horizontal storage surface of the steel racks; (2) wire shelving units, i.e., units made from wire that incorporate both a wire deck and wire horizontal supports (taking the place of the horizontal beams and braces) into a single piece with tubular collars that slide over the posts and onto plastic sleeves snapped on the posts to create a finished unit; (3) pins, nuts, bolts, washers, and clips used as connecting devices; and (4) non‐steel components. Specifically excluded from the scope of this investigation are any products covered by Commerce's existing antidumping and countervailing duty orders on boltless steel shelving units prepackaged for sale from the People's Republic of China. See Boltless Steel Shelving Units Prepackaged for Sale From the People's Republic of China: Antidumping Duty Order, 80 FR 63,741 (October 21, 2017); and Boltless Steel Shelving Units Prepackaged for Sale From the People's Republic of China: Amended Final Affirmative Countervailing Duty Determination and Countervailing Duty Order, 80 FR 63,745 (October 21, 2017). Also excluded from the scope of this investigation are bulk‐packed parts or components of boltless steel shelving units that were specifically excluded from the scope of the Boltless Steel Shelving Orders because such bulk‐packed parts or components do not
8
contain the steel vertical supports (i.e., uprights and posts) and steel horizontal supports (i.e., beams, braces) packaged together for assembly into a completed boltless steel shelving unit. Such excluded components of boltless steel shelving are defined as: (1) Boltless horizontal supports (beams, braces) that have each of the following characteristics: (a) A length of 95 inches or less, (b) made from steel that has a thickness of 0.068 inches or less, and (c) a weight capacity that does not exceed 2500 lbs per pair of beams for beams that are 78” or shorter, a weight capacity that does not exceed 2200 lbs per pair of beams for beams that are over 78” long but not longer than 90,” and/or a weight capacity that does not exceed 1800 lbs per pair of beams for beams that are longer than 90”; (2) shelf supports that mate with the aforementioned horizontal supports; and (3) boltless vertical supports (upright welded frames and posts) that have each of the following characteristics: (a) A length of 95 inches or less, (b) with no face that exceeds 2.90 inches wide, and (c) made from steel that has a thickness of 0.065 inches or less. Excluded from the scope of this investigation are: (1) Wall‐mounted shelving and racks, defined as shelving and racks that suspend all of the load from the wall, and do not stand on, or transfer load to, the floor; (2) ceiling‐mounted shelving and racks, defined as shelving and racks that suspend all of the load from the ceiling and do not stand on, or transfer load to, the floor; and (3) wall/ceiling mounted shelving and racks, defined as shelving and racks that suspend the load from the ceiling and the wall and do not stand on, or transfer load to, the floor. The addition of a wall or ceiling bracket or other device to attach otherwise subject merchandise to a wall or ceiling does not meet the terms of this exclusion. Also excluded from the scope of this investigation is scaffolding that complies with ANSI/ASSE A10.8—2011—Scaffolding Safety Requirements, CAN/CSA S269.2‐M87 (Reaffirmed 2003)—Access Scaffolding for Construction Purposes, and/or Occupational Safety and Health Administration regulations at 29 CFR part 1926 subpart L—Scaffolds. Also excluded from the scope of this investigation are tubular racks such as garment racks and drying racks, i.e., racks in which the load bearing vertical and horizontal steel members consist solely of: (1) Round tubes that are no more than two inches in diameter; (2) round rods that are no more than two inches in diameter; (3) other tubular shapes that have both an overall height of no more than two inches and an overall width of no more than two inches; and/or (4) wire. Also excluded from the scope of this investigation are portable tier racks. Portable tier racks must meet each of the following criteria to qualify for this exclusion: (1) They are freestanding, portable assemblies with a fully welded base and four freely inserted and easily removable corner posts;
9
(2) They are assembled without the use of bolts, braces, anchors, brackets, clips, attachments, or connectors; (3) One assembly may be stacked on top of another without applying any additional load to the product being stored on each assembly, but individual portable tier racks are not securely attached to one another to provide interaction or interdependence; and (4) The assemblies have no mechanism (e.g., a welded foot plate with bolt holes) for anchoring the assembly to the ground. Also excluded from the scope of this investigation are accessories that are independently bolted to the floor and not attached to the rack system itself, i.e., column protectors, corner guards, bollards, and end row and end of aisle protectors. Merchandise covered by this investigation is currently classified in the Harmonized Tariff Schedule of the United States (HTSUS) under the following subheadings: 7326.90.8688, 9403.20.0080, and 9403.90.8041. Subject merchandise may also enter under subheadings 7308.90.3000, 7308.90.6000, 7308.90.9590, and 9403.20.0090. The HTSUS subheadings are provided for convenience and U.S. Customs purposes only. The written description of the scope is dispositive.18 A steel rack is a structure consisting of hot‐rolled or cold‐formed steel structural components
designed so that its dimensions and configurations can be adjusted as required, either with or without locking tabs or slots, and either with or without bolted, clamped, or welded connections. Certain types of steel racks may also include movable components, such as rails, wheels, rollers, tracks, channels, carts, or conveyors. Steel racks and parts thereof are available either assembled or unassembled.19 The key technical characteristics of steel racks are their strength, load‐bearing capacity, and stability, which enable them to bear heavy loads in readily accessible rack configurations.20
C. Arguments of the Parties
The Coalition argues that the Commission should define a single domestic like product, coextensive with the scope of investigation, as it did in its preliminary determinations.21 UMH does not address the definition of the domestic like product.
18 Certain Steel Racks and Parts Thereof From the People’s Republic of China: Final Affirmative
Countervailing Duty Determination, 84 Fed. Reg. 35592 (July 24, 2019); Certain Steel Racks and Parts Thereof From the People’s Republic of China: Final Affirmative Determination of Sales at Less Than Fair Value, 84 Fed. Reg. 35595 (July 24, 2019). The scope is the same in both the countervailing duty and antidumping duty final determinations. Commerce revised the scope of these investigations after they were initiated in order to describe additional specific characterizations of subject steel racks and to exclude certain components and racks. CR at I‐16, PR at I‐14.
19 CR at I‐19‐20, PR at I‐16. 20 CR at I‐20, PR at I‐17. 21 Coalition Prehearing Brief at 3.
10
D. Domestic Like Product Analysis
In the preliminary phase of these investigations, the Commission defined a single domestic like product consisting of steel racks coextensive with Commerce’s scope of investigation. The Commission applied its traditional six‐factor like product analysis and found that there were no clear dividing lines between structural and roll‐formed steel racks, or parts of steel racks that would warrant defining separate domestic like products. The Commission found that although structural steel racks were made from channels of steel, which made them more durable with a greater load bearing capacity than roll‐formed racks, all steel racks were used for storage in industrial and commercial applications by the same end users, and could be used interchangeably.22 Further, the Commission found that all domestically produced steel racks and parts were made from the same basic raw material, by the same employees, using mostly the same manufacturing processes and equipment.
In the final phase of these investigations, the Commission has gathered additional information pertinent to its definition of the domestic like product that supports finding a single domestic like product corresponding to the scope of investigation.
Although steel racks come in a variety of configurations, all steel racks are made from high strength, low‐alloy steel, have a vertical column, a horizontal beam, and a beam‐locking device, and all of them serve the same basic function — holding heavy materials in a readily accessible rack configuration in a stable manner.23 Steel racks, which are sometimes referred to as storage racks, are utilized in warehouses, order‐fulfillment and distribution centers, big‐box retail stores, and manufacturing facilities to hold loaded shipping pallets moved by fork‐lift trucks.24
With respect to interchangeability, the responding domestic producers manufacture many of the same steel rack configurations, and all *** responding domestic producers manufacture pallet racks.25 Steel racks are manufactured to meet ANSI standards and almost all reporting domestic producers have the R‐Mark certification.26 With respect to channels of distribution, most domestically produced steel racks are sold to distributors with the remainder sold to end‐users.27 Steel racks may be manufactured either by cold‐forming and rolling steel strip (“roll‐forming”) or by welding together hot‐
22 Steel Racks from China, Inv. Nos. 701‐TA‐608 and 731‐TA‐1420 (Preliminary), USITC Pub. No.
4811 (Aug. 2018) (“Preliminary Determinations”) at 9‐11 & n.30. In the preliminary phase of these investigations, the Commission found various arguments were more accurately characterized as scope exclusion issues directed to Commerce rather than domestic like product issues since their focus was on whether certain products should have been included in Commerce’s scope of investigation. Preliminary Determinations at 9‐10.
23 CR at I‐19‐23, PR at I‐16‐19. Steel racks come in a range of configurations, including cantilever racks, pallet racks, and movable shelf racks. CR at I‐26‐28, PR at I‐21‐22.
24 CR at I‐20, PR at I‐17. The steel rack industry distinguishes between steel racks and steel shelving. Steel shelving is typically hand‐loaded. Id.
25 CR/PR at Table IV‐6. Furthermore, the vast majority of domestically produced steel racks are painted, complete rack sets. CR/PR at Table III‐6 and Table III‐7.
26 Compare CR/PR at Table III‐1 to CR at I‐23 n.51, PR at I‐19 n.51. The Rack Manufacturers Institute (“RMI”) provides its “R‐Mark” certification to steel rack producers that meet its RMI‐ANSI MH16.1 standard. The R‐Mark certification is available to both domestic and foreign steel‐rack manufacturers. CR at I‐24 n.54, PR at I‐19 n.54. Steel racks are readily available in standard sizes, e.g., with 12‐feet or 16‐feet high vertical frames and 8‐foot long beams, that are typically rated for a specific load rating of 5,000 pounds per shelf. CR at I‐20 n. 37, I‐23; PR at I‐17 n.37, I‐19.
27 CR/PR at Table II‐2.
11
rolled structural shapes (angles, channels, and other shapes).28 Although steel racks may be produced using two different manufacturing processes, both processes start with a high‐strength low‐alloy (high carbon) hot‐rolled steel of structural grade, with a yield strength of 50,000 pounds‐per‐square‐inch or higher.29 Most responding purchasers require their suppliers to become certified or qualified to sell steel racks to their firm, and many purchasers require their suppliers to be RMI certified.30 Prices for steel racks vary based on the rack configuration and the individual firm.31
Thus, the record reflects that steel racks are a standardized steel product, manufactured domestically in several widely available configurations, using two different processes that use the same high quality steel. There is no evidence in the final phase of these investigations nor arguments by parties to suggest a different definition of the domestic like product than the one reached by the Commission in its preliminary determinations. Therefore, we define a single domestic like product consisting of all steel racks, coextensive with the scope of these investigations. III. Domestic Industry and Related Parties
The domestic industry is defined as the domestic “producers as a whole of a domestic like product, or those producers whose collective output of a domestic like product constitutes a major proportion of the total domestic production of the product.”32 In defining the domestic industry, the Commission’s general practice has been to include in the industry producers of all domestic production of the like product, whether toll‐produced, captively consumed, or sold in the domestic merchant market.
We must determine whether any producer of the domestic like product should be excluded from the domestic industry pursuant to section 771(4)(B) of the Tariff Act. This provision allows the Commission, if appropriate circumstances exist, to exclude from the domestic industry producers that are related to an exporter or importer of subject merchandise or which are themselves importers.33 Exclusion of such a producer is within the Commission’s discretion based upon the facts presented in each investigation.34
28 CR at I‐22, PR at I‐18. 29 CR at I‐30‐31, V‐1; PR at I‐23‐24, V‐1. 30 CR at II‐19‐20, PR at II‐13. 31 CR at V‐8, PR at V‐5 and CR/PR at Tables V‐3 to V‐6. 32 19 U.S.C. § 1677(4)(A). 33 See Torrington Co. v. United States, 790 F. Supp. 1161, 1168 (Ct. Int’l Trade 1992), aff’d
without opinion, 991 F.2d 809 (Fed. Cir. 1993); Sandvik AB v. United States, 721 F. Supp. 1322, 1331‐32 (Ct. Int’l Trade 1989), aff’d mem., 904 F.2d 46 (Fed. Cir. 1990); Empire Plow Co. v. United States, 675 F. Supp. 1348, 1352 (Ct. Int’l Trade 1987).
34 The primary factors the Commission has examined in deciding whether appropriate circumstances exist to exclude a related party include the following:
(1) the percentage of domestic production attributable to the importing producer; (2) the reason the U.S. producer has decided to import the product subject to investigation
(whether the firm benefits from the LTFV sales or subsidies or whether the firm must import in order to enable it to continue production and compete in the U.S. market);
(3) whether inclusion or exclusion of the related party will skew the data for the rest of the industry;
(4) the ratio of import shipments to U.S. production for the imported product; and (Continued...)
12
In the preliminary phase of these investigations, the Commission found that domestic producer *** was a related party due to its reported imports of subject merchandise, but found that appropriate circumstances did not exist to exclude *** from the domestic industry.35 In the final phase of these investigations, *** initially submitted an importer questionnaire but then stated that it had been submitted in error and provided a purchaser questionnaire response.36 Therefore, no domestic producer imported subject imports during the period of investigation.37 While domestic producers *** and *** purchased subject merchandise during the period of investigation, neither controlled a large volume of subject imports.38 Thus, we do not find these two purchasers to be related parties. Accordingly, we define the domestic industry as all domestic producers of steel racks.
(…Continued)
(5) whether the primary interest of the importing producer lies in domestic production or importation. Changzhou Trina Solar Energy Co. v. USITC, 100 F. Supp.3d 1314, 1326‐31 (Ct. Int’l. Trade 2015); see also Torrington Co. v. United States, 790 F. Supp. at 1168.
35 Preliminary Determinations at 12; Confidential Version, EDIS Doc. No. 653039 at 15‐16. 36 CR at III‐11 n.5, PR at III‐6 n.5. 37 CR/PR at Table III‐9. 38 The Commission has previously concluded that a purchaser may be treated as a related party
if it controls large volumes of subject imports. The Commission has found such control to exist when the domestic producer was responsible for a predominant proportion of an importer’s purchases and these purchases were substantial. See Iron Construction Castings from Brazil, Canada, and China, Inv. Nos. 701‐TA‐249, 731‐TA‐262‐263 and 265 (Fourth Review), USITC Pub. 4655 (Dec. 2016) at 11.
*** purchased *** pounds of subject merchandise from importer *** in 2017, *** pounds in 2018, and *** pounds in interim 2019. CR at III‐11, PR at III‐6; *** Purchaser Questionnaire at questions II‐1 and II‐4, EDIS Document No. 677224. We do not have import data from ***. See CR/PR at Table IV‐1. *** purchases of subject merchandise were the equivalent of *** percent of subject imports in 2016, *** percent in 2017, *** percent in 2018, and *** percent in interim 2019. *** purchases of subject merchandise were the equivalent of *** percent of subject imports over the period of investigation (full years 2016, 2017, and 2018, and interim (January to March) 2019 (“POI”)). CR at III‐11, PR at III‐6 and CR/PR at Table IV‐2. *** purchases were a relatively small share of total subject imports over the POI, even though it increased its purchases in 2018.
*** purchased *** pounds of subject merchandise from importer *** in 2018 to ***. CR at III‐10‐11, PR at III‐5‐6; *** Producer Questionnaire at question II‐15, EDIS Document No. 676669. We do not have import data from ***. See CR at Table IV‐1. ***. CR at III‐11 and Table IV‐2. We find that neither *** nor *** controls large volumes of imports such that it should be treated as a related party.
13
IV. Material Injury by Reason of Subject Imports39
Based on the record in the final phase of these investigations, we find that an industry in the United States is materially injured by reason of imports of steel racks from China that Commerce has found to be sold in the United States at less than fair value and subsidized by the government of China.
A. Legal Standards
In the final phase of antidumping and countervailing duty investigations, the Commission determines whether an industry in the United States is materially injured or threatened with material injury by reason of the imports under investigation.40 In making this determination, the Commission must consider the volume of subject imports, their effect on prices for the domestic like product, and their impact on domestic producers of the domestic like product, but only in the context of U.S. production operations.41 The statute defines “material injury” as “harm which is not inconsequential, immaterial, or unimportant.”42 In assessing whether the domestic industry is materially injured by reason of subject imports, we consider all relevant economic factors that bear on the state of the industry in the United States.43 No single factor is dispositive, and all relevant factors are considered “within the context of the business cycle and conditions of competition that are distinctive to the affected industry.”44
Although the statute requires the Commission to determine whether the domestic industry is “materially injured or threatened with material injury by reason of” unfairly traded imports,45 it does not define the phrase “by reason of,” indicating that this aspect of the injury analysis is left to the Commission’s reasonable exercise of its discretion.46 In identifying a causal link, if any, between subject imports and material injury to the domestic industry, the Commission examines the facts of record that relate to the significance of the volume and price effects of the subject imports and any impact of those imports on the condition of the domestic industry. This evaluation under the “by reason of” standard
39 Pursuant to Section 771(24) of the Tariff Act, imports from a subject country of merchandise
corresponding to a domestic like product that account for less than 3 percent of all such merchandise imported into the United States during the most recent 12‐month period for which data are available that precedes the filing of the petition shall be deemed negligible. 19 U.S.C. § 1677(24)(A)(i). None of the parties addressed negligibility. Based on import data derived from responding Chinese producers’ exports to the United States for June 2017 through May 2018, the 12‐month period preceding the filing of the petition, subject imports from China accounted for *** percent of total imports of steel racks by quantity. CR/PR at Table IV‐3. Because subject imports from China exceeded the statutory negligibility threshold, we find that these imports are not negligible.
40 19 U.S.C. §§ 1671d(b), 1673d(b). 41 19 U.S.C. § 1677(7)(B). The Commission “may consider such other economic factors as are
relevant to the determination” but shall “identify each {such} factor ... and explain in full its relevance to the determination.” 19 U.S.C. § 1677(7)(B).
42 19 U.S.C. § 1677(7)(A). 43 19 U.S.C. § 1677(7)(C)(iii). 44 19 U.S.C. § 1677(7)(C)(iii). 45 19 U.S.C. §§ 1671d(b), 1673d(b). 46 Angus Chemical Co. v. United States, 140 F.3d 1478, 1484‐85 (Fed. Cir. 1998) (“{T}he statute
does not ‘compel the commissioners’ to employ {a particular methodology}.”), aff’g, 944 F. Supp. 943, 951 (Ct. Int’l Trade 1996).
14
must ensure that subject imports are more than a minimal or tangential cause of injury and that there is a sufficient causal, not merely a temporal, nexus between subject imports and material injury.47
In many investigations, there are other economic factors at work, some or all of which may also be having adverse effects on the domestic industry. Such economic factors might include nonsubject imports; changes in technology, demand, or consumer tastes; competition among domestic producers; or management decisions by domestic producers. The legislative history explains that the Commission must examine factors other than subject imports to ensure that it is not attributing injury from other factors to the subject imports, thereby inflating an otherwise tangential cause of injury into one that satisfies the statutory material injury threshold.48 In performing its examination, however, the Commission need not isolate the injury caused by other factors from injury caused by unfairly traded imports.49 Nor does the “by reason of” standard require that unfairly traded imports be the “principal”
47 The Federal Circuit, in addressing the causation standard of the statute, observed that “{a}s
long as its effects are not merely incidental, tangential, or trivial, the foreign product sold at less than fair value meets the causation requirement.” Nippon Steel Corp. v. USITC, 345 F.3d 1379, 1384 (Fed. Cir. 2003). This was further ratified in Mittal Steel Point Lisas Ltd. v. United States, 542 F.3d 867, 873 (Fed. Cir. 2008), where the Federal Circuit, quoting Gerald Metals, Inc. v. United States, 132 F.3d 716, 722 (Fed. Cir. 1997), stated that “this court requires evidence in the record ‘to show that the harm occurred “by reason of” the LTFV imports, not by reason of a minimal or tangential contribution to material harm caused by LTFV goods.’” See also Nippon Steel Corp. v. United States, 458 F.3d 1345, 1357 (Fed. Cir. 2006); Taiwan Semiconductor Industry Ass’n v. USITC, 266 F.3d 1339, 1345 (Fed. Cir. 2001).
48 SAA at 851‐52 (“{T}he Commission must examine other factors to ensure that it is not attributing injury from other sources to the subject imports.”); S. Rep. 96‐249 at 75 (1979) (the Commission “will consider information which indicates that harm is caused by factors other than less‐than‐fair‐value imports.”); H.R. Rep. 96‐317 at 47 (1979) (“in examining the overall injury being experienced by a domestic industry, the ITC will take into account evidence presented to it which demonstrates that the harm attributed by the petitioner to the subsidized or dumped imports is attributable to such other factors;” those factors include “the volume and prices of nonsubsidized imports or imports sold at fair value, contraction in demand or changes in patterns of consumption, trade restrictive practices of and competition between the foreign and domestic producers, developments in technology and the export performance and productivity of the domestic industry”); accord Mittal Steel, 542 F.3d at 877.
49 SAA at 851‐52 (“{T}he Commission need not isolate the injury caused by other factors from injury caused by unfair imports.”); Taiwan Semiconductor Industry Ass’n, 266 F.3d at 1345 (“{T}he Commission need not isolate the injury caused by other factors from injury caused by unfair imports ... . Rather, the Commission must examine other factors to ensure that it is not attributing injury from other sources to the subject imports.” (emphasis in original)); Asociacion de Productores de Salmon y Trucha de Chile AG v. United States, 180 F. Supp. 2d 1360, 1375 (Ct. Int’l Trade 2002) (“{t}he Commission is not required to isolate the effects of subject imports from other factors contributing to injury” or make “bright‐line distinctions” between the effects of subject imports and other causes.); see also Softwood Lumber from Canada, Inv. Nos. 701‐TA‐414 and 731‐TA‐928 (Remand), USITC Pub. 3658 at 100‐01 (Dec. 2003) (Commission recognized that “{i}f an alleged other factor is found not to have or threaten to have injurious effects to the domestic industry, i.e., it is not an ‘other causal factor,’ then there is nothing to further examine regarding attribution to injury”), citing Gerald Metals, 132 F.3d at 722 (the statute “does not suggest that an importer of LTFV goods can escape countervailing duties by finding some tangential or minor cause unrelated to the LTFV goods that contributed to the harmful effects on domestic market prices.”).
15
cause of injury or contemplate that injury from unfairly traded imports be weighed against other factors, such as nonsubject imports, which may be contributing to overall injury to an industry.50 It is clear that the existence of injury caused by other factors does not compel a negative determination.51
Assessment of whether material injury to the domestic industry is “by reason of” subject imports “does not require the Commission to address the causation issue in any particular way” as long as “the injury to the domestic industry can reasonably be attributed to the subject imports.”52 The Commission ensures that it has “evidence in the record” to “show that the harm occurred ‘by reason of’ the LTFV imports,” and that it is “not attributing injury from other sources to the subject imports.” 53 The Federal Circuit has examined and affirmed various Commission methodologies and has disavowed “rigid adherence to a specific formula.”54
The question of whether the material injury threshold for subject imports is satisfied notwithstanding any injury from other factors is factual, subject to review under the substantial evidence standard.55 Congress has delegated this factual finding to the Commission because of the agency’s institutional expertise in resolving injury issues.56
B. Conditions of Competition and the Business Cycle
The following conditions of competition inform our analysis of whether there is material injury by reason of subject imports.
50 S. Rep. 96‐249 at 74‐75; H.R. Rep. 96‐317 at 47. 51 See Nippon Steel Corp., 345 F.3d at 1381 (“an affirmative material‐injury determination under
the statute requires no more than a substantial‐factor showing. That is, the ‘dumping’ need not be the sole or principal cause of injury.”).
52 Mittal Steel, 542 F.3d at 876 &78; see also id. at 873 (“While the Commission may not enter an affirmative determination unless it finds that a domestic industry is materially injured ‘by reason of’ subject imports, the Commission is not required to follow a single methodology for making that determination ... {and has} broad discretion with respect to its choice of methodology.”) citing United States Steel Group v. United States, 96 F.3d 1352, 1362 (Fed. Cir. 1996) and S. Rep. 96‐249 at 75. In its decision in Swiff‐Train v. United States, 793 F.3d 1355 (Fed. Cir. 2015), the Federal Circuit affirmed the Commission’s causation analysis as comporting with the Court’s guidance in Mittal.
53 Mittal Steel, 542 F.3d at 873 (quoting from Gerald Metals, 132 F.3d at 722), 877‐79. We note that one relevant “other factor” may involve the presence of significant volumes of price‐competitive nonsubject imports in the U.S. market, particularly when a commodity product is at issue. In appropriate cases, the Commission collects information regarding nonsubject imports and producers in nonsubject countries in order to conduct its analysis.
54 Nucor Corp. v. United States, 414 F.3d 1331, 1336, 1341 (Fed. Cir. 2005); see also Mittal Steel, 542 F.3d at 879 (“Bratsk did not read into the antidumping statute a Procrustean formula for determining whether a domestic injury was ‘by reason’ of subject imports.”).
55 We provide in our discussion below a full analysis of other factors alleged to have caused any material injury experienced by the domestic industry.
56 Mittal Steel, 542 F.3d at 873; Nippon Steel Corp., 458 F.3d at 1350, citing U.S. Steel Group, 96 F.3d at 1357; S. Rep. 96‐249 at 75 (“The determination of the ITC with respect to causation is ... complex and difficult, and is a matter for the judgment of the ITC.”).
16
1. Demand Considerations
Demand for steel racks is largely driven by broad economic growth and demand for storage in warehousing and distribution centers.57 Steel racks typically have a long lifespan with new demand primarily coming from additional storage needs, or the need for replacement of racks that have been damaged.58
Most responding U.S. producers, importers, and purchasers reported an increase in U.S. demand for steel racks since January 1, 2016. Firms attributed increased demand to overall economic growth and growth in e‐commerce.59
Apparent U.S. consumption of steel racks increased by *** percent from 2016 to 2018, and it was *** percent lower in January to March (“interim”) 2019 than in interim 2018. It increased from *** pounds in 2016 to *** pounds in 2018 and was *** pounds in interim 2018 and *** pounds in interim 2019.60
2. Supply Considerations
The domestic industry was the largest source of supply to the U.S. market during the POI. Its share of apparent U.S. consumption decreased from *** percent in 2016 to *** percent in 2018, and was higher in interim 2019 at *** percent than in interim 2018 at *** percent.61 The domestic industry’s production capacity increased by *** percent from 2016 to 2018; it had unused production capacity throughout the POI.62
Subject imports accounted for *** percent to *** percent of the U.S. market. Their share of apparent U.S. consumption increased from *** percent in 2016 to *** percent in 2018; it was *** percent in interim 2018 and *** percent in interim 2019.63
Nonsubject imports’ share of apparent U.S. consumption increased from *** percent in 2016 to *** percent in 2018; it was *** percent in interim 2018 and *** percent in interim 2019.64 Most nonsubject imports were from ***, and all of the nonsubject imports from *** were imported by ***.65
Although the majority of responding firms did not report any supply constraints, some firms reported experiencing long lead times, limited availability, or difficulties with U.S. suppliers meeting deadlines or limiting supply. Two firms had difficulties with their Chinese suppliers; one firm experienced delays and another had insufficient inventories to meet customer orders.66
57 CR at II‐13, PR at II‐9. 58 CR at II‐14, PR at II‐9. 59 CR at II‐14, PR at II‐10 and CR/PR at Table II‐5. 60 CR/PR at Table IV‐7 and Table C‐1. 61 CR/PR at Table IV‐7 and Table C‐1. 62 CR/PR at Table III‐4. 63 CR/PR at Table IV‐7. ***. CR at I‐24 n. 54, IV‐2 n.3; PR at I‐19‐20 n. 54, IV‐2 n.3. 64 CR/PR at Table IV‐7. 65 CR at II‐11, PR at II‐7. 66 CR at II‐11‐12, PR at II‐8. *** reported long delays, including with its Chinese suppliers; ***
and reported that it had insufficient inventories to meet customer orders. Id. at 11 and *** Importer Questionnaire Response at question III‐22, EDIS Document No. 675187.
17
3. Substitutability and Other Conditions
Substitutability. There is a high degree of substitutability between domestically produced steel racks and subject imports.67 The majority of responding U.S. producers (9 of 10), importers (8 of 12) and purchasers (14 of 21) reported that domestically produced steel racks and subject imports were always or frequently interchangeable.68 A majority or plurality of purchasers reported that domestically produced steel racks and subject imports were comparable with respect to 13 out of 18 purchasing factors, including quality meets industry standards, availability, delivery terms, and reliability of supply.69 Lead times are shorter for “commodity‐type” steel racks for smaller projects, and stocking distributors maintain large inventories of these types of products, whereas lead times for steel racks for large‐scale, fully engineered projects are longer.70 Most U.S. producers do not typically hold inventories, but rather rely on their distributors to hold inventories of steel racks; by contrast, most importers have their own warehouses.71 A comparable share of both U.S. producers’ and U.S. importers’ shipments of steel racks went to distributors from 2016 to 2018; the share of U.S. importers’ shipments to distributors was substantially lower in interim 2019.72
Domestic producers and importers of subject merchandise both ship a wide range of types of steel racks, including pallet racks and cantilever racks.73 Steel rack components from domestic and subject suppliers that are similar may theoretically be used in the same system but, as a practical matter concerns over safety and voiding warranties limits using them together.74 Steel racks are manufactured to meet ANSI standards and RMI provides both domestic and foreign manufacturers its R‐Mark certification. Several Chinese producers as well as almost all of the responding domestic producers have R‐Mark certification.75
Price is an important consideration in purchasing steel racks. Purchasers reported that price/cost and quality/meets specification were the two most important factors they considered in their purchasing decisions, followed by availability/delivery/lead time/supply.76 Market participants held
67 CR at II‐16, PR at II‐10. 68 CR at II‐24, PR at II‐15 and CR/PR at Table II‐11. 69 CR at II‐22, PR at II‐15 and CR/PR at Table II‐10. With respect to delivery time, seven firms
reported that the domestic product was superior or comparable to the subject imports, and five firms reported that the domestic product was inferior. With respect to availability, nine firms reported that the domestic product and subject imports were comparable, seven firms reported that the domestic product was inferior, and four firms reported that the domestic product was superior. CR/PR at Table II‐10.
70 CR at II‐16‐17, PR at II‐11. 71 CR at II‐16, PR at II‐11. 72 CR/PR at Table II‐2. The share of U.S. producers’ shipments to distributors ranged from ***
percent from 2016 to 2018 and the share of U.S. importers’ shipments of subject imports to distributors ranged from *** percent; in interim 2019 it was *** percent for U.S. producers’ shipments and *** percent for U.S. importers’ shipments of subject imports. Id. ***. CR at II‐5 n.10, PR at II‐3 n.10.
73 CR/PR at Table IV‐6. 74 CR at II‐25‐26, PR at II‐17. 75 CR at I‐23‐24 & n.54; PR at I‐19 & n.54. Most responding purchasers consider RMI
certification a very important purchasing factor. CR/PR at Table II‐8. 76 CR at II‐18, PR at II‐12 and CR/PR at Table II‐7. Ten firms reported that price was their most
important purchasing factor, ten firms reported it was quality, and three firms reported it was availability. Twelve firms reported that quality was their second most important purchasing factor, six (Continued...)
18
differing views on the importance of nonprice factors in purchasing decisions.77 There are only limited substitutes for steel racks, and demand for steel racks is relatively inelastic.78 Raw Materials and Other Considerations. Most steel racks are produced by roll‐forming slit hot‐rolled steel coil into uprights, braces, and beams, and a smaller share is produced from hot‐rolled structural steel shapes.79 Steel costs accounted for 90.5 percent of domestic producers’ raw material costs and, in turn, raw material costs accounted for 66.9 percent of U.S. producers’ cost of goods sold (“COGS”) in 2018.80 Based on the American Metal Market Midwest index, the cost of hot‐rolled steel increased overall during the POI, with average domestic prices increasing by *** percent from January 2016 to July 2018 before declining by *** percent from July 2018 to March 2019.81
Both the Coalition and UMH acknowledge that the duties of 25 percent ad valorem imposed in March 2018 on imported steel mill products pursuant to Section 232 of the Trade Expansion Act of 1962, as amended, were an important factor in the increased costs of hot‐rolled steel for the production of steel racks.82 Duties of 10 to 25 percent ad valorem also were placed on steel racks from China in 2018 or early 2019 pursuant to Section 301 of the Trade Act.83 Most responding importers reported that the Section 301 duties on steel racks increased their prices.84
(…Continued) firms reported it was price and six firms reported it was availability. Seven firms reported that price was their third most important purchasing factor, and six firms reported it was availability. Id.
The purchasing factors rated as very important by more than half of responding purchasers were quality meets industry standards, availability, delivery time, product consistency, reliability of supply, price, delivery terms, RMI certification, and discounts offered. CR/PR at Table II‐8.
77 Most U.S. producers reported that differences other than price were sometimes or never significant in comparing domestically produced steel racks and subject imports, while most importers reported that differences other than price were always or frequently significant in those comparisons; purchasers’ responses were more mixed with ten firms reporting that differences other than price were always or frequently significant, ten firms reported that they were sometimes significant and two firms reporting that they were never significant. CR/PR at Table II‐13.
78 CR at II‐15, II‐29, PR at II‐10, II‐19. Most responding firms reported that there are no substitutes for steel racks. CR at II‐15, PR at II‐10.
79 CR/PR at V‐1. 80 CR/PR at Table VI‐4 and CR/PR at V‐1. 81 CR/PR at V‐1 and Figure V‐1. 82 CR at II‐3, V‐3; PR at II‐1, V‐2. Transcript of Commission Hearing dated July 16, 2019 (“Tr.”) at
76 (Anderson); UMH Prehearing Brief at 22‐24. 83 Subject steel racks are commonly classified under HTS subheadings 7326.90.86, 9403.20.00,
and 9403.90.80; steel racks classified under these HTS subheadings became subject to an additional 10 percent Section 301 duty in September 2018 that was raised to 25 percent in May 2019 (Tranche 3). Other subject steel racks classifiable under HTS subheadings 7308.90.30, 7308.90.60 and 7308.90.95 became subject to the additional 25 percent Section 301 duties in August 2018 (Tranche 2). CR at I‐7, I‐17‐18; PR at I‐5, I‐14‐15.
84 CR at V‐3, PR at V‐2.
19
C. Volume of Subject Imports
Section 771(7)(C)(i) of the Tariff Act provides that the “Commission shall consider whether the volume of imports of the merchandise, or any increase in that volume, either in absolute terms or relative to production or consumption in the United States, is significant.”85
The volume of subject imports increased over the POI and these imports had a substantial presence in the U.S. market. The volume of subject imports increased by *** percent from 2016 to 2018.86 It increased from *** pounds in 2016 to *** pounds in 2017 to *** pounds in 2018, an overall increase of *** pounds.87 88 As the volume of subject imports grew, these imports also gained market share. Subject import market share increased by *** percentage points from 2016 to 2018, steadily increasing from *** percent in 2016 to *** percent in 2017 and *** percent in 2018.89 Subject imports gained market share entirely at the expense of the domestic industry.90
In light of the foregoing, we find that the volume of subject imports and the increase in the volume of subject imports are significant in both absolute terms and relative to consumption in the United States.
D. Price Effects of the Subject Imports
Section 771(7)(C)(ii) of the Tariff Act provides that, in evaluating the price effects of the subject imports, the Commission shall consider whether
(I) there has been significant price underselling by the imported merchandise as compared with the price of domestic like products of the United States, and
85 19 U.S.C. § 1677(7)(C)(i). 86 While subject import volume increased by *** percent from 2016 to 2018, apparent U.S.
consumption increased by *** percent. Subject import volume was *** percent lower in interim 2019 than in interim 2018. Apparent U.S. consumption was *** percent lower in interim 2019 than in interim 2018. CR/PR at Table C‐1.
87 CR/PR at Table IV‐2 and Table C‐1. The Commission issued importer questionnaires to 192 firms believed to be possible U.S. importers of subject steel racks, and received usable questionnaire responses from 17 importers ***. As previously stated, data on the quantity of U.S. imports from China are based on export data from six responding Chinese producers’ exports to the United States, which the Commission has determined to be the most comprehensive dataset with which to evaluate volume. CR at I‐5‐6, IV‐1; PR at I‐4, IV‐1.
88 Subject import volume was *** pounds in interim 2018 and *** pounds in interim 2019. CR/PR at Table IV‐2. We note that there were multiple factors affecting interim 2019 data, which only covered the first quarter of 2019. Specifically, Commerce’s preliminary CVD determination, which found margins in excess of 100 percent for multiple Chinese exporters, was issued in these investigations in December 2018; ***; the imposition of Section 232 duties; and additional Section 301 duties on steel racks from China were factors. Further, the fact that our subject import data is based on export data raises timing issues as to when shipments of subject imports were exported and when they were present in the U.S. market. Therefore, we find the interim 2019 data less instructive than the full year data in the POI, given the various factors affecting the data in this short period, including postpetition effects.
89 CR/PR at Table IV‐7 and Table C‐1. Subject import market share was *** percent in interim 2018 and *** percent in interim 2019. Id.
90 CR/PR at Table IV‐7 and Table C‐1.
20
II) the effect of imports of such merchandise otherwise depresses prices to a significant degree or prevents price increases, which otherwise would have occurred, to a significant degree.91 As previously discussed in section V.B.3 above, we find that there is a high degree of
substitutability between subject imports and the domestic like product and that price is an important factor in purchasing decisions for steel racks.
The Commission collected quarterly quantity (by weight) and f.o.b. pricing data for sales of four steel racks products shipped to unrelated U.S. customers during the POI.92 Eight U.S. producers and seven importers provided usable pricing data for sales of the requested products, although not all firms reported pricing for all products for all quarters.93 Pricing data reported by these firms accounted for approximately 7.5 percent of U.S. producers’ commercial U.S. shipments of steel racks and 9.9 percent of commercial U.S. shipments of subject imports in 2018.94
We have examined several sources of data in our underselling analysis. The pricing product data indicate that subject imports undersold the domestic like product in 20 out of 48 quarterly comparisons, at margins ranging between *** percent and *** percent, and an average underselling margin of 16.0 percent. The data also reflect that the subject imports oversold the domestic like product in 28 out of 48 quarterly comparisons, at margins ranging between *** percent and *** percent with an average overselling margin of 19.5 percent. Thus, subject imports undersold the domestic like product in 41.7 percent of the quarterly price comparisons and oversold the domestic like product in 58.3 percent of the comparisons. The data show that there were 7.5 million pounds of subject imports associated with instances of underselling and 12.2 million pounds of steel racks from China associated with instances of overselling.95
Our examination of the pricing data focuses particularly on the trends in the data regarding Product 1, which accounted for more than three quarters of the U.S. shipments of both subject imports and the domestic like product.96 The overselling by subject imports for Product 1 comparisons in 2016 and 2017 shifted to underselling in the last quarter of 2017 and
91 19 U.S.C. § 1677(7)(C)(ii). 92 CR at V‐7, PR at V‐5. The four pricing products are as follows.
Product 1: Beam, non‐galvanized, 16 gauge, 96” length, 4” face, 3 pins connection, 1 5/8’ step, RMI certified. Product 2: Beam, non‐galvanized, 16 gauge, 120” length, 5“ face, 4 pins connection, 1 5/8“ step, RMI certified. Product 3: Frame, non‐galvanized, 15 gauge, 3” X 1 5/8” posts, 42” x 120,” RMI certified. Product 4: Frame, non‐galvanized, 14 gauge, 3” x 3” posts, 42” x 192,” RMI certified.
CR at V‐7, PR at V‐5. Id. 93 CR at V‐7, PR at V‐5. 94 CR at V‐7‐8, PR at V‐5. 95 CR/PR at Table V‐8. Import prices in the pricing data varied widely by company, with some
importers’ sales prices consistently underselling the domestic like products and some importers’ sales prices frequently overselling them. CR at V‐19‐V‐20, PR at V‐11.
96 CR at V‐8, PR at V‐5.
21
throughout most of 2018 as the volume of subject imports increased.97 Similarly, the overall pricing data show mostly overselling by subject imports in 2016 and 2017 and predominant underselling in 2018.98 99
In contrast to the pricing data that reveal a mixed pattern of over‐ and underselling, other record information indicates that subject import prices were below prices for domestic steel racks. Purchasers confirmed that the domestic industry lost substantial sales to the subject imports due to their lower prices. Of the 26 purchasers responding to the Commission’s questionnaire regarding lost sales,100 14 reported that, since 2016, they had purchased subject imports instead of the domestic like product. Thirteen of these 14 purchasers reported that subject import prices were lower than prices for the domestic like product, and 12 of these purchasers reported that price was a primary reason for the decision to purchase the subject imports rather than the domestic like product.101 Nine purchasers estimated that they had purchased a total of *** pounds of subject imports for which price had been a primary reason for choosing subject imports over the domestic like product.102 Notably, the *** pounds of subject imports that purchasers reported buying instead of domestically produced racks because of lower prices is larger than the total quantity of subject imports covered in our price comparison data (19.7 million pounds).103 It constitutes *** percent of the total quantity of subject imports purchased by the responding purchasers reporting data in pounds (47.7 million pounds).104 Furthermore, *** pounds is equivalent to *** percent of the total volume of subject imports over the POI, and is equivalent to *** percent of the increase in subject imports from 2016 to 2018.105
Purchaser questionnaire responses are consistent with our lost sales data. A large majority of responding firms (16 out of 20) reported that subject imports were priced lower than the domestic like
97 CR/PR at Table V‐3. 98 By year, subject imports undersold the domestic like product in *** quarterly comparisons in
2016 (*** pounds), *** quarterly comparisons in 2017 (*** pounds, and *** quarterly comparisons in 2018 (*** pounds). Subject imports oversold the domestic like product in *** quarterly comparisons in 2016 (*** pounds), *** quarterly comparisons in 2017 (*** pounds), and *** quarterly comparisons in 2018 (***). CR/PR at Tables V‐3 to V‐6.
99 We note that there is wide variation in the data reported by importers for the same products, which may lessen the probative value of the data for evaluating subject import prices relative to prices of U.S.‐made steel racks. Some differences may reflect the degree to which an importer sold to distributors or rather acted as its own distributor and sold to end users of steel racks. ***. CR at V‐19‐20 & nn. 22‐23, PR at V‐11 & nn. 22‐23. ***. *** at questions II‐5a and III‐2a, EDIS Doc. No. 675266.
100 Twenty‐one responding purchasers reported purchasing 773 million pounds of steel racks from January 2016 to March 2019. Five purchasers were unable to provide purchase data in pounds and provided data by value. CR at V‐21, PR at V‐12.
101 CR at V‐21, PR at V‐12. CR/PR at Table V‐10. Of the 26 responding purchasers, four reported that U.S. producers had reduced prices in order to compete with lower‐priced subject imports at price reductions ranging from *** to *** percent. CR at V‐21, PR at V‐12 and CR/PR at Table V‐11.
102 CR/PR at Table V‐10. 103 CR/PR at Table V‐8 and Table V‐10. 104 CR/PR at Table V‐9a and Table V‐10. 105 CR/PR at Table IV‐7 and Table V‐10. UMH states that our lost sales data are open‐ended as
the questionnaires ask about sales “since January 1, 2016” and that respondents’ answers could include sales beyond the end of the POI. UMH Posthearing Brief, Response to Commission Questions at 27. We are unpersuaded by this argument as there was only one month between the end of the POI and the deadline for returning the questionnaire response (May 1, 2019).
22
product.106 UMH argues that purchasers’ perceptions of subject imports as lower priced may be because the imports generally contain less steel and therefore weigh less on a unit basis than the comparable domestic like product, which may affect price comparisons based on weight. UMH asserts that because steel racks are generally sold on a per‐unit basis rather than a per‐pound basis, the lighter imported product may be priced less as a unit than a unit of the heavier domestic product, although measured on a dollar per pound basis the opposite may be true.107 UMH indicated that on a dollar per unit basis, as opposed to the dollar per pound basis used in the Commission’s price comparisons, a rational purchaser might well consider subject imports lower in price than the domestic like product.108 This appears to confirm that purchasers consider subject imports to be lower priced than the domestic product.
Based on all of the data that we have examined in our underselling analysis, and given the high degree of substitutability of the domestic like product and the subject imports and the importance of price in purchasing decisions, we find that there has been significant underselling of the domestic like product by subject imports from China. This significant underselling enabled subject imports to gain sales and increase their market share at the expense of the domestic industry.
We have also considered price trends for the domestic like product and subject imports over the POI. Prices of the domestic like product and subject imports increased from January 2016 to March 2019, with the exception of subject import Pricing Product 3. During this time, domestic price increases for products 1 through 4 ranged from 15.6 to 26.0 percent and subject import price increases for products 1, 2, and 4 ranged from *** percent.109
We have further considered whether subject imports have prevented price increases which otherwise would have occurred to a significant degree. During the full years of the POI, the domestic industry’s COGS to net sales ratio increased from 81.0 percent in 2016 to 84.3 percent in 2017 and 85.7 percent in 2018.110 This occurred as apparent U.S. consumption steadily increased by *** percent. Although the industry was able to increase its average unit net sales value from 2016 to 2018 as it increased its prices, this increase was not sufficient to cover the increases in the industry’s total average unit COGS, resulting in increases in the COGS to net sales ratio.111 Although the industry’s increase in net sales value did not keep pace with total COGS, the industry was generally able to pass along most of its increase in raw material costs.112 Moreover, the domestic industry’s price of Pricing Product 1, its largest volume product, experienced an
106 CR/PR at Table II‐10. 107 We note that the Commission’s ability to evaluate this argument is limited because it was not
raised in UMH’s prehearing brief or at the Commission’s hearing. In any event, the argument suggests
that the underselling in the Commission’s pricing data may, if anything, be understated. UMH
Posthearing Brief at 6 and Exhibit 3, Declaration of Ryan Bartlett at 1, and Exhibit 4, Declaration of ***
and UMH Final Comments at 4. ***. Declaration of *** at 2. 108 UMH Posthearing Brief at 6; UMH Final Comments at 4. See also Coalition Final Comments at
5‐6. 109 CR/PR at Table V‐7 and Figure V‐6. 110 CR/PR at Table VI‐1. 111 CR/PR at Table VI‐1 and Table VI‐2. The domestic industry’s unit COGS increased by 20.5
percent from 2016 to 2018 as raw material costs increased, and the industry’s average unit net sales value increased by 13.8 percent. CR/PR at Table C‐1.
112 CR/PR at Table VI‐2 (for 2016 to 2018, AUVs for net sales and raw material costs both increased by $0.11 per pound).
23
increase of 23.1 percent from 2016 to 2018, which exceeded the industry’s increase in total COGS in that period.113 Given the domestic industry’s price increases, we do not find that subject imports prevented price increases which otherwise would have occurred to a significant degree.114 115
In sum, the subject imports significantly undersold the domestic like product and this underselling led to lost sales and a shift in market share away from the domestic industry and toward subject imports.116 We therefore find that the subject imports had significant price effects.
E. Impact of the Subject Imports117
Section 771(7)(C)(iii) of the Tariff Act provides that examining the impact of subject imports, the Commission “shall evaluate all relevant economic factors which have a bearing on the state of the industry.”118 These factors include output, sales, inventories, capacity utilization, market share,
113 CR/PR at Table V‐3 and Table C‐1. 114 CR/PR at Table VI‐1 and Table VI‐2. UMH has argued that the cost‐price squeeze experienced
by the domestic industry was due to the Section 232 duties rather than subject imports. UMH Prehearing Brief at 10‐11. Based on the full‐year financial data, the industry was generally able to pass along most of its raw material cost increases and, in any event, we are not relying on price suppression as the basis for our finding of significant price effects.
115 Commissioner Kearns finds that subject imports suppressed domestic prices for steel racks to a significant degree. He finds that market conditions were conducive to producers passing on higher costs to purchasers: consumption was growing, purchasers have no real alternative to steel racks for their storage needs, the U.S. price of the main hot‐rolled steel raw material input is visible to all market participants, and all U.S. producers were reliant on that same domestic market for their hot‐rolled steel. Despite these conditions, the 13.8 percent rise in the industry’s unit sales value from 2016 to 2018 was well below the 27.1 percent growth in unit raw material cost and the 20.5 percent growth in overall unit COGS over the same period. This disparity produced an increase of 4.8 percentage points in the industry’s ratio of COGS to net sales.
The Commission has found that subject imports significantly undersold domestic prices of steel racks, and that purchasers confirmed that they bought a substantial quantity of subject imports instead of domestic steel racks because of lower prices. Commissioner Kearns finds that, given conditions in the domestic market for steel racks, the growing volume of low‐priced subject imports likewise contributed to the domestic industry’s inability to raise prices to match rising costs.
116 The domestic industry’s market share declined by *** percentage points from 2016 to 2018. It was *** percentage points higher in interim 2019 than in interim 2018. CR/PR at Table C‐1.
117 The statute instructs the Commission to consider the “magnitude of the dumping margin” in an antidumping proceeding as part of its consideration of the impact of imports. 19 U.S.C. § 1677(7)(C)(iii)(V). In its final determination of sales at less value, Commerce found antidumping duty margins ranging from 18.06 to 144.5 percent for imports of steel racks from China. We take into account in our analysis the fact that Commerce has made final findings that all subject producers in China are selling subject imports in the United States at less than fair value. In addition to this consideration, our impact analysis has considered other factors affecting domestic prices. Our analysis of the significant price effects of subject imports, described in both the price effects discussion and below, is particularly probative to an assessment of the impact of the subject imports.
118 19 U.S.C. § 1677(7)(C)(iii); see also SAA at 851 and 885 (“In material injury determinations, the Commission considers, in addition to imports, other factors that may be contributing to overall (Continued...)
24
employment, wages, productivity, gross profits, net profits, operating profits, cash flow, return on investment, return on capital, ability to raise capital, ability to service debts, research and development, and factors affecting domestic prices. No single factor is dispositive and all relevant factors are considered “within the context of the business cycle and conditions of competition that are distinctive to the affected industry.” 119
The domestic industry’s output indicators either decreased or did not keep pace with the increase in apparent U.S. consumption from 2016 to 2018. Apparent U.S. consumption increased by *** percent and the domestic industry increased its production capacity by *** percent from 2016 to 2018 in anticipation of rising demand.120 In contrast to these increases, production and capacity utilization decreased by *** percent and *** percentage points, respectively.121 U.S. shipments increased by only *** percent from 2016 to 2018.122 The domestic industry’s market share declined steadily from *** percent in 2016 to *** percent in 2017 and *** percent in 2018, a decline of *** percentage points.123 The domestic industry’s end‐of‐period inventories declined by *** percent from 2016 to 2018.124
Trends in the domestic industry’s employment indicators were mixed from 2016 to 2018. The number of production‐related workers (“PRWs”) and hours worked increased by *** and *** percent, respectively. Wages paid increased by *** percent and hourly wages increased by *** percent. Productivity decreased by *** percent and unit labor costs increased by *** percent.125
(…Continued) injury. While these factors, in some cases, may account for the injury to the domestic industry, they also may demonstrate that an industry is facing difficulties from a variety of sources and is vulnerable to dumped or subsidized imports.”).
119 19 U.S.C. § 1677(7)(C)(iii). This provision was amended by the Trade Preferences Extension Act of 2015, Pub. L. 114‐27.
120 Coalition Prehearing Brief at 20. Domestic production capacity increased from *** pounds in 2016 to *** pounds in 2017 and *** pounds in 2018; it was *** pounds in interim 2018 and *** pounds in interim 2019. CR/PR at Table III‐4 and Table C‐1.
121 Domestic production decreased from *** pounds in 2016 to *** pounds in 2017 before increasing to *** pounds in 2018. It was *** pounds in interim 2018 and *** pounds in interim 2019. Capacity utilization was *** percent in 2016, *** percent in 2017, and *** percent in 2018; it was *** percent in interim 2018 and *** percent in interim 2019. CR/PR at Table III‐4. The domestic industry had unused production capacity throughout the POI.
122 The domestic industry’s U.S. shipments decreased from *** pounds in 2016 to *** pounds in 2017 and then increased to *** pounds in 2018; they were *** pounds in interim 2018 and *** pounds in interim 2019. CR/PR at Table III‐5, and Table C‐1.
123 The domestic industry’s market share was *** percent in interim 2018 and *** percent in interim 2019. CR/PR at Table IV‐7 and Table C‐1. Domestic producer *** states that it received additional orders in interim 2019 after the imposition of preliminary countervailing duties in December 2018. Coalition Prehearing Brief, Exhibit 10, ***.
124 CR/PR at Table III‐8 and Table C‐1. U.S. producers’ end‐of‐period inventories were *** pounds in 2016, *** pounds in 2017, and *** pounds in 2018; they were *** pounds in interim 2018 and *** pounds in interim 2019. Id.
125 CR/PR at Table III‐10 and Table C‐1. The industry’s number of PRWs were *** in in 2016, *** in 2017, and *** in 2018; the number of PRWs was *** in interim 2018 and *** in interim 2019. Total hours worked were *** hours in 2016 and *** hours in 2017 and 2018; the total hours worked were *** hours in interim 2018 and *** hours in interim 2019. Total wages paid were $*** in 2016, $*** in 2017, and $*** in 2018; total wages paid were $*** in interim 2018 and $*** in interim 2019. Hourly wages (Continued...)
25
Although the domestic industry’s total sales revenue increased over the POI, its profitability declined. Total net sales revenue increased by 14.4 percent from 2016 to 2018 while total COGS increased by 21.2 percent.126 The COGS to net sales value ratio increased from 81.0 percent in 2016 to 84.3 percent in 2017 and 85.7 percent in 2018.127 The domestic industry’s operating income declined over the POI; it was $54.0 million in 2016, $36.4 million in 2017, and $39.3 million in 2018. The domestic industry’s ratio of operating income to net sales was 7.0 percent in 2016, 4.7 percent in 2017, and 4.4 percent in 2018.128 Similarly, the industry’s net income declined absolutely and as a percentage of net sales.129 The domestic industry’s capital expenditures decreased over the POI; they were $*** in 2016, $*** in 2017, and $*** in 2018.130 Seven out of 10 domestic producers reported that subject imports had negative effects on their investments.131
We have considered the impact of subject imports on the domestic industry taking into account the conditions of competition in this market. We find that the significant and increasing volumes of low‐
(…Continued) (dollars per hour) were $*** in 2016, $*** in 2017, and $*** in 2018; they were $*** in interim 2018 and $*** in interim 2019. Productivity (pounds per hour) were *** pounds per hour in 2016, *** pounds per hour in 2017, and *** pounds per hour in 2018; they were *** pounds per hour in interim 2018 and *** pounds per hour in interim 2019. Unit labor costs (dollars per pound) were $*** in 2016, $*** in 2017, and $*** in 2018; they were $*** in interim 2018 and $*** in interim 2019. CR/PR at Table III‐10.
126 Total net sales revenue increased from $772.7 million in 2016 to $783.6 million in 2017 and to $884.3 million in 2018; it was $212.6 million in interim 2018 and $216.4 million in interim 2019. The average net sales unit value was $0.81 in 2016, $0.83 in 2017, $0.92 in 2018; it was $0.87 in interim 2018 and $0.95 in interim 2019. Total COGS increased from $625.6 million in 2016 to $660.7 million in 2017 and $758.1 million in 2018; it was $175.2 million in interim 2018 and $189.0 million in interim 2019. The average unit value of COGS increased from $0.66 in 2016 to $0.70 in 2017 and $0.79 in 2018; it was $0.72 in interim 2018 and $0.83 in interim 2019. CR/PR at Table VI‐1 and Table C‐1.
127 CR/PR at Table VI‐1. The COGS to net sales value ratio was 82.4 percent in interim 2018 and 87.3 percent in interim 2019. Id.
128 The domestic industry’s operating income was $17.9 million in interim 2018 and $6.7 million in interim 2019. Its ratio of operating income to net sales was 8.4 percent in interim 2018 and 3.1 percent in interim 2019. The domestic industry’s gross profit was $147.2 million in 2016, $122.9 million in 2017, and $126.1 million in 2018; it was $37.4 million in interim 2018 and $27.4 million in interim 2019. The domestic industry’s cash flow was $56.9 million in 2016, $40.5 million in 2017, and $47.9 million in 2018; it was $19.5 million in interim 2018 and $8.4 million in interim 2019. CR/PR at Table VI‐1.
129 The domestic industry’s net income was $44.4 million in 2016, $26.0 million in 2017, and $32.6 million in 2018; it was $15.1 million in interim 2018 and $4.1 million in interim 2019. Its net income as a percentage of net sales was 5.7 percent in 2016, 3.3 percent in 2017, and 3.7 percent in 2018; it was 7.1 percent in interim 2018 and 1.9 percent in interim 2019. CR/PR at Table VI‐1.
130 The domestic industry’s capital expenditures were $*** in interim 2018 and $*** in interim 2019. The domestic industry’s research and development expenses increased from $*** in 2016 to $*** in 2017 before decreasing to $*** in 2018; they were $*** in interim 2018 and *** in interim 2019. CR/PR at Table VI‐6. Total net assets for the domestic industry were $390.9 million in 2016, $396.3 million in 2017, and $414.6 million in 2018. The domestic industry’s operating return on assets was 13.8 percent in 2016, 9.2 percent in 2017, and 9.5 percent in 2018. CR/PR at Table VI‐7.
131 CR/PR at Table VI‐8 and Table VI‐9.
26
priced subject imports that were substitutable with the domestic like product took market share from the domestic industry from 2016 to 2018. The declines in domestic industry market share in turn led to lower production, capacity utilization, shipments, and sales than would have otherwise occurred given the growth in apparent U.S. consumption. Thus, the subject imports prevented the domestic industry from materially benefitting from the growth in apparent U.S. consumption. Because the domestic industry, despite having the ability to increase its production and shipments, lost sales and market share to the lower‐priced subject imports, it lost revenues it otherwise would have obtained. These lost revenues occurred at a time of rising costs when the per‐unit profitability of the industry was already decreasing and these additional lost revenues caused the profitability of the industry to further deteriorate. As a result of the significant volume of low‐priced subject imports, the domestic industry’s output and revenues were lower than they would have been otherwise.132 133
The evidence does not support UMH’s allegation that the domestic industry is performing well in terms of its capacity utilization, employment, and investments. As previously stated, the domestic industry’s capacity utilization declined from 2016 to 2018 notwithstanding the increase in apparent U.S. consumption. Although the industry’s PRWs increased overall, the number of PRWs declined between 2017 and 2018 despite continued growth in apparent U.S. consumption.134 As for its investments, the domestic industry’s capital investments declined by *** percent from 2016 to 2018 and seven out of ten domestic producers reported that subject imports had a negative effect on their investments.135
Similarly, UMH’s contention that there is no correlation between subject imports and any material injury to the domestic industry is not in accordance with the evidence. As subject imports increased from 2016 to 2018, the domestic industry lost substantial sales and market share, and its profitability declined.136 137
UMH also argues that the domestic industry lost sales and market share to subject imports for nonprice reasons. In particular, it contends that customers preferred the shorter lead times and the
132 Contrary to UMH’s allegation (UMH Posthearing Brief at 8 and Response to Commission
Questions at 32‐35), the accounting convention “apparently adopted by the U.S. industry” is based on the matching principle, which is one of the fundamental principles of GAAP accounting. Thus, a lag between when raw materials are purchased and when they are recognized is common in financial accounting.
133 Commissioner Kearns finds that the declining financial performance of the domestic industry was a direct result of the significant price suppression caused by subject imports. In particular, the data set out above indicate a 27.1 percent drop in operating income and 26.5 percent decline in net income from 2016 to 2018. The financial variance analysis shows that the reduced operating income was due to the growth in costs outpacing the increase in the value of sales. CR/PR at Table VI‐1 and Table VI‐5.
134 CR/PR at Table C‐1. 135 CR/PR at Table VI‐6, Table VI‐8, Table VI‐9, and Table C‐1. ***. CR/PR at Table VI‐6. 136 CR/PR at Table C‐1. We find no basis to exclude Interlake’s data from the domestic industry.
Interlake’s data were verified, revised, and found to be accurate by the Commission. 137 UMH’s pro forma purporting to show only a minor financial impact from subject imports’
gain in market share overlooks that the industry’s loss in market share and the lower production, capacity utilization, shipments, and sales than would otherwise have occurred given the growth in apparent U.S. consumption, are themselves indicators of the injury experienced by the domestic industry. Furthermore, we place little weight on the pro forma calculations; they assume that SG&A expenses increase proportionally with net sales, which is highly unlikely given that SG&A expenses are comprised of both fixed and variable expenses, and they were not prepared using the final financial data contained in the staff report. UMH Prehearing Brief at 19 and Exhibit 4; UMH Posthearing Brief at 11.
27
superior availability of subject imports over the domestic product, and that it would only require a few purchasers to prefer subject imports for these nonprice reasons to account for the market share shifts seen on the record.138 The facts, however, do not support UMH’s premise. The domestic industry uses its distributors to give its customers on‐time delivery.139 Most purchasers reported that the domestic product was comparable or superior to subject imports in terms of delivery times, and a plurality of purchasers reported that the domestic product and subject imports were comparable in terms of availability.140 Moreover, of the five purchasers that stated that the U.S. product was inferior to subject imports with respect to delivery time, *** increased (relatively modestly) its purchases of subject imports over the POI.141 Thus, to the extent that there are any differences between the lead times and availability of subject imports and the domestic product, those differences are not driving the purchasing decisions for subject imports.
We also disagree with UMH’s allegation that steel racks with welded frames produced by the domestic industry do not compete directly with the subject imports, which have bolted frames.142 These products are highly substitutable and compete directly with each other in the U.S. market. Producers, importers, and purchasers indicated that the U.S. and Chinese steel racks are always, frequently, or sometimes interchangeable.143
We have considered whether there are other factors that may have had an impact on the domestic industry during the POI to ensure that we are not attributing injury from such other factors to the subject imports. Nonsubject imports, most of which were from Mexico, had a more stable presence in the U.S. market over the POI than the subject imports; it was the subject imports (not nonsubject imports) that gained most of the market share from the domestic industry from 2016 to 2018.144 Moreover, nonsubject imports from Mexico were higher priced than subject imports both in terms of the number of comparisons and the quantity of steel racks reported.145 Thus, we find that nonsubject imports do not explain the loss of sales and market share shift experienced by the domestic industry that we have attributed to subject imports.
We find that the significant and increasing volume of lower‐priced subject imports took sales and market share from the domestic industry. The declines in domestic industry market share in turn led to lower production, capacity utilization, shipments, and sales than would have otherwise occurred given the growth in apparent U.S. consumption. We consequently determine that subject imports of steel racks from China have adversely impacted the domestic industry.
V. Conclusion
For the reasons stated above, we determine that an industry in the United States is materially injured by reason of subject imports of steel racks from China that are sold in the United States at less than fair value and are subsidized by the government of China.
138 UMH Posthearing Brief at 3‐5. 139 Tr. at 38‐39. 140 CR/PR at Table II‐10. 141 Purchaser Questionnaire Responses of ***. 142 UMH Final Comments at 2. 143 CR/PR at Table II‐11; see also Coalition Posthearing Brief at 2‐3. 144 CR/PR at Table IV‐7. 145 CR/PR at Table D‐4.

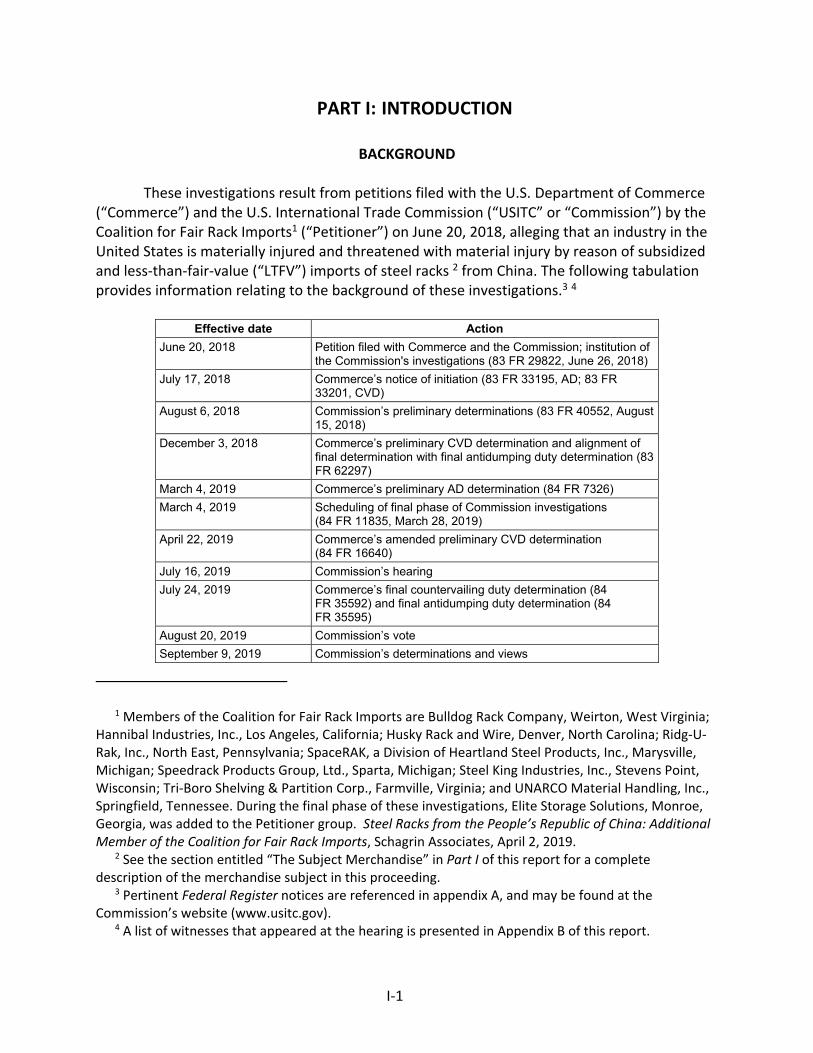
I‐1
PART I: INTRODUCTION
BACKGROUND
These investigations result from petitions filed with the U.S. Department of Commerce (“Commerce”) and the U.S. International Trade Commission (“USITC” or “Commission”) by the Coalition for Fair Rack Imports1 (“Petitioner”) on June 20, 2018, alleging that an industry in the United States is materially injured and threatened with material injury by reason of subsidized and less‐than‐fair‐value (“LTFV”) imports of steel racks 2 from China. The following tabulation provides information relating to the background of these investigations.3 4
Effective date Action
June 20, 2018 Petition filed with Commerce and the Commission; institution of the Commission's investigations (83 FR 29822, June 26, 2018)
July 17, 2018 Commerce’s notice of initiation (83 FR 33195, AD; 83 FR 33201, CVD)
August 6, 2018 Commission’s preliminary determinations (83 FR 40552, August 15, 2018)
December 3, 2018 Commerce’s preliminary CVD determination and alignment of final determination with final antidumping duty determination (83 FR 62297)
March 4, 2019 Commerce’s preliminary AD determination (84 FR 7326)
March 4, 2019 Scheduling of final phase of Commission investigations (84 FR 11835, March 28, 2019)
April 22, 2019 Commerce’s amended preliminary CVD determination (84 FR 16640)
July 16, 2019 Commission’s hearing
July 24, 2019 Commerce’s final countervailing duty determination (84 FR 35592) and final antidumping duty determination (84 FR 35595)
August 20, 2019 Commission’s vote
September 9, 2019 Commission’s determinations and views
1 Members of the Coalition for Fair Rack Imports are Bulldog Rack Company, Weirton, West Virginia; Hannibal Industries, Inc., Los Angeles, California; Husky Rack and Wire, Denver, North Carolina; Ridg‐U‐Rak, Inc., North East, Pennsylvania; SpaceRAK, a Division of Heartland Steel Products, Inc., Marysville, Michigan; Speedrack Products Group, Ltd., Sparta, Michigan; Steel King Industries, Inc., Stevens Point, Wisconsin; Tri‐Boro Shelving & Partition Corp., Farmville, Virginia; and UNARCO Material Handling, Inc., Springfield, Tennessee. During the final phase of these investigations, Elite Storage Solutions, Monroe, Georgia, was added to the Petitioner group. Steel Racks from the People’s Republic of China: Additional Member of the Coalition for Fair Rack Imports, Schagrin Associates, April 2, 2019.
2 See the section entitled “The Subject Merchandise” in Part I of this report for a complete description of the merchandise subject in this proceeding.
3 Pertinent Federal Register notices are referenced in appendix A, and may be found at the Commission’s website (www.usitc.gov).
4 A list of witnesses that appeared at the hearing is presented in Appendix B of this report.
I‐2
STATUTORY CRITERIA AND ORGANIZATION OF THE REPORT
Statutory criteria
Section 771(7)(B) of the Tariff Act of 1930 (the “Act”) (19 U.S.C. § 1677(7)(B)) provides that in making its determinations of injury to an industry in the United States, the Commission‐‐
shall consider (I) the volume of imports of the subject merchandise, (II) the effect of imports of that merchandise on prices in the United States for domestic like products, and (III) the impact of imports of such merchandise on domestic producers of domestic like products, but only in the context of production operations within the United States; and. . . may consider such other economic factors as are relevant to the determination regarding whether there is material injury by reason of imports.
Section 771(7)(C) of the Act (19 U.S.C. § 1677(7)(C)) further provides that‐‐5
In evaluating the volume of imports of merchandise, the Commission shall consider whether the volume of imports of the merchandise, or any increase in that volume, either in absolute terms or relative to production or consumption in the United States is significant.. . .In evaluating the effect of imports of such merchandise on prices, the Commission shall consider whether. . .(I) there has been significant price underselling by the imported merchandise as compared with the price of domestic like products of the United States, and (II) the effect of imports of such merchandise otherwise depresses prices to a significant degree or prevents price increases, which otherwise would have occurred, to a significant degree.. . . In examining the impact required to be considered under subparagraph (B)(i)(III), the Commission shall evaluate (within the context of the business cycle and conditions of competition that are
5 Amended by PL 114‐27 (as signed, June 29, 2015), Trade Preferences Extension Act of 2015.
I‐3
distinctive to the affected industry) all relevant economic factors which have a bearing on the state of the industry in the United States, including, but not limited to. . . (I) actual and potential decline in output, sales, market share, gross profits, operating profits, net profits, ability to service debt, productivity, return on investments, return on assets, and utilization of capacity, (II) factors affecting domestic prices, (III) actual and potential negative effects on cash flow, inventories, employment, wages, growth, ability to raise capital, and investment, (IV) actual and potential negative effects on the existing development and production efforts of the domestic industry, including efforts to develop a derivative or more advanced version of the domestic like product, and (V) in {an antidumping investigation}, the magnitude of the margin of dumping.
In addition, Section 771(7)(J) of the Act (19 U.S.C. § 1677(7)(J)) provides that—6 (J) EFFECT OF PROFITABILITY.—The Commission may not determine that there is no material injury or threat of material injury to an industry in the United States merely because that industry is profitable or because the performance of that industry has recently improved.
Organization of report
Part I of this report presents information on the subject merchandise, subsidy and dumping margins, and domestic like product. Part II of this report presents information on conditions of competition and other relevant economic factors. Part III presents information on the condition of the U.S. industry, including data on capacity, production, shipments, inventories, and employment. Parts IV and V present the volume of subject imports and pricing of domestic and imported products, respectively. Part VI presents information on the financial experience of U.S. producers. Part VII presents the statutory requirements and information obtained for use in the Commission’s consideration of the question of threat of material injury as well as information regarding nonsubject countries.
MARKET SUMMARY
Steel racks are generally used for storage in facilities such as warehouses, fulfillment and distribution centers, big‐box retail stores, and manufacturing facilities. The leading U.S. producers of steel racks are ***, while leading producers of steel racks in China include Nanjing Huade Storage Equipment Manufacturing Co., Ltd (“Huade”), Jiangsu Kingmore Storage Equipment Manufacturing Co., Ltd (“Kingmore”), and Nanjing Inform Storage Equipment
6 Amended by PL 114‐27 (as signed, June 29, 2015), Trade Preferences Extension Act of 2015.
I‐4
(Group) Co., Ltd. (“Inform Storage”). The leading U.S. importers of steel racks from China are ***. Leading importers of steel racks from nonsubject countries (primarily Mexico, and also Poland, Germany, Malaysia, and Spain) include ***. U.S. purchasers of steel racks consist of a combination of distributors, resellers, and logistics handling companies, as well as end users that make direct purchases for storage system requirements in warehouses, distribution centers, or other facilities. Leading purchasers of steel racks include distributors *** and retailers ***.
Apparent U.S. consumption of steel racks totaled approximately *** ($***) in 2018. Currently, 12 firms are known to produce steel racks in the United States.7 U.S. producers’ U.S. shipments of steel racks totaled *** in 2018, and accounted for *** percent of apparent U.S. consumption by quantity and *** percent by value. U.S. imports from China totaled *** in 2018 and accounted for *** percent of apparent U.S. consumption by quantity and *** percent by value. U.S. imports from nonsubject sources totaled *** in 2018 and accounted for *** percent of apparent U.S. consumption by quantity and *** percent by value.
SUMMARY DATA AND DATA SOURCES
A summary of data collected in these investigations is presented in appendix C, table C‐1. Except as noted, U.S. industry data are based on questionnaire responses of eleven firms that accounted for the majority of U.S. production of steel racks during 2018.8 Data on U.S. imports are based on questionnaire responses of 17 U.S. importers, six Chinese producers of steel racks, and ***.9 Steel racks enter the U.S. under several basket categories which limits the usefulness of official import statistics. Data on the quantity of U.S. imports of steel racks from China are based on export data from six responding Chinese producers’ exports to the United States.10 Data on the value of U.S. imports of steel racks from China are derived from the average unit
7 Seventeen firms were cited in the petition as potential producers of steel racks, ten of which provided usable responses. Five firms failed to respond with questionnaires. One firm *** provided a certification that it does not manufacture in‐scope product. One firm *** provided a questionnaire that was not usable. Eight more firms were identified as potential producers of steel racks based on questionnaire responses, four of which provided certification that they do not manufacture in‐scope product and four of which failed to respond with questionnaires. One firm, *** provided a partial response via email with estimates of certain data.
8 Domestic producer *** provided a questionnaire with unusable data, however, responses to certain narrative questions were included in the staff report. Domestic producer *** provided a partial response via email with estimates of certain data that were incorporated in report tables as noted.
9 *** did not provide a usable importer questionnaire response but provided via email estimates of its import quantities and values for imports from *** during the period of investigations. As discussed further below, data for ***’s imports are derived from *** under HTS statistical reporting numbers 7308.90.6000 and 7308.90.9590, accessed July 24, 2018.
10 Commission staff used data from the foreign producer questionnaires to calculate subject import volume rather than the import data contained in the responses to the importer questionnaires because it provided the most comprehensive dataset in terms of volume.
I‐5
values (“AUVs”) of responding U.S. importers’ imports of steel racks from China.11 U.S. import data from nonsubject sources are based on importer questionnaire responses from responding U.S. importers and ***.12 According to estimates requested of the responding Chinese producers, the production of steel racks in China reported in the questionnaires accounted for approximately *** percent of overall production of steel racks in China and *** percent of total China exports of steel racks to the United States. Data on the quantity of imports from China received from U.S. importer questionnaires accounted for *** percent of responding Chinese producers’ reported exports to the United States and *** percent of responding Chinese producers’ total estimated exports from China to the United States from 2016 to 2018. Previous and related investigations
Steel racks have not been the subject of any prior countervailing and/or antidumping duty investigations in the United States. As discussed further below, in 2018, Section 232 tariffs on aluminum and steel and Section 301 tariffs on goods from China entered into effect.
Section 301 proceedings
Following the investigations under Section 301 of the Trade Act of 1974, by the Office of the United States Trade Representative (“USTR”), into “China’s acts, policies, and practices related to technology transfer, intellectual property, and innovation,” steel racks were included among the USTR’s second enumeration of products originating from China that became subject to additional 25 percent ad valorem duties in August 2018;13 and its third enumeration of such products that became subject to additional 10 percent ad valorem duties in September 2018 that were subsequently escalated to 25 percent in May 2019.14 For further details of the applicability and timing of these ad valorem duty rates for steel racks, see the “Section 301 tariff treatment” section below.
Section 232 presidential proclamations
On the advice of the Secretary of Commerce, the President issued Proclamation 9705 on Adjusting Imports of Steel into the United States under Section 232 of the Trade Expansion Act of 1962, as amended (19 U.S.C. 1862). Steel mill products, including those that are the raw materials for manufacturing steel racks, were included in the enumeration of iron and steel articles that became subject to the additional 25 percent national‐security import duties since
11 Foreign producers’ export quantities to the United States were multiplied by the average unit values of U.S. importers’ U.S. imports.
12 *** imported nonsubject imports from *** and provided estimates of its imports from *** via email. However, Commission staff used *** rather than the data it provided because *** indicated that its submitted data were estimates.
13 Notice of Action Pursuant to Section 301: China’s Acts, Policies, and Practices Related to Technology Transfer, Intellectual Property, and Innovation, 83 FR 40823, August 16, 2018.
14 Notice of Modification of Section 301 Action: China’s Acts, Policies, and Practices Related to Technology Transfer, Intellectual Property, and Innovation, 83 FR 47974, September 21, 2018.
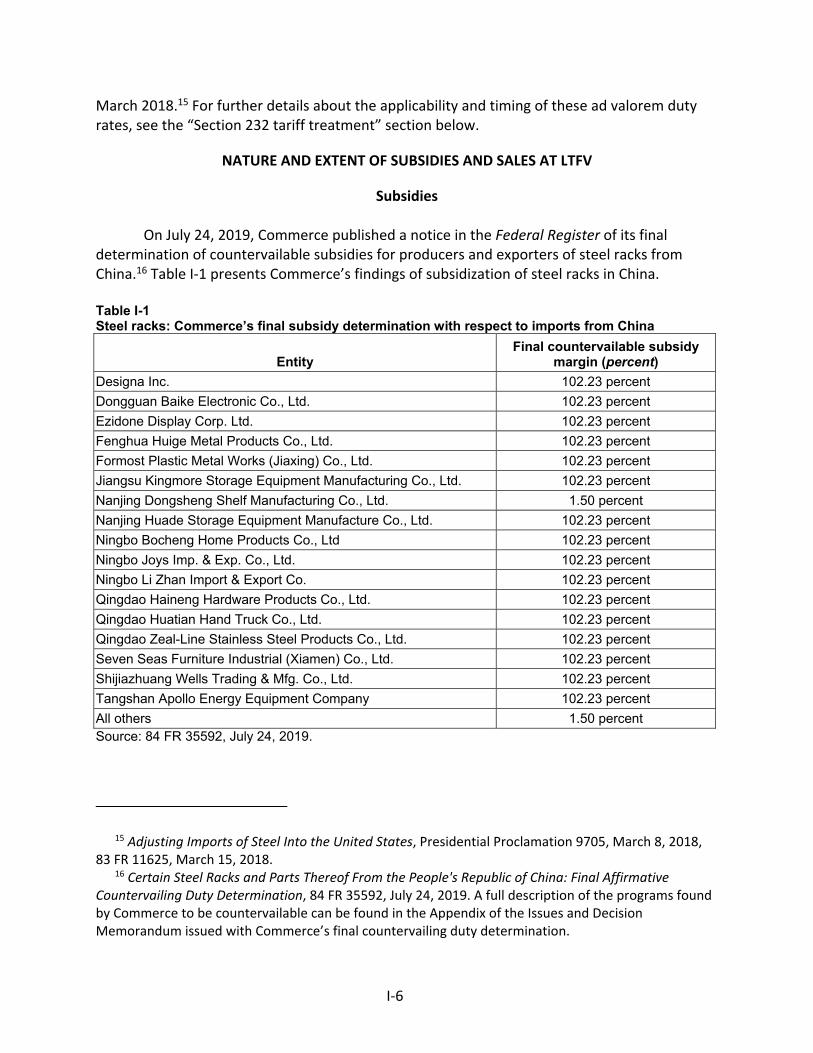
I‐6
March 2018.15 For further details about the applicability and timing of these ad valorem duty rates, see the “Section 232 tariff treatment” section below.
NATURE AND EXTENT OF SUBSIDIES AND SALES AT LTFV
Subsidies
On July 24, 2019, Commerce published a notice in the Federal Register of its final determination of countervailable subsidies for producers and exporters of steel racks from China.16 Table I‐1 presents Commerce’s findings of subsidization of steel racks in China.
Table I-1 Steel racks: Commerce’s final subsidy determination with respect to imports from China
Entity Final countervailable subsidy
margin (percent)
Designa Inc. 102.23 percent
Dongguan Baike Electronic Co., Ltd. 102.23 percent
Ezidone Display Corp. Ltd. 102.23 percent
Fenghua Huige Metal Products Co., Ltd. 102.23 percent
Formost Plastic Metal Works (Jiaxing) Co., Ltd. 102.23 percent
Jiangsu Kingmore Storage Equipment Manufacturing Co., Ltd. 102.23 percent
Nanjing Dongsheng Shelf Manufacturing Co., Ltd. 1.50 percent
Nanjing Huade Storage Equipment Manufacture Co., Ltd. 102.23 percent
Ningbo Bocheng Home Products Co., Ltd 102.23 percent
Ningbo Joys Imp. & Exp. Co., Ltd. 102.23 percent
Ningbo Li Zhan Import & Export Co. 102.23 percent
Qingdao Haineng Hardware Products Co., Ltd. 102.23 percent
Qingdao Huatian Hand Truck Co., Ltd. 102.23 percent
Qingdao Zeal-Line Stainless Steel Products Co., Ltd. 102.23 percent
Seven Seas Furniture Industrial (Xiamen) Co., Ltd. 102.23 percent
Shijiazhuang Wells Trading & Mfg. Co., Ltd. 102.23 percent
Tangshan Apollo Energy Equipment Company 102.23 percent
All others 1.50 percent Source: 84 FR 35592, July 24, 2019.
15 Adjusting Imports of Steel Into the United States, Presidential Proclamation 9705, March 8, 2018, 83 FR 11625, March 15, 2018.
16 Certain Steel Racks and Parts Thereof From the People's Republic of China: Final Affirmative Countervailing Duty Determination, 84 FR 35592, July 24, 2019. A full description of the programs found by Commerce to be countervailable can be found in the Appendix of the Issues and Decision Memorandum issued with Commerce’s final countervailing duty determination.
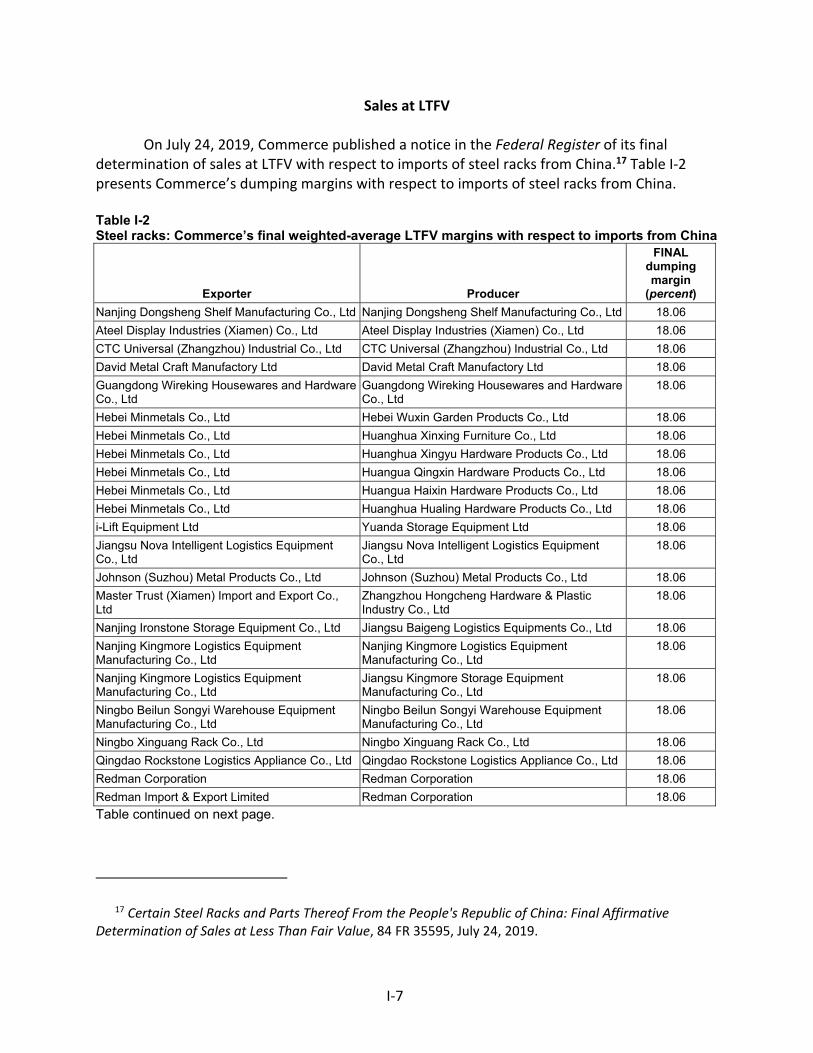
I‐7
Sales at LTFV
On July 24, 2019, Commerce published a notice in the Federal Register of its final determination of sales at LTFV with respect to imports of steel racks from China.17 Table I‐2 presents Commerce’s dumping margins with respect to imports of steel racks from China.
Table I-2 Steel racks: Commerce’s final weighted-average LTFV margins with respect to imports from China
Exporter Producer
FINAL dumping margin
(percent)
Nanjing Dongsheng Shelf Manufacturing Co., Ltd Nanjing Dongsheng Shelf Manufacturing Co., Ltd 18.06
Ateel Display Industries (Xiamen) Co., Ltd Ateel Display Industries (Xiamen) Co., Ltd 18.06
CTC Universal (Zhangzhou) Industrial Co., Ltd CTC Universal (Zhangzhou) Industrial Co., Ltd 18.06
David Metal Craft Manufactory Ltd David Metal Craft Manufactory Ltd 18.06
Guangdong Wireking Housewares and Hardware Co., Ltd
Guangdong Wireking Housewares and Hardware Co., Ltd
18.06
Hebei Minmetals Co., Ltd Hebei Wuxin Garden Products Co., Ltd 18.06
Hebei Minmetals Co., Ltd Huanghua Xinxing Furniture Co., Ltd 18.06
Hebei Minmetals Co., Ltd Huanghua Xingyu Hardware Products Co., Ltd 18.06
Hebei Minmetals Co., Ltd Huangua Qingxin Hardware Products Co., Ltd 18.06
Hebei Minmetals Co., Ltd Huangua Haixin Hardware Products Co., Ltd 18.06
Hebei Minmetals Co., Ltd Huanghua Hualing Hardware Products Co., Ltd 18.06
i-Lift Equipment Ltd Yuanda Storage Equipment Ltd 18.06
Jiangsu Nova Intelligent Logistics Equipment Co., Ltd
Jiangsu Nova Intelligent Logistics Equipment Co., Ltd
18.06
Johnson (Suzhou) Metal Products Co., Ltd Johnson (Suzhou) Metal Products Co., Ltd 18.06
Master Trust (Xiamen) Import and Export Co., Ltd
Zhangzhou Hongcheng Hardware & Plastic Industry Co., Ltd
18.06
Nanjing Ironstone Storage Equipment Co., Ltd Jiangsu Baigeng Logistics Equipments Co., Ltd 18.06
Nanjing Kingmore Logistics Equipment Manufacturing Co., Ltd
Nanjing Kingmore Logistics Equipment Manufacturing Co., Ltd
18.06
Nanjing Kingmore Logistics Equipment Manufacturing Co., Ltd
Jiangsu Kingmore Storage Equipment Manufacturing Co., Ltd
18.06
Ningbo Beilun Songyi Warehouse Equipment Manufacturing Co., Ltd
Ningbo Beilun Songyi Warehouse Equipment Manufacturing Co., Ltd
18.06
Ningbo Xinguang Rack Co., Ltd Ningbo Xinguang Rack Co., Ltd 18.06
Qingdao Rockstone Logistics Appliance Co., Ltd Qingdao Rockstone Logistics Appliance Co., Ltd 18.06
Redman Corporation Redman Corporation 18.06
Redman Import & Export Limited Redman Corporation 18.06
Table continued on next page.
17 Certain Steel Racks and Parts Thereof From the People's Republic of China: Final Affirmative Determination of Sales at Less Than Fair Value, 84 FR 35595, July 24, 2019.
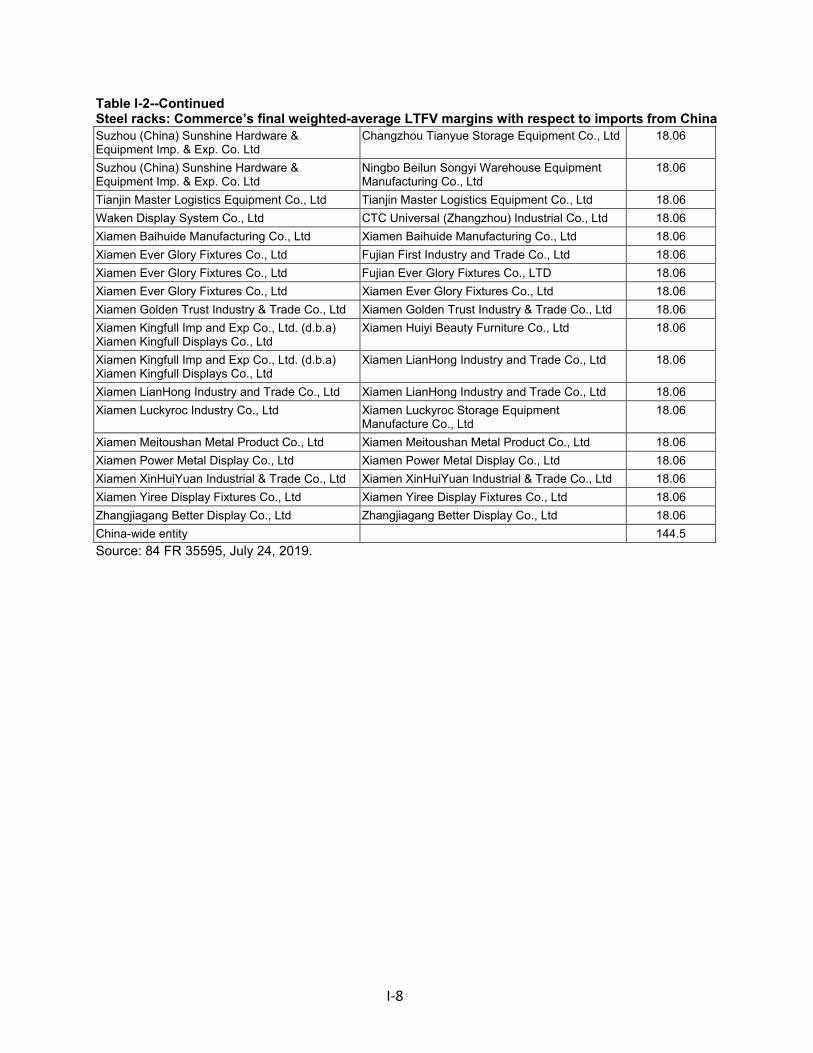
I‐8
Table I-2--Continued Steel racks: Commerce’s final weighted-average LTFV margins with respect to imports from China Suzhou (China) Sunshine Hardware & Equipment Imp. & Exp. Co. Ltd
Changzhou Tianyue Storage Equipment Co., Ltd 18.06
Suzhou (China) Sunshine Hardware & Equipment Imp. & Exp. Co. Ltd
Ningbo Beilun Songyi Warehouse Equipment Manufacturing Co., Ltd
18.06
Tianjin Master Logistics Equipment Co., Ltd Tianjin Master Logistics Equipment Co., Ltd 18.06
Waken Display System Co., Ltd CTC Universal (Zhangzhou) Industrial Co., Ltd 18.06
Xiamen Baihuide Manufacturing Co., Ltd Xiamen Baihuide Manufacturing Co., Ltd 18.06
Xiamen Ever Glory Fixtures Co., Ltd Fujian First Industry and Trade Co., Ltd 18.06
Xiamen Ever Glory Fixtures Co., Ltd Fujian Ever Glory Fixtures Co., LTD 18.06
Xiamen Ever Glory Fixtures Co., Ltd Xiamen Ever Glory Fixtures Co., Ltd 18.06
Xiamen Golden Trust Industry & Trade Co., Ltd Xiamen Golden Trust Industry & Trade Co., Ltd 18.06
Xiamen Kingfull Imp and Exp Co., Ltd. (d.b.a) Xiamen Kingfull Displays Co., Ltd
Xiamen Huiyi Beauty Furniture Co., Ltd
18.06
Xiamen Kingfull Imp and Exp Co., Ltd. (d.b.a) Xiamen Kingfull Displays Co., Ltd
Xiamen LianHong Industry and Trade Co., Ltd 18.06
Xiamen LianHong Industry and Trade Co., Ltd Xiamen LianHong Industry and Trade Co., Ltd 18.06
Xiamen Luckyroc Industry Co., Ltd Xiamen Luckyroc Storage Equipment Manufacture Co., Ltd
18.06
Xiamen Meitoushan Metal Product Co., Ltd Xiamen Meitoushan Metal Product Co., Ltd 18.06
Xiamen Power Metal Display Co., Ltd Xiamen Power Metal Display Co., Ltd 18.06
Xiamen XinHuiYuan Industrial & Trade Co., Ltd Xiamen XinHuiYuan Industrial & Trade Co., Ltd 18.06
Xiamen Yiree Display Fixtures Co., Ltd Xiamen Yiree Display Fixtures Co., Ltd 18.06
Zhangjiagang Better Display Co., Ltd Zhangjiagang Better Display Co., Ltd 18.06
China-wide entity 144.5
Source: 84 FR 35595, July 24, 2019.
I‐9
THE SUBJECT MERCHANDISE
Commerce’s scope
In the current proceeding, Commerce has defined the scope as follows:18
The merchandise covered by this investigation is steel racks and parts thereof, assembled, to any extent, or unassembled, including but not limited to, vertical components (e.g., uprights, posts, or columns), horizontal or diagonal components (e.g., arms or beams), braces, frames, locking devices (e.g., end plates and beam connectors), and accessories (including, but not limited to, rails, skid channels, skid rails, drum/coil beds, fork clearance bars, pallet supports, row spacers, and wall ties). Subject steel racks and parts thereof are made of steel, including, but not limited to, cold and/or hot‐formed steel, regardless of the type of steel used to produce the components and may, or may not, include locking tabs, slots, or bolted, clamped, or welded connections. Subject steel racks have the following physical characteristics: (1) Each steel vertical and horizontal load bearing member (e.g., arms, beams, posts, and columns) is composed of steel that is at least 0.044 inches thick; (2) Each steel vertical and horizontal load bearing member (e.g., arms, beams, posts, and columns) is composed of steel that has a yield strength equal to or greater than 36,000 pounds per square inch; (3) The width of each steel vertical load bearing member (e.g., posts and columns) exceeds two inches; and (4) The overall depth of each steel roll‐formed horizontal load bearing member (e.g., beams) exceeds two inches. In the case of steel horizontal load bearing members other than roll‐formed (e.g., structural beams, Z‐beams, or cantilever arms), only the criteria in subparagraphs (1) and (2) apply to these horizontal load
18 Certain Steel Racks and Parts Thereof From the People's Republic of China: Final Affirmative Countervailing Duty Determination, 84 FR 35592, July 24, 2019; Certain Steel Racks and Parts Thereof From the People's Republic of China: Final Affirmative Determination of Sales at Less Than Fair Value, 84 FR 35595, July 24, 2019.
I‐10
bearing members. The depth limitation in subparagraph (4) does not apply to steel horizontal load bearing members that are not roll‐formed. Steel rack components can be assembled into structures of various dimensions and configurations by welding, bolting, clipping, or with the use of devices such as clips, end plates, and beam connectors, including, but not limited to the following configurations: (1) Racks with upright frames perpendicular to the aisles that are independently adjustable, with positive‐locking beams parallel to the aisle spanning the upright frames with braces; and (2) cantilever racks with vertical components parallel to the aisle and cantilever beams or arms connected to the vertical components perpendicular to the aisle. Steel racks may be referred to as pallet racks, storage racks, stacker racks, retail racks, pick modules, selective racks, or cantilever racks and may incorporate moving components and be referred to as pallet‐flow racks, carton‐flow racks, push‐back racks, movable‐shelf racks, drive‐in racks, and drive‐through racks. While steel racks may be made to ANSI MH16.l or ANSI MH16.3 standards, all steel racks and parts thereof meeting the description set out herein are covered by the scope of this investigation, whether or not produced according to a particular standard. The scope includes all steel racks and parts thereof meeting the description above, regardless of (1) other dimensions, weight, or load rating; (2) vertical components or frame type (including structural, roll‐form, or other); (3) horizontal support or beam/brace type (including but not limited to structural, roll‐form, slotted, unslotted, Z‐beam, C‐beam, L‐beam, step beam, and cantilever beam); (4) number of supports; (5) number of levels; (6) surface coating, if any (including but not limited to paint, epoxy, powder coating, zinc, or other metallic coatings); (7) rack shape (including but not limited to rectangular, square, corner, and cantilever);
I‐11
(8) the method by which the vertical and horizontal supports connect (including but not limited to locking tabs or slots, bolting, clamping, and welding); and (9) whether or not the steel rack has moving components (including but not limited to rails, wheels, rollers, tracks, channels, carts, and conveyors). Subject merchandise includes merchandise matching the above description that has been finished or packaged in a third country. Finishing includes, but is not limited to, coating, painting, or assembly, including attaching the merchandise to another product, or any other finishing or assembly operation that would not remove the merchandise from the scope of the investigation if performed in the country of manufacture of the steel racks and parts thereof. Packaging includes packaging the merchandise with or without another product or any other packaging operation that would not remove the merchandise from the scope of the investigation if performed in the country of manufacture of the steel racks and parts thereof. Steel racks and parts thereof are included in the scope of this investigation whether or not imported attached to, or included with, other parts or accessories such as wire decking, nuts, and bolts. If steel racks and parts thereof are imported attached to, or included with, such non‐subject merchandise, only the steel racks and parts thereof are included in the scope. The scope of this investigation does not cover: (1) Decks, i.e., shelving that sits on or fits into the horizontal supports to provide the horizontal storage surface of the steel racks; (2) wire shelving units, i.e., units made from wire that incorporate both a wire deck and wire horizontal supports (taking the place of the horizontal beams and braces) into a single piece with tubular collars that slide over the posts and onto plastic sleeves snapped on the posts to create a finished unit; (3) pins, nuts, bolts, washers, and clips used as connecting devices; and (4) non‐steel components. Specifically excluded from the scope of this investigation are any products covered by Commerce's existing antidumping and countervailing duty orders on boltless steel shelving units prepackaged for sale from the People's Republic of China. See Boltless Steel Shelving Units Prepackaged for Sale From the People's Republic of China: Antidumping Duty Order, 80 FR 63,741 (October 21, 2017); Boltless Steel Shelving Units Prepackaged for Sale From the People's Republic of China: Amended Final Affirmative
I‐12
Countervailing Duty Determination and Countervailing Duty Order, 80 FR 63,745 (October 21, 2017). Also excluded from the scope of this investigation are bulk‐packed parts or components of boltless steel shelving units that were specifically excluded from the scope of the Boltless Steel Shelving Orders because such bulk‐packed parts or components do not contain the steel vertical supports (i.e., uprights and posts) and steel horizontal supports (i.e., beams, braces) packaged together for assembly into a completed boltless steel shelving unit. Such excluded components of boltless steel shelving are defined as: (1) Boltless horizontal supports (beams, braces) that have each of the following characteristics: (a) A length of 95 inches or less, (b) made from steel that has a thickness of 0.068 inches or less, and (c) a weight capacity that does not exceed 2500 lbs per pair of beams for beams that are 78″ or shorter, a weight capacity that does not exceed 2200 lbs per pair of beams for beams that are over 78″ long but not longer than 90″, and/or a weight capacity that does not exceed 1800 lbs per pair of beams for beams that are longer than 90″; (2) shelf supports that mate with the aforementioned horizontal supports; and (3) boltless vertical supports (upright welded frames and posts) that have each of the following characteristics: (a) A length of 95 inches or less, (b) with no face that exceeds 2.90 inches wide, and (c) made from steel that has a thickness of 0.065 inches or less. Excluded from the scope of this investigation are: (1) Wall‐mounted shelving and racks, defined as shelving and racks that suspend all of the load from the wall, and do not stand on, or transfer load to, the floor; (2) ceiling‐mounted shelving and racks, defined as shelving and racks that suspend all of the load from the ceiling and do not stand on, or transfer load to, the floor; and (3) wall/ceiling mounted shelving and racks, defined as shelving and racks that suspend the load from the ceiling and the wall and do not stand on, or transfer load to, the floor. The addition of a wall or ceiling bracket or other device to attach otherwise subject merchandise to a wall or ceiling does not meet the terms of this exclusion. Also excluded from the scope of this investigation is scaffolding that complies with ANSI/ASSE A10.8—2011—Scaffolding Safety Requirements, CAN/CSA S269.2‐M87 (Reaffirmed 2003)—Access Scaffolding for
I‐13
Construction Purposes, and/or Occupational Safety and Health Administration regulations at 29 CFR part 1926 subpart L—Scaffolds. Also excluded from the scope of this investigation are tubular racks such as garment racks and drying racks, i.e., racks in which the load bearing vertical and horizontal steel members consist solely of: (1) Round tubes that are no more than two inches in diameter; (2) round rods that are no more than two inches in diameter; (3) other tubular shapes that have both an overall height of no more than two inches and an overall width of no more than two inches; and/or (4) wire. Also excluded from the scope of this investigation are portable tier racks. Portable tier racks must meet each of the following criteria to qualify for this exclusion: (1) They are freestanding, portable assemblies with a fully welded base and four freely inserted and easily removable corner posts; (2) They are assembled without the use of bolts, braces, anchors, brackets, clips, attachments, or connectors; (3) One assembly may be stacked on top of another without applying any additional load to the product being stored on each assembly, but individual portable tier racks are not securely attached to one another to provide interaction or interdependence; and (4) The assemblies have no mechanism (e.g., a welded foot plate with bolt holes) for anchoring the assembly to the ground. Also excluded from the scope of this investigation are accessories that are independently bolted to the floor and not attached to the rack system itself, i.e., column protectors, corner guards, bollards, and end row and end of aisle protectors. Merchandise covered by this investigation is currently classified in the Harmonized Tariff Schedule of the United States (HTSUS) under the following subheadings: 7326.90.8688, 9403.20.0080, and 9403.90.8041. Subject merchandise may also enter under subheadings 7308.90.3000, 7308.90.6000, 7308.90.9590, and 9403.20.0090. The HTSUS subheadings are provided for convenience and U.S. Customs purposes only. The written description of the scope is dispositive.
I‐14
On March 4, 2019, Commerce modified the scope of its investigation of steel racks from China in its preliminary determination of sales at less than fair value, based on interested party comments on the scope as well as additional language proposed by the petitioner.19 In its Scope Decision Memorandum, Commerce stated that it modified the scope of the investigation “to include additional descriptions of specific characterizations of subject steel racks (such as yield strength and dimensions of load bearing members,” and to exclude components of boltless steel shelving, wall‐mounted racks, ceiling mounted racks, scaffolding, tubular racks (including garment and drying racks), portable tier racks, and various rack accessories.20 Commerce amended the scope of the countervailing duty investigation of steel racks from China to conform with the scope of the companion antidumping duty investigation.21
Tariff treatment
Based upon the scope set forth by Commerce, information available to the Commission indicates that the merchandise subject to these investigations are imported under the following statistical reporting numbers 7326.90.8688, 9403.20.0081,22 and 9403.90.8041 of the Harmonized Tariff Schedule of the United States (“HTSUS” or “HTS”). The subject merchandise may also be imported under HTS statistical reporting numbers 7308.90.3000, 7308.90.6000, 7308.90.9590, and 9403.20.0090. The 2019 column 1‐general rate of duty is “Free” for HTS subheadings 7308.90.30, 7308.90.60, 7308.90.95, 9403.20.00, and 9403.90.80; and 2.9 percent ad valorem for HTS subheading 7326.90.86.23 Decisions on the tariff classification and treatment of imported goods are within the authority of U.S. Customs and Border Protection.
Section 301 tariff treatment
As stated above, the merchandise subject to these investigations may be imported under HTS subheadings 7308.90.30, 7308.90.60, and 7308.90.95; products imported under these HTS subheadings were included in the USTR’s second enumeration (“Tranche 2” or “List 2”) of products originating in China that became subject to the additional 25 percent ad
19 Steel Racks and Parts Thereof From the People’s Republic of China: Preliminary Determination of Sales at Less Than Fair Value, 84 FR 7326, March 4, 2019.
20 Steel Racks from the People’s Republic of China, Preliminary Scope Decision Memorandum dated February 25, 2019 at 9, referenced in Steel Racks and Parts Thereof From the People’s Republic of China: Preliminary Determination of Sales at Less Than Fair Value, 84 FR 7326, 7327, n.7.
21 Steel Racks From the People’s Republic of China: Amended Preliminary Countervailing Duty Determination, 84 FR 16640, April 22, 2019.
22 On July 1, 2019, HTS statistical reporting number 9403.20.0080 for all other non‐household furniture, not elsewhere specified or identified (“nesoi”), was deleted and replaced by a new HTS statistical reporting number 9403.20.0078 for storage lockers along with a new HTS statistical reporting number 9403.20.0081 for all other non‐household furniture, nesoi. HTSUS (2019) Revision 8, USITC Publication 4918, July 2019, Change Record (Rev. 8), p. 3.
23 HTSUS (2019) Revision 9, USITC Publication 4937, July 2019, ch. 73, pp. 23, 41; ch. 94, pp. 8, 11.
I‐15
valorem duties, under Section 301 of the Trade Act of 1974 (annexes A and C of 83 FR 40823, on or after August 23, 2018).24 See also U.S. notes 20(c) and 20(d) to subchapter III of HTS chapter 99.25
Moreover, the merchandise subject to these investigations may be imported under HTS subheadings 7326.90.86, 9403.20.00, and 9403.90.80; products imported under these HTS subheadings were included in the USTR’s third enumeration (“Tranche 3” or “List 3”) of products originating in China that became subject to the additional 10 percent ad valorem duties (annexes A and C of 83 FR 47974, on or after September 24, 2018) under Section 301.26 Such products exported before May 10, 2019, could still be entered at the 10 percent ad valorem rate prior to June 15, 2019, but shipments entering the United States thereafter are currently subject to the escalated additional duty of 25 percent, pursuant to Section 301.27 See also U.S. notes 20(e), 20(f), and 20(l) to subchapter III of HTS chapter 99.28
Section 232 tariff treatment The raw materials for manufacturing steel racks—various steel mill products classifiable under the HTS headings of chapters 72 and 73—were included in the enumeration of iron and steel articles, imported on or after March 23, 2018, that became subject to the additional 25 percent ad valorem Section 232 duties.29 The President issued subsequent Proclamations to exempt or adjust these duties for selected U.S. trade partners.30 See U.S. notes 16(a) and 16(b) in
24 Notice of Action Pursuant to Section 301: China’s Acts, Policies, and Practices Related to Technology Transfer, Intellectual Property, and Innovation, 83 FR 40823, August 16, 2018.
25 HTSUS (2019) Revision 9, USITC Publication 4937, July 2019, ch. 99, pp. 99‐III‐18, 99‐III‐19, 99‐III‐20, 99‐III‐80.
26 Notice of Modification of Section 301 Action: China’s Acts, Policies, and Practices Related to Technology Transfer, Intellectual Property, and Innovation, 83 FR 47974, September 21, 2018.
27 Notice of Action Pursuant to Section 301: China’s Acts, Policies, and Practices Related to Technology Transfer, Intellectual Property, and Innovation, 83 FR 65918, December 19, 2018; Notice of Modification of Section 301 Action: China’s Acts, Policies, and Practices Related to Technology Transfer, Intellectual Property, and Innovation, 84 FR 7966, March 5, 2019; Notice of Modification of Section 301 Action: China’s Acts, Policies, and Practices Related to Technology Transfer, Intellectual Property, and Innovation, 84 FR 20459, May 9, 2019; Implementing Modification to Section 301 Action: China’s Acts, Policies, and Practices Related to Technology Transfer, Intellectual Property, and Innovation, 84 FR 21892, May 15, 2019; Additional Implementing Modification to Section 301 Action: China’s Acts, Policies, and Practices Related to Technology Transfer, Intellectual Property, and Innovation, 84 FR 26930, June 10, 2019.
28 HTSUS (2019) Revision 9, USITC Publication 4937, July 2019, ch. 99, pp. 99‐III‐21, 99‐III‐22, 99‐III‐40, 99‐III‐44, 99‐III‐52, 99‐III‐80, 99‐III‐81.
29 Adjusting Imports of Steel Into the United States, Presidential Proclamation 9705, March 8, 2018, 83 FR 11625, March 15, 2018.
30 China was not among the selected trade partners exempted from these additional duties. Adjusting Imports of Steel Into the United States, Presidential Proclamation 9711, March 22, 2018, 83 FR 13361, March 28, 2018; Presidential Proclamation 9740, April 30, 2018, 83 FR 20683, May 7, 2018;
(continued...)
I‐16
subchapter III of HTS chapter 99.31 Imported steel racks are not covered by these additional duties.
THE PRODUCT
Description and applications32
A steel rack is a structure consisting of hot‐rolled or cold‐formed steel structural components such as plates, rods, angles, channels, other sections, tubes, etc. These steel structural components are typically assembled by welding, bolting, or clipping. A steel rack is designed so that its dimensions and configurations can be adjusted as required, either with or without locking tabs or slots, and either with or without bolted, clamped, or welded connections.33 Certain types of steel racks may also include movable components, such as rails, wheels, rollers, tracks, channels, carts, or conveyors.34 Steel racks and parts thereof are available either assembled or unassembled.35 They may also be finished (i.e., by coating or painting), assembled, or packaged in a third country.36
(…continued) Presidential Proclamation 9759, May 31, 2018, 83 FR 25857, June 5, 2018; Presidential Proclamation 9772, August 10, 2018, 83 FR 40429, August 15, 2018; and Presidential Proclamation 9777, August 29, 2018, 83 FR 45025, September 4, 2018, exempted imports of iron and steel mill products originating from Argentina, Australia, Brazil, and South Korea; but doubled the duty rate on such imported products originating from Turkey, as of June 1, 2018. U.S. Customs and Border Protection, “Section 232 Tariffs on Aluminum and Steel Duty on Imports of Steel and Aluminum Articles Under Section 232 of the Trade Expansion Act of 1962,” April 2, 2019.
Subsequently, Presidential Proclamation 9886, May 16, 2019, 84 FR 23421, May 21, 2019 restored the original additional duty rate on steel mill products originating from Turkey, effective May 21, 2019; and Presidential Proclamation 9894, May 19, 2019, 84 FR 23987, May 23, 2019, restored the duty exemptions for steel mill products originating from Canada and Mexico, effective May 20, 2019.
31 HTSUS (2019) Revision 9, USITC Publication 4937, July 2019, ch. 99, pp. 99‐III‐5, 99‐III‐6, 99‐III‐72 ‐ 99‐III‐79.
32 Unless otherwise noted, this information is based on Steel Racks from China, Inv. Nos. 701‐TA‐608 and 731‐TA‐1420 (Preliminary), USITC Publication 4811, August 2018, pp. I‐10 ‐ I‐14.
33 Petition, pp. 5‐6. 34 Steel racks with movable components include drive‐in racks, drive‐through racks, movable‐shelf
racks, pallet‐flow racks, or push‐back racks. Petition, p. 7. 35 Although domestic manufacturers usually ship fully assembled steel racks, in some instances racks
are shipped in “knocked‐down” (unassembled) condition to reduce freight costs, for subsequent assembly at a job site. Conference transcript, p. 40 (Neal). Moreover, imported steel racks from China arrive knocked‐down, rather than trying to fit a fully assembled rack into a shipping container. Conference transcript, p. 40 (Neal); p. 39 (Drake).
36 Petition, p. 7.
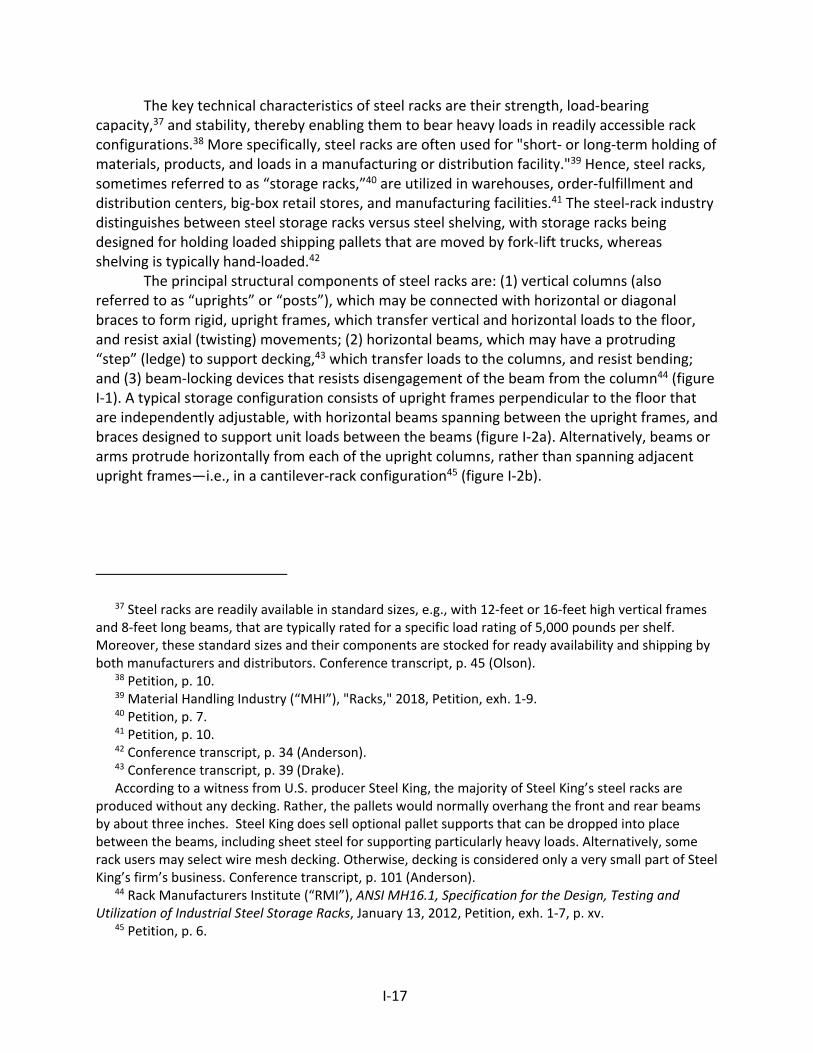
I‐17
The key technical characteristics of steel racks are their strength, load‐bearing capacity,37 and stability, thereby enabling them to bear heavy loads in readily accessible rack configurations.38 More specifically, steel racks are often used for "short‐ or long‐term holding of materials, products, and loads in a manufacturing or distribution facility."39 Hence, steel racks, sometimes referred to as “storage racks,”40 are utilized in warehouses, order‐fulfillment and distribution centers, big‐box retail stores, and manufacturing facilities.41 The steel‐rack industry distinguishes between steel storage racks versus steel shelving, with storage racks being designed for holding loaded shipping pallets that are moved by fork‐lift trucks, whereas shelving is typically hand‐loaded.42
The principal structural components of steel racks are: (1) vertical columns (also referred to as “uprights” or “posts”), which may be connected with horizontal or diagonal braces to form rigid, upright frames, which transfer vertical and horizontal loads to the floor, and resist axial (twisting) movements; (2) horizontal beams, which may have a protruding “step” (ledge) to support decking,43 which transfer loads to the columns, and resist bending; and (3) beam‐locking devices that resists disengagement of the beam from the column44 (figure I‐1). A typical storage configuration consists of upright frames perpendicular to the floor that are independently adjustable, with horizontal beams spanning between the upright frames, and braces designed to support unit loads between the beams (figure I‐2a). Alternatively, beams or arms protrude horizontally from each of the upright columns, rather than spanning adjacent upright frames—i.e., in a cantilever‐rack configuration45 (figure I‐2b).
37 Steel racks are readily available in standard sizes, e.g., with 12‐feet or 16‐feet high vertical frames and 8‐feet long beams, that are typically rated for a specific load rating of 5,000 pounds per shelf. Moreover, these standard sizes and their components are stocked for ready availability and shipping by both manufacturers and distributors. Conference transcript, p. 45 (Olson).
38 Petition, p. 10. 39 Material Handling Industry (“MHI”), "Racks," 2018, Petition, exh. 1‐9. 40 Petition, p. 7. 41 Petition, p. 10. 42 Conference transcript, p. 34 (Anderson). 43 Conference transcript, p. 39 (Drake). According to a witness from U.S. producer Steel King, the majority of Steel King’s steel racks are
produced without any decking. Rather, the pallets would normally overhang the front and rear beams by about three inches. Steel King does sell optional pallet supports that can be dropped into place between the beams, including sheet steel for supporting particularly heavy loads. Alternatively, some rack users may select wire mesh decking. Otherwise, decking is considered only a very small part of Steel King’s firm’s business. Conference transcript, p. 101 (Anderson).
44 Rack Manufacturers Institute (“RMI”), ANSI MH16.1, Specification for the Design, Testing and Utilization of Industrial Steel Storage Racks, January 13, 2012, Petition, exh. 1‐7, p. xv.
45 Petition, p. 6.
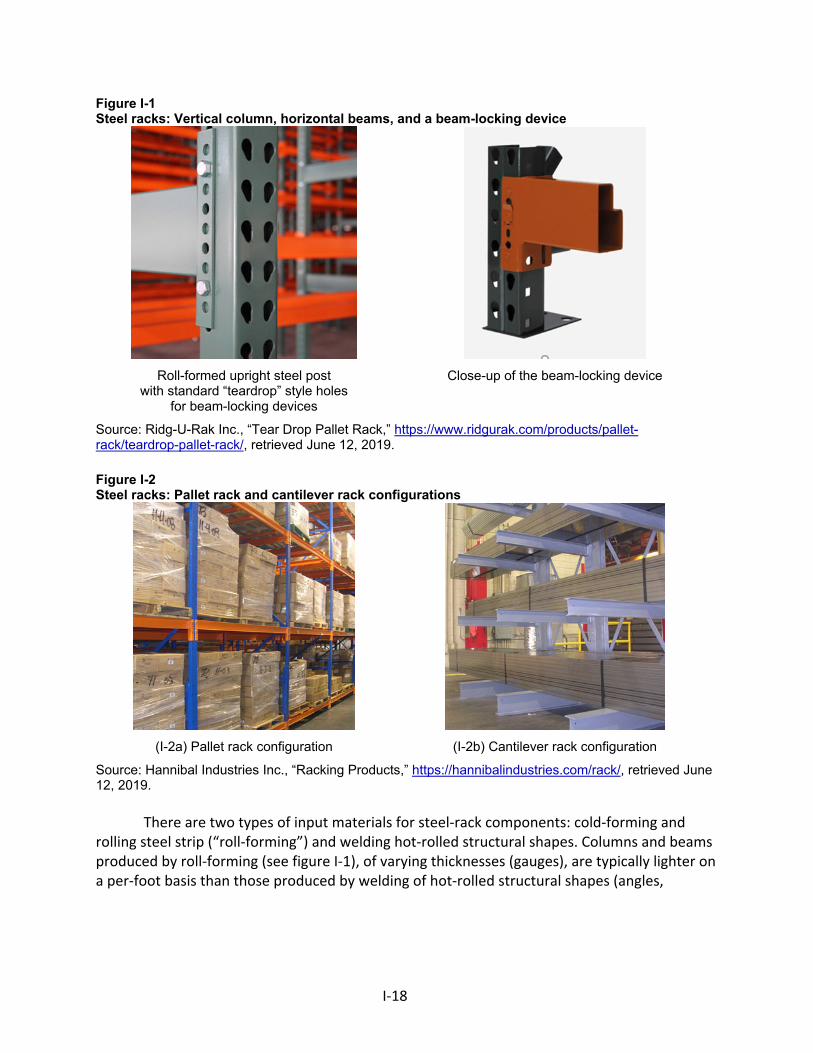
I‐18
Figure I-1 Steel racks: Vertical column, horizontal beams, and a beam-locking device
Roll-formed upright steel post with standard “teardrop” style holes
for beam-locking devices
Close-up of the beam-locking device
Source: Ridg-U-Rak Inc., “Tear Drop Pallet Rack,” https://www.ridgurak.com/products/pallet-rack/teardrop-pallet-rack/, retrieved June 12, 2019. Figure I-2 Steel racks: Pallet rack and cantilever rack configurations
(I-2a) Pallet rack configuration (I-2b) Cantilever rack configuration
Source: Hannibal Industries Inc., “Racking Products,” https://hannibalindustries.com/rack/, retrieved June 12, 2019.
There are two types of input materials for steel‐rack components: cold‐forming and rolling steel strip (“roll‐forming”) and welding hot‐rolled structural shapes. Columns and beams produced by roll‐forming (see figure I‐1), of varying thicknesses (gauges), are typically lighter on a per‐foot basis than those produced by welding of hot‐rolled structural shapes (angles,
I‐19
channels, and other shapes) that are available in more limited sizes.46 Compared to welding of structural shapes, according to a Petitioner’s witness, roll‐forming of steel strip offers more possibilities for structural optimization by allowing greater flexibility for rack components, in terms of shapes, depths, widths, and gauges.47 Moreover, because they contain less steel than structural racks, roll‐formed racks are considered, by that witness, as more cost effective and cost competitive for supporting loads.48 ***.49 Regardless of whether the rack is structural or roll‐formed, and regardless of whether it is a relatively simple, static, selective rack or a more complex dynamic system, all steel racks are produced from the same basic materials and serve the same function.50
Steel racks are manufactured to meet American National Standards Institute (“ANSI”) MH16.1 (industrial steel storage racks)51 or ANSI MH16.3 (cantilever steel storage racks)52 standards.53 The Rack Manufacturers Institute (“RMI”) provides both domestic and foreign manufacturers its “R‐Mark” certification that a manufacturer’s industrial steel storage racks or welded wire rack decking meets the RMI‐ANSI MH16.1 standard.54 During the staff conference,
46 Conference transcript, p. 68 (Neal). 47 Conference transcript, pp. 67‐68, (Neal). 48 Conference transcript, p. 65 (Neal). 49 First, Chinese rack columns are of an “open‐post” design consisting of steel formed on three sides,
rather than the more typical U.S. “close‐post” design with steel formed on all four sides. Second, Chinese beams are narrower in cross section, yet can still meet load‐capacity requirements. Finally, Chinese braces are narrower than U.S.‐made bracing. Respondent UMH’s posthearing brief, exh. 4. “Declaration 2 ***,” pp. 1‐3.
50 Conference transcript, p. 23 (Neal). 51 ANSI MH16.1‐2012: Specification for the Design Testing and Utilization of Industrial Steel Storage
Racks, 2012, available from RMI via Internet web link: http://imis.mhi.org/imis/ItemDetail?iProductCode=10083&WebsiteKey=7f58dfad‐596e‐4e29‐84f6‐33c278512f2b, retrieved July 18, 2018.
52 ANSI MH16.3‐2016: Specification for the Design, Testing and Utilization of Industrial Steel Cantilevered Storage Racks, 2016, available from RMI via Internet web link: http://imis.mhi.org/imis/ItemDetail?iProductCode=11118&WebsiteKey=7f58dfad‐596e‐4e29‐84f6‐33c278512f2b&_ga=2.204168979.2059789001.1531946133‐452396286.1531500319, retrieved July 18, 2018.
53 Petition, p. 6. 54 The R‐Mark certification is available to both domestic and foreign steel‐rack manufacturers. U.S. steel‐rack manufacturers and importers with R‐Mark certification include: Advance Storage
Products, Atlanta Pallet Rack, Elite Storage Solutions Inc. (“Elite”), Engineered Products, Equipment Boni Inc., Frazier, Hannibal, Husky Rack & Wire (“Wireway Husky”), Interlake, Pacific Bend Inc., Rack USA, Ridg‐U‐Rak, Space RAK, Speedrack Products Group Ltd. (“Speedrack”), Steel King, Unarco, and UMH. Respondent UMH’s posthearing brief, exh. 2, RMI, “R‐Mark Certification,” 2019.
Chinese steel‐rack firms with R‐Mark certification include: Nanjing Jiangrul Storage Equipment Co. Ltd., Nanjing Kingmore Logistics Equipment Manufacturing Co. Ltd., and Xiamen Luckyroc Storage Equipment Manufacture Co. Ltd. Respondent UMH’s posthearing brief, exh. 2, RMI, “R‐Mark Certification,” 2019.
(continued...)
I‐20
a Petitioner’s witness testified that access to R‐Mark certification, standardized designs, and the aforementioned interchangeability provided Chinese manufacturers with the necessary credibility to enter into the U.S. market for steel racks.55
According to the Petitioner, because steel racks are manufactured to meet these standards, with many racks produced to standardized dimensions, and adoption of similar component design characteristics (e.g., the “teardrop”‐shaped holes along the length of the columns) and locking features, components produced by different manufacturers, whether domestic or foreign, tend to be highly interchangeable,56 although not entirely so due to differences in dimensional tolerances.57 During the hearing, a witness for Respondent UMH elaborated further that interchangeability between steel rack components produced by different manufacturers is possible but not total, as connectors won’t fit correctly due to differences in dimensional tolerances and shapes of the tear‐drop holes, and the differences in attaching the bracing by bolting it to the frame columns in Chinese‐origin steel racks versus welding it to the frame columns in domestically produced steel racks discussed further below.58 Moreover, according to this witness, purchasers would not be likely to mix together components from different manufacturers when purchasing rack sets lest they void the warranty provided either directly by the manufacturer or through the distributor.59
During the hearing, a witness for Respondent UMH highlighted a structural difference between domestically produced versus imported steel racks originating from China. Chinese steel racks feature bracing that is bolted to the upright frame members, whereas domestically produced steel racks feature bracing that is welded to the frame.60 According to the Petitioner, domestic producers are rarely if ever asked to provide bolted‐frame racks,61 as customers prefer the greater strength and rigidity of welded over bolted frames.62 Furthermore,
(…continued)
Moreover, ***. Respondent UMH’s posthearing brief, p. 14. Konstant is a Canadian steel‐rack manufacturer with R‐Mark certification. RMI, Respondent UMH’s
posthearing brief, exh. 2, RMI, “R‐Mark Certification,” 2019. For more information about RMI’s R‐Mark certification program features and qualification
requirements, see: RMI, “Information About the R‐Mark Process,” November 5, 2017, http://www.mhi.org/downloads/industrygroups/rmi/rmark/rmark‐process.pdf, retrieved July 24, 2019.
55 Conference transcript, pp. 113 (Olson). 56 Conference transcript, pp. 16 (B. Bartlett); 26 (Olson); 30 (Anderson); 70 (Schagrin); Petitioner’s
posthearing brief, p. 3. Furthermore, a witness for Speedrack testified at the hearing that a standard Chinese beam would readily fit onto one of Speedrack’s upright columns. Hearing transcript, p. 29 (Quist).
57 Conference transcript, pp. 110‐111 (Schagrin); 131 (Peplowski); 158 (R. Bartlett). 58 Hearing transcript, pp. 146‐147, 149 (R. Bartlett). 59 Hearing transcript, pp. 147, 171 (R. Bartlett). 60 Hearing transcript, pp. 145‐146, 149, 158, 207‐208 (R. Bartlett). 61 Interlake reportedly produced bolted racks in the past but has discontinued doing so. Petitioner’s
postconference brief, “Answers to Commissioner questions,” p. 21; exh. 4 “Declaration of David Olson.” 62 Petitioner’s postconference brief, pp. 2‐3; “Answers to Commissioner questions,” p. 21; exh. 5
“Declaration of Jay Anderson.”
I‐21
purchasing welded‐frame racks also avoids both the on‐site assembly costs and potential liability for structural failure due to incorrectly assembled bolted‐frame racks.63
Steel racks are available, with either structural or roll‐formed components, in various configurations,64 or even as hybrid rack systems consisting of a structural‐steel frame and roll‐formed steel beams.65 According to the Petitioner, steel racks covered by the scope of these investigations66 are described by the ANSI MH16.1 standard depending on their specific configurations:67
Cantilever racks consist primarily of vertical columns, extended bases, horizontal arms projecting from the face of the columns, and down‐aisle bracing between columns. There can be shelf beams between arms depending on the product being stored. Cantilever columns may be either free‐standing or stabilized by overhead ties.
Case‐flow racks are specialized pallet racks in which either the horizontal shelf beams support case‐flow lanes or case‐flow shelf assemblies are supported by the upright frames. The case‐flow lanes or shelves are installed at a slight pitch permitting multiple‐depth case or box storage with loading from one service aisle and return loading or picking from another service aisle.
Drive‐in racks consist primarily of vertical upright frames, horizontal support arms, and horizontal load rails typically used for one‐wide by multiple‐depth storage. This structure includes an "anchor section" with horizontal beams supporting the load rails. Loading and unloading within a bay must be done from the same aisle. A two‐way drive‐in rack is a special case where back‐to‐back rows of drive‐in racks are combined into a single entity with a common rear post.
Drive‐through racks consist primarily of vertical upright frames, horizontal support arms, and horizontal load rails typically used for one‐wide by multiple‐depth storage. This structure lacks the 'anchor section' found in drive‐in racks; therefore, loading and unloading can be accomplished from both ends of a bay.
Movable‐shelf racks consist primarily of vertical upright frames and horizontal shelf beams and are typically used for one‐deep pallet68 or hand‐stack storage.69 Typically, the
63 Petitioner’s postconference brief, p. 3; “Answers to Commissioner questions,” p. 21; exh. 4 “Declaration of David Olson;” exh. 5 “Declaration of Jay Anderson.”
64 Further information was not readily available about the extent to which a particular rack configuration would consist solely of either structural or roll‐formed components.
65 Conference transcript, p. 65 (Neal). 66 Petition, p. 8. 67 Unless otherwise noted, information in this section is compiled from Rack Manufacturers Institute
(“RMI”), ANSI MH16.1, Specification for the Design, Testing and Utilization of Industrial Steel Storage Racks, January 13, 2012, Petition, exh. 1‐7, pp. xv‐xx.
68 A “one‐deep” or “single‐deep” pallet rack is of suitable dimensions with room to store a single pallet. Two one‐deep pallet racks can be arranged “back‐to‐back” to store two pallets, each being accessible from opposite aisles. By contrast, a “double‐deep” pallet rack is of suitable dimensions for storing two pallets, one in front of the other. Double‐deep pallet racks provide the advantage of occupying less floor space, as both pallets are accessible from the same aisle; however, they also have
(continued...)
I‐22
locations of a couple shelf levels are "fixed" with the location of the in‐fill shelves being adjustable.
Pallet‐flow racks are specialized pallet racks in which the horizontal shelf beams support pallet‐flow lanes. The pallet‐flow lanes are typically installed on a slight pitch permitting multiple‐depth pallet storage with loading from one service aisle and unloading from another service aisle.
Pallet racks consist primarily of vertical upright frames and horizontal shelf beams and are typically used for one‐ and two‐deep pallet storage.
Pick modules consist primarily of vertical frames and horizontal beams, typically having one or more platform levels of selective, case‐flow, or pallet‐flow bays feeding into a central pick aisle(s) (work platform(s) supported by the rack structure.
Portable racks (stacking frames) are assemblies, typically with four corner columns, that permits stacking of one assembly on top of another without applying any additional load to the product being stored on each assembly.
Push‐back racks are specialized pallet racks in which the horizontal shelf beams support push‐back lanes comprised of tracks and carts. The push‐back lanes are installed on a slight pitch permitting multiple‐depth pallet storage. Loading and unloading are done from the same service aisle by pushing the pallets back.
Stacker racks are similar to other rack structures but are serviced by automated storage and retrieval machines.
During the staff conference, Petitioner’s witnesses testified that their firms produce both structural and roll‐formed steel racks,70 whereas only a few domestic producers sell only structural racks.71 A Petitioner’s witness estimated that structural racks accounted for about one‐quarter of the U.S. marketplace and roll‐formed racks accounted for about three‐quarters of the U.S. marketplace.72 A Petitioner’s witness further elaborated that pallet racks account for the vast majority (80‐85 percent) of the steel racks purchased in the United States.73
(…continued) the disadvantage in that they require either a specialized fork lift designed with a longer reach or a conventional forklift fitted with both additional extensions and a counterbalance to reach the pallet furthest from the aisle. For more information, see, e.g., AK Material Handling Systems, “Choosing Double Deep Pallet Rack for Your Warehouse, What is Double Deep Pallet Rack?,” https://www.akequipment.com/choosing‐double‐deep‐pallet‐rack‐for‐your‐warehouse/, retrieved July 1, 2019.
69 Hand stack racks, being designed to support large, bulky, or unusually shaped products that are too large for bins, have a shelf surface of either wire decking or wood boards, usually set in a step or depression on the inside of the beam. Siggins Co., “Storage Rack/Pallet Rack,” https://siggins.com/products/storage‐media/palletstorage‐rack, retrieved July 1, 2019.
70 Conference transcript, pp. 16 (B. Bartlett); 20 (Peplowski); 23 and 65 (Neal); 26 (Olson); 30 (Anderson); 63 (Schagrin).
71 Conference transcript, p. 65 (Neal). 72 Conference transcript, p. 64 (Schagrin). 73 Conference transcript, p. 99 (Peplowski).
I‐23
According to a Petitioner’s witness, imported steel racks are predominantly (95 percent) roll‐formed.74 A witness for Respondent UMH concurred that 95 percent of UMH’s imports is roll‐formed pallet racks with the remaining 5 percent being structural cantilever racks.75 The witness further elaborated that he’s not aware of any firm that imports structural pallet racks and that the only imported structural rack is the cantilever type.76 The lighter roll‐formed steel racks are more efficient to transport via containerized ocean freight, while the heavier structural steel racks might not completely fill a shipping container without exceeding the container’s load‐weight capacity.77
The hearing witness for Respondent UMH claimed that the steel racks originating from China are more cost effective to transport; by leaving the braces unbolted from the columns, UMH can load approximately three times more rack material on a truck than the steel racks produced by the Petitioners.78 Furthermore, according to Respondent UMH, most if not all steel‐rack components originating from China are shipped unassembled to the U.S. market.79 By contrast, the Petitioner argued that any cost advantage from shipping unassembled bolted‐frame racks would be offset by additional assembly costs along with potential liability for incorrectly assembled bolted‐frame racks.80
Manufacturing processes81
The manufacturing process and raw material inputs both differ, depending on whether the steel rack consists of either roll‐formed or structural steel components. A key distinction is that the components of roll‐formed steel racks are cold‐formed, whereas those of structural steel racks are hot‐rolled.82 Nevertheless, both processes start with a high‐strength, low‐alloy (high‐carbon) steel of structural grade, with a yield strength of 50,000 pounds‐per‐square‐inch or higher.83
74 Conference transcript, p. 67 (Peplowski). 75 Conference transcript, pp. 132 and 144 (R. Bartlett). 76 Conference transcript, pp. 132 and 145 (R. Bartlett). 77 Conference transcript, p. 68 (Neal). 78 Hearing transcript, pp. 145‐146, 149, 158 (R. Bartlett); Respondent UMH’s posthearing brief, exh. 3
“Declaration 1 from Ryan Bartlett,” p. 4. See also ***. 79 Respondent UMH’s postconference brief, exh. 1 “Compiled Q&As,” 2. 80 Petitioner’s postconference brief, p. 3; “Answers to Commissioner questions,” p. 21; exh. 4
“Declaration of David Olson;” exh. 5 “Declaration of Jay Anderson.” 81 Unless otherwise noted, this information is based on Steel Racks from China, Inv. Nos. 701‐TA‐608
and 731‐TA‐1420 (Preliminary), USITC Publication 4811, August 2018, pp. i‐14 ‐ I‐15. 82 REB Storage Systems International, “Differences Between Structural Steel Rack and Roll‐Formed
Steel Rack,” 2018; Krummell, John, “What is the Difference Between Structural and Roll Formed Rack?,” Advance Storage Products, July 26, 2017; Mink, Jeremy, “Pallet Rack Systems: Structural vs. Roll Form Pallet Racking,” Bastian Solutions, July 13, 2017; Next Level Storage Solutions, “Pallet Rack 101: Roll Formed vs. Structural Steel, What’s the Difference?,” July 25, 2013, Petition, exh. 1‐11.
83 Conference transcript, p. 44 (Olson).
I‐24
Roll‐formed rack components are typically manufactured by first slitting light‐gauge, hot‐rolled,84 steel coils (generally weighing 20‐25 tons)85 into narrower widths suitable for producing the beam, brace, and column profiles. The slit steel blanks are first punched with holes by which the beams and columns will be attached to one another with a locking device to construct the rack. The steel blanks are then cut to length prior to being fed into a roll‐forming machine consisting of a series of forming rolls that progressively bend the steel to create the final shape, typically into a channel or tube. In the case of tube‐shaped beams, the beams will be welded to form a tube.86 The braces are welded across the columns to produce the vertical frame.87
Structural rack components are assembled by welding together hot‐rolled steel channel and angle sections.88 Prior to welding, the structural sections are cut to length and punched with holes by which they will be attached to the columns.89 These welded structural shapes are generally thicker and more resistant to damage than the equivalent roll‐formed shapes.90
Finally, the finished components from either process are subsequently galvanized, painted, or coated.91
DOMESTIC LIKE PRODUCT ISSUES
During the preliminary phase of these investigations, the Commission defined a single domestic like product consisting of steel racks coextensive with the scope in these investigations.92 The Petitioner proposed a single domestic like product co‐extensive with the scope. Several respondent parties argued that the Commission should define various separate domestic like products. While respondents framed their arguments as seeking definitions of various separate like products, each of these proposals were based on their interpretation that the scope unintentionally included their respective imported products. The Commission concluded that it was not clear if these imported products were within the scope and/or domestically produced, and as such, respondents’ arguments were more accurately characterized as scope exclusion issues, which should be directed to Commerce and not the Commission.93 After certain interested parties commented on the scope of the investigation,
84 Although cold‐rolled steel can be used to produce steel rack, it is not considered cost effective. Conference transcript, p. 106 (Neal).
85 Conference transcript, p. 35 (B. Bartlett). 86 Petition, p. 10; Conference transcript, p. 35 (B. Bartlett). 87 Conference transcript, p. 35 (B. Bartlett). 88 Petition, p. 10; Conference transcript, p. 43 (Neal). 89 Conference transcript, p. 35 (B. Bartlett). 90 Petition, pp. 10‐11. 91 Petition, p. 10. 92 Investigation Nos. 701‐TA‐608 and 731‐TA‐1420 (Preliminary): Steel Racks from China‐‐ Final
Consolidated Staff Report and Views, July 30, 2018, p. 13 93 Steel Racks from China, Inv. Nos. 701‐TA‐608 and 731‐TA‐1420 (Preliminary), USITC Pub. 4811,
August 2018, p. 10.
I‐25
and additional language was proposed by the Petitioner, Commerce modified the scope, based on comments and rebuttal comments received.94
No party requested that the Commission collect data on other possible domestic like products in their comments on the Commission’s draft final questionnaires.
94 Steel Racks and Parts Thereof From the People's Republic of China: Preliminary Determination of Sales at Less Than Fair Value, 84 FR 7326, March 4, 2019.

`
II‐1
PART II: CONDITIONS OF COMPETITION IN THE U.S. MARKET
U.S. MARKET CHARACTERISTICS
Steel racks are produced in numerous designs, sizes, and configurations, and are used for holding loaded shipping pallets in warehouses, order‐fulfillment and distribution centers, big‐box retail stores, and manufacturing facilities. The U.S. market for steel racks has grown since 2015, as a result of warehouse construction driven by a growing economy and increased online retail sales, with demand peaking in 2018.1 Petitioner expects slowing demand growth in the U.S. steel racks’ market in 2019 and decreased demand in 2020.2 On the other hand, respondent expects increased growth, citing articles projecting a compound annual growth rate of 5 to 7 percent over the next five years.3 Most U.S. producers, and some foreign manufacturers that sell to the U.S. market, are members of the Rack Manufacturers Institute (RMI), the primary industry association representing steel rack manufacturers in the U.S. market.4
Steel rack producers provide customized steel rack projects for end users as well as supplying stock items to distributors. U.S. producer Ridg‐U‐Rak stated that it lost orders on its stock order sales from 2016 to 2018, whereas its steel racks’ engineering projects were steady to growing because of expansions in e‐commerce and in the logistics business.5 U.S. producer and importer Interlake reportedly focuses on the more standardized steel rack products rather than on customized products.6
Apparent U.S. consumption of steel racks increased during 2016 to 2018. Overall, apparent U.S. consumption in 2018 was *** percent higher than in 2016. Apparent consumption was *** percent lower in interim 2019 compared to interim 2018. Impact of section 232 and 301 investigations and tariffs
U.S. producers and importers were asked whether the announcement of the section 301
investigation in June 2018 or the subsequent imposition of tariffs on Chinese‐origin products had an impact on the steel racks market (see Part I). Among U.S. producers, four of nine responding firms reported that section 301 measures had an impact, three reported no impact, and two reported that they did not know. Most importers (10 of 15) reported that section 301 measures had an impact on the steel racks market, one reported no impact, and four did not know. U.S. producers and importers were also asked whether the announcement of the section 232 investigation in April 2017 or the subsequent imposition of tariffs on imported steel
1 Petition, pp. 18‐19, hearing transcript, p. 75 (Drake). 2 Hearing transcript, p. 20 (Anderson), p. 47 (Drake). Petitioner’s prehearing brief, p. 5. 3 Respondent’s posthearing brief, p. 15 and exh. 8. 4 Petition, p. 4. 5 Hearing transcript, pp. 74‐75 (Olson). 6 Hearing transcript, p. 114 (Neal).
`
II‐2
products beginning in March 2018 had an impact on the steel racks market. Most firms (10 of 11 U.S. producers and 10 of 15 importers) responded that section 232 measures had impacted the steel racks market.
Firms were also specifically asked what the impact of the announcement and implementation of section 301 and 232 tariffs had been on overall demand, supply, prices, and raw materials for steel racks in the U.S. market (table II‐1). As shown in the table, most U.S. producers reported that section 232 and 301 measures did not change demand or supply for steel racks in the U.S. market. Importers generally agreed that these measures did not change supply, but had mixed responses regarding the impact of these measures on demand. The vast majority of U.S. producers and importers reported that section 232 tariffs on steel increased raw material prices and prices of steel racks. Most importers reported that section 301 tariffs also increased raw material prices and prices of steel racks, while most U.S. producers reported no change in steel racks prices as a result of section 301 tariffs.
Respondent UMH stated that it raised its prices by 10 percent following implementation of the 301 tariffs in September 2018, and that when rates increased to 25 percent in May 2019, many of its customers were no longer willing to do business with UMH.7
U.S. PURCHASERS The Commission received 26 usable questionnaire responses from firms that had
purchased steel racks during January 2016‐March 2019.8 Sixteen responding purchasers are distributors, nine are end users/retailers, and one is a manufacturer of racking systems. Thirteen of the 16 responding distributors reported that they compete for sales to customers with the manufacturers or importers from which they purchase steel racks, with many of these firms reporting that U.S. manufacturers also sell direct to end users. For example, purchaser *** stated that on large retail pallet projects, the steel rack manufacturers from which it purchases will often deal directly with the client rather than going through *** as a middleman. Large purchasers of steel racks include distributors *** and retailers ***.
End user/retailer firms reported that varying shares of their purchases of steel racks were used for retail or customer‐visible displays, for warehousing and storage, and for other uses. Four purchasers, retailers ***, reported that the majority of their purchases were for retail or customer‐visible displays; six purchasers (***) reported that the majority of their purchases were for warehousing and storage; and one purchaser (***) reported that the majority of its purchases were for other uses (retail stockrooms).
7 Hearing transcript, p. 147 (Bartlett). ***. Respondent’s posthearing brief, exh. 3, p. 5. 8 Of the 26 responding purchasers, 25 purchased domestic steel racks, 17 purchased imported steel
racks from China, and 8 purchased imports from other countries.
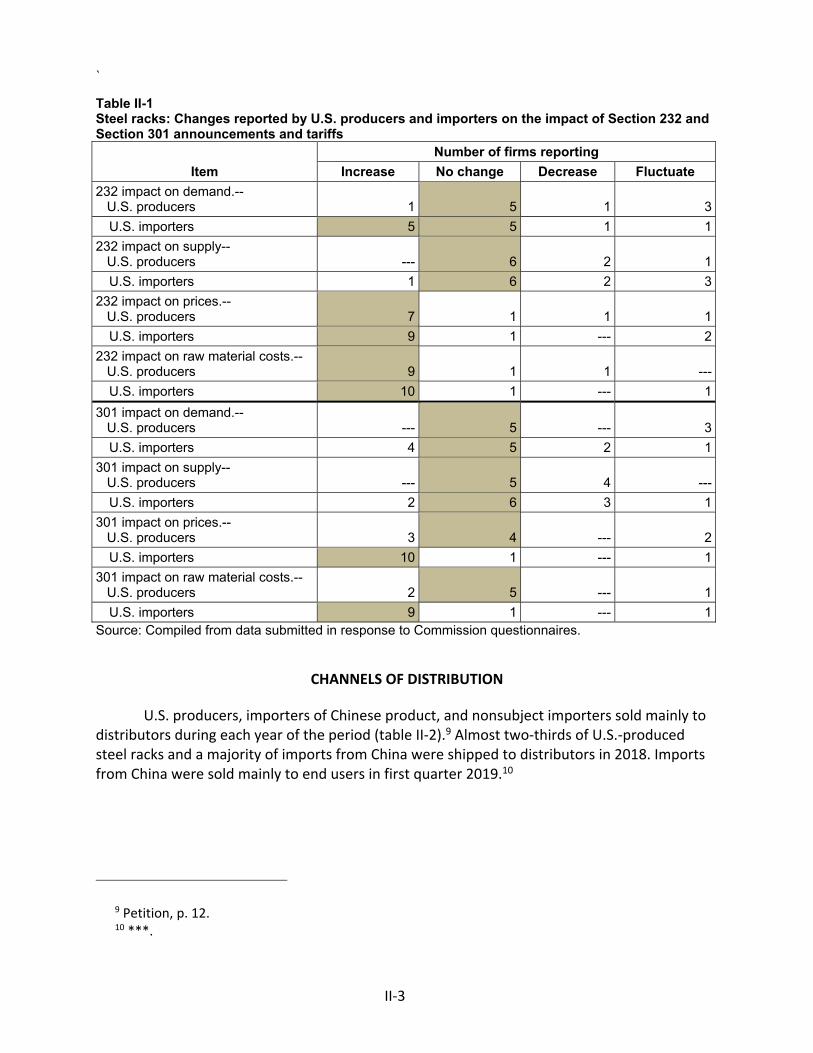
`
II‐3
Table II-1 Steel racks: Changes reported by U.S. producers and importers on the impact of Section 232 and Section 301 announcements and tariffs
Item
Number of firms reporting
Increase No change Decrease Fluctuate
232 impact on demand.-- U.S. producers 1 5 1 3
U.S. importers 5 5 1 1
232 impact on supply-- U.S. producers --- 6 2 1
U.S. importers 1 6 2 3
232 impact on prices.-- U.S. producers 7 1 1 1
U.S. importers 9 1 --- 2
232 impact on raw material costs.-- U.S. producers 9 1 1 ---
U.S. importers 10 1 --- 1
301 impact on demand.-- U.S. producers --- 5 --- 3
U.S. importers 4 5 2 1
301 impact on supply-- U.S. producers --- 5 4 ---
U.S. importers 2 6 3 1
301 impact on prices.-- U.S. producers 3 4 --- 2
U.S. importers 10 1 --- 1
301 impact on raw material costs.-- U.S. producers 2 5 --- 1
U.S. importers 9 1 --- 1 Source: Compiled from data submitted in response to Commission questionnaires.
CHANNELS OF DISTRIBUTION
U.S. producers, importers of Chinese product, and nonsubject importers sold mainly to distributors during each year of the period (table II‐2).9 Almost two‐thirds of U.S.‐produced steel racks and a majority of imports from China were shipped to distributors in 2018. Imports from China were sold mainly to end users in first quarter 2019.10
9 Petition, p. 12. 10 ***.
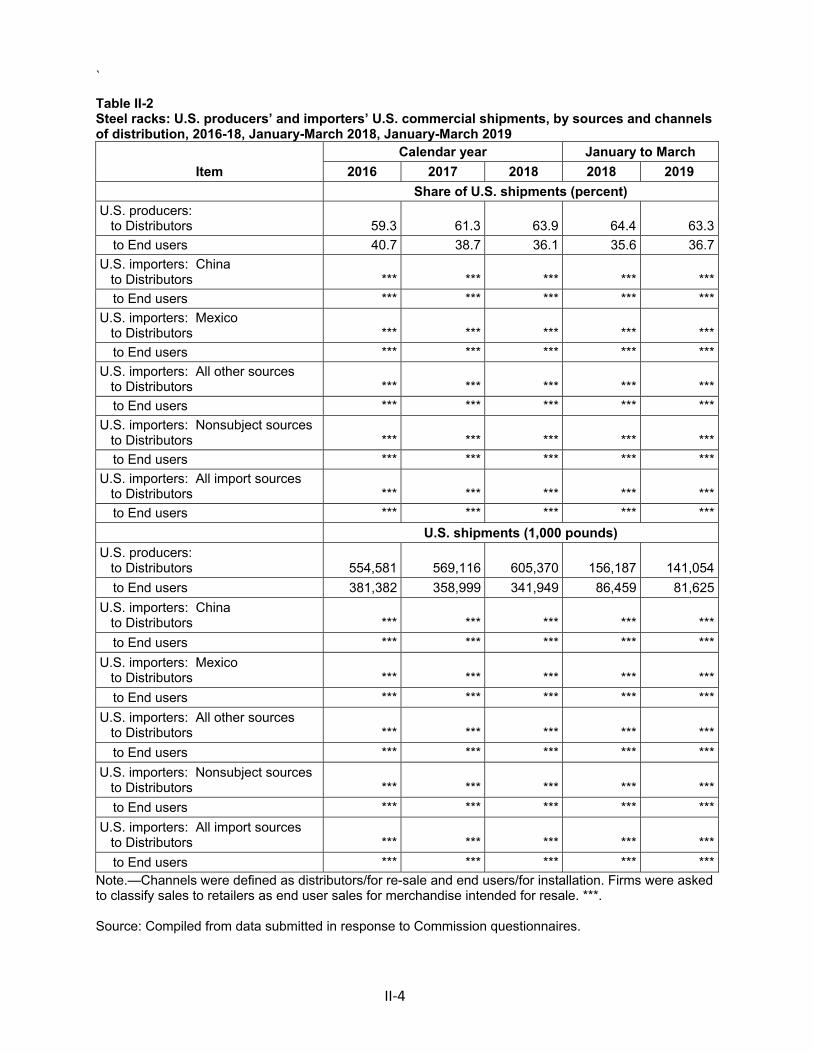
`
II‐4
Table II-2 Steel racks: U.S. producers’ and importers’ U.S. commercial shipments, by sources and channels of distribution, 2016-18, January-March 2018, January-March 2019
Item
Calendar year January to March
2016 2017 2018 2018 2019
Share of U.S. shipments (percent)
U.S. producers: to Distributors 59.3 61.3 63.9 64.4 63.3
to End users 40.7 38.7 36.1 35.6 36.7
U.S. importers: China to Distributors *** *** *** *** ***
to End users *** *** *** *** ***
U.S. importers: Mexico to Distributors *** *** *** *** ***
to End users *** *** *** *** ***
U.S. importers: All other sources to Distributors *** *** *** *** ***
to End users *** *** *** *** ***
U.S. importers: Nonsubject sources to Distributors *** *** *** *** ***
to End users *** *** *** *** ***
U.S. importers: All import sources to Distributors *** *** *** *** ***
to End users *** *** *** *** ***
U.S. shipments (1,000 pounds)
U.S. producers: to Distributors 554,581 569,116 605,370 156,187 141,054
to End users 381,382 358,999 341,949 86,459 81,625
U.S. importers: China to Distributors *** *** *** *** ***
to End users *** *** *** *** ***
U.S. importers: Mexico to Distributors *** *** *** *** ***
to End users *** *** *** *** ***
U.S. importers: All other sources to Distributors *** *** *** *** ***
to End users *** *** *** *** ***
U.S. importers: Nonsubject sources to Distributors *** *** *** *** ***
to End users *** *** *** *** ***
U.S. importers: All import sources to Distributors *** *** *** *** ***
to End users *** *** *** *** *** Note.—Channels were defined as distributors/for re-sale and end users/for installation. Firms were asked to classify sales to retailers as end user sales for merchandise intended for resale. ***. Source: Compiled from data submitted in response to Commission questionnaires.
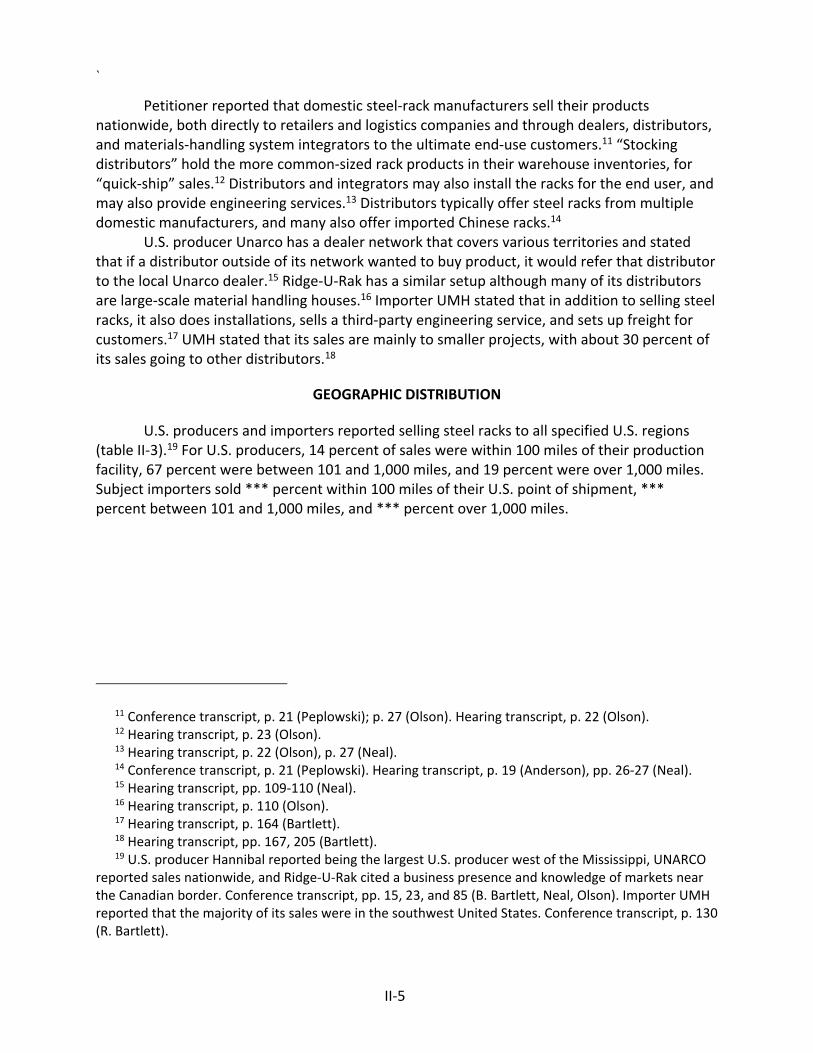
`
II‐5
Petitioner reported that domestic steel‐rack manufacturers sell their products nationwide, both directly to retailers and logistics companies and through dealers, distributors, and materials‐handling system integrators to the ultimate end‐use customers.11 “Stocking distributors” hold the more common‐sized rack products in their warehouse inventories, for “quick‐ship” sales.12 Distributors and integrators may also install the racks for the end user, and may also provide engineering services.13 Distributors typically offer steel racks from multiple domestic manufacturers, and many also offer imported Chinese racks.14
U.S. producer Unarco has a dealer network that covers various territories and stated that if a distributor outside of its network wanted to buy product, it would refer that distributor to the local Unarco dealer.15 Ridge‐U‐Rak has a similar setup although many of its distributors are large‐scale material handling houses.16 Importer UMH stated that in addition to selling steel racks, it also does installations, sells a third‐party engineering service, and sets up freight for customers.17 UMH stated that its sales are mainly to smaller projects, with about 30 percent of its sales going to other distributors.18
GEOGRAPHIC DISTRIBUTION
U.S. producers and importers reported selling steel racks to all specified U.S. regions (table II‐3).19 For U.S. producers, 14 percent of sales were within 100 miles of their production facility, 67 percent were between 101 and 1,000 miles, and 19 percent were over 1,000 miles. Subject importers sold *** percent within 100 miles of their U.S. point of shipment, *** percent between 101 and 1,000 miles, and *** percent over 1,000 miles.
11 Conference transcript, p. 21 (Peplowski); p. 27 (Olson). Hearing transcript, p. 22 (Olson). 12 Hearing transcript, p. 23 (Olson). 13 Hearing transcript, p. 22 (Olson), p. 27 (Neal). 14 Conference transcript, p. 21 (Peplowski). Hearing transcript, p. 19 (Anderson), pp. 26‐27 (Neal). 15 Hearing transcript, pp. 109‐110 (Neal). 16 Hearing transcript, p. 110 (Olson). 17 Hearing transcript, p. 164 (Bartlett). 18 Hearing transcript, pp. 167, 205 (Bartlett). 19 U.S. producer Hannibal reported being the largest U.S. producer west of the Mississippi, UNARCO
reported sales nationwide, and Ridge‐U‐Rak cited a business presence and knowledge of markets near the Canadian border. Conference transcript, pp. 15, 23, and 85 (B. Bartlett, Neal, Olson). Importer UMH reported that the majority of its sales were in the southwest United States. Conference transcript, p. 130 (R. Bartlett).
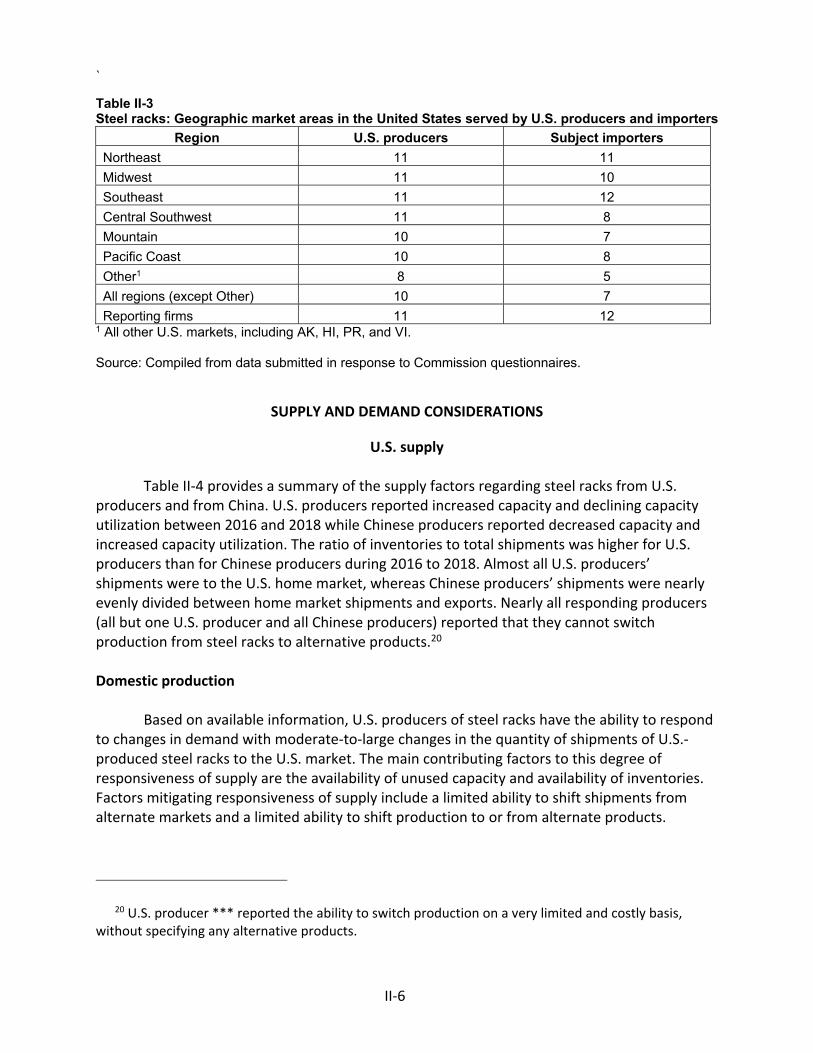
`
II‐6
Table II-3 Steel racks: Geographic market areas in the United States served by U.S. producers and importers
Region U.S. producers Subject importers
Northeast 11 11 Midwest 11 10 Southeast 11 12 Central Southwest 11 8 Mountain 10 7 Pacific Coast 10 8 Other1 8 5 All regions (except Other) 10 7 Reporting firms 11 12
1 All other U.S. markets, including AK, HI, PR, and VI. Source: Compiled from data submitted in response to Commission questionnaires.
SUPPLY AND DEMAND CONSIDERATIONS
U.S. supply Table II‐4 provides a summary of the supply factors regarding steel racks from U.S.
producers and from China. U.S. producers reported increased capacity and declining capacity utilization between 2016 and 2018 while Chinese producers reported decreased capacity and increased capacity utilization. The ratio of inventories to total shipments was higher for U.S. producers than for Chinese producers during 2016 to 2018. Almost all U.S. producers’ shipments were to the U.S. home market, whereas Chinese producers’ shipments were nearly evenly divided between home market shipments and exports. Nearly all responding producers (all but one U.S. producer and all Chinese producers) reported that they cannot switch production from steel racks to alternative products.20
Domestic production
Based on available information, U.S. producers of steel racks have the ability to respond
to changes in demand with moderate‐to‐large changes in the quantity of shipments of U.S.‐produced steel racks to the U.S. market. The main contributing factors to this degree of responsiveness of supply are the availability of unused capacity and availability of inventories. Factors mitigating responsiveness of supply include a limited ability to shift shipments from alternate markets and a limited ability to shift production to or from alternate products.
20 U.S. producer *** reported the ability to switch production on a very limited and costly basis, without specifying any alternative products.
`
II‐7
Table II-4 Steel racks: Supply factors that affect the ability to increase shipments to the U.S. market
Country
Capacity (1,000 pounds)
Capacity utilization (percent)
Ratio of inventories to
total shipments (percent)
Shipments by market, 2018
(percent)
Able to shift to alternate products
2016 2018 2016 2018 2016 2018
Home market
shipments
Exports to non-U.S. markets
No. of firms reporting
“yes” United States *** *** *** *** *** *** *** *** 1 of 10 China *** *** *** *** *** *** *** *** 0 of 6 Note.--Responding U.S. producers accounted for the majority of U.S. production of steel racks in 2018. Responding foreign producer/exporter firms accounted for the majority of U.S. imports of steel racks from China during 2018. For additional data on the number of responding firms and their share of U.S. production and of U.S. imports from each subject country, please refer to Part I, “Summary Data and Data Sources.” Source: Compiled from data submitted in response to Commission questionnaires.
U.S. producers’ capacity utilization declined from 2016 to 2018 as a result of capacity increasing by *** percent while production declined by less than *** percent. Nearly all U.S. production is shipped domestically, with less than *** percent of shipments going to export markets. Barriers to exporting include high transportation costs, as well as uncompetitive pricing that is sometimes related to exchange rates.21
Subject imports from China
Based on available information, producers of steel racks from China have the ability to
respond to changes in demand with moderate changes in the quantity of shipments of steel racks to the U.S. market. The main contributing factors to this degree of responsiveness of supply are some unused capacity and the ability to shift shipments from alternate markets. Factors mitigating responsiveness of supply include limited inventories and a limited ability to shift production to or from alternate products.
Chinese producers’ capacity utilization increased from 2016 to 2018 as a result of capacity declining by *** percent from 2016 to 2018 and production increasing by *** percent. Chinese producers reported exports to other markets including ***. Chinese producers reported that they cannot produce other products on the same equipment used to produce steel racks. Imports from nonsubject sources
Nonsubject imports accounted for *** percent of total U.S. imports, by quantity, in
2018. The largest source of nonsubject imports during January 2016‐March 2018 was Mexico, which accounted for *** percent of the quantity of nonsubject imports in 2018. U.S. producers Interlake and Frazier accounted for *** reported imports from Mexico during the period.
21 Conference transcript, pp. 59, 60, 68 (Neal, Olson).
`
II‐8
Supply constraints
Most responding firms reported no supply constraints. No U.S. producers, 5 of 15 importers, and 10 of 26 purchasers reported that they experienced supply constraints since January 1, 2016.
Among importers, *** reported a lack of manufacturers of tire racks and very long delays (including with its Chinese suppliers), *** reported that it had insufficient inventories to meet customer orders, *** reported that U.S. producers’ lead times were running into backorders of up to 5 weeks, *** reported that domestic manufacturers lack the capacity to process orders, and *** reported that it has had occasionally missed shipments and late deliveries since 2016.
Among the purchasers reporting supply constraints, five firms reported long lead times and issues with suppliers meeting deadlines. Among end user/retailers, *** stated that lead times have increased and that inventories are low and *** stated that U.S. manufacturers cannot meet project timelines. Among distributors, *** stated that some suppliers have not been able to meet deadlines, *** reported very extended lead times and that it has switched suppliers based upon availability and ability to meet requested ship dates, and *** reported “unacceptably long” delivery times. Distributor *** stated that current lead times for U.S. produced pallet racks are so long that steel racks from China can be manufactured and shipped to the United States faster than *** is able to receive delivery from a U.S. producer.
Two steel racks distributors stated that some U.S. producers will not sell them steel racks. *** stated that its “best domestic supplier” will not sell to it since the supplier has an exclusive agreement with *** competition. *** stated that it has made attempts to become a distributor of U.S.‐produced pallet racks manufactured by *** but that these firms will not sell directly to *** because they already have other distributors in the area. It further stated that there are only two U.S. manufacturers (***) willing to sell pallet rack to it, but that these manufacturers’ pricing and lead times are not competitive with Interlake.
Among other purchasers reporting supply constraints, distributor *** reported that some suppliers did not offer competitive pricing, distributor *** stated that a major Chinese importer, North Shore, has gone out of business, and distributor *** stated that it received two truckloads of defective steel racks from U.S. producer Hannibal that had to be returned.22 New suppliers
Four of 26 purchasers indicated that new suppliers have entered the U.S. steel racks
market since January 1, 2016. All four purchasers listed suppliers of Chinese product, including importers North Shore and UMH, and one purchaser also cited U.S. producer Pacific Bend.23
22 The specific problems were incorrect welding on cross bars on uprights; brackets on beams were backwards; footplates on uprights were welded on top of upright, not bottom; and “horrible” paint job.
23 ***.
`
II‐9
U.S. demand Demand for steel racks is largely driven by broad economic growth and demand for
storage in warehousing and distribution centers. Based on available information, the overall demand for steel racks is likely to experience small‐to‐moderate changes in response to changes in price. The main contributing factors are the large cost share of steel racks relative to the cost of the installed product but limited substitute products for holding and storing products and materials.
End uses and cost share
Reported end uses include wire shelving, pallet racks, audio racks, furniture storage, e‐commerce distribution center infrastructure, and storage of other consumer materials. Steel racks are essentially a finished product once they are fully assembled and installed. Assembly and installation costs vary based on multiple factors including the project scale and rack designs and configurations. Reported cost shares for fully assembled and installed steel racks ranged from 10 percent to 100 percent, with most firms indicating that steel racks accounted for 50 percent or more of the installed cost share.
Business cycles
Steel racks typically have long lifespans, with new demand primarily coming from additional storage needs, or for the replacement of racks that were damaged by material handling vehicles.24
Most firms (5 of 10 U.S. producers, 10 of 14 importers, and 24 of 26 purchasers) indicated that the market was not subject to business cycles. Among firms reporting cycles, several U.S. producers reported seasonal demand, with lower sales during the winter. U.S. producer *** reported higher demand as retailers prepare sites for busy construction and home building seasons and before the holidays begin. *** reported that the retail part of its business is seasonal with the fourth quarter generally slower, and *** similarly reported lower volume during winter months. Importer *** stated that demand typically slows in mid‐summer when decision makers are taking vacations, and also slows in the fall due to the holiday season. Purchaser *** stated that the market was subject to fiscal year budgeting, holidays, and new store openings, and purchaser *** stated that purchases are historically highest from March to September and slower during the winter.
24 Conference transcript, p. 108 (B. Bartlett).
`
II‐10
Demand trends Most responding U.S. producers, importers, and purchasers reported an increase in U.S.
demand for steel racks since January 1, 2016 (table II‐5). Firms attributed increased demand to overall economic growth and growth in e‐commerce. Purchaser *** stated as follows: “the rapid expansion of warehousing in the United States has caused the demand for pallet racking to skyrocket. Hundreds of millions of square footage of new warehouses are currently under construction in the U.S. and the vast majority of these will require some kind of material handling storage solution.”
Table II-5 Steel racks: Firms’ responses regarding U.S. demand and demand outside the United States
Item Increase No change Decrease Fluctuate Demand inside the United States: U.S. producers 6 1 --- 3 Importers 9 2 1 4 Purchasers 17 3 --- 5 Demand outside the United States: U.S. producers 2 2 2 1 Importers 5 2 --- 2 Purchasers 2 3 1 3 Demand for end use product(s): Purchasers 3 6 1 1
Source: Compiled from data submitted in response to Commission questionnaires. Substitute products
Most responding firms (all responding U.S. producers, 13 of 14 importers, and 21 of 25 purchasers) reported that there are no substitutes for steel racks. The five firms that reported substitutes listed shelving, stackable pallets, wood racks, plastic racks, aluminum racks, and out‐of‐scope steel racks, although firms indicated that substitutes may not meet weight and safety requirements and may be more expensive than steel racks. All but one of the four purchasers reporting substitutes stated that changes in the price of substitutes had not affected the price for steel racks.
SUBSTITUTABILITY ISSUES The degree of substitution between domestic and imported steel racks depends on such
factors as steel gauge, dimensions, coating/galvanization, connecting mechanisms, load capacity, lead times between order and delivery dates, and RMI certification or other code specification. Based on available data, staff believes that there is a high degree of substitutability between domestically produced steel racks and steel racks imported from China.
`
II‐11
Lead times U.S. producers’ steel racks are primarily produced‐to‐order while steel racks from
importers are primarily sold from inventory. U.S. producers reported that 75 percent of their commercial shipments were produced‐to‐order, with lead times averaging 51 days. The remaining 25 percent of their commercial shipments came from inventories, with lead times averaging 19 days. All responding U.S. producers reported that all or most of their shipments were produced‐to‐order except ***.
In contrast, importers of steel racks from China reported that 83 percent of their commercial shipments were from U.S. inventories, with lead times averaging 8 days; 11 percent were produced‐to‐order, with lead times averaging 68 days; and 7 percent were from foreign inventories, with lead times averaging 56 days.
Most U.S. producers do not typically hold inventories, but rather rely on their distributors to hold the inventories whereas importers have their own warehouses.25 Lead times are shorter for “commodity‐type” steel racks for smaller projects, and stocking distributors maintain large inventories of these types of products, whereas lead times for steel racks for large‐scale, fully engineered projects are longer.26 U.S. producer Wireway Husky stated that it ships standard size uprights and beams, which comprise 25 to 50 percent of its business, within 48 hours.27 Similarly Speedrack stated that 20 to 25 percent of its shipments are through stocking distributors, and that these shipments are standard beams that compete with subject imports.28 Speedrack reserves a certain amount of its production for its stocking dealers so that its dealers can generally get the products within 4 to 5 weeks.29 Steel King maintains an inventory of components for its dealers which Steel King generally ships within 48 hours.30 Ridg‐U‐Rak’s stocking distributors have reservation orders placed 3 to 4 months in advance with frequent shipments to the distributors.31
Importer UMH stated that it holds a large inventory of imported steel racks, and supplies its customers in an average of 8 days.32 UMH’s lead time from China to its U.S. warehouse is about 6 to 7 weeks.33
25 Hearing transcript, pp. 87‐88 (Drake). 26 Ridg‐U‐Rak does not maintain inventories. Hearing transcript, pp. 51‐52 (Olson). 27 Hearing transcript, pp. 48‐49 (Young). 28 Hearing transcript, p. 49 (Quist). 29 Hearing transcript, p. 74 (Quist). 30 Hearing transcript, p. 51 (Anderson). 31 Hearing transcript, p. 73 (Olson). 32 Hearing transcript, p. 143 (Bartlett). 33 Hearing transcript, p. 198 (Bartlett).
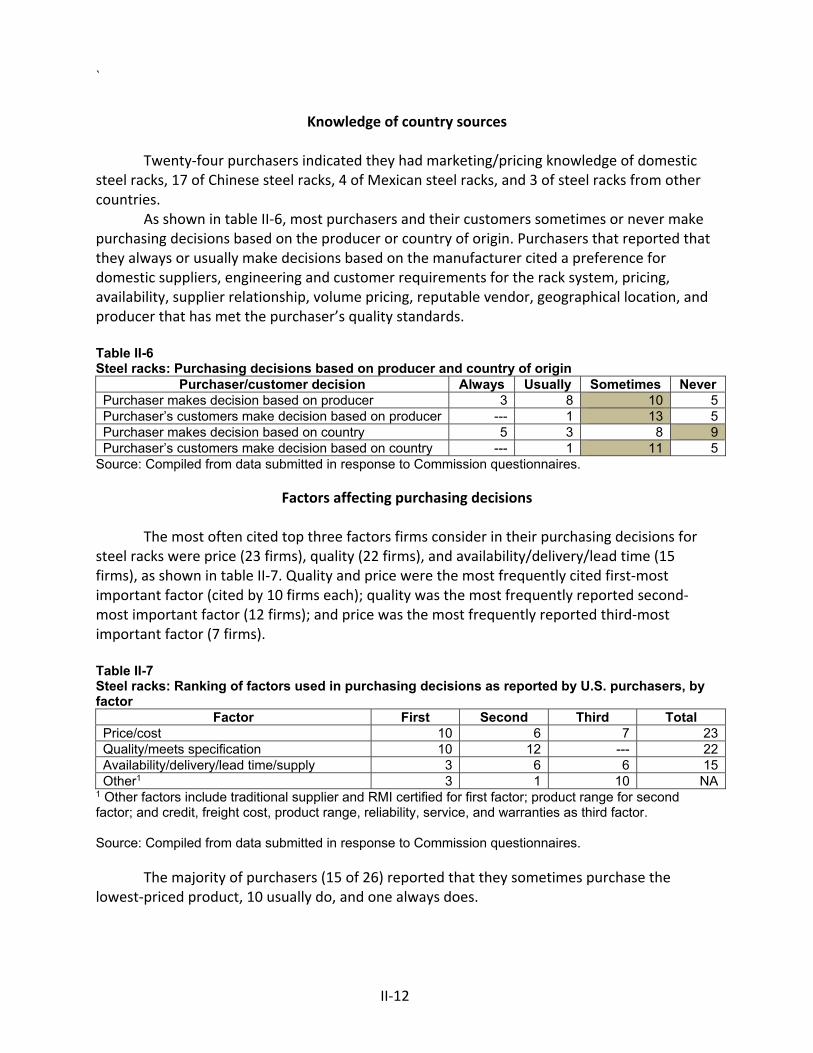
`
II‐12
Knowledge of country sources Twenty‐four purchasers indicated they had marketing/pricing knowledge of domestic
steel racks, 17 of Chinese steel racks, 4 of Mexican steel racks, and 3 of steel racks from other countries.
As shown in table II‐6, most purchasers and their customers sometimes or never make purchasing decisions based on the producer or country of origin. Purchasers that reported that they always or usually make decisions based on the manufacturer cited a preference for domestic suppliers, engineering and customer requirements for the rack system, pricing, availability, supplier relationship, volume pricing, reputable vendor, geographical location, and producer that has met the purchaser’s quality standards.
Table II-6 Steel racks: Purchasing decisions based on producer and country of origin
Purchaser/customer decision Always Usually Sometimes Never Purchaser makes decision based on producer 3 8 10 5 Purchaser’s customers make decision based on producer --- 1 13 5 Purchaser makes decision based on country 5 3 8 9 Purchaser’s customers make decision based on country --- 1 11 5
Source: Compiled from data submitted in response to Commission questionnaires.
Factors affecting purchasing decisions The most often cited top three factors firms consider in their purchasing decisions for
steel racks were price (23 firms), quality (22 firms), and availability/delivery/lead time (15 firms), as shown in table II‐7. Quality and price were the most frequently cited first‐most important factor (cited by 10 firms each); quality was the most frequently reported second‐most important factor (12 firms); and price was the most frequently reported third‐most important factor (7 firms).
Table II-7 Steel racks: Ranking of factors used in purchasing decisions as reported by U.S. purchasers, by factor
Factor First Second Third Total Price/cost 10 6 7 23 Quality/meets specification 10 12 --- 22 Availability/delivery/lead time/supply 3 6 6 15 Other1 3 1 10 NA
1 Other factors include traditional supplier and RMI certified for first factor; product range for second factor; and credit, freight cost, product range, reliability, service, and warranties as third factor. Source: Compiled from data submitted in response to Commission questionnaires.
The majority of purchasers (15 of 26) reported that they sometimes purchase the lowest‐priced product, 10 usually do, and one always does.
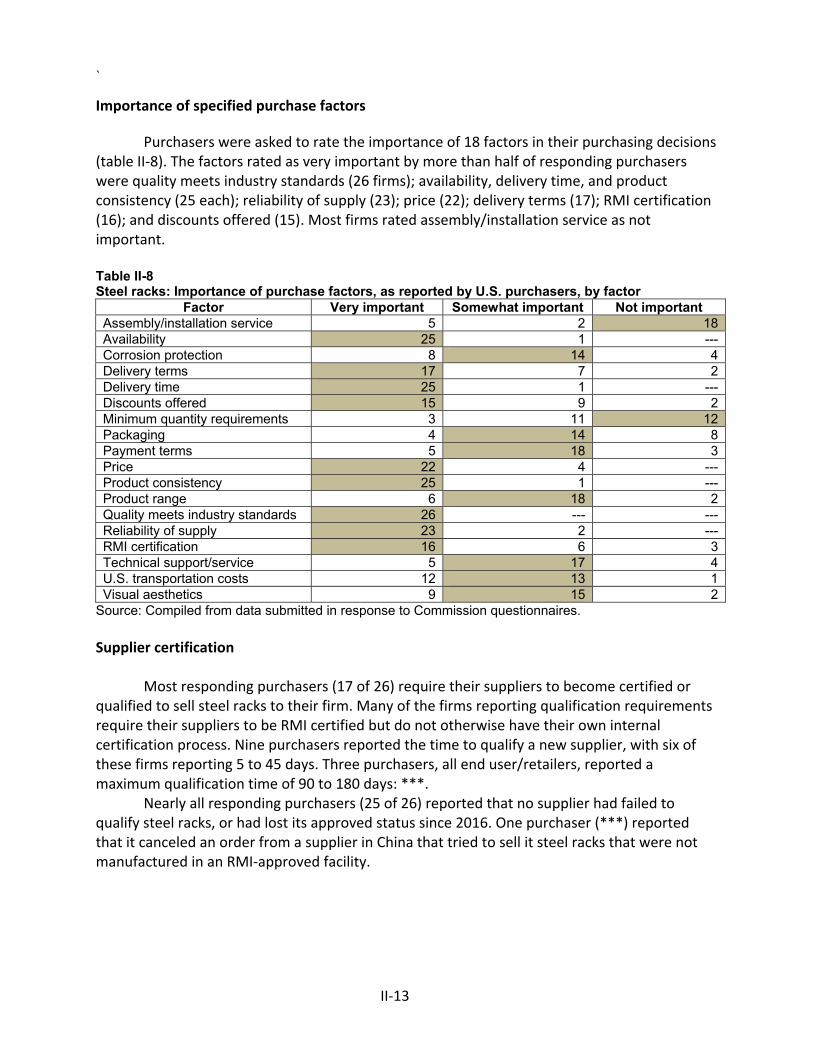
`
II‐13
Importance of specified purchase factors
Purchasers were asked to rate the importance of 18 factors in their purchasing decisions (table II‐8). The factors rated as very important by more than half of responding purchasers were quality meets industry standards (26 firms); availability, delivery time, and product consistency (25 each); reliability of supply (23); price (22); delivery terms (17); RMI certification (16); and discounts offered (15). Most firms rated assembly/installation service as not important.
Table II-8 Steel racks: Importance of purchase factors, as reported by U.S. purchasers, by factor
Factor Very important Somewhat important Not important Assembly/installation service 5 2 18 Availability 25 1 --- Corrosion protection 8 14 4 Delivery terms 17 7 2 Delivery time 25 1 --- Discounts offered 15 9 2 Minimum quantity requirements 3 11 12 Packaging 4 14 8 Payment terms 5 18 3 Price 22 4 --- Product consistency 25 1 --- Product range 6 18 2 Quality meets industry standards 26 --- --- Reliability of supply 23 2 --- RMI certification 16 6 3 Technical support/service 5 17 4 U.S. transportation costs 12 13 1 Visual aesthetics 9 15 2
Source: Compiled from data submitted in response to Commission questionnaires.
Supplier certification Most responding purchasers (17 of 26) require their suppliers to become certified or
qualified to sell steel racks to their firm. Many of the firms reporting qualification requirements require their suppliers to be RMI certified but do not otherwise have their own internal certification process. Nine purchasers reported the time to qualify a new supplier, with six of these firms reporting 5 to 45 days. Three purchasers, all end user/retailers, reported a maximum qualification time of 90 to 180 days: ***.
Nearly all responding purchasers (25 of 26) reported that no supplier had failed to qualify steel racks, or had lost its approved status since 2016. One purchaser (***) reported that it canceled an order from a supplier in China that tried to sell it steel racks that were not manufactured in an RMI‐approved facility.
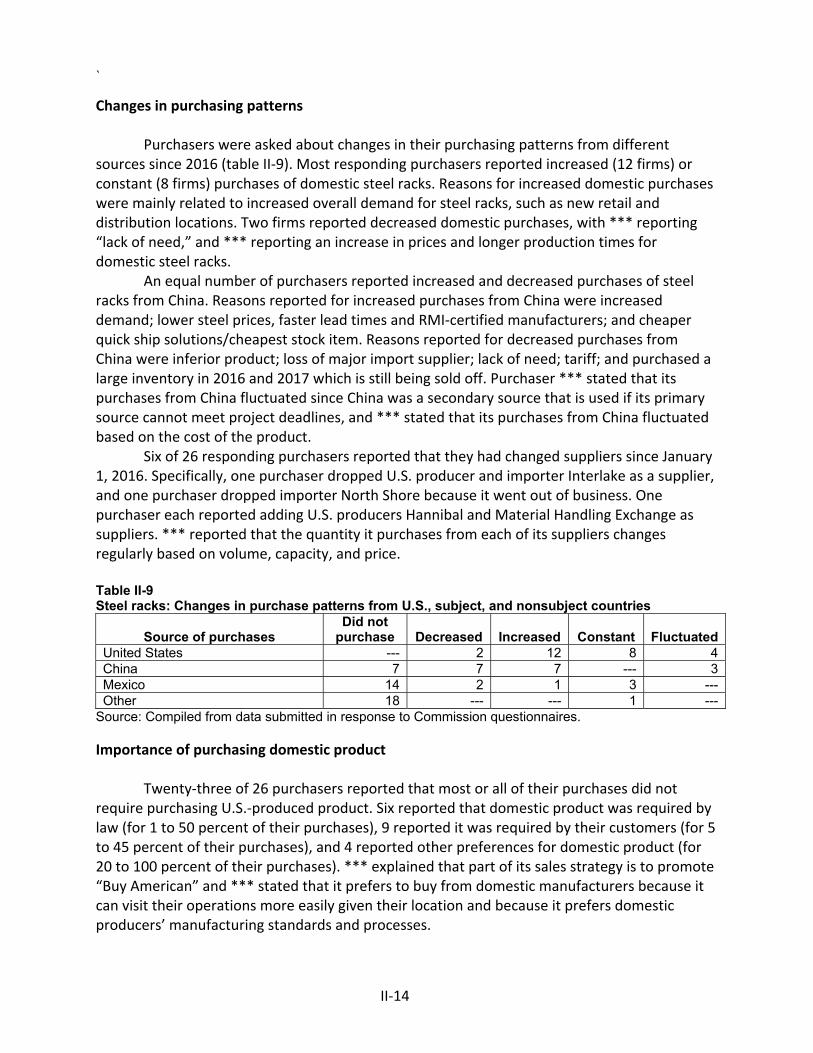
`
II‐14
Changes in purchasing patterns Purchasers were asked about changes in their purchasing patterns from different
sources since 2016 (table II‐9). Most responding purchasers reported increased (12 firms) or constant (8 firms) purchases of domestic steel racks. Reasons for increased domestic purchases were mainly related to increased overall demand for steel racks, such as new retail and distribution locations. Two firms reported decreased domestic purchases, with *** reporting “lack of need,” and *** reporting an increase in prices and longer production times for domestic steel racks.
An equal number of purchasers reported increased and decreased purchases of steel racks from China. Reasons reported for increased purchases from China were increased demand; lower steel prices, faster lead times and RMI‐certified manufacturers; and cheaper quick ship solutions/cheapest stock item. Reasons reported for decreased purchases from China were inferior product; loss of major import supplier; lack of need; tariff; and purchased a large inventory in 2016 and 2017 which is still being sold off. Purchaser *** stated that its purchases from China fluctuated since China was a secondary source that is used if its primary source cannot meet project deadlines, and *** stated that its purchases from China fluctuated based on the cost of the product.
Six of 26 responding purchasers reported that they had changed suppliers since January 1, 2016. Specifically, one purchaser dropped U.S. producer and importer Interlake as a supplier, and one purchaser dropped importer North Shore because it went out of business. One purchaser each reported adding U.S. producers Hannibal and Material Handling Exchange as suppliers. *** reported that the quantity it purchases from each of its suppliers changes regularly based on volume, capacity, and price.
Table II-9 Steel racks: Changes in purchase patterns from U.S., subject, and nonsubject countries
Source of purchases Did not
purchase Decreased Increased Constant Fluctuated United States --- 2 12 8 4 China 7 7 7 --- 3 Mexico 14 2 1 3 --- Other 18 --- --- 1 ---
Source: Compiled from data submitted in response to Commission questionnaires. Importance of purchasing domestic product
Twenty‐three of 26 purchasers reported that most or all of their purchases did not
require purchasing U.S.‐produced product. Six reported that domestic product was required by law (for 1 to 50 percent of their purchases), 9 reported it was required by their customers (for 5 to 45 percent of their purchases), and 4 reported other preferences for domestic product (for 20 to 100 percent of their purchases). *** explained that part of its sales strategy is to promote “Buy American” and *** stated that it prefers to buy from domestic manufacturers because it can visit their operations more easily given their location and because it prefers domestic producers’ manufacturing standards and processes.
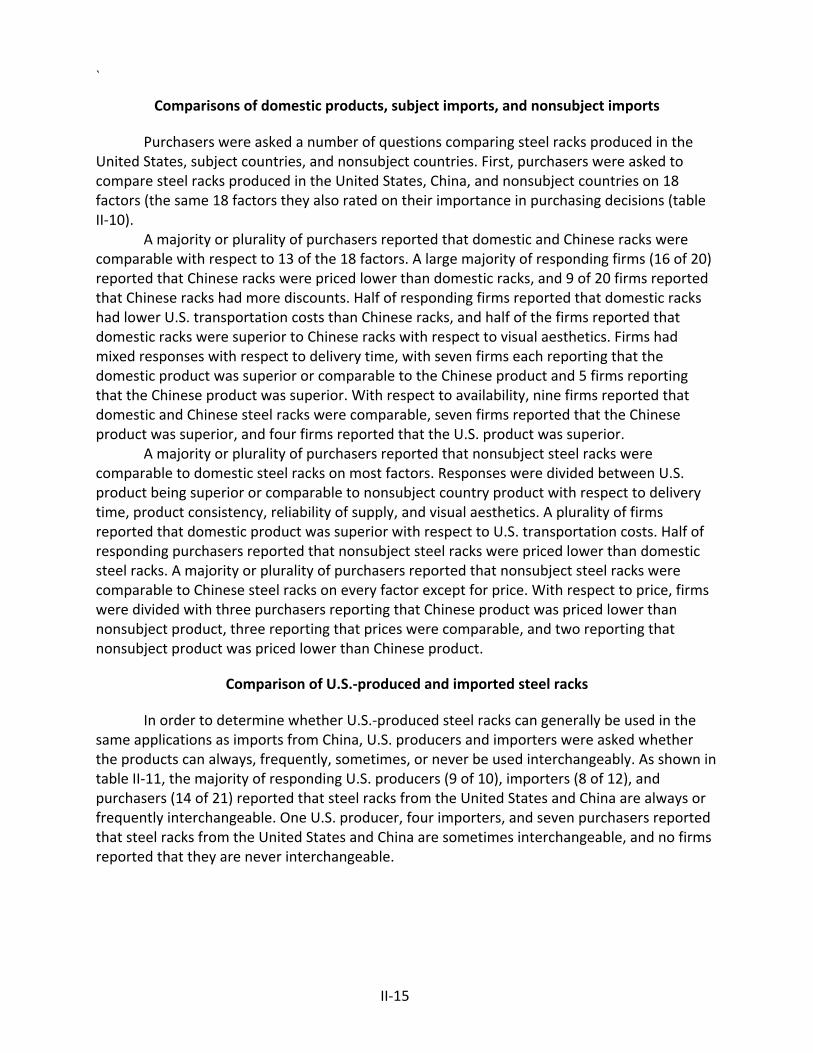
`
II‐15
Comparisons of domestic products, subject imports, and nonsubject imports
Purchasers were asked a number of questions comparing steel racks produced in the United States, subject countries, and nonsubject countries. First, purchasers were asked to compare steel racks produced in the United States, China, and nonsubject countries on 18 factors (the same 18 factors they also rated on their importance in purchasing decisions (table II‐10).
A majority or plurality of purchasers reported that domestic and Chinese racks were comparable with respect to 13 of the 18 factors. A large majority of responding firms (16 of 20) reported that Chinese racks were priced lower than domestic racks, and 9 of 20 firms reported that Chinese racks had more discounts. Half of responding firms reported that domestic racks had lower U.S. transportation costs than Chinese racks, and half of the firms reported that domestic racks were superior to Chinese racks with respect to visual aesthetics. Firms had mixed responses with respect to delivery time, with seven firms each reporting that the domestic product was superior or comparable to the Chinese product and 5 firms reporting that the Chinese product was superior. With respect to availability, nine firms reported that domestic and Chinese steel racks were comparable, seven firms reported that the Chinese product was superior, and four firms reported that the U.S. product was superior.
A majority or plurality of purchasers reported that nonsubject steel racks were comparable to domestic steel racks on most factors. Responses were divided between U.S. product being superior or comparable to nonsubject country product with respect to delivery time, product consistency, reliability of supply, and visual aesthetics. A plurality of firms reported that domestic product was superior with respect to U.S. transportation costs. Half of responding purchasers reported that nonsubject steel racks were priced lower than domestic steel racks. A majority or plurality of purchasers reported that nonsubject steel racks were comparable to Chinese steel racks on every factor except for price. With respect to price, firms were divided with three purchasers reporting that Chinese product was priced lower than nonsubject product, three reporting that prices were comparable, and two reporting that nonsubject product was priced lower than Chinese product.
Comparison of U.S.‐produced and imported steel racks
In order to determine whether U.S.‐produced steel racks can generally be used in the same applications as imports from China, U.S. producers and importers were asked whether the products can always, frequently, sometimes, or never be used interchangeably. As shown in table II‐11, the majority of responding U.S. producers (9 of 10), importers (8 of 12), and purchasers (14 of 21) reported that steel racks from the United States and China are always or frequently interchangeable. One U.S. producer, four importers, and seven purchasers reported that steel racks from the United States and China are sometimes interchangeable, and no firms reported that they are never interchangeable.
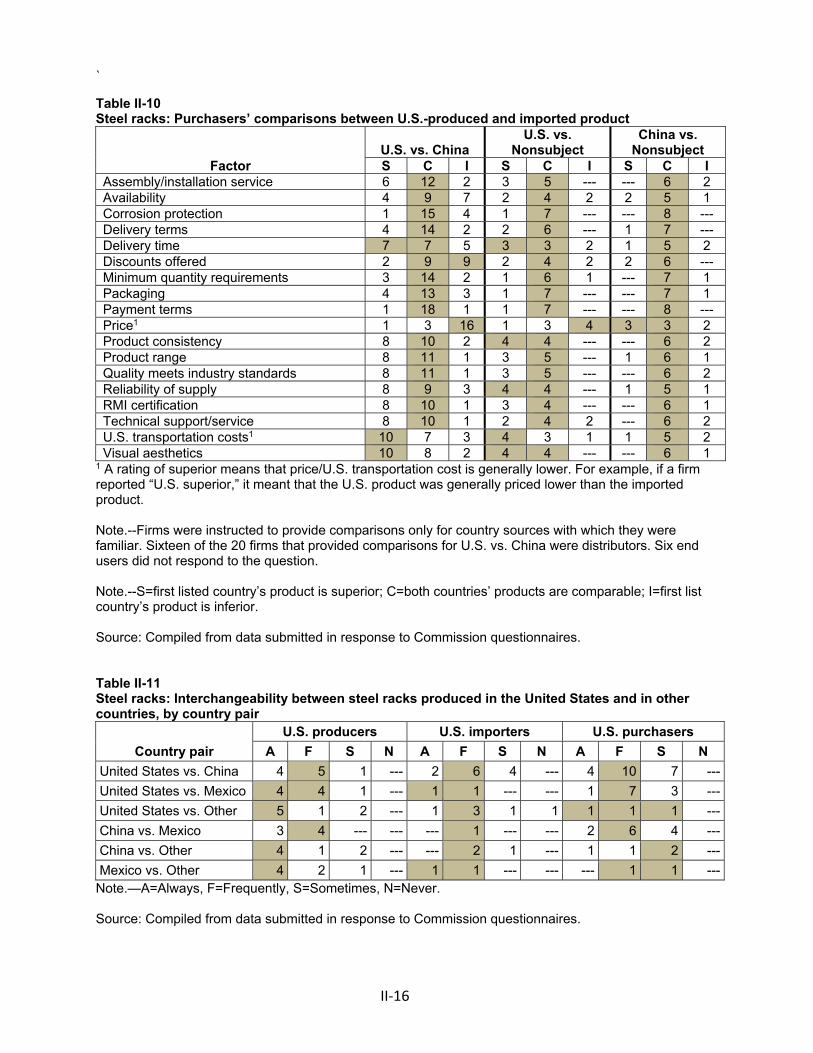
`
II‐16
Table II-10 Steel racks: Purchasers’ comparisons between U.S.-produced and imported product
Factor U.S. vs. China
U.S. vs. Nonsubject
China vs. Nonsubject
S C I S C I S C I Assembly/installation service 6 12 2 3 5 --- --- 6 2 Availability 4 9 7 2 4 2 2 5 1 Corrosion protection 1 15 4 1 7 --- --- 8 --- Delivery terms 4 14 2 2 6 --- 1 7 --- Delivery time 7 7 5 3 3 2 1 5 2 Discounts offered 2 9 9 2 4 2 2 6 --- Minimum quantity requirements 3 14 2 1 6 1 --- 7 1 Packaging 4 13 3 1 7 --- --- 7 1 Payment terms 1 18 1 1 7 --- --- 8 --- Price1 1 3 16 1 3 4 3 3 2 Product consistency 8 10 2 4 4 --- --- 6 2 Product range 8 11 1 3 5 --- 1 6 1 Quality meets industry standards 8 11 1 3 5 --- --- 6 2 Reliability of supply 8 9 3 4 4 --- 1 5 1 RMI certification 8 10 1 3 4 --- --- 6 1 Technical support/service 8 10 1 2 4 2 --- 6 2 U.S. transportation costs1 10 7 3 4 3 1 1 5 2 Visual aesthetics 10 8 2 4 4 --- --- 6 1
1 A rating of superior means that price/U.S. transportation cost is generally lower. For example, if a firm reported “U.S. superior,” it meant that the U.S. product was generally priced lower than the imported product. Note.--Firms were instructed to provide comparisons only for country sources with which they were familiar. Sixteen of the 20 firms that provided comparisons for U.S. vs. China were distributors. Six end users did not respond to the question. Note.--S=first listed country’s product is superior; C=both countries’ products are comparable; I=first list country’s product is inferior. Source: Compiled from data submitted in response to Commission questionnaires. Table II-11 Steel racks: Interchangeability between steel racks produced in the United States and in other countries, by country pair
Country pair
U.S. producers U.S. importers U.S. purchasers
A F S N A F S N A F S N
United States vs. China 4 5 1 --- 2 6 4 --- 4 10 7 ---
United States vs. Mexico 4 4 1 --- 1 1 --- --- 1 7 3 ---
United States vs. Other 5 1 2 --- 1 3 1 1 1 1 1 ---
China vs. Mexico 3 4 --- --- --- 1 --- --- 2 6 4 ---
China vs. Other 4 1 2 --- --- 2 1 --- 1 1 2 ---
Mexico vs. Other 4 2 1 --- 1 1 --- --- --- 1 1 --- Note.—A=Always, F=Frequently, S=Sometimes, N=Never. Source: Compiled from data submitted in response to Commission questionnaires.
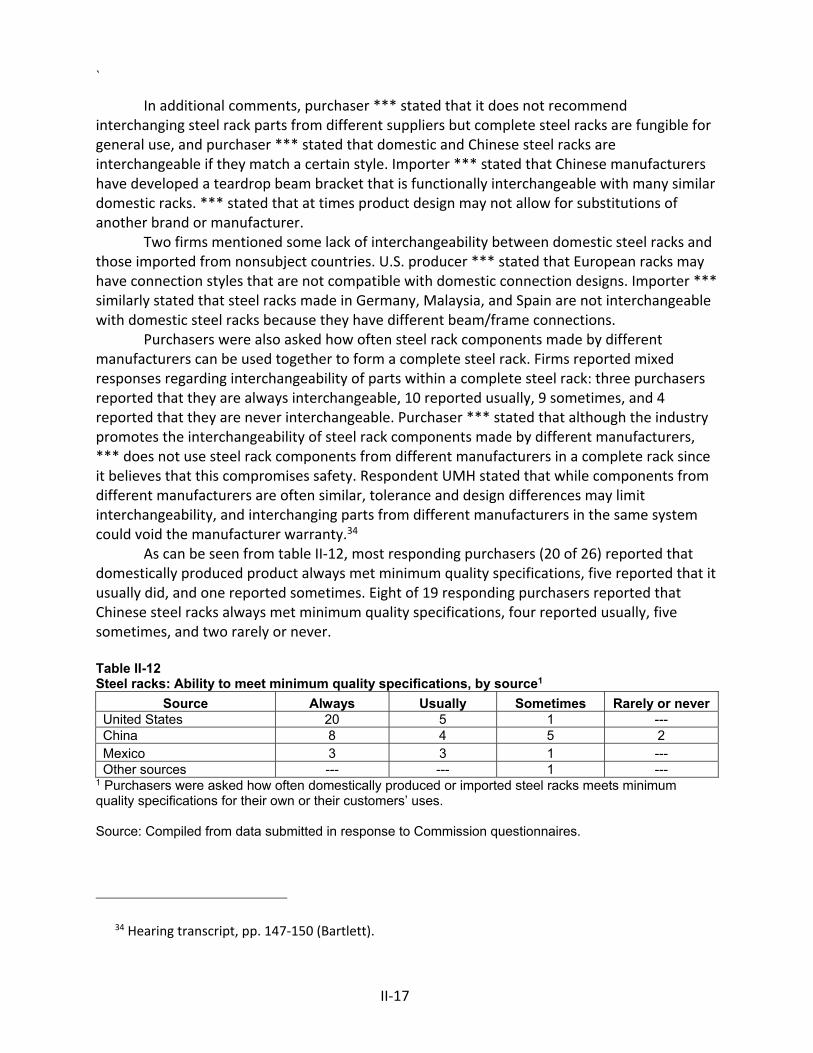
`
II‐17
In additional comments, purchaser *** stated that it does not recommend interchanging steel rack parts from different suppliers but complete steel racks are fungible for general use, and purchaser *** stated that domestic and Chinese steel racks are interchangeable if they match a certain style. Importer *** stated that Chinese manufacturers have developed a teardrop beam bracket that is functionally interchangeable with many similar domestic racks. *** stated that at times product design may not allow for substitutions of another brand or manufacturer.
Two firms mentioned some lack of interchangeability between domestic steel racks and those imported from nonsubject countries. U.S. producer *** stated that European racks may have connection styles that are not compatible with domestic connection designs. Importer *** similarly stated that steel racks made in Germany, Malaysia, and Spain are not interchangeable with domestic steel racks because they have different beam/frame connections.
Purchasers were also asked how often steel rack components made by different manufacturers can be used together to form a complete steel rack. Firms reported mixed responses regarding interchangeability of parts within a complete steel rack: three purchasers reported that they are always interchangeable, 10 reported usually, 9 sometimes, and 4 reported that they are never interchangeable. Purchaser *** stated that although the industry promotes the interchangeability of steel rack components made by different manufacturers, *** does not use steel rack components from different manufacturers in a complete rack since it believes that this compromises safety. Respondent UMH stated that while components from different manufacturers are often similar, tolerance and design differences may limit interchangeability, and interchanging parts from different manufacturers in the same system could void the manufacturer warranty.34
As can be seen from table II‐12, most responding purchasers (20 of 26) reported that domestically produced product always met minimum quality specifications, five reported that it usually did, and one reported sometimes. Eight of 19 responding purchasers reported that Chinese steel racks always met minimum quality specifications, four reported usually, five sometimes, and two rarely or never.
Table II-12 Steel racks: Ability to meet minimum quality specifications, by source1
Source Always Usually Sometimes Rarely or never United States 20 5 1 --- China 8 4 5 2 Mexico 3 3 1 --- Other sources --- --- 1 ---
1 Purchasers were asked how often domestically produced or imported steel racks meets minimum quality specifications for their own or their customers’ uses. Source: Compiled from data submitted in response to Commission questionnaires.
34 Hearing transcript, pp. 147‐150 (Bartlett).
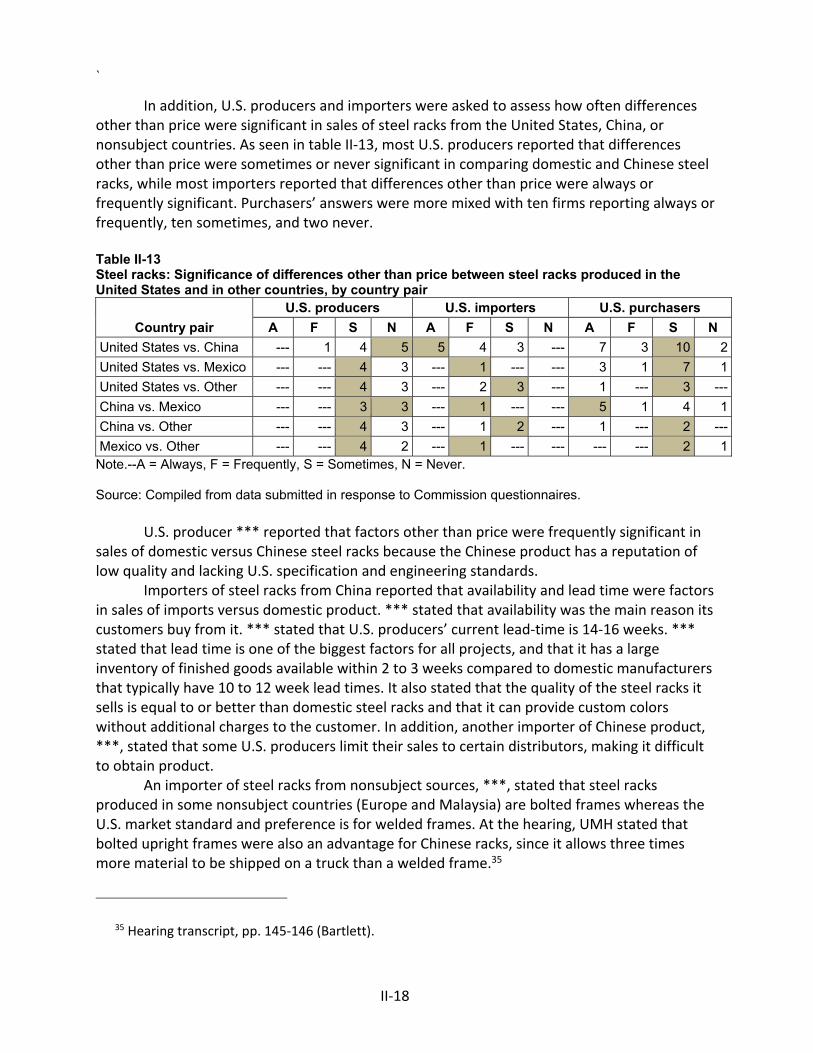
`
II‐18
In addition, U.S. producers and importers were asked to assess how often differences other than price were significant in sales of steel racks from the United States, China, or nonsubject countries. As seen in table II‐13, most U.S. producers reported that differences other than price were sometimes or never significant in comparing domestic and Chinese steel racks, while most importers reported that differences other than price were always or frequently significant. Purchasers’ answers were more mixed with ten firms reporting always or frequently, ten sometimes, and two never.
Table II-13 Steel racks: Significance of differences other than price between steel racks produced in the United States and in other countries, by country pair
Country pair
U.S. producers U.S. importers U.S. purchasers
A F S N A F S N A F S N
United States vs. China --- 1 4 5 5 4 3 --- 7 3 10 2
United States vs. Mexico --- --- 4 3 --- 1 --- --- 3 1 7 1
United States vs. Other --- --- 4 3 --- 2 3 --- 1 --- 3 ---
China vs. Mexico --- --- 3 3 --- 1 --- --- 5 1 4 1
China vs. Other --- --- 4 3 --- 1 2 --- 1 --- 2 ---
Mexico vs. Other --- --- 4 2 --- 1 --- --- --- --- 2 1 Note.--A = Always, F = Frequently, S = Sometimes, N = Never. Source: Compiled from data submitted in response to Commission questionnaires.
U.S. producer *** reported that factors other than price were frequently significant in
sales of domestic versus Chinese steel racks because the Chinese product has a reputation of low quality and lacking U.S. specification and engineering standards.
Importers of steel racks from China reported that availability and lead time were factors in sales of imports versus domestic product. *** stated that availability was the main reason its customers buy from it. *** stated that U.S. producers’ current lead‐time is 14‐16 weeks. *** stated that lead time is one of the biggest factors for all projects, and that it has a large inventory of finished goods available within 2 to 3 weeks compared to domestic manufacturers that typically have 10 to 12 week lead times. It also stated that the quality of the steel racks it sells is equal to or better than domestic steel racks and that it can provide custom colors without additional charges to the customer. In addition, another importer of Chinese product, ***, stated that some U.S. producers limit their sales to certain distributors, making it difficult to obtain product.
An importer of steel racks from nonsubject sources, ***, stated that steel racks produced in some nonsubject countries (Europe and Malaysia) are bolted frames whereas the U.S. market standard and preference is for welded frames. At the hearing, UMH stated that bolted upright frames were also an advantage for Chinese racks, since it allows three times more material to be shipped on a truck than a welded frame.35
35 Hearing transcript, pp. 145‐146 (Bartlett).
`
II‐19
Some purchasers reported that lead times and quality were factors in their purchases of steel racks from different sources. Purchaser *** stated that the Spectrum brand of Chinese steel racks has much better quality than steel racks manufactured in the United States and Mexico. *** stated that the prices of domestic and Chinese steel racks are very similar, and the main differences are delivery time and shipping cost to truck the material to the site. *** stated that quality, transportation, and technical support are significant non‐price differences between domestic product, Mexican, and Chinese product. Retailer *** stated that it often opts for domestic steel racks because of shorter lead times while distributor *** stated that its Chinese supplier typically has shorter lead times than domestic manufacturers.
ELASTICITY ESTIMATES
This section discusses elasticity estimates. Parties did not comment on these estimates in either their prehearing or posthearing briefs.
U.S. supply elasticity The domestic supply elasticity36 for steel racks measures the sensitivity of the quantity
supplied by U.S. producers to changes in the U.S. market price of steel racks. The elasticity of domestic supply depends on several factors including the level of excess capacity, the ease with which producers can alter capacity, producers’ ability to shift to production of other products, the existence of inventories, and the availability of alternate markets for U.S.‐produced steel racks. Analysis of these factors above indicates that the U.S. industry has the ability to moderately increase or decrease shipments to the U.S. market; an estimate in the range of 3 to 6 is suggested.
U.S. demand elasticity
The U.S. demand elasticity for steel racks measures the sensitivity of the overall quantity demanded to a change in the U.S. market price of steel racks. This estimate depends on factors discussed above such as the existence, availability, and commercial viability of substitute products, as well as the component share of the steel racks in the production of any downstream products. Based on the available information, the aggregate demand for steel racks is likely to be inelastic; a range of ‐0.5 to ‐0.9 is suggested.
Substitution elasticity
The elasticity of substitution depends upon the extent of product differentiation between the domestic and imported products.37 Product differentiation, in turn, depends upon
36 A supply function is not defined in the case of a non‐competitive market. 37 The substitution elasticity measures the responsiveness of the relative U.S. consumption levels of
the subject imports and the domestic like products to changes in their relative prices. This reflects how (continued...)
`
II‐20
such factors as quality (e.g., steel gauge, dimensions, coating, connecting mechanisms, load capacity, etc.) and conditions of sale (e.g., availability, sales terms/discounts/promotions, lead times, etc.). Based on available information, the elasticity of substitution between U.S.‐produced steel racks and imported steel racks is likely to be in the range of 3 to 5.
(…continued) easily purchasers switch from the U.S. product to the subject products (or vice versa) when prices change.
III‐1
PART III: U.S. PRODUCERS’ PRODUCTION, SHIPMENTS, AND EMPLOYMENT
The Commission analyzes a number of factors in making injury determinations (see 19 U.S.C. §§ 1677(7)(B) and 1677(7)(C)). Information on the subsidies and dumping margins was presented in Part I of this report and information on the volume and pricing of imports of the subject merchandise is presented in Part IV and Part V. Information on the other factors specified is presented in this section and/or Part VI and (except as noted) is based on the questionnaire responses of 10 firms that accounted for the majority of U.S. production of steel racks during 2018.
U.S. PRODUCERS
The Commission issued a U.S. producer questionnaire to 25 firms based on information
contained in the petition, research, and the preliminary investigations.1 Ten firms provided questionnaires with usable data on their production operations.2 Staff believes that the responses received represent the majority of U.S. production of steel racks.
Table III‐1 lists U.S. producers of steel racks, their production locations, positions on the petition, and shares of total production.
1 After the initial mailing, eight additional firms were identified as potential producers of steel racks based on questionnaire responses and issued U.S. producer questionnaires. Of the eight additional firms that were issued questionnaires, four firms provided a certification that they do not manufacture in‐scope product and four failed to respond with questionnaires.
2 *** provided a questionnaire response but the data were not usable, except for a few narrative responses. *** provided via email estimates of ***. These data are incorporated in report tables as noted. Five firms provided a certification that they do not manufacture in‐scope product, and eight firms failed to respond with questionnaires.
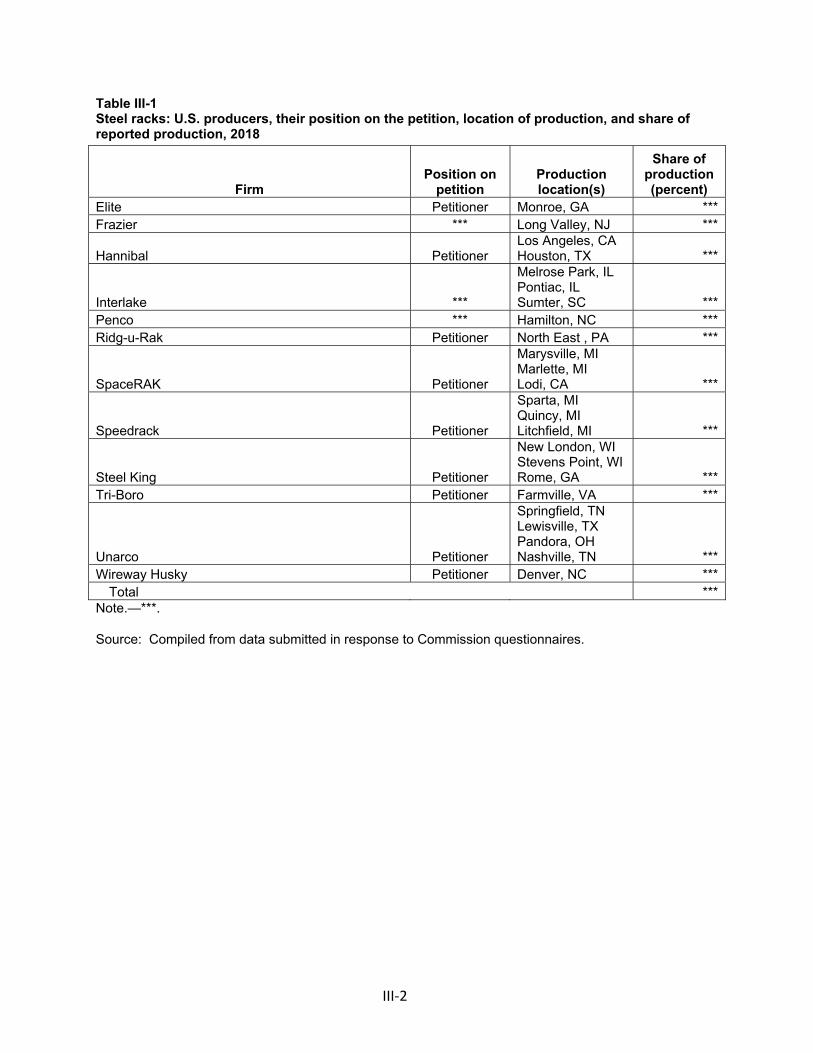
III‐2
Table III-1 Steel racks: U.S. producers, their position on the petition, location of production, and share of reported production, 2018
Firm Position on
petition Production location(s)
Share of production (percent)
Elite Petitioner Monroe, GA *** Frazier *** Long Valley, NJ ***
Hannibal Petitioner Los Angeles, CA Houston, TX ***
Interlake ***
Melrose Park, IL Pontiac, IL Sumter, SC ***
Penco *** Hamilton, NC *** Ridg-u-Rak Petitioner North East , PA ***
SpaceRAK Petitioner
Marysville, MI Marlette, MI Lodi, CA ***
Speedrack Petitioner
Sparta, MI Quincy, MI Litchfield, MI ***
Steel King Petitioner
New London, WI Stevens Point, WI Rome, GA ***
Tri-Boro Petitioner Farmville, VA ***
Unarco Petitioner
Springfield, TN Lewisville, TX Pandora, OH Nashville, TN ***
Wireway Husky Petitioner Denver, NC *** Total ***
Note.—***.
Source: Compiled from data submitted in response to Commission questionnaires.
III‐3
Table III‐2 presents information on U.S. producers’ ownership, related and/or affiliated firms of steel racks.
Table III-2 Steel racks: U.S. producers' ownership, related and/or affiliated firms
* * * * * * *
As indicated in table III‐2, *** U.S. producers are related to U.S. importers of the subject
merchandise and *** U.S. producer, ***, is related to foreign producers/exporters of nonsubject merchandise. In addition, as discussed in greater detail below, *** U.S. producers *** directly import steel racks from Mexico, and *** U.S. producers, *** purchase subject merchandise from U.S. importers.
Table III‐3 presents U.S. producers’ reported changes in operations since January 1, 2016. Two firms reported plant openings, one firm reported a relocation, two firms reported expansions, one firm reported curtailment, three firms reported revised labor agreements, and two firms reported other changes in operations.
Table III-3 Steel racks: U.S. producers' reported changes in operations, since January 1, 2016
* * * * * * *
U.S. PRODUCTION, CAPACITY, AND CAPACITY UTILIZATION
Table III‐4 and figure III‐1 present U.S. producers’ production, capacity, and capacity utilization. Total capacity increased by *** percent from 2016 to 2018, (*** percent of the increase in total capacity was driven by the plant expansion in 2016 of ***). Total production decreased by *** percent from 2016 to 2018. Because of the increase in total capacity but not total production from 2016 to 2018, total capacity utilization decreased from *** percent in 2016 to *** percent in 2017 and *** percent in 2018. All but one of the responding U.S. producers reported lower capacity utilization rates in 2018 compared to 2016. While total capacity remained relatively constant, total production and total capacity utilization were lower in January to March 2019 compared with January to March 2018.
Table III-4 Steel racks: U.S. producers' capacity, production, and capacity utilization, 2016-18, January to March 2018, and January to March 2019
* * * * * * *
III‐4
Figure III-1 Steel racks: U.S. producers' capacity, production, and capacity utilization, 2016-18, January to March 2018, and January to March 2019
* * * * * * *
Alternative products
Based on questionnaire responses, all of the steel racks produced during 2018 by U.S. producers were in‐scope merchandise. No U.S. producers reported producing any out‐of‐scope merchandise on the same machinery and equipment as in‐scope merchandise.
U.S. PRODUCERS’ U.S. SHIPMENTS AND EXPORTS
Table III‐5 presents U.S. producers’ U.S. shipments, export shipments, and total
shipments. Total shipments of steel racks by U.S. producers consisted almost exclusively of U.S. shipments; export shipments ranged between *** percent, by quantity, and *** percent, by value, from 2016 to 2018. Combined internal consumption and transfers to related firms accounted for less than *** percent of total shipments. U.S. shipments of steel racks increased from *** in 2016 to *** in 2018, an increase of *** percent by quantity and *** percent by value. Export shipments increased from *** in 2016 to *** in 2018. Export shipments were reported by *** U.S. producers with the most common export markets being Canada and Mexico. Other export markets include *** and the general regions of the ***. Total shipments increased *** percent by quantity and *** percent by value from 2016 to 2018. U.S shipments in January to March 2019 were lower in quantity but higher in value than U.S. shipments in January to March 2018, while export shipments were higher in both quantity and value during the interim periods. The average unit value of U.S. shipments increased from $*** per pound in 2016 to $*** per pound in 2018. The average unit value of U.S. shipments was $*** per pound in January to March 2018 and $*** per pound in January to March 2019. Table III-5 Steel racks: U.S. producers’ U.S. shipments, export shipments, and total shipments, 2016-18, January to March 2018, and January to March 2019
* * * * * * *
U.S. producers’ shipments by type
Table III‐6 presents U.S. producers’ U.S. shipments by coating type in 2018. The vast majority of U.S. producers’ U.S. shipments of steel racks in 2018 were painted steel racks, reported by every U.S. producer, accounting for *** percent of the quantity and *** percent of the value of total U.S. shipments. Epoxy coated steel racks, reported by ***, accounted for *** percent of the quantity and *** percent of the value of U.S. shipments, while steel racks with
III‐5
zinc or galvanized coating, reported by *** firms comprised *** percent of quantity and *** percent of value. The reported unit values for painted steel racks, epoxy coated steel racks, and steel racks with zinc or galvanized coating were $*** per pound, $*** per pound, and $*** per pound, respectively.
Table III-6 Steel racks: U.S. producers' U.S. shipments, by type, 2018
* * * * * * *
Table III‐7 presents U.S. producers' 2018 U.S. shipments by rack sale type – complete rack sets versus rack components not sold as a complete set. In 2018, complete rack sets comprised *** percent of U.S. producers’ U.S. shipments.
Table III-7 Steel racks: U.S. producers' U.S. shipments, by sets, 2018
* * * * * * *
U.S. PRODUCERS’ INVENTORIES
Table III‐8 presents U.S. producers’ end‐of‐period inventories and the ratio of these inventories to U.S. producers’ production, U.S. shipments, and total shipments. Inventories increased by *** percent from 2016 to 2017 and decreased by *** percent from 2017 to 2018. Inventories were lower in January to March 2018 than during January to March 2019. Relative to U.S. production, U.S. shipments, and total shipments, the ratio of inventories ranged from *** to *** percent. From the end of 2016 to the end of 2018, inventory levels increased for *** U.S. producers and decreased for *** U.S. producers.
Table III-8 Steel racks: U.S. producers' inventories, 2016-18, January to March 2018, and January to March 2019
* * * * * * *
U.S. PRODUCERS’ IMPORTS AND PURCHASES
U.S. producers’ imports of steel racks are presented in table III‐9. *** reported imports of steel racks from *** during the period of investigations.3 *** also reported imports of steel racks from *** during the period of investigations. Import quantities from nonsubject sources averaged *** percent of *** and *** percent of *** U.S. production from 2016 to 2018. ***
3 ***.
III‐6
reported purchasing *** pounds of imported steel racks from China in 2018 ‐ ***.4 The purchase was *** of the firm’s production quantity in 2018.
Another U.S. producer, ***, reported purchasing imported steel racks from China from a U.S. importer during the period of investigations. *** was the *** smallest domestic producer in 2018, accounting for *** percent of U.S. production of steel racks. It purchased *** pounds of subject product during the period examined, which was the equivalent of *** percent of its domestic production during that time. It did not report purchases of subject product in 2016. In 2017 and 2018, it purchased *** and *** pounds of subject merchandise, respectively, equivalent to ***, and *** percent of its domestic production. It purchased *** pounds in January to March 2019, equivalent to *** percent of its reported domestic production during the same period.5
Table III-9 Steel racks: U.S. producers' imports, 2016-18, January to March 2018, and January to March 2019
* * * * * * *
U.S. EMPLOYMENT, WAGES, AND PRODUCTIVITY
Table III‐10 shows U.S. producers’ employment‐related data. The total number of production related workers (“PRWs”) and total hours worked increased by *** and *** percent, respectively, from 2016 to 2018. Hours worked per PRW increased by *** and hourly wages increased by *** percent, while productivity decreased by *** percent over the same period. Higher wage rates and lower productivity resulted in rising unit labor costs – an increase of *** percent during 2016 to 2018. PRWs and total hours worked were higher by *** percent and *** percent, respectively, from January to March 2019 than from January to March 2018. Productivity was lower by *** percent and unit labor costs were higher by *** percent, respectively, from January to March 2019 compared with the same period in 2018. Hours worked per PRW, total wages paid, and hourly wages were higher from January to March 2019 than in January to March 2018.
Table III-10 Steel racks: U.S. producers' employment related data, 2016-18, January to March 2018, and January to March 2019
* * * * * * *
4*** U.S. producer questionnaire response. 5 ***
IV‐1
PART IV: U.S. IMPORTS, APPARENT U.S. CONSUMPTION, AND MARKET SHARES
U.S. IMPORTERS
The Commission issued importer questionnaires to 192 firms believed to be possible
importers of steel racks, as well as to all U.S. producers of steel racks.1 Usable questionnaire responses were received from 18 companies.2 HTS subheadings 7326.90.8688, 9403.20.0080, and 9403.90.8041 are “basket” categories preventing staff from obtaining a reliable coverage estimate for these investigations. Table IV‐1 lists all responding U.S. importers of steel racks from China, Mexico, and all other sources, their locations, and their shares of U.S. imports, in 2018.
1 The Commission issued questionnaires to those firms identified in the petition, along with firms that, based on a review of data provided by U.S. Customs and Border Protection (“Customs”), may have accounted for more than one percent of total imports under HTS subheadings 7326.90.8688 and 9403.20.0080, 9403.90.8041 in 2018. Additional questionnaires were issued to firms identified in foreign producer questionnaire responses.
2 Twenty‐six firms provided certifications that they do not import steel racks. *** during the period of investigations. However, staff derived *** data from *** under HTS statistical reporting numbers 7308.90.6000 and 7308.90.9590, accessed July 24, 2018. These data are incorporated in report tables as noted.
IV‐2
Table IV-1 Steel racks: U.S. importers, their headquarters, and share of total imports by source, 2018
Firm Headquarters
Share of imports by source (percent)
China Mexico
All other
sources Nonsubject
sources
All import
sources Action Wholesale Anaheim, CA *** *** *** *** *** APP Tempe, AZ *** *** *** *** *** Atlas Hialeah, FL *** *** *** *** *** Clayton's New Milford, CT *** *** *** *** *** Frazier Long Valley, NJ *** *** *** *** *** Global Equipment Port Washington, NY *** *** *** *** *** Grainger Lake Forest, IL *** *** *** *** *** Headzup Secaucus, NJ *** *** *** *** *** Interlake Melrose Park, IL *** *** *** *** *** Lozier Omaha, NE *** *** *** *** *** Martins Farnham, QC *** *** *** *** *** Mobile Media Pine Bush, NY *** *** *** *** *** North Shore Houston, TX *** *** *** *** *** Raymond Union, NJ *** *** *** *** *** REB Steel Chicago, IL *** *** *** *** *** Schaefer Charlotte, NC *** *** *** *** *** UMH Moreno Valley, CA *** *** *** *** *** Warehouse Rack Houston, TX *** *** *** *** ***
Total *** *** *** *** *** Note.--Shares and ratios shown as "0.0" represent values greater than zero, but less than "0.05" percent. Source: Compiled from data submitted in response to Commission importer questionnaires.
*** and *** are the leading importers of steel racks from China, accounting for *** percent of reported imports from China, and *** percent of imports from all sources, in 2018, by quantity.3 *** and *** are the largest importers of steel racks from nonsubject sources ***, accounting for *** percent of imports from nonsubject sources in 2018, by quantity.
U.S. IMPORTS
Table IV‐2 and figure IV‐1 present data for U.S. imports of steel racks from China and all
other sources. From 2016 to 2018, U.S. imports of steel racks from China increased by *** percent, from *** pounds in 2016 to *** pounds in 2018. Subject imports from January to March 2019 were lower than when compared to the same period in 2018, from *** pounds to *** pounds. From 2016 to 2018, subject imports’ share of total imports increased from *** to *** percent in share of quantity and from *** to *** percent in share of value.
3 *** reported that as of ***, it is no longer importing steel racks. (***) *** importer questionnaire response, section II‐2.
IV‐3
Imports from nonsubject sources increased by *** percent from 2016 to 2018, from *** pounds to *** pounds. They were *** percent lower in interim 2019 than during interim 2018. Mexico was the largest nonsubject source of imports, accounting for *** percent of total imports from 2016 to 2018. Other nonsubject sources of imports included ***. Imports from all sources increased *** percent by quantity, and *** percent by value, from 2016 to 2018, and were lower in interim 2019 than in interim 2018, by *** percent, by quantity, and *** percent, by value.
The average unit values of imports from China was *** per pound in 2016, *** per pound in 2017, and *** per pound in 2018. The average unit values of imports from China in January to March 2019 were higher by *** than the average unit values during the same period in 2018. The average unit values of imports from nonsubject sources increased by *** percent, from *** per pound to *** per pound, from 2016 to 2018, and were higher by *** percent during interim 2019 than in interim 2018.
As a ratio to U.S. production of steel racks, U.S. imports of steel racks from all sources increased from the equivalent of *** percent of U.S. production of steel racks in 2016 to the equivalent of *** percent of U.S. production of steel racks in 2018. Imports from China increased from the equivalent of *** percent to the equivalent of *** percent of U.S. production of steel racks from 2016 to 2018, while imports from nonsubject sources increased from the equivalent of *** percent to the equivalent of *** percent during the same period.
Table IV-2 Steel racks: U.S. imports, by source, 2016-18, January to March 2018, and January to March 2019
* * * * * * * Figure IV-1 Steel racks: U.S. import volumes and AUVs, 2016-18, January to March 2018, and January to March 2019
* * * * * * *
NEGLIGIBILITY
The statute requires that an investigation be terminated without an injury determination if imports of the subject merchandise are found to be negligible.4 Negligible imports are generally defined in the Act, as amended, as imports from a country of merchandise corresponding to a domestic like product where such imports account for less than 3 percent of the volume of all such merchandise imported into the United States in the most recent 12‐month period for which data are available that precedes the filing of the petition or the initiation of the investigation. However, if there are imports of such merchandise from a number of countries subject to investigations initiated on the same day that individually account for less than 3 percent of the total volume of the subject merchandise, and if the
4 Sections 703(a)(1), 705(b)(1), 733(a)(1), and 735(b)(1) of the Act (19 U.S.C. §§ 1671b(a)(1), 1671d(b)(1), 1673b(a)(1), and 1673d(b)(1)).
IV‐4
imports from those countries collectively account for more than 7 percent of the volume of all such merchandise imported into the United States during the applicable 12‐month period, then imports from such countries are deemed not to be negligible.5 Table IV‐3 presents data on U.S. imports of steel racks by quantity in the twelve months prior to the filing of the petition. Imports from China accounted for *** percent of total reported imports of steel racks by quantity during the twelve months preceding the filing of the petition. Table IV-3 Steel racks: U.S. imports in the twelve month period preceding the filing of the petition, June 2017 through May 2018
* * * * * * *
U.S. IMPORTERS’ U.S. SHIPMENTS BY TYPE
Table IV‐4 presents data on U.S. importers’ U.S. shipments of steel racks by coating type. Most U.S.‐produced steel racks, *** percent, are coated with paint, while *** percent are coated with epoxy and *** percent have zinc or galvanized coating. A majority of all imported U.S. shipments of steel racks, *** percent, have a paint coating, while *** percent are epoxy coated, *** percent have “other” coating, and *** percent have zinc or galvanized coating. Of imports of steel racks from China, *** percent are coated with paint and *** percent have “other” coating. Steel rack imports from Mexico were *** percent coated with paint, *** percent epoxy coated, and *** percent with zinc or galvanized coating. Steel rack imports from all other sources consisted of *** percent with a paint coating, *** percent epoxy coated, and *** percent with zinc or galvanized coating.
Table IV-4 Steel racks: U.S. importers' U.S. shipments, by type, 2018
* * * * * * *
Table IV‐5 presents U.S. importers’ 2018 U.S. shipments by rack sale type – complete rack sets versus rack components not sold as a complete set. In 2018, complete rack sets comprised *** percent of U.S. importers’ U.S. shipments compared to *** percent of U.S. producers’ U.S. shipments. Most subject import shipments in 2018 were of rack components not sold as a complete set. Complete rack sets accounted for ***, ***, and *** percent, respectively, of U.S. importers’ U.S. shipments from China, Mexico, and all other sources in 2018.
Table IV-5 Steel racks: U.S. importers’ U.S. shipments, by set, 2018
* * * * * * *
5 Section 771 (24) of the Act (19 U.S.C § 1677(24)).
IV‐5
Table IV‐6 presents data on shipments by rack type. *** U.S. producers that provided questionnaire responses reported producing pallet racks. *** producers reported producing drive‐in racks, drive‐through racks, pallet‐flow racks, and pick modules. *** producers reported producing cantilever racks, case‐flow racks, and push‐back racks. *** U.S. importers of steel racks reported importing pallet racks and *** reported importing cantilever racks.6
Table IV-6 Steel racks: U.S. producers' production and sales and U.S. importers' importation and sales/usage by rack type
* * * * * * *
APPARENT U.S. CONSUMPTION AND MARKET SHARE
Table IV‐7 and figure IV‐2 present data on apparent U.S. consumption and market shares for steel racks. Apparent U.S. consumption increased *** percent by quantity from 2016 to 2018, from *** pounds to *** pounds. It also increased *** percent by value, from *** to *** during the same period. Apparent U.S. consumption from January to March 2019 was *** percent lower by quantity and *** percent higher by value than in January to March 2018.
Table IV-7 Steel racks: Apparent U.S. consumption and market shares, 2016-18, January to March 2018, and January to March 2019
* * * * * * * Figure IV-2 Steel racks: Apparent U.S. consumption, 2016-18, January to March 2018, and January to March 2019
* * * * * * *
From 2016 to 2018, U.S. producers’ U.S. shipments’ share of apparent U.S. consumption decreased from *** to *** percent by quantity, and from *** to *** percent by value. Meanwhile, the share of U.S. shipments of imports from China increased from *** to *** percent by quantity, and from *** to *** percent by value. Market share of U.S. shipments of imports from nonsubject sources increased from *** to *** percent by quantity, and from *** to *** percent by value during the same period.
6 *** did not provide data on its U.S. production and sales or its U.S. imports and sales/usage by rack type.

V‐1
PART V: PRICING DATA
FACTORS AFFECTING PRICES
Raw material costs
Steel racks are made from roll‐formed or structural steel.1 The majority of steel racks are produced by roll‐forming slit hot‐rolled steel coil into uprights, braces, and beams, and a smaller share are produced using structural steel.2 The most commonly referenced benchmark for steel prices in the steel rack industry is the American Metal Market Midwest index for hot‐rolled steel.3 Hot‐rolled steel prices increased during the period of investigation, with average domestic prices increasing by *** percent from January 2016‐July 2018, and then declining by *** percent from July 2018‐March 2019 (figure V‐1).4
Figure V-1 Raw material prices: Hot-rolled steel coil index, U.S. domestic Midwest fob mill and U.S. import CFR Port of Houston, average mid, January 2016-April 2019
* * * * * * *
Steel inputs account for about two‐thirds of the cost of a steel rack system, although the
percentage varies with the price of steel.5 Other input costs include paint, weld wire, factory supplies, overhead expenses, and labor.6 Raw materials accounted for 66.9 percent of U.S. producers’ cost of goods sold in 2018, up from 63.4 percent in 2016. U.S. producers’ unit raw material costs increased from $0.42 per pound in 2016 to $0.53 per pound in 2018, and were $0.57 per pound in first quarter 2019 (see Part VI).
All 11 responding U.S. producers and 10 of 14 importers reported that steel prices had increased since 2016, and 7 producers and 4 importers reported that prices of other raw materials had increased. All responding U.S. producers and all but one responding importer also reported that raw material price changes had affected their selling price for steel racks. U.S. producers generally reported that they pass on raw material price increases to their customers, but may not always be able to pass on the full costs. *** stated that it passes through raw material prices to its customers with a surcharge added to its price. *** stated that although it attempts to pass on raw material price increases to its customers, it is not always able to do so. *** reported that it has been able to pass on to its customers a good portion of its material cost
1 Conference transcript, p. 20 (Peplowski), p. 23 (Neal), pp. 35‐36 (B. Bartlett), p. 65 (Neal). 2 Petition, p. 12. Conference transcript, p. 64 (Schagrin). 3 Conference transcript, pp. 88‐90 (Olson, B. Bartlett, Anderson). 4 The Commerce Department issued antidumping and/or countervailing duty orders on hot‐rolled
steel products from Australia, Brazil, Japan, Korea, the Netherlands, and the United Kingdom in 2016. Section 232 tariffs on steel from multiple countries entered into effect in March 2018.
5 Conference transcript, p. 22 (Peplowski), p. 29 (Olson), p. 32 (Anderson). 6 Conference transcript, p. 90 (Peplowski, Olson).
V‐2
increases. *** stated that large increases or decreases in steel pricing creates risk in pricing its steel racks products, and *** stated that it holds 2 to 3 months of raw material in inventories and that it is affected by raw material pricing swings. Importer *** stated that domestic steel rack manufacturers have added a steel surcharge to their rack prices, and that U.S. steel rack manufacturers have increased their sales prices by 24 percent while also increasing their sales volumes.
Impact of section 232 tariffs on steel and aluminum As discussed in Part II, the vast majority of responding U.S. producers and importers reported that section 232 tariffs on steel increased raw material prices and the prices of steel racks. U.S. producers reported rapidly rising steel prices, and volatility, uncertainty, delays, and limited supply of steel following the announcement of the 232 measures in February 2018 through July 2018. Firms stated that steel prices have slowly decreased since then and are currently at levels similar to what they were in February 2018 prior to the 232 tariffs. U.S. producer *** reported that it was unable to increase its steel rack selling prices in line with the 27 percent steel cost increase from February to July 2018. *** reported that it solely uses domestic steel and that its input costs increased 30‐35 percent between March and July 2018. *** stated that after the announcement of the 232 tariffs on steel, customers moved up previously planned purchases of steel racks to try to get ahead of any price increases, and that it attempted to increase the steel surcharge quickly enough to cover its costs. It also stated that ***. Impact of section 301 tariffs on Chinese‐origin products
As discussed in Part II, most responding importers reported that section 301 tariffs
increased raw material prices and prices of steel racks, while most U.S. producers reported no change in steel racks’ prices as a result of section 301 tariffs.
U.S. inland transportation costs
Four of 10 responding U.S. producers and 10 of 12 importers reported that they typically arrange transportation to their customers. Most U.S. producers reported that their U.S. inland transportation costs ranged from 4 to 15 percent while most importers reported costs of 2 to 15 percent.
PRICING PRACTICES
Pricing methods
Nearly all responding U.S. producers and importers reported using transaction‐by‐
transaction negotiations to set prices (table V‐1). Firms also reported using contracts, set price lists, and other pricing methods. U.S. producers and importers reported selling the vast majority of their steel racks through spot sales and short‐term contracts (table V‐2).
V‐3
Table V-1 Steel racks: U.S. producers’ and importers’ reported price setting methods, by number of responding firms1
Method U.S. producers Importers Transaction-by-transaction 9 13 Contract 7 2 Set price list 7 5 Other --- 2 Responding firms 11 15
1 The sum of responses down may not add up to the total number of responding firms as each firm was instructed to check all applicable price setting methods employed. Source: Compiled from data submitted in response to Commission questionnaires.
Table V-2 Steel racks: U.S. producers’ and importers’ shares of U.S. commercial shipments by type of sale, 2018
Type of sale U.S. producers Subject U.S. importers Long-term contracts 6.6 *** Annual contracts 3.9 *** Short-term contracts 24.0 *** Spot sales 65.5 *** Total 100.0 100.0
Note.--Because of rounding, figures may not add to the totals shown. Source: Compiled from data submitted in response to Commission questionnaires.
U.S. producers reported short‐term contract durations of 25 to 120 days, and importers reported short‐term contracts of 10 to 60 days. U.S. producers’ short‐term contracts typically fix price, and some also fix quantity. Four U.S. producers reported that their contract prices are indexed to raw material prices, typically American Metal Market steel prices.7 Importers reported that their short‐term contracts fix both price and quantity and are not indexed to raw material costs.
At the hearing, U.S. producers provided additional information regarding contracts and steel price indexing. Unarco stated that end users typically request that a distributor provide three bids for a project based on a set design.8 Ridg‐U‐Rak reported that its sales to national retailers are typically on a contract basis, and that the large retailers will typically contract with more than one steel rack manufacturer.9 Ridg‐U‐Rak has contracts with its direct customers with quarterly adjustments for steel prices; it does not have contracts or indexing on its sales to distributors for commodity type steel racks.10 Steel King stated that almost none of its pricing is indexed to steel prices.11 Wireway Husky sells to distributors on a spot basis and to one of its
7 ***. 8 Hearing transcript, p. 27 (Neal). 9 Hearing transcript, p. 23 (Olson). 10 Hearing transcript, pp. 24, 55 (Olson). For day to day stocking programs, and short‐term projects
under 3 months, there is no adjustment for steel prices. 11 Hearing transcript, p. 59 (Anderson).
V‐4
largest customers on a contract basis, and although it stated it does not use an indexing method, it does have a cents‐per pound surcharge.12
U.S. producers may include a quotation for subcontracted installation as a separate line item if requested by the customer, particularly on large engineered systems, but this is not part of the steel rack material quote.13 Importer UMH also subcontracts installation as well as assembly of uprights, and quotes these installation costs as a different line item from steel rack material costs.14
Seven purchasers reported that they purchase product daily, eight purchase weekly, six purchase monthly, one purchases quarterly, one purchases annually, and three purchase as needed. Twenty‐two of 26 responding purchasers reported that their purchasing frequency had not changed since 2016. Purchasers generally reported contacting between one and five suppliers before making a purchase.
Sales terms and discounts
Most U.S. producers and importers typically quote prices on an f.o.b. basis. Nine U.S.
producers reported quantity discounts, three reported total volume discounts, two reported no discount policy, and two reported other discounts based on project profitability or cost‐plus discounts. Eight importers reported quantity discounts, two reported total volume discounts, five reported no discount policy, and one reported customer‐specific discounts.
Price leadership
Most purchasers (17 of 26) did not list any firms as price leaders in the U.S. steel racks
market. Four purchasers listed Interlake as a price leader, reporting that it had the lowest cost bids on projects, that its steel racks were priced similarly to imports from China, and that it dominates the pallet rack industry with its imports from Mexico. Seven other firms (Elite, Hannibal, Kingmore, SpaceRAK, Steel King, Tennsco, and UMH) were listed as a price leader by one purchaser each.15
12 Wireway Husky attempted to, but was not able to, pass on the full costs of increased steel prices to this customer. Hearing transcript, pp. 33‐34, 59 (Young).
13 Hearing transcript, pp. 115‐117 (Anderson, Neal, Olson, Quist). 14 Respondent’s posthearing brief, exh. 1, p. 2. 15 ***.
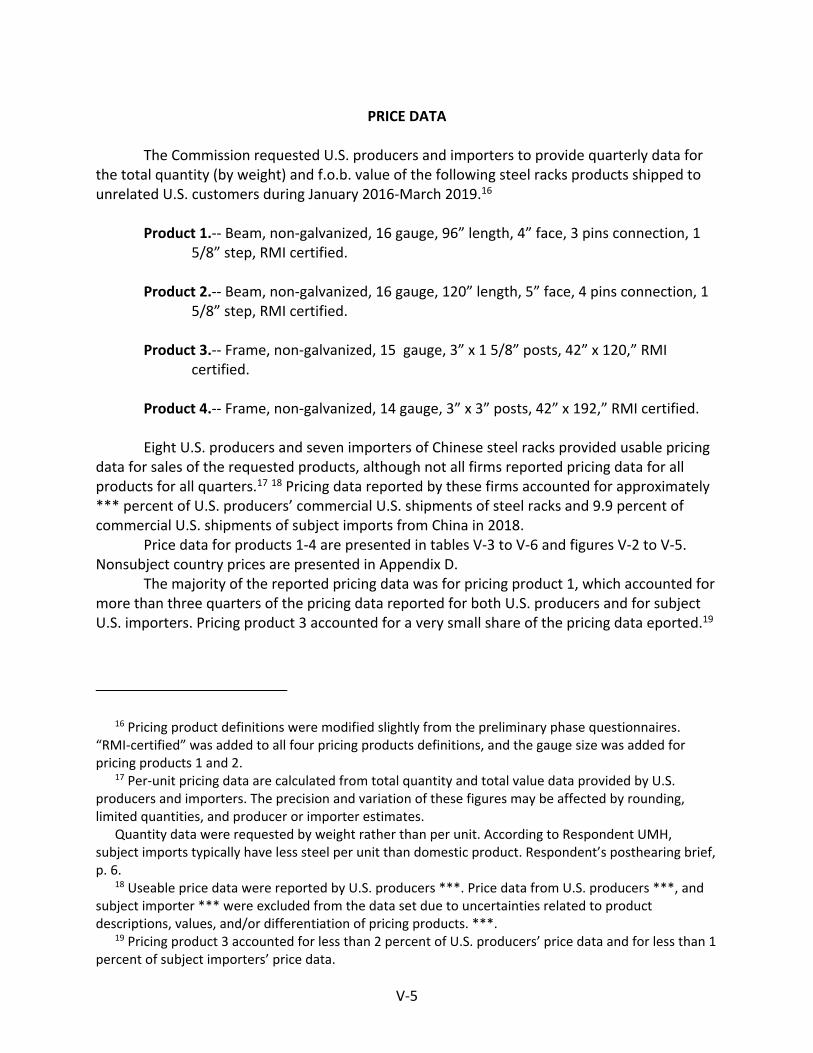
V‐5
PRICE DATA The Commission requested U.S. producers and importers to provide quarterly data for
the total quantity (by weight) and f.o.b. value of the following steel racks products shipped to unrelated U.S. customers during January 2016‐March 2019.16
Product 1.‐‐ Beam, non‐galvanized, 16 gauge, 96” length, 4” face, 3 pins connection, 1
5/8” step, RMI certified. Product 2.‐‐ Beam, non‐galvanized, 16 gauge, 120” length, 5” face, 4 pins connection, 1
5/8” step, RMI certified. Product 3.‐‐ Frame, non‐galvanized, 15 gauge, 3” x 1 5/8” posts, 42” x 120,” RMI
certified. Product 4.‐‐ Frame, non‐galvanized, 14 gauge, 3” x 3” posts, 42” x 192,” RMI certified. Eight U.S. producers and seven importers of Chinese steel racks provided usable pricing
data for sales of the requested products, although not all firms reported pricing data for all products for all quarters.17 18 Pricing data reported by these firms accounted for approximately *** percent of U.S. producers’ commercial U.S. shipments of steel racks and 9.9 percent of commercial U.S. shipments of subject imports from China in 2018.
Price data for products 1‐4 are presented in tables V‐3 to V‐6 and figures V‐2 to V‐5. Nonsubject country prices are presented in Appendix D.
The majority of the reported pricing data was for pricing product 1, which accounted for more than three quarters of the pricing data reported for both U.S. producers and for subject U.S. importers. Pricing product 3 accounted for a very small share of the pricing data eported.19
16 Pricing product definitions were modified slightly from the preliminary phase questionnaires. “RMI‐certified” was added to all four pricing products definitions, and the gauge size was added for pricing products 1 and 2.
17 Per‐unit pricing data are calculated from total quantity and total value data provided by U.S. producers and importers. The precision and variation of these figures may be affected by rounding, limited quantities, and producer or importer estimates.
Quantity data were requested by weight rather than per unit. According to Respondent UMH, subject imports typically have less steel per unit than domestic product. Respondent’s posthearing brief, p. 6.
18 Useable price data were reported by U.S. producers ***. Price data from U.S. producers ***, and subject importer *** were excluded from the data set due to uncertainties related to product descriptions, values, and/or differentiation of pricing products. ***.
19 Pricing product 3 accounted for less than 2 percent of U.S. producers’ price data and for less than 1 percent of subject importers’ price data.
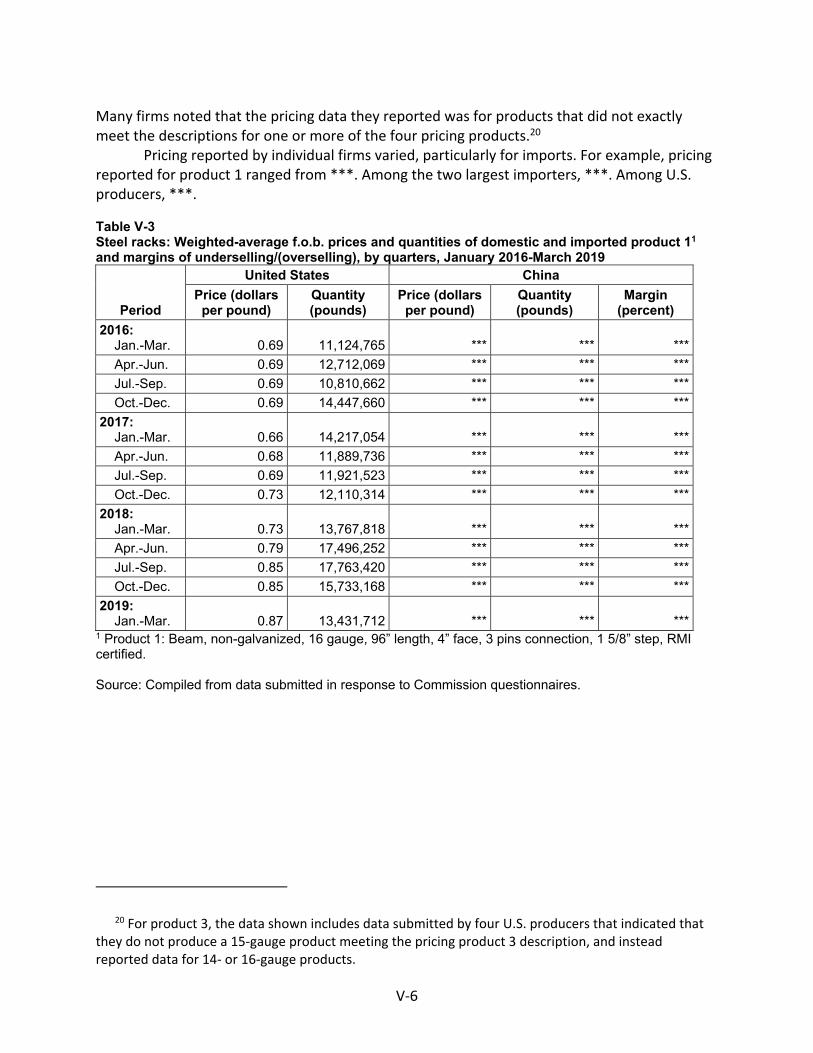
V‐6
Many firms noted that the pricing data they reported was for products that did not exactly meet the descriptions for one or more of the four pricing products.20
Pricing reported by individual firms varied, particularly for imports. For example, pricing reported for product 1 ranged from ***. Among the two largest importers, ***. Among U.S. producers, ***.
Table V-3 Steel racks: Weighted-average f.o.b. prices and quantities of domestic and imported product 11 and margins of underselling/(overselling), by quarters, January 2016-March 2019
Period
United States China
Price (dollars per pound)
Quantity (pounds)
Price (dollars per pound)
Quantity (pounds)
Margin (percent)
2016: Jan.-Mar. 0.69 11,124,765 *** *** ***
Apr.-Jun. 0.69 12,712,069 *** *** ***
Jul.-Sep. 0.69 10,810,662 *** *** ***
Oct.-Dec. 0.69 14,447,660 *** *** ***
2017: Jan.-Mar. 0.66 14,217,054 *** *** ***
Apr.-Jun. 0.68 11,889,736 *** *** ***
Jul.-Sep. 0.69 11,921,523 *** *** ***
Oct.-Dec. 0.73 12,110,314 *** *** ***
2018: Jan.-Mar. 0.73 13,767,818 *** *** ***
Apr.-Jun. 0.79 17,496,252 *** *** ***
Jul.-Sep. 0.85 17,763,420 *** *** ***
Oct.-Dec. 0.85 15,733,168 *** *** ***
2019: Jan.-Mar. 0.87 13,431,712 *** *** ***
1 Product 1: Beam, non-galvanized, 16 gauge, 96” length, 4” face, 3 pins connection, 1 5/8” step, RMI certified. Source: Compiled from data submitted in response to Commission questionnaires.
20 For product 3, the data shown includes data submitted by four U.S. producers that indicated that they do not produce a 15‐gauge product meeting the pricing product 3 description, and instead reported data for 14‐ or 16‐gauge products.
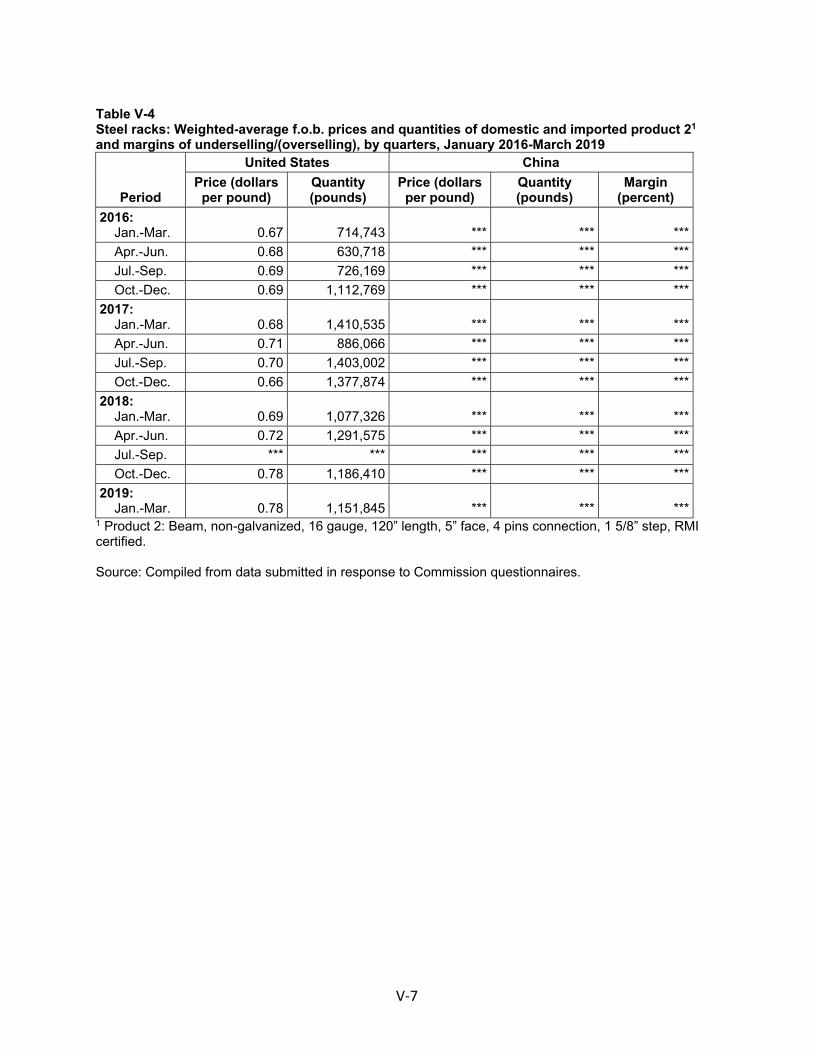
V‐7
Table V-4 Steel racks: Weighted-average f.o.b. prices and quantities of domestic and imported product 21 and margins of underselling/(overselling), by quarters, January 2016-March 2019
Period
United States China
Price (dollars per pound)
Quantity (pounds)
Price (dollars per pound)
Quantity (pounds)
Margin (percent)
2016: Jan.-Mar. 0.67 714,743 *** *** ***
Apr.-Jun. 0.68 630,718 *** *** ***
Jul.-Sep. 0.69 726,169 *** *** ***
Oct.-Dec. 0.69 1,112,769 *** *** ***
2017: Jan.-Mar. 0.68 1,410,535 *** *** ***
Apr.-Jun. 0.71 886,066 *** *** ***
Jul.-Sep. 0.70 1,403,002 *** *** ***
Oct.-Dec. 0.66 1,377,874 *** *** ***
2018: Jan.-Mar. 0.69 1,077,326 *** *** ***
Apr.-Jun. 0.72 1,291,575 *** *** ***
Jul.-Sep. *** *** *** *** ***
Oct.-Dec. 0.78 1,186,410 *** *** ***
2019: Jan.-Mar. 0.78 1,151,845 *** *** ***
1 Product 2: Beam, non-galvanized, 16 gauge, 120” length, 5” face, 4 pins connection, 1 5/8” step, RMI certified. Source: Compiled from data submitted in response to Commission questionnaires.
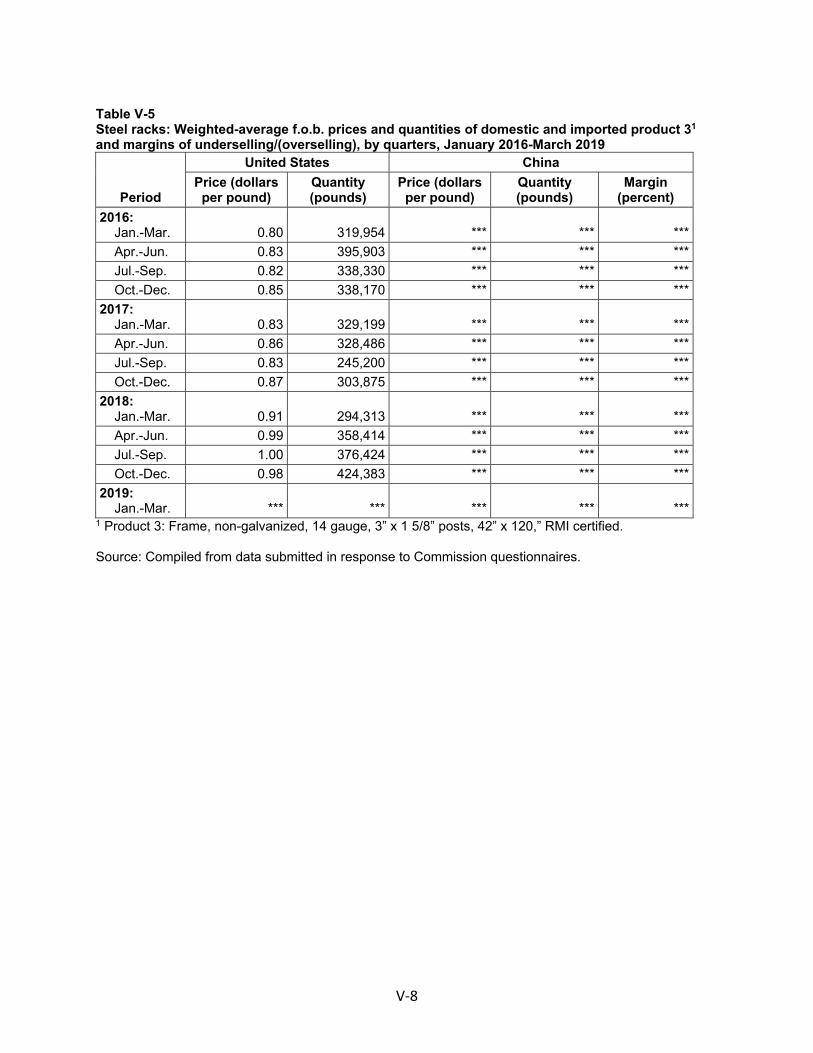
V‐8
Table V-5 Steel racks: Weighted-average f.o.b. prices and quantities of domestic and imported product 31 and margins of underselling/(overselling), by quarters, January 2016-March 2019
Period
United States China
Price (dollars per pound)
Quantity (pounds)
Price (dollars per pound)
Quantity (pounds)
Margin (percent)
2016: Jan.-Mar. 0.80 319,954 *** *** ***
Apr.-Jun. 0.83 395,903 *** *** ***
Jul.-Sep. 0.82 338,330 *** *** ***
Oct.-Dec. 0.85 338,170 *** *** ***
2017: Jan.-Mar. 0.83 329,199 *** *** ***
Apr.-Jun. 0.86 328,486 *** *** ***
Jul.-Sep. 0.83 245,200 *** *** ***
Oct.-Dec. 0.87 303,875 *** *** ***
2018: Jan.-Mar. 0.91 294,313 *** *** ***
Apr.-Jun. 0.99 358,414 *** *** ***
Jul.-Sep. 1.00 376,424 *** *** ***
Oct.-Dec. 0.98 424,383 *** *** ***
2019: Jan.-Mar. *** *** *** *** ***
1 Product 3: Frame, non-galvanized, 14 gauge, 3” x 1 5/8” posts, 42” x 120,” RMI certified. Source: Compiled from data submitted in response to Commission questionnaires.
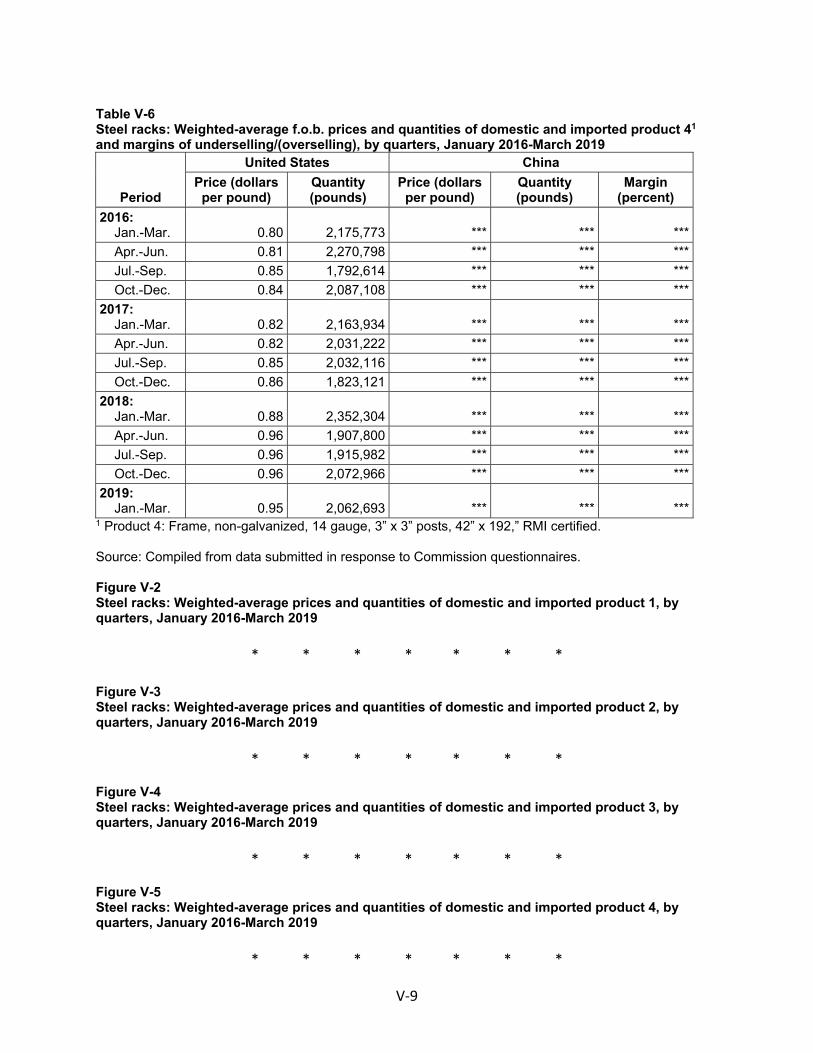
V‐9
Table V-6 Steel racks: Weighted-average f.o.b. prices and quantities of domestic and imported product 41 and margins of underselling/(overselling), by quarters, January 2016-March 2019
Period
United States China
Price (dollars per pound)
Quantity (pounds)
Price (dollars per pound)
Quantity (pounds)
Margin (percent)
2016: Jan.-Mar. 0.80 2,175,773 *** *** ***
Apr.-Jun. 0.81 2,270,798 *** *** ***
Jul.-Sep. 0.85 1,792,614 *** *** ***
Oct.-Dec. 0.84 2,087,108 *** *** ***
2017: Jan.-Mar. 0.82 2,163,934 *** *** ***
Apr.-Jun. 0.82 2,031,222 *** *** ***
Jul.-Sep. 0.85 2,032,116 *** *** ***
Oct.-Dec. 0.86 1,823,121 *** *** ***
2018: Jan.-Mar. 0.88 2,352,304 *** *** ***
Apr.-Jun. 0.96 1,907,800 *** *** ***
Jul.-Sep. 0.96 1,915,982 *** *** ***
Oct.-Dec. 0.96 2,072,966 *** *** ***
2019: Jan.-Mar. 0.95 2,062,693 *** *** ***
1 Product 4: Frame, non-galvanized, 14 gauge, 3” x 3” posts, 42” x 192,” RMI certified. Source: Compiled from data submitted in response to Commission questionnaires. Figure V-2 Steel racks: Weighted-average prices and quantities of domestic and imported product 1, by quarters, January 2016-March 2019
* * * * * * *
Figure V-3 Steel racks: Weighted-average prices and quantities of domestic and imported product 2, by quarters, January 2016-March 2019
* * * * * * *
Figure V-4 Steel racks: Weighted-average prices and quantities of domestic and imported product 3, by quarters, January 2016-March 2019
* * * * * * *
Figure V-5 Steel racks: Weighted-average prices and quantities of domestic and imported product 4, by quarters, January 2016-March 2019
* * * * * * *
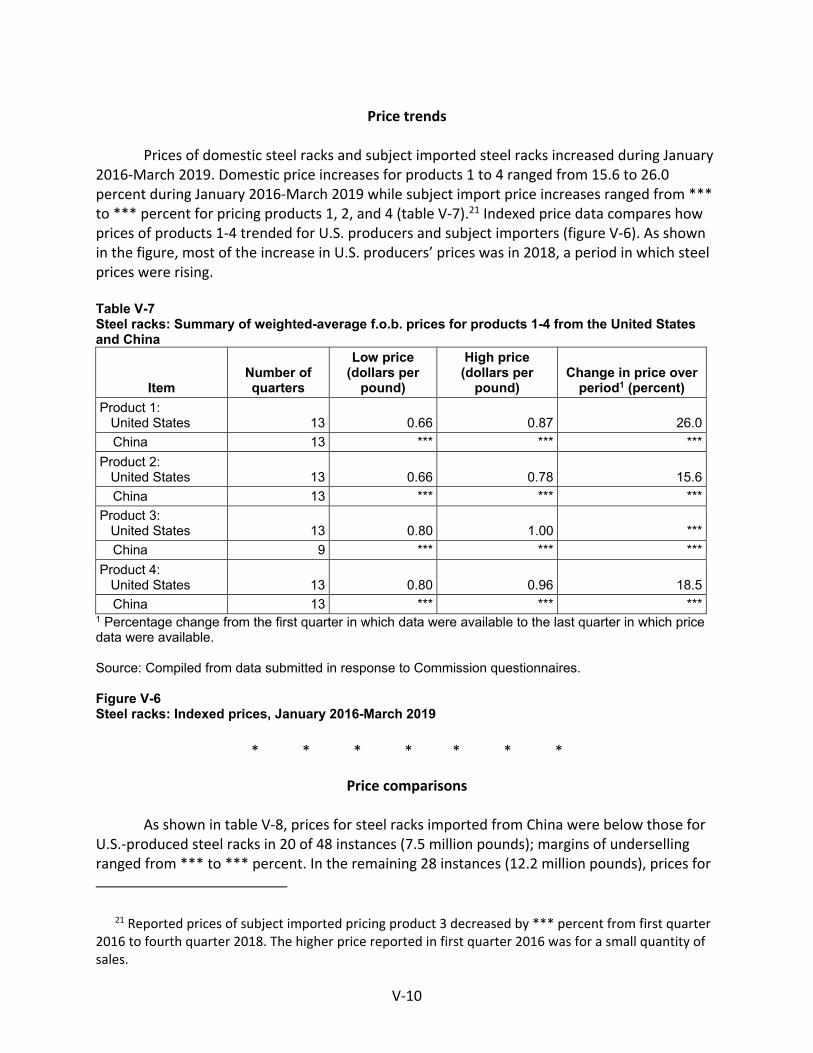
V‐10
Price trends Prices of domestic steel racks and subject imported steel racks increased during January
2016‐March 2019. Domestic price increases for products 1 to 4 ranged from 15.6 to 26.0 percent during January 2016‐March 2019 while subject import price increases ranged from *** to *** percent for pricing products 1, 2, and 4 (table V‐7).21 Indexed price data compares how prices of products 1‐4 trended for U.S. producers and subject importers (figure V‐6). As shown in the figure, most of the increase in U.S. producers’ prices was in 2018, a period in which steel prices were rising.
Table V-7 Steel racks: Summary of weighted-average f.o.b. prices for products 1-4 from the United States and China
Item Number of quarters
Low price (dollars per
pound)
High price (dollars per
pound) Change in price over
period1 (percent)
Product 1: United States 13 0.66 0.87 26.0
China 13 *** *** ***
Product 2: United States 13 0.66 0.78 15.6
China 13 *** *** ***
Product 3: United States 13 0.80 1.00 ***
China 9 *** *** ***
Product 4: United States 13 0.80 0.96 18.5
China 13 *** *** *** 1 Percentage change from the first quarter in which data were available to the last quarter in which price data were available. Source: Compiled from data submitted in response to Commission questionnaires. Figure V-6 Steel racks: Indexed prices, January 2016-March 2019
* * * * * * *
Price comparisons
As shown in table V‐8, prices for steel racks imported from China were below those for
U.S.‐produced steel racks in 20 of 48 instances (7.5 million pounds); margins of underselling ranged from *** to *** percent. In the remaining 28 instances (12.2 million pounds), prices for
21 Reported prices of subject imported pricing product 3 decreased by *** percent from first quarter 2016 to fourth quarter 2018. The higher price reported in first quarter 2016 was for a small quantity of sales.
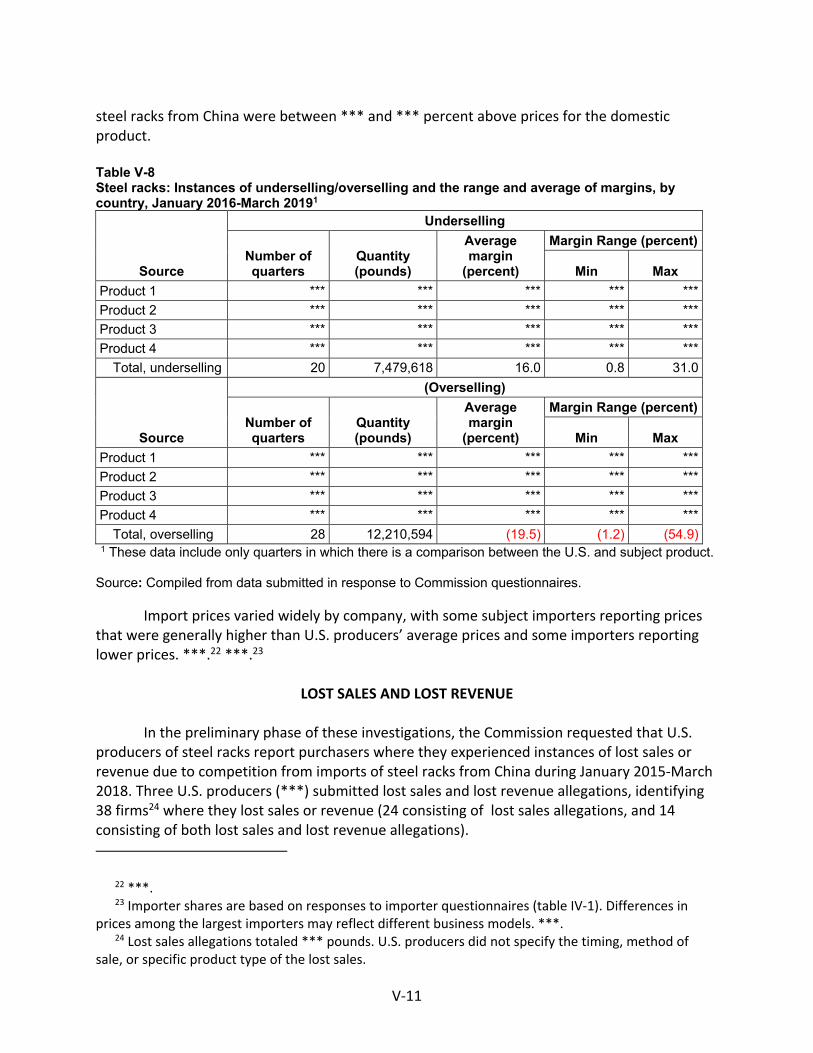
V‐11
steel racks from China were between *** and *** percent above prices for the domestic product.
Table V-8 Steel racks: Instances of underselling/overselling and the range and average of margins, by country, January 2016-March 20191
Source
Underselling
Number of quarters
Quantity (pounds)
Average margin
(percent)
Margin Range (percent)
Min Max
Product 1 *** *** *** *** ***
Product 2 *** *** *** *** ***
Product 3 *** *** *** *** ***
Product 4 *** *** *** *** ***
Total, underselling 20 7,479,618 16.0 0.8 31.0
Source
(Overselling)
Number of quarters
Quantity (pounds)
Average margin
(percent)
Margin Range (percent)
Min Max
Product 1 *** *** *** *** ***
Product 2 *** *** *** *** ***
Product 3 *** *** *** *** ***
Product 4 *** *** *** *** ***
Total, overselling 28 12,210,594 (19.5) (1.2) (54.9) 1 These data include only quarters in which there is a comparison between the U.S. and subject product. Source: Compiled from data submitted in response to Commission questionnaires.
Import prices varied widely by company, with some subject importers reporting prices that were generally higher than U.S. producers’ average prices and some importers reporting lower prices. ***.22 ***.23
LOST SALES AND LOST REVENUE
In the preliminary phase of these investigations, the Commission requested that U.S.
producers of steel racks report purchasers where they experienced instances of lost sales or revenue due to competition from imports of steel racks from China during January 2015‐March 2018. Three U.S. producers (***) submitted lost sales and lost revenue allegations, identifying 38 firms24 where they lost sales or revenue (24 consisting of lost sales allegations, and 14 consisting of both lost sales and lost revenue allegations).
22 ***. 23 Importer shares are based on responses to importer questionnaires (table IV‐1). Differences in
prices among the largest importers may reflect different business models. ***. 24 Lost sales allegations totaled *** pounds. U.S. producers did not specify the timing, method of
sale, or specific product type of the lost sales.
V‐12
In the final phase of these investigations, seven U.S. producers reported that they had to reduce prices, five reported that they had to roll back announced price increases, and nine reported that they had lost sales.
Staff received purchaser questionnaire responses from 26 firms. Twenty‐one responding purchasers reported purchasing 773 million pounds of steel racks during January 2016‐March 2019 (table V‐9a). Five purchasers were unable to provide purchase data in pounds, and staff requested these firms to provide their purchase data by value (table V‐9b).
Of the 26 responding purchasers, 14 reported that, since 2016, they had purchased imported steel racks from China instead of U.S.‐produced product. Thirteen of these 14 purchasers reported that subject import prices were lower than U.S.‐produced product, and 12 of these purchasers reported that price was a primary reason for the decision to purchase imported product rather than U.S.‐produced product. Nine purchasers estimated the quantity of steel racks from China purchased instead of domestic product; quantities ranged from *** pounds to *** pounds (table V‐10). Purchasers identified lead time and quality as non‐price reasons for purchasing imported rather than U.S.‐produced product.
Of the 26 responding purchasers, four reported that U.S. producers had reduced prices in order to compete with lower‐priced imports from China (table V‐11; nine reported that they did not know). The reported estimated price reduction ranged from *** to *** percent.
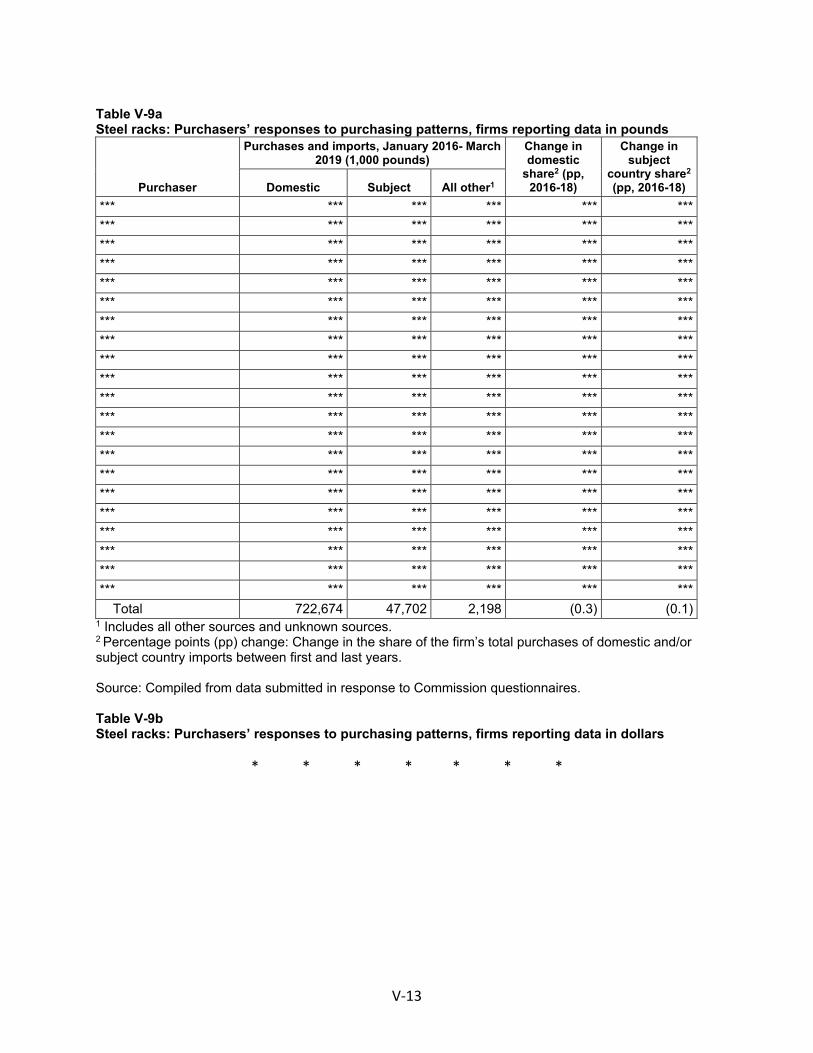
V‐13
Table V-9a Steel racks: Purchasers’ responses to purchasing patterns, firms reporting data in pounds
Purchaser
Purchases and imports, January 2016- March 2019 (1,000 pounds)
Change in domestic
share2 (pp, 2016-18)
Change in subject
country share2 (pp, 2016-18) Domestic Subject All other1
*** *** *** *** *** ***
*** *** *** *** *** ***
*** *** *** *** *** ***
*** *** *** *** *** ***
*** *** *** *** *** ***
*** *** *** *** *** ***
*** *** *** *** *** ***
*** *** *** *** *** ***
*** *** *** *** *** ***
*** *** *** *** *** ***
*** *** *** *** *** ***
*** *** *** *** *** ***
*** *** *** *** *** ***
*** *** *** *** *** ***
*** *** *** *** *** ***
*** *** *** *** *** ***
*** *** *** *** *** ***
*** *** *** *** *** ***
*** *** *** *** *** ***
*** *** *** *** *** ***
*** *** *** *** *** ***
Total 722,674 47,702 2,198 (0.3) (0.1) 1 Includes all other sources and unknown sources. 2 Percentage points (pp) change: Change in the share of the firm’s total purchases of domestic and/or subject country imports between first and last years. Source: Compiled from data submitted in response to Commission questionnaires. Table V-9b Steel racks: Purchasers’ responses to purchasing patterns, firms reporting data in dollars
* * * * * * *
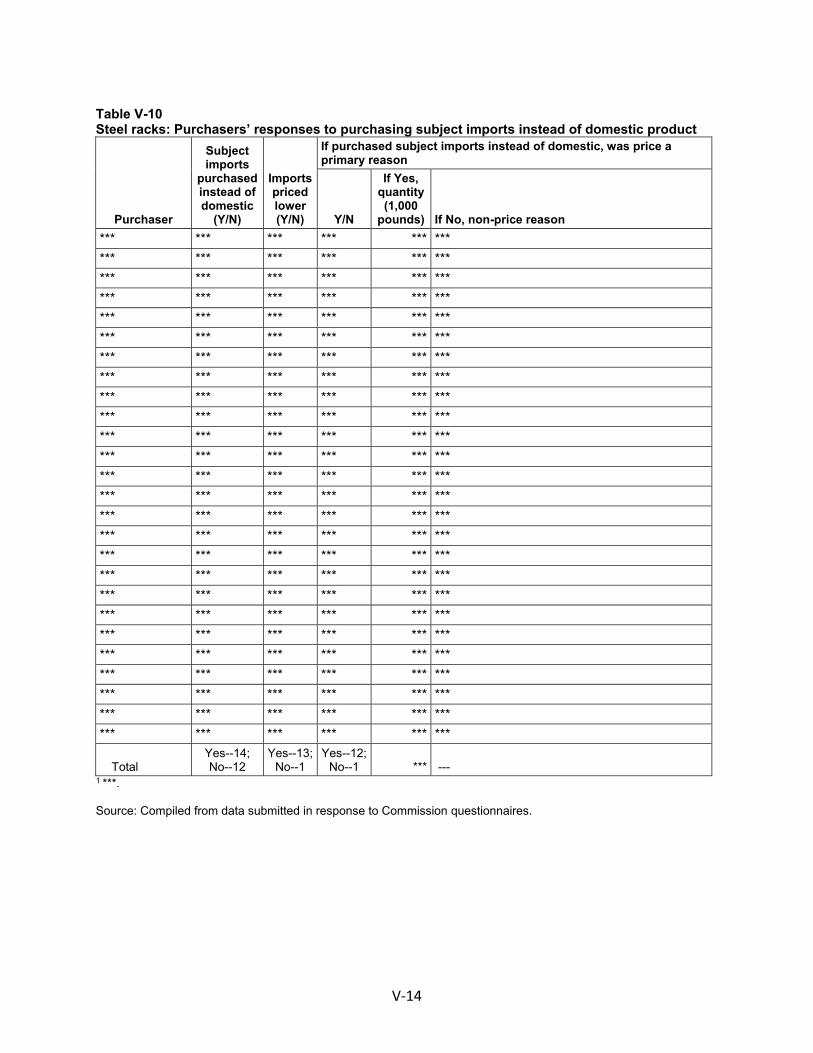
V‐14
Table V-10 Steel racks: Purchasers’ responses to purchasing subject imports instead of domestic product
Purchaser
Subject imports
purchased instead of domestic
(Y/N)
Imports priced lower (Y/N)
If purchased subject imports instead of domestic, was price a primary reason
Y/N
If Yes, quantity (1,000
pounds) If No, non-price reason
*** *** *** *** *** ***
*** *** *** *** *** ***
*** *** *** *** *** ***
*** *** *** *** *** ***
*** *** *** *** *** ***
*** *** *** *** *** ***
*** *** *** *** *** ***
*** *** *** *** *** ***
*** *** *** *** *** ***
*** *** *** *** *** ***
*** *** *** *** *** ***
*** *** *** *** *** ***
*** *** *** *** *** ***
*** *** *** *** *** ***
*** *** *** *** *** ***
*** *** *** *** *** ***
*** *** *** *** *** ***
*** *** *** *** *** ***
*** *** *** *** *** ***
*** *** *** *** *** ***
*** *** *** *** *** ***
*** *** *** *** *** ***
*** *** *** *** *** ***
*** *** *** *** *** ***
*** *** *** *** *** ***
*** *** *** *** *** ***
Total Yes--14; No--12
Yes--13; No--1
Yes--12; No--1 *** ---
1 ***.
Source: Compiled from data submitted in response to Commission questionnaires.
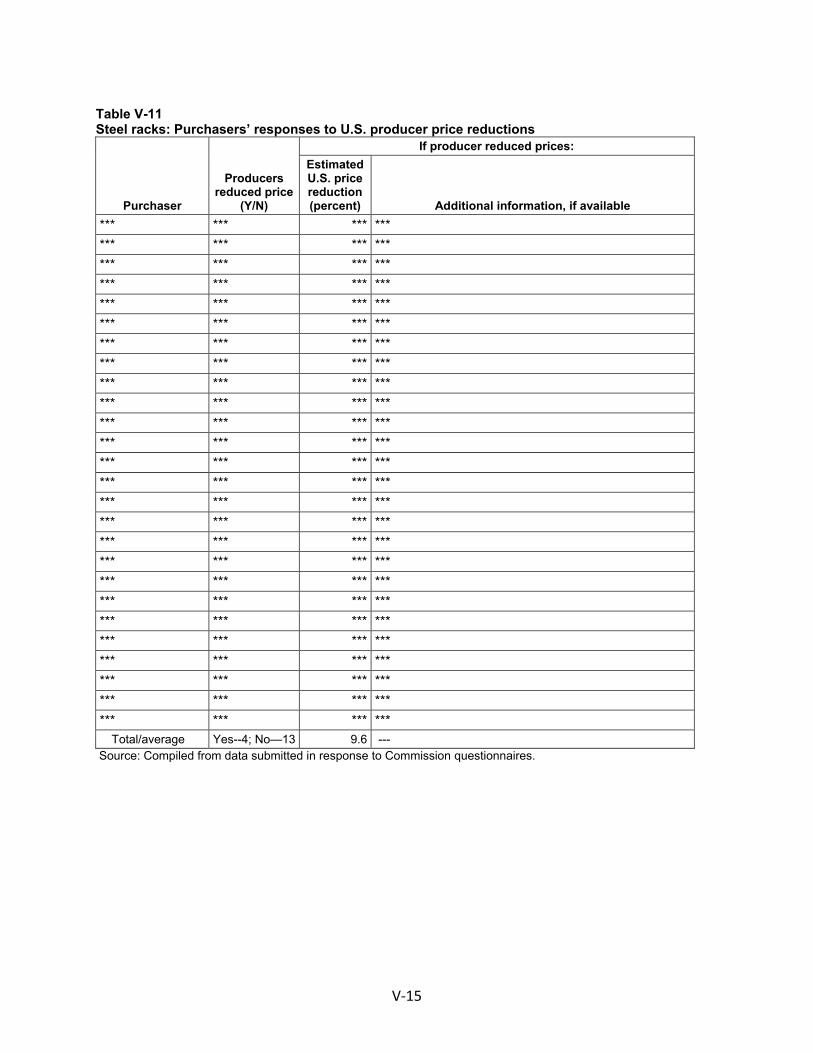
V‐15
Table V-11 Steel racks: Purchasers’ responses to U.S. producer price reductions
Purchaser
Producers reduced price
(Y/N)
If producer reduced prices:
Estimated U.S. price reduction (percent) Additional information, if available
*** *** *** ***
*** *** *** ***
*** *** *** ***
*** *** *** ***
*** *** *** ***
*** *** *** ***
*** *** *** ***
*** *** *** ***
*** *** *** ***
*** *** *** ***
*** *** *** ***
*** *** *** ***
*** *** *** ***
*** *** *** ***
*** *** *** ***
*** *** *** ***
*** *** *** ***
*** *** *** ***
*** *** *** ***
*** *** *** ***
*** *** *** ***
*** *** *** ***
*** *** *** ***
*** *** *** ***
*** *** *** ***
*** *** *** ***
Total/average Yes--4; No—13 9.6 --- Source: Compiled from data submitted in response to Commission questionnaires.

VI‐1
PART VI: FINANCIAL EXPERIENCE OF U.S. PRODUCERS
BACKGROUND
Ten U.S. producers provided usable financial data.1 *** of the U.S. producers reported financial data on a calendar year basis. 2 *** U.S. producers reported financial data on a GAAP basis.3 Commercial sales account for the vast majority of reported steel racks revenue, with internal consumption and transfers to related firms accounting for a combined *** percent in 2018. Accordingly, the tables below present a combined revenue total. Figure VI‐1 presents the relative size of the U.S. producers included in this section of the report, by 2018 net sales quantity. The three largest responding firms were ***, and they represented *** percent, *** percent, and *** percent of total net sales quantity in 2018, respectively.
Staff verified the results of *** with its company records. The verification adjustments were incorporated into this report.4 ***.5 6
Figure VI-1 Steel racks: Share of net sales quantity by firm, 2018
* * * * * * *
OPERATIONS ON STEEL RACKS
Income‐and‐loss data for the U.S. producers’ steel racks operations are presented in table VI‐1. Corresponding changes in average per pound values are presented in table VI‐2. Table VI‐3 presents selected company‐specific financial data.
1 ***. 2 ***. 3 ***. 4 Staff verification report, ***, August 2, 2019. 5 ***. 6 ***.
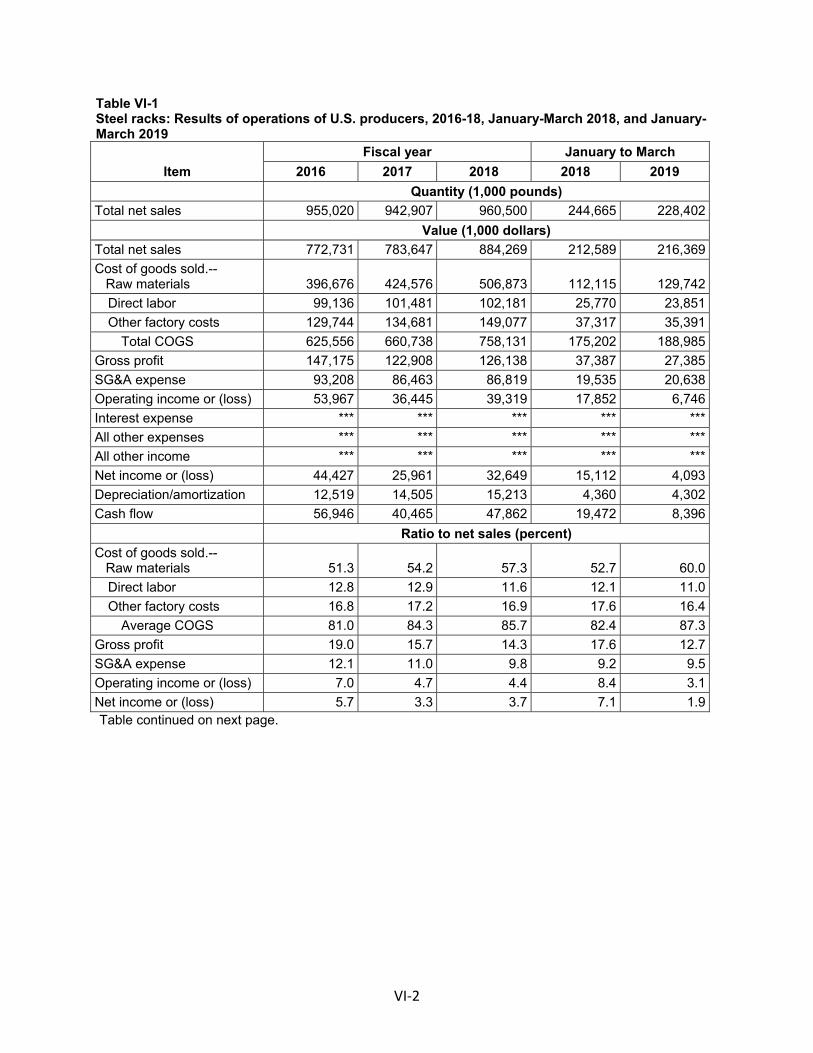
VI‐2
Table VI-1 Steel racks: Results of operations of U.S. producers, 2016-18, January-March 2018, and January-March 2019
Item
Fiscal year January to March
2016 2017 2018 2018 2019
Quantity (1,000 pounds)
Total net sales 955,020 942,907 960,500 244,665 228,402
Value (1,000 dollars)
Total net sales 772,731 783,647 884,269 212,589 216,369
Cost of goods sold.-- Raw materials 396,676 424,576 506,873 112,115 129,742
Direct labor 99,136 101,481 102,181 25,770 23,851
Other factory costs 129,744 134,681 149,077 37,317 35,391
Total COGS 625,556 660,738 758,131 175,202 188,985
Gross profit 147,175 122,908 126,138 37,387 27,385
SG&A expense 93,208 86,463 86,819 19,535 20,638
Operating income or (loss) 53,967 36,445 39,319 17,852 6,746
Interest expense *** *** *** *** ***
All other expenses *** *** *** *** ***
All other income *** *** *** *** ***
Net income or (loss) 44,427 25,961 32,649 15,112 4,093
Depreciation/amortization 12,519 14,505 15,213 4,360 4,302
Cash flow 56,946 40,465 47,862 19,472 8,396
Ratio to net sales (percent)
Cost of goods sold.-- Raw materials 51.3 54.2 57.3 52.7 60.0
Direct labor 12.8 12.9 11.6 12.1 11.0
Other factory costs 16.8 17.2 16.9 17.6 16.4
Average COGS 81.0 84.3 85.7 82.4 87.3
Gross profit 19.0 15.7 14.3 17.6 12.7
SG&A expense 12.1 11.0 9.8 9.2 9.5
Operating income or (loss) 7.0 4.7 4.4 8.4 3.1
Net income or (loss) 5.7 3.3 3.7 7.1 1.9 Table continued on next page.
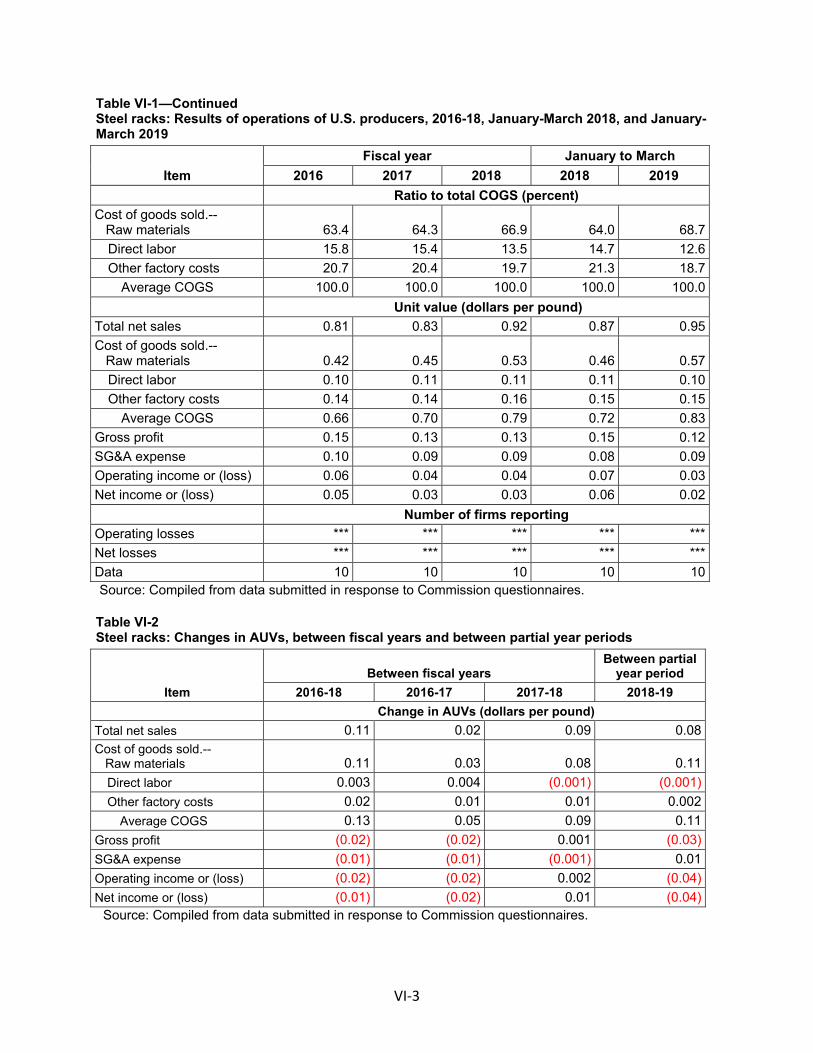
VI‐3
Table VI-1—Continued Steel racks: Results of operations of U.S. producers, 2016-18, January-March 2018, and January-March 2019
Item
Fiscal year January to March
2016 2017 2018 2018 2019
Ratio to total COGS (percent)
Cost of goods sold.-- Raw materials 63.4 64.3 66.9 64.0 68.7
Direct labor 15.8 15.4 13.5 14.7 12.6
Other factory costs 20.7 20.4 19.7 21.3 18.7
Average COGS 100.0 100.0 100.0 100.0 100.0
Unit value (dollars per pound)
Total net sales 0.81 0.83 0.92 0.87 0.95
Cost of goods sold.-- Raw materials 0.42 0.45 0.53 0.46 0.57
Direct labor 0.10 0.11 0.11 0.11 0.10
Other factory costs 0.14 0.14 0.16 0.15 0.15
Average COGS 0.66 0.70 0.79 0.72 0.83
Gross profit 0.15 0.13 0.13 0.15 0.12
SG&A expense 0.10 0.09 0.09 0.08 0.09
Operating income or (loss) 0.06 0.04 0.04 0.07 0.03
Net income or (loss) 0.05 0.03 0.03 0.06 0.02
Number of firms reporting
Operating losses *** *** *** *** ***
Net losses *** *** *** *** ***
Data 10 10 10 10 10 Source: Compiled from data submitted in response to Commission questionnaires. Table VI-2 Steel racks: Changes in AUVs, between fiscal years and between partial year periods
Item
Between fiscal years Between partial
year period
2016-18 2016-17 2017-18 2018-19
Change in AUVs (dollars per pound)
Total net sales 0.11 0.02 0.09 0.08
Cost of goods sold.-- Raw materials 0.11 0.03 0.08 0.11
Direct labor 0.003 0.004 (0.001) (0.001)
Other factory costs 0.02 0.01 0.01 0.002
Average COGS 0.13 0.05 0.09 0.11
Gross profit (0.02) (0.02) 0.001 (0.03)
SG&A expense (0.01) (0.01) (0.001) 0.01
Operating income or (loss) (0.02) (0.02) 0.002 (0.04)
Net income or (loss) (0.01) (0.02) 0.01 (0.04) Source: Compiled from data submitted in response to Commission questionnaires.
VI‐4
Table VI-3 Steel racks: Results of operations of U.S. producers, by firm, 2016-18, January-March 2018, and January-March 2019
* * * * * * *
Net sales
As shown in table VI‐1, total net sales quantity decreased from 2016 to 2017 and
increased in 2018, whereas total net sales value increased from 2016 to 2017 and again in 2018. Net sales quantity was lower in interim 2019 than in interim 2018, while net sales value was higher. The directional trend of the individual firms’ sales quantities between 2016 and 2018 were mixed with *** of 10 companies reporting decreasing sales quantities from 2016 to 2018. Between the interim periods, *** of 10 companies reported lower net sales quantities in the first quarter of 2019 compared to the first quarter of 2018.
The average unit value (“AUV”) of net sales increased from $0.81 per pound in 2016 to $0.92 per pound in 2018, and was higher in the first quarter of 2019 ($0.95 per pound) compared to the first quarter of 2018 ($0.87 per pound). The directional trend of the individual firms’ average unit sales values was rather uniform, with *** of 10 companies reporting an increase in net sales AUVs from 2016 to 2018, and ***. The comparison of the interim periods had similar results, with *** of 10 companies reporting higher net sales AUVs in the first quarter of 2019 compared to the first quarter of 2018, and ***. 7 8
Cost of goods sold and gross profit or (loss)
As shown in table VI‐1, raw material costs represented the largest component of cost of
goods sold (“COGS”) throughout 2016‐18 and during both interim periods, accounting for between 63.4 percent (in 2016) and 68.7 percent (in interim 2019) of total COGS. On an average per‐pound basis, the U.S. industry’s raw material costs increased from 2016 to 2018, and were higher in the first quarter of 2019 than in the first quarter of 2018. The vast majority of U.S. producers reported an increase in raw material costs.9 As seen in table VI‐4, steel accounted for the vast majority of total raw material costs, over 90 percent in 2018. *** companies reported that they make the steel tubing used in steel racks internally, *** companies reported that they primarily purchase steel tubing, and *** company reported that they had a mix of both.10 11
7 ***. *** percent of total net sales value in 2018. 8 ***. ***. 9 ***. 10 Companies were asked to list if they had any other “notable” raw material inputs. Paint was the
most frequently listed “other material input.” In addition, the following raw materials were reported: ***. U.S. producer questionnaire responses at III‐9c.
11 ***.
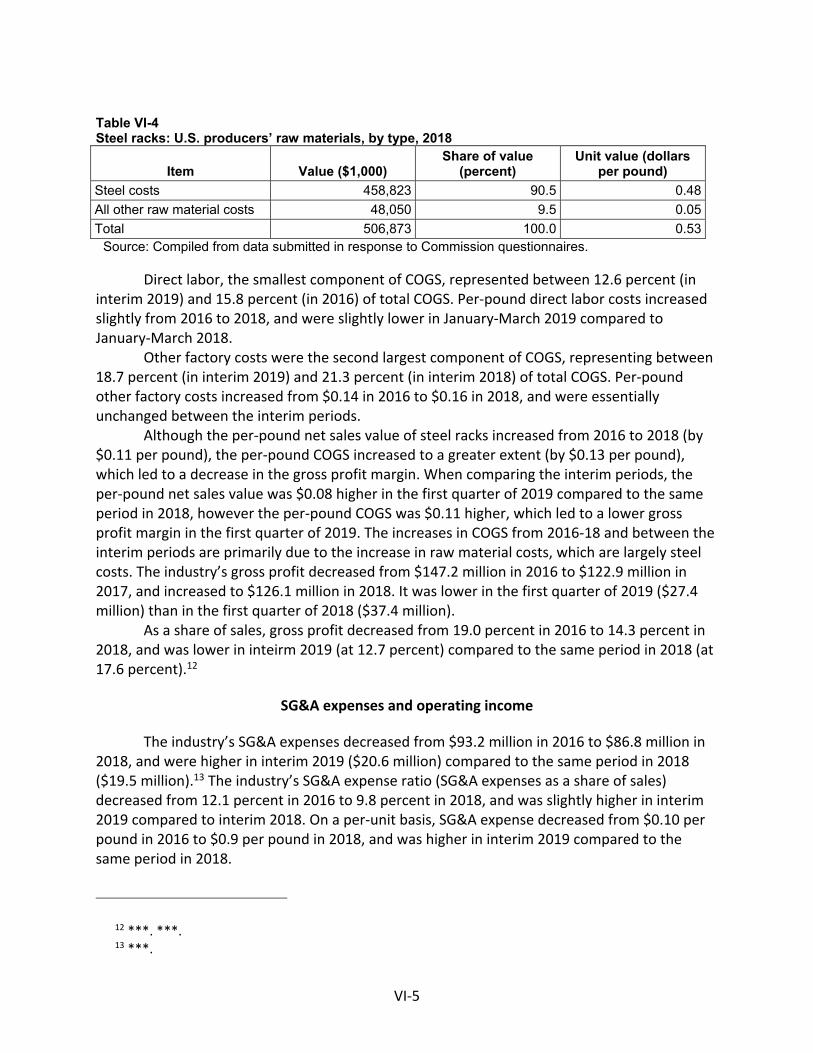
VI‐5
Table VI-4 Steel racks: U.S. producers’ raw materials, by type, 2018
Item Value ($1,000) Share of value
(percent) Unit value (dollars
per pound)
Steel costs 458,823 90.5 0.48
All other raw material costs 48,050 9.5 0.05
Total 506,873 100.0 0.53 Source: Compiled from data submitted in response to Commission questionnaires.
Direct labor, the smallest component of COGS, represented between 12.6 percent (in interim 2019) and 15.8 percent (in 2016) of total COGS. Per‐pound direct labor costs increased slightly from 2016 to 2018, and were slightly lower in January‐March 2019 compared to January‐March 2018.
Other factory costs were the second largest component of COGS, representing between 18.7 percent (in interim 2019) and 21.3 percent (in interim 2018) of total COGS. Per‐pound other factory costs increased from $0.14 in 2016 to $0.16 in 2018, and were essentially unchanged between the interim periods.
Although the per‐pound net sales value of steel racks increased from 2016 to 2018 (by $0.11 per pound), the per‐pound COGS increased to a greater extent (by $0.13 per pound), which led to a decrease in the gross profit margin. When comparing the interim periods, the per‐pound net sales value was $0.08 higher in the first quarter of 2019 compared to the same period in 2018, however the per‐pound COGS was $0.11 higher, which led to a lower gross profit margin in the first quarter of 2019. The increases in COGS from 2016‐18 and between the interim periods are primarily due to the increase in raw material costs, which are largely steel costs. The industry’s gross profit decreased from $147.2 million in 2016 to $122.9 million in 2017, and increased to $126.1 million in 2018. It was lower in the first quarter of 2019 ($27.4 million) than in the first quarter of 2018 ($37.4 million).
As a share of sales, gross profit decreased from 19.0 percent in 2016 to 14.3 percent in 2018, and was lower in inteirm 2019 (at 12.7 percent) compared to the same period in 2018 (at 17.6 percent).12
SG&A expenses and operating income
The industry’s SG&A expenses decreased from $93.2 million in 2016 to $86.8 million in 2018, and were higher in interim 2019 ($20.6 million) compared to the same period in 2018 ($19.5 million).13 The industry’s SG&A expense ratio (SG&A expenses as a share of sales) decreased from 12.1 percent in 2016 to 9.8 percent in 2018, and was slightly higher in interim 2019 compared to interim 2018. On a per‐unit basis, SG&A expense decreased from $0.10 per pound in 2016 to $0.9 per pound in 2018, and was higher in interim 2019 compared to the same period in 2018.
12 ***. ***. 13 ***.

VI‐6
The industry’s operating income decreased from $54.0 million in 2016 to $36.4 million 2017, before increasing to $39.3 million in 2018, for an overall decrease of 27.1 percent. It was 62.2 percent lower in interim 2019 ($6.7 million) compared to the same period in 2018 ($17.9 million). On a company‐by‐company basis, the trends in operating income were *** with *** of *** companies reporting an overall decrease in operating income between 2016 and 2018. The other *** companies reported *** increases of *** and *** percent during the same period. Between the interim periods, *** of 10 companies reported lower operating income in January‐March 2019 than during the same period of 2018.
All other expenses and net income
As seen in table VI‐1, the industry’s interest expense increased by *** percent from
2016 to 2018 and was *** higher in the first quarter of 2019 than in the first quarter of 2018. ***.14 The industry’s reported other expenses decreased from $*** in 2016 to $*** in 2018, and were lower in the first quarter of 2019 ($***) than during the same period of 2018 ($***). Net income decreased from $44.4 million in 2016 to $26.0 million in 2017, and increased to $32.6 million in 2018. Between the interim periods, net income was lower in the first quarter of 2019 ($4.1 million) than in the first quarter of 2018 ($15.1 million).
Variance analysis
A variance analysis for the operations of U.S. producers of steel racks is presented in
table VI‐5.15 The information for this variance analysis is derived from table VI‐1. The analysis illustrates that both the decrease in operating income from 2016 to 2018 as well as the lower operating income in interim 2019 compared to interim 2018 were primarily attributable to higher unfavorable net cost/expense variances despite favorable price variances (i.e., unit costs and expenses increased more than net sales unit values).
14 ***. 15 The Commission’s variance analysis is calculated in three parts: Sales variance, cost of sales
variance (COGS variance), and SG&A expense variance. Each part consists of a price variance (in the case of the sales variance) or a cost or expense variance (in the case of the COGS and SG&A expense variance), and a volume variance. The sales or cost/expense variance is calculated as the change in unit price or per‐unit cost/expense times the new volume, while the volume variance is calculated as the change in volume times the old unit price or per‐unit cost/expense. Summarized at the bottom of the table, the price variance is from sales; the cost/expense variance is the sum of those items from COGS and SG&A variances, respectively, and the volume variance is the sum of the volume components of the net sales, COGS, and SG&A expense variances. The overall volume component of the variance analysis is generally small.
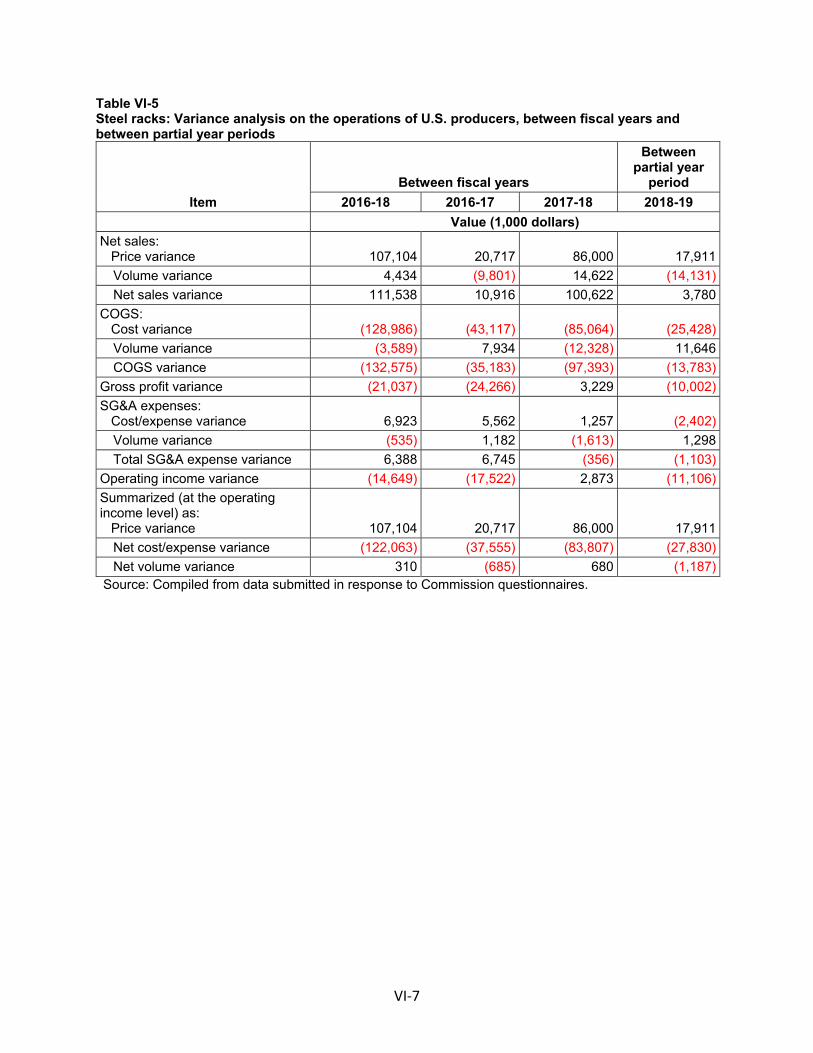
VI‐7
Table VI-5 Steel racks: Variance analysis on the operations of U.S. producers, between fiscal years and between partial year periods
Item
Between fiscal years
Between partial year
period
2016-18 2016-17 2017-18 2018-19
Value (1,000 dollars)
Net sales: Price variance 107,104 20,717 86,000 17,911
Volume variance 4,434 (9,801) 14,622 (14,131)
Net sales variance 111,538 10,916 100,622 3,780
COGS: Cost variance (128,986) (43,117) (85,064) (25,428)
Volume variance (3,589) 7,934 (12,328) 11,646
COGS variance (132,575) (35,183) (97,393) (13,783)
Gross profit variance (21,037) (24,266) 3,229 (10,002)
SG&A expenses: Cost/expense variance 6,923 5,562 1,257 (2,402)
Volume variance (535) 1,182 (1,613) 1,298
Total SG&A expense variance 6,388 6,745 (356) (1,103)
Operating income variance (14,649) (17,522) 2,873 (11,106)
Summarized (at the operating income level) as: Price variance 107,104 20,717 86,000 17,911
Net cost/expense variance (122,063) (37,555) (83,807) (27,830)
Net volume variance 310 (685) 680 (1,187) Source: Compiled from data submitted in response to Commission questionnaires.
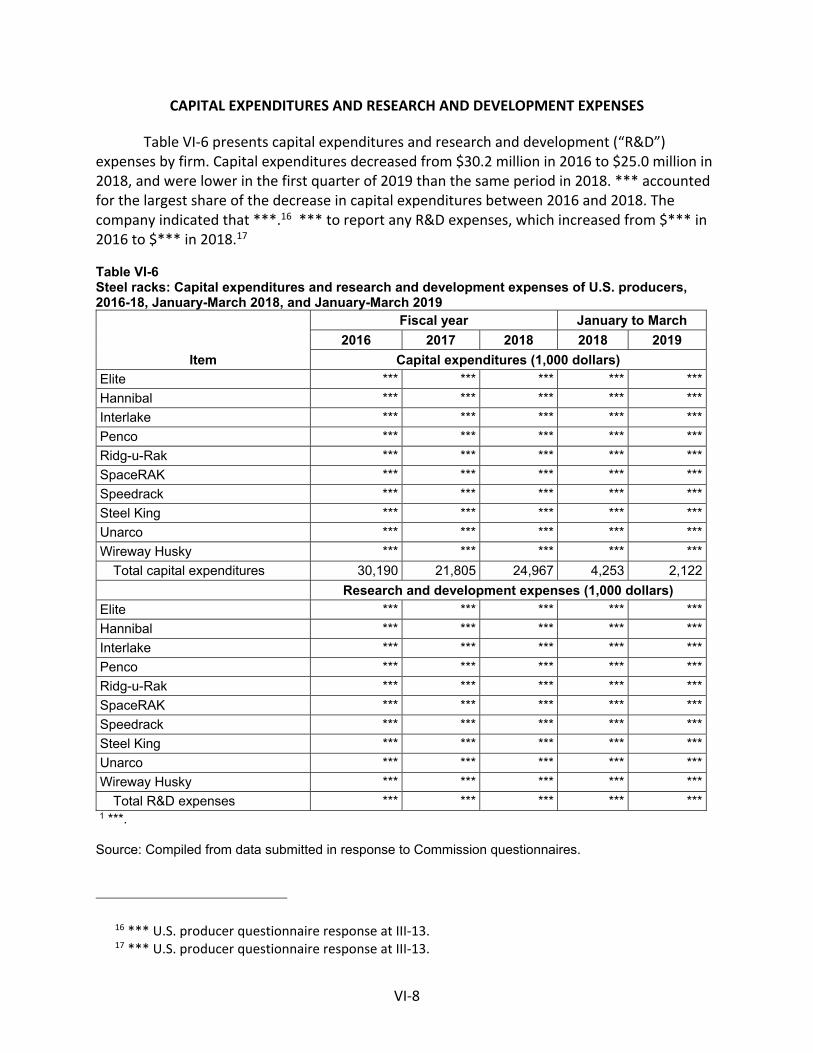
VI‐8
CAPITAL EXPENDITURES AND RESEARCH AND DEVELOPMENT EXPENSES
Table VI‐6 presents capital expenditures and research and development (“R&D”) expenses by firm. Capital expenditures decreased from $30.2 million in 2016 to $25.0 million in 2018, and were lower in the first quarter of 2019 than the same period in 2018. *** accounted for the largest share of the decrease in capital expenditures between 2016 and 2018. The company indicated that ***.16 *** to report any R&D expenses, which increased from $*** in 2016 to $*** in 2018.17 Table VI-6 Steel racks: Capital expenditures and research and development expenses of U.S. producers, 2016-18, January-March 2018, and January-March 2019
Item
Fiscal year January to March
2016 2017 2018 2018 2019
Capital expenditures (1,000 dollars)
Elite *** *** *** *** ***
Hannibal *** *** *** *** ***
Interlake *** *** *** *** ***
Penco *** *** *** *** ***
Ridg-u-Rak *** *** *** *** ***
SpaceRAK *** *** *** *** ***
Speedrack *** *** *** *** ***
Steel King *** *** *** *** ***
Unarco *** *** *** *** ***
Wireway Husky *** *** *** *** ***
Total capital expenditures 30,190 21,805 24,967 4,253 2,122
Research and development expenses (1,000 dollars)
Elite *** *** *** *** ***
Hannibal *** *** *** *** ***
Interlake *** *** *** *** ***
Penco *** *** *** *** ***
Ridg-u-Rak *** *** *** *** ***
SpaceRAK *** *** *** *** ***
Speedrack *** *** *** *** ***
Steel King *** *** *** *** ***
Unarco *** *** *** *** ***
Wireway Husky *** *** *** *** ***
Total R&D expenses *** *** *** *** *** 1 ***. Source: Compiled from data submitted in response to Commission questionnaires.
16 *** U.S. producer questionnaire response at III‐13. 17 *** U.S. producer questionnaire response at III‐13.
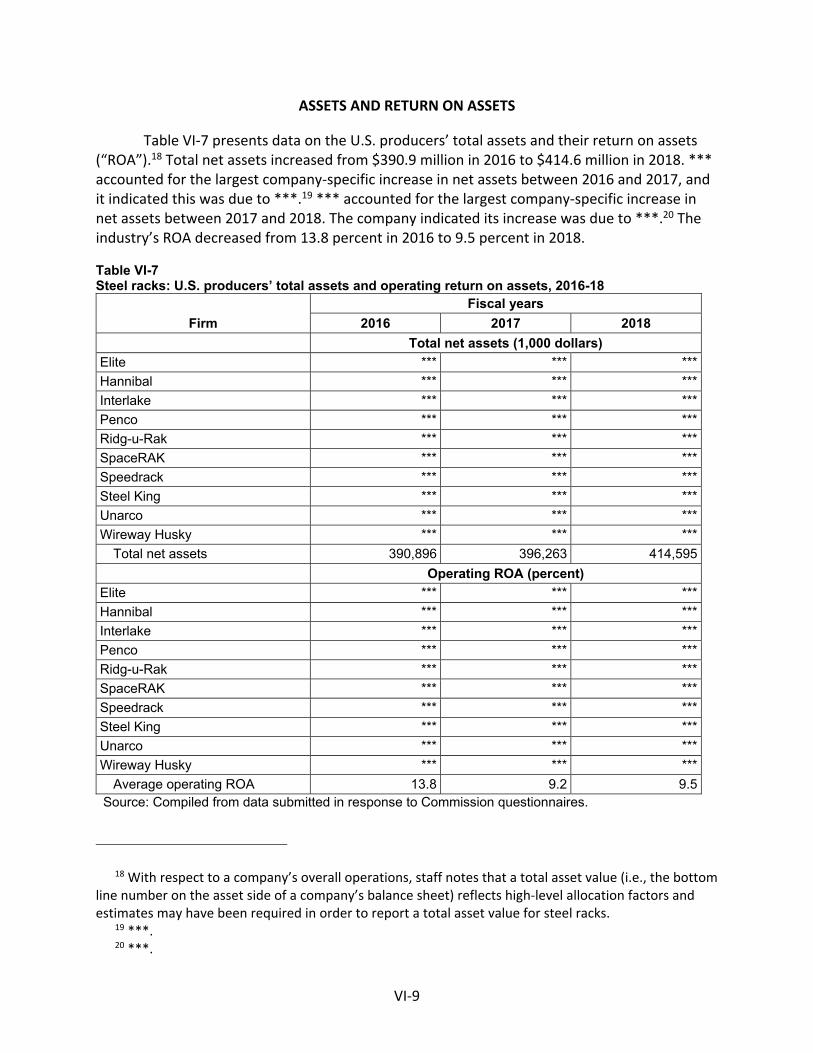
VI‐9
ASSETS AND RETURN ON ASSETS
Table VI‐7 presents data on the U.S. producers’ total assets and their return on assets (“ROA”).18 Total net assets increased from $390.9 million in 2016 to $414.6 million in 2018. *** accounted for the largest company‐specific increase in net assets between 2016 and 2017, and it indicated this was due to ***.19 *** accounted for the largest company‐specific increase in net assets between 2017 and 2018. The company indicated its increase was due to ***.20 The industry’s ROA decreased from 13.8 percent in 2016 to 9.5 percent in 2018. Table VI-7 Steel racks: U.S. producers’ total assets and operating return on assets, 2016-18
Firm
Fiscal years
2016 2017 2018
Total net assets (1,000 dollars)
Elite *** *** ***
Hannibal *** *** ***
Interlake *** *** ***
Penco *** *** ***
Ridg-u-Rak *** *** ***
SpaceRAK *** *** ***
Speedrack *** *** ***
Steel King *** *** ***
Unarco *** *** ***
Wireway Husky *** *** ***
Total net assets 390,896 396,263 414,595
Operating ROA (percent)
Elite *** *** ***
Hannibal *** *** ***
Interlake *** *** ***
Penco *** *** ***
Ridg-u-Rak *** *** ***
SpaceRAK *** *** ***
Speedrack *** *** ***
Steel King *** *** ***
Unarco *** *** ***
Wireway Husky *** *** ***
Average operating ROA 13.8 9.2 9.5 Source: Compiled from data submitted in response to Commission questionnaires.
18 With respect to a company’s overall operations, staff notes that a total asset value (i.e., the bottom line number on the asset side of a company’s balance sheet) reflects high‐level allocation factors and estimates may have been required in order to report a total asset value for steel racks.
19 ***. 20 ***.
VI‐10
CAPITAL AND INVESTMENT
The Commission requested U.S. producers of steel racks to describe any actual or potential negative effects of imports of steel racks from China on their firms’ growth, investment, ability to raise capital, development and production efforts, or the scale of capital investments. Table VI‐8 presents the number of firms reporting an impact in each category and table VI‐9 provides the U.S. producers’ narrative responses. Table VI-8 Steel racks: Actual and anticipated negative effects of imports on investment, growth, and development, since January 1, 2016
* * * * * * *
Table VI-9 Steel racks: Narratives relating to actual and anticipated negative effects of imports on investment and growth and development, since January 1, 2016
* * * * * * *
VII‐1
PART VII: THREAT CONSIDERATIONS AND INFORMATION ON NONSUBJECT COUNTRIES
Section 771(7)(F)(i) of the Act (19 U.S.C. § 1677(7)(F)(i)) provides that—
In determining whether an industry in the United States is threatened with material injury by reason of imports (or sales for importation) of the subject merchandise, the Commission shall consider, among other relevant economic factors1‐‐
(I) if a countervailable subsidy is involved, such information as may be presented to it by the administering authority as to the nature of the subsidy (particularly as to whether the countervailable subsidy is a subsidy described in Article 3 or 6.1 of the Subsidies Agreement), and whether imports of the subject merchandise are likely to increase,
(II) any existing unused production capacity or imminent, substantial increase in production capacity in the exporting country indicating the likelihood of substantially increased imports of the subject merchandise into the United States, taking into account the availability of other export markets to absorb any additional exports,
(III) a significant rate of increase of the volume or market penetration of imports of the subject merchandise indicating the likelihood of substantially increased imports,
(IV) whether imports of the subject merchandise are entering at prices that are likely to have a significant depressing or suppressing effect on domestic prices, and are likely to increase demand for further imports,
(V) inventories of the subject merchandise,
1 Section 771(7)(F)(ii) of the Act (19 U.S.C. § 1677(7)(F)(ii)) provides that “The Commission shall consider {these factors} . . . as a whole in making a determination of whether further dumped or subsidized imports are imminent and whether material injury by reason of imports would occur unless an order is issued or a suspension agreement is accepted under this title. The presence or absence of any factor which the Commission is required to consider . . . shall not necessarily give decisive guidance with respect to the determination. Such a determination may not be made on the basis of mere conjecture or supposition.”
VII‐2
(VI) the potential for product‐shifting if production facilities in the foreign country, which can be used to produce the subject merchandise, are currently being used to produce other products,
(VII) in any investigation under this title which involves imports of both a raw agricultural product (within the meaning of paragraph (4)(E)(iv)) and any product processed from such raw agricultural product, the likelihood that there will be increased imports, by reason of product shifting, if there is an affirmative determination by the Commission under section 705(b)(1) or 735(b)(1) with respect to either the raw agricultural product or the processed agricultural product (but not both),
(VIII) the actual and potential negative effects on the existing development and production efforts of the domestic industry, including efforts to develop a derivative or more advanced version of the domestic like product, and
(IX) any other demonstrable adverse trends that indicate the probability that there is likely to be material injury by reason of imports (or sale for importation) of the subject merchandise (whether or not it is actually being imported at the time).2
Information on the nature of the subsidies was presented earlier in this report; information on the volume and pricing of imports of the subject merchandise is presented in Parts IV and V; and information on the effects of imports of the subject merchandise on U.S. producers’ existing development and production efforts is presented in Part VI. Information on inventories of the subject merchandise; foreign producers’ operations, including the potential for “product‐shifting;” any other threat indicators, if applicable; and any dumping in third‐country markets, follows. Also presented in this section of the report is information obtained for consideration by the Commission on nonsubject countries.
2 Section 771(7)(F)(iii) of the Act (19 U.S.C. § 1677(7)(F)(iii)) further provides that, in antidumping investigations, “. . . the Commission shall consider whether dumping in the markets of foreign countries (as evidenced by dumping findings or antidumping remedies in other WTO member markets against the same class or kind of merchandise manufactured or exported by the same party as under investigation) suggests a threat of material injury to the domestic industry.”
VII‐3
THE INDUSTRY IN CHINA
The Commission issued foreign producers’ or exporters’ questionnaires to 53 firms believed to produce and/or export steel racks from China.3 Usable responses to the Commission’s questionnaire were received from six firms: Nanjing Dongsheng Shelf Manufacturing Co., Ltd. (“Dongsheng Shelf”), Nanjing Huade Storage Equipment Manufacture Co., Ltd. (“Huade Rack”), Jiangsu Kingmore Storage Equipment Manufacturing Co., Ltd. (“Kingmore Storage”), Nanjing Inform Storage Equipment (Group) Co., Ltd. (“Inform Storage”), Ningbo Xinguang Rack Co., Ltd. (“Xinguang Rack“), and Ningbo Beilun Songyi Warehouse Equipment Manufacturing Co., Ltd. (“Songyi Warehouse”). According to estimates requested of the responding China producers, the production of steel racks in China reported in the questionnaires accounts for approximately *** percent of overall production of steel racks in China and *** percent of total China exports of steel racks to the United States. Table VII‐1 presents information on the steel racks operations of the responding producers and exporters in China. Table VII-1 Steel racks: Summary data on firms in China, 2018
* * * * * * *
Changes in operations
As presented in table VII‐2, one producer in China reported an operational change since January 1, 2016. ***.
Table VII-2 Steel racks: Reported changes in operations by producers in China, since January 1, 2016
* * * * * * *
Operations on steel racks
Table VII‐3 presents information on the steel racks operations of the responding producers and exporters in China. Capacity in China decreased by *** percent from 2016 to 2018 and was lower by *** percent during January to March 2019 than January to March 2018. Capacity is also projected to remain relatively the same through 2019 and 2020. Meanwhile, production increased by *** percent from 2016 to 2018 and was lower by *** percent in January to March 2019 than in January to March 2018. Production is projected to decrease by
3 These firms were identified through a review of information submitted in the petition and contained in *** records.
VII‐4
*** percent in 2019 and subsequently increase by *** percent in 2020. Along with increased production, capacity utilization increased by *** percentage points from 2016 to 2018, from *** to *** percent. Capacity utilization was lower by *** percentage points during January to March 2019 than January to March 2018 and is projected to reach *** percent in 2020.
From 2016 to 2018, commercial home market shipments, export shipments to the United States, and export shipments to other markets increased by *** percent, *** percent, and *** percent, respectively. However, export shipments to the United States and commercial home market shipments were lower by *** and *** percent, respectively, in January to March 2019 than in January to March 2018, while export shipments to all other markets were higher by *** percent.4
The share of commercial home market shipments declined from *** to *** percent from 2016 to 2018. In contrast, the share of export shipments to the United States increased from *** percent in 2016 to *** percent in 2018. The share of exports to all other markets declined from *** to *** percent during the same period.
End‐of‐period inventories as a share of production and total shipments both increased by *** percentage points from 2016 to 2018, and were higher by *** and *** percentage points, respectively, in interim 2019 compared to interim 2018.
Steel rack producers in China reported operating between *** and *** weeks per year, with hours per week ranging from *** to ***. Chinese producers reported that production and capacity constraints included production equipment capacity, electricity supply, local climate, government policy, and warehouse space. Table VII-3 Steel racks: Data on industry in China, 2016-18, January to March 2018, and January to March 2019 and projection calendar years 2019 and 2020
* * * * * * *
Alternative products
As shown in table VII‐4, responding Chinese firms produced other products on the same equipment and machinery used to produce steel racks. *** of the *** responding firms reported out‐of‐scope production which included *** and ***. *** firms stated that they are not able to switch production (capacity) between steel racks and other products using the same equipment and/or labor. *** of Chinese production capacity was devoted to in‐scope steel racks. Out‐of‐scope production accounted for *** percent of total production from 2016 to 2018.
4 Other exports markets reported by Chinese steel rack producers: ***.
VII‐5
Table VII-4 Steel racks: Overall capacity and production on the same equipment as in-scope production by producers in China, 2016-18, January to March 2018, and January to March 2019
* * * * * * *
U.S. INVENTORIES OF IMPORTED MERCHANDISE
Table VII‐5 presents data on U.S. importers’ reported inventories of steel racks. Inventories of U.S. imports from China decreased from *** pounds in 2016 to *** pounds in 2018. Compared to subject imports, inventories decreased from the equivalent of *** percent of subject imports in 2016 to *** percent in 2018. Similarly, ratios of inventories of subject imports to U.S. shipments of imports decreased from *** percent in 2016 to *** percent in 2018. Inventories of imports from nonsubject sources increased from *** pounds in 2016 to *** pounds in 2018. The ratio of these inventories to U.S. imports, U.S. shipments of imports, and total shipments of imports fell by ***, ***, and *** percentage points, respectively, from 2016 to 2018. Table VII-5 Steel racks: U.S. importers' end-of-period inventories of imports by source, 2016-18, January to March 2018, and January to March 2019
* * * * * * *
U.S. IMPORTERS’ OUTSTANDING ORDERS
The Commission requested importers to indicate whether they imported or arranged for the importation of steel racks from China after March 31, 2019. Table VII‐6 presents data on U.S. importers’ arranged imports of steel racks from April 2019 through March 2020. Responding importers reported *** pounds of arranged imports of steel racks from China and *** pounds of arranged imports of steel racks from nonsubject sources. *** arranged imports of steel racks from Mexico were reported for the specified period.
Table VII-6 Steel racks: Arranged imports, April 2019 through March 2020
* * * * * * *
VII‐6
ANTIDUMPING OR COUNTERVAILING DUTY ORDERS IN THIRD‐COUNTRY MARKETS
On June 18, 2018, the Australian Anti‐dumping Commission (“AADC”) issued preliminary affirmative antidumping determinations on “steel pallet racking”5 exported from China6 and Malaysia, to prevent material injury to the Australian industry while the investigation continues.7
On April 5, 2019, the AADC provided its affirmative final affirmative antidumping recommendations on steel pallet racking8 exported from China9 and Malaysia to the Minister for Industry, Science and Technology (“Minister”). On May 6, the Minister published a notice announcing acceptance and imposition of the AADC’s final‐report’s antidumping‐duty findings and recommendations on steel pallet racking exported from China and Malaysia to Australia, effective after the notice publication date.10
The Petitioner and Respondent UMH provided different approaches to addressing the extent of overlap between the steel pallet racking subject to Australia’s antidumping proceedings and the subject steel racks described in Commerce’s scope. According to the Petitioner, the Australian subject‐product scope description in its final proceedings is broader with only one dimensional specification,11 in contrast to Commerce’s more complex scope with multiple dimensional limitations and specific exemptions for a number of non‐pallet products. The Petitioner further noted that the steel racks described in Commerce’s scope of these
5 The goods subject to Australia’s investigation are described as: “Steel pallet racking, or part thereof, assembled or unassembled, of dimensions that can be adjusted as required (with or without licking tabs and/or lots, and/or bolted or clamped connections), including any of the following— beams, uprights (up to 12 meters) and brace (with or without nuts and bolts.” AADC, “Steel Pallet Racking Exported from the People’s Republic of China and Malaysia, Preliminary Affirmative Determination and Imposition of Securities,” Anti‐dumping Notice No. 2018/87, Canberra: Australian Government, Department of Industry, Innovation and Science, June 18, 2018, p. 1. Petitioner’s postconference brief, exh. 14.
6 Preliminary antidumping margins of 12.0‐74.4 percent were assigned to responding Chinese exporters and of 109.1 percent to non‐responding Chinese exporters. Ibid., pp. 6, 10.
7 Ibid., p. 3. 8 AADC, Alleged Dumping of Steel Pallet Racking Exported from the People’s Republic of China and
Malaysia, Final Report No. 441, Canberra: Australian Government, Department of Industry, Innovation and Science, April 5, 2019,
9 Final antidumping margins of 33.7−78.6 percent were assigned to responding Chinese exporters and of 110.3 percent to non‐responding Chinese exporters. Ibid., p. 9.
10 AADC, “Investigation Number 441, Steel Pallet Racking, Findings in Relation to a Dumping Investigation Exported from China and Malaysia,” Anti‐Dumping Notice (AND) 2019/45, Canberra: Australian Government, Department of Industry, Innovation and Science, May 6, 2019.
11 Petitioner’s posthearing brief, exh. 10, “Everything you need to know about Australia’s anti‐dumping against steel pallet racking from China,” March 29, 2019; exh. 11, “Australian Antidumping Commission, Final Report No. 441,” pp. 13‐14.
VII‐7
antidumping and countervailing duty investigations appear to be covered within the scope of the Australian antidumping investigation.12
The Respondent UMH noted differences between the U.S. and Australian‐manufactured rack products, including product certifications (RMI versus Standards Australia (“AS”)), product standards (ANSI MH16 1‐2012 versus AS 4084‐2012), and column hole shapes (teardrop versus oblong), and others.13 It stated that, due to these product differences that would also require different manufacturing equipment, the Chinese rack producers for the Australian market could not produce these rack products for the U.S. market without investing in new manufacturing equipment, adopting new production methods, and obtaining new product certifications.14
The Petitioner stated that it was not aware of any other trade‐remedy investigations in third‐country markets beyond the Australian proceedings.15
INFORMATION ON NONSUBJECT COUNTRIES
Information about global exports by nonsubject countries is not readily available, in part because steel racks enter the U.S. market under HTS subheadings that include numerous other fabricated products of iron or steel, of which the portion that is the in‐scope product is not known.
12 Petitioner’s posthearing brief, “Answers to Commissioner questions,” p. 20. 13 Repsondent UMH’s posthearing brief, exh. 16, “Differences between Australian investigation and
U.S. investigation.” 14 Respondent UMH’s posthearing brief, exh. 1, “Compiled Q&As,” pp. 57‐58. 15 Petitioner’s posthearing brief, “Answers to Commissioner questions,” p. 20. Respondent UMH mentioned but did not address this question in its posthearing brief. Respondent
UMH’s posthearing brief, exh. 1, “Compiled Q&As,” p. 57.
VII‐8
The AADC identified six Australian firms that produce steel pallet racking.16 In the preliminary phase of the Commission’s investigations, a witness for U.S. producer Ridge‐U‐Rak testified that some steel racks are periodically imported from Canada,17 and a witness for importer UMH testified that some steel racks are imported from Mexico. The UMH witness also cited Interlake and Frazier among the importers of product from nonsubject countries, primarily Mexico.18 *** reported importing from *** in ***, ***, and ***.19 *** reported importing from ***. *** reported importing from ***, ***.20
16 The six Australian manufacturers are: APC Storage Solutions Pty. Ltd., Brownbuilt Pty. Ltd., Dematic, Macrack (Australia) Pty. Ltd., Noble Trading Manufacturing Pty. Ltd., and Spacerack Storage Centre (Brisbane) Pty. Ltd. AADC, Alleged Dumping of Steel Pallet Racking Exported from the People’s Republic of China and Malaysia, Final Report No. 441, Canberra: Australian Government, Department of Industry, Innovation and Science, April 5, 2019., p. 9.
17 Conference transcript, p. 85 (Olson). 18 Conference transcript pp. 122‐123 (R. Bartlett). ***. Staff telephone interviews with *** and ***,
July 12 and 18, 2018. Interlake has two production facilities, located in Tijuana (across from San Diego, California) and
Matamoros (in the northeastern state of Tamaulipas, across from Brownsville at the southern tip of Texas). Interlake, “The Group’s Position in the World,” 2018.
*** Two other Mexican producers are ESTRAL Rack Manufacture, with a production facility located in San
Nicolás de los Garza (in Nuevo León) and Rack USA/Nechochea, with a production facility located in Gomez Palácio (in the northwestern state of Durango). Staff e‐mail correspondence with ***, July 24‐26, 2018.
19 *** importer questionnaire response. 20 *** importer questionnaire response.
A‐1
APPENDIX A
FEDERAL REGISTER NOTICES


A‐3
The Commission makes available notices relevant to its investigations and reviews on its website, www.usitc.gov. In addition, the following tabulation presents, in chronological order, Federal Register notices issued by the Commission and Commerce during the current proceeding.
Citation Title Link
83 FR 29822
June 20, 2018 Steel Racks From China; Institution of Antidumping and Countervailing Duty Investigations and Scheduling of Preliminary Phase Investigations
https://www.govinfo.gov/content/pkg/FR-2018-06-26/pdf/2018-13727.pdf
83 FR 33201 July 17, 2018
Certain Steel Racks From the People's Republic: Initiation of Countervailing Duty Investigation
https://www.govinfo.gov/content/pkg/FR‐2018‐07‐17/pdf/2018‐15224.pdf
83 FR 33195 July 17, 2018
Steel Racks From the People's Republic of China: Initiation of Less‐Than‐Fair‐Value Investigation
https://www.govinfo.gov/content/pkg/FR‐2018‐07‐17/pdf/2018‐15225.pdf
83 FR 40552 August 15, 2018
Steel Racks From China https://www.govinfo.gov/content/pkg/FR‐2018‐08‐15/pdf/2018‐17476.pdf
83 FR 43848 August 28, 2018
Countervailing Duty Investigation of Steel Racks From the People's Republic of China: Postponement of Preliminary Determination
https://www.govinfo.gov/content/pkg/FR‐2018‐08‐28/pdf/2018‐18611.pdf
83 FR 53606 October 24, 2018
Steel Racks and Parts Thereof From the People's Republic of China: Postponement of Preliminary Determination in the Less‐Than‐Fair‐Value Investigation
https://www.govinfo.gov/content/pkg/FR‐2018‐10‐24/pdf/2018‐23223.pdf
83 FR 62297 December 3, 2018
Certain Steel Racks From the People's Republic of China: Preliminary Affirmative Countervailing Duty Determination, and Alignment of Final Determination With Final Antidumping Duty Determination
https://www.govinfo.gov/content/pkg/FR‐2018‐12‐03/pdf/2018‐26172.pdf
84 FR 7326 March 4, 2019
Steel Racks and Parts Thereof From the People's Republic of China: Preliminary Determination of Sales at Less Than Fair Value
https://www.govinfo.gov/content/pkg/FR‐2019‐03‐04/pdf/2019‐03820.pdf
84 FR 11835 March 4, 2019
Steel Racks From China; Scheduling of the Final Phase of Countervailing Duty and Antidumping Duty Investigations
https://www.govinfo.gov/content/pkg/FR‐2019‐03‐28/pdf/2019‐05925.pdf
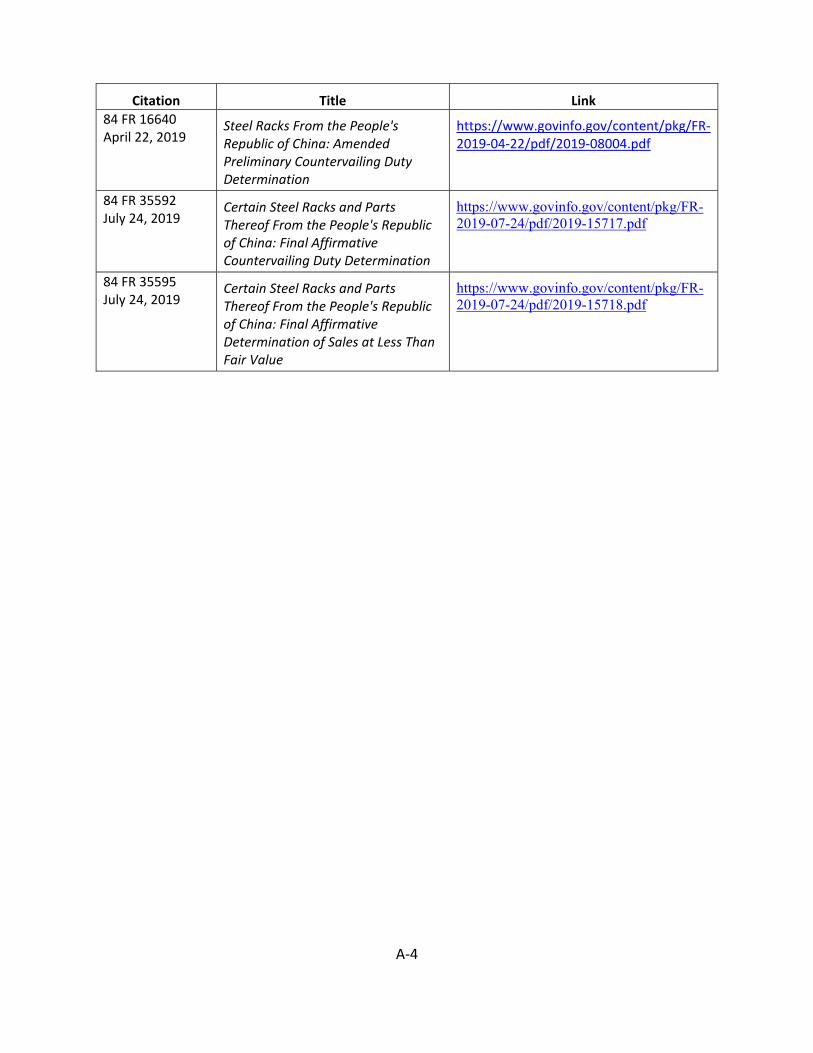
A‐4
Citation Title Link
84 FR 16640 April 22, 2019
Steel Racks From the People's Republic of China: Amended Preliminary Countervailing Duty Determination
https://www.govinfo.gov/content/pkg/FR‐2019‐04‐22/pdf/2019‐08004.pdf
84 FR 35592 July 24, 2019
Certain Steel Racks and Parts Thereof From the People's Republic of China: Final Affirmative Countervailing Duty Determination
https://www.govinfo.gov/content/pkg/FR-2019-07-24/pdf/2019-15717.pdf
84 FR 35595 July 24, 2019
Certain Steel Racks and Parts Thereof From the People's Republic of China: Final Affirmative Determination of Sales at Less Than Fair Value
https://www.govinfo.gov/content/pkg/FR-2019-07-24/pdf/2019-15718.pdf

B‐1
APPENDIX B
LIST OF HEARING WITNESSES

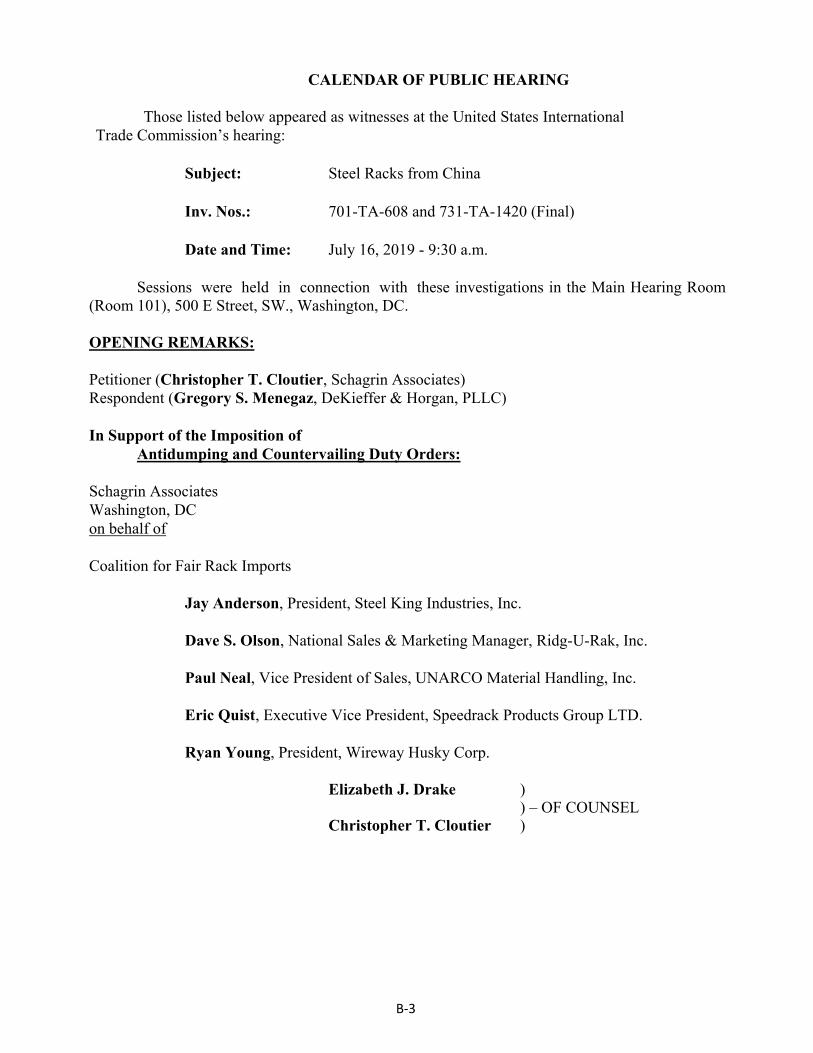
B-3
CALENDAR OF PUBLIC HEARING
Those listed below appeared as witnesses at the United States International Trade Commission’s hearing:
Subject: Steel Racks from China
Inv. Nos.: 701-TA-608 and 731-TA-1420 (Final)
Date and Time: July 16, 2019 - 9:30 a.m.
Sessions were held in connection with these investigations in the Main Hearing Room (Room 101), 500 E Street, SW., Washington, DC.
OPENING REMARKS:
Petitioner (Christopher T. Cloutier, Schagrin Associates) Respondent (Gregory S. Menegaz, DeKieffer & Horgan, PLLC)
In Support of the Imposition of Antidumping and Countervailing Duty Orders:
Schagrin Associates Washington, DC on behalf of
Coalition for Fair Rack Imports
Jay Anderson, President, Steel King Industries, Inc.
Dave S. Olson, National Sales & Marketing Manager, Ridg-U-Rak, Inc.
Paul Neal, Vice President of Sales, UNARCO Material Handling, Inc.
Eric Quist, Executive Vice President, Speedrack Products Group LTD.
Ryan Young, President, Wireway Husky Corp.
Elizabeth J. Drake ) ) – OF COUNSEL
Christopher T. Cloutier )
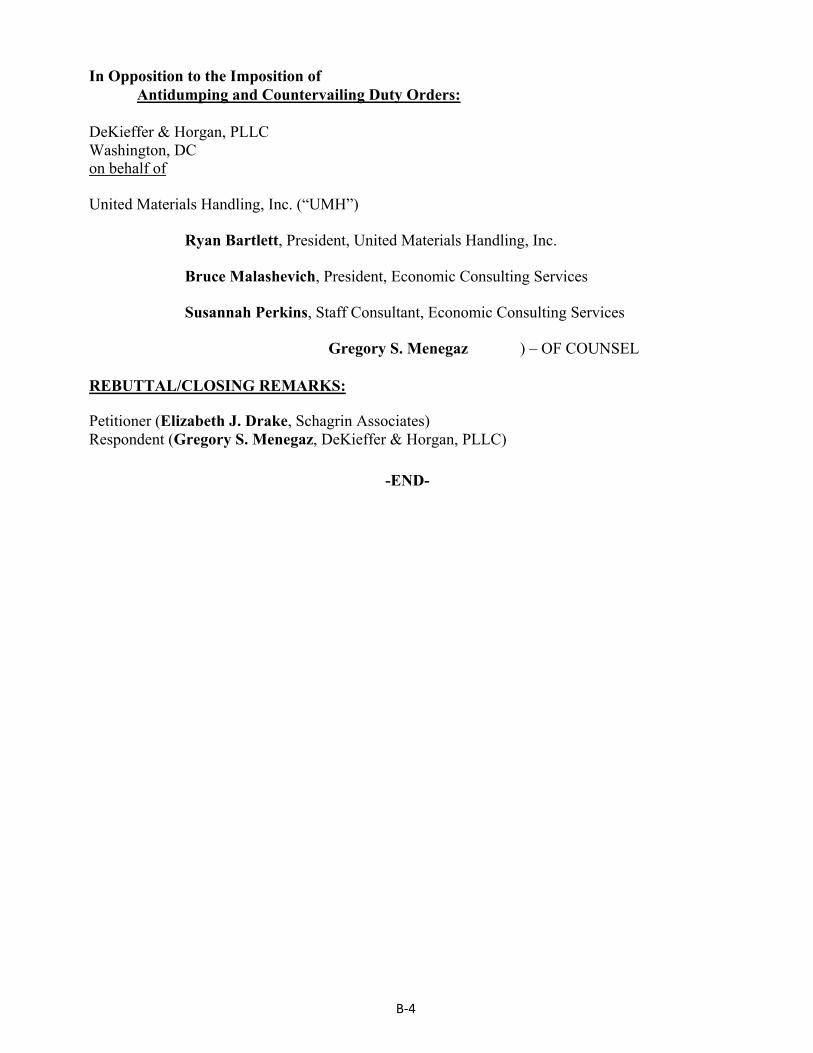
B-4
In Opposition to the Imposition of Antidumping and Countervailing Duty Orders:
DeKieffer & Horgan, PLLC Washington, DC on behalf of
United Materials Handling, Inc. (“UMH”)
Ryan Bartlett, President, United Materials Handling, Inc.
Bruce Malashevich, President, Economic Consulting Services
Susannah Perkins, Staff Consultant, Economic Consulting Services
Gregory S. Menegaz ) – OF COUNSEL
REBUTTAL/CLOSING REMARKS:
Petitioner (Elizabeth J. Drake, Schagrin Associates) Respondent (Gregory S. Menegaz, DeKieffer & Horgan, PLLC)
-END-
C‐1
APPENDIX C
SUMMARY DATA
Table C‐1: Steel Racks: Summary data concerning the total U.S. market .................................. C‐3
C‐2
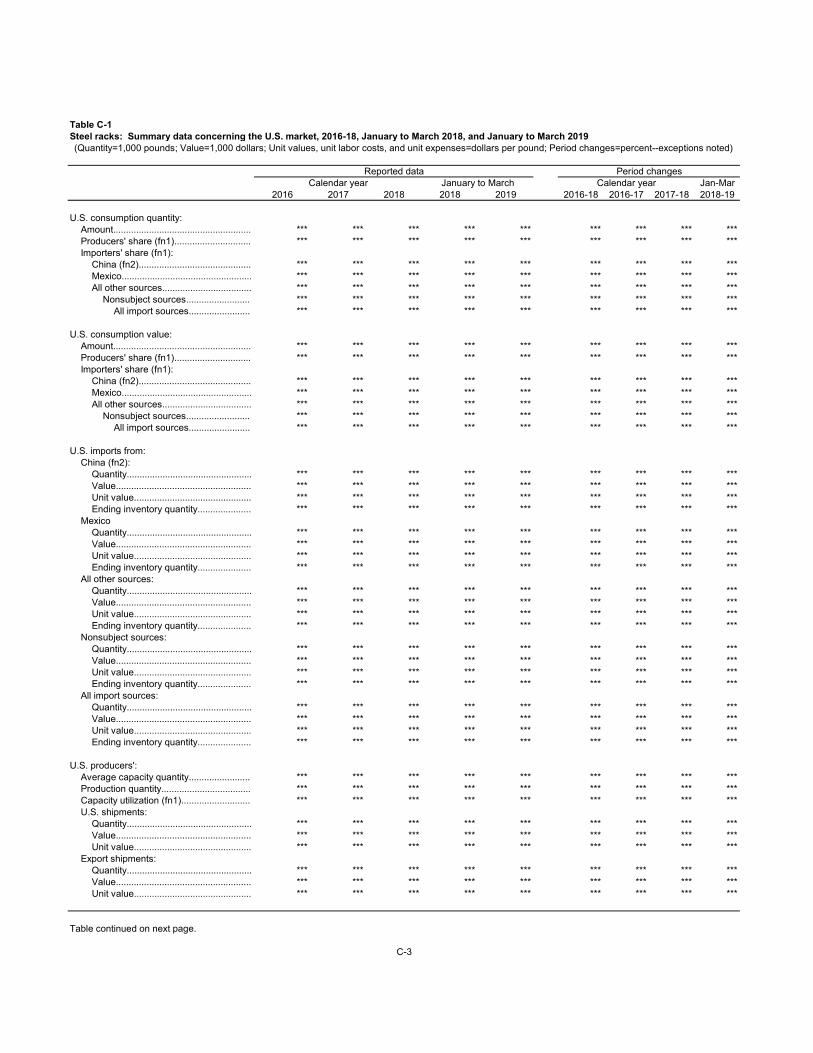
Table C-1Steel racks: Summary data concerning the U.S. market, 2016-18, January to March 2018, and January to March 2019
Jan-Mar2016 2017 2018 2018 2019 2016-18 2016-17 2017-18 2018-19
U.S. consumption quantity:Amount...................................................... *** *** *** *** *** *** *** *** ***Producers' share (fn1).............................. *** *** *** *** *** *** *** *** ***Importers' share (fn1):
China (fn2)............................................ *** *** *** *** *** *** *** *** ***Mexico................................................... *** *** *** *** *** *** *** *** ***All other sources................................... *** *** *** *** *** *** *** *** ***
Nonsubject sources......................... *** *** *** *** *** *** *** *** ***All import sources........................ *** *** *** *** *** *** *** *** ***
U.S. consumption value:Amount...................................................... *** *** *** *** *** *** *** *** ***Producers' share (fn1).............................. *** *** *** *** *** *** *** *** ***Importers' share (fn1):
China (fn2)............................................ *** *** *** *** *** *** *** *** ***Mexico................................................... *** *** *** *** *** *** *** *** ***All other sources................................... *** *** *** *** *** *** *** *** ***
Nonsubject sources......................... *** *** *** *** *** *** *** *** ***All import sources........................ *** *** *** *** *** *** *** *** ***
U.S. imports from:China (fn2):
Quantity................................................. *** *** *** *** *** *** *** *** ***Value..................................................... *** *** *** *** *** *** *** *** ***Unit value.............................................. *** *** *** *** *** *** *** *** ***Ending inventory quantity..................... *** *** *** *** *** *** *** *** ***
MexicoQuantity................................................. *** *** *** *** *** *** *** *** ***Value..................................................... *** *** *** *** *** *** *** *** ***Unit value.............................................. *** *** *** *** *** *** *** *** ***Ending inventory quantity..................... *** *** *** *** *** *** *** *** ***
All other sources:Quantity................................................. *** *** *** *** *** *** *** *** ***Value..................................................... *** *** *** *** *** *** *** *** ***Unit value.............................................. *** *** *** *** *** *** *** *** ***Ending inventory quantity..................... *** *** *** *** *** *** *** *** ***
Nonsubject sources:Quantity................................................. *** *** *** *** *** *** *** *** ***Value..................................................... *** *** *** *** *** *** *** *** ***Unit value.............................................. *** *** *** *** *** *** *** *** ***Ending inventory quantity..................... *** *** *** *** *** *** *** *** ***
All import sources:Quantity................................................. *** *** *** *** *** *** *** *** ***Value..................................................... *** *** *** *** *** *** *** *** ***Unit value.............................................. *** *** *** *** *** *** *** *** ***Ending inventory quantity..................... *** *** *** *** *** *** *** *** ***
U.S. producers':Average capacity quantity........................ *** *** *** *** *** *** *** *** ***Production quantity................................... *** *** *** *** *** *** *** *** ***Capacity utilization (fn1)........................... *** *** *** *** *** *** *** *** ***U.S. shipments:
Quantity................................................. *** *** *** *** *** *** *** *** ***Value..................................................... *** *** *** *** *** *** *** *** ***Unit value.............................................. *** *** *** *** *** *** *** *** ***
Export shipments:Quantity................................................. *** *** *** *** *** *** *** *** ***Value..................................................... *** *** *** *** *** *** *** *** ***Unit value.............................................. *** *** *** *** *** *** *** *** ***
Table continued on next page.
Calendar year Calendar yearJanuary to MarchPeriod changes
(Quantity=1,000 pounds; Value=1,000 dollars; Unit values, unit labor costs, and unit expenses=dollars per pound; Period changes=percent--exceptions noted)
C-3
Reported data
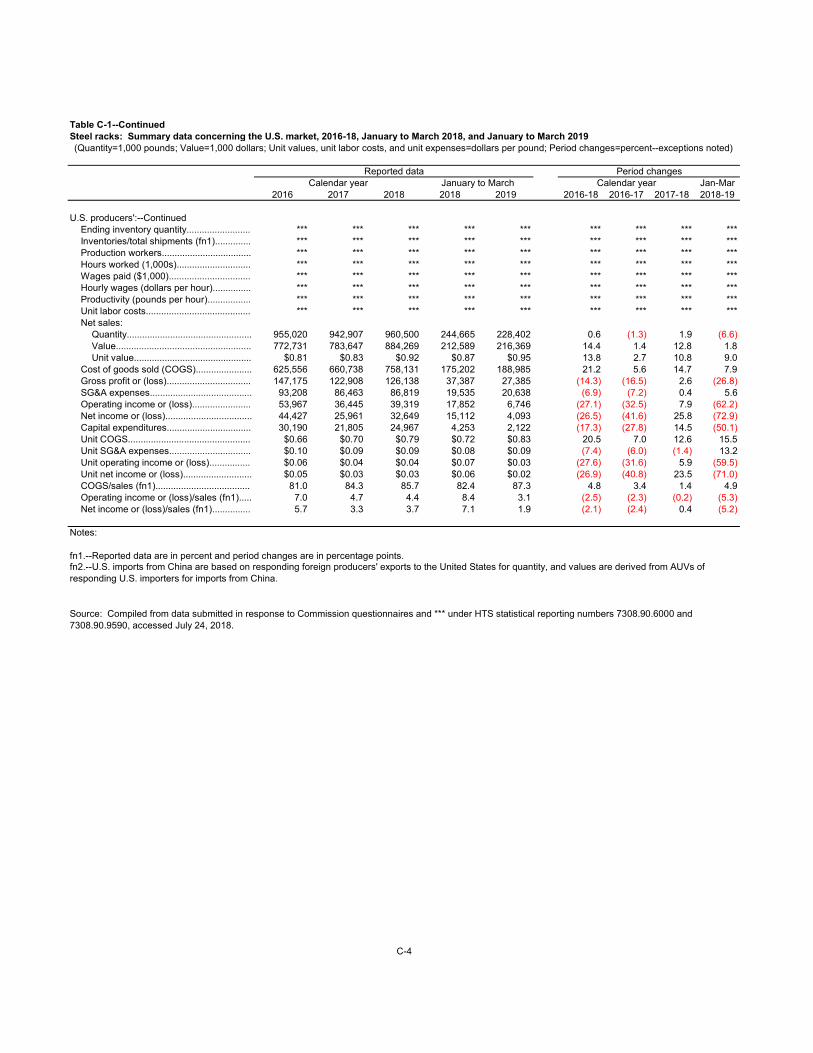
Table C-1--ContinuedSteel racks: Summary data concerning the U.S. market, 2016-18, January to March 2018, and January to March 2019
Jan-Mar2016 2017 2018 2018 2019 2016-18 2016-17 2017-18 2018-19
U.S. producers':--ContinuedEnding inventory quantity......................... *** *** *** *** *** *** *** *** ***Inventories/total shipments (fn1).............. *** *** *** *** *** *** *** *** ***Production workers................................... *** *** *** *** *** *** *** *** ***Hours worked (1,000s)............................. *** *** *** *** *** *** *** *** ***Wages paid ($1,000)................................ *** *** *** *** *** *** *** *** ***Hourly wages (dollars per hour)............... *** *** *** *** *** *** *** *** ***Productivity (pounds per hour)................. *** *** *** *** *** *** *** *** ***Unit labor costs......................................... *** *** *** *** *** *** *** *** ***Net sales:
Quantity................................................. 955,020 942,907 960,500 244,665 228,402 0.6 (1.3) 1.9 (6.6)Value..................................................... 772,731 783,647 884,269 212,589 216,369 14.4 1.4 12.8 1.8Unit value.............................................. $0.81 $0.83 $0.92 $0.87 $0.95 13.8 2.7 10.8 9.0
Cost of goods sold (COGS)...................... 625,556 660,738 758,131 175,202 188,985 21.2 5.6 14.7 7.9Gross profit or (loss)................................. 147,175 122,908 126,138 37,387 27,385 (14.3) (16.5) 2.6 (26.8)SG&A expenses........................................ 93,208 86,463 86,819 19,535 20,638 (6.9) (7.2) 0.4 5.6Operating income or (loss)....................... 53,967 36,445 39,319 17,852 6,746 (27.1) (32.5) 7.9 (62.2)Net income or (loss).................................. 44,427 25,961 32,649 15,112 4,093 (26.5) (41.6) 25.8 (72.9)Capital expenditures................................. 30,190 21,805 24,967 4,253 2,122 (17.3) (27.8) 14.5 (50.1)Unit COGS................................................ $0.66 $0.70 $0.79 $0.72 $0.83 20.5 7.0 12.6 15.5Unit SG&A expenses................................ $0.10 $0.09 $0.09 $0.08 $0.09 (7.4) (6.0) (1.4) 13.2Unit operating income or (loss)................ $0.06 $0.04 $0.04 $0.07 $0.03 (27.6) (31.6) 5.9 (59.5)Unit net income or (loss)........................... $0.05 $0.03 $0.03 $0.06 $0.02 (26.9) (40.8) 23.5 (71.0)COGS/sales (fn1)..................................... 81.0 84.3 85.7 82.4 87.3 4.8 3.4 1.4 4.9Operating income or (loss)/sales (fn1)..... 7.0 4.7 4.4 8.4 3.1 (2.5) (2.3) (0.2) (5.3)Net income or (loss)/sales (fn1)............... 5.7 3.3 3.7 7.1 1.9 (2.1) (2.4) 0.4 (5.2)
Notes:
fn1.--Reported data are in percent and period changes are in percentage points.
C-4
(Quantity=1,000 pounds; Value=1,000 dollars; Unit values, unit labor costs, and unit expenses=dollars per pound; Period changes=percent--exceptions noted)
Period changesCalendar year January to March
fn2.--U.S. imports from China are based on responding foreign producers' exports to the United States for quantity, and values are derived from AUVs of responding U.S. importers for imports from China.
Source: Compiled from data submitted in response to Commission questionnaires and *** under HTS statistical reporting numbers 7308.90.6000 and 7308.90.9590, accessed July 24, 2018.
Reported dataCalendar year
D‐1
APPENDIX D
NONSUBJECT COUNTRY PRICE DATA

D‐3
One importer (***) reported price data for Mexico for products 1, 2, and 4.1 Price data reported by this firm accounted for *** percent of U.S. commercial shipments from Mexico. These price items and accompanying data are comparable to those presented in tables V‐3, V‐4, and V‐6. Price and quantity data for Mexico are shown in tables D‐1 to D‐3 and in figure D‐1 to D‐3 (with domestic and subject sources). ***.
In comparing Mexico pricing data with U.S. producer pricing data, prices for product imported from Mexico were lower than prices for U.S.‐produced product in *** instances and higher in *** instances. In comparing Mexico pricing data with China pricing data, prices for product imported from Mexico were lower than prices for product imported from subject countries in *** instances and higher in *** instances. A summary of price differentials is presented in table D‐4.
Table D-1 Steel racks: Weighted-average f.o.b. prices and quantities of imported product 1, by quarters, January 2016-March 2019
* * * * * * *
Table D-2 Steel racks: Weighted-average f.o.b. prices and quantities of imported product 2, by quarters, January 2016-March 2019
* * * * * * * Table D-3 Steel racks: Weighted-average f.o.b. prices and quantities of imported product 4, by quarters, January 2016-March 2019
* * * * * * * Figure D-1 Steel racks: Weighted-average f.o.b. prices and quantities of domestic and imported product 1, by quarters, January 2016-March 2019
* * * * * * * Figure D-2 Steel racks: Weighted-average f.o.b. prices and quantities of domestic and imported product 2, by quarters, January 2016-March 2019
* * * * * * *
1 ***.
D‐4
Figure D-3 Steel racks: Weighted-average f.o.b. prices and quantities of domestic and imported product 4, by quarters, January 2016-March 2019
* * * * * * * Table D-4 Steel racks: Summary of price comparisons for nonsubject price data, by source, January 2016-March 2019
* * * * * * *