Embed Size (px)
Citation preview
June 2016
A Division of the New York State Department of Labor
STEM Occupations
in New York State
1
STEM Occupations in New York State
Introduction “STEM” is used to refer to occupations that involve studies in these four fields:
Science
Technology
Engineering
Mathematics
STEM jobs are a catalyst for regional economic growth as they bolster innovation while
improving productivity across the workforce. Although very competitive, STEM careers offer
many advantages, including:
Relatively high wages
Low unemployment rates
Growing employment opportunities
In addition, STEM careers tend to be more financially lucrative than non-STEM careers. In New
York State, the 2015 median hourly wage for job titles classified as “STEM Core” jobs was
$41.74, which is almost 60% higher than the comparable wage ($24.65) for non-STEM job titles.
STEM careers typically require a bachelor’s degree or higher, but there also exist certain STEM
occupations in which an associate degree and/or a post-secondary vocational certificate are the
only pre-requisites needed for entry.
All statewide and regional STEM data presented in this report come from Economic Modeling
Specialists International (EMSI), an economic software firm that specializes in employment data
and labor market analysis.
Defining STEM The acronym “STEM” is widely used in discussions across government, academia and business,
given the recent increased emphasis on innovation and its implications for the economy and
labor market. The discussion and analyses quickly get confounded, however, since there is no
commonly agreed upon definition of STEM.
In July 2011, the U.S. Office of Management and Budget asked the Standard Occupational
Classification Policy Committee (SOCPC) to recommend options for defining STEM occupations
based on the 2010 Standard Occupational Classification system. This request was made in order
2
to enhance comparability of data across statistical agencies and organizations studying the
STEM workforce for policymaking purposes, including educational and workforce planners. This
definition, unlike previous attempts, also includes higher-level health care occupations. The
number of jobs in these health-related occupations is almost twice the number of non-health or
“core” STEM occupations.
Including health-related STEM job titles in this report would heavily skew much of the analysis.
For example, females constitute just over 1 in 4 workers in core STEM occupations (indicative of
a need to recruit more women to the field), but more than half of workers in all STEM
occupations. Similarly, the health care and core STEM occupations face very different
challenges, so this report will focus on core STEM job titles only.
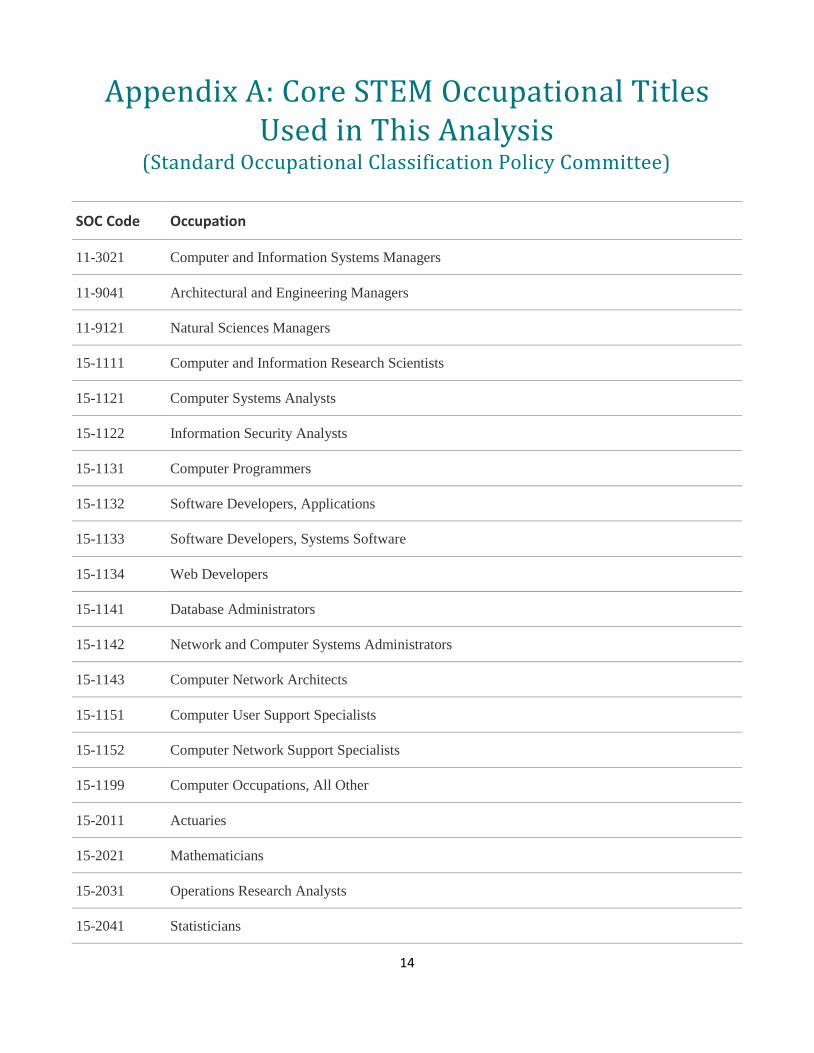
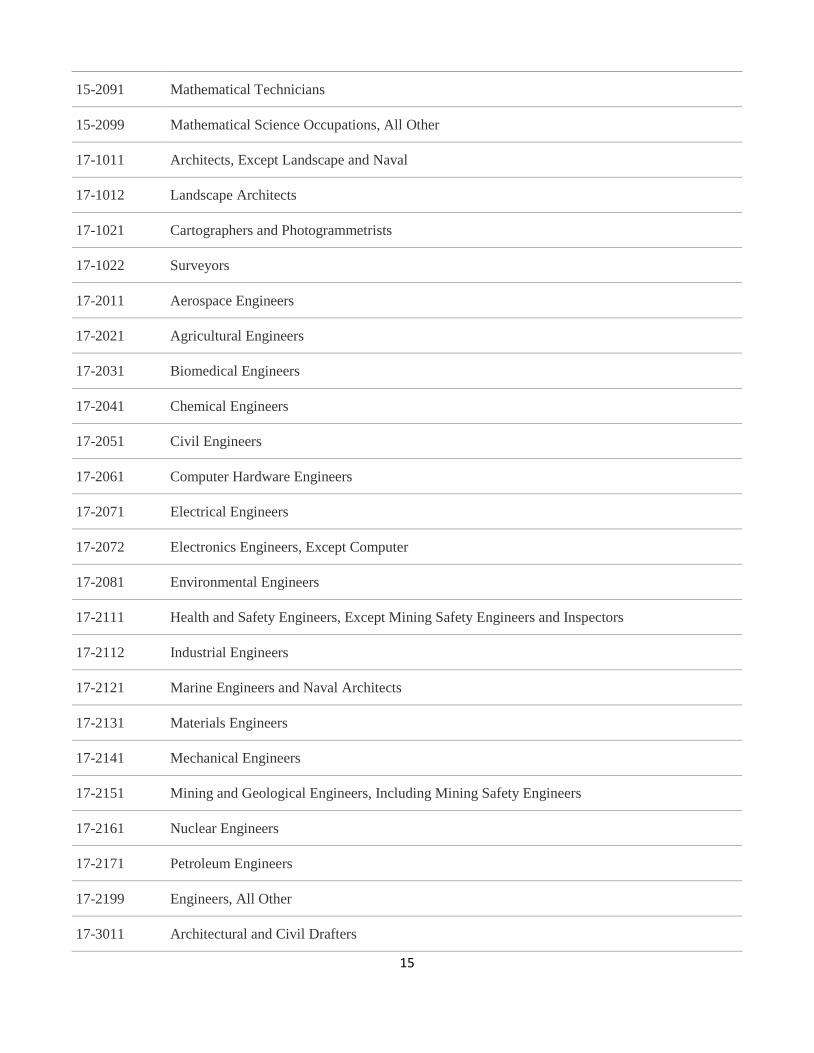
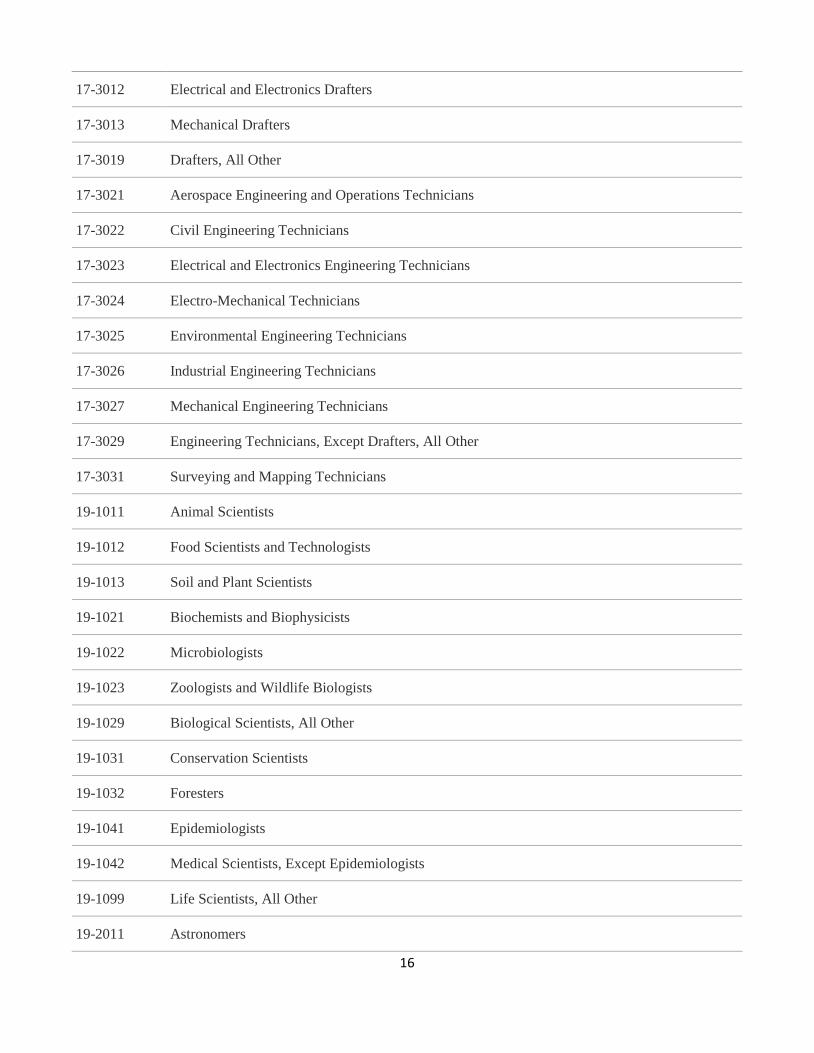
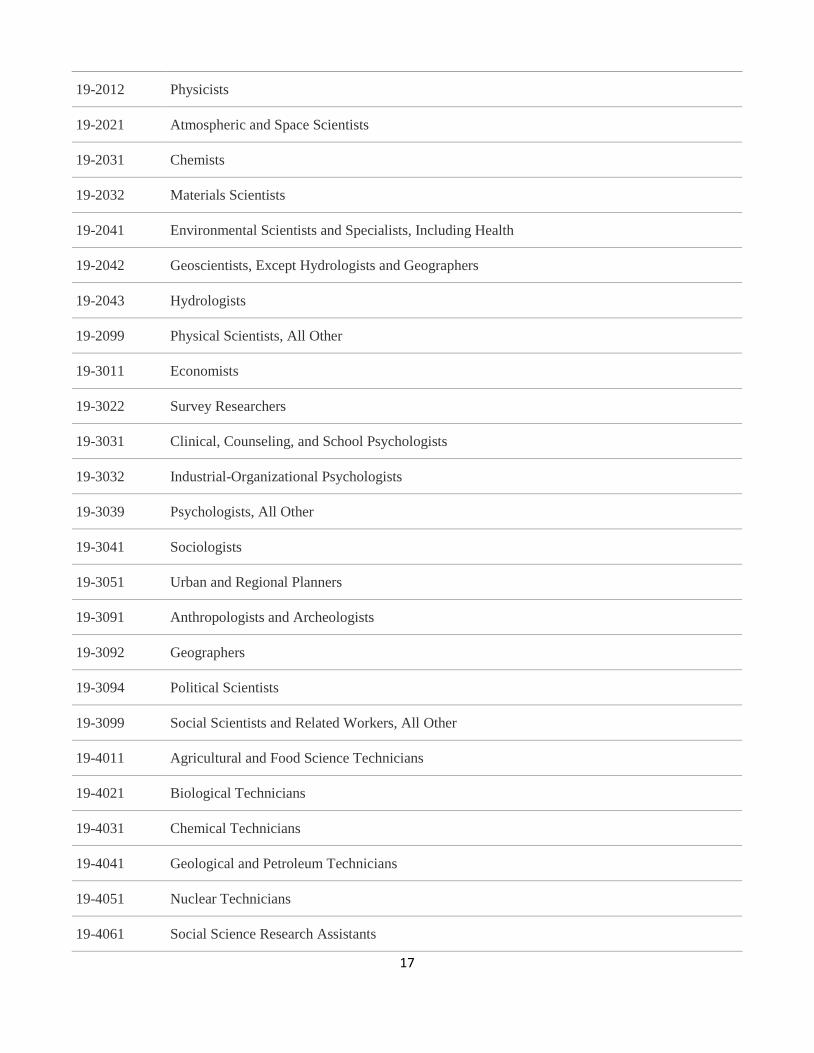
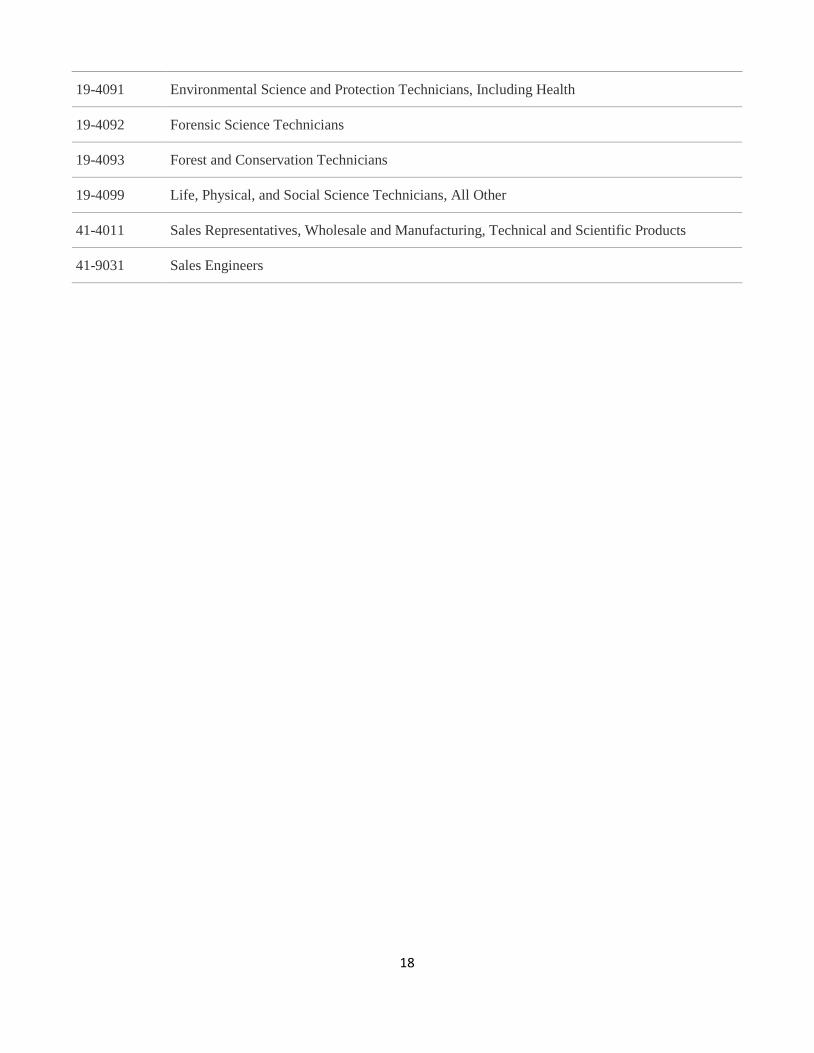
See Appendix A at the end of this report for a list of core STEM job titles, based on the SOCPC’s
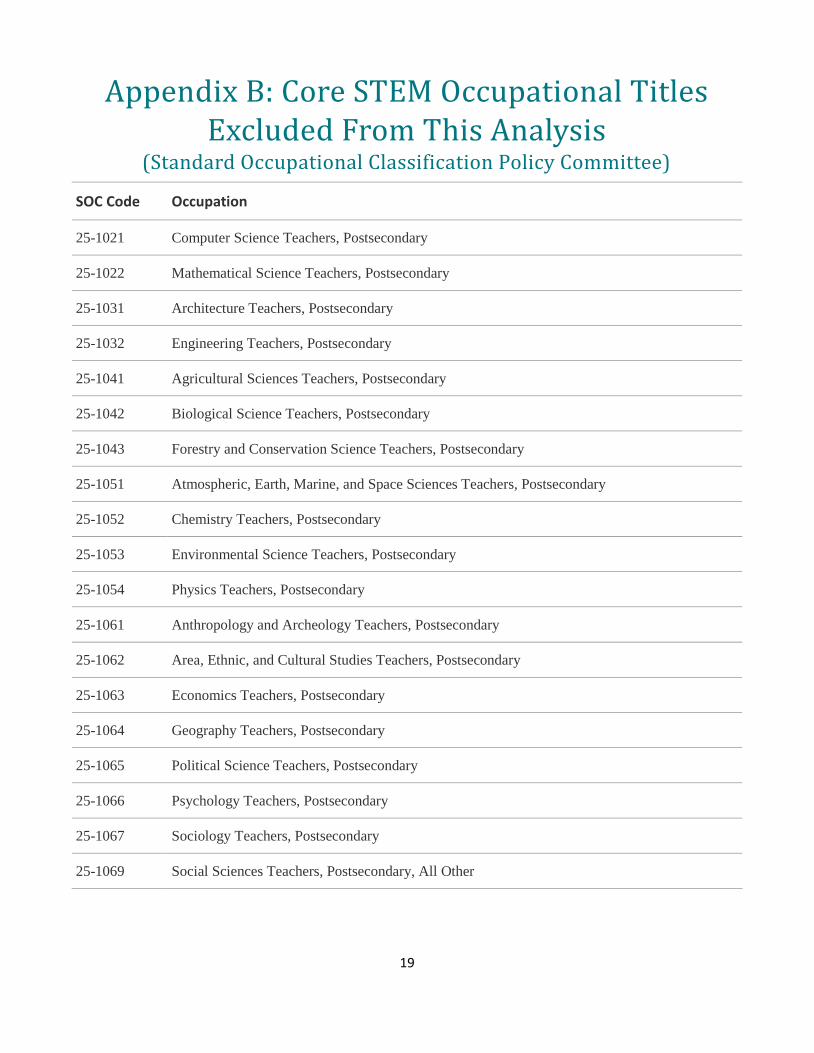
recommendations, used in this analysis. Due to data limitations, post-secondary teacher titles
(all with SOC code 25-10XX), which were originally on SOCPC’s core STEM list, were excluded
from our analysis; these titles are presented separately in Appendix B.
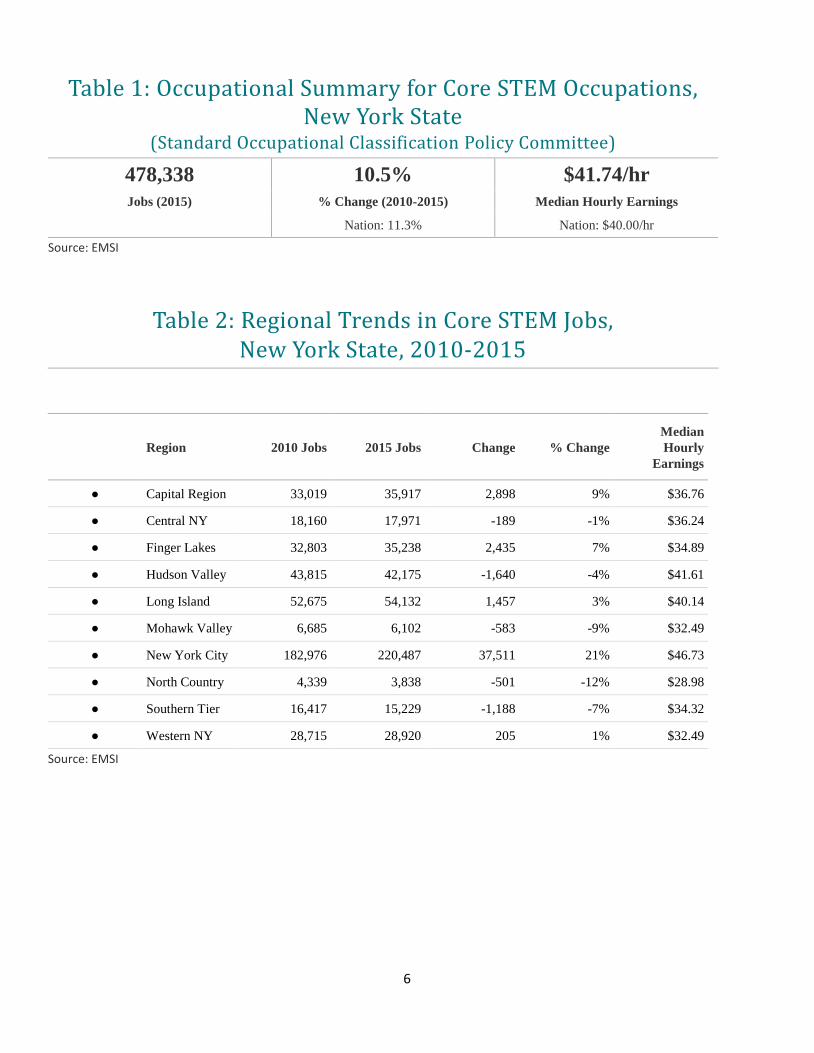
Regional Trends in Core STEM Employment In New York State, between 2010 and 2015, employment in core STEM job titles grew by 10.5%,
or 45,444, to 478,338 (see Table 1). Over the same time period, the nation’s core STEM job
count grew by 11.3%.
Growth in core STEM employment was concentrated in certain regions of the state (see Table
2). From 2010 to 2015, growth in STEM employment was strongest in these regions:
New York City (+21.0%)
Capital Region (+9.0%)
Finger Lakes (+7.0%)
Long Island (+3.0%)
Western New York (+1.0%)
Meanwhile, these labor market regions experienced declines in their STEM employment levels
over the 2010 to 2015 period:
North Country (-12.0%)
Mohawk Valley (-9.0%)
Southern Tier (-7.0%)
Hudson Valley (-4.0%)
Central New York (-1.0%)
3
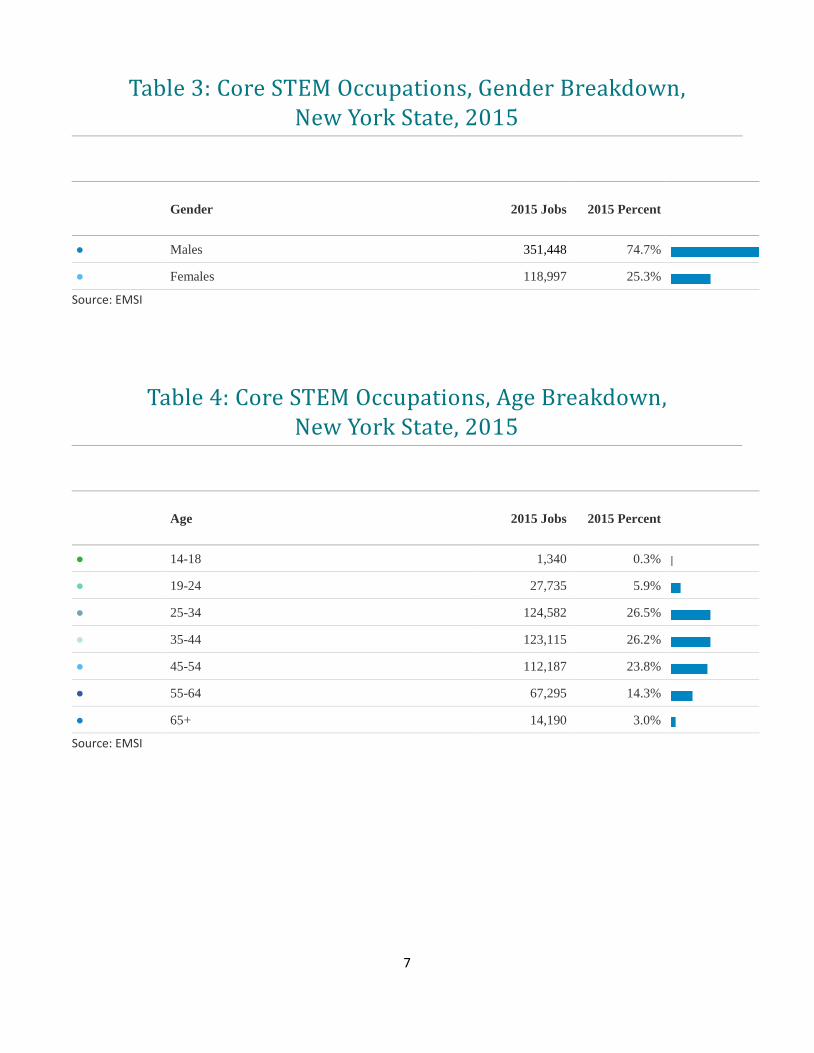
The Core STEM Workforce in New York State Additional demographic information regarding the core STEM workforce in New York State is
presented in Tables 3, 4 and 5. As shown in Table 3, almost 75% of workers in core STEM jobs
are male.
Table 4 provides information on the age breakdown of the STEM workforce. The 25-34 age
group is the largest with 124,582 workers. This translates into just over one-quarter (26.5%) of
all STEM workers in the state. The second largest category is the 35-44 age group, which had
123,115 workers, accounting for 26.2% of the statewide STEM workforce. In third place is the
45-54 age group with 112,187 workers, or 23.8% of STEM workers in New York State. These
three age categories together account for more than three-quarters of all core STEM jobs in the
state.
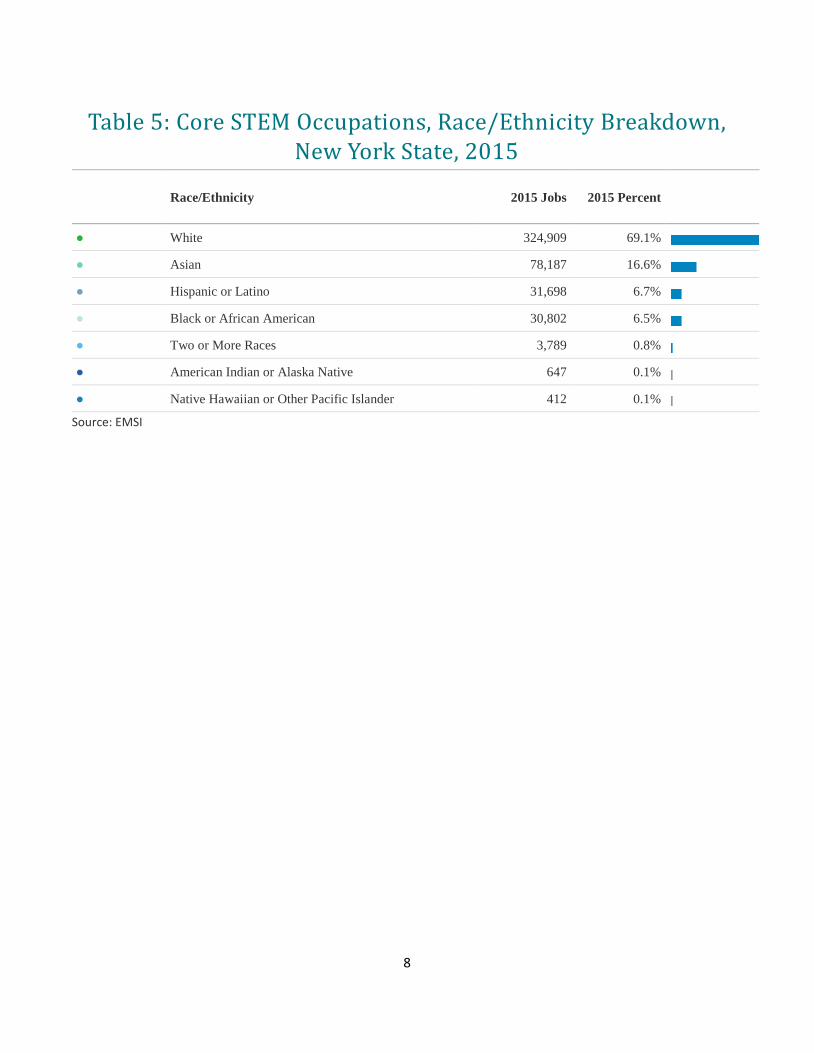
Table 5 shows the racial and ethnic breakdown of workers in New York State’s core STEM
occupations in 2015. Groups accounting for at least 5% of the STEM workforce and their overall
share of STEM workers in New York State in 2015 include:
White (69.1%)
Asian (16.6%)
Hispanic or Latino (6.7%)
Black or African American (6.5%)
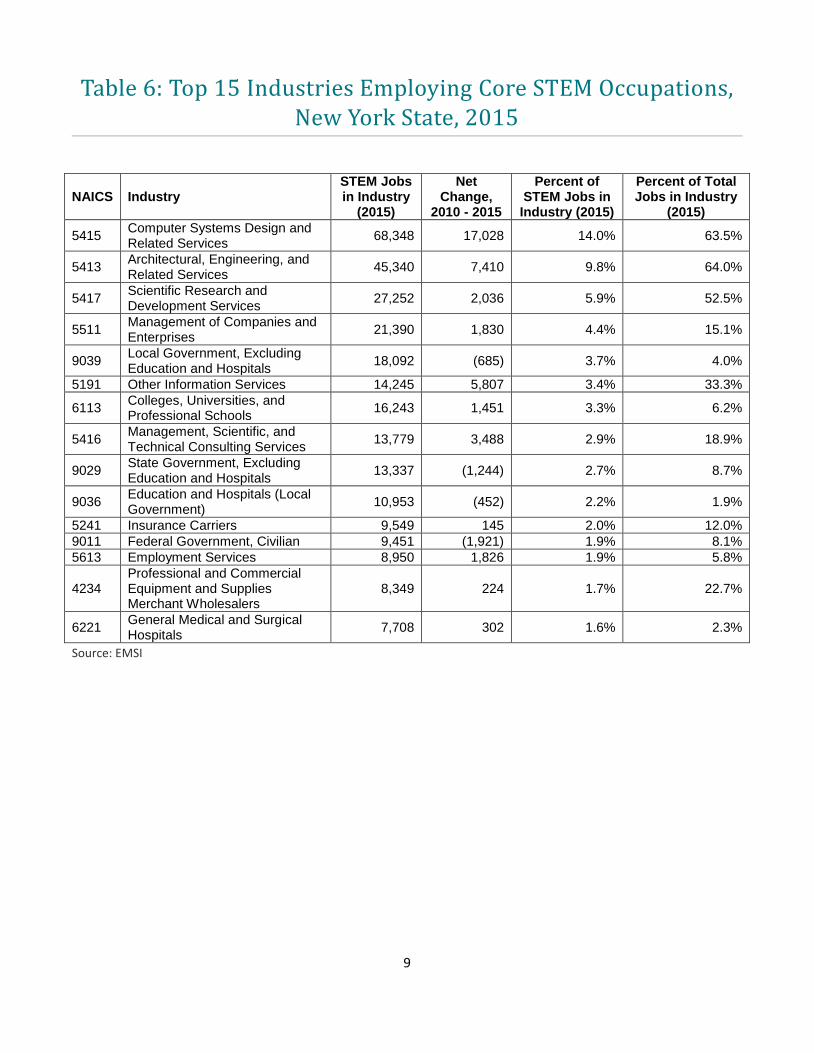
Industries with the Most Core STEM Employment Table 6 shows the 15 statewide industries with the most core STEM jobs in 2015. These STEM
jobs are relatively concentrated as the five largest industries had a combined employment base
of 180,422 in 2015, accounting for almost 40% of overall core STEM employment in New York
State. The five statewide industries with the largest number of core STEM jobs in 2015 include:
Computer system design and related services (68,348)
Architectural, engineering and related services (45,340)
Scientific research and development services (27,252)
Management of companies and enterprises (21,390)
Local government, excluding education and hospitals (18,092)
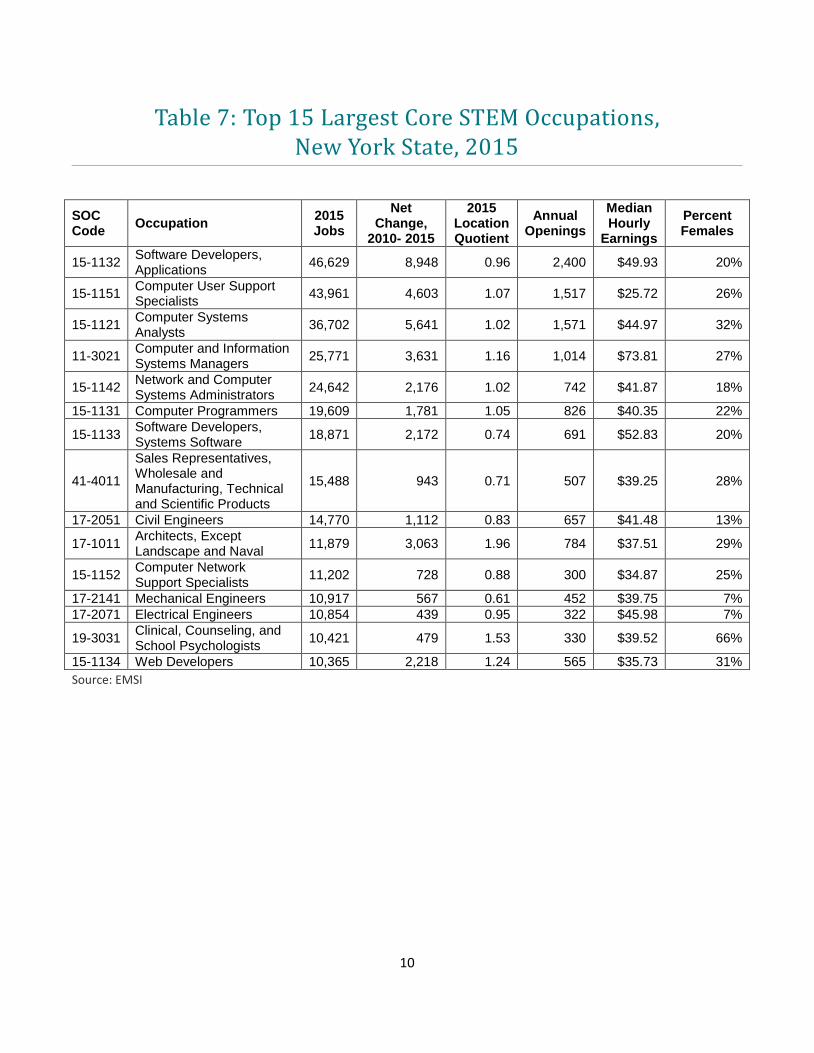
Occupations with the Most Core STEM Employment Table 7 shows the 15 core STEM job titles with the most employment in New York State in
2015. This set of largest STEM occupations, which is primarily focused in computer
science-related titles, had combined employment of just over 312,000, or about 65% of core
4
STEM jobs in New York State. All 15 of these largest STEM occupations grew between 2010 and
2015. Combined, they grew by 38,500 jobs, accounting for more than four out of every five jobs
added in the core STEM field over this time period.
Among the top 15 STEM occupational titles, software developers (applications) with an
employment count of 46,629 in 2015 is the single largest one. Moreover, this job title had the
most annual openings (2,400) of any STEM occupation in the state. Women are very much
underrepresented in this occupation, accounting for just 20% of those employed.
The 15 largest STEM job titles have a wide salary range. At the low end, computer user support
specialists have a median hourly wage of $25.72. At the high end, computer and information
systems managers have a median hourly wage of $73.81. Outside of computer user support
specialists, which typically only require a vocational certificate and some college experience for
job entry, most of the rest of the occupations in the top 15 group require at least a bachelor’s
degree.
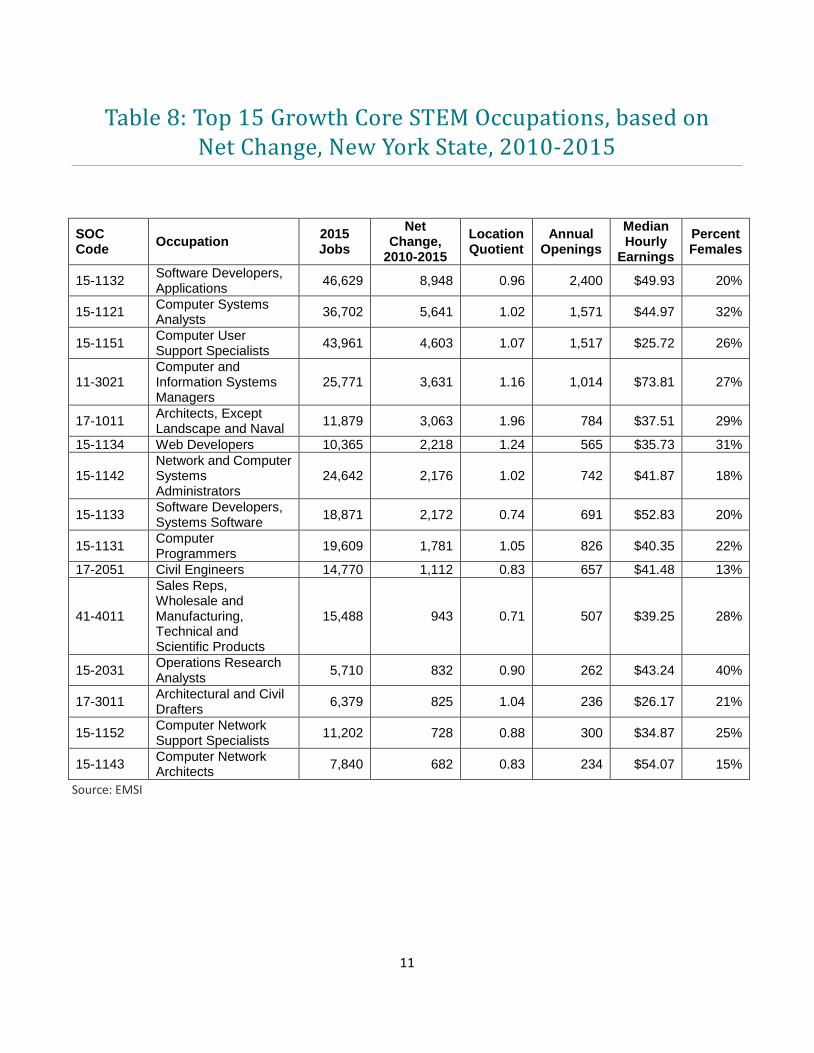
Core STEM Occupations with the Most Net Job Growth, 2010-2015 Table 8 shows the 15 core STEM job titles with the most employment growth between 2010
and 2015. Computer science-related titles dominate this list, accounting for 10 of the top 15
spots.
What’s also interesting is that STEM job growth over the past five years is concentrated in
relatively few job titles. Of the 39,355 jobs added in 2010-2015 by occupations on the top 15
list, almost half (19,192) are accounted for by just the top three growing occupations, all of
which are computer related: software developers (applications), computer systems analysts
and computer user support specialists.
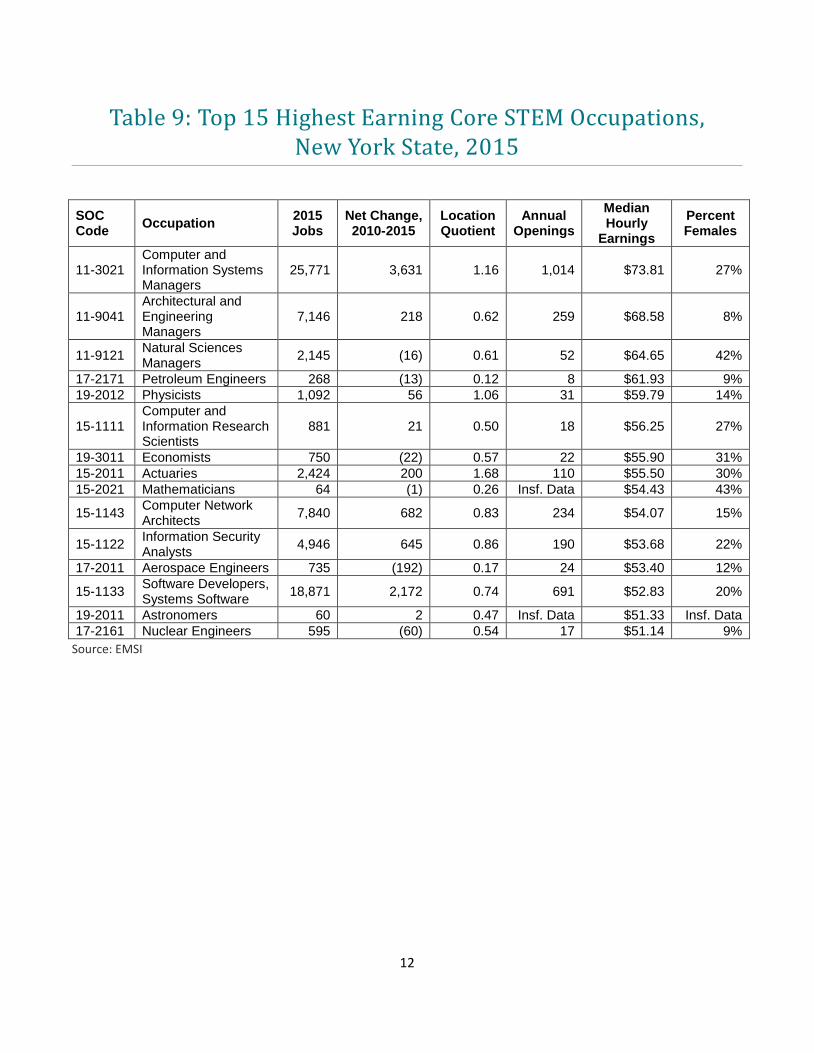
Core STEM Occupations with the Highest Salaries Table 9 presents information on the 15 core STEM job titles with the highest median salaries in
2015. As expected, the occupations at the very top of the list are all manager titles. The three
core STEM occupations with the highest median salaries in 2015 include:
Computer and information systems managers (median hourly salary of $73.81)
Architectural and engineering managers ($68.58)
Natural sciences managers ($64.65)
Also of note is the fact that many of these highest paying core STEM occupations have relatively
low employment levels. Among the 15 best-paying job titles, seven have overall employment of
less than 1,000, including three with job counts of less than 300.
5
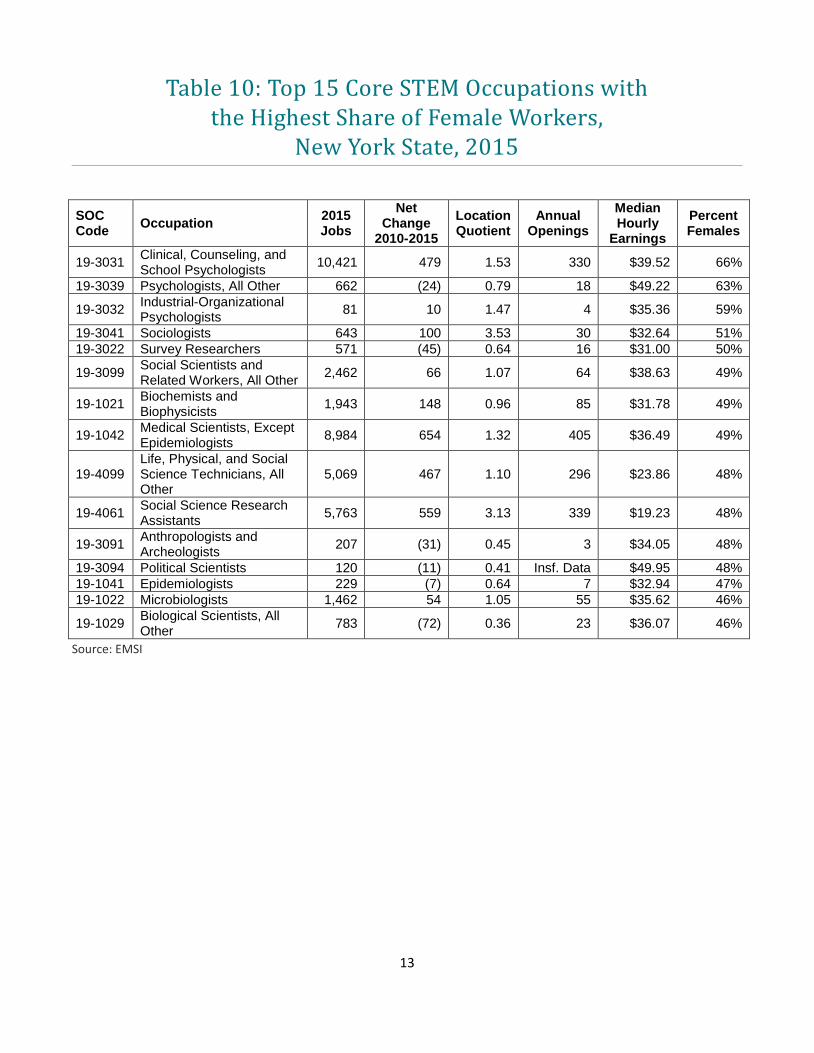
STEM Occupations with the Highest Share of Female Workers Table 10 presents information on the 15 core STEM job titles with the highest share of female
workers. The top 15 STEM occupations with the largest concentration of female employees are
all in the life, physical and social science fields (i.e., SOC codes with prefix 19).
Looking at individual occupational titles, clinical, counseling and school psychologist has the
largest percentage (66%) of employees that are women. In fact, all job titles rounding out the
top 5 list are social science occupations including:
Psychologists, all other (63%)
Industrial- organizational psychologists (59%)
Sociologists (51%)
Survey researchers (50%)
As was the case with the list of highest paying core STEM occupations, many of the job titles
with the highest share of female workers have relatively low employment levels. Among the 15
best-paying job titles, eight have overall employment of less than 1,000, including four with job
counts of less than 300.
Summary STEM job titles represent the future of the economy and where many of the jobs of tomorrow
will be. This report offers a rich set of labor market statistics that are specific to New York State
and its 10 labor market regions. We hope this information will be useful to students, job
seekers and others interested in the current and future outlook for STEM jobs.
For Further Information
Questions regarding this report should be directed to Kevin Jack, Statewide Labor Market
Analyst. He can be reached via email at [email protected] or by phone at (518)
457-3800.
6
Table 1: Occupational Summary for Core STEM Occupations, New York State
(Standard Occupational Classification Policy Committee)
478,338 10.5% $41.74/hr
Jobs (2015) % Change (2010-2015) Median Hourly Earnings
Nation: 11.3% Nation: $40.00/hr
Source: EMSI
Table 2: Regional Trends in Core STEM Jobs, New York State, 2010-2015
Region 2010 Jobs 2015 Jobs Change % Change Median
Hourly
Earnings
● Capital Region 33,019 35,917 2,898 9% $36.76
● Central NY 18,160 17,971 -189 -1% $36.24
● Finger Lakes 32,803 35,238 2,435 7% $34.89
● Hudson Valley 43,815 42,175 -1,640 -4% $41.61
● Long Island 52,675 54,132 1,457 3% $40.14
● Mohawk Valley 6,685 6,102 -583 -9% $32.49
● New York City 182,976 220,487 37,511 21% $46.73
● North Country 4,339 3,838 -501 -12% $28.98
● Southern Tier 16,417 15,229 -1,188 -7% $34.32
● Western NY 28,715 28,920 205 1% $32.49
Source: EMSI
7
Table 3: Core STEM Occupations, Gender Breakdown, New York State, 2015
Gender 2015 Jobs 2015 Percent
● Males 351,448 74.7%
● Females 118,997 25.3%
Source: EMSI
Table 4: Core STEM Occupations, Age Breakdown, New York State, 2015
Age 2015 Jobs 2015 Percent
● 14-18 1,340 0.3%
● 19-24 27,735 5.9%
● 25-34 124,582 26.5%
● 35-44 123,115 26.2%
● 45-54 112,187 23.8%
● 55-64 67,295 14.3%
● 65+ 14,190 3.0%
Source: EMSI
8
Table 5: Core STEM Occupations, Race/Ethnicity Breakdown, New York State, 2015
Race/Ethnicity 2015 Jobs 2015 Percent
● White 324,909 69.1%
● Asian 78,187 16.6%
● Hispanic or Latino 31,698 6.7%
● Black or African American 30,802 6.5%
● Two or More Races 3,789 0.8%
● American Indian or Alaska Native 647 0.1%
● Native Hawaiian or Other Pacific Islander 412 0.1%
Source: EMSI
9
Table 6: Top 15 Industries Employing Core STEM Occupations, New York State, 2015
NAICS Industry STEM Jobs in Industry
(2015)
Net Change,
2010 - 2015
Percent of STEM Jobs in Industry (2015)
Percent of Total Jobs in Industry
(2015)
5415 Computer Systems Design and Related Services
68,348 17,028 14.0% 63.5%
5413 Architectural, Engineering, and Related Services
45,340 7,410 9.8% 64.0%
5417 Scientific Research and Development Services
27,252 2,036 5.9% 52.5%
5511 Management of Companies and Enterprises
21,390 1,830 4.4% 15.1%
9039 Local Government, Excluding Education and Hospitals
18,092 (685) 3.7% 4.0%
5191 Other Information Services 14,245 5,807 3.4% 33.3%
6113 Colleges, Universities, and Professional Schools
16,243 1,451 3.3% 6.2%
5416 Management, Scientific, and Technical Consulting Services
13,779 3,488 2.9% 18.9%
9029 State Government, Excluding Education and Hospitals
13,337 (1,244) 2.7% 8.7%
9036 Education and Hospitals (Local Government)
10,953 (452) 2.2% 1.9%
5241 Insurance Carriers 9,549 145 2.0% 12.0%
9011 Federal Government, Civilian 9,451 (1,921) 1.9% 8.1%
5613 Employment Services 8,950 1,826 1.9% 5.8%
4234 Professional and Commercial Equipment and Supplies Merchant Wholesalers
8,349 224 1.7% 22.7%
6221 General Medical and Surgical Hospitals
7,708 302 1.6% 2.3%
Source: EMSI
10
Table 7: Top 15 Largest Core STEM Occupations,
New York State, 2015
SOC Code
Occupation 2015 Jobs
Net Change,
2010- 2015
2015 Location Quotient
Annual Openings
Median Hourly
Earnings
Percent Females
15-1132 Software Developers, Applications
46,629 8,948 0.96 2,400 $49.93 20%
15-1151 Computer User Support Specialists
43,961 4,603 1.07 1,517 $25.72 26%
15-1121 Computer Systems Analysts
36,702 5,641 1.02 1,571 $44.97 32%
11-3021 Computer and Information Systems Managers
25,771 3,631 1.16 1,014 $73.81 27%
15-1142 Network and Computer Systems Administrators
24,642 2,176 1.02 742 $41.87 18%
15-1131 Computer Programmers 19,609 1,781 1.05 826 $40.35 22%
15-1133 Software Developers, Systems Software
18,871 2,172 0.74 691 $52.83 20%
41-4011
Sales Representatives, Wholesale and Manufacturing, Technical and Scientific Products
15,488 943 0.71 507 $39.25 28%
17-2051 Civil Engineers 14,770 1,112 0.83 657 $41.48 13%
17-1011 Architects, Except Landscape and Naval
11,879 3,063 1.96 784 $37.51 29%
15-1152 Computer Network Support Specialists
11,202 728 0.88 300 $34.87 25%
17-2141 Mechanical Engineers 10,917 567 0.61 452 $39.75 7%
17-2071 Electrical Engineers 10,854 439 0.95 322 $45.98 7%
19-3031 Clinical, Counseling, and School Psychologists
10,421 479 1.53 330 $39.52 66%
15-1134 Web Developers 10,365 2,218 1.24 565 $35.73 31%
Source: EMSI
11
Table 8: Top 15 Growth Core STEM Occupations, based on
Net Change, New York State, 2010-2015
SOC Code
Occupation 2015 Jobs
Net Change,
2010-2015
Location Quotient
Annual Openings
Median Hourly
Earnings
Percent Females
15-1132 Software Developers, Applications
46,629 8,948 0.96 2,400 $49.93 20%
15-1121 Computer Systems Analysts
36,702 5,641 1.02 1,571 $44.97 32%
15-1151 Computer User Support Specialists
43,961 4,603 1.07 1,517 $25.72 26%
11-3021 Computer and Information Systems Managers
25,771 3,631 1.16 1,014 $73.81 27%
17-1011 Architects, Except Landscape and Naval
11,879 3,063 1.96 784 $37.51 29%
15-1134 Web Developers 10,365 2,218 1.24 565 $35.73 31%
15-1142 Network and Computer Systems Administrators
24,642 2,176 1.02 742 $41.87 18%
15-1133 Software Developers, Systems Software
18,871 2,172 0.74 691 $52.83 20%
15-1131 Computer Programmers
19,609 1,781 1.05 826 $40.35 22%
17-2051 Civil Engineers 14,770 1,112 0.83 657 $41.48 13%
41-4011
Sales Reps, Wholesale and Manufacturing, Technical and Scientific Products
15,488 943 0.71 507 $39.25 28%
15-2031 Operations Research Analysts
5,710 832 0.90 262 $43.24 40%
17-3011 Architectural and Civil Drafters
6,379 825 1.04 236 $26.17 21%
15-1152 Computer Network Support Specialists
11,202 728 0.88 300 $34.87 25%
15-1143 Computer Network Architects
7,840 682 0.83 234 $54.07 15%
Source: EMSI
12
Table 9: Top 15 Highest Earning Core STEM Occupations,
New York State, 2015
SOC Code
Occupation 2015 Jobs
Net Change, 2010-2015
Location Quotient
Annual Openings
Median Hourly
Earnings
Percent Females
11-3021 Computer and Information Systems Managers
25,771 3,631 1.16 1,014 $73.81 27%
11-9041 Architectural and Engineering Managers
7,146 218 0.62 259 $68.58 8%
11-9121 Natural Sciences Managers
2,145 (16) 0.61 52 $64.65 42%
17-2171 Petroleum Engineers 268 (13) 0.12 8 $61.93 9%
19-2012 Physicists 1,092 56 1.06 31 $59.79 14%
15-1111 Computer and Information Research Scientists
881 21 0.50 18 $56.25 27%
19-3011 Economists 750 (22) 0.57 22 $55.90 31%
15-2011 Actuaries 2,424 200 1.68 110 $55.50 30%
15-2021 Mathematicians 64 (1) 0.26 Insf. Data $54.43 43%
15-1143 Computer Network Architects
7,840 682 0.83 234 $54.07 15%
15-1122 Information Security Analysts
4,946 645 0.86 190 $53.68 22%
17-2011 Aerospace Engineers 735 (192) 0.17 24 $53.40 12%
15-1133 Software Developers, Systems Software
18,871 2,172 0.74 691 $52.83 20%
19-2011 Astronomers 60 2 0.47 Insf. Data $51.33 Insf. Data
17-2161 Nuclear Engineers 595 (60) 0.54 17 $51.14 9%
Source: EMSI
13
Table 10: Top 15 Core STEM Occupations with the Highest Share of Female Workers,
New York State, 2015
SOC Code
Occupation 2015 Jobs
Net Change
2010-2015
Location Quotient
Annual Openings
Median Hourly
Earnings
Percent Females
19-3031 Clinical, Counseling, and School Psychologists
10,421 479 1.53 330 $39.52 66%
19-3039 Psychologists, All Other 662 (24) 0.79 18 $49.22 63%
19-3032 Industrial-Organizational Psychologists
81 10 1.47 4 $35.36 59%
19-3041 Sociologists 643 100 3.53 30 $32.64 51%
19-3022 Survey Researchers 571 (45) 0.64 16 $31.00 50%
19-3099 Social Scientists and Related Workers, All Other
2,462 66 1.07 64 $38.63 49%
19-1021 Biochemists and Biophysicists
1,943 148 0.96 85 $31.78 49%
19-1042 Medical Scientists, Except Epidemiologists
8,984 654 1.32 405 $36.49 49%
19-4099 Life, Physical, and Social Science Technicians, All Other
5,069 467 1.10 296 $23.86 48%
19-4061 Social Science Research Assistants
5,763 559 3.13 339 $19.23 48%
19-3091 Anthropologists and Archeologists
207 (31) 0.45 3 $34.05 48%
19-3094 Political Scientists 120 (11) 0.41 Insf. Data $49.95 48%
19-1041 Epidemiologists 229 (7) 0.64 7 $32.94 47%
19-1022 Microbiologists 1,462 54 1.05 55 $35.62 46%
19-1029 Biological Scientists, All Other
783 (72) 0.36 23 $36.07 46%
Source: EMSI
14
Appendix A: Core STEM Occupational Titles Used in This Analysis
(Standard Occupational Classification Policy Committee)
SOC Code Occupation
11-3021 Computer and Information Systems Managers
11-9041 Architectural and Engineering Managers
11-9121 Natural Sciences Managers
15-1111 Computer and Information Research Scientists
15-1121 Computer Systems Analysts
15-1122 Information Security Analysts
15-1131 Computer Programmers
15-1132 Software Developers, Applications
15-1133 Software Developers, Systems Software
15-1134 Web Developers
15-1141 Database Administrators
15-1142 Network and Computer Systems Administrators
15-1143 Computer Network Architects
15-1151 Computer User Support Specialists
15-1152 Computer Network Support Specialists
15-1199 Computer Occupations, All Other
15-2011 Actuaries
15-2021 Mathematicians
15-2031 Operations Research Analysts
15-2041 Statisticians
15
15-2091 Mathematical Technicians
15-2099 Mathematical Science Occupations, All Other
17-1011 Architects, Except Landscape and Naval
17-1012 Landscape Architects
17-1021 Cartographers and Photogrammetrists
17-1022 Surveyors
17-2011 Aerospace Engineers
17-2021 Agricultural Engineers
17-2031 Biomedical Engineers
17-2041 Chemical Engineers
17-2051 Civil Engineers
17-2061 Computer Hardware Engineers
17-2071 Electrical Engineers
17-2072 Electronics Engineers, Except Computer
17-2081 Environmental Engineers
17-2111 Health and Safety Engineers, Except Mining Safety Engineers and Inspectors
17-2112 Industrial Engineers
17-2121 Marine Engineers and Naval Architects
17-2131 Materials Engineers
17-2141 Mechanical Engineers
17-2151 Mining and Geological Engineers, Including Mining Safety Engineers
17-2161 Nuclear Engineers
17-2171 Petroleum Engineers
17-2199 Engineers, All Other
17-3011 Architectural and Civil Drafters
16
17-3012 Electrical and Electronics Drafters
17-3013 Mechanical Drafters
17-3019 Drafters, All Other
17-3021 Aerospace Engineering and Operations Technicians
17-3022 Civil Engineering Technicians
17-3023 Electrical and Electronics Engineering Technicians
17-3024 Electro-Mechanical Technicians
17-3025 Environmental Engineering Technicians
17-3026 Industrial Engineering Technicians
17-3027 Mechanical Engineering Technicians
17-3029 Engineering Technicians, Except Drafters, All Other
17-3031 Surveying and Mapping Technicians
19-1011 Animal Scientists
19-1012 Food Scientists and Technologists
19-1013 Soil and Plant Scientists
19-1021 Biochemists and Biophysicists
19-1022 Microbiologists
19-1023 Zoologists and Wildlife Biologists
19-1029 Biological Scientists, All Other
19-1031 Conservation Scientists
19-1032 Foresters
19-1041 Epidemiologists
19-1042 Medical Scientists, Except Epidemiologists
19-1099 Life Scientists, All Other
19-2011 Astronomers
17
19-2012 Physicists
19-2021 Atmospheric and Space Scientists
19-2031 Chemists
19-2032 Materials Scientists
19-2041 Environmental Scientists and Specialists, Including Health
19-2042 Geoscientists, Except Hydrologists and Geographers
19-2043 Hydrologists
19-2099 Physical Scientists, All Other
19-3011 Economists
19-3022 Survey Researchers
19-3031 Clinical, Counseling, and School Psychologists
19-3032 Industrial-Organizational Psychologists
19-3039 Psychologists, All Other
19-3041 Sociologists
19-3051 Urban and Regional Planners
19-3091 Anthropologists and Archeologists
19-3092 Geographers
19-3094 Political Scientists
19-3099 Social Scientists and Related Workers, All Other
19-4011 Agricultural and Food Science Technicians
19-4021 Biological Technicians
19-4031 Chemical Technicians
19-4041 Geological and Petroleum Technicians
19-4051 Nuclear Technicians
19-4061 Social Science Research Assistants
18
19-4091 Environmental Science and Protection Technicians, Including Health
19-4092 Forensic Science Technicians
19-4093 Forest and Conservation Technicians
19-4099 Life, Physical, and Social Science Technicians, All Other
41-4011 Sales Representatives, Wholesale and Manufacturing, Technical and Scientific Products
41-9031 Sales Engineers
19
Appendix B: Core STEM Occupational Titles Excluded From This Analysis
(Standard Occupational Classification Policy Committee)
SOC Code Occupation
25-1021 Computer Science Teachers, Postsecondary
25-1022 Mathematical Science Teachers, Postsecondary
25-1031 Architecture Teachers, Postsecondary
25-1032 Engineering Teachers, Postsecondary
25-1041 Agricultural Sciences Teachers, Postsecondary
25-1042 Biological Science Teachers, Postsecondary
25-1043 Forestry and Conservation Science Teachers, Postsecondary
25-1051 Atmospheric, Earth, Marine, and Space Sciences Teachers, Postsecondary
25-1052 Chemistry Teachers, Postsecondary
25-1053 Environmental Science Teachers, Postsecondary
25-1054 Physics Teachers, Postsecondary
25-1061 Anthropology and Archeology Teachers, Postsecondary
25-1062 Area, Ethnic, and Cultural Studies Teachers, Postsecondary
25-1063 Economics Teachers, Postsecondary
25-1064 Geography Teachers, Postsecondary
25-1065 Political Science Teachers, Postsecondary
25-1066 Psychology Teachers, Postsecondary
25-1067 Sociology Teachers, Postsecondary
25-1069 Social Sciences Teachers, Postsecondary, All Other
20
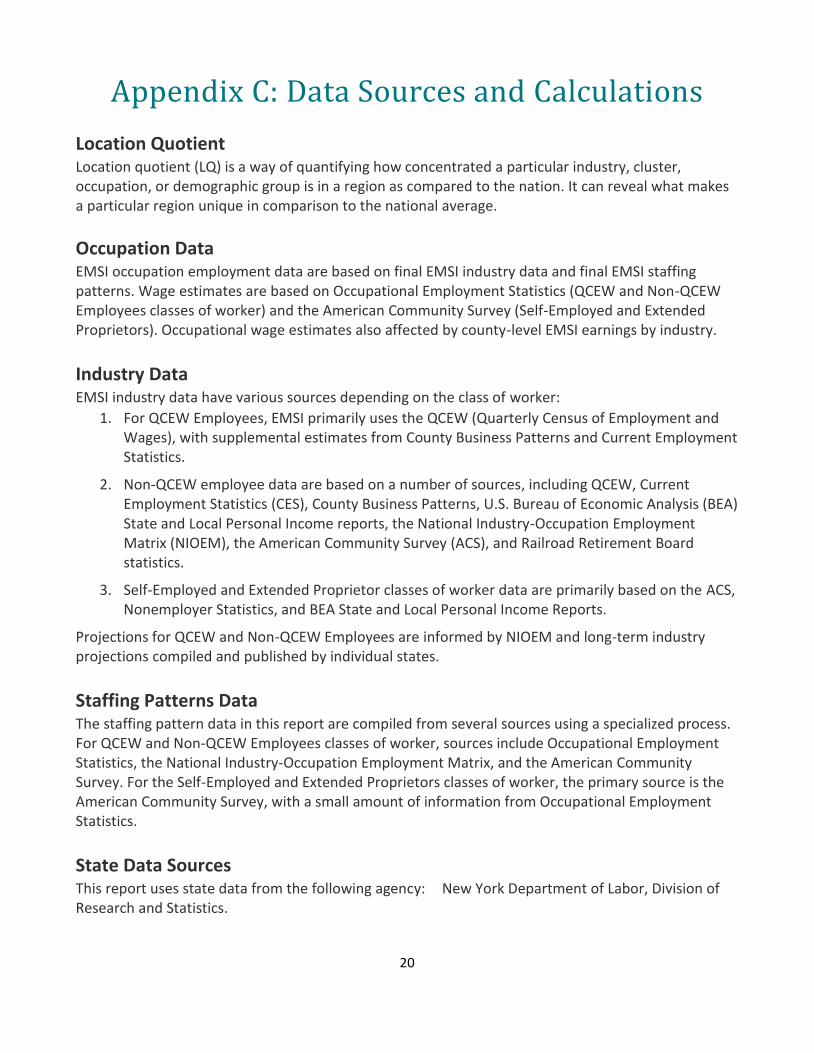
Appendix C: Data Sources and Calculations
Location Quotient
Location quotient (LQ) is a way of quantifying how concentrated a particular industry, cluster, occupation, or demographic group is in a region as compared to the nation. It can reveal what makes a particular region unique in comparison to the national average.
Occupation Data
EMSI occupation employment data are based on final EMSI industry data and final EMSI staffing patterns. Wage estimates are based on Occupational Employment Statistics (QCEW and Non-QCEW Employees classes of worker) and the American Community Survey (Self-Employed and Extended Proprietors). Occupational wage estimates also affected by county-level EMSI earnings by industry.
Industry Data
EMSI industry data have various sources depending on the class of worker:
1. For QCEW Employees, EMSI primarily uses the QCEW (Quarterly Census of Employment and Wages), with supplemental estimates from County Business Patterns and Current Employment Statistics.
2. Non-QCEW employee data are based on a number of sources, including QCEW, Current Employment Statistics (CES), County Business Patterns, U.S. Bureau of Economic Analysis (BEA) State and Local Personal Income reports, the National Industry-Occupation Employment Matrix (NIOEM), the American Community Survey (ACS), and Railroad Retirement Board statistics.
3. Self-Employed and Extended Proprietor classes of worker data are primarily based on the ACS, Nonemployer Statistics, and BEA State and Local Personal Income Reports.
Projections for QCEW and Non-QCEW Employees are informed by NIOEM and long-term industry projections compiled and published by individual states.
Staffing Patterns Data
The staffing pattern data in this report are compiled from several sources using a specialized process. For QCEW and Non-QCEW Employees classes of worker, sources include Occupational Employment Statistics, the National Industry-Occupation Employment Matrix, and the American Community Survey. For the Self-Employed and Extended Proprietors classes of worker, the primary source is the American Community Survey, with a small amount of information from Occupational Employment Statistics.
State Data Sources
This report uses state data from the following agency: New York Department of Labor, Division of Research and Statistics.
This workforce product was funded by a grant awarded by the U.S. Department of Labor's Employment and
Training Administration. The product was created by the recipient and does not necessarily reflect the official
position of the U.S. Department of Labor. The Department of Labor makes no guarantees, warranties, or
assurances of any kind, express or implied, with respect to such information, including any information on
linked sites and including, but not limited to, accuracy of the information or its completeness, timeliness,
usefulness, adequacy, continued availability, or ownership. This product is copyrighted by the institution that
created it. Internal use by an organization and/or personal use by an individual for non-commercial purposes
is permissible. All other uses require the prior authorization of the copyright owner.
A Division of the Department of Labor
The New York State Department of Labor is an Equal Opportunity Employer/Program. Auxiliary aids and services are available upon request to individuals with disabilities.