Embed Size (px)
Citation preview
Steppe Capitalist Equity Research:
APU JSC (MSE: APU)
8 January 2018, www.steppecapitalist.com
HOLD Rating with Target Price of MNT 866
We are initiating coverage of APU JSC (APU or the Company) a
Mongolian Stock Exchange listed alcohol and beverage producer with a
HOLD rating and 12 month target price of MNT 866.
Merger with Heineken (the Merger): APU is closing a merger
transaction with Heineken’s business in Mongolia (Evergreen Investment
LLC or Evergreen) publically announced in July 2017 and effectively
becoming a near monopoly player with more than 80% share of the
local alcoholic beverage market. The transaction will mark as the largest
merger in the country.
Immediate value drivers: (i) the Merger expected to create over MNT
13bn cost synergies in 2018-2021; (ii) a vertical integration with the
trading business (APU Trading LLC), taking place as part of the Merger is
an important value driver for APU public shareholders. It results in
immediate 10 percentage point increase in gross margins previously only
captured by the shareholders of APU Trading (Shunkhlai Group).
Longer term value driver: Having secured a dominant position in the
local market APU is strategically focusing on growth through
exports, as the market for alcoholic beverages in Mongolia (the largest
EBITDA generator) has limited growth potential.
Having Heineken as a strategic shareholder will help APU to achieve the
immediate and long-term strategic targets through the use of Heineken’s
international supply chain network and marketing expertise.
As a result of the consolidation in 2017, APU expects to see 65% jump in
revenue to MNT 492bn, 10 percentage point increase in gross margins to
39% and an EPS of MNT 68.
We conclude that the market has largely priced in the value gain from the
Merger as the share price surged 99% since the announcement.
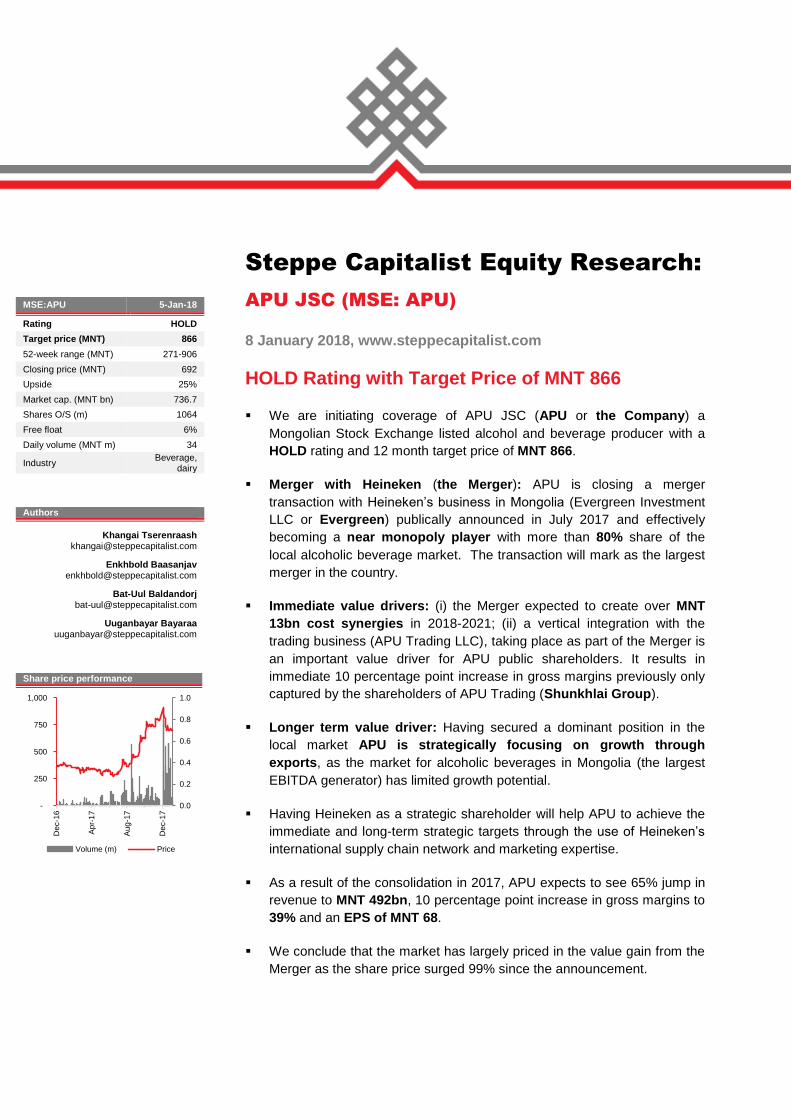
MSE:APU 5-Jan-18
Rating HOLD
Target price (MNT) 866
52-week range (MNT) 271-906
Closing price (MNT) 692
Upside 25%
Market cap. (MNT bn) 736.7
Shares O/S (m) 1064
Free float 6%
Daily volume (MNT m) 34
Industry Beverage,
dairy
Authors
Khangai Tserenraash [email protected]
Enkhbold Baasanjav [email protected]
Bat-Uul Baldandorj [email protected]
Uuganbayar Bayaraa [email protected]
Share price performance
0.0
0.2
0.4
0.6
0.8
1.0
-
250
500
750
1,000
Dec-1
6
Ap
r-1
7
Au
g-1
7
Dec-1
7
Volume (m) Price
TABLE OF CONTENTS
HOLD Rating with Target Price of MNT 866 ................................................... 0
TABLE OF CONTENTS ..................................................................................... 0
COMPANY OVERVIEW ..................................................................................... 1
Market leader with well-established operations .............................................. 1
Vertically integrated operations ....................................................................... 1
Corporate Governance .................................................................................... 2
INDUSTRY OVERVIEW ..................................................................................... 3
Vodka market – sluggish growth ..................................................................... 3
Beer market – moderate growth ...................................................................... 4
Dairy market – high growth.............................................................................. 4
Soft drink – high growth outlook ...................................................................... 5
Export markets: Chinese market analysis ....................................................... 5
GROWTH STRATEGY AND MERGER ............................................................. 6
APU strategy: growth through international markets ....................................... 6
Transaction details .......................................................................................... 6
Key regulatory approvals received .................................................................. 7
FINANCIAL OUTLOOK ...................................................................................... 8
Earnings outlook .............................................................................................. 8
Cashflow outlook ............................................................................................. 9
Financial Summary ........................................................................................ 10
VALUATION ..................................................................................................... 11
Discounted cashflow valuation ...................................................................... 11
Comparable valuation .................................................................................... 11
Valuation summary – Target price ................................................................ 11
INVESTMENT RISKS ....................................................................................... 12
Meaningful sensitivity to margins and discount rate ...................................... 12
Risks to our target price ................................................................................. 12
IMPORTANT INFORMATION AND DISCLOSURES ...................................... 13
Shareholding in the subject company ........................................................... 13
Our ratings classifications .............................................................................. 13
Steppe Capitalist: Equity coverage report MSE:APU 8 Jan 2018
www.steppecapitalist.com 1
COMPANY OVERVIEW
Market leader with well-established operations
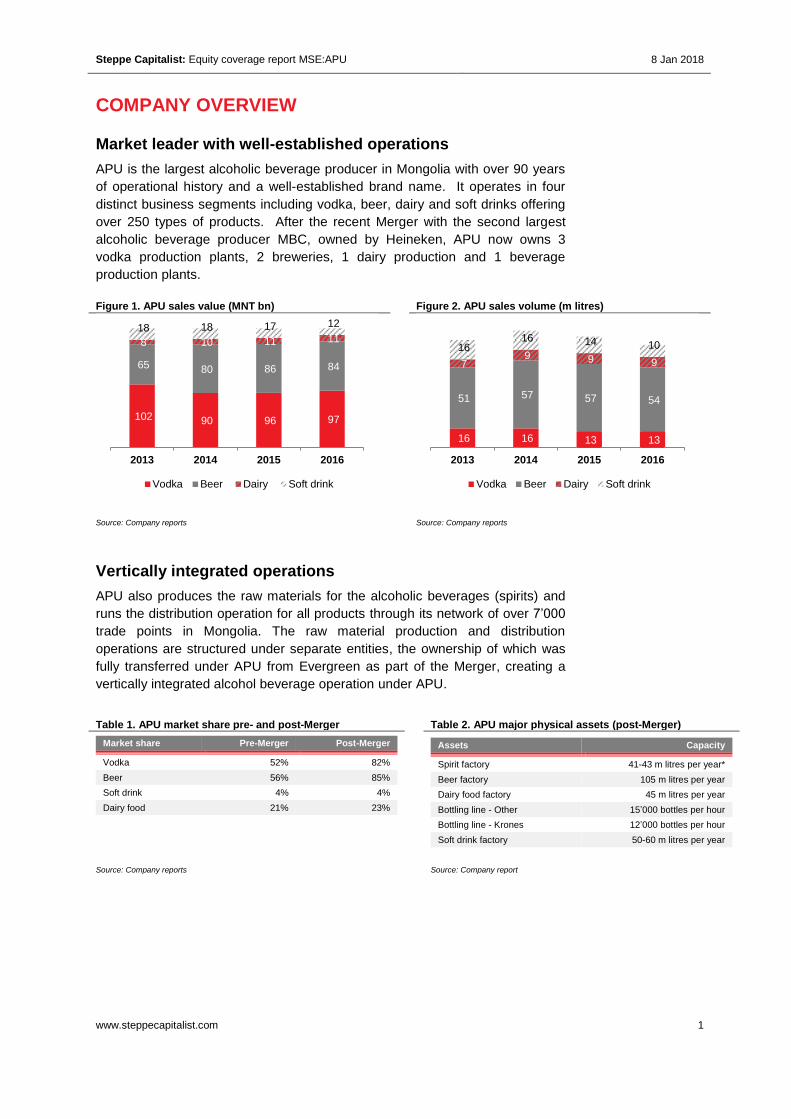
APU is the largest alcoholic beverage producer in Mongolia with over 90 years
of operational history and a well-established brand name. It operates in four
distinct business segments including vodka, beer, dairy and soft drinks offering
over 250 types of products. After the recent Merger with the second largest
alcoholic beverage producer MBC, owned by Heineken, APU now owns 3
vodka production plants, 2 breweries, 1 dairy production and 1 beverage
production plants.
Figure 1. APU sales value (MNT bn) Figure 2. APU sales volume (m litres)
Source: Company reports Source: Company reports
Vertically integrated operations
APU also produces the raw materials for the alcoholic beverages (spirits) and
runs the distribution operation for all products through its network of over 7’000
trade points in Mongolia. The raw material production and distribution
operations are structured under separate entities, the ownership of which was
fully transferred under APU from Evergreen as part of the Merger, creating a
vertically integrated alcohol beverage operation under APU.
Table 1. APU market share pre- and post-Merger Table 2. APU major physical assets (post-Merger)
Market share Pre-Merger Post-Merger
Vodka 52% 82%
Beer 56% 85%
Soft drink 4% 4%
Dairy food 21% 23%
Assets Capacity
Spirit factory 41-43 m litres per year*
Beer factory 105 m litres per year
Dairy food factory 45 m litres per year
Bottling line - Other 15’000 bottles per hour
Bottling line - Krones 12’000 bottles per hour
Soft drink factory 50-60 m litres per year
Source: Company reports Source: Company report
102 90 96 97
65 80 86 84
8 10 11 11 18 18 17 12
2013 2014 2015 2016
Vodka Beer Dairy Soft drink
16 16 13 13
51 57 57 54
7 9 9 9
16 16 14 10
2013 2014 2015 2016
Vodka Beer Dairy Soft drink
Steppe Capitalist: Equity coverage report MSE:APU 8 Jan 2018
www.steppecapitalist.com 2
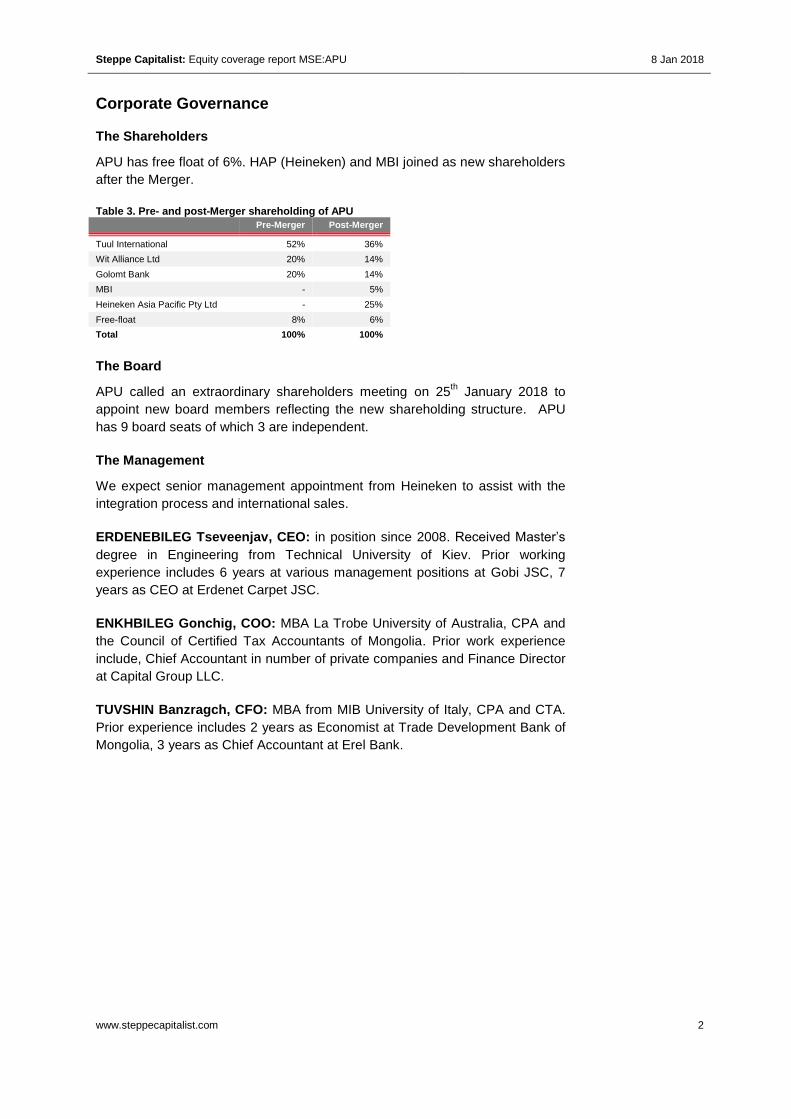
Corporate Governance
The Shareholders
APU has free float of 6%. HAP (Heineken) and MBI joined as new shareholders
after the Merger.
Table 3. Pre- and post-Merger shareholding of APU
Pre-Merger Post-Merger
Tuul International 52% 36%
Wit Alliance Ltd 20% 14%
Golomt Bank 20% 14%
MBI - 5%
Heineken Asia Pacific Pty Ltd - 25%
Free-float 8% 6%
Total 100% 100%
The Board
APU called an extraordinary shareholders meeting on 25th January 2018 to
appoint new board members reflecting the new shareholding structure. APU
has 9 board seats of which 3 are independent.
The Management
We expect senior management appointment from Heineken to assist with the
integration process and international sales.
ERDENEBILEG Tseveenjav, CEO: in position since 2008. Received Master’s
degree in Engineering from Technical University of Kiev. Prior working
experience includes 6 years at various management positions at Gobi JSC, 7
years as CEO at Erdenet Carpet JSC.
ENKHBILEG Gonchig, COO: MBA La Trobe University of Australia, CPA and
the Council of Certified Tax Accountants of Mongolia. Prior work experience
include, Chief Accountant in number of private companies and Finance Director
at Capital Group LLC.
TUVSHIN Banzragch, CFO: MBA from MIB University of Italy, CPA and CTA.
Prior experience includes 2 years as Economist at Trade Development Bank of
Mongolia, 3 years as Chief Accountant at Erel Bank.
Steppe Capitalist: Equity coverage report MSE:APU 8 Jan 2018
www.steppecapitalist.com 3
INDUSTRY OVERVIEW
The domestic alcoholic beverage market showed signs of maturity in the past 3
years with CAGR of negative 2% after a decade of high growth of 15% CAGR.
The industry growth expectations are therefore below the GDP growth outlook
of 5% CAGR. The dairy products and soft drink markets, on the other hand, are
still growing with a potential for double digit growth in the next 5 years (CAGR
of 10% for both segments). APU plans to offset the slow growth in the alcoholic
beverage market by exporting to neighbouring countries, our preliminary
analysis indicate that such move could potentially be very lucrative line of
business for APU.
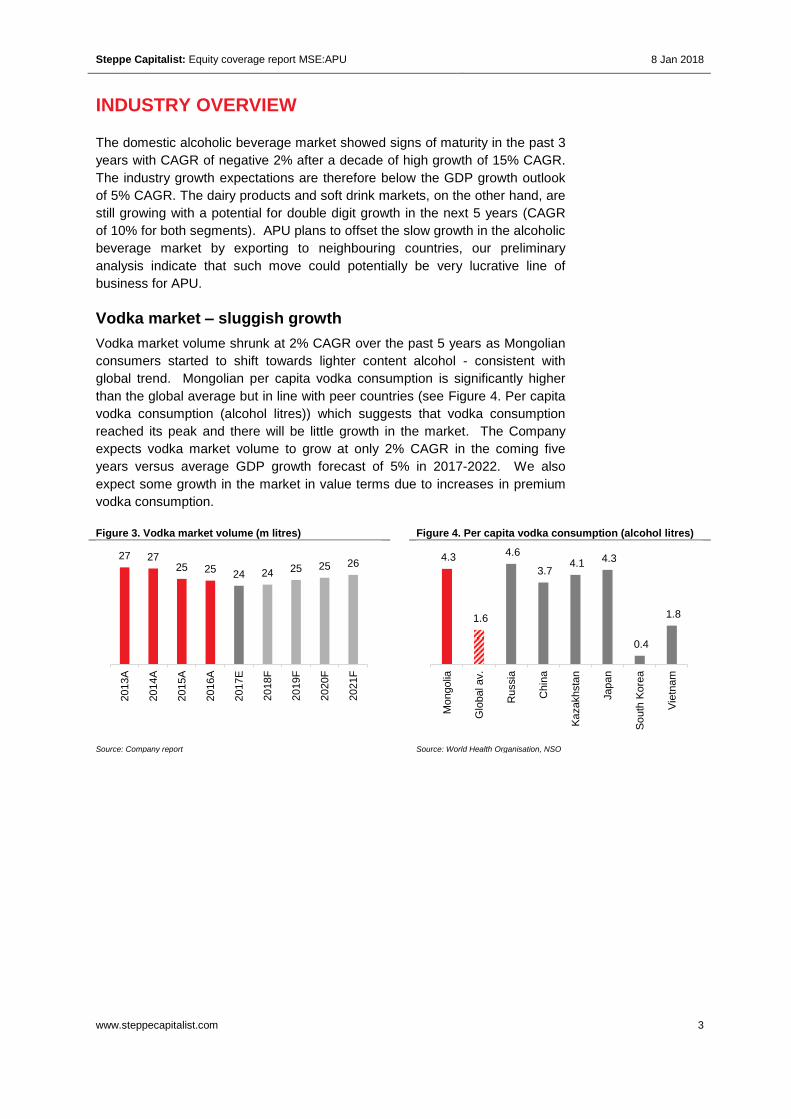
Vodka market – sluggish growth
Vodka market volume shrunk at 2% CAGR over the past 5 years as Mongolian
consumers started to shift towards lighter content alcohol - consistent with
global trend. Mongolian per capita vodka consumption is significantly higher
than the global average but in line with peer countries (see Figure 4. Per capita
vodka consumption (alcohol litres)) which suggests that vodka consumption
reached its peak and there will be little growth in the market. The Company
expects vodka market volume to grow at only 2% CAGR in the coming five
years versus average GDP growth forecast of 5% in 2017-2022. We also
expect some growth in the market in value terms due to increases in premium
vodka consumption.
Figure 3. Vodka market volume (m litres) Figure 4. Per capita vodka consumption (alcohol litres)
Source: Company report Source: World Health Organisation, NSO
27 27 25 25
24 24 25 25 26
2013A
2014A
2015A
2016A
2017E
2018F
2019F
2020F
2021F
4.3
1.6
4.6
3.7 4.1 4.3
0.4
1.8
Mo
ngolia
Glo
bal av.
Russia
Chin
a
Ka
zakhsta
n
Jap
an
So
uth
Kore
a
Vie
tnam
Steppe Capitalist: Equity coverage report MSE:APU 8 Jan 2018
www.steppecapitalist.com 4
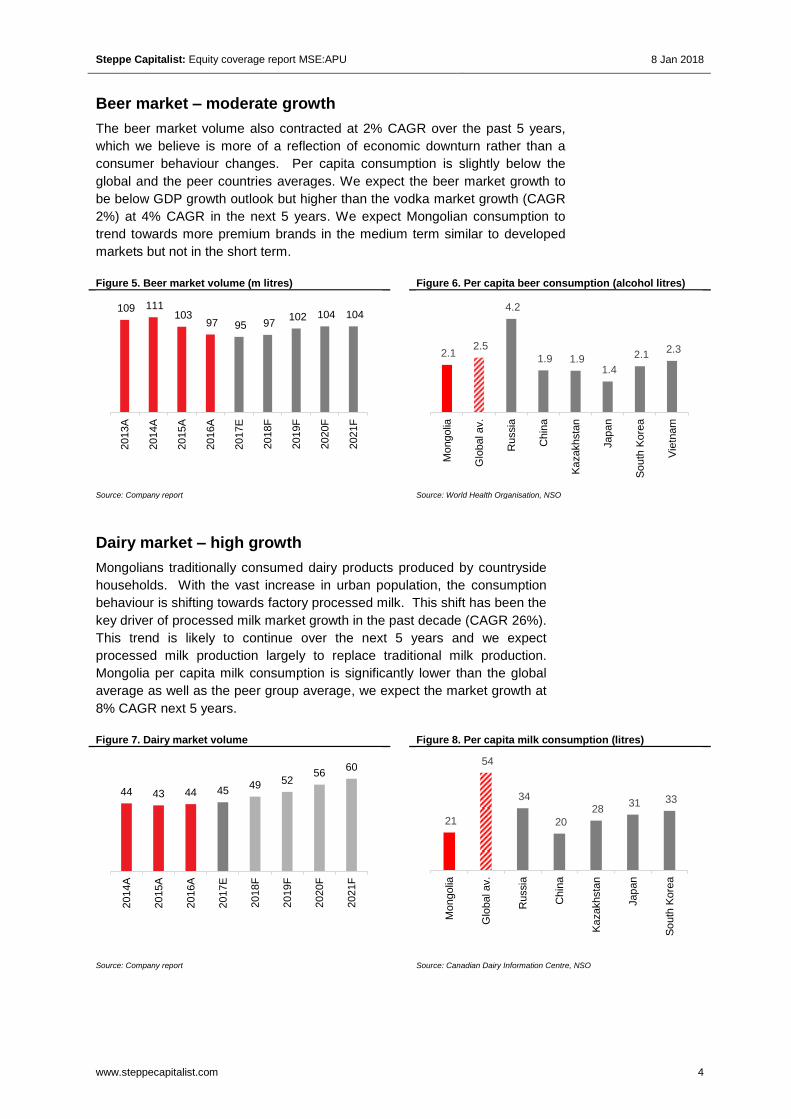
Beer market – moderate growth
The beer market volume also contracted at 2% CAGR over the past 5 years,
which we believe is more of a reflection of economic downturn rather than a
consumer behaviour changes. Per capita consumption is slightly below the
global and the peer countries averages. We expect the beer market growth to
be below GDP growth outlook but higher than the vodka market growth (CAGR
2%) at 4% CAGR in the next 5 years. We expect Mongolian consumption to
trend towards more premium brands in the medium term similar to developed
markets but not in the short term.
Figure 5. Beer market volume (m litres) Figure 6. Per capita beer consumption (alcohol litres)
Source: Company report Source: World Health Organisation, NSO
Dairy market – high growth
Mongolians traditionally consumed dairy products produced by countryside
households. With the vast increase in urban population, the consumption
behaviour is shifting towards factory processed milk. This shift has been the
key driver of processed milk market growth in the past decade (CAGR 26%).
This trend is likely to continue over the next 5 years and we expect
processed milk production largely to replace traditional milk production.
Mongolia per capita milk consumption is significantly lower than the global
average as well as the peer group average, we expect the market growth at
8% CAGR next 5 years.
Figure 7. Dairy market volume Figure 8. Per capita milk consumption (litres)
Source: Company report Source: Canadian Dairy Information Centre, NSO
109 111 103
97 95 97 102 104 104
2013A
2014A
2015A
2016A
2017E
2018F
2019F
2020F
2021F
2.1 2.5
4.2
1.9 1.9 1.4
2.1 2.3
Mo
ngolia
Glo
bal av.
Russia
Chin
a
Ka
zakhsta
n
Jap
an
So
uth
Kore
a
Vie
tnam
44 43 44 45 49 52
56 60
2014A
2015A
2016A
2017E
2018F
2019F
2020F
2021F
21
54
34
20
28 31 33
Mo
ngolia
Glo
bal av.
Russia
Chin
a
Ka
zakhsta
n
Jap
an
So
uth
Kore
a
Steppe Capitalist: Equity coverage report MSE:APU 8 Jan 2018
www.steppecapitalist.com 5
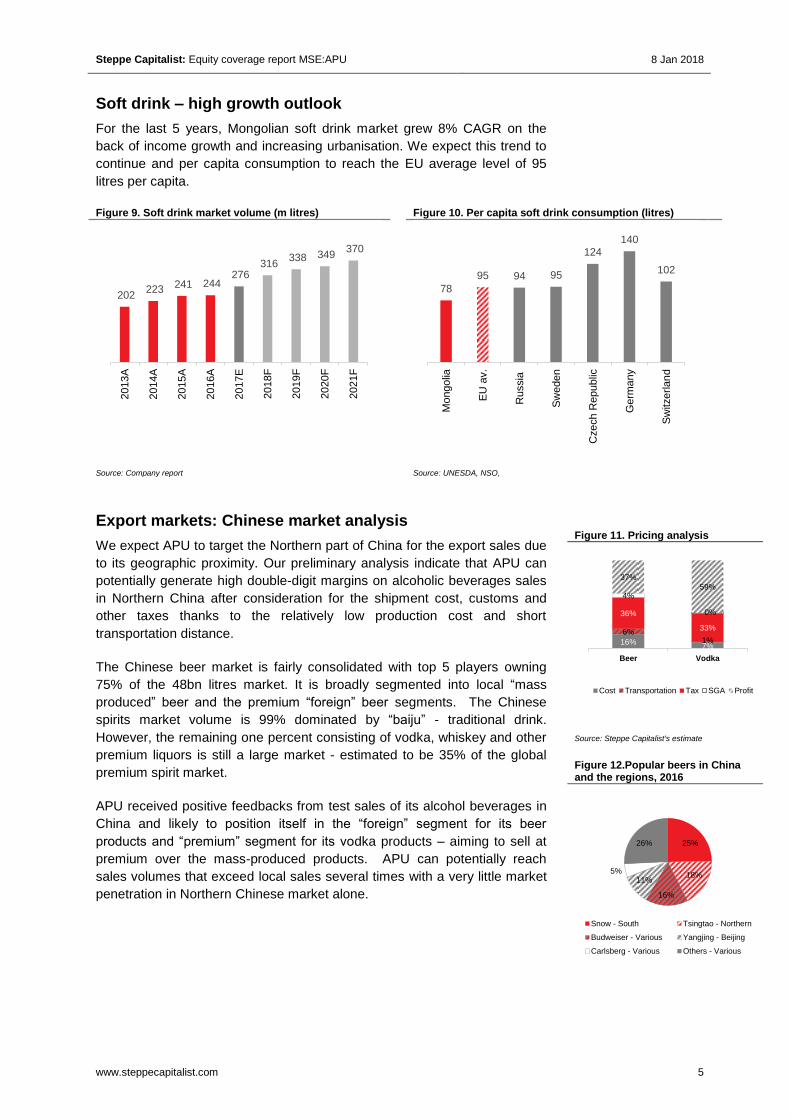
Soft drink – high growth outlook
For the last 5 years, Mongolian soft drink market grew 8% CAGR on the
back of income growth and increasing urbanisation. We expect this trend to
continue and per capita consumption to reach the EU average level of 95
litres per capita.
Figure 9. Soft drink market volume (m litres) Figure 10. Per capita soft drink consumption (litres)
Source: Company report Source: UNESDA, NSO,
Export markets: Chinese market analysis
We expect APU to target the Northern part of China for the export sales due
to its geographic proximity. Our preliminary analysis indicate that APU can
potentially generate high double-digit margins on alcoholic beverages sales
in Northern China after consideration for the shipment cost, customs and
other taxes thanks to the relatively low production cost and short
transportation distance.
The Chinese beer market is fairly consolidated with top 5 players owning
75% of the 48bn litres market. It is broadly segmented into local “mass
produced” beer and the premium “foreign” beer segments. The Chinese
spirits market volume is 99% dominated by “baiju” - traditional drink.
However, the remaining one percent consisting of vodka, whiskey and other
premium liquors is still a large market - estimated to be 35% of the global
premium spirit market.
APU received positive feedbacks from test sales of its alcohol beverages in
China and likely to position itself in the “foreign” segment for its beer
products and “premium” segment for its vodka products – aiming to sell at
premium over the mass-produced products. APU can potentially reach
sales volumes that exceed local sales several times with a very little market
penetration in Northern Chinese market alone.
202 223 241 244
276 316
338 349 370
2013A
2014A
2015A
2016A
2017E
2018F
2019F
2020F
2021F
78
95 94 95
124
140
102
Mo
ngolia
EU
av.
Russia
Sw
eden
Cze
ch R
epublic
Germ
any
Sw
itzerlan
d
Figure 11. Pricing analysis
Source: Steppe Capitalist's estimate
Figure 12.Popular beers in China and the regions, 2016
Source: Nikkei
16% 7%
6% 1%
36%
33%
4%
0%
37%
59%
Beer Vodka
Cost Transportation Tax SGA Profit
25%
18%
16%
11% 5%
26%
Snow - South Tsingtao - Northern
Budweiser - Various Yangjing - Beijing
Carlsberg - Various Others - Various
Steppe Capitalist: Equity coverage report MSE:APU 8 Jan 2018
www.steppecapitalist.com 6
GROWTH STRATEGY AND MERGER
APU strategy: growth through international markets
Having successfully positioned itself in the local market APU is now
strategically focusing on international markets. As the local alcoholic drink
market has limited growth prospects, international sales will be an important
part of the APU’s long term growth. This strategy is aligned with the
Heineken’s objective to increase its footprint in Asian market. APU’s
expertise in producing high quality vodka (World Vodka Award 2016) and its
geographic proximity to China combined with Heineken’s marketing
expertise can competitively position APU in Chinese market, in particular the
premium vodka and beer segments in the Northern region. The Company
estimates to generate MNT 25bn of additional EBITDA from export sales
from 2018 to 2021. Export sales will increase the current plant utilisation rate
(c.60%) and reduce production costs.
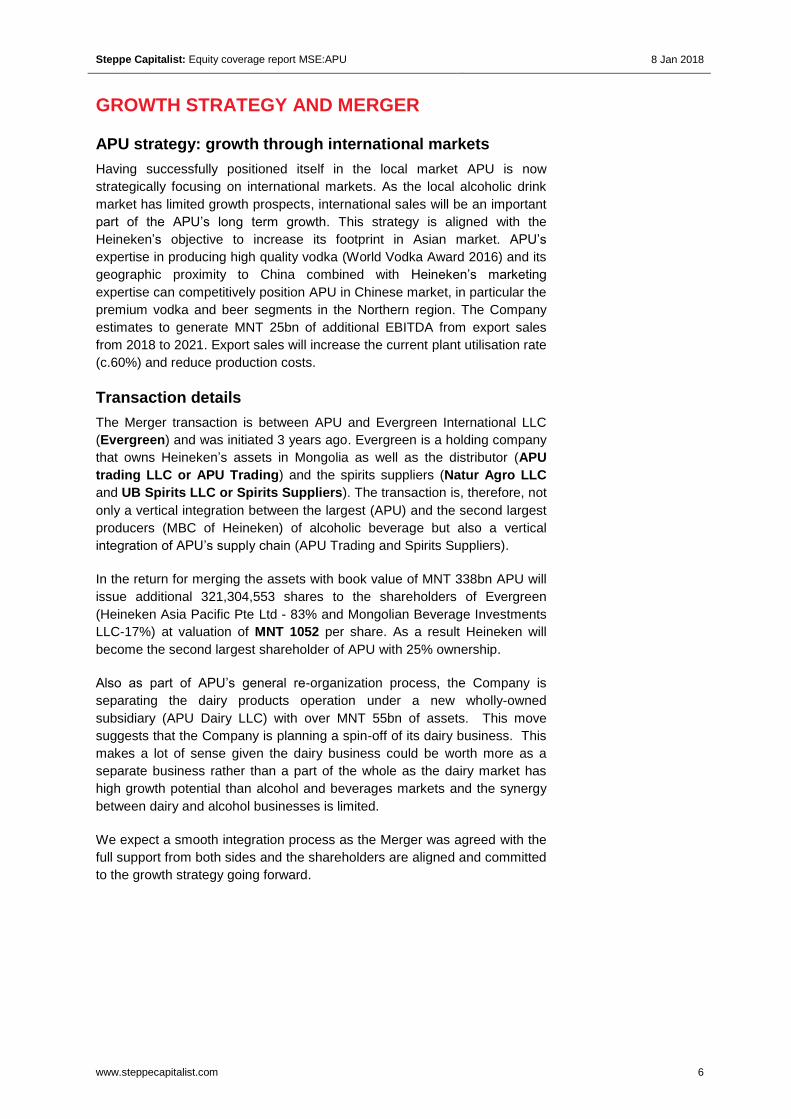
Transaction details
The Merger transaction is between APU and Evergreen International LLC
(Evergreen) and was initiated 3 years ago. Evergreen is a holding company
that owns Heineken’s assets in Mongolia as well as the distributor (APU
trading LLC or APU Trading) and the spirits suppliers (Natur Agro LLC
and UB Spirits LLC or Spirits Suppliers). The transaction is, therefore, not
only a vertical integration between the largest (APU) and the second largest
producers (MBC of Heineken) of alcoholic beverage but also a vertical
integration of APU’s supply chain (APU Trading and Spirits Suppliers).
In the return for merging the assets with book value of MNT 338bn APU will
issue additional 321,304,553 shares to the shareholders of Evergreen
(Heineken Asia Pacific Pte Ltd - 83% and Mongolian Beverage Investments
LLC-17%) at valuation of MNT 1052 per share. As a result Heineken will
become the second largest shareholder of APU with 25% ownership.
Also as part of APU’s general re-organization process, the Company is
separating the dairy products operation under a new wholly-owned
subsidiary (APU Dairy LLC) with over MNT 55bn of assets. This move
suggests that the Company is planning a spin-off of its dairy business. This
makes a lot of sense given the dairy business could be worth more as a
separate business rather than a part of the whole as the dairy market has
high growth potential than alcohol and beverages markets and the synergy
between dairy and alcohol businesses is limited.
We expect a smooth integration process as the Merger was agreed with the
full support from both sides and the shareholders are aligned and committed
to the growth strategy going forward.
Steppe Capitalist: Equity coverage report MSE:APU 8 Jan 2018
www.steppecapitalist.com 7
Figure 13. Merger diagram
Source: Company report
The transaction will mark Mongolia’s largest ever merger deal and there are
number of high profile international consultants (PwC, Bain & Co, KPMG
etc.) advising the company on the deal. Eventually APU is considering an
IPO on international stock exchanges to unlock shareholder value by
diversifying shareholder basis.
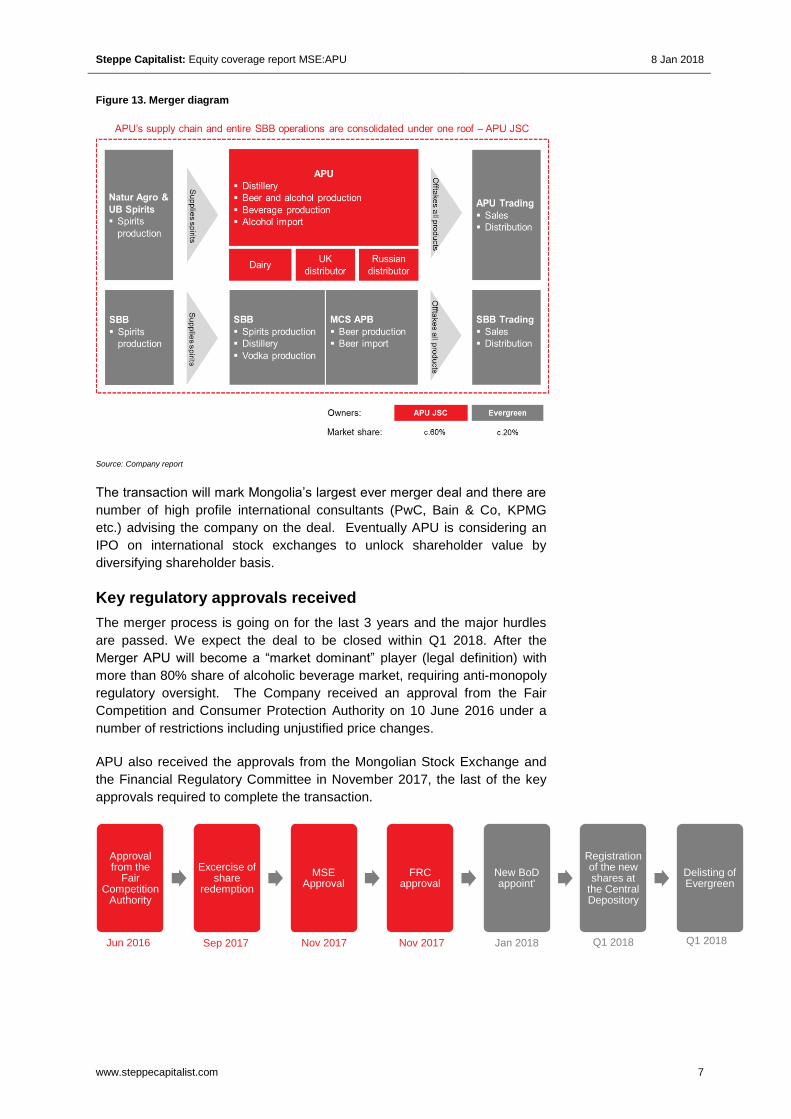
Key regulatory approvals received
The merger process is going on for the last 3 years and the major hurdles
are passed. We expect the deal to be closed within Q1 2018. After the
Merger APU will become a “market dominant” player (legal definition) with
more than 80% share of alcoholic beverage market, requiring anti-monopoly
regulatory oversight. The Company received an approval from the Fair
Competition and Consumer Protection Authority on 10 June 2016 under a
number of restrictions including unjustified price changes.
APU also received the approvals from the Mongolian Stock Exchange and
the Financial Regulatory Committee in November 2017, the last of the key
approvals required to complete the transaction.
Approval from the
Fair Competition
Authority
Excercise of share
redemption
MSE Approval
FRC approval
New BoD appoint'
Registration of the new shares at
the Central Depository
Delisting of Evergreen
Q1 2018 Q1 2018 Jan 2018 Nov 2017 Sep 2017 Nov 2017 Jun 2016
Steppe Capitalist: Equity coverage report MSE:APU 8 Jan 2018
www.steppecapitalist.com 8
FINANCIAL OUTLOOK
Earnings outlook
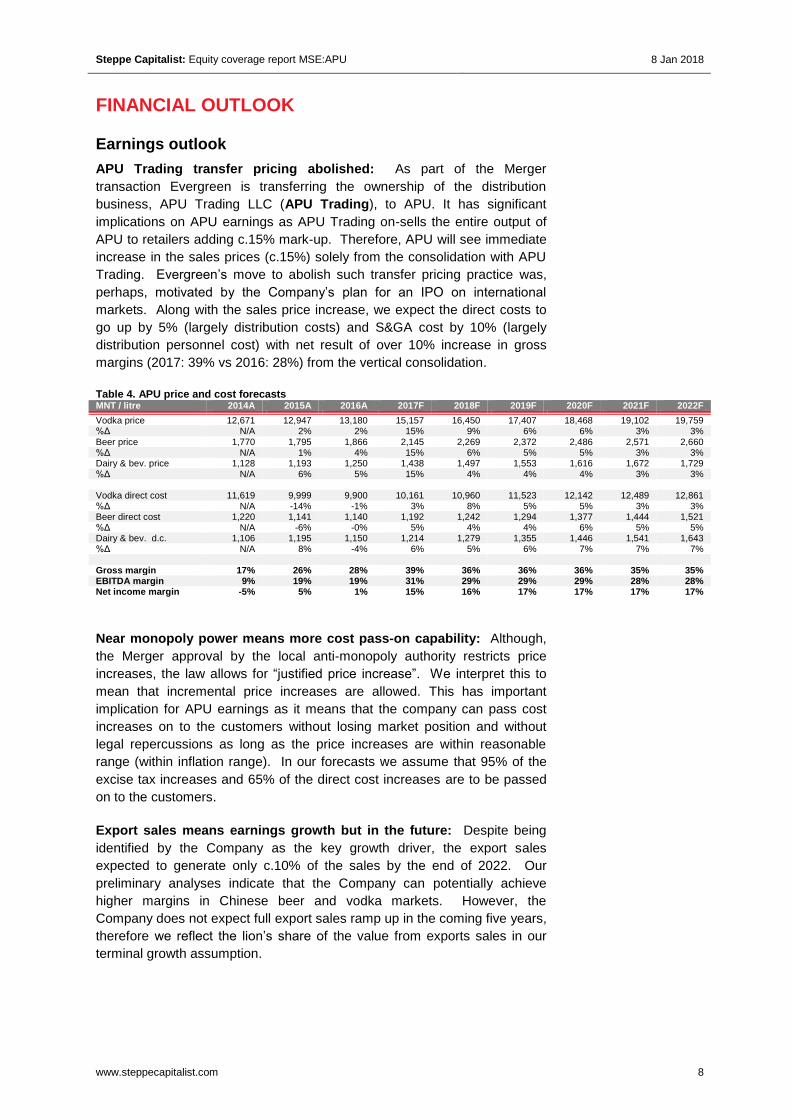
APU Trading transfer pricing abolished: As part of the Merger
transaction Evergreen is transferring the ownership of the distribution
business, APU Trading LLC (APU Trading), to APU. It has significant
implications on APU earnings as APU Trading on-sells the entire output of
APU to retailers adding c.15% mark-up. Therefore, APU will see immediate
increase in the sales prices (c.15%) solely from the consolidation with APU
Trading. Evergreen’s move to abolish such transfer pricing practice was,
perhaps, motivated by the Company’s plan for an IPO on international
markets. Along with the sales price increase, we expect the direct costs to
go up by 5% (largely distribution costs) and S&GA cost by 10% (largely
distribution personnel cost) with net result of over 10% increase in gross
margins (2017: 39% vs 2016: 28%) from the vertical consolidation.
Table 4. APU price and cost forecasts MNT / litre 2014A 2015A 2016A 2017F 2018F 2019F 2020F 2021F 2022F
Vodka price 12,671 12,947 13,180 15,157 16,450 17,407 18,468 19,102 19,759 %Δ N/A 2% 2% 15% 9% 6% 6% 3% 3% Beer price 1,770 1,795 1,866 2,145 2,269 2,372 2,486 2,571 2,660 %Δ N/A 1% 4% 15% 6% 5% 5% 3% 3% Dairy & bev. price 1,128 1,193 1,250 1,438 1,497 1,553 1,616 1,672 1,729 %Δ N/A 6% 5% 15% 4% 4% 4% 3% 3%
Vodka direct cost 11,619 9,999 9,900 10,161 10,960 11,523 12,142 12,489 12,861 %Δ N/A -14% -1% 3% 8% 5% 5% 3% 3% Beer direct cost 1,220 1,141 1,140 1,192 1,242 1,294 1,377 1,444 1,521 %Δ N/A -6% -0% 5% 4% 4% 6% 5% 5% Dairy & bev. d.c. 1,106 1,195 1,150 1,214 1,279 1,355 1,446 1,541 1,643 %Δ N/A 8% -4% 6% 5% 6% 7% 7% 7%
Gross margin 17% 26% 28% 39% 36% 36% 36% 35% 35% EBITDA margin 9% 19% 19% 31% 29% 29% 29% 28% 28% Net income margin -5% 5% 1% 15% 16% 17% 17% 17% 17%
Near monopoly power means more cost pass-on capability: Although,
the Merger approval by the local anti-monopoly authority restricts price
increases, the law allows for “justified price increase”. We interpret this to
mean that incremental price increases are allowed. This has important
implication for APU earnings as it means that the company can pass cost
increases on to the customers without losing market position and without
legal repercussions as long as the price increases are within reasonable
range (within inflation range). In our forecasts we assume that 95% of the
excise tax increases and 65% of the direct cost increases are to be passed
on to the customers.
Export sales means earnings growth but in the future: Despite being
identified by the Company as the key growth driver, the export sales
expected to generate only c.10% of the sales by the end of 2022. Our
preliminary analyses indicate that the Company can potentially achieve
higher margins in Chinese beer and vodka markets. However, the
Company does not expect full export sales ramp up in the coming five years,
therefore we reflect the lion’s share of the value from exports sales in our
terminal growth assumption.
Steppe Capitalist: Equity coverage report MSE:APU 8 Jan 2018
www.steppecapitalist.com 9
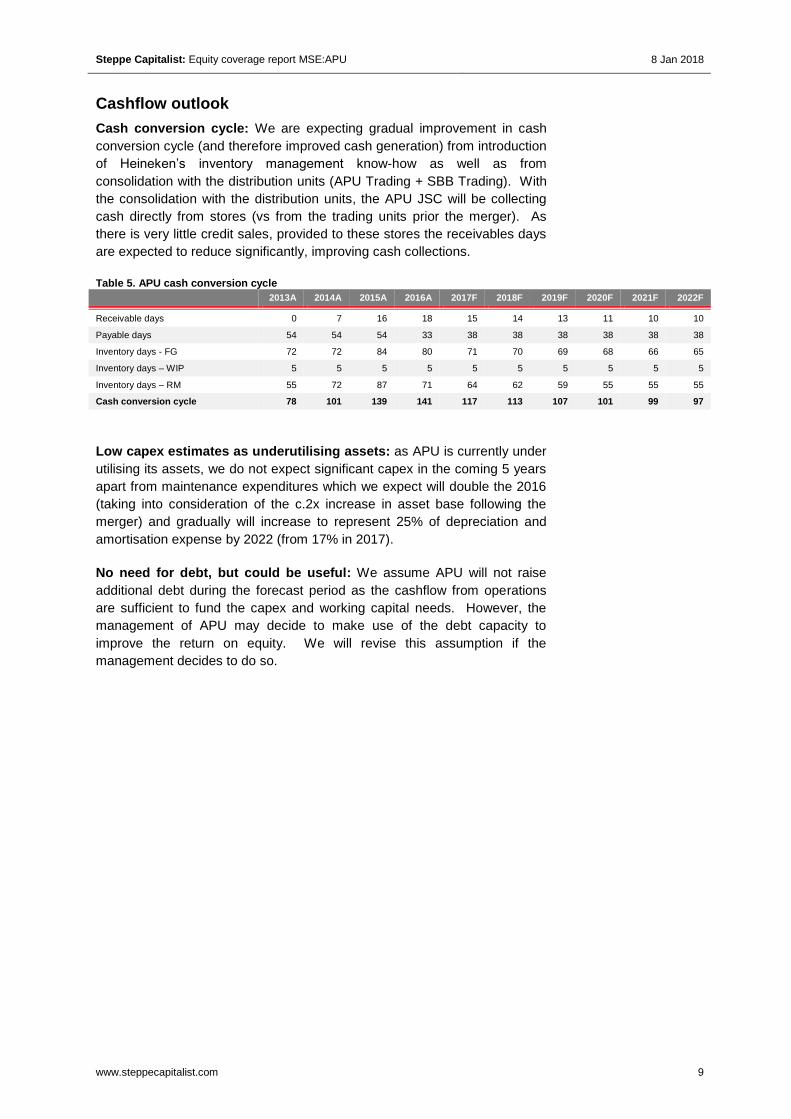
Cashflow outlook
Cash conversion cycle: We are expecting gradual improvement in cash
conversion cycle (and therefore improved cash generation) from introduction
of Heineken’s inventory management know-how as well as from
consolidation with the distribution units (APU Trading + SBB Trading). With
the consolidation with the distribution units, the APU JSC will be collecting
cash directly from stores (vs from the trading units prior the merger). As
there is very little credit sales, provided to these stores the receivables days
are expected to reduce significantly, improving cash collections.
Table 5. APU cash conversion cycle
2013A 2014A 2015A 2016A 2017F 2018F 2019F 2020F 2021F 2022F
Receivable days 0 7 16 18 15 14 13 11 10 10
Payable days 54 54 54 33 38 38 38 38 38 38
Inventory days - FG 72 72 84 80 71 70 69 68 66 65
Inventory days – WIP 5 5 5 5 5 5 5 5 5 5
Inventory days – RM 55 72 87 71 64 62 59 55 55 55
Cash conversion cycle 78 101 139 141 117 113 107 101 99 97
Low capex estimates as underutilising assets: as APU is currently under
utilising its assets, we do not expect significant capex in the coming 5 years
apart from maintenance expenditures which we expect will double the 2016
(taking into consideration of the c.2x increase in asset base following the
merger) and gradually will increase to represent 25% of depreciation and
amortisation expense by 2022 (from 17% in 2017).
No need for debt, but could be useful: We assume APU will not raise
additional debt during the forecast period as the cashflow from operations
are sufficient to fund the capex and working capital needs. However, the
management of APU may decide to make use of the debt capacity to
improve the return on equity. We will revise this assumption if the
management decides to do so.
Steppe Capitalist: Equity coverage report MSE:APU 8 Jan 2018
www.steppecapitalist.com 10
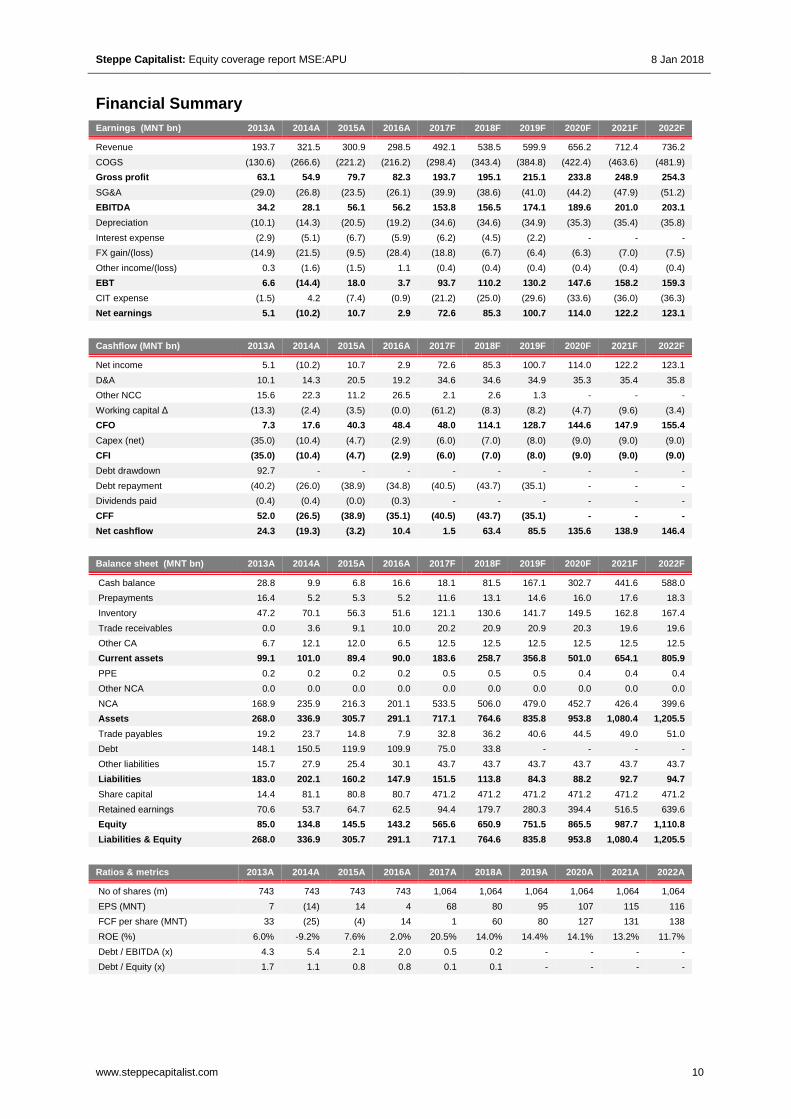
Financial Summary
Earnings (MNT bn) 2013A 2014A 2015A 2016A 2017F 2018F 2019F 2020F 2021F 2022F
Revenue 193.7 321.5 300.9 298.5 492.1 538.5 599.9 656.2 712.4 736.2
COGS (130.6) (266.6) (221.2) (216.2) (298.4) (343.4) (384.8) (422.4) (463.6) (481.9)
Gross profit 63.1 54.9 79.7 82.3 193.7 195.1 215.1 233.8 248.9 254.3
SG&A (29.0) (26.8) (23.5) (26.1) (39.9) (38.6) (41.0) (44.2) (47.9) (51.2)
EBITDA 34.2 28.1 56.1 56.2 153.8 156.5 174.1 189.6 201.0 203.1
Depreciation (10.1) (14.3) (20.5) (19.2) (34.6) (34.6) (34.9) (35.3) (35.4) (35.8)
Interest expense (2.9) (5.1) (6.7) (5.9) (6.2) (4.5) (2.2) - - -
FX gain/(loss) (14.9) (21.5) (9.5) (28.4) (18.8) (6.7) (6.4) (6.3) (7.0) (7.5)
Other income/(loss) 0.3 (1.6) (1.5) 1.1 (0.4) (0.4) (0.4) (0.4) (0.4) (0.4)
EBT 6.6 (14.4) 18.0 3.7 93.7 110.2 130.2 147.6 158.2 159.3
CIT expense (1.5) 4.2 (7.4) (0.9) (21.2) (25.0) (29.6) (33.6) (36.0) (36.3)
Net earnings 5.1 (10.2) 10.7 2.9 72.6 85.3 100.7 114.0 122.2 123.1
Cashflow (MNT bn) 2013A 2014A 2015A 2016A 2017F 2018F 2019F 2020F 2021F 2022F
Net income 5.1 (10.2) 10.7 2.9 72.6 85.3 100.7 114.0 122.2 123.1
D&A 10.1 14.3 20.5 19.2 34.6 34.6 34.9 35.3 35.4 35.8
Other NCC 15.6 22.3 11.2 26.5 2.1 2.6 1.3 - - -
Working capital Δ (13.3) (2.4) (3.5) (0.0) (61.2) (8.3) (8.2) (4.7) (9.6) (3.4)
CFO 7.3 17.6 40.3 48.4 48.0 114.1 128.7 144.6 147.9 155.4
Capex (net) (35.0) (10.4) (4.7) (2.9) (6.0) (7.0) (8.0) (9.0) (9.0) (9.0)
CFI (35.0) (10.4) (4.7) (2.9) (6.0) (7.0) (8.0) (9.0) (9.0) (9.0)
Debt drawdown 92.7 - - - - - - - - -
Debt repayment (40.2) (26.0) (38.9) (34.8) (40.5) (43.7) (35.1) - - -
Dividends paid (0.4) (0.4) (0.0) (0.3) - - - - - -
CFF 52.0 (26.5) (38.9) (35.1) (40.5) (43.7) (35.1) - - -
Net cashflow 24.3 (19.3) (3.2) 10.4 1.5 63.4 85.5 135.6 138.9 146.4
Balance sheet (MNT bn) 2013A 2014A 2015A 2016A 2017F 2018F 2019F 2020F 2021F 2022F
Cash balance 28.8 9.9 6.8 16.6 18.1 81.5 167.1 302.7 441.6 588.0
Prepayments 16.4 5.2 5.3 5.2 11.6 13.1 14.6 16.0 17.6 18.3
Inventory 47.2 70.1 56.3 51.6 121.1 130.6 141.7 149.5 162.8 167.4
Trade receivables 0.0 3.6 9.1 10.0 20.2 20.9 20.9 20.3 19.6 19.6
Other CA 6.7 12.1 12.0 6.5 12.5 12.5 12.5 12.5 12.5 12.5
Current assets 99.1 101.0 89.4 90.0 183.6 258.7 356.8 501.0 654.1 805.9
PPE 0.2 0.2 0.2 0.2 0.5 0.5 0.5 0.4 0.4 0.4
Other NCA 0.0 0.0 0.0 0.0 0.0 0.0 0.0 0.0 0.0 0.0
NCA 168.9 235.9 216.3 201.1 533.5 506.0 479.0 452.7 426.4 399.6
Assets 268.0 336.9 305.7 291.1 717.1 764.6 835.8 953.8 1,080.4 1,205.5
Trade payables 19.2 23.7 14.8 7.9 32.8 36.2 40.6 44.5 49.0 51.0
Debt 148.1 150.5 119.9 109.9 75.0 33.8 - - - -
Other liabilities 15.7 27.9 25.4 30.1 43.7 43.7 43.7 43.7 43.7 43.7
Liabilities 183.0 202.1 160.2 147.9 151.5 113.8 84.3 88.2 92.7 94.7
Share capital 14.4 81.1 80.8 80.7 471.2 471.2 471.2 471.2 471.2 471.2
Retained earnings 70.6 53.7 64.7 62.5 94.4 179.7 280.3 394.4 516.5 639.6
Equity 85.0 134.8 145.5 143.2 565.6 650.9 751.5 865.5 987.7 1,110.8
Liabilities & Equity 268.0 336.9 305.7 291.1 717.1 764.6 835.8 953.8 1,080.4 1,205.5
Ratios & metrics 2013A 2014A 2015A 2016A 2017A 2018A 2019A 2020A 2021A 2022A
No of shares (m) 743 743 743 743 1,064 1,064 1,064 1,064 1,064 1,064
EPS (MNT) 7 (14) 14 4 68 80 95 107 115 116
FCF per share (MNT) 33 (25) (4) 14 1 60 80 127 131 138
ROE (%) 6.0% -9.2% 7.6% 2.0% 20.5% 14.0% 14.4% 14.1% 13.2% 11.7%
Debt / EBITDA (x) 4.3 5.4 2.1 2.0 0.5 0.2 - - - -
Debt / Equity (x) 1.7 1.1 0.8 0.8 0.1 0.1 - - - -
Steppe Capitalist: Equity coverage report MSE:APU 8 Jan 2018
www.steppecapitalist.com 11
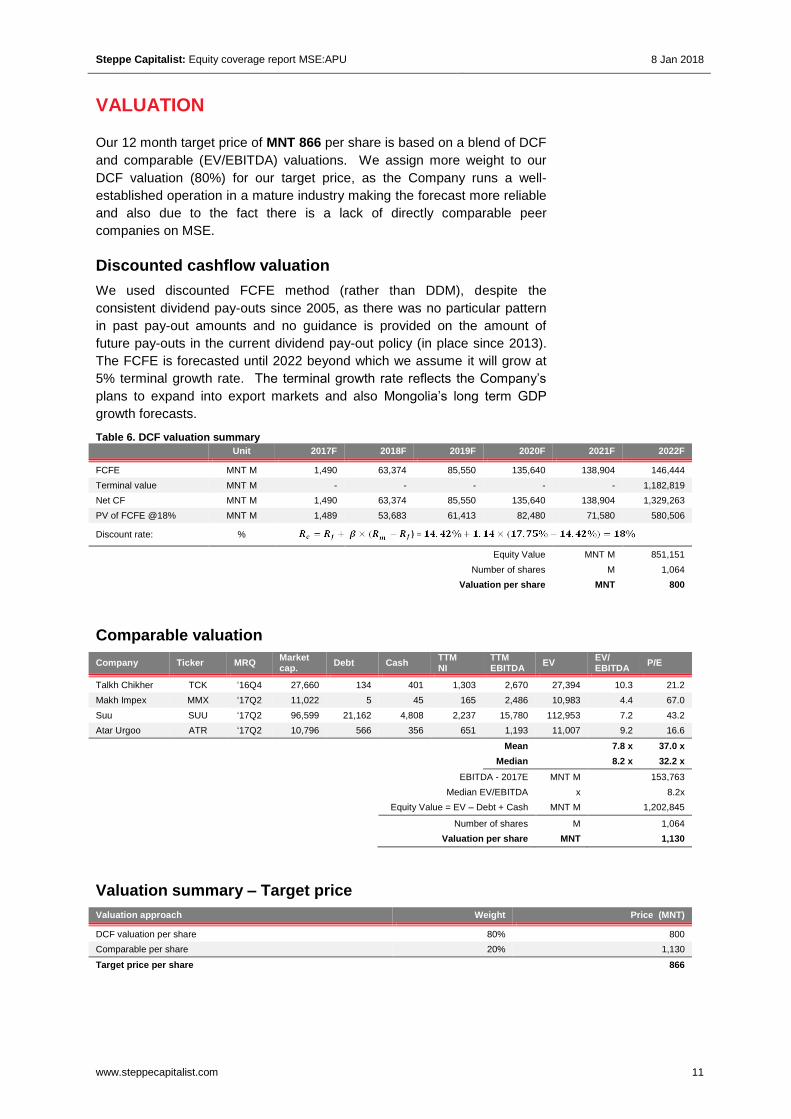
VALUATION
Our 12 month target price of MNT 866 per share is based on a blend of DCF
and comparable (EV/EBITDA) valuations. We assign more weight to our
DCF valuation (80%) for our target price, as the Company runs a well-
established operation in a mature industry making the forecast more reliable
and also due to the fact there is a lack of directly comparable peer
companies on MSE.
Discounted cashflow valuation
We used discounted FCFE method (rather than DDM), despite the
consistent dividend pay-outs since 2005, as there was no particular pattern
in past pay-out amounts and no guidance is provided on the amount of
future pay-outs in the current dividend pay-out policy (in place since 2013).
The FCFE is forecasted until 2022 beyond which we assume it will grow at
5% terminal growth rate. The terminal growth rate reflects the Company’s
plans to expand into export markets and also Mongolia’s long term GDP
growth forecasts.
Table 6. DCF valuation summary
Unit 2017F 2018F 2019F 2020F 2021F 2022F
FCFE MNT M 1,490 63,374 85,550 135,640 138,904 146,444
Terminal value MNT M - - - - - 1,182,819
Net CF MNT M 1,490 63,374 85,550 135,640 138,904 1,329,263
PV of FCFE @18% MNT M 1,489 53,683 61,413 82,480 71,580 580,506
Discount rate: %
Equity Value MNT M 851,151
Number of shares M 1,064
Valuation per share MNT 800
Comparable valuation
Company Ticker MRQ Market cap.
Debt Cash TTM NI
TTM EBITDA
EV EV/ EBITDA
P/E
Talkh Chikher TCK ‘16Q4 27,660 134 401 1,303 2,670 27,394 10.3 21.2
Makh Impex MMX ‘17Q2 11,022 5 45 165 2,486 10,983 4.4 67.0
Suu SUU ‘17Q2 96,599 21,162 4,808 2,237 15,780 112,953 7.2 43.2
Atar Urgoo ATR ‘17Q2 10,796 566 356 651 1,193 11,007 9.2 16.6
Mean 7.8 x 37.0 x
Median 8.2 x 32.2 x
EBITDA - 2017E MNT M 153,763
Median EV/EBITDA x 8.2x
Equity Value = EV – Debt + Cash MNT M 1,202,845
Number of shares M 1,064
Valuation per share MNT 1,130
Valuation summary – Target price
Valuation approach Weight Price (MNT)
DCF valuation per share 80% 800
Comparable per share 20% 1,130
Target price per share
866
Steppe Capitalist: Equity coverage report MSE:APU 8 Jan 2018
www.steppecapitalist.com 12
INVESTMENT RISKS
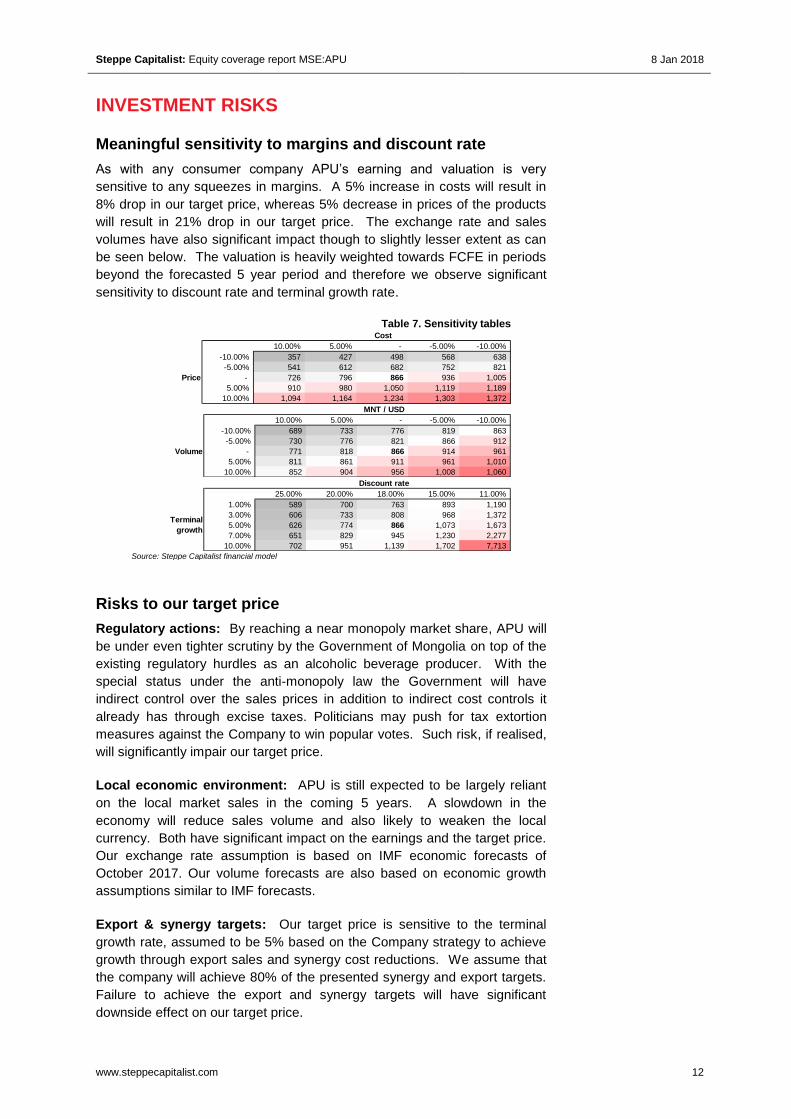
Meaningful sensitivity to margins and discount rate
As with any consumer company APU’s earning and valuation is very
sensitive to any squeezes in margins. A 5% increase in costs will result in
8% drop in our target price, whereas 5% decrease in prices of the products
will result in 21% drop in our target price. The exchange rate and sales
volumes have also significant impact though to slightly lesser extent as can
be seen below. The valuation is heavily weighted towards FCFE in periods
beyond the forecasted 5 year period and therefore we observe significant
sensitivity to discount rate and terminal growth rate.
Table 7. Sensitivity tables
Source: Steppe Capitalist financial model
Risks to our target price
Regulatory actions: By reaching a near monopoly market share, APU will
be under even tighter scrutiny by the Government of Mongolia on top of the
existing regulatory hurdles as an alcoholic beverage producer. With the
special status under the anti-monopoly law the Government will have
indirect control over the sales prices in addition to indirect cost controls it
already has through excise taxes. Politicians may push for tax extortion
measures against the Company to win popular votes. Such risk, if realised,
will significantly impair our target price.
Local economic environment: APU is still expected to be largely reliant
on the local market sales in the coming 5 years. A slowdown in the
economy will reduce sales volume and also likely to weaken the local
currency. Both have significant impact on the earnings and the target price.
Our exchange rate assumption is based on IMF economic forecasts of
October 2017. Our volume forecasts are also based on economic growth
assumptions similar to IMF forecasts.
Export & synergy targets: Our target price is sensitive to the terminal
growth rate, assumed to be 5% based on the Company strategy to achieve
growth through export sales and synergy cost reductions. We assume that
the company will achieve 80% of the presented synergy and export targets.
Failure to achieve the export and synergy targets will have significant
downside effect on our target price.
Cost
866 10.00% 5.00% - -5.00% -10.00%
-10.00% 357 427 498 568 638
-5.00% 541 612 682 752 821
Price - 726 796 866 936 1,005
5.00% 910 980 1,050 1,119 1,189
10.00% 1,094 1,164 1,234 1,303 1,372
MNT / USD
866 10.00% 5.00% - -5.00% -10.00%
-10.00% 689 733 776 819 863
-5.00% 730 776 821 866 912
Volume - 771 818 866 914 961
5.00% 811 861 911 961 1,010
10.00% 852 904 956 1,008 1,060
Discount rate
866 25.00% 20.00% 18.00% 15.00% 11.00%
1.00% 589 700 763 893 1,190
3.00% 606 733 808 968 1,372
5.00% 626 774 866 1,073 1,673
7.00% 651 829 945 1,230 2,277
10.00% 702 951 1,139 1,702 7,713
Terminal
growth
Steppe Capitalist: Equity coverage report MSE:APU 8 Jan 2018
www.steppecapitalist.com 13
IMPORTANT INFORMATION AND DISCLOSURES
This document/post is solely for information purposes and must not be
singularly used as the basis of any investment decision. Nothing in this
document should be construed as investment or financial advice. Please do
your own research as deem necessary to arrive at an independent
evaluation of an investment in the securities of the companies referred to in
this document/post.
The information and data in this document/post was obtained from publicly
available sources and other reliable sources. No information/data was
obtained from proprietary or non-public sources. We did not independently
verify all the information contained within this document, although best
efforts were taken.
Shareholding in the subject company
The authors of the document/post own the shares in the company referred
to in this document/post. The collective shareholding is below 0.01% of the
issued common shares.
Our ratings classifications
BUY – the target price is 30% or more above the current market price
HOLD – the target price is within -10-29% range of the current market
price
SELL – the target price is 10% or more below the current market price