Embed Size (px)
Citation preview
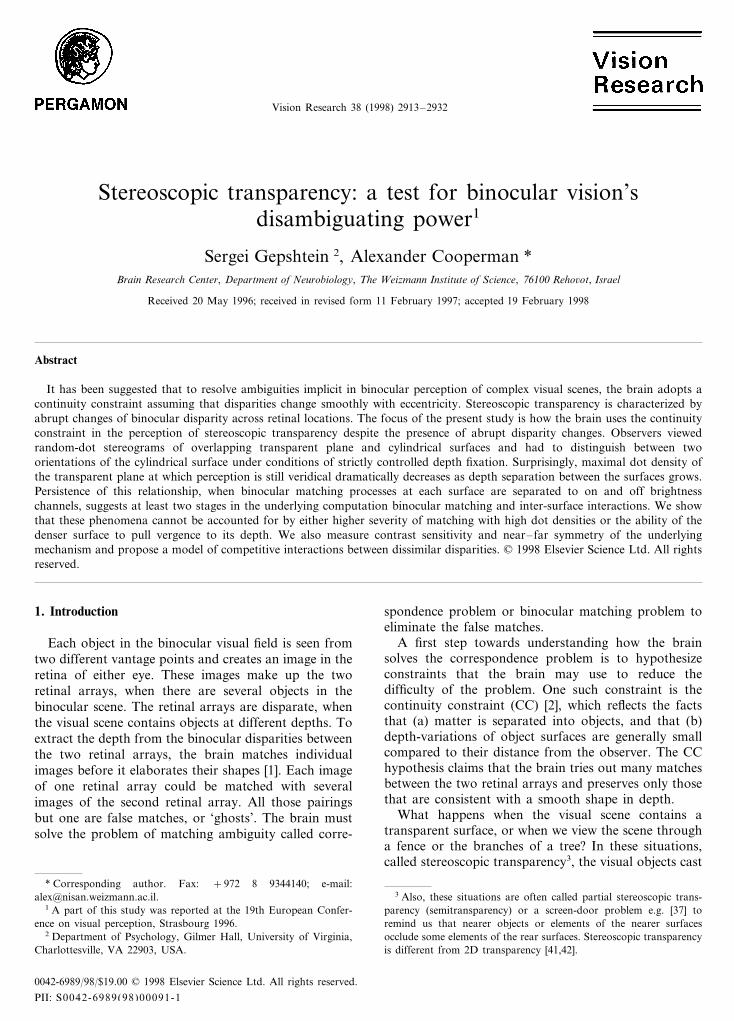
Vision Research 38 (1998) 2913–2932
Stereoscopic transparency: a test for binocular vision’sdisambiguating power1
Sergei Gepshtein 2, Alexander Cooperman *Brain Research Center, Department of Neurobiology, The Weizmann Institute of Science, 76100 Reho6ot, Israel
Received 20 May 1996; received in revised form 11 February 1997; accepted 19 February 1998
Abstract
It has been suggested that to resolve ambiguities implicit in binocular perception of complex visual scenes, the brain adopts acontinuity constraint assuming that disparities change smoothly with eccentricity. Stereoscopic transparency is characterized byabrupt changes of binocular disparity across retinal locations. The focus of the present study is how the brain uses the continuityconstraint in the perception of stereoscopic transparency despite the presence of abrupt disparity changes. Observers viewedrandom-dot stereograms of overlapping transparent plane and cylindrical surfaces and had to distinguish between twoorientations of the cylindrical surface under conditions of strictly controlled depth fixation. Surprisingly, maximal dot density ofthe transparent plane at which perception is still veridical dramatically decreases as depth separation between the surfaces grows.Persistence of this relationship, when binocular matching processes at each surface are separated to on and off brightnesschannels, suggests at least two stages in the underlying computation binocular matching and inter-surface interactions. We showthat these phenomena cannot be accounted for by either higher severity of matching with high dot densities or the ability of thedenser surface to pull vergence to its depth. We also measure contrast sensitivity and near–far symmetry of the underlyingmechanism and propose a model of competitive interactions between dissimilar disparities. © 1998 Elsevier Science Ltd. All rightsreserved.
1. Introduction
Each object in the binocular visual field is seen fromtwo different vantage points and creates an image in theretina of either eye. These images make up the tworetinal arrays, when there are several objects in thebinocular scene. The retinal arrays are disparate, whenthe visual scene contains objects at different depths. Toextract the depth from the binocular disparities betweenthe two retinal arrays, the brain matches individualimages before it elaborates their shapes [1]. Each imageof one retinal array could be matched with severalimages of the second retinal array. All those pairingsbut one are false matches, or ‘ghosts’. The brain mustsolve the problem of matching ambiguity called corre-
spondence problem or binocular matching problem toeliminate the false matches.
A first step towards understanding how the brainsolves the correspondence problem is to hypothesizeconstraints that the brain may use to reduce thedifficulty of the problem. One such constraint is thecontinuity constraint (CC) [2], which reflects the factsthat (a) matter is separated into objects, and that (b)depth-variations of object surfaces are generally smallcompared to their distance from the observer. The CChypothesis claims that the brain tries out many matchesbetween the two retinal arrays and preserves only thosethat are consistent with a smooth shape in depth.
What happens when the visual scene contains atransparent surface, or when we view the scene througha fence or the branches of a tree? In these situations,called stereoscopic transparency3, the visual objects cast
* Corresponding author. Fax: +972 8 9344140; e-mail:[email protected].
1 A part of this study was reported at the 19th European Confer-ence on visual perception, Strasbourg 1996.
2 Department of Psychology, Gilmer Hall, University of Virginia,Charlottesville, VA 22903, USA.
3 Also, these situations are often called partial stereoscopic trans-parency (semitransparency) or a screen-door problem e.g. [37] toremind us that nearer objects or elements of the nearer surfacesocclude some elements of the rear surfaces. Stereoscopic transparencyis different from 2D transparency [41,42].
0042-6989/98/$19.00 © 1998 Elsevier Science Ltd. All rights reserved.
PII: S0042-6989(98)00091-1
S. Gepshtein, A. Cooperman / Vision Research 38 (1998) 2913–29322914
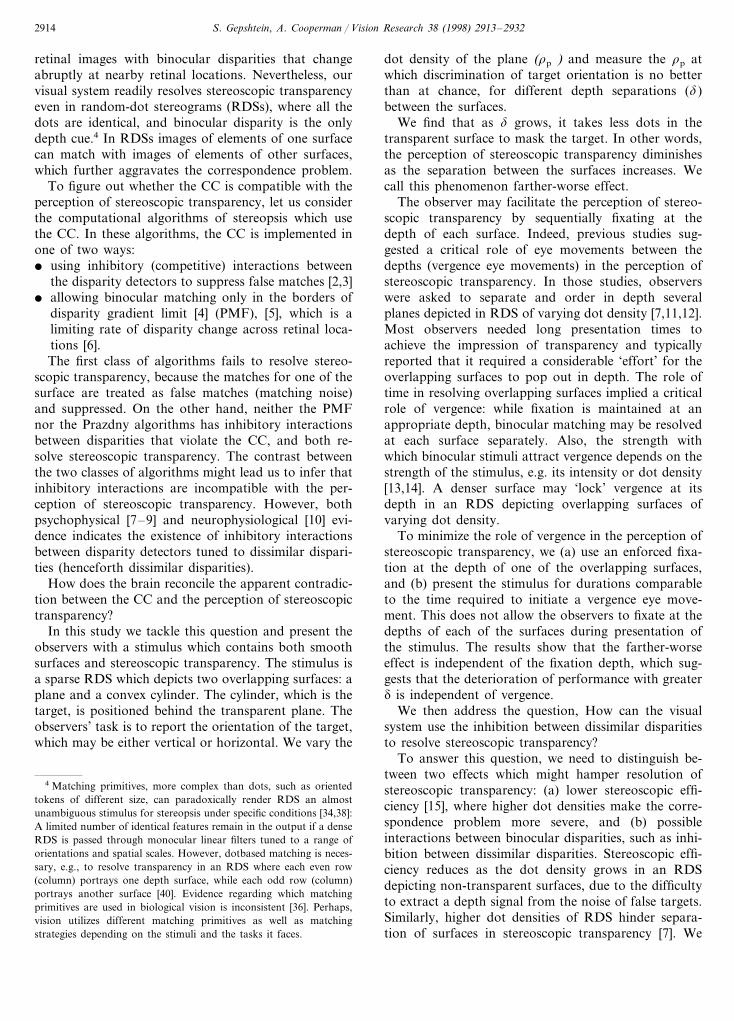
retinal images with binocular disparities that changeabruptly at nearby retinal locations. Nevertheless, ourvisual system readily resolves stereoscopic transparencyeven in random-dot stereograms (RDSs), where all thedots are identical, and binocular disparity is the onlydepth cue.4 In RDSs images of elements of one surfacecan match with images of elements of other surfaces,which further aggravates the correspondence problem.
To figure out whether the CC is compatible with theperception of stereoscopic transparency, let us considerthe computational algorithms of stereopsis which usethe CC. In these algorithms, the CC is implemented inone of two ways:� using inhibitory (competitive) interactions between
the disparity detectors to suppress false matches [2,3]� allowing binocular matching only in the borders of
disparity gradient limit [4] (PMF), [5], which is alimiting rate of disparity change across retinal loca-tions [6].The first class of algorithms fails to resolve stereo-
scopic transparency, because the matches for one of thesurface are treated as false matches (matching noise)and suppressed. On the other hand, neither the PMFnor the Prazdny algorithms has inhibitory interactionsbetween disparities that violate the CC, and both re-solve stereoscopic transparency. The contrast betweenthe two classes of algorithms might lead us to infer thatinhibitory interactions are incompatible with the per-ception of stereoscopic transparency. However, bothpsychophysical [7–9] and neurophysiological [10] evi-dence indicates the existence of inhibitory interactionsbetween disparity detectors tuned to dissimilar dispari-ties (henceforth dissimilar disparities).
How does the brain reconcile the apparent contradic-tion between the CC and the perception of stereoscopictransparency?
In this study we tackle this question and present theobservers with a stimulus which contains both smoothsurfaces and stereoscopic transparency. The stimulus isa sparse RDS which depicts two overlapping surfaces: aplane and a convex cylinder. The cylinder, which is thetarget, is positioned behind the transparent plane. Theobservers’ task is to report the orientation of the target,which may be either vertical or horizontal. We vary the
dot density of the plane (rp ) and measure the rp atwhich discrimination of target orientation is no betterthan at chance, for different depth separations (d)between the surfaces.
We find that as d grows, it takes less dots in thetransparent surface to mask the target. In other words,the perception of stereoscopic transparency diminishesas the separation between the surfaces increases. Wecall this phenomenon farther-worse effect.
The observer may facilitate the perception of stereo-scopic transparency by sequentially fixating at thedepth of each surface. Indeed, previous studies sug-gested a critical role of eye movements between thedepths (vergence eye movements) in the perception ofstereoscopic transparency. In those studies, observerswere asked to separate and order in depth severalplanes depicted in RDS of varying dot density [7,11,12].Most observers needed long presentation times toachieve the impression of transparency and typicallyreported that it required a considerable ‘effort’ for theoverlapping surfaces to pop out in depth. The role oftime in resolving overlapping surfaces implied a criticalrole of vergence: while fixation is maintained at anappropriate depth, binocular matching may be resolvedat each surface separately. Also, the strength withwhich binocular stimuli attract vergence depends on thestrength of the stimulus, e.g. its intensity or dot density[13,14]. A denser surface may ‘lock’ vergence at itsdepth in an RDS depicting overlapping surfaces ofvarying dot density.
To minimize the role of vergence in the perception ofstereoscopic transparency, we (a) use an enforced fixa-tion at the depth of one of the overlapping surfaces,and (b) present the stimulus for durations comparableto the time required to initiate a vergence eye move-ment. This does not allow the observers to fixate at thedepths of each of the surfaces during presentation ofthe stimulus. The results show that the farther-worseeffect is independent of the fixation depth, which sug-gests that the deterioration of performance with greaterd is independent of vergence.
We then address the question, How can the visualsystem use the inhibition between dissimilar disparitiesto resolve stereoscopic transparency?
To answer this question, we need to distinguish be-tween two effects which might hamper resolution ofstereoscopic transparency: (a) lower stereoscopic effi-ciency [15], where higher dot densities make the corre-spondence problem more severe, and (b) possibleinteractions between binocular disparities, such as inhi-bition between dissimilar disparities. Stereoscopic effi-ciency reduces as the dot density grows in an RDSdepicting non-transparent surfaces, due to the difficultyto extract a depth signal from the noise of false targets.Similarly, higher dot densities of RDS hinder separa-tion of surfaces in stereoscopic transparency [7]. We
4 Matching primitives, more complex than dots, such as orientedtokens of different size, can paradoxically render RDS an almostunambiguous stimulus for stereopsis under specific conditions [34,38]:A limited number of identical features remain in the output if a denseRDS is passed through monocular linear filters tuned to a range oforientations and spatial scales. However, dotbased matching is neces-sary, e.g., to resolve transparency in an RDS where each even row(column) portrays one depth surface, while each odd row (column)portrays another surface [40]. Evidence regarding which matchingprimitives are used in biological vision is inconsistent [36]. Perhaps,vision utilizes different matching primitives as well as matchingstrategies depending on the stimuli and the tasks it faces.
S. Gepshtein, A. Cooperman / Vision Research 38 (1998) 2913–2932 2915
analyze the geometry of binocular matching under theCC and under another common matching constraintthe ordering constraint (OC) and show that matchingnoise can, at least qualitatively, account for the farther-worse effect. This account predicts that increasing thedot density of the target surface will also hamperperformance. We find, however, that the performance isfacilitated with higher density of the target surface.
Furthermore, reversing the depth order of the twosurfaces changes characteristics of the farther-worseeffect, which cannot be explained by the destructiveinfluence of matching noise. We also use another testprompted by the recent finding that on and off bright-ness channels [16] are independent at the level of binoc-ular matching [17]. We apply opposite contrast polarityto the dots of different surfaces and thus separatebinocular matching at each surface to on and off. Thisallows us to separately examine the effects of stereo-scopic efficiency and interactions between the surfaces.We find that the farther-worse effect persists with oppo-site contrast polarities, although the performance isfacilitated when the dots of the two surfaces havedifferent luminances. The observed facilitation is quan-titatively different from the predictions of the OC. Thepersistence of the farther-worse effect indicates that it isindependent of the false matches between the images ofdifferent surface elements. We conclude that the far-ther-worse effect characterizes an interaction betweenthe surfaces which occurs separately from binocularmatching at each surface.
We offer a model of inhibitory connections at thehyperglobal5 level of inter-surface interactions, consis-tent with the concept of disparity gradient limit. In themodel, active binocular unit inhibit the units tuned todissimilar disparities so that the zone of inhibition hasa conelike shape in the disparity map: The lateral extentof the inhibition grows at higher depth separations.
Finally, the model led us to perform other experi-ments (section Experiment 5–6), where we ruled outmatching noise explanation of the farther-worse effect,and investigate:� The role of target strength in the perception of
stereoscopic transparency: In agreement with ourmodel, an increment of the target dot density im-proves performance, which further rules out the falsematches between different surface images as an ex-planation of the farther-worse effect.
� The symmetry of the inter-surface interactions in thedomains of crossed (near) and uncrossed (far) dis-parities: We show that the inter-surface interactionsalso operate when the target is positioned in front ofthe masking surface, but the characteristics of theinhibition differ between the near and far domains.The rest of the paper has the following structure:
After a detailed explanation of the experimental set-tings in General methods, we present the experimentswhich reveal the father-worse effect with different fixa-tion depths and different luminances of the overlappingsurfaces (Experiments 1–4). Then, we turn to inhibitionin the disparity domain and a model of inhibitoryinteractions. Finally, we present the experiments aboutthe strength of the target surface and the near–farasymmetry of the father-worse effect (Experiments 5–6).
2. General methods
Apparatus stereograms were displayed in a darkenedroom on a Mitsubishi color monitor with a screen of1280×1024 pixels subtending about 25.6×20.4° withthe viewing distance of 90 cm. Stimulus generation anddisplay were controlled by a Silicon Graphics Crimsonworkstation using a Silicon Graphics Reality Enginesystem. The disparate images, displayed using a flicker-free method (StereoGraphics system, 120 fields/s rate),were viewed with CrystalEyes shutter glasses synchro-nized with the presentation of the left and the rightimages (half-images) by infra-red emitter.
2.1. Obser6ers
The observers were one of the authors (SG) and threepaid subjects, naive as to the purpose of the experi-ment. All the observers had normal stereoscopic visionand normal or corrected-to-normal visual acuity.
2.2. Stimuli
The three stimuli fixation pattern, the test stimulusand the mask were presented on a background withluminance of 2 cd/m2 except for Experiment 3. Theviewing distance in all experiments was 90 cm. Eachtrial consisted of a fixation pattern, a test stimulus anda mask, shown in a rapid succession:
2.2.1. Forced fixationTo control the depth of fixation, a stereogram of two
vertical lines (luminance 94 cd/m2; size 1.2×84% arc),on the background of a sparse random-dot plane,preceded each test stimulus. When stereoscopicallyfused, one of the lines was perceived as slightly closer tothe observer. The depth separation between the lines
5 Following [27,39], we distinguish between the three levels instereopsis: (1) local, where information from the left and the righteyes is first combined at each retinal location disregarding the dispar-ities at other locations, (2) global, where the disparities at differentlocations interact to produce a smooth solution for the correspon-dence problem, and (3) hyperglobal, where several global solutionsexist in the same visual direction. Stereoscopic transparency is a caseof hyperglobality where the overlapping surfaces make (simultaneous)global solutions in the same visual direction.
S. Gepshtein, A. Cooperman / Vision Research 38 (1998) 2913–29322916
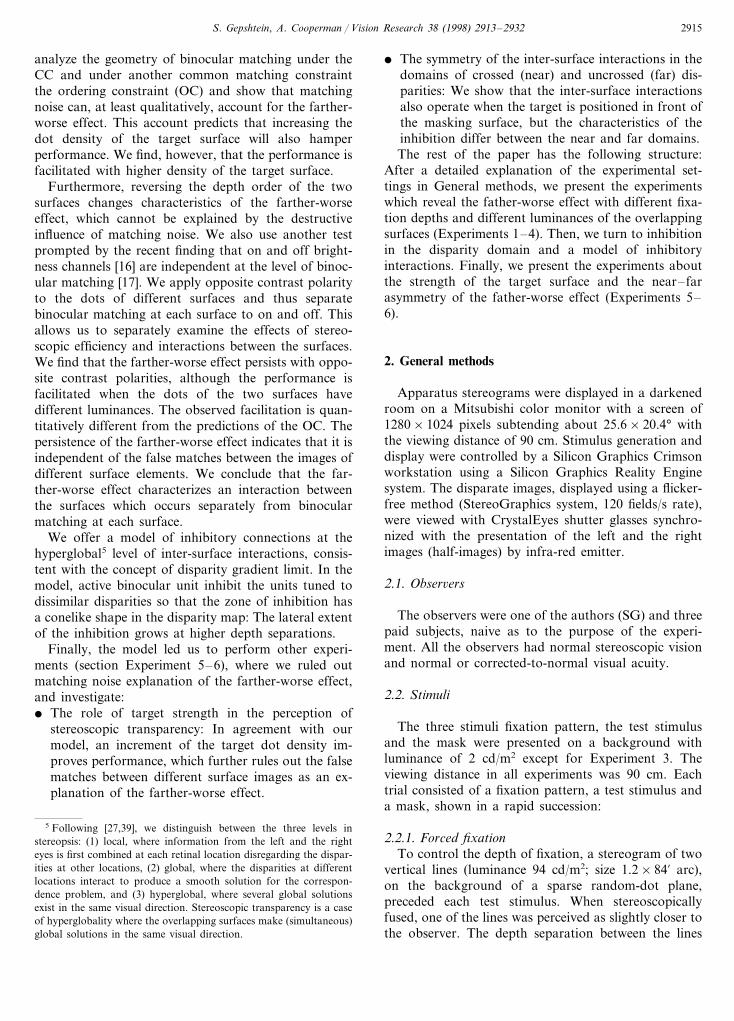
Fig. 1. A. Horizontal cross-section of the test stimulus with the vertical cylinder (target). To compute the depth separation between the surfaces(d we subtracted half of the maximal cylinder disparity from the disparity of its pedestal. The asterisk marks the depth of fixation in Experiment1, which was changed in Experiment 2 (open circle). B. Two random-dot stereograms illustrate stereoscopic configurations similar to our teststimuli. When fused with crossed disparities, vertical (top) or horizontal (bottom) convex cylindrical surface is seen through the lace of thetransparent plane.
was 2.4% arc. The sparse RDS plane at the depth of oneof the lines made fixation at the desirable depth easierand more stable.
At the end of the trial, the observers were asked torespond which of the lines left or right was closer. If theanswer was wrong, the response of the observer to thetest stimulus in that trial was discarded and a beep washeard. In Experiment 1, the lines and the plane of thefixation stereogram were at the depth of the transparentplane of the test stimulus (zero depth; Fig. 1A).
2.2.2. Test stimulusThe test stimulus was a sparse RDS occupying a
central rectangular region (18×14°) of the display. Thedots subtended 1.2×1.2% arc and had luminance of 94cd/m2 (the latter was changed in Experiments 3–4).When fused, the test stereogram was perceived as a
convex vertical, or horizontal, cylindrical surface(target) seen through a semitransparent plane (Fig. 1B).
We computed the binocular disparities between thetwo half-images of the test stereograms in two indepen-dent cyclic processes, each producing one of the twosurfaces the plane or the cylinder (Fig. 1A):� The plane. In one of the processes, over the whole
stereogram, each dot was repeated in the left and theright half-images with the same co-ordinates to pro-duce a stereogram of a plane at zero depth (18×14°). The dot density of the cylinder was 1% in allthe experiments, except for Experiment 5.
� The cylinder. In the second process, over a smallercentral patch of the stereogram (7.6×5.6°), each dotwas repeated in the left and the right half- imageswith a horizontal displacement computed accordingto the current co-ordinates of the dot to produce a
S. Gepshtein, A. Cooperman / Vision Research 38 (1998) 2913–2932 2917
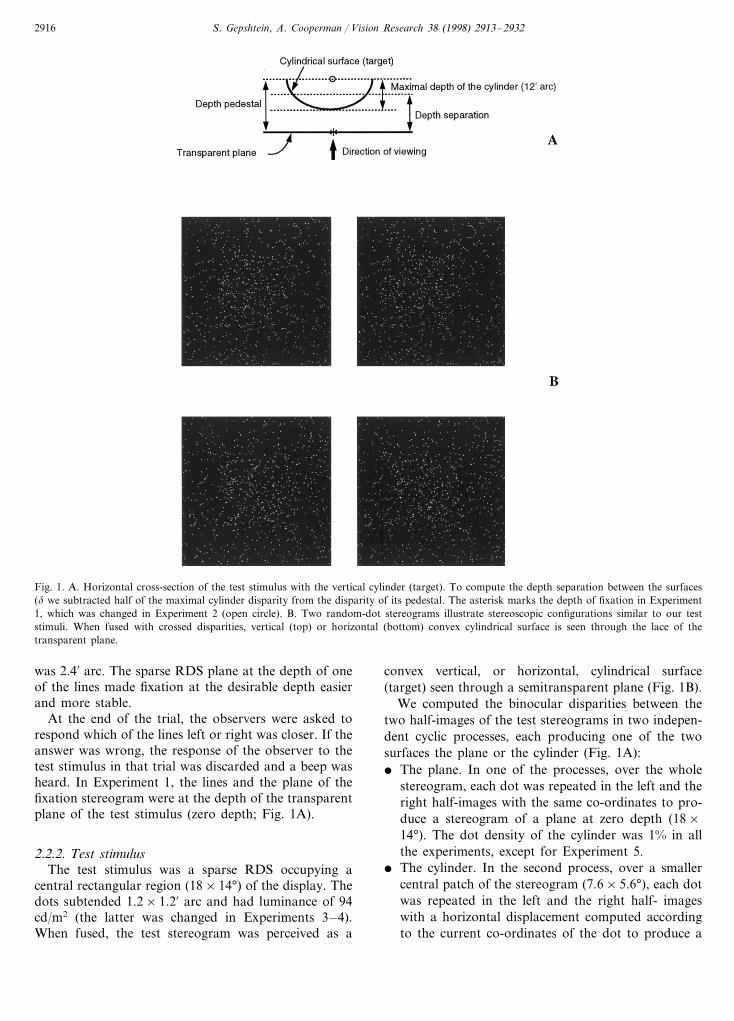
Fig. 2. The trial temporal sequence. After the observers pressed the ready key in response to presentation of the random-dot stereogram of a plane,fixation pattern, test stimulus, and mask were shown in a rapid succession without intervals. In the end of the trial, the observers were asked togive two responses: first, whether the left or the right vertical line of the fixation pattern was closer, and second, was the target surface in the teststimulus vertical or horizontal.
stereogram of a central vertical or horizontal convexcylinder, mounted on a depth pedestal6. Maximaldepth of the cylinder (Fig. 1A) was 12% arc. Thevertical and horizontal cylinders had the same widthand height (the same ‘perimeter’) in the frontalplane. We followed the convention that when theplane was seen in front of the cylinder, the depthpedestal had positive binocular disparity. The dotdensity of the transparent plane varied as explainedbelow.Within each iteration of each of the two processes, a
random number generator was employed twice to pro-duce the horizontal and vertical co-ordinates of a dot.This resulted in a roughly uniform distribution of thedots over a chosen part of the stereogram. To computethe dot density, we divided the number of dots in asurface by the area circumscribed in the ‘perimeter’ ofthat surface, i.e. by the total number of all possible dotpositions inside the area. For example, 300 random-dots in 100×200 array make dot density of 300/(100×200)=1.5%.
In each experimental block we wanted to compareobserver’s performance with two different dot densitiesof the transparent plane. To do that, we generated anew set of four test stimuli, two with vertical and twowith horizontal cylinders, at the beginning of eachexperimental or pilot block. The test stimuli withequally oriented cylinders differed by the dot density ofthe transparent plane.
2.2.3. MaskThe mask was an RDS of 20×20 planar rectangular
patches, each at a random depth. The overall size andmaximal depth of the mask, as well as the size and
luminance of the dots, were close to those of the testpattern. The dot density of the mask and the test weresimilar to ensure that their overall luminances wereclose.
2.3. Procedure
The trial temporal sequence is shown in Fig. 2. Theobservers viewed an RDS of a plane at zero depth andpressed the ready key to call the fixation pattern, whichwas shown for 96 ms. The test stimulus followed thefixation for variable duration, and was immediatelysucceeded by the mask for 960 ms. (There was no delaybetween the test and the mask.) An RDS of a plane atzero depth identical to the plane shown at the begin-ning of the trail followed the mask, which prompted theobservers to give two responses and initiate the nexttrial. The two responses at the end of the trail were: (1)which of the lines of the fixation pattern-the left or theright was closer, and (2) what was the orientationvertical or horizontal of the target. There were no gapsin the sequence of stereoscopic stimuli, which providedthe observers with a continuous clue for vergence andhelped them to correctly solve the fixation task.
In pilot experiments, we established the durations ofthe test stimulus (henceforth test durations) to plot apsychometric curve of correct answer rate as a functionof test duration for each of the four test stimuli in ablock, i.e. so that at the shortest test duration theobservers performed at the chance level, while at thelongest test duration the performance was near perfect.We used four different test durations in each experi-mental block: 96, 160, 224, and 288 ms. Only the twolargest test durations permitted vergence eye move-ments during the presentation of the test stimulus.
The distribution of binocular disparities in the cylin-der resulted in an uneven density of the dots over oneof the half-images. This inequality could serve as amonocular cue to the cylinder orientation. This prob-
6 A strong transparency effect may be produced by multiple repeti-tion of micropatterns, each similar to the Panum’s limiting case ([35])or double-nail ( dot) micropatterns ([12]). We did not use theseconfigurations here because dot densities for individual surfaces can-not be manipulated independently in both cases.
S. Gepshtein, A. Cooperman / Vision Research 38 (1998) 2913–29322918
lem could be avoided in a task of convex versus con-cave horizontal cylinders, instead of the task verticalversus horizontal convex cylinders, which we used. Wedid not use the convex versus concave task, because itwould produce a high variability of the intersurfacedepth separations, the parameter we wanted to control.Control experiments showed that with the dot densitiesand test durations used in the experiments, the perfor-mance was at chance level when the stimuli were pre-sented either monocularly or with inactive shutterstereo-glasses, and the density inequalities were the onlyclue about orientation of the target.
Out of four different test patterns presented to theobserver in each experimental block (60 presentationsof each kind), two contained vertical and two horizon-tal cylinders. Typically, the two test stimuli with equallyoriented cylinders differed by the dot density of thetransparent plane, while the depth separation betweenthe plane and the cylinder was the same for four teststimuli.
Each session typically comprised several short pilotblocks and three to five experimental blocks, each 240trials long (four test durations× four test conditions×15 trials).
3. Experiments 1–4
3.1. Experiment 1: shape discrimination drops at higherdepth separations between the surfaces
In introduction we discussed the computational ad-vantages of the continuity constraint in solving thecorrespondence problem. We said also that we readilyperceive stereoscopic transparency, even though it con-tains abrupt depth changes at nearby retinal locations.To figure out how the brain could use the continuityconstraint in this case, we wanted to quantify thelimitations of the human observers in perception ofstereoscopic transparency, using a stimulus which con-tains smooth overlapping surfaces. Specifically, in thisexperiment our purpose was to explore how perceptionof a rear surface depends on the dot density of thetransparent surface at various depth separations be-tween the surfaces.
3.1.1. MethodObservers initiated each trial and viewed the se-
quence of fixation, test and mask patterns. The fixationpattern contained two vertical lines at slightly differentdepths; the fixation task was to tell which line is closer.The test stimulus depicted a vertical or horizontal cylin-drical surface (target) seen through a transparent plane;the test task was to tell the orientation of the target.The fixation pattern was positioned at a depth of thetransparent plane of the test stimulus, and the observers
had to fixate at the required depth to be able to solvethe fixation task. At the end of each trial observers gavetwo answers: to the fixation and to the test tasks.
We measured the proportion of correct answers as afunction of test duration, as we varied the two parame-ters depth separation between the surfaces (d), and thedot density of the transparent plane (rp). The dotdensity of the target (rc, where index c stands forcylinder) was constant and equal to 1%. At any given d,we increased rp through the experimental blocks untilthe limiting density (r*p, see definition below) wasreached. We repeated this procedure across d in orderto plot the relationship between rp and d.
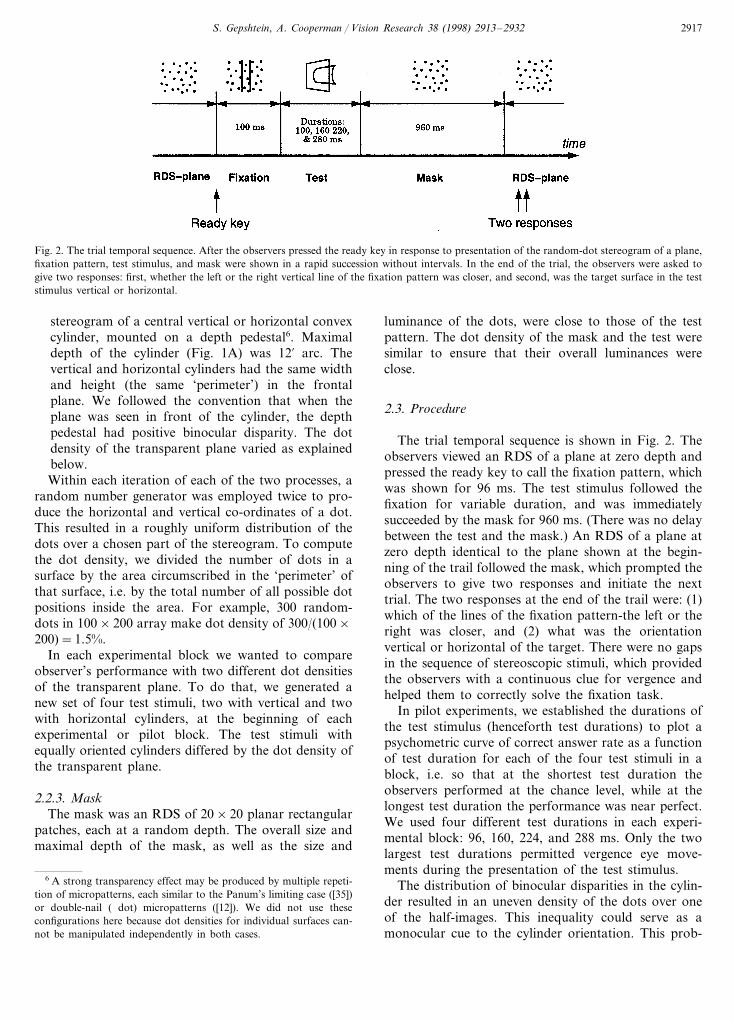
We measured r*p as follows. First, we obtained closeto perfect performance at low rp (Fig. 3A). Second, weincreased rp over experimental blocks, with otherparameters held constant, until the discrimination be-tween the two orientations of the target fell below acriterion of 75% correct. We defined r*p as the highestrp at which discrimination between the two orienta-tions of the target was veridical. High r*p means thatthe task is easy, and many random-dots need to beadded to the transparent plane to reduce performancebelow the 75% criterion. In other words, r*p measuresthe efficiency of target discrimination.
In each block, we applied two different rp’s to thetest stimuli with the same orientation of the target.Each session began with a number of pilot blocks, 48 or80 trials long, used to estimate the operative range ofrp. In subsequent experimental blocks, 240 trials long,rp differed between the two test patterns, or betweensuccessive blocks, by several tenths percent, whichdefined the precision of our measurements. This proce-dure appeared robust for two reasons: (1) sensitivity-when r*p was approached, an increment of rp by0.1–0.2% typically caused a dramatic deterioration of
Fig. 3. Typical results from one experimental block (observer OK).We plot correct answer rates averaged for the vertical and thehorizontal targets as a function of test duration. The dotted linemarks the 75% criterion level. With rp=3.9% performance is muchworse (dashed line) than with rp=3.8% (solid line).
S. Gepshtein, A. Cooperman / Vision Research 38 (1998) 2913–2932 2919
performance; (2) reproducibility-when we repeated theexperiment in the same observer on the next day oreven a week after the first measurement, r*p typicallywas very close (within 0.1–11.2%) to r*p obtained in theprevious measurement, except for the domain of smalld, where the measurements were noisier (see Resultssection). An example of the data from one experimentalblock is shown in Fig. 3.
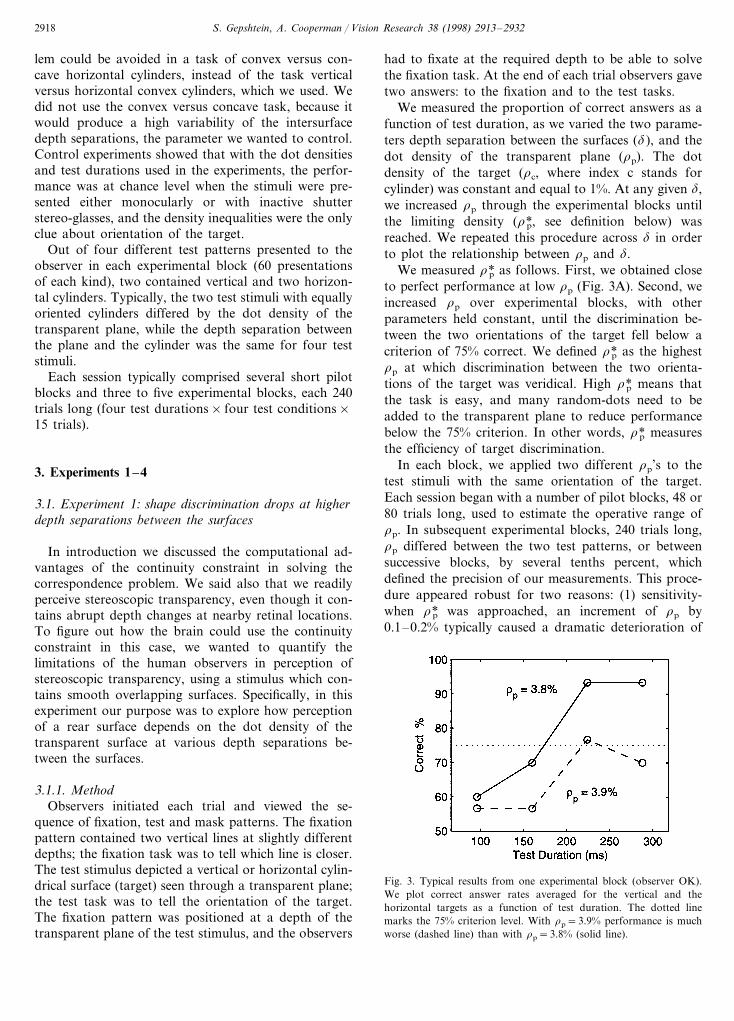
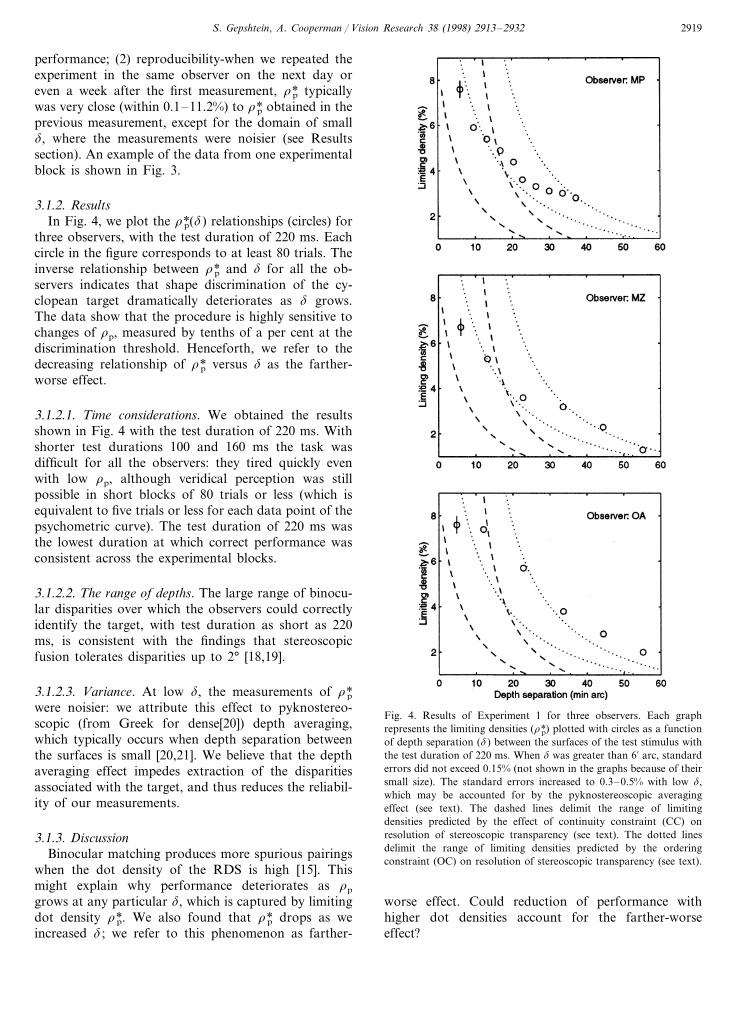
3.1.2. ResultsIn Fig. 4, we plot the r*p(d) relationships (circles) for
three observers, with the test duration of 220 ms. Eachcircle in the figure corresponds to at least 80 trials. Theinverse relationship between r*p and d for all the ob-servers indicates that shape discrimination of the cy-clopean target dramatically deteriorates as d grows.The data show that the procedure is highly sensitive tochanges of rp, measured by tenths of a per cent at thediscrimination threshold. Henceforth, we refer to thedecreasing relationship of r*p versus d as the farther-worse effect.
3.1.2.1. Time considerations. We obtained the resultsshown in Fig. 4 with the test duration of 220 ms. Withshorter test durations 100 and 160 ms the task wasdifficult for all the observers: they tired quickly evenwith low rp, although veridical perception was stillpossible in short blocks of 80 trials or less (which isequivalent to five trials or less for each data point of thepsychometric curve). The test duration of 220 ms wasthe lowest duration at which correct performance wasconsistent across the experimental blocks.
3.1.2.2. The range of depths. The large range of binocu-lar disparities over which the observers could correctlyidentify the target, with test duration as short as 220ms, is consistent with the findings that stereoscopicfusion tolerates disparities up to 2° [18,19].
3.1.2.3. Variance. At low d, the measurements of r*pwere noisier: we attribute this effect to pyknostereo-scopic (from Greek for dense[20]) depth averaging,which typically occurs when depth separation betweenthe surfaces is small [20,21]. We believe that the depthaveraging effect impedes extraction of the disparitiesassociated with the target, and thus reduces the reliabil-ity of our measurements.
3.1.3. DiscussionBinocular matching produces more spurious pairings
when the dot density of the RDS is high [15]. Thismight explain why performance deteriorates as rp
grows at any particular d, which is captured by limitingdot density r*p. We also found that r*p drops as weincreased d ; we refer to this phenomenon as farther-
Fig. 4. Results of Experiment 1 for three observers. Each graphrepresents the limiting densities (r*p) plotted with circles as a functionof depth separation (d) between the surfaces of the test stimulus withthe test duration of 220 ms. When d was greater than 6% arc, standarderrors did not exceed 0.15% (not shown in the graphs because of theirsmall size). The standard errors increased to 0.3–0.5% with low d,which may be accounted for by the pyknostereoscopic averagingeffect (see text). The dashed lines delimit the range of limitingdensities predicted by the effect of continuity constraint (CC) onresolution of stereoscopic transparency (see text). The dotted linesdelimit the range of limiting densities predicted by the orderingconstraint (OC) on resolution of stereoscopic transparency (see text).
worse effect. Could reduction of performance withhigher dot densities account for the farther-worseeffect?
S. Gepshtein, A. Cooperman / Vision Research 38 (1998) 2913–29322920
To answer the question of whether matching noisealone might cause the farther-worse effect, we assumethat the continuity constraint (CC) is used in binocularmatching; that is, the brain prefers small binoculardisparities and searches to minimize the overall dispar-ity in the reconstructed surfaces. First, let us considerhow images of the transparent plane and the cylinderdots are distributed on the retinas. The geometry ofbinocular vision facilitates our task, because the corre-sponding images in the two retinas fall onto corre-sponding lines called epipolar lines and matching isreduced to a one-dimensional problem. Let P and Cstand for the retinal images of the dots of the transpar-ent plane and of the cylinder, respectively, the super-scripts of these symbols stand for the eye (L for the leftand R for the right) of the images, and the subscriptsstand for the sequential order of the surface elementsalong the epipolar lines. For example, Ci
Lrepresents theleft image of the ith dot of the cylinder, and CR
i+1
represents the right image of its (i+ l)th dot. In our teststimuli, P images have the same epipolar co-ordinatesin both retinas. The epipolar co-ordinates of Ci
L andCi
R images are disparate: Their binocular disparityvaries in the range of D=d9 6% min. As d grows, thedisparity between Ci
L and CiR increases and at some
point the disparity of the correct match [CiL Ci
R] willexceed the disparity of one of the two false matches:[Ci
R CLi+1] or [Ci
R PjL]. The CC assumption predicts
that in this situation the false matches with the smallerdisparities will have a stronger weight in the computa-tion of the global shape than the correct match.7
Based on the CC assumption, we can compute ther*p(d) relationship predicted by matching noise alone.Remember that to produce a monocular array of thetest stereogram, we first created a sparse array ofrandom-dots (plane-dots) with the dot density of rp.Then, we added more random-dots (target-dots) to thetarget area, so that the resulting dot density in this areabecame rt=rp+rc and the average horizontal inter-dot distance became h=100s/rt, where s stands for thedot width in angular minutes, and rt is measured in percent. Next, we copied the resulting array into thesecond half of the stereogram and shifted its target-dotslaterally by to produce a distribution of binoculardisparities yielding perception of a cylindrical surface inthe fused stereogram. When D exceeds h/2, the binocu-lar disparities of most correct matches [Ci
R CiL] will
exceed the disparity of one of the two types of false
matches: [CiR CL
i+1] [CiR Pj
L]. The CC predicts that atthat point the false matches with the smaller disparitieswill be preferred, and the resulting matching noise willdestroy the correct reconstruction of the target surface.Thus, the observers’ ability to resolve the stereogramwill drop when D approaches h/2. From h=100s/rt
and D=h/2 follows that the matching noise will en-cumber resolution of the target when rp reaches r*p =(100s/2D)−rc. We compute the r*p and plot them, as afunction of D, with two dashed lines in Fig. 4: Thedashed lines demarcate the range of predicted r*p withtwo extreme values of D; that is with D=d−6% whenonly the disparities on the top of the convex cylindersystematically produce false matches (the right dashedcurve), and with D=d+6% arc, when all the targetdisparities are false.
As clear from the simulation, the CC predicts thatperformance will deteriorate as a function of d, but therate of the deterioration will be steeper than we foundin Experiment 1. Ordering constraint (OC) is anotherconstraint which is often considered in the context ofthe effect of matching noise on the reconstruction ofstereoscopic depth.8 The OC forbids binocular match-ing which violates the order of images in the tworetinas. To use our notation, most of the matches willviolation the order when D exceeds h, rather then h/2,and r*p = (100s/D)−rc. The dotted lines in Fig. 4represent the OC predicted r*p for D=d−6% (the rightdotted curve), and D=d+6%. As clear from the figure,the OC permits resolution of transparency over abroader range of d than the CC does. Results ofExperiment 1 fall close to the range of r*p predicted bythe OC. Note, however, that the results of Experiment1 are based on a less-than-perfect performance (75%correct). In our simulation of the effect of matchingnoise, we assume that most of the binocular matchesmust turn false to hamper reconstruction of a surface.Since we do not know what proportion of false matcheswill reduce performance to the level of 75% correct, wecan only draw a qualitative conclusion that the match-ing noise predicted by the OC might account for ourfindings in Experiment 1. Also, our computations of thetheoretical curves was based on a number of assump-tions, which weakens the predictive power of the simu-lations. To decide the issue, we search for otherevidence in the following experiments and discover thatthe hypothesis of the OC makes an unlikely explanationof the farther-worse effect:� In Experiment 5 we find that discrimination of the
target is facilitated with higher rc, the dot density ofthe target surface. By contrast, the ordering con-straint hypothesis predicts that increasing dot densityof either surface will hamper performance.
7 Notice that the CC agrees with a more general principle ofinteraction between the visual stimuli. The relative proximity betweenthe stimuli typically controls their interaction in the static e.g. [44]and dynamic e.g. [43] visual scenes. The CC implies that the binocularmatches between the images with the closest inter-ocular co-ordinatesare preferred. Thus, the CC may be viewed as a binocular equivalentof the Gestalt principle of grouping by proximity.
8 We thank one of the anonymous referees for drawing our atten-tion to the fact that operation of the OC may account for thefarther-worse effect.
S. Gepshtein, A. Cooperman / Vision Research 38 (1998) 2913–2932 2921
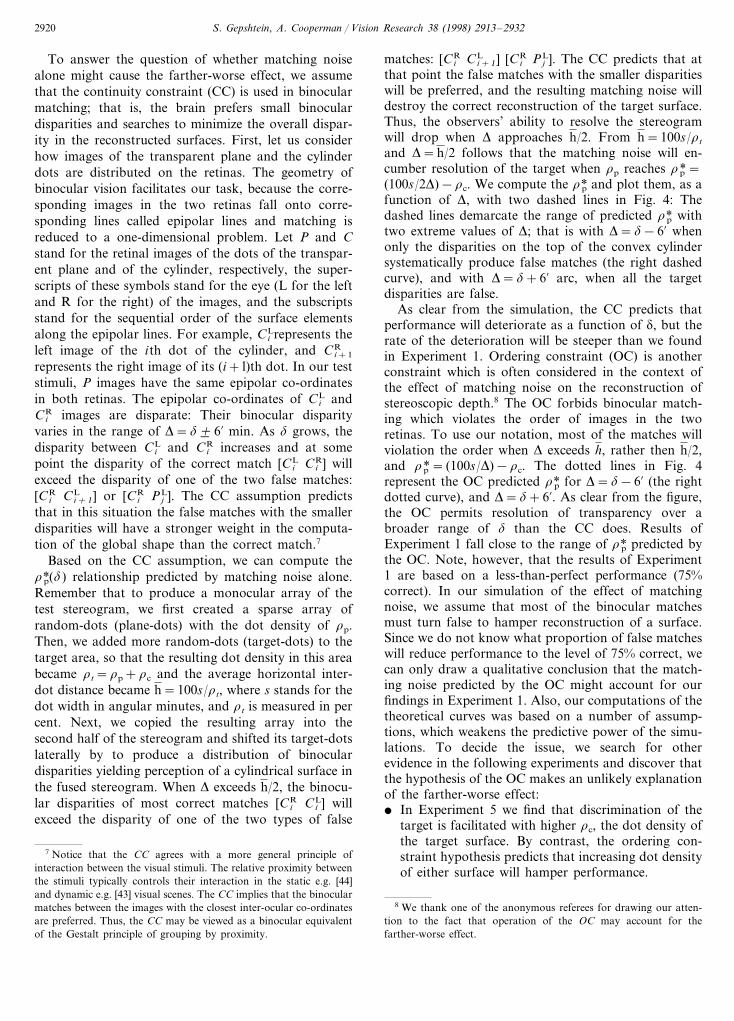
Fig. 5. Results of Experiment 2 (open circles) for two observers. Cross symbols (× ) show data from Experiment 1. Standard errors were notlarger than in Experiment 1. The results show that displacement of fixation pattern to the depth of the cylinder pedestal does not affect the basicfarther-worse effect reported in Experiment 1 (Fig. 4).
� The ordering constraint hypothesis predicts that thedepth order of the target and the masking surfaceswill not affect the farther-worse effect, as long as thedot densities of the surfaces do not change. We find,however, in Experiment 6 that the farther-worseeffect is influenced by reversing the depth order ofthe two surfaces.Searching for other explanations of the farther-worse
effect, we consider two further hypotheses: (i) the ver-gence hypothesis and (ii) the competitive interactionshypothesis. The vergence hypothesis rests on the evi-dence that a disparate stimulus in the visual field elicitsvergence eye movements directed to its depth [13,14,22].Along these lines, the stronger the disparate stimulus ofthe transparent plane (the strength may be a function ofthe dot density in the RDS [14]) the more time isrequired for vergence eye movement to reach the targetsurface.
The hypothesis of competitive interactions explainsthe lower performance at higher dot densities by in-hibitory interactions between binocular disparity detec-tors (or pools of the disparity detectors) tuned todifferent disparities [7]. First, we rule out the vergencehypothesis in Experiment 2; then we address the hy-pothesis of competitive interactions and compare itwith the predictions of the OC.
3.2. Experiment 2: farther-worse effect cannot beaccounted for by the 6ergence hypothesis
In Experiment 1 we found that the resolution ofstereoscopic transparency is hurt at larger depth separa-tions (d) between the surfaces; we call this phenomenonfarther-worse effect. As we discussed in the introduc-tion vergence eye movements might account for thefarther-worse effect: Binocular disparities elicit vergenceeye movements, and random-dot images provide morestimulation for the vergence system than line targets orsingle dots [13,14]. In a similar way, a depth plane withhigher dot density provides more stimulation for fusion
and vergence. The farther-worse effect may reflect thisdependence between the pulling strength of the trans-parent plane and its dot density.
The purpose of this experiment is to examine whetheran increase of transparent plane pulling strength, pro-duced by its higher dot density (rp), causes the decreasein the limiting density (r*p) at greater depth separations(d) between the surfaces (farther-worse effect). If adenser transparent plane slows down vergence move-ments directed to another surface, then higher rp willhamper target discrimination at the same d and testduration. This possibility is consistent with the resultsof Experiment 1.
The vergence hypothesis also predicts that if theobservers fixate at the depth of the target, then thefarther-worse effect will either disappear or at least besignificantly reduced. To test this prediction, the sameprocedure as in Experiment 1 was employed, but nowthe fixation pattern was placed at the depth of thecylinder pedestal. Thus, fixation depth varied across theblocks as we changed the depth separation between theplane and the cylinder.
3.2.1. ResultsIn Fig. 5, we plot r*p as a function of d for two
observers. The results of Experiment 1 with fixationpattern at zero depth are replotted for comparison. Asclear from the figure, there is no significant differencebetween the two curves for both observers. Thus, thevergence hypothesis cannot explain the farther-worseeffect. Vergence eye movements may still be involved indiscrimination of the cyclopean target over the exam-ined range of d (remember that the test duration of 220ms was required for consistently veridical perception),but the farther-worse effect is independent of vergence.
3.2.2. DiscussionAfter we have shown that the farther-worse effect is
independent of vergence, we will consider the hypothe-sis of competitive interactions between dissimilar dis-
S. Gepshtein, A. Cooperman / Vision Research 38 (1998) 2913–29322922
parities, i.e. between disparity detectors tuned to suffi-ciently different disparities.
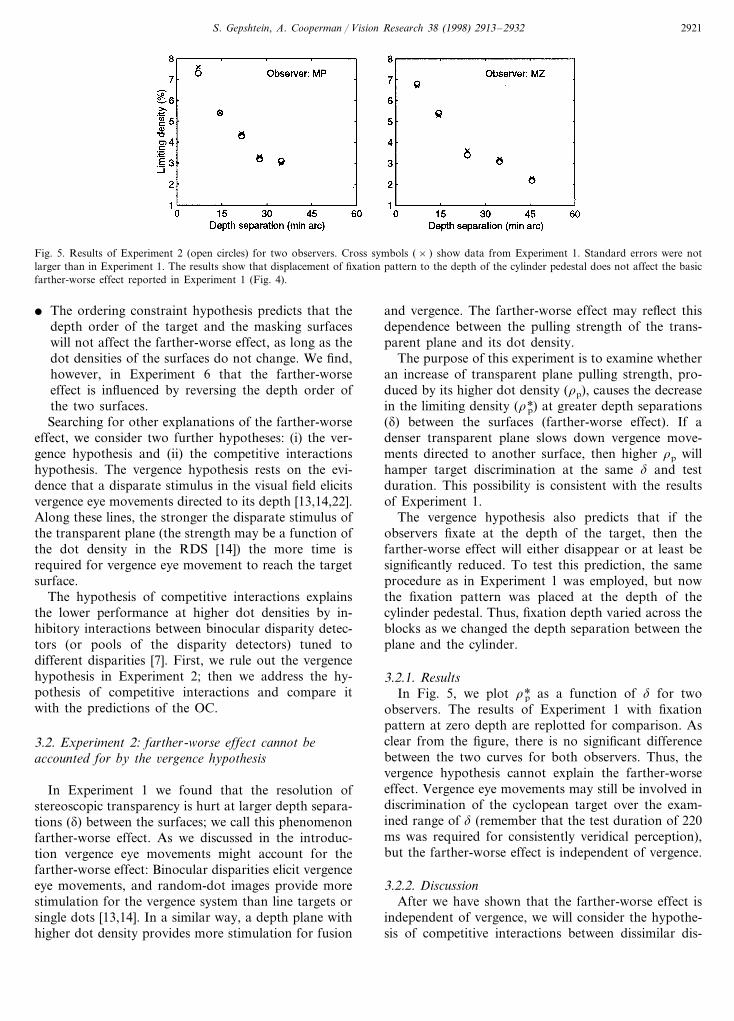
Using a method of measuring statistical efficiency ofstereoscopic perception, it was recently found that in-crements and decrements of brightness (transmittedthrough on and off neural channels, respectively; [16])are processed independently in binocular vision, at leastas far as the level at which information from the leftand right eyes is first combined [17]. Furthermore, theincrements and decrements of brightness are statisti-cally independent in stereo matching, i.e. the elimina-tion of false matches proceeds independently for thebright and dark elements [17]. These results presupposethat (a) local stereopsis is specific to contrast sign(contrast polarity), and (b) at least two distinct globalprocesses exist (Fig. 6):� where elimination of false matches occurs separately
for increments and decrements of brightness.� where the individual depth estimates derived sepa-
rately at on and off channels are combined.The evidence of separate binocular matching over the
increments and decrements of brightness suggests a toolfor discovering whether a stereoscopic phenomenonoccurs at the level of global disparity processing. If aphenomenon persists when the image elements are ofopposite contrasts polarities, then the underlying mech-anism cannot be operating before global disparity pro-cessing. The converse—if the phenomenon is abolished,it depends on a local disparity processes—is not possi-ble, because both local and global mechanisms work atthe levels where the on and off channels are separated(Fig. 6). In other words, the application of oppositecontrast polarities makes a test for stereoscopic global-ity. Since spurious matches between the surfaces areimpossible when matching processes at each surface are
separated, the test allows one to rule out the possibilitythat inter-surface matching noise, including the matcheswhich violate the ordering constraint, contributes to thefarther-worse effect. We use this test in Experiment 3.
3.3. Experiment 3: farther-worse effect persists withdots of the two surfaces ha6ing opposite contrastpolarities
In this experiment we apply opposite contrast polari-ties to the two surfaces of the test stimuli to separatethe processes of binocular matching at each surfacefrom possible interactions between the surfaces. Thishelps us (1) test whether monocular or local stereo-scopic mechanisms can account for the findings ofExperiment 1, and (2) estimate individual contributionsof matching noise and inter-surface interactions intothe farther-worse effect.
3.3.1. MethodWe changed the contrast polarities of dots of the
transparent plane and the cylinder as follows: We in-creased background luminance to 56 cd/m2 (as com-pared to 2 cd/m2 in Experiments 1–2) and decreasedcylinder dots luminance to 2 cd/m2 (as compared to 94cd/m2 in Experiments 1–2). The luminance of the trans-parent plane dots was 94 cd/m2. This made the con-trasts of the dots of the plane and the cylinder againstthe background 68 and 96%, respectively.
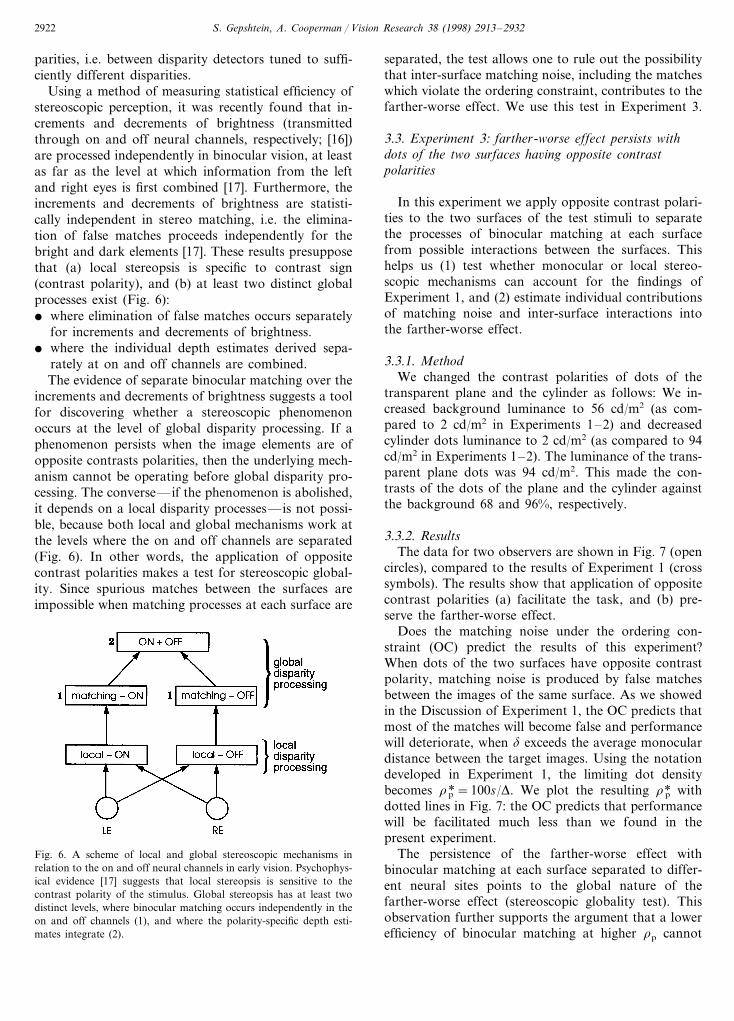
3.3.2. ResultsThe data for two observers are shown in Fig. 7 (open
circles), compared to the results of Experiment 1 (crosssymbols). The results show that application of oppositecontrast polarities (a) facilitate the task, and (b) pre-serve the farther-worse effect.
Does the matching noise under the ordering con-straint (OC) predict the results of this experiment?When dots of the two surfaces have opposite contrastpolarity, matching noise is produced by false matchesbetween the images of the same surface. As we showedin the Discussion of Experiment 1, the OC predicts thatmost of the matches will become false and performancewill deteriorate, when d exceeds the average monoculardistance between the target images. Using the notationdeveloped in Experiment 1, the limiting dot densitybecomes r*p =100s/D. We plot the resulting r*p withdotted lines in Fig. 7: the OC predicts that performancewill be facilitated much less than we found in thepresent experiment.
The persistence of the farther-worse effect withbinocular matching at each surface separated to differ-ent neural sites points to the global nature of thefarther-worse effect (stereoscopic globality test). Thisobservation further supports the argument that a lowerefficiency of binocular matching at higher rp cannot
Fig. 6. A scheme of local and global stereoscopic mechanisms inrelation to the on and off neural channels in early vision. Psychophys-ical evidence [17] suggests that local stereopsis is sensitive to thecontrast polarity of the stimulus. Global stereopsis has at least twodistinct levels, where binocular matching occurs independently in theon and off channels (1), and where the polarity-specific depth esti-mates integrate (2).

S. Gepshtein, A. Cooperman / Vision Research 38 (1998) 2913–2932 2923
Fig. 7. Results of Experiment 3 (open circles) for two observers. Standard errors were not larger than in Experiment 1. Cross symbols (× ) showdata from Experiment 1. The farther-worse effect persisted with the opposite contrast polarities of the elements of two surfaces. In the same time,the limiting densities were significantly larger than in Experiment 1. The dotted lines stand for the predictions of the ordering constraint, wherethe performance is limited by violations of matching order between the images of the target surfaces alone.
account for the farther-worse effect. We believe that theinverse relationship between r*p and d reveals inter-sur-face interactions which occur at a stage later than thebinocular matching, i.e., at or above the site designatedas on and off in Fig. 6.
The magnitudes of r*p in this experiment are signifi-cantly larger than when elements of the two surfaceshad the same contrast. It is unclear, however, whetherthe facilitation with opposite contrast polarities is dueto the separation between binocular matching at indi-vidual surfaces, or to a mere contrast difference be-tween the two surfaces. In other words, the question iswhether the underlying mechanism is sensitive to con-trast polarities or contrast difference. We explore con-trast sensitivity of the farther-worse effect inExperiment 4.
3.4. Experiment 4: limiting density is sensiti6e to theluminance of transparent surface elements
In this experiment we examine whether the facilita-tion observed in Experiment 3 was caused by theseparation of the binocular matching processes at eachsurface, or that a contrast difference between elementsof the two surfaces is sufficient for easier discriminationof the target surface.
3.4.1. MethodThe dot contrast of the plane and the cylinder were
of the same polarity and we measured r*p at differentdot luminance of the transparent plane. Luminance ofthe background was 2 cd/m2 as in Experiments 1–2. Inthis experiment we were only able to use inter surfacecontrast differences smaller than the ones we used inExperiment 3; otherwise the dots of the transparentplane would have been invisible against the dark back-ground. While the inter-surface luminance differenceused in Experiment 3 was 92 cd/m2, the maximal lumi-nance difference used in this experiment was 80 cd/m2
for observer OE and 60 cd/m2 for observer SG. In thisluminance range, the dots were well visible and trans-parency was readily perceived. For the observers OEand SG, d was 35 and 24% arc min, respectively.
3.4.2. ResultsIn Fig. 8, we plot r*p with open circles as a function
of dot luminance of the transparent plane. The resultsshow that r*p is sensitive to luminance difference be-tween the surfaces. To show that the results agree withthe notion of signal strength in the disparity domain(see below), we fit the data with the quadratic function(the solid lines). Again, we cannot measure r*p at lowerluminances of the transparent plane, where the experi-ence of stereoscopic transparency becomesquestionable.
3.4.3. DiscussionAs we have shown in Experiment 3, discrimination of
cyclopean shape is much easier with opposite contrastpolarities of the transparent and the target surfaces.The magnitude of this facilitation is close in Experi-ments 3–4 for observer OK, the only observer whoparticipated in both. Thus, the facilitation observed inExperiment 3 is attributable to the large difference inluminances (92 cd/m2) at opposite contrasts polarities,rather than to opposite contrasts polarities per se. Weconclude that contrast differences between the surfacesfacilitate matching within the surfaces, while the far-ther-worse effect is due to a mechanism independent ofwithin-surface matching (Experiment 3).
What architecture of inhibitory interactions betweendisparities could both resolve the severe matching ambi-guities in perception of stereoscopic transparency andagree with our observations? In the next section wesuggest a scheme of inhibitory connections which usesthe concept of disparity gradient limit. First, we willbriefly review psychophysical and physiological evi-dence of inhibitory interactions in the disparity domain

S. Gepshtein, A. Cooperman / Vision Research 38 (1998) 2913–29322924
Fig. 8. Results of Experiment 4 for two observers. Limiting dot density of the transparent plane is plotted as a function of the luminance of itsdots. The solid lines represent quadratic approximations to the data. The results show that with greater differences between the dots luminancesof the two surfaces, the limiting density may be increased by tens per cent.
and, second, review the evidence which suggests thatdisparity gradient limit is brought about by a globalmechanism.
4. Model of inhibitory connections in the cyclopeandomain
Based on our findings in Experiments 1 , we offer amodel of inhibitory interactions between binocularunits, which may account for the farther-worse effect.In this section, we will first review the evidence of theinhibitory interactions between dissimilar disparities,and then turn to the design of the model. The modelsuggests two tests to distinguish between the hypothesisof competitive interactions and the OC hypothesis. InExperiments 5–6 we discover that these tests supportthe hypothesis of competitive interactions as an accountof the farther-worse effect.
Inhibition in the disparity domain; e6idence from psy-chophysics. The spaces between the dots of the trans-parent surface are perceived at the depth of the rearsurface. By contrast, in random-dot stereograms ofopaque surfaces, the background regions are typicallyperceived ‘filled in’ at the depth of the surface. Perhaps,this perceptual ‘filling in’ is inhibited in stereoscopictransparency in sparse RDS [7]. What happens at theboundaries between opaque surfaces, where sharplydefined subjective contours are perceived? Akerstromand Todd [7] hypothesized that:� neurons tuned to similar disparities co-operatively
interact over relatively large neighborhoods of visualspace (global excitation associated with slowlychanging depth),
� whereas competitive interactions between neuronstuned to different disparities are restricted to a muchsmaller vicinity (local inhibition over abrupt changesin disparity).This scheme explains why locally detected disparity
information can propagate into neighboring regions,
and why this propagation is inhibited when two regionsof sufficiently different disparity come in contact withone another: The lateral propagation of disparity infor-mation is inhibited both at the boundaries betweenopaque surfaces and in stereoscopic transparency.
In another study of interactions between disparities,the stimulus was a random-dot plane emerging from adots cloud [8]. Inter-ocular correlation was used as ameasure of strength of the stereoscopic signal. Thestrength of the signal was proportional to the square ofdot contrast, which supports our observation in Exper-iment 4. The authors interpreted the influence of dotcontrast on signal strength as evidence of inhibitoryinteractions between dissimilar disparities. Similarly,inter-ocular correlation may be used as measure ofsignal strength, and weight, of each surface in inter-sur-face inhibitory interactions in transparency.
In a study attempting to reveal binocular disparitychannels, the disparity-tuning functions of the channelshad opponent-type profiles [9], which also implies inhi-bition between dissimilar disparities.
Inhibition in the disparity domain; e6idence from phys-iology. A convenient way to visualize the operation ofglobal stereopsis is to use the metaphor of disparitymap (or projection field; [23]). In the disparity map,each element of the binocular visual field is associatedwith a location in the disparity map through a pair ofretinal receptive fields (Fig. 9). Each intersection ofprojection lines in the disparity map represents binocu-lar units activated by the currently viewed stimulus.Note that the depth layers ranging from ‘far’ to ‘near’(as shown in Fig. 9) are not anatomically segregated tolayers in the visual cortex, rather, the segregation isprovided by the connectivity between binocular neu-rons tuned to different disparities.
The notion of disparity map provides a convenientframework to illustrate the known properties of binocu-lar neurons (binocular units). The typical profiles ofneural responses (Fig. 9, insets) were obtained in exper-iments with extracellular recording from neurons of
S. Gepshtein, A. Cooperman / Vision Research 38 (1998) 2913–2932 2925
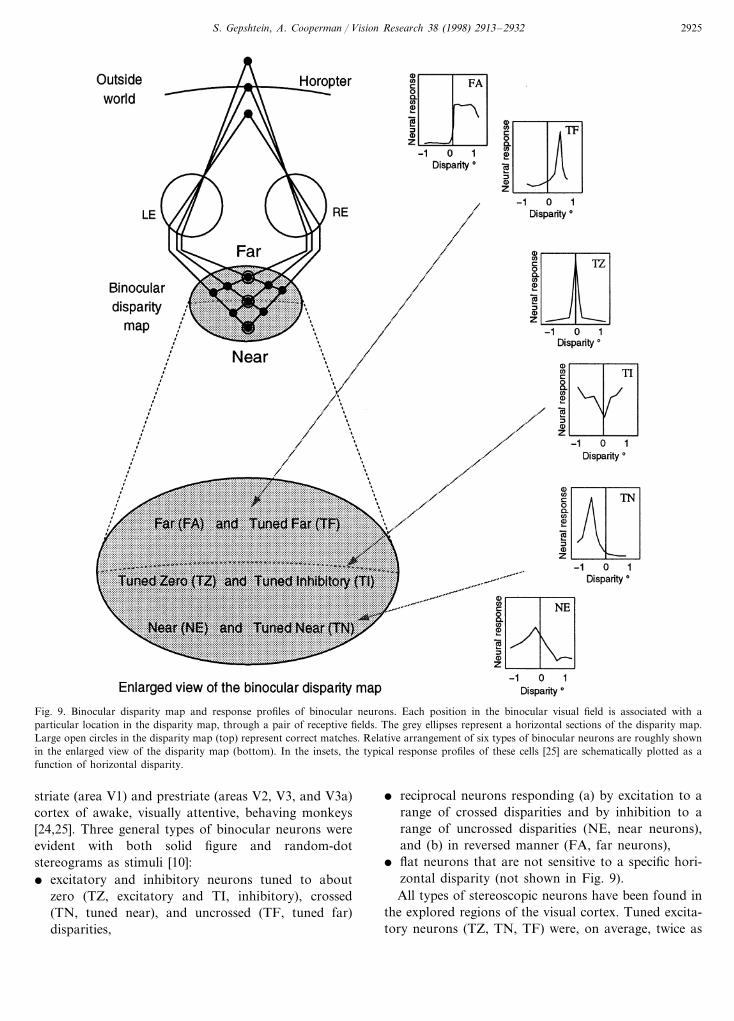
Fig. 9. Binocular disparity map and response profiles of binocular neurons. Each position in the binocular visual field is associated with aparticular location in the disparity map, through a pair of receptive fields. The grey ellipses represent a horizontal sections of the disparity map.Large open circles in the disparity map (top) represent correct matches. Relative arrangement of six types of binocular neurons are roughly shownin the enlarged view of the disparity map (bottom). In the insets, the typical response profiles of these cells [25] are schematically plotted as afunction of horizontal disparity.
striate (area V1) and prestriate (areas V2, V3, and V3a)cortex of awake, visually attentive, behaving monkeys[24,25]. Three general types of binocular neurons wereevident with both solid figure and random-dotstereograms as stimuli [10]:� excitatory and inhibitory neurons tuned to about
zero (TZ, excitatory and TI, inhibitory), crossed(TN, tuned near), and uncrossed (TF, tuned far)disparities,
� reciprocal neurons responding (a) by excitation to arange of crossed disparities and by inhibition to arange of uncrossed disparities (NE, near neurons),and (b) in reversed manner (FA, far neurons),
� flat neurons that are not sensitive to a specific hori-zontal disparity (not shown in Fig. 9).All types of stereoscopic neurons have been found in
the explored regions of the visual cortex. Tuned excita-tory neurons (TZ, TN, TF) were, on average, twice as
S. Gepshtein, A. Cooperman / Vision Research 38 (1998) 2913–29322926
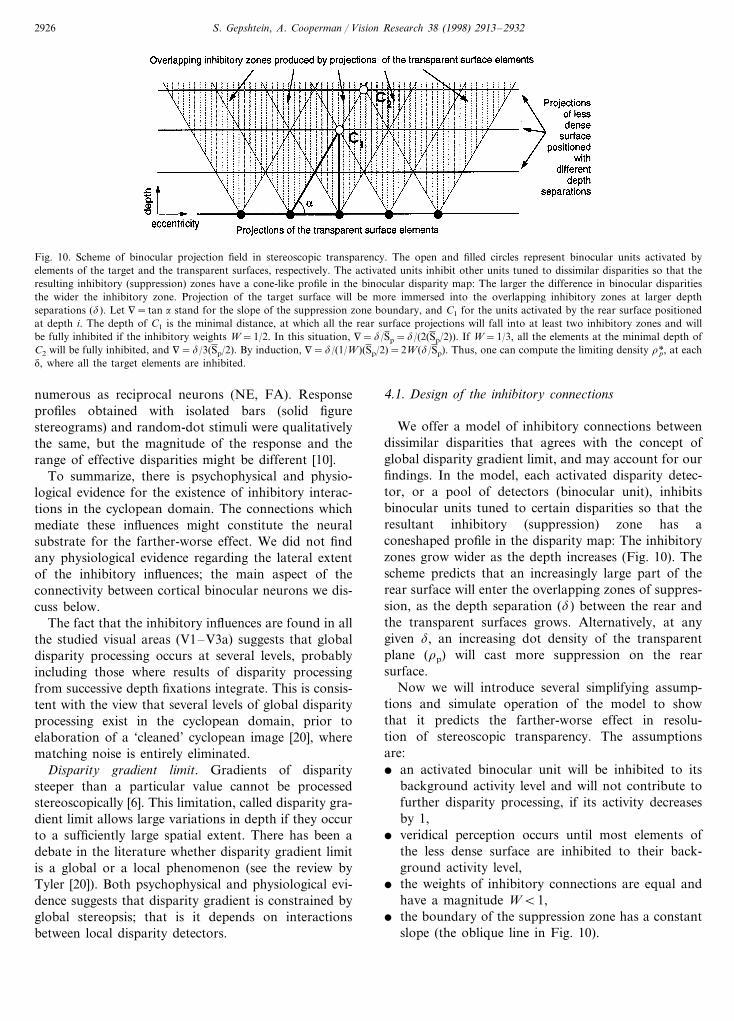
Fig. 10. Scheme of binocular projection field in stereoscopic transparency. The open and filled circles represent binocular units activated byelements of the target and the transparent surfaces, respectively. The activated units inhibit other units tuned to dissimilar disparities so that theresulting inhibitory (suppression) zones have a cone-like profile in the binocular disparity map: The larger the difference in binocular disparitiesthe wider the inhibitory zone. Projection of the target surface will be more immersed into the overlapping inhibitory zones at larger depthseparations (d). Let 9= tan a stand for the slope of the suppression zone boundary, and C1 for the units activated by the rear surface positionedat depth i. The depth of C1 is the minimal distance, at which all the rear surface projections will fall into at least two inhibitory zones and willbe fully inhibited if the inhibitory weights W=1/2. In this situation, 9=d/Sp=d/(2(Sp/2)). If W=1/3, all the elements at the minimal depth ofC2 will be fully inhibited, and 9=d/3(Sp/2). By induction, 9=d/(1/W)(Sp/2)=2W(d/Sp). Thus, one can compute the limiting density r*p, at eachd, where all the target elements are inhibited.
numerous as reciprocal neurons (NE, FA). Responseprofiles obtained with isolated bars (solid figurestereograms) and random-dot stimuli were qualitativelythe same, but the magnitude of the response and therange of effective disparities might be different [10].
To summarize, there is psychophysical and physio-logical evidence for the existence of inhibitory interac-tions in the cyclopean domain. The connections whichmediate these influences might constitute the neuralsubstrate for the farther-worse effect. We did not findany physiological evidence regarding the lateral extentof the inhibitory influences; the main aspect of theconnectivity between cortical binocular neurons we dis-cuss below.
The fact that the inhibitory influences are found in allthe studied visual areas (V1–V3a) suggests that globaldisparity processing occurs at several levels, probablyincluding those where results of disparity processingfrom successive depth fixations integrate. This is consis-tent with the view that several levels of global disparityprocessing exist in the cyclopean domain, prior toelaboration of a ‘cleaned’ cyclopean image [20], wherematching noise is entirely eliminated.
Disparity gradient limit. Gradients of disparitysteeper than a particular value cannot be processedstereoscopically [6]. This limitation, called disparity gra-dient limit allows large variations in depth if they occurto a sufficiently large spatial extent. There has been adebate in the literature whether disparity gradient limitis a global or a local phenomenon (see the review byTyler [20]). Both psychophysical and physiological evi-dence suggests that disparity gradient is constrained byglobal stereopsis; that is it depends on interactionsbetween local disparity detectors.
4.1. Design of the inhibitory connections
We offer a model of inhibitory connections betweendissimilar disparities that agrees with the concept ofglobal disparity gradient limit, and may account for ourfindings. In the model, each activated disparity detec-tor, or a pool of detectors (binocular unit), inhibitsbinocular units tuned to certain disparities so that theresultant inhibitory (suppression) zone has aconeshaped profile in the disparity map: The inhibitoryzones grow wider as the depth increases (Fig. 10). Thescheme predicts that an increasingly large part of therear surface will enter the overlapping zones of suppres-sion, as the depth separation (d) between the rear andthe transparent surfaces grows. Alternatively, at anygiven d, an increasing dot density of the transparentplane (rp) will cast more suppression on the rearsurface.
Now we will introduce several simplifying assump-tions and simulate operation of the model to showthat it predicts the farther-worse effect in resolu-tion of stereoscopic transparency. The assumptionsare:� an activated binocular unit will be inhibited to its
background activity level and will not contribute tofurther disparity processing, if its activity decreasesby 1,
� veridical perception occurs until most elements ofthe less dense surface are inhibited to their back-ground activity level,
� the weights of inhibitory connections are equal andhave a magnitude WB1,
� the boundary of the suppression zone has a constantslope (the oblique line in Fig. 10).
S. Gepshtein, A. Cooperman / Vision Research 38 (1998) 2913–2932 2927
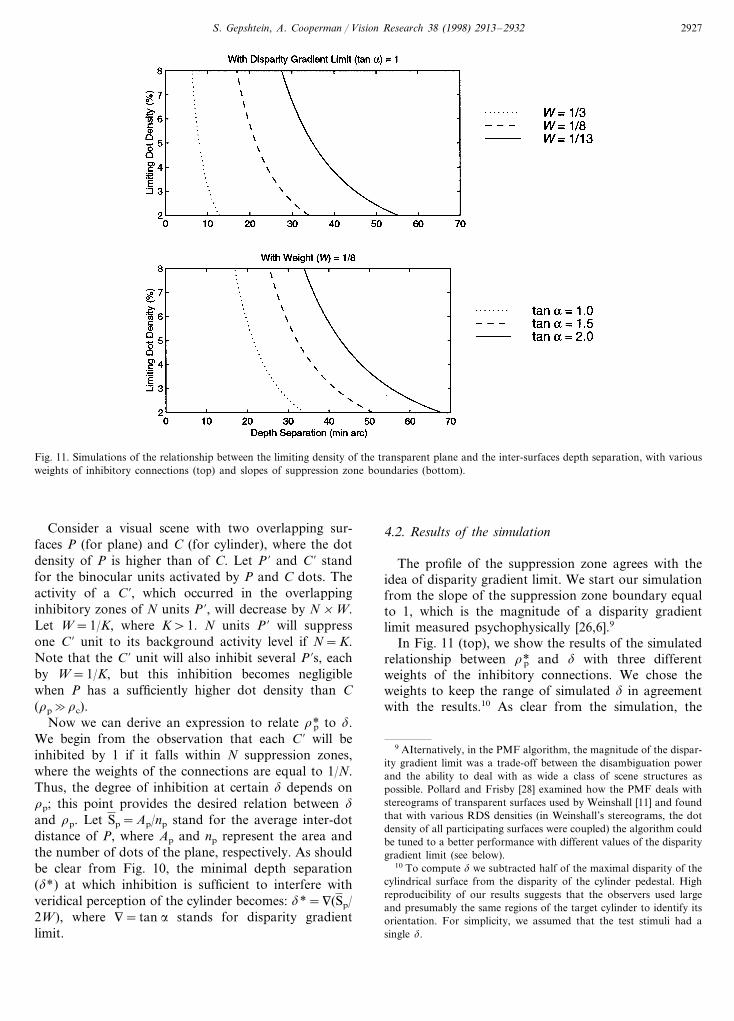
Fig. 11. Simulations of the relationship between the limiting density of the transparent plane and the inter-surfaces depth separation, with variousweights of inhibitory connections (top) and slopes of suppression zone boundaries (bottom).
Consider a visual scene with two overlapping sur-faces P (for plane) and C (for cylinder), where the dotdensity of P is higher than of C. Let P % and C % standfor the binocular units activated by P and C dots. Theactivity of a C %, which occurred in the overlappinginhibitory zones of N units P %, will decrease by N×W.Let W=1/K, where K\1. N units P % will suppressone C % unit to its background activity level if N=K.Note that the C % unit will also inhibit several P %s, eachby W=1/K, but this inhibition becomes negligiblewhen P has a sufficiently higher dot density than C(rp�rc).
Now we can derive an expression to relate r*p to d.We begin from the observation that each C % will beinhibited by 1 if it falls within N suppression zones,where the weights of the connections are equal to 1/N.Thus, the degree of inhibition at certain d depends onrp; this point provides the desired relation between d
and rp. Let Sp=Ap/np stand for the average inter-dotdistance of P, where Ap and np represent the area andthe number of dots of the plane, respectively. As shouldbe clear from Fig. 10, the minimal depth separation(d*) at which inhibition is sufficient to interfere withveridical perception of the cylinder becomes: d*=9(Sp/2W), where 9= tan a stands for disparity gradientlimit.
4.2. Results of the simulation
The profile of the suppression zone agrees with theidea of disparity gradient limit. We start our simulationfrom the slope of the suppression zone boundary equalto 1, which is the magnitude of a disparity gradientlimit measured psychophysically [26,6].9
In Fig. 11 (top), we show the results of the simulatedrelationship between r*p and d with three differentweights of the inhibitory connections. We chose theweights to keep the range of simulated d in agreementwith the results.10 As clear from the simulation, the
9 AIternatively, in the PMF algorithm, the magnitude of the dispar-ity gradient limit was a trade-off between the disambiguation powerand the ability to deal with as wide a class of scene structures aspossible. Pollard and Frisby [28] examined how the PMF deals withstereograms of transparent surfaces used by Weinshall [11] and foundthat with various RDS densities (in Weinshall’s stereograms, the dotdensity of all participating surfaces were coupled) the algorithm couldbe tuned to a better performance with different values of the disparitygradient limit (see below).
10 To compute d we subtracted half of the maximal disparity of thecylindrical surface from the disparity of the cylinder pedestal. Highreproducibility of our results suggests that the observers used largeand presumably the same regions of the target cylinder to identify itsorientation. For simplicity, we assumed that the test stimuli had asingle d.
S. Gepshtein, A. Cooperman / Vision Research 38 (1998) 2913–29322928
lower weights of inhibitory connections permit veridicalperception over larger ‘, i.e. lower weights facilitateresolution of transparency.
The effect of variable inhibitory weights may explainour findings in Experiment 4, where we showed that r*pis sensitive to the contrast of the transparent surface: Itis generally assumed that binocular units perform localcross-correlation at different locations in the binocularvisual field e.g. [27]. Accordingly, different contrasts ofbinocular objects activate binocular units to variousextents, which in turn may influence the contribution ofthese units to global disparity processing, i.e. by chang-ing either the weights of inhibitory connections orthe lateral extent of the suppression zones. Above,we have shown how the weights of inhibitory connec-tions affect performance. What about the slope of thesuppression zone boundary? Fig. 11 (bottom) illustratesthe simulated relationships between r*p and d withdifferent slopes of boundaries of the inhibitory zones:the steeper disparity gradient limit the broader therange of d at which transparency can be resolved.This conclusion is consistent with our expectations,because low disparity gradient limits strengthen smoothsurfaces and suppress perception of surfaces varyingrapidly in depth. Note that we used the magnitude oflimiting disparity gradient reported by Tyler [26] andBurt and Julesz [6] with respect to fusional limits.Limiting disparity gradient may be different in globalstereopsis, or the limiting value of the disparity gradientmay depend on the number of involved disparate stim-uli [28].
4.3. Discussion
So far, we have focused on the algorithms whichsolve the correspondence problem using the local crite-rion of disparity gradient. Another class of algorithms,based on the Bayesian approach, assumes that severalsmooth surfaces may exist in the same visual direction[29,30]. These algorithms compute and minimize the‘cost functions’, which weigh alternative solutions ofthe stimulus. Resolution of transparent surfaces is lim-ited by employing in the cost function a ‘line processfield’, which represents depth discontinuities, where dis-parity changes too abruptly. For example, in the globalalgorithm of Madarasmi et al. [30] the activity at eachdepth layer is weighed by the number of units activatedat that depth, a feature that may provide a link betweenthe dot densities of the participating surfaces and theability to resolve transparency. However, it is unclearwithout simulation whether the model will exhibitworse performance at larger d.
Another interesting approach to global stereopsis isthe stereo-matching neural network model of Marshallet al. [31]. The model incorporates ‘surface patch’binocular units which
� are sensitive to small pieces of surfaces (coherentgroups of close binocular disparities),
� project reciprocal excitatory connections to the first-stage binocular units.
Due to these back-projections, the model occupies anintermediate position on the local-to-global matchingscale. It would be very interesting to see how our resultscould be incorporated into the theories describedabove.
Global limitations may operate both at the level offeature-specific binocular matching and when these in-dividual reconstructions integrate. Our scheme may beapplied at both global stages, i.e. through parsimoniousrecurrent inputs. Alternatively, the further-worse effectmay be attributed only to a separate level of hyper-global integration, suggested in Experiment 3. In thiscase, binocular matching processes would proceed sepa-rately at each surface and be followed by a hyperglobalreconstruction process characterized by the farther-worse effect. Now, the participating surfaces have al-ready been ‘cleaned’ in earlier global computations andthe inhibitory interactions may serve to eliminate thespurious surfaces interpolated between those falsematches which survived at earlier levels (cf. the con-jugacy principle in [20]).
The inhibitory interactions at a separate level ofhyperglobal integration will bring to a ‘rarefication’ ofall participating surfaces, which is consistent with theknown parsimony and interpolating ability of vision,when a limited number of disparate elements is suffi-cient to produce a strong percept of a surface.
To summarize, we proposed a model of inhibitoryconnections between dissimilar disparities which maybe verified using physiological methods [10] and testedby extending the existing stereo-algorithms. Globalstereopsis also involves co-operative (excitatory) inter-actions between disparities satisfying the disparity gra-dient requirement (as in the PMF and Prazdny’salgorithms). Here, we have not addressed the excitatoryaspect of connectivity between binocular units to em-phasize that the existence of competitive interactions iscompatible with the perception of stereoscopictransparency.
5. Experiments 5–6
5.1. Experiment 5: linear relationship between limitingdensity and dot density of the rear surface
In discussion section of Experiment 1 we showed thatthe ordering constraint (OC) produces matching noisewhich hampers performance in a manner similar to ourfarther-worse effect. The OC hypothesis predicts thatdot density increment of either the transparent plane orthe target surface will hurt performance. On the other
S. Gepshtein, A. Cooperman / Vision Research 38 (1998) 2913–2932 2929
hand, our model of inhibitory connections betweendissimilar disparities predicts that performance will im-prove with higher dot densities of the target surface (rc):an increment of rc will cause a fraction of the rearsurface dots to fall into those locations in the disparitymap where the overlap between the suppression zones isnot sufficient for inhibition. As a result, the observerswill be able to identify cylinder orientation with higherlimiting densities of the transparent plane (r*p).
In the present experiment we pit the hypothesis ofcompetitive interactions against the OC hypothesis.
5.1.1. MethodWe kept d constant (28% arc for observer MP and 35%
arc for observer MZ) and measured r*p with various rc.The fixation pattern was presented at the depth of thecylinder pedestal (34% arc) for the observer MP, and atzero depth (the depth of the transparent plane of thefollowing test stimulus) for the observer MZ.
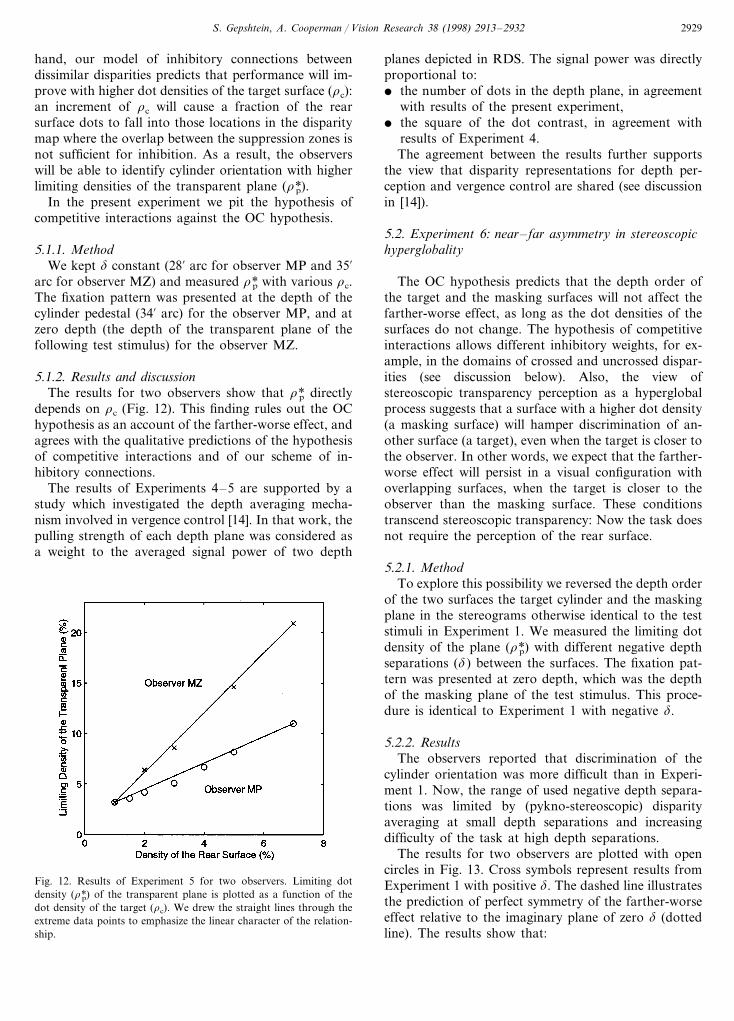
5.1.2. Results and discussionThe results for two observers show that r*p directly
depends on rc (Fig. 12). This finding rules out the OChypothesis as an account of the farther-worse effect, andagrees with the qualitative predictions of the hypothesisof competitive interactions and of our scheme of in-hibitory connections.
The results of Experiments 4–5 are supported by astudy which investigated the depth averaging mecha-nism involved in vergence control [14]. In that work, thepulling strength of each depth plane was considered asa weight to the averaged signal power of two depth
planes depicted in RDS. The signal power was directlyproportional to:� the number of dots in the depth plane, in agreement
with results of the present experiment,� the square of the dot contrast, in agreement with
results of Experiment 4.The agreement between the results further supports
the view that disparity representations for depth per-ception and vergence control are shared (see discussionin [14]).
5.2. Experiment 6: near– far asymmetry in stereoscopichyperglobality
The OC hypothesis predicts that the depth order ofthe target and the masking surfaces will not affect thefarther-worse effect, as long as the dot densities of thesurfaces do not change. The hypothesis of competitiveinteractions allows different inhibitory weights, for ex-ample, in the domains of crossed and uncrossed dispar-ities (see discussion below). Also, the view ofstereoscopic transparency perception as a hyperglobalprocess suggests that a surface with a higher dot density(a masking surface) will hamper discrimination of an-other surface (a target), even when the target is closer tothe observer. In other words, we expect that the farther-worse effect will persist in a visual configuration withoverlapping surfaces, when the target is closer to theobserver than the masking surface. These conditionstranscend stereoscopic transparency: Now the task doesnot require the perception of the rear surface.
5.2.1. MethodTo explore this possibility we reversed the depth order
of the two surfaces the target cylinder and the maskingplane in the stereograms otherwise identical to the teststimuli in Experiment 1. We measured the limiting dotdensity of the plane (r*p) with different negative depthseparations (d) between the surfaces. The fixation pat-tern was presented at zero depth, which was the depthof the masking plane of the test stimulus. This proce-dure is identical to Experiment 1 with negative d.
5.2.2. ResultsThe observers reported that discrimination of the
cylinder orientation was more difficult than in Experi-ment 1. Now, the range of used negative depth separa-tions was limited by (pykno-stereoscopic) disparityaveraging at small depth separations and increasingdifficulty of the task at high depth separations.
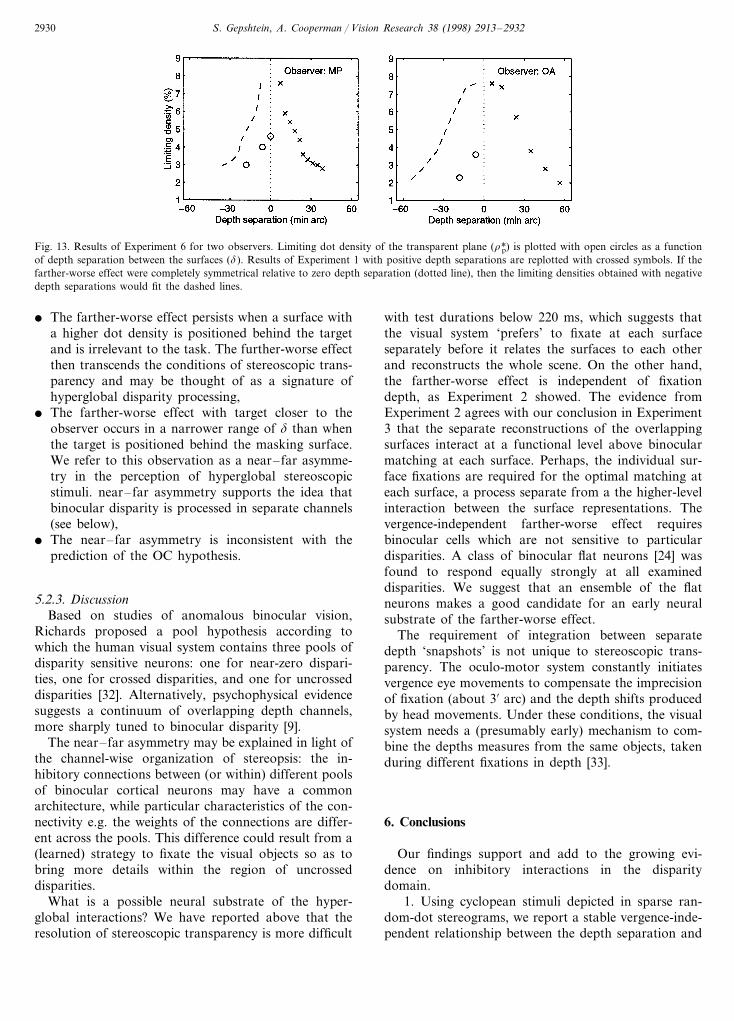
The results for two observers are plotted with opencircles in Fig. 13. Cross symbols represent results fromExperiment 1 with positive d. The dashed line illustratesthe prediction of perfect symmetry of the farther-worseeffect relative to the imaginary plane of zero d (dottedline). The results show that:
Fig. 12. Results of Experiment 5 for two observers. Limiting dotdensity (r*p) of the transparent plane is plotted as a function of thedot density of the target (rc). We drew the straight lines through theextreme data points to emphasize the linear character of the relation-ship.
S. Gepshtein, A. Cooperman / Vision Research 38 (1998) 2913–29322930
Fig. 13. Results of Experiment 6 for two observers. Limiting dot density of the transparent plane (r*p) is plotted with open circles as a functionof depth separation between the surfaces (d). Results of Experiment 1 with positive depth separations are replotted with crossed symbols. If thefarther-worse effect were completely symmetrical relative to zero depth separation (dotted line), then the limiting densities obtained with negativedepth separations would fit the dashed lines.
� The farther-worse effect persists when a surface witha higher dot density is positioned behind the targetand is irrelevant to the task. The further-worse effectthen transcends the conditions of stereoscopic trans-parency and may be thought of as a signature ofhyperglobal disparity processing,
� The farther-worse effect with target closer to theobserver occurs in a narrower range of d than whenthe target is positioned behind the masking surface.We refer to this observation as a near–far asymme-try in the perception of hyperglobal stereoscopicstimuli. near–far asymmetry supports the idea thatbinocular disparity is processed in separate channels(see below),
� The near–far asymmetry is inconsistent with theprediction of the OC hypothesis.
5.2.3. DiscussionBased on studies of anomalous binocular vision,
Richards proposed a pool hypothesis according towhich the human visual system contains three pools ofdisparity sensitive neurons: one for near-zero dispari-ties, one for crossed disparities, and one for uncrosseddisparities [32]. Alternatively, psychophysical evidencesuggests a continuum of overlapping depth channels,more sharply tuned to binocular disparity [9].
The near–far asymmetry may be explained in light ofthe channel-wise organization of stereopsis: the in-hibitory connections between (or within) different poolsof binocular cortical neurons may have a commonarchitecture, while particular characteristics of the con-nectivity e.g. the weights of the connections are differ-ent across the pools. This difference could result from a(learned) strategy to fixate the visual objects so as tobring more details within the region of uncrosseddisparities.
What is a possible neural substrate of the hyper-global interactions? We have reported above that theresolution of stereoscopic transparency is more difficult
with test durations below 220 ms, which suggests thatthe visual system ‘prefers’ to fixate at each surfaceseparately before it relates the surfaces to each otherand reconstructs the whole scene. On the other hand,the farther-worse effect is independent of fixationdepth, as Experiment 2 showed. The evidence fromExperiment 2 agrees with our conclusion in Experiment3 that the separate reconstructions of the overlappingsurfaces interact at a functional level above binocularmatching at each surface. Perhaps, the individual sur-face fixations are required for the optimal matching ateach surface, a process separate from a the higher-levelinteraction between the surface representations. Thevergence-independent farther-worse effect requiresbinocular cells which are not sensitive to particulardisparities. A class of binocular flat neurons [24] wasfound to respond equally strongly at all examineddisparities. We suggest that an ensemble of the flatneurons makes a good candidate for an early neuralsubstrate of the farther-worse effect.
The requirement of integration between separatedepth ‘snapshots’ is not unique to stereoscopic trans-parency. The oculo-motor system constantly initiatesvergence eye movements to compensate the imprecisionof fixation (about 3% arc) and the depth shifts producedby head movements. Under these conditions, the visualsystem needs a (presumably early) mechanism to com-bine the depths measures from the same objects, takenduring different fixations in depth [33].
6. Conclusions
Our findings support and add to the growing evi-dence on inhibitory interactions in the disparitydomain.
1. Using cyclopean stimuli depicted in sparse ran-dom-dot stereograms, we report a stable vergence-inde-pendent relationship between the depth separation and
S. Gepshtein, A. Cooperman / Vision Research 38 (1998) 2913–2932 2931
the dot density (farther-worse effect) of two overlap-ping surfaces, one of which is perceived as transparent(Experiments 1–2).
2. The farther-worse effect persists:1. when the elements of the participating surfaces are
of the opposite contrast polarities (Experiment 3),2. and in a purely hyperglobal task, where the target
surface was positioned in front of the suppressing(masking) surface (Experiment 6).3. The results with opposite contrast polarities (2a)
show that the basic phenomenon persists when binocu-lar matching at each surface is separated to indepen-dent neural sites in the visual pathway [17]. Thissuggests the independent processes of1. binocular matching at each surface,2. inter-surface suppressing interactions.
4. The sensitivity of the farther-worse effect toabsolute luminance difference between elements of par-ticipating surfaces is well approximated by a quadraticrelationship, which provides a link with the studiesaddressing the concept of signal strength in the dispar-ity domain [8,14].
5. The farther-worse effect cannot be accounted forby matching noise generated due to operation of eitherthe continuity or ordering constraint (Experiments 1–6).
6. We propose a scheme of inhibitory interactionsbetween (pools of) cortical binocular neurons thatis based on the concept of disparity gradient limit,which was first characterized psychophysically andfound to be computationally advantageous in re-solving stereoscopic transparency [4,5]. We simulateperformance of the scheme and find that it agreeswith psychophysical observations (Experiments 1–3–6).
7. Although based on competitive (inhibitory) inter-actions between dissimilar disparities, the scheme per-mits veridical perception of the scenes with overlappingsurfaces in the same visual direction.
Acknowledgements
We are grateful to Dov Sagi for his continuoussupport throughout the study, to Yoram Bonnehfor helpful advice on computer graphics, to MichaelKubovy for his substantial contribution to clarityof this article, and to two anonymous referees forproviding helpful comments about the manuscript.The research was supported in part by The Ministryof Science and Technology and The Ministry ofAbsorption of Israel to A.C., and the Feinberg Gradu-ate School of The Weizmann Institute of Science toS.G.
References
[1] Julesz B. Binocular depth perception of computer-generatedpatterns. Bell Syst Tech J 1960;39:1125–62.
[2] Marr D, Poggio T. Cooperative computation of stereo disparity.Science 1976;194:283–7.
[3] Grimson WEL. Computational experiments with a feature basedstereo algorithm. IEEE Trans Pattern Anal Mach Intell1985;1:17–34.
[4] Pollard SB, Mayhew JEW, Frisby JP. PMF: A stereo correspon-dence algorithm using a disparity gradient limit. Perception1985;14:449–70.
[5] Prazdny K. Detection of binocular disparities. Biol Cyber1985;52:93–9.
[6] Burt P, Julesz B. A disparity gradient limit for binocular fusion.Science 1980;208:615–7.
[7] Akerstrom RA, Todd JT. The perception of stereoscopic trans-parency. Percept Psychophys 1988;44:421–32.
[8] Cormack LK, Stevenson SB, Schor CM. Interocular correlation,luminance contrast and cyclopean processing. Vis Res1991;31:2195–207.
[9] Cormack LK, Stevenson SB, Schor CM. Disparity-tuned chan-nels of the human visual system. Vis Neurosci 1993;10:585–96.
[10] Poggio GF. Stereoscopic processing in monkey visual cortex: areview. In: Papathomas TV, Chubb C, Gorea A, Kowler E,editors. Early Vision and Beyond. Cambridge: MIT Press,1995:43–55.
[11] Weinshall D. Perception of multiple transparent depth planes instereo vision. Nature 1989;307:737–9.
[12] Weinshall D. Seeing ‘ghost’ planes in stereo vision. Vis Res1991;31:1731–48.
[13] Rashbass C, Westheimer G. Disjunctive eye movements. J Phys-iol 1961;159:339–60.
[14] Mallot HA, Roll A, Arndt PA. Disparity-evoked vergence isdirected towards average depth. Tech Rep 019, Max PlanckInstitut fur Biologische Kybernetik, Tubingen, Germany,(1995).
[15] Harris JM, Parker AJ. Efficiency of stereopsis in random-dotstereograms. J Optic Soc Am A 1992;9(1):14–24.
[16] Schiller PH. The on and off channels of the visual system.Trends Neurosci 1992;15:86–92.
[17] Harris JM, Parker AJ. Independent neural mechanisms forbright and dark information in binocular stereopsis. Nature1995;374:808–11.
[18] Erkelens CJ. Adaptation of ocular vergence to stimulation withlarge disparities. Exp Brain Res 1987;66:507–16.
[19] Erkelens CJ. Fusional limits for a large random-dot stereogram.Vis Res 1988;28:345–53.
[20] Tyler CW. Cyclopean vision. In: Regan D, editor. BinocularVision. London: Macmillian Press, 1991.
[21] Parker AJ, Yang Y. Spatial properties of disparity pooling inhuman stereo vision. Vis Res 1989;29:1525–38.
[22] Saye A, Frisby JP. The role of monocularly conspicuous featurein facilitating stereopsis from random-dot stereograms. Percep-tion 1975;4:159–71.
[23] Boring EG. The Physical Dimensions of Consciousness. NewYork: The Century Co., 1933.
[24] Poggio GF, Gonzalez F, Krause F. Stereoscopic mechanisms inmonkey visual cortex: binocular correlation and disparity selec-tivity. J Neurosci 1988;8:4531–50.
[25] Poggio GF. Physiological basis of stereoscopic vision. In: ReganD, editor. Binocular Vision. London: Macmillian Press, 1991.
[26] Tyler CW. Depth perception in disparity gratings. Nature1974;251:140–2.
[27] Tyler CW. Cyclopean riches: co-operativity, neurotropy, hys-teresis, stereoattention, hyperglobality, and hypercyclopean pro-cesses in random-dot stereopsis. In: Papathomas TV, Chubb C,
S. Gepshtein, A. Cooperman / Vision Research 38 (1998) 2913–29322932
Gorea A, Kowler E, editors. Early Vision and Beyond. Cam-bridge: MIT Press, 1995.
[28] Pollard SB, Frisby JP. Transparency and the uniqueness con-straint in human and computer stereo vision. Nature1990;347:553–6.
[29] Clark JJ, Yuille AL. Data Fusion for Sensory InformationProcessing Systems. Boston: Kluwer, 1990.
[30] Madarasmi S, Kersten D, Pong TC. The computation of stereodisparity for transparent and for opaque surfaces. In: Giles CL,Hanson SJ, Cowan JD, editors. Advances in Neural InformationProcessing Systems 5. San Mateo, CA: Morgan Kaufmann,1993.
[31] Marshall JA, Kalarickal GJ, Graves EB. Neural model of visualstereomatching: Slant, transparency, and clouds. Network: Com-putation in Neural Systems 1996;7:635–69.
[32] Richards W. Anomalous stereoscopic depth perception. J OpticSoc Am 1971;61:610–4.
[33] Collewijn H, Steinman RM, Erkelens CF, Regan D. Binocularfusion, stereopsis and stereoacuity with a moving head. In:Regan D, editor. Binocular Vision. London: Macmillian Press,1991.
[34] Anderson BL, Nakayama K. Toward a general theory ofstereopsis: binocular matching, occluding contours, and fusion.Psychol Rev 1994;101:414–45.
[35] Braddick O. Multiple matching in stereopsis.(1978) (Not pub-lished). Report of work supported by NSF grant No 77-07569-MCS to Richards W and Marr D.
[36] Cavanagh P. Pathways in early vision. In: Pylyshyn ZW, editor.Computational Processes in Human Vision. Norwood, NJ:Ablex, 1988.
[37] Churchland PS, Sejnowski TJ. The Computational Brain. Cam-bridge: MIT, 1993.
[38] Jones J, Malik J. Determining three-dimensional shape fromorientation and spatial frequency disparities. Proc ECCV, SantaMargherita Ligure, Italy, (1992) 661–9.
[39] Julesz B. Global stereopsis: co-operative phenomena in stereo-scopic depth perception. In: Held R, Leibowitz H, Teiber HL,editors. Handbook of Sensory Physiology, vol. VII. Berlin:Springer, 1978.
[40] Julesz B. Dialogues on Perception. Cambridge: MIT, 1995.[41] Marr D. Vision. New York: WH Freeman, 1982.[42] Metelli F. The perception of transparency. Sci Am 1974;230:91–
8.[43] Ramachandran VS, Anstis SM. Perception organization in mul-
tistable apparent motion. Perception 1985;14:135–43.[44] Wertheimer M. Principles of perceptual organization. (Originally
published in German, 1923.) In: Ellis WD, editor. A SourceBook of Gestalt Pschology. London, Routledge and Kegan Paul,1955.
.