Embed Size (px)
Citation preview
Copyright © 2018 ARM Limited or its affiliates. All rights reserved
STMicroelectronics Discovery STM32F4 Lab with ARM® Keil™ MDK toolkit www.keil.com/st
1
The latest version of this document is here: www.keil.com/appnotes/docs/apnt_230.asp For a CAN lab on the STM32F4 Discovery: www.keil.com/appnotes/docs/apnt_236.asp
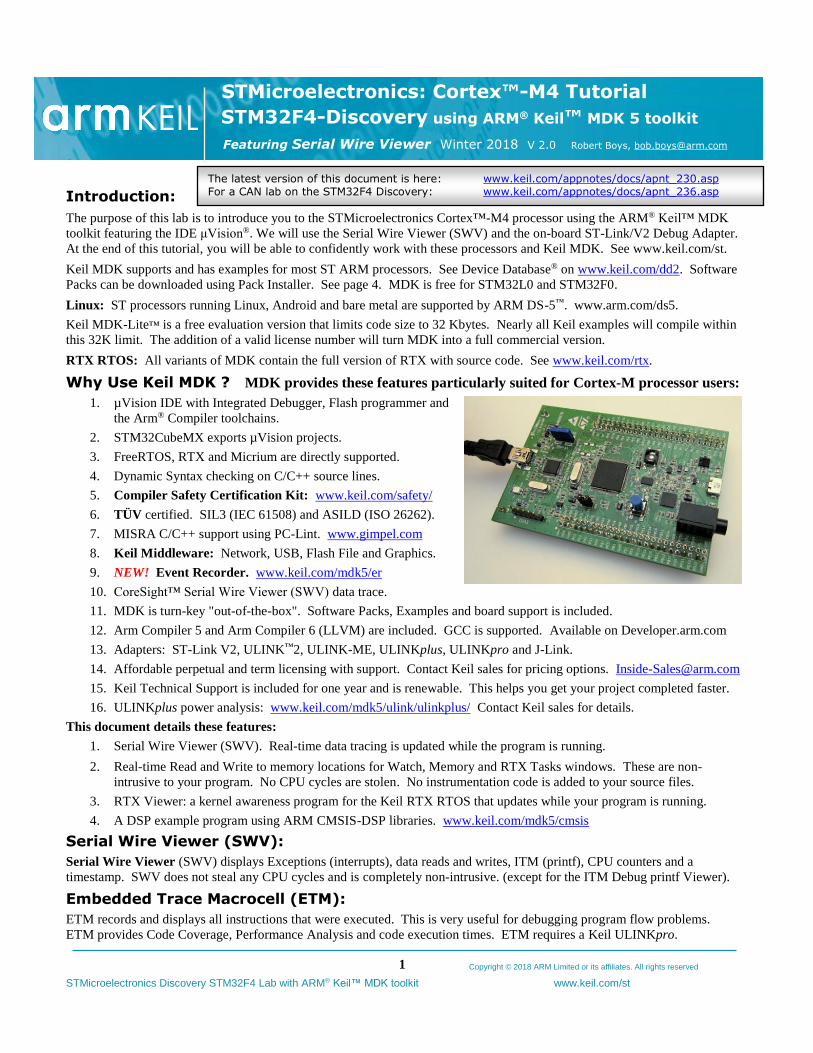
STMicroelectronics: Cortex™-M4 Tutorial
STM32F4-Discovery using ARM® Keil™ MDK 5 toolkit
Featuring Serial Wire Viewer Winter 2018 V 2.0 Robert Boys, [email protected]
Introduction:
The purpose of this lab is to introduce you to the STMicroelectronics Cortex™-M4 processor using the ARM® Keil™ MDK
toolkit featuring the IDE μVision®. We will use the Serial Wire Viewer (SWV) and the on-board ST-Link/V2 Debug Adapter.
At the end of this tutorial, you will be able to confidently work with these processors and Keil MDK. See www.keil.com/st.
Keil MDK supports and has examples for most ST ARM processors. See Device Database® on www.keil.com/dd2. Software
Packs can be downloaded using Pack Installer. See page 4. MDK is free for STM32L0 and STM32F0.
Linux: ST processors running Linux, Android and bare metal are supported by ARM DS-5™. www.arm.com/ds5.
Keil MDK-Lite™ is a free evaluation version that limits code size to 32 Kbytes. Nearly all Keil examples will compile within
this 32K limit. The addition of a valid license number will turn MDK into a full commercial version.
RTX RTOS: All variants of MDK contain the full version of RTX with source code. See www.keil.com/rtx.
Why Use Keil MDK ? MDK provides these features particularly suited for Cortex-M processor users:
1. µVision IDE with Integrated Debugger, Flash programmer and
the Arm® Compiler toolchains.
2. STM32CubeMX exports µVision projects.
3. FreeRTOS, RTX and Micrium are directly supported.
4. Dynamic Syntax checking on C/C++ source lines.
5. Compiler Safety Certification Kit: www.keil.com/safety/
6. TÜV certified. SIL3 (IEC 61508) and ASILD (ISO 26262).
7. MISRA C/C++ support using PC-Lint. www.gimpel.com
8. Keil Middleware: Network, USB, Flash File and Graphics.
9. NEW! Event Recorder. www.keil.com/mdk5/er
10. CoreSight™ Serial Wire Viewer (SWV) data trace.
11. MDK is turn-key "out-of-the-box". Software Packs, Examples and board support is included.
12. Arm Compiler 5 and Arm Compiler 6 (LLVM) are included. GCC is supported. Available on Developer.arm.com
13. Adapters: ST-Link V2, ULINK™2, ULINK-ME, ULINKplus, ULINKpro and J-Link.
14. Affordable perpetual and term licensing with support. Contact Keil sales for pricing options. [email protected]
15. Keil Technical Support is included for one year and is renewable. This helps you get your project completed faster.
16. ULINKplus power analysis: www.keil.com/mdk5/ulink/ulinkplus/ Contact Keil sales for details.
This document details these features:
1. Serial Wire Viewer (SWV). Real-time data tracing is updated while the program is running.
2. Real-time Read and Write to memory locations for Watch, Memory and RTX Tasks windows. These are non-
intrusive to your program. No CPU cycles are stolen. No instrumentation code is added to your source files.
3. RTX Viewer: a kernel awareness program for the Keil RTX RTOS that updates while your program is running.
4. A DSP example program using ARM CMSIS-DSP libraries. www.keil.com/mdk5/cmsis
Serial Wire Viewer (SWV):
Serial Wire Viewer (SWV) displays Exceptions (interrupts), data reads and writes, ITM (printf), CPU counters and a
timestamp. SWV does not steal any CPU cycles and is completely non-intrusive. (except for the ITM Debug printf Viewer).
Embedded Trace Macrocell (ETM):
ETM records and displays all instructions that were executed. This is very useful for debugging program flow problems.
ETM provides Code Coverage, Performance Analysis and code execution times. ETM requires a Keil ULINKpro.
Copyright © 2018 ARM Limited or its affiliates. All rights reserved
STMicroelectronics Discovery STM32F4 Lab with ARM® Keil™ MDK toolkit www.keil.com/st
2
1. Keil Evaluation Software: MDK 5.25: 3
2. Keil Software Download and Installation: 3
3. The On-board ST-Link/V2 Debug Adapter: 3
4. ETM Instruction Trace: 3
5. Example Programs 3
6. ST Evaluation Boards: 3
7. µVision Software Packs Download and Install Process: 4
8. Software Packs Version Select and Manage Run-Time Environment (MRTE) 5
• Select Software Packs, MRTE and Updating CMSIS Source Files.
9. CoreSight Definitions: 7
10. Testing the ST-Link/V2 Connection: 8
11. Installing the ST-Link USB Drivers: 8
12. Blinky_no_rtos example using the STM32F4 Discovery board: 9
13. Hardware Breakpoints: 9
14. Call Stack & Locals window: 10
15. Watch and Memory windows and how to use them: 11
16. Peripherals: System Viewer (SV) 12
17. View Variables Graphically with the Logic Analyzer (LA): 13
18. Watchpoints: Conditional Breakpoints (Access Breakpoints) 14
19. printf using ITM 0: 15
20. NEW ! Event Recorder: 16
21. NEW ! Power Measurement using Keil ULINKplus: 17
22. Blinky RTX example: Keil RTX RTOS: 18
23. RTX Kernel Awareness using RTX Viewers: 19
24. DSP Sine Example using ARM CMSIS-DSP Libraries: 20
25. Creating your own µVision Project from scratch: 21
26. Adding RTX to your Project: 27
27. Adding a Thread to your RTX Project: 28
28. ETM Instruction Trace Examples: for reference 29
• Code Coverage, Performance Analysis, Execution Profile, In-the-Weeds
29. Serial Wire Viewer and ETM summary: 34
30. Document Resources: 35
31. Keil Products and contact information: 36
Notes on using this document:
1. The latest version of this document and the necessary example source files are available here:
www.keil.com/appnotes/docs/apnt_230.asp
2. MDK 5.25 was used in the exercises in this document. www.keil.com/mdk5/525 MDK 4.24a can be used.
3. To use MDK 4.7x, see www.keil.com/appnotes/docs/apnt_261.asp
4. This tutorial can be adapted for many STM32 boards. Board Support Packages are supplied in the Software Packs.
5. The on-board ST-Link/V2 is used by default in this document. All you need install is the USB driver to your PC.
6. The ST-Link/V2 interfaces very well with Keil µVision and its performance is quite good including SWV.
Copyright © 2018 ARM Limited or its affiliates. All rights reserved
STMicroelectronics Discovery STM32F4 Lab with ARM® Keil™ MDK toolkit www.keil.com/st
3
1) Keil Evaluation Software: MDK 5.25 or later: MDK 5.24a will also work.
MDK 5 uses Software Packs to distribute processor specific software, examples and middleware. MDK 5 is installed and the
Packs you need are downloaded from the web. They can also be imported manually. You can create your own Packs.
Keil has several labs for various STM32 processors including one using CAN. See www.keil.com/st for details.
** Using ST-Link/V2: www.keil.com/appnotes/docs/apnt_286.asp
** Getting Started MDK 5: Obtain this useful book here: www.keil.com/mdk5/.
2) Keil Software Download and Installation:
1. Download MDK 5.24a or 5.25 or later. www.keil.com/mdk5/install or www.keil.com/mdk5/525
2. Install MDK into the default folder. You can install into any folder, but this tutorial uses the default C:\Keil_v5
3. We recommend you use the default directories for this tutorial. We will use C:\00MDK\ for the examples.
4. If you install MDK or the examples into a different folder, you will have to adjust for the folder differences.
7. The examples DSP and Blinky_no_rtos are available on the web where you got this document.
8. You can use the evaluation version (MDK-Lite) for this lab. No license is needed.
9. You do not need any debug adapters: just the Discovery board, a USB cable and MDK 5 installed on your PC.
3) The on-board ST-Link/V2 Debug Adapter:
The on-board ST-Link/V2 is used exclusively in this lab. Instructions on configuring the ST-Link/V2 are given on page 8. A
simple test for the ST-Link/V2 drivers is included.
4) Embedded Trace Macrocell (ETM): Instruction Trace:
ETM records and displays all instructions that were executed. This is very useful for debugging program flow problems such
as “going into the weeds” and “how did I get here?”. Keil µVision uses ETM to provide Code Coverage, Performance
Analysis and code execution times. ETM requires a debug adapter such as the ULINKpro and a 20 pin ETM connector.
The ST Discovery and Nucleo boards lack the standard ARM debugger connections. This means it is not easy to connect a
ULINK2, ULINKpro or J-Link to these boards. In order to use features like ETM trace, it is easier to obtain a board such as
the Keil MCBSTM32 series or a STM32xxx-EVAL board. Versions are available with Cortex-M3, M4 and M7 processors.
5) Example Programs:
The MDK 5 Software Pack contains a Blinky example using Keil RTX. Blinky without RTX and a DSP example are
available on the web where the latest version of this document is stored: www.keil.com/appnotes/docs/apnt_230.asp.
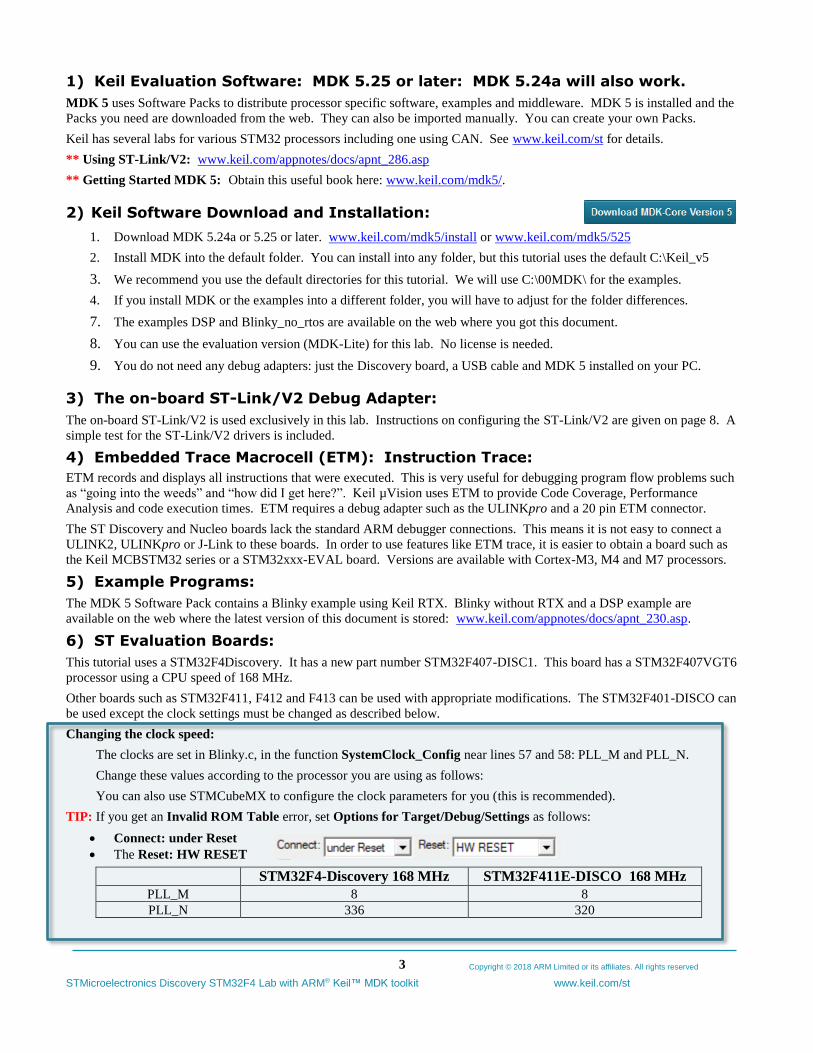
6) ST Evaluation Boards:
This tutorial uses a STM32F4Discovery. It has a new part number STM32F407-DISC1. This board has a STM32F407VGT6
processor using a CPU speed of 168 MHz.
Other boards such as STM32F411, F412 and F413 can be used with appropriate modifications. The STM32F401-DISCO can
be used except the clock settings must be changed as described below.
Changing the clock speed:
The clocks are set in Blinky.c, in the function SystemClock_Config near lines 57 and 58: PLL_M and PLL_N.
Change these values according to the processor you are using as follows:
You can also use STMCubeMX to configure the clock parameters for you (this is recommended).
TIP: If you get an Invalid ROM Table error, set Options for Target/Debug/Settings as follows:
• Connect: under Reset
• The Reset: HW RESET
STM32F4-Discovery 168 MHz STM32F411E-DISCO 168 MHz PLL_M 8 8
PLL_N 336 320
Copyright © 2018 ARM Limited or its affiliates. All rights reserved
STMicroelectronics Discovery STM32F4 Lab with ARM® Keil™ MDK toolkit www.keil.com/st
4
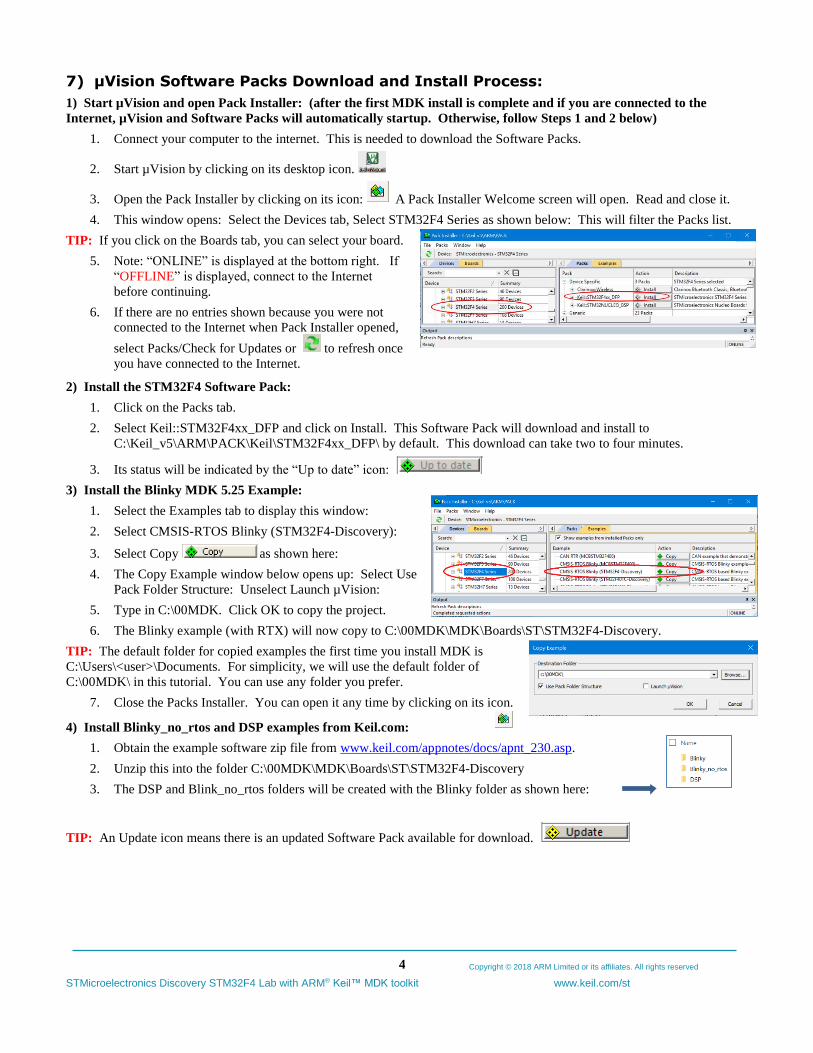
7) µVision Software Packs Download and Install Process:
1) Start µVision and open Pack Installer: (after the first MDK install is complete and if you are connected to the
Internet, µVision and Software Packs will automatically startup. Otherwise, follow Steps 1 and 2 below)
1. Connect your computer to the internet. This is needed to download the Software Packs.
2. Start µVision by clicking on its desktop icon.
3. Open the Pack Installer by clicking on its icon: A Pack Installer Welcome screen will open. Read and close it.
4. This window opens: Select the Devices tab, Select STM32F4 Series as shown below: This will filter the Packs list.
TIP: If you click on the Boards tab, you can select your board.
5. Note: “ONLINE” is displayed at the bottom right. If
“OFFLINE” is displayed, connect to the Internet
before continuing.
6. If there are no entries shown because you were not
connected to the Internet when Pack Installer opened,
select Packs/Check for Updates or to refresh once
you have connected to the Internet.
2) Install the STM32F4 Software Pack:
1. Click on the Packs tab.
2. Select Keil::STM32F4xx_DFP and click on Install. This Software Pack will download and install to
C:\Keil_v5\ARM\PACK\Keil\STM32F4xx_DFP\ by default. This download can take two to four minutes.
3. Its status will be indicated by the “Up to date” icon:
3) Install the Blinky MDK 5.25 Example:
1. Select the Examples tab to display this window:
2. Select CMSIS-RTOS Blinky (STM32F4-Discovery):
3. Select Copy as shown here:
4. The Copy Example window below opens up: Select Use
Pack Folder Structure: Unselect Launch µVision:
5. Type in C:\00MDK. Click OK to copy the project.
6. The Blinky example (with RTX) will now copy to C:\00MDK\MDK\Boards\ST\STM32F4-Discovery.
TIP: The default folder for copied examples the first time you install MDK is
C:\Users\<user>\Documents. For simplicity, we will use the default folder of
C:\00MDK\ in this tutorial. You can use any folder you prefer.
7. Close the Packs Installer. You can open it any time by clicking on its icon.
4) Install Blinky_no_rtos and DSP examples from Keil.com:
1. Obtain the example software zip file from www.keil.com/appnotes/docs/apnt_230.asp.
2. Unzip this into the folder C:\00MDK\MDK\Boards\ST\STM32F4-Discovery
3. The DSP and Blink_no_rtos folders will be created with the Blinky folder as shown here:
TIP: An Update icon means there is an updated Software Pack available for download.
Copyright © 2018 ARM Limited or its affiliates. All rights reserved
STMicroelectronics Discovery STM32F4 Lab with ARM® Keil™ MDK toolkit www.keil.com/st
5
8) Software Pack Version Selection and Manage Run-Time Environment:
This section contains three parts on this and the next page:
A) Select Software Pack Version:
B) Manage Run-Time Environment:
C) Updating Source Files:
A) Select Software Pack Version: this section is provided for reference:
This µVision utility provides the ability to choose various Software Pack versions installed in your computer. You can select
the versions you want to use. You must have µVision running and any project open for the following exercises:
1. Select Project/Open Project and navigate to C:\00MDK\Boards\Freescale\TWR-K64F120M\Blinky.
2. Open Blinky.uvprojx. Blinky will load into µVision.
3. Open Select Software Packs by clicking on its icon:
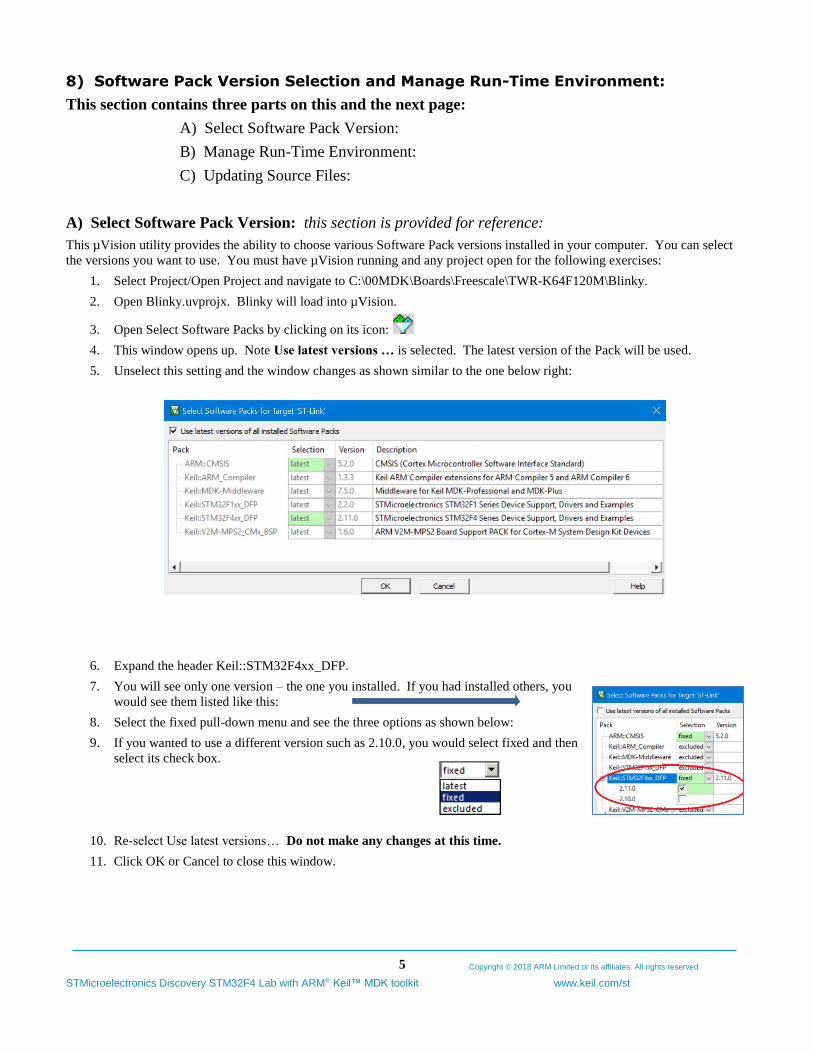
4. This window opens up. Note Use latest versions … is selected. The latest version of the Pack will be used.
5. Unselect this setting and the window changes as shown similar to the one below right:
6. Expand the header Keil::STM32F4xx_DFP.
7. You will see only one version – the one you installed. If you had installed others, you
would see them listed like this:
8. Select the fixed pull-down menu and see the three options as shown below:
9. If you wanted to use a different version such as 2.10.0, you would select fixed and then
select its check box.
10. Re-select Use latest versions… Do not make any changes at this time.
11. Click OK or Cancel to close this window.
Copyright © 2018 ARM Limited or its affiliates. All rights reserved
STMicroelectronics Discovery STM32F4 Lab with ARM® Keil™ MDK toolkit www.keil.com/st
6
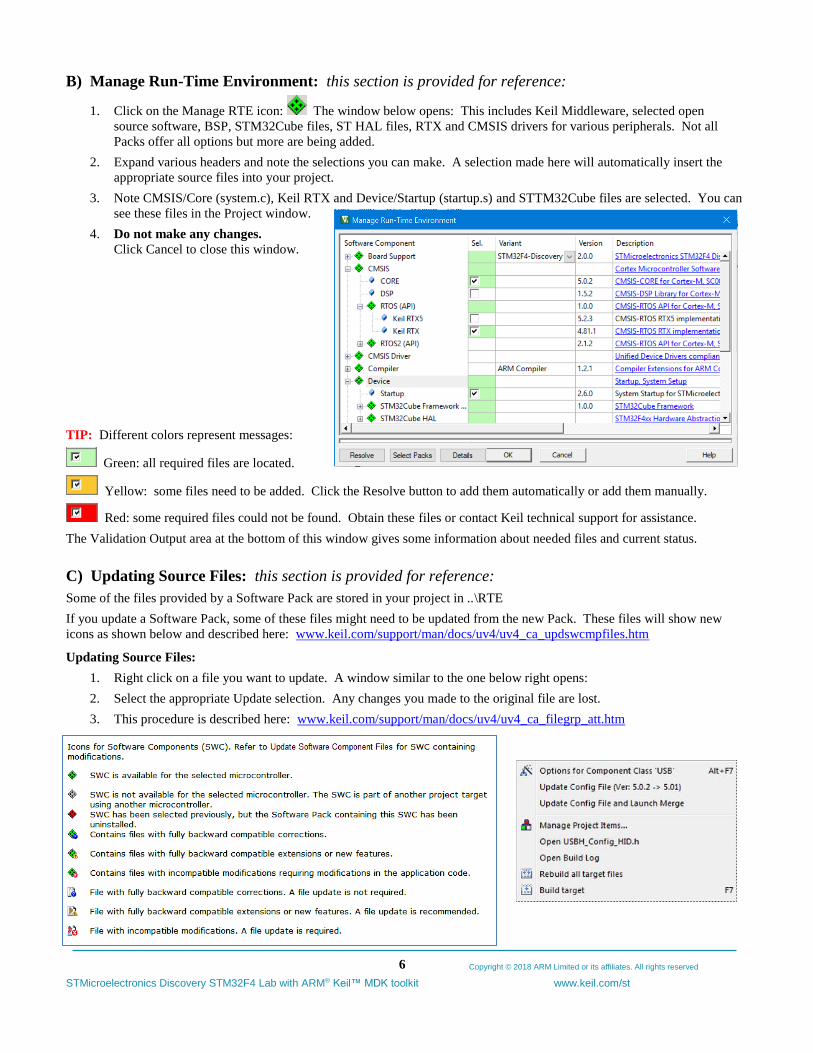
B) Manage Run-Time Environment: this section is provided for reference:
1. Click on the Manage RTE icon: The window below opens: This includes Keil Middleware, selected open
source software, BSP, STM32Cube files, ST HAL files, RTX and CMSIS drivers for various peripherals. Not all
Packs offer all options but more are being added.
2. Expand various headers and note the selections you can make. A selection made here will automatically insert the
appropriate source files into your project.
3. Note CMSIS/Core (system.c), Keil RTX and Device/Startup (startup.s) and STTM32Cube files are selected. You can
see these files in the Project window.
4. Do not make any changes.
Click Cancel to close this window.
TIP: Different colors represent messages:
Green: all required files are located.
Yellow: some files need to be added. Click the Resolve button to add them automatically or add them manually.
Red: some required files could not be found. Obtain these files or contact Keil technical support for assistance.
The Validation Output area at the bottom of this window gives some information about needed files and current status.
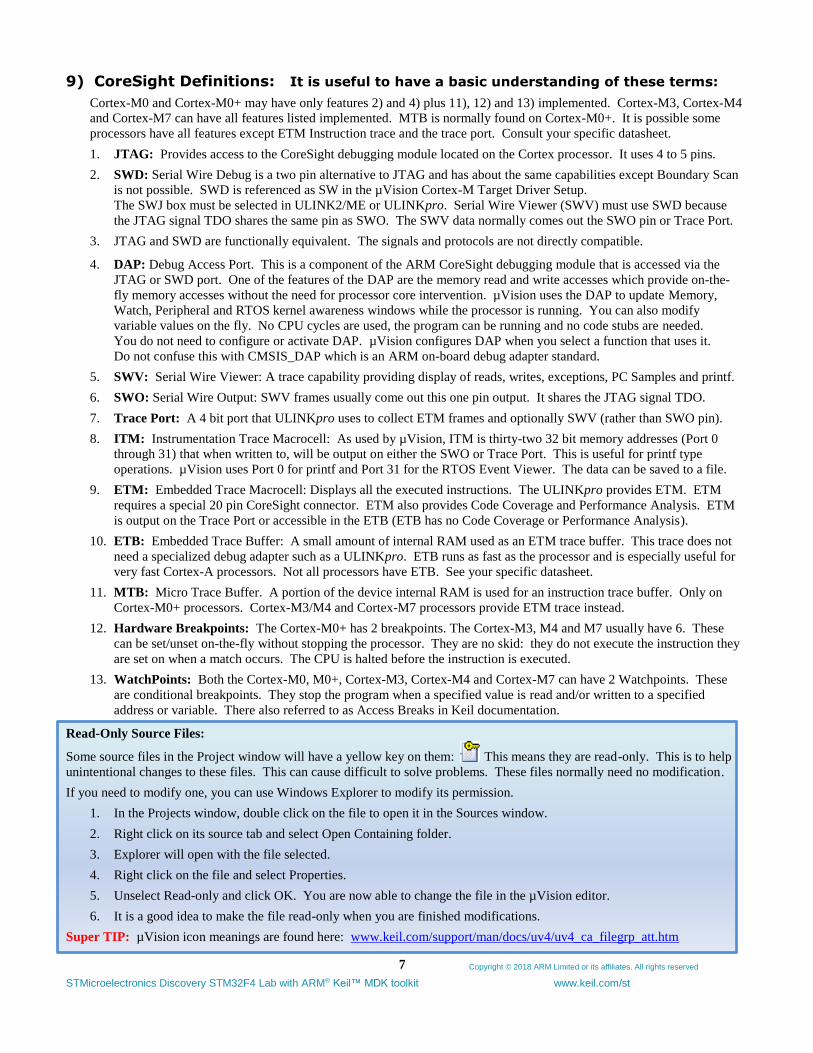
C) Updating Source Files: this section is provided for reference:
Some of the files provided by a Software Pack are stored in your project in ..\RTE
If you update a Software Pack, some of these files might need to be updated from the new Pack. These files will show new
icons as shown below and described here: www.keil.com/support/man/docs/uv4/uv4_ca_updswcmpfiles.htm
Updating Source Files:
1. Right click on a file you want to update. A window similar to the one below right opens:
2. Select the appropriate Update selection. Any changes you made to the original file are lost.
3. This procedure is described here: www.keil.com/support/man/docs/uv4/uv4_ca_filegrp_att.htm
Copyright © 2018 ARM Limited or its affiliates. All rights reserved
STMicroelectronics Discovery STM32F4 Lab with ARM® Keil™ MDK toolkit www.keil.com/st
7
9) CoreSight Definitions: It is useful to have a basic understanding of these terms:
Cortex-M0 and Cortex-M0+ may have only features 2) and 4) plus 11), 12) and 13) implemented. Cortex-M3, Cortex-M4
and Cortex-M7 can have all features listed implemented. MTB is normally found on Cortex-M0+. It is possible some
processors have all features except ETM Instruction trace and the trace port. Consult your specific datasheet.
1. JTAG: Provides access to the CoreSight debugging module located on the Cortex processor. It uses 4 to 5 pins.
2. SWD: Serial Wire Debug is a two pin alternative to JTAG and has about the same capabilities except Boundary Scan
is not possible. SWD is referenced as SW in the µVision Cortex-M Target Driver Setup.
The SWJ box must be selected in ULINK2/ME or ULINKpro. Serial Wire Viewer (SWV) must use SWD because
the JTAG signal TDO shares the same pin as SWO. The SWV data normally comes out the SWO pin or Trace Port.
3. JTAG and SWD are functionally equivalent. The signals and protocols are not directly compatible.
4. DAP: Debug Access Port. This is a component of the ARM CoreSight debugging module that is accessed via the
JTAG or SWD port. One of the features of the DAP are the memory read and write accesses which provide on-the-
fly memory accesses without the need for processor core intervention. µVision uses the DAP to update Memory,
Watch, Peripheral and RTOS kernel awareness windows while the processor is running. You can also modify
variable values on the fly. No CPU cycles are used, the program can be running and no code stubs are needed.
You do not need to configure or activate DAP. µVision configures DAP when you select a function that uses it.
Do not confuse this with CMSIS_DAP which is an ARM on-board debug adapter standard.
5. SWV: Serial Wire Viewer: A trace capability providing display of reads, writes, exceptions, PC Samples and printf.
6. SWO: Serial Wire Output: SWV frames usually come out this one pin output. It shares the JTAG signal TDO.
7. Trace Port: A 4 bit port that ULINKpro uses to collect ETM frames and optionally SWV (rather than SWO pin).
8. ITM: Instrumentation Trace Macrocell: As used by µVision, ITM is thirty-two 32 bit memory addresses (Port 0
through 31) that when written to, will be output on either the SWO or Trace Port. This is useful for printf type
operations. µVision uses Port 0 for printf and Port 31 for the RTOS Event Viewer. The data can be saved to a file.
9. ETM: Embedded Trace Macrocell: Displays all the executed instructions. The ULINKpro provides ETM. ETM
requires a special 20 pin CoreSight connector. ETM also provides Code Coverage and Performance Analysis. ETM
is output on the Trace Port or accessible in the ETB (ETB has no Code Coverage or Performance Analysis).
10. ETB: Embedded Trace Buffer: A small amount of internal RAM used as an ETM trace buffer. This trace does not
need a specialized debug adapter such as a ULINKpro. ETB runs as fast as the processor and is especially useful for
very fast Cortex-A processors. Not all processors have ETB. See your specific datasheet.
11. MTB: Micro Trace Buffer. A portion of the device internal RAM is used for an instruction trace buffer. Only on
Cortex-M0+ processors. Cortex-M3/M4 and Cortex-M7 processors provide ETM trace instead.
12. Hardware Breakpoints: The Cortex-M0+ has 2 breakpoints. The Cortex-M3, M4 and M7 usually have 6. These
can be set/unset on-the-fly without stopping the processor. They are no skid: they do not execute the instruction they
are set on when a match occurs. The CPU is halted before the instruction is executed.
13. WatchPoints: Both the Cortex-M0, M0+, Cortex-M3, Cortex-M4 and Cortex-M7 can have 2 Watchpoints. These
are conditional breakpoints. They stop the program when a specified value is read and/or written to a specified
address or variable. There also referred to as Access Breaks in Keil documentation.
Read-Only Source Files:
Some source files in the Project window will have a yellow key on them: This means they are read-only. This is to help
unintentional changes to these files. This can cause difficult to solve problems. These files normally need no modification.
If you need to modify one, you can use Windows Explorer to modify its permission.
1. In the Projects window, double click on the file to open it in the Sources window.
2. Right click on its source tab and select Open Containing folder.
3. Explorer will open with the file selected.
4. Right click on the file and select Properties.
5. Unselect Read-only and click OK. You are now able to change the file in the µVision editor.
6. It is a good idea to make the file read-only when you are finished modifications.
Super TIP: µVision icon meanings are found here: www.keil.com/support/man/docs/uv4/uv4_ca_filegrp_att.htm
Copyright © 2018 ARM Limited or its affiliates. All rights reserved
STMicroelectronics Discovery STM32F4 Lab with ARM® Keil™ MDK toolkit www.keil.com/st
8
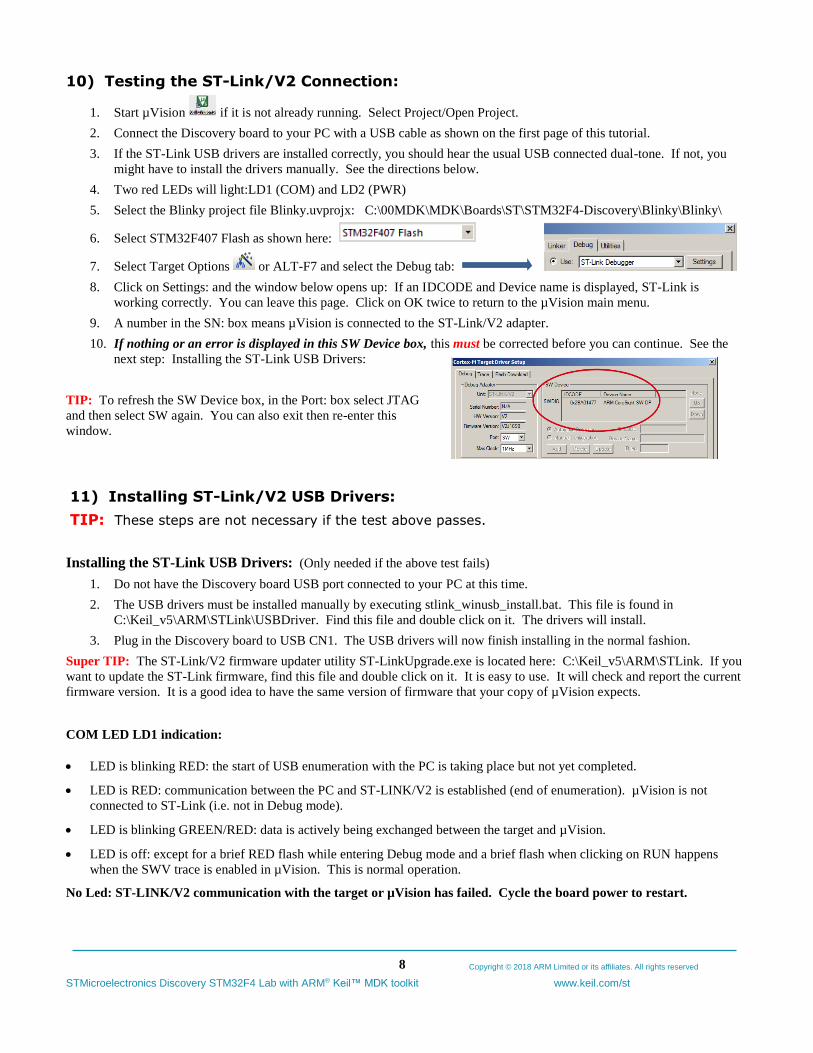
10) Testing the ST-Link/V2 Connection:
1. Start µVision if it is not already running. Select Project/Open Project.
2. Connect the Discovery board to your PC with a USB cable as shown on the first page of this tutorial.
3. If the ST-Link USB drivers are installed correctly, you should hear the usual USB connected dual-tone. If not, you
might have to install the drivers manually. See the directions below.
4. Two red LEDs will light:LD1 (COM) and LD2 (PWR)
5. Select the Blinky project file Blinky.uvprojx: C:\00MDK\MDK\Boards\ST\STM32F4-Discovery\Blinky\Blinky\
6. Select STM32F407 Flash as shown here:
7. Select Target Options or ALT-F7 and select the Debug tab:
8. Click on Settings: and the window below opens up: If an IDCODE and Device name is displayed, ST-Link is
working correctly. You can leave this page. Click on OK twice to return to the µVision main menu.
9. A number in the SN: box means µVision is connected to the ST-Link/V2 adapter.
10. If nothing or an error is displayed in this SW Device box, this must be corrected before you can continue. See the
next step: Installing the ST-Link USB Drivers:
TIP: To refresh the SW Device box, in the Port: box select JTAG
and then select SW again. You can also exit then re-enter this
window.
11) Installing ST-Link/V2 USB Drivers:
TIP: These steps are not necessary if the test above passes.
Installing the ST-Link USB Drivers: (Only needed if the above test fails)
1. Do not have the Discovery board USB port connected to your PC at this time.
2. The USB drivers must be installed manually by executing stlink_winusb_install.bat. This file is found in
C:\Keil_v5\ARM\STLink\USBDriver. Find this file and double click on it. The drivers will install.
3. Plug in the Discovery board to USB CN1. The USB drivers will now finish installing in the normal fashion.
Super TIP: The ST-Link/V2 firmware updater utility ST-LinkUpgrade.exe is located here: C:\Keil_v5\ARM\STLink. If you
want to update the ST-Link firmware, find this file and double click on it. It is easy to use. It will check and report the current
firmware version. It is a good idea to have the same version of firmware that your copy of µVision expects.
COM LED LD1 indication:
• LED is blinking RED: the start of USB enumeration with the PC is taking place but not yet completed.
• LED is RED: communication between the PC and ST-LINK/V2 is established (end of enumeration). µVision is not
connected to ST-Link (i.e. not in Debug mode).
• LED is blinking GREEN/RED: data is actively being exchanged between the target and µVision.
• LED is off: except for a brief RED flash while entering Debug mode and a brief flash when clicking on RUN happens
when the SWV trace is enabled in µVision. This is normal operation.
No Led: ST-LINK/V2 communication with the target or µVision has failed. Cycle the board power to restart.
Copyright © 2018 ARM Limited or its affiliates. All rights reserved
STMicroelectronics Discovery STM32F4 Lab with ARM® Keil™ MDK toolkit www.keil.com/st
9
12) Blinky_no_rtos example program using the STM32F4 Discovery board:
We will connect a Keil MDK development system using real target hardware using the built-in ST-Link/V2 debug adapter.
1. Start µVision by clicking on its desktop icon. Connect your PC to the board with a USB cable to CN1.
2. Select Project/Open Project. Open Blinky.uvprojx found in:
C:\00MDK\MDK\Boards\ST\STM32F4-Discovery\Blinky_no_rtos\
3. By default, the ST-Link is selected. If this is the first time you have run µVision and the Discovery board, you might
have to install the USB drivers. See the configuration instructions on the previous page.
4. Compile the source files by clicking on the Rebuild icon. . You can also use the Build icon beside it.
5. Enter Debug mode by clicking on the Debug icon. Select OK if the Evaluation Mode box appears.
The Flash will be programmed. Progress will be indicated in the Output Window.
6. Click on the RUN icon. Note: you can stop the program with the STOP icon.
The 4 LEDs on the STM32F4 Discovery board will now blink in succession.
Press the blue USER button and they will go out.
Now you know how to compile a program, program it into the STM32 processor Flash, run it and stop it !
Note: The board will now run Blinky stand-alone. Blinky is now permanently programmed in the Flash until reprogrammed.
13) Hardware Breakpoints:
The STM32F4 has six hardware breakpoints that can be set or unset on the fly while the program is running.
1. With Blinky running, in the Blinky.c window, click on a darker grey block in the left margin on a line in main() in the
while loop. Anywhere in the while(1) loop will suffice.
2. A red circle will appear and the program will soon stop.
3. Note the breakpoint is displayed in both the Disassembly and source windows as shown below:
4. You can set a breakpoint in either the Disassembly or Source windows as long there is a gray rectangle indicating the
existence of an assembly instruction at that point.
5. Every time you click on the RUN icon the program will run until the breakpoint is again encountered.
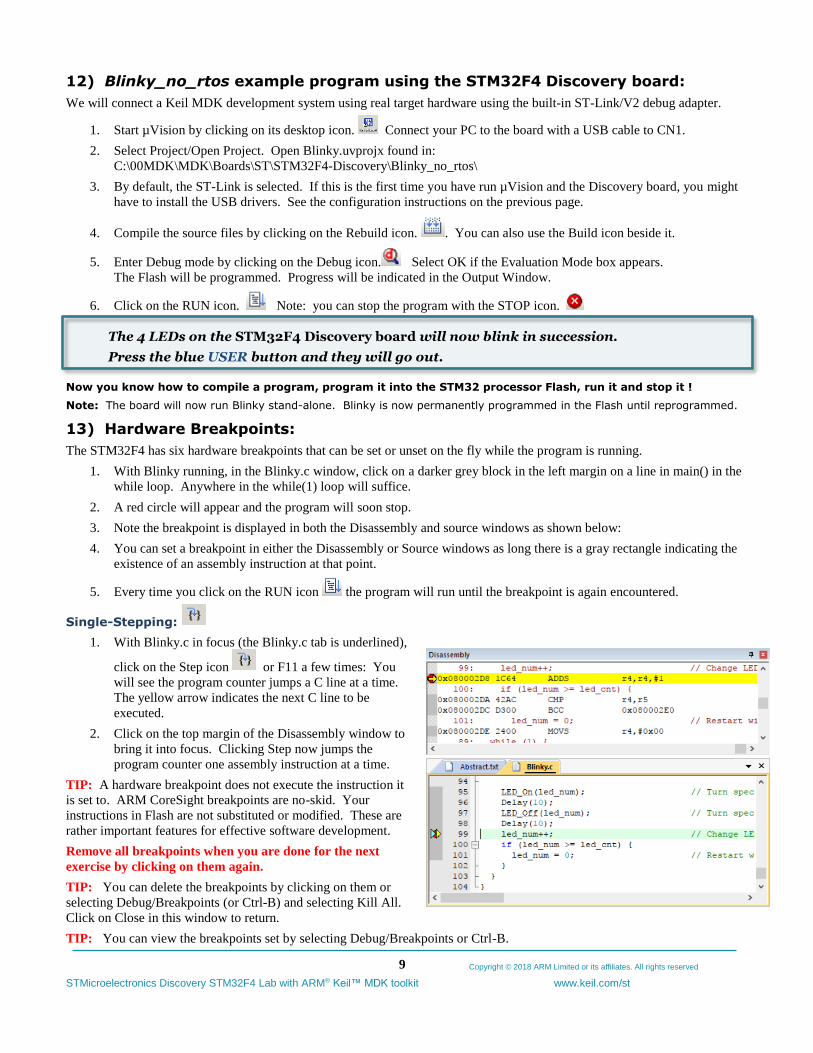
Single-Stepping:
1. With Blinky.c in focus (the Blinky.c tab is underlined),
click on the Step icon or F11 a few times: You
will see the program counter jumps a C line at a time.
The yellow arrow indicates the next C line to be
executed.
2. Click on the top margin of the Disassembly window to
bring it into focus. Clicking Step now jumps the
program counter one assembly instruction at a time.
TIP: A hardware breakpoint does not execute the instruction it
is set to. ARM CoreSight breakpoints are no-skid. Your
instructions in Flash are not substituted or modified. These are
rather important features for effective software development.
Remove all breakpoints when you are done for the next
exercise by clicking on them again.
TIP: You can delete the breakpoints by clicking on them or
selecting Debug/Breakpoints (or Ctrl-B) and selecting Kill All.
Click on Close in this window to return.
TIP: You can view the breakpoints set by selecting Debug/Breakpoints or Ctrl-B.
Copyright © 2018 ARM Limited or its affiliates. All rights reserved
STMicroelectronics Discovery STM32F4 Lab with ARM® Keil™ MDK toolkit www.keil.com/st
10
14) Call Stack + Locals Window:
Local Variables:
The Call Stack and Local windows are incorporated into one integrated window. Whenever the program is stopped, the Call
Stack + Locals window will display call stack contents as well as any local variables belonging to the active function.
If possible, the values of the local variables will be displayed and if not the message <not in scope> will be displayed. The
Call + Stack window presence or visibility can be toggled by selecting View/Call Stack window.
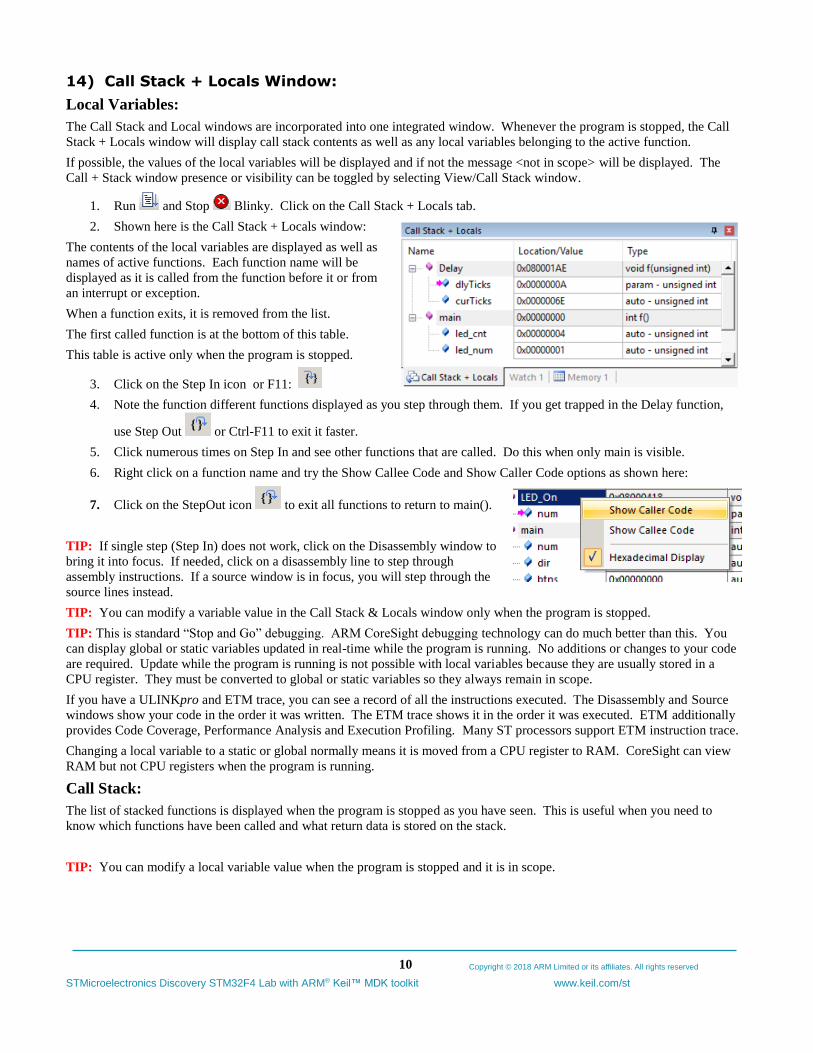
1. Run and Stop Blinky. Click on the Call Stack + Locals tab.
2. Shown here is the Call Stack + Locals window:
The contents of the local variables are displayed as well as
names of active functions. Each function name will be
displayed as it is called from the function before it or from
an interrupt or exception.
When a function exits, it is removed from the list.
The first called function is at the bottom of this table.
This table is active only when the program is stopped.
3. Click on the Step In icon or F11:
4. Note the function different functions displayed as you step through them. If you get trapped in the Delay function,
use Step Out or Ctrl-F11 to exit it faster.
5. Click numerous times on Step In and see other functions that are called. Do this when only main is visible.
6. Right click on a function name and try the Show Callee Code and Show Caller Code options as shown here:
7. Click on the StepOut icon to exit all functions to return to main().
TIP: If single step (Step In) does not work, click on the Disassembly window to
bring it into focus. If needed, click on a disassembly line to step through
assembly instructions. If a source window is in focus, you will step through the
source lines instead.
TIP: You can modify a variable value in the Call Stack & Locals window only when the program is stopped.
TIP: This is standard “Stop and Go” debugging. ARM CoreSight debugging technology can do much better than this. You
can display global or static variables updated in real-time while the program is running. No additions or changes to your code
are required. Update while the program is running is not possible with local variables because they are usually stored in a
CPU register. They must be converted to global or static variables so they always remain in scope.
If you have a ULINKpro and ETM trace, you can see a record of all the instructions executed. The Disassembly and Source
windows show your code in the order it was written. The ETM trace shows it in the order it was executed. ETM additionally
provides Code Coverage, Performance Analysis and Execution Profiling. Many ST processors support ETM instruction trace.
Changing a local variable to a static or global normally means it is moved from a CPU register to RAM. CoreSight can view
RAM but not CPU registers when the program is running.
Call Stack:
The list of stacked functions is displayed when the program is stopped as you have seen. This is useful when you need to
know which functions have been called and what return data is stored on the stack.
TIP: You can modify a local variable value when the program is stopped and it is in scope.
Copyright © 2018 ARM Limited or its affiliates. All rights reserved
STMicroelectronics Discovery STM32F4 Lab with ARM® Keil™ MDK toolkit www.keil.com/st
11
15) Watch and Memory Windows and how to use them:
The Watch and Memory windows will display updated variable values in real-time. It does this through the ARM CoreSight
debugging technology that is part of Cortex-M processors. It is also possible to “put” or insert values into these memory
locations in real-time. It is possible to “drag and drop” variable names into windows or enter them manually.
Watch window:
Add a global variable: Recall the Watch and Memory windows can’t see local variables unless stopped in their function.
1. Stop the processor and exit Debug mode.
2. In Blinky.c, declare a global variable (I called it counter) near line 20 like this: unsigned int counter = 0;
3. Add the statements counter++; and if (counter > 0x10) counter = 0; as shown here near line 100:
4. Select File/Save All or click .
5. Click on Rebuild. .
6. Enter Debug mode. Click on RUN . You can set Watch and
Memory windows while the program runs.
7. In Blinky.c, right click on the variable counter and select Add value to … and select Watch 1. Watch 1 will open if
needed and counter will be displayed as shown here:
8. counter will increment up to 0x0F in real-time.
TIP: You can also block counter, click and hold and drag it
into a Watch or Memory window.
TIP: Make sure View/Periodic Window Update is selected.
9. You can also enter a variable manually by double-clicking under Name or pressing F2 and using copy and paste or
typing the variable. Use the View/Symbols window to enter a variable fully qualified.
10. Right click on the value of counter and enter a new value and press Enter. This works if counter is not changing fast.
TIP: To Drag ‘n Drop into a tab that is not active, pick up the variable and hold it over the tab you want to open; when it
opens, move your mouse into the window and release the variable.
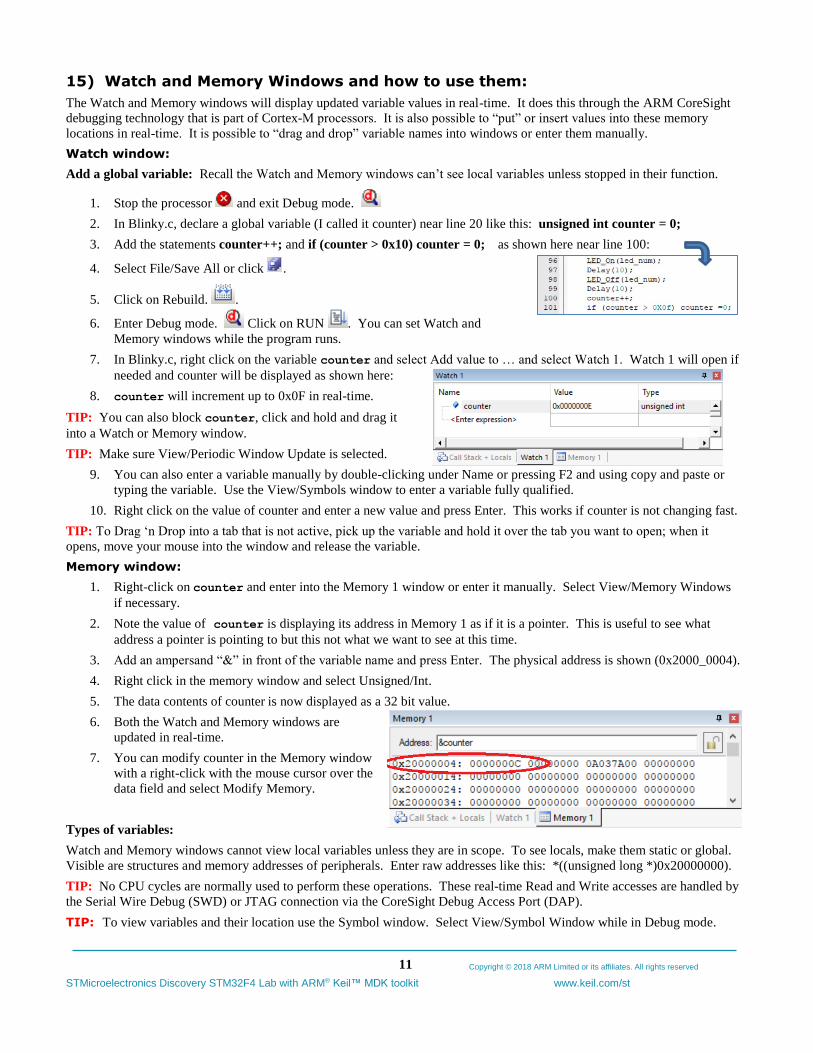
Memory window:
1. Right-click on counter and enter into the Memory 1 window or enter it manually. Select View/Memory Windows
if necessary.
2. Note the value of counter is displaying its address in Memory 1 as if it is a pointer. This is useful to see what
address a pointer is pointing to but this not what we want to see at this time.
3. Add an ampersand “&” in front of the variable name and press Enter. The physical address is shown (0x2000_0004).
4. Right click in the memory window and select Unsigned/Int.
5. The data contents of counter is now displayed as a 32 bit value.
6. Both the Watch and Memory windows are
updated in real-time.
7. You can modify counter in the Memory window
with a right-click with the mouse cursor over the
data field and select Modify Memory.
Types of variables:
Watch and Memory windows cannot view local variables unless they are in scope. To see locals, make them static or global.
Visible are structures and memory addresses of peripherals. Enter raw addresses like this: *((unsigned long *)0x20000000).
TIP: No CPU cycles are normally used to perform these operations. These real-time Read and Write accesses are handled by
the Serial Wire Debug (SWD) or JTAG connection via the CoreSight Debug Access Port (DAP).
TIP: To view variables and their location use the Symbol window. Select View/Symbol Window while in Debug mode.
Copyright © 2018 ARM Limited or its affiliates. All rights reserved
STMicroelectronics Discovery STM32F4 Lab with ARM® Keil™ MDK toolkit www.keil.com/st
12
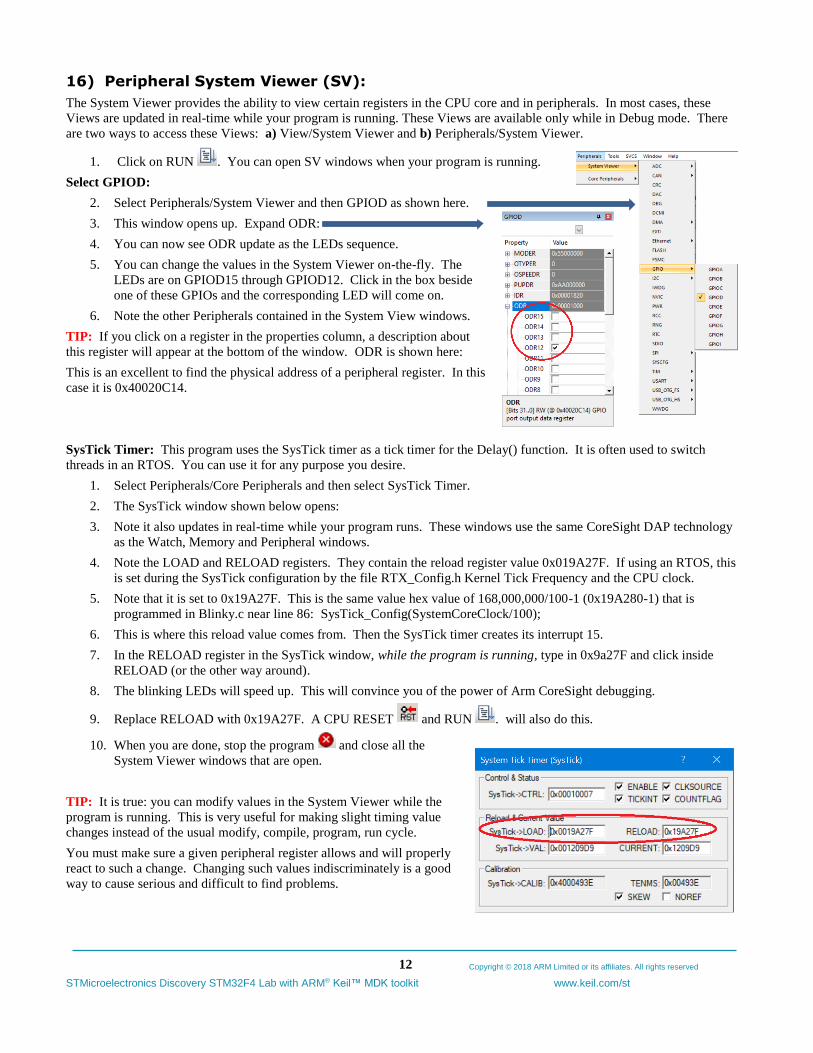
16) Peripheral System Viewer (SV):
The System Viewer provides the ability to view certain registers in the CPU core and in peripherals. In most cases, these
Views are updated in real-time while your program is running. These Views are available only while in Debug mode. There
are two ways to access these Views: a) View/System Viewer and b) Peripherals/System Viewer.
1. Click on RUN . You can open SV windows when your program is running.
Select GPIOD:
2. Select Peripherals/System Viewer and then GPIOD as shown here.
3. This window opens up. Expand ODR:
4. You can now see ODR update as the LEDs sequence.
5. You can change the values in the System Viewer on-the-fly. The
LEDs are on GPIOD15 through GPIOD12. Click in the box beside
one of these GPIOs and the corresponding LED will come on.
6. Note the other Peripherals contained in the System View windows.
TIP: If you click on a register in the properties column, a description about
this register will appear at the bottom of the window. ODR is shown here:
This is an excellent to find the physical address of a peripheral register. In this
case it is 0x40020C14.
SysTick Timer: This program uses the SysTick timer as a tick timer for the Delay() function. It is often used to switch
threads in an RTOS. You can use it for any purpose you desire.
1. Select Peripherals/Core Peripherals and then select SysTick Timer.
2. The SysTick window shown below opens:
3. Note it also updates in real-time while your program runs. These windows use the same CoreSight DAP technology
as the Watch, Memory and Peripheral windows.
4. Note the LOAD and RELOAD registers. They contain the reload register value 0x019A27F. If using an RTOS, this
is set during the SysTick configuration by the file RTX_Config.h Kernel Tick Frequency and the CPU clock.
5. Note that it is set to 0x19A27F. This is the same value hex value of 168,000,000/100-1 (0x19A280-1) that is
programmed in Blinky.c near line 86: SysTick_Config(SystemCoreClock/100);
6. This is where this reload value comes from. Then the SysTick timer creates its interrupt 15.
7. In the RELOAD register in the SysTick window, while the program is running, type in 0x9a27F and click inside
RELOAD (or the other way around).
8. The blinking LEDs will speed up. This will convince you of the power of Arm CoreSight debugging.
9. Replace RELOAD with 0x19A27F. A CPU RESET and RUN . will also do this.
10. When you are done, stop the program and close all the
System Viewer windows that are open.
TIP: It is true: you can modify values in the System Viewer while the
program is running. This is very useful for making slight timing value
changes instead of the usual modify, compile, program, run cycle.
You must make sure a given peripheral register allows and will properly
react to such a change. Changing such values indiscriminately is a good
way to cause serious and difficult to find problems.
Copyright © 2018 ARM Limited or its affiliates. All rights reserved
STMicroelectronics Discovery STM32F4 Lab with ARM® Keil™ MDK toolkit www.keil.com/st
13
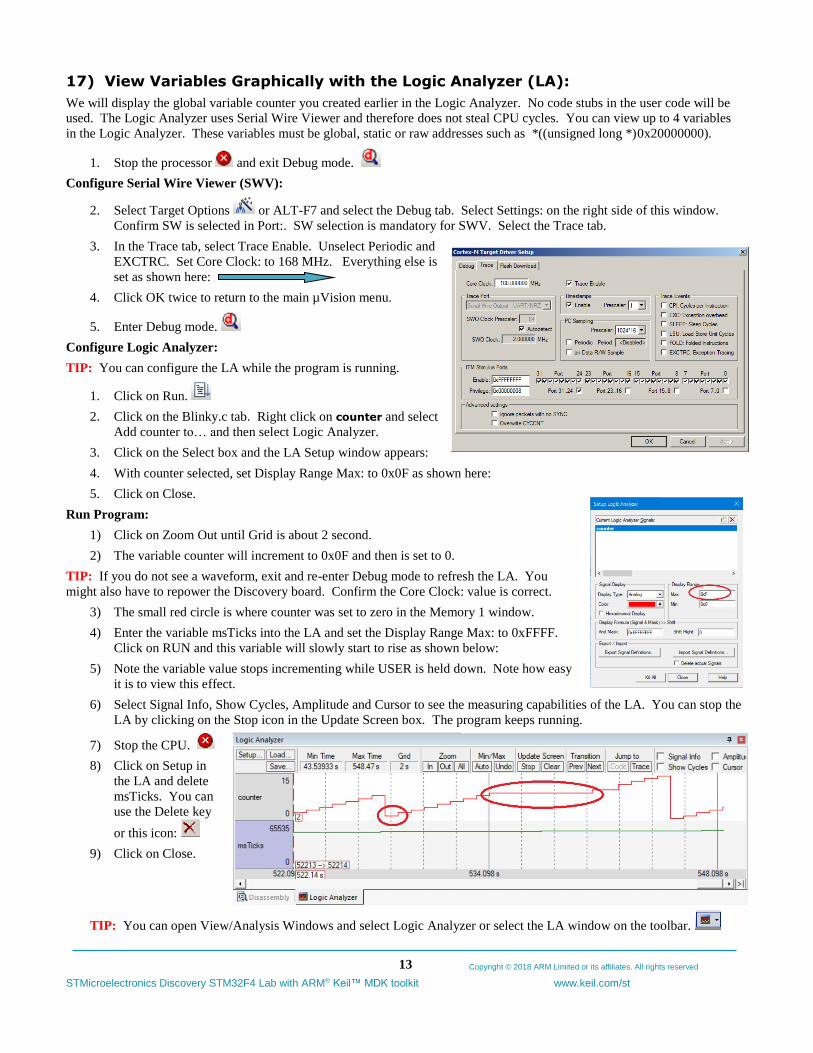
17) View Variables Graphically with the Logic Analyzer (LA):
We will display the global variable counter you created earlier in the Logic Analyzer. No code stubs in the user code will be
used. The Logic Analyzer uses Serial Wire Viewer and therefore does not steal CPU cycles. You can view up to 4 variables
in the Logic Analyzer. These variables must be global, static or raw addresses such as *((unsigned long *)0x20000000).
1. Stop the processor and exit Debug mode.
Configure Serial Wire Viewer (SWV):
2. Select Target Options or ALT-F7 and select the Debug tab. Select Settings: on the right side of this window.
Confirm SW is selected in Port:. SW selection is mandatory for SWV. Select the Trace tab.
3. In the Trace tab, select Trace Enable. Unselect Periodic and
EXCTRC. Set Core Clock: to 168 MHz. Everything else is
set as shown here:
4. Click OK twice to return to the main µVision menu.
5. Enter Debug mode.
Configure Logic Analyzer:
TIP: You can configure the LA while the program is running.
1. Click on Run.
2. Click on the Blinky.c tab. Right click on counter and select
Add counter to… and then select Logic Analyzer.
3. Click on the Select box and the LA Setup window appears:
4. With counter selected, set Display Range Max: to 0x0F as shown here:
5. Click on Close.
Run Program:
1) Click on Zoom Out until Grid is about 2 second.
2) The variable counter will increment to 0x0F and then is set to 0.
TIP: If you do not see a waveform, exit and re-enter Debug mode to refresh the LA. You
might also have to repower the Discovery board. Confirm the Core Clock: value is correct.
3) The small red circle is where counter was set to zero in the Memory 1 window.
4) Enter the variable msTicks into the LA and set the Display Range Max: to 0xFFFF.
Click on RUN and this variable will slowly start to rise as shown below:
5) Note the variable value stops incrementing while USER is held down. Note how easy
it is to view this effect.
6) Select Signal Info, Show Cycles, Amplitude and Cursor to see the measuring capabilities of the LA. You can stop the
LA by clicking on the Stop icon in the Update Screen box. The program keeps running.
7) Stop the CPU.
8) Click on Setup in
the LA and delete
msTicks. You can
use the Delete key
or this icon:
9) Click on Close.
TIP: You can open View/Analysis Windows and select Logic Analyzer or select the LA window on the toolbar.
Copyright © 2018 ARM Limited or its affiliates. All rights reserved
STMicroelectronics Discovery STM32F4 Lab with ARM® Keil™ MDK toolkit www.keil.com/st
14
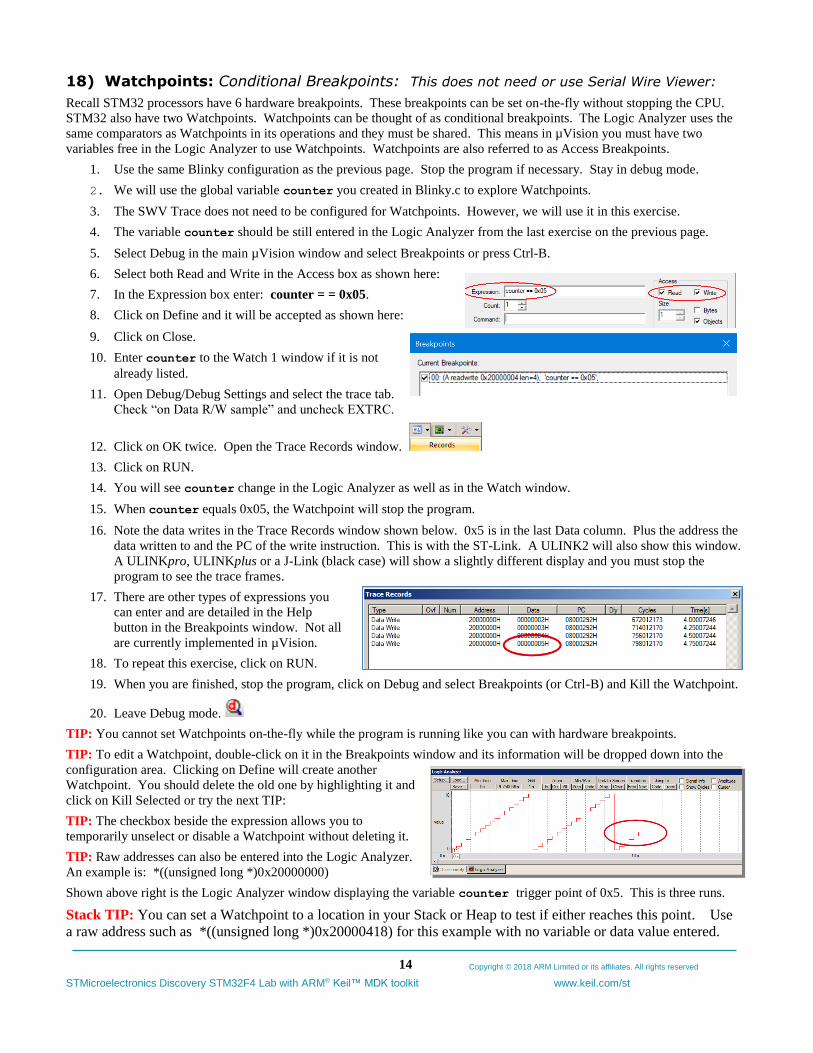
18) Watchpoints: Conditional Breakpoints: This does not need or use Serial Wire Viewer:
Recall STM32 processors have 6 hardware breakpoints. These breakpoints can be set on-the-fly without stopping the CPU.
STM32 also have two Watchpoints. Watchpoints can be thought of as conditional breakpoints. The Logic Analyzer uses the
same comparators as Watchpoints in its operations and they must be shared. This means in µVision you must have two
variables free in the Logic Analyzer to use Watchpoints. Watchpoints are also referred to as Access Breakpoints.
1. Use the same Blinky configuration as the previous page. Stop the program if necessary. Stay in debug mode.
2. We will use the global variable counter you created in Blinky.c to explore Watchpoints.
3. The SWV Trace does not need to be configured for Watchpoints. However, we will use it in this exercise.
4. The variable counter should be still entered in the Logic Analyzer from the last exercise on the previous page.
5. Select Debug in the main µVision window and select Breakpoints or press Ctrl-B.
6. Select both Read and Write in the Access box as shown here:
7. In the Expression box enter: counter = = 0x05.
8. Click on Define and it will be accepted as shown here:
9. Click on Close.
10. Enter counter to the Watch 1 window if it is not
already listed.
11. Open Debug/Debug Settings and select the trace tab.
Check “on Data R/W sample” and uncheck EXTRC.
12. Click on OK twice. Open the Trace Records window.
13. Click on RUN.
14. You will see counter change in the Logic Analyzer as well as in the Watch window.
15. When counter equals 0x05, the Watchpoint will stop the program.
16. Note the data writes in the Trace Records window shown below. 0x5 is in the last Data column. Plus the address the
data written to and the PC of the write instruction. This is with the ST-Link. A ULINK2 will also show this window.
A ULINKpro, ULINKplus or a J-Link (black case) will show a slightly different display and you must stop the
program to see the trace frames.
17. There are other types of expressions you
can enter and are detailed in the Help
button in the Breakpoints window. Not all
are currently implemented in µVision.
18. To repeat this exercise, click on RUN.
19. When you are finished, stop the program, click on Debug and select Breakpoints (or Ctrl-B) and Kill the Watchpoint.
20. Leave Debug mode.
TIP: You cannot set Watchpoints on-the-fly while the program is running like you can with hardware breakpoints.
TIP: To edit a Watchpoint, double-click on it in the Breakpoints window and its information will be dropped down into the
configuration area. Clicking on Define will create another
Watchpoint. You should delete the old one by highlighting it and
click on Kill Selected or try the next TIP:
TIP: The checkbox beside the expression allows you to
temporarily unselect or disable a Watchpoint without deleting it.
TIP: Raw addresses can also be entered into the Logic Analyzer.
An example is: *((unsigned long *)0x20000000)
Shown above right is the Logic Analyzer window displaying the variable counter trigger point of 0x5. This is three runs.
Stack TIP: You can set a Watchpoint to a location in your Stack or Heap to test if either reaches this point. Use
a raw address such as *((unsigned long *)0x20000418) for this example with no variable or data value entered.
Copyright © 2018 ARM Limited or its affiliates. All rights reserved
STMicroelectronics Discovery STM32F4 Lab with ARM® Keil™ MDK toolkit www.keil.com/st
15
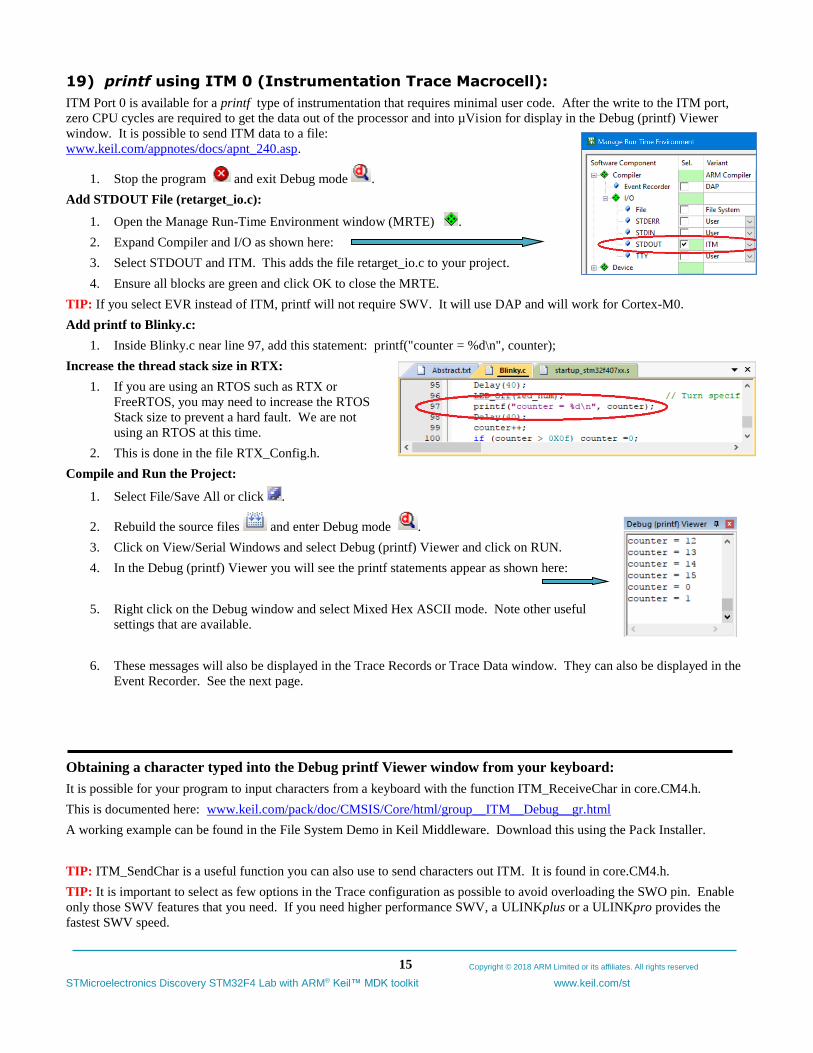
19) printf using ITM 0 (Instrumentation Trace Macrocell):
ITM Port 0 is available for a printf type of instrumentation that requires minimal user code. After the write to the ITM port,
zero CPU cycles are required to get the data out of the processor and into µVision for display in the Debug (printf) Viewer
window. It is possible to send ITM data to a file:
www.keil.com/appnotes/docs/apnt_240.asp.
1. Stop the program and exit Debug mode .
Add STDOUT File (retarget_io.c):
1. Open the Manage Run-Time Environment window (MRTE) .
2. Expand Compiler and I/O as shown here:
3. Select STDOUT and ITM. This adds the file retarget_io.c to your project.
4. Ensure all blocks are green and click OK to close the MRTE.
TIP: If you select EVR instead of ITM, printf will not require SWV. It will use DAP and will work for Cortex-M0.
Add printf to Blinky.c:
1. Inside Blinky.c near line 97, add this statement: printf("counter = %d\n", counter);
Increase the thread stack size in RTX:
1. If you are using an RTOS such as RTX or
FreeRTOS, you may need to increase the RTOS
Stack size to prevent a hard fault. We are not
using an RTOS at this time.
2. This is done in the file RTX_Config.h.
Compile and Run the Project:
1. Select File/Save All or click .
2. Rebuild the source files and enter Debug mode .
3. Click on View/Serial Windows and select Debug (printf) Viewer and click on RUN.
4. In the Debug (printf) Viewer you will see the printf statements appear as shown here:
5. Right click on the Debug window and select Mixed Hex ASCII mode. Note other useful
settings that are available.
6. These messages will also be displayed in the Trace Records or Trace Data window. They can also be displayed in the
Event Recorder. See the next page.
Obtaining a character typed into the Debug printf Viewer window from your keyboard:
It is possible for your program to input characters from a keyboard with the function ITM_ReceiveChar in core.CM4.h.
This is documented here: www.keil.com/pack/doc/CMSIS/Core/html/group__ITM__Debug__gr.html
A working example can be found in the File System Demo in Keil Middleware. Download this using the Pack Installer.
TIP: ITM_SendChar is a useful function you can also use to send characters out ITM. It is found in core.CM4.h.
TIP: It is important to select as few options in the Trace configuration as possible to avoid overloading the SWO pin. Enable
only those SWV features that you need. If you need higher performance SWV, a ULINKplus or a ULINKpro provides the
fastest SWV speed.
Copyright © 2018 ARM Limited or its affiliates. All rights reserved
STMicroelectronics Discovery STM32F4 Lab with ARM® Keil™ MDK toolkit www.keil.com/st
16
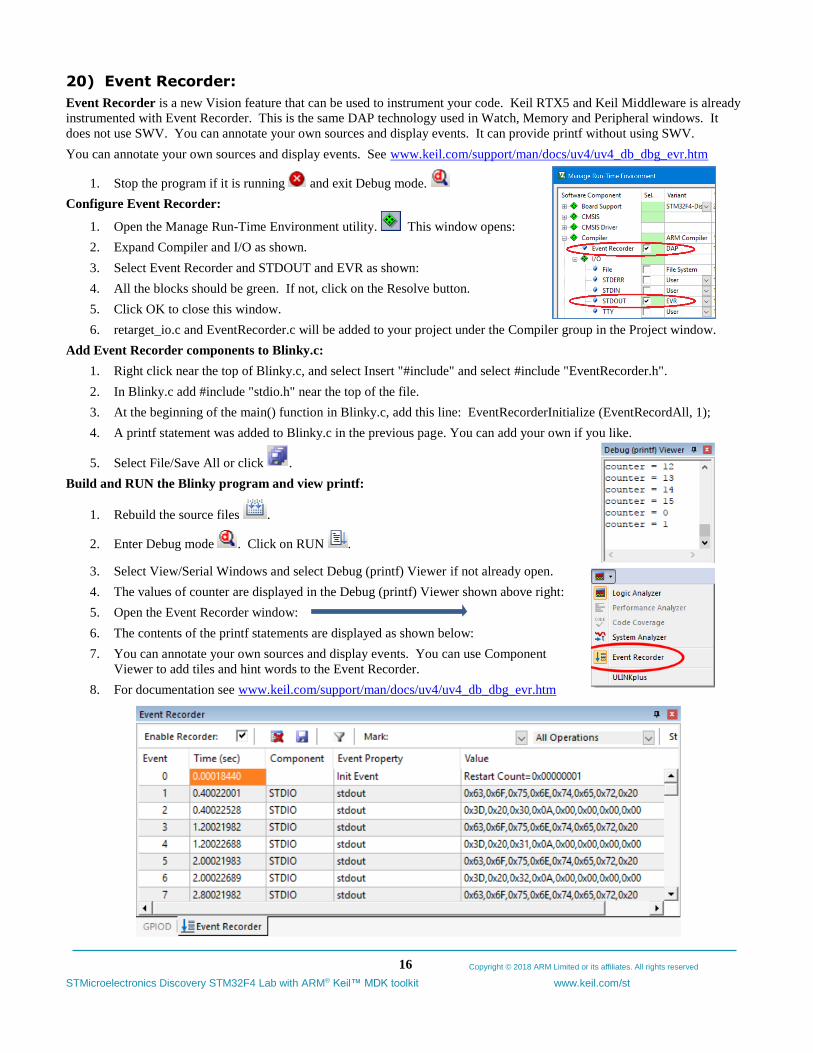
20) Event Recorder:
Event Recorder is a new Vision feature that can be used to instrument your code. Keil RTX5 and Keil Middleware is already
instrumented with Event Recorder. This is the same DAP technology used in Watch, Memory and Peripheral windows. It
does not use SWV. You can annotate your own sources and display events. It can provide printf without using SWV.
You can annotate your own sources and display events. See www.keil.com/support/man/docs/uv4/uv4_db_dbg_evr.htm
1. Stop the program if it is running and exit Debug mode.
Configure Event Recorder:
1. Open the Manage Run-Time Environment utility. This window opens:
2. Expand Compiler and I/O as shown.
3. Select Event Recorder and STDOUT and EVR as shown:
4. All the blocks should be green. If not, click on the Resolve button.
5. Click OK to close this window.
6. retarget_io.c and EventRecorder.c will be added to your project under the Compiler group in the Project window.
Add Event Recorder components to Blinky.c:
1. Right click near the top of Blinky.c, and select Insert "#include" and select #include "EventRecorder.h".
2. In Blinky.c add #include "stdio.h" near the top of the file.
3. At the beginning of the main() function in Blinky.c, add this line: EventRecorderInitialize (EventRecordAll, 1);
4. A printf statement was added to Blinky.c in the previous page. You can add your own if you like.
5. Select File/Save All or click .
Build and RUN the Blinky program and view printf:
1. Rebuild the source files .
2. Enter Debug mode . Click on RUN .
3. Select View/Serial Windows and select Debug (printf) Viewer if not already open.
4. The values of counter are displayed in the Debug (printf) Viewer shown above right:
5. Open the Event Recorder window:
6. The contents of the printf statements are displayed as shown below:
7. You can annotate your own sources and display events. You can use Component
Viewer to add tiles and hint words to the Event Recorder.
8. For documentation see www.keil.com/support/man/docs/uv4/uv4_db_dbg_evr.htm
Copyright © 2018 ARM Limited or its affiliates. All rights reserved
STMicroelectronics Discovery STM32F4 Lab with ARM® Keil™ MDK toolkit www.keil.com/st
17
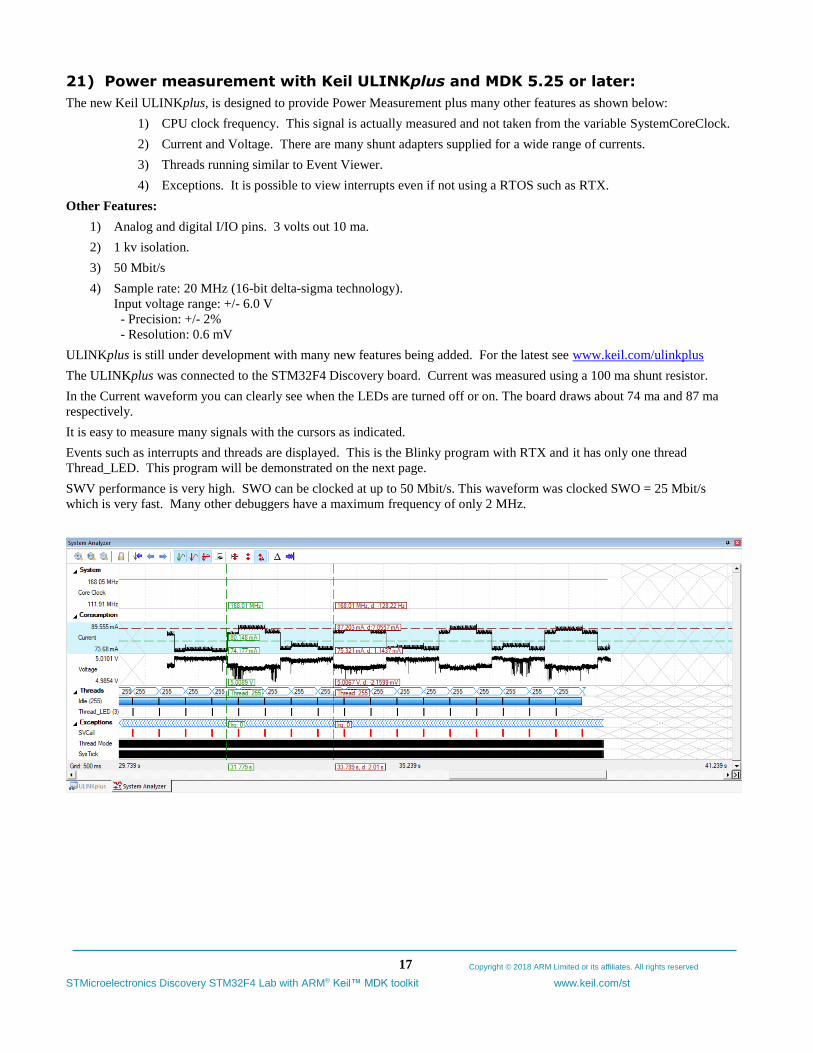
21) Power measurement with Keil ULINKplus and MDK 5.25 or later:
The new Keil ULINKplus, is designed to provide Power Measurement plus many other features as shown below:
1) CPU clock frequency. This signal is actually measured and not taken from the variable SystemCoreClock.
2) Current and Voltage. There are many shunt adapters supplied for a wide range of currents.
3) Threads running similar to Event Viewer.
4) Exceptions. It is possible to view interrupts even if not using a RTOS such as RTX.
Other Features:
1) Analog and digital I/IO pins. 3 volts out 10 ma.
2) 1 kv isolation.
3) 50 Mbit/s
4) Sample rate: 20 MHz (16-bit delta-sigma technology).
Input voltage range: +/- 6.0 V
- Precision: +/- 2%
- Resolution: 0.6 mV
ULINKplus is still under development with many new features being added. For the latest see www.keil.com/ulinkplus
The ULINKplus was connected to the STM32F4 Discovery board. Current was measured using a 100 ma shunt resistor.
In the Current waveform you can clearly see when the LEDs are turned off or on. The board draws about 74 ma and 87 ma
respectively.
It is easy to measure many signals with the cursors as indicated.
Events such as interrupts and threads are displayed. This is the Blinky program with RTX and it has only one thread
Thread_LED. This program will be demonstrated on the next page.
SWV performance is very high. SWO can be clocked at up to 50 Mbit/s. This waveform was clocked SWO = 25 Mbit/s
which is very fast. Many other debuggers have a maximum frequency of only 2 MHz.
Copyright © 2018 ARM Limited or its affiliates. All rights reserved
STMicroelectronics Discovery STM32F4 Lab with ARM® Keil™ MDK toolkit www.keil.com/st
18
22) Blinky Example Program with Keil RTX RTOS:
Keil provides RTX, a full feature RTOS. RTX is included as part of Keil MDK including sources. This example explores the
Blinky RTX project. MDK will work with any RTOS including FreeRTOS. An RTOS is just a set of C functions that gets
compiled with your project. RTX comes with a BSD or Apache 2.0 license and source code is provided on GitHub.
RTX and all its components are located here: C:\Keil_v5\ARM\PACK\ARM\CMSIS or www.keil.com/rtx. RTX5 source is
stored on GitHub: https://github.com/ARM-software/CMSIS_5.
This version of Blinky is similar to Blinky_no_rtos but the LEDs are controlled in the thread Thread_LED.
You must have copied Blinky to C:\00MDK\MDK\Boards\ST\STM32F4-Discovery\Blinky as described on page 4.
1. With µVision in Edit mode (not in Debug mode): Select Project/Open Project.
2. Open the µVision project file Blinky.uvprojx found in C:\00MDK\MDK\Boards\ST\STM32F4-Discovery\Blinky\
3. This project is pre-configured for the ST-Link/V2 debug adapter.
4. Compile the source files by clicking on the Rebuild icon. . They will compile with no errors or warnings.
5. Enter the Debug mode by clicking on the debug icon The Flash will be programmed. A progress bar will be at
the bottom left.
6. Click on the RUN icon.
7. The four LEDs will blink in succession.
8. Click on STOP .
We will explore the operation of RTX with the two Kernel Awareness windows.
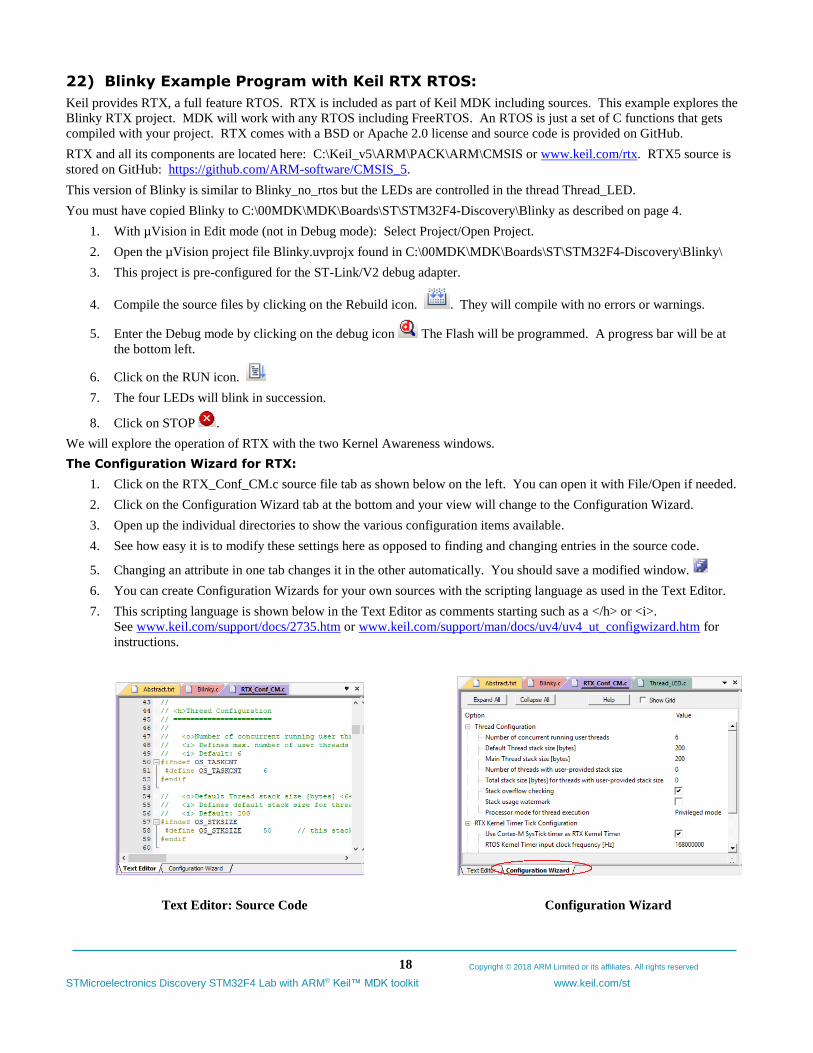
The Configuration Wizard for RTX:
1. Click on the RTX_Conf_CM.c source file tab as shown below on the left. You can open it with File/Open if needed.
2. Click on the Configuration Wizard tab at the bottom and your view will change to the Configuration Wizard.
3. Open up the individual directories to show the various configuration items available.
4. See how easy it is to modify these settings here as opposed to finding and changing entries in the source code.
5. Changing an attribute in one tab changes it in the other automatically. You should save a modified window.
6. You can create Configuration Wizards for your own sources with the scripting language as used in the Text Editor.
7. This scripting language is shown below in the Text Editor as comments starting such as a </h> or <i>.
See www.keil.com/support/docs/2735.htm or www.keil.com/support/man/docs/uv4/uv4_ut_configwizard.htm for
instructions.
Text Editor: Source Code Configuration Wizard
Copyright © 2018 ARM Limited or its affiliates. All rights reserved
STMicroelectronics Discovery STM32F4 Lab with ARM® Keil™ MDK toolkit www.keil.com/st
19
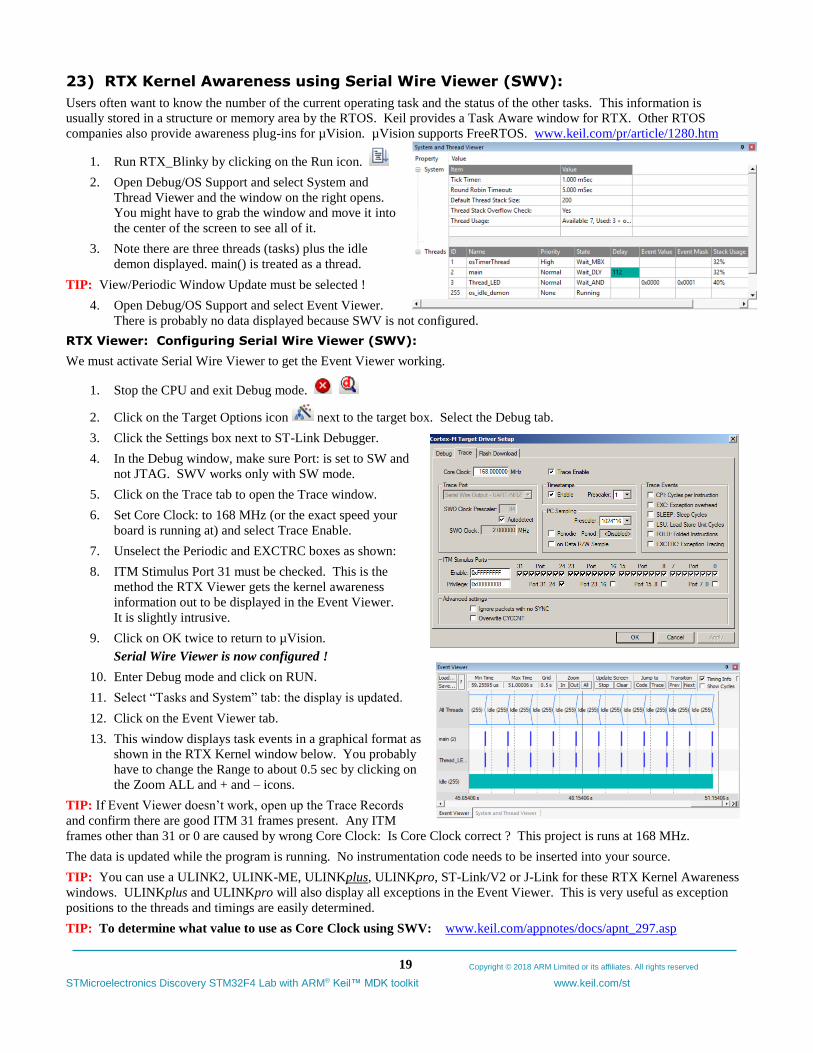
23) RTX Kernel Awareness using Serial Wire Viewer (SWV):
Users often want to know the number of the current operating task and the status of the other tasks. This information is
usually stored in a structure or memory area by the RTOS. Keil provides a Task Aware window for RTX. Other RTOS
companies also provide awareness plug-ins for µVision. µVision supports FreeRTOS. www.keil.com/pr/article/1280.htm
1. Run RTX_Blinky by clicking on the Run icon.
2. Open Debug/OS Support and select System and
Thread Viewer and the window on the right opens.
You might have to grab the window and move it into
the center of the screen to see all of it.
3. Note there are three threads (tasks) plus the idle
demon displayed. main() is treated as a thread.
TIP: View/Periodic Window Update must be selected !
4. Open Debug/OS Support and select Event Viewer.
There is probably no data displayed because SWV is not configured.
RTX Viewer: Configuring Serial Wire Viewer (SWV):
We must activate Serial Wire Viewer to get the Event Viewer working.
1. Stop the CPU and exit Debug mode.
2. Click on the Target Options icon next to the target box. Select the Debug tab.
3. Click the Settings box next to ST-Link Debugger.
4. In the Debug window, make sure Port: is set to SW and
not JTAG. SWV works only with SW mode.
5. Click on the Trace tab to open the Trace window.
6. Set Core Clock: to 168 MHz (or the exact speed your
board is running at) and select Trace Enable.
7. Unselect the Periodic and EXCTRC boxes as shown:
8. ITM Stimulus Port 31 must be checked. This is the
method the RTX Viewer gets the kernel awareness
information out to be displayed in the Event Viewer.
It is slightly intrusive.
9. Click on OK twice to return to µVision.
Serial Wire Viewer is now configured !
10. Enter Debug mode and click on RUN.
11. Select “Tasks and System” tab: the display is updated.
12. Click on the Event Viewer tab.
13. This window displays task events in a graphical format as
shown in the RTX Kernel window below. You probably
have to change the Range to about 0.5 sec by clicking on
the Zoom ALL and + and – icons.
TIP: If Event Viewer doesn’t work, open up the Trace Records
and confirm there are good ITM 31 frames present. Any ITM
frames other than 31 or 0 are caused by wrong Core Clock: Is Core Clock correct ? This project is runs at 168 MHz.
The data is updated while the program is running. No instrumentation code needs to be inserted into your source.
TIP: You can use a ULINK2, ULINK-ME, ULINKplus, ULINKpro, ST-Link/V2 or J-Link for these RTX Kernel Awareness
windows. ULINKplus and ULINKpro will also display all exceptions in the Event Viewer. This is very useful as exception
positions to the threads and timings are easily determined.
TIP: To determine what value to use as Core Clock using SWV: www.keil.com/appnotes/docs/apnt_297.asp
Copyright © 2018 ARM Limited or its affiliates. All rights reserved
STMicroelectronics Discovery STM32F4 Lab with ARM® Keil™ MDK toolkit www.keil.com/st
20
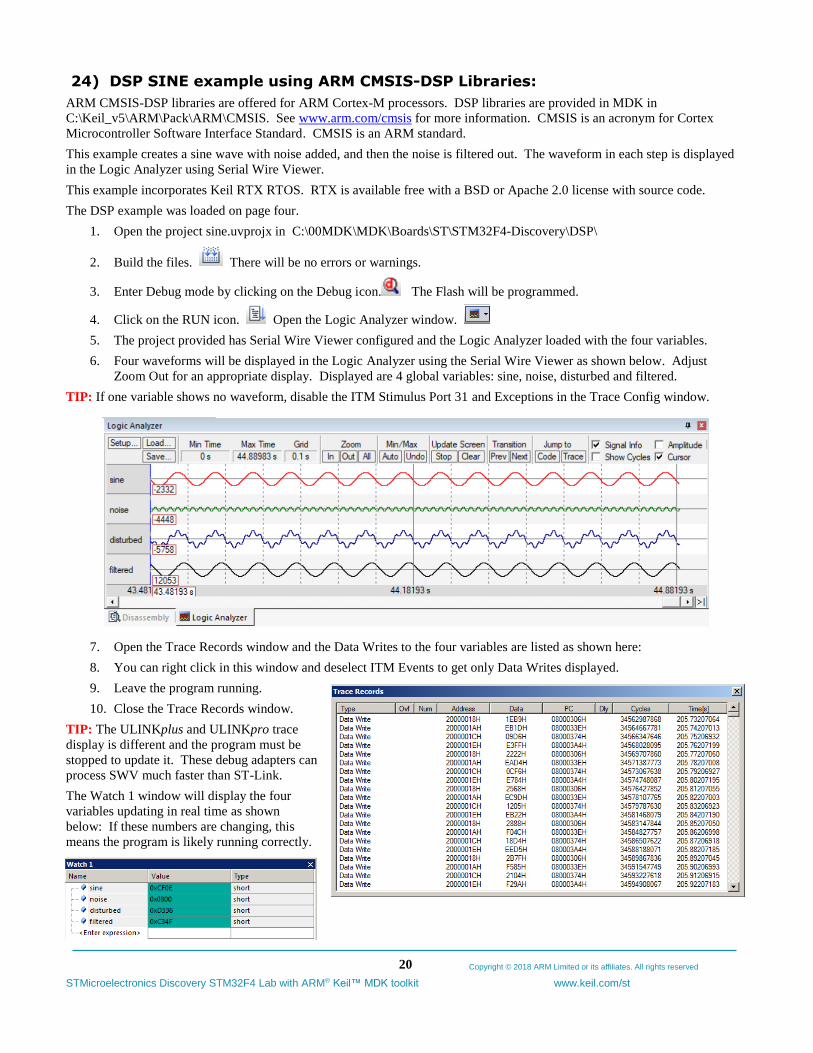
24) DSP SINE example using ARM CMSIS-DSP Libraries:
ARM CMSIS-DSP libraries are offered for ARM Cortex-M processors. DSP libraries are provided in MDK in
C:\Keil_v5\ARM\Pack\ARM\CMSIS. See www.arm.com/cmsis for more information. CMSIS is an acronym for Cortex
Microcontroller Software Interface Standard. CMSIS is an ARM standard.
This example creates a sine wave with noise added, and then the noise is filtered out. The waveform in each step is displayed
in the Logic Analyzer using Serial Wire Viewer.
This example incorporates Keil RTX RTOS. RTX is available free with a BSD or Apache 2.0 license with source code.
The DSP example was loaded on page four.
1. Open the project sine.uvprojx in C:\00MDK\MDK\Boards\ST\STM32F4-Discovery\DSP\
2. Build the files. There will be no errors or warnings.
3. Enter Debug mode by clicking on the Debug icon. The Flash will be programmed.
4. Click on the RUN icon. Open the Logic Analyzer window.
5. The project provided has Serial Wire Viewer configured and the Logic Analyzer loaded with the four variables.
6. Four waveforms will be displayed in the Logic Analyzer using the Serial Wire Viewer as shown below. Adjust
Zoom Out for an appropriate display. Displayed are 4 global variables: sine, noise, disturbed and filtered.
TIP: If one variable shows no waveform, disable the ITM Stimulus Port 31 and Exceptions in the Trace Config window.
7. Open the Trace Records window and the Data Writes to the four variables are listed as shown here:
8. You can right click in this window and deselect ITM Events to get only Data Writes displayed.
9. Leave the program running.
10. Close the Trace Records window.
TIP: The ULINKplus and ULINKpro trace
display is different and the program must be
stopped to update it. These debug adapters can
process SWV much faster than ST-Link.
The Watch 1 window will display the four
variables updating in real time as shown
below: If these numbers are changing, this
means the program is likely running correctly.
Copyright © 2018 ARM Limited or its affiliates. All rights reserved
STMicroelectronics Discovery STM32F4 Lab with ARM® Keil™ MDK toolkit www.keil.com/st
21
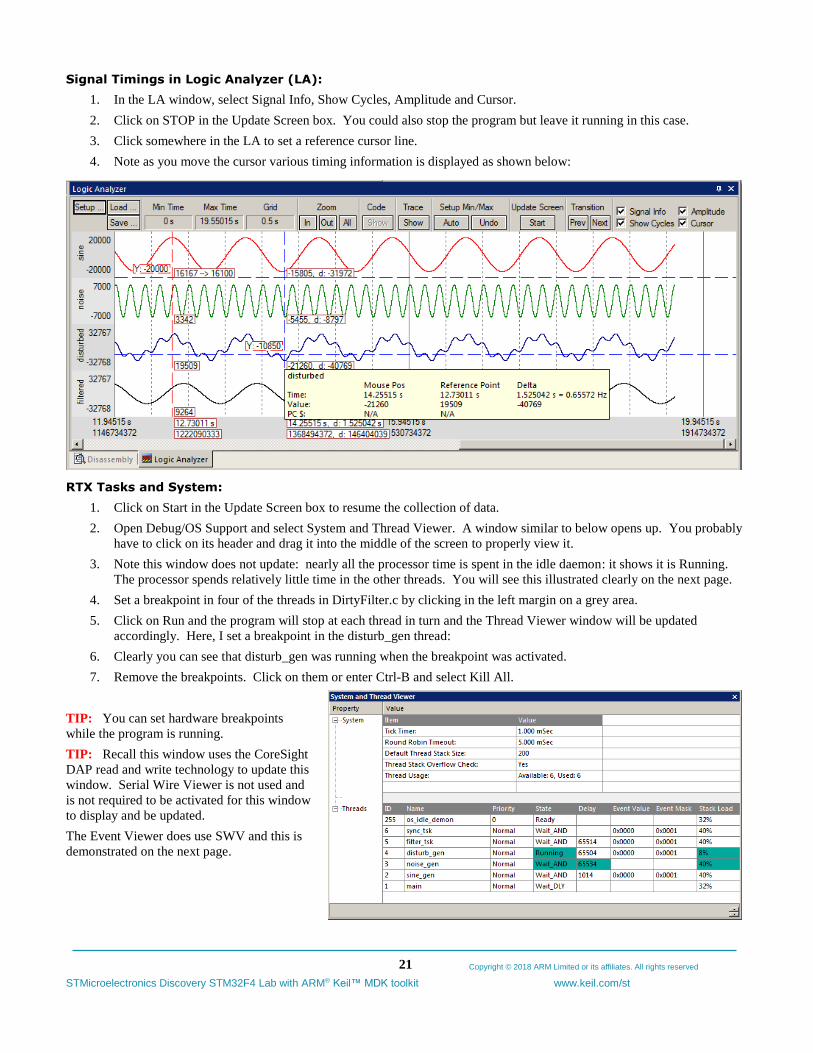
Signal Timings in Logic Analyzer (LA):
1. In the LA window, select Signal Info, Show Cycles, Amplitude and Cursor.
2. Click on STOP in the Update Screen box. You could also stop the program but leave it running in this case.
3. Click somewhere in the LA to set a reference cursor line.
4. Note as you move the cursor various timing information is displayed as shown below:
RTX Tasks and System:
1. Click on Start in the Update Screen box to resume the collection of data.
2. Open Debug/OS Support and select System and Thread Viewer. A window similar to below opens up. You probably
have to click on its header and drag it into the middle of the screen to properly view it.
3. Note this window does not update: nearly all the processor time is spent in the idle daemon: it shows it is Running.
The processor spends relatively little time in the other threads. You will see this illustrated clearly on the next page.
4. Set a breakpoint in four of the threads in DirtyFilter.c by clicking in the left margin on a grey area.
5. Click on Run and the program will stop at each thread in turn and the Thread Viewer window will be updated
accordingly. Here, I set a breakpoint in the disturb_gen thread:
6. Clearly you can see that disturb_gen was running when the breakpoint was activated.
7. Remove the breakpoints. Click on them or enter Ctrl-B and select Kill All.
TIP: You can set hardware breakpoints
while the program is running.
TIP: Recall this window uses the CoreSight
DAP read and write technology to update this
window. Serial Wire Viewer is not used and
is not required to be activated for this window
to display and be updated.
The Event Viewer does use SWV and this is
demonstrated on the next page.
Copyright © 2018 ARM Limited or its affiliates. All rights reserved
STMicroelectronics Discovery STM32F4 Lab with ARM® Keil™ MDK toolkit www.keil.com/st
22
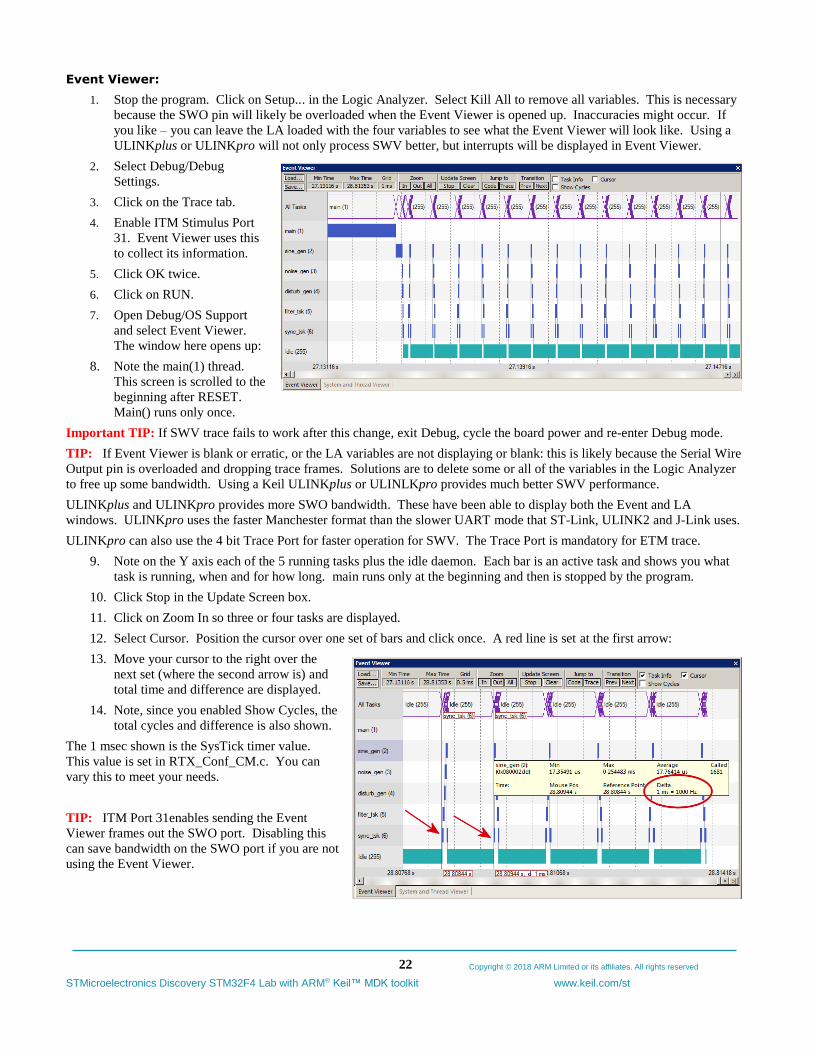
Event Viewer:
1. Stop the program. Click on Setup... in the Logic Analyzer. Select Kill All to remove all variables. This is necessary
because the SWO pin will likely be overloaded when the Event Viewer is opened up. Inaccuracies might occur. If
you like – you can leave the LA loaded with the four variables to see what the Event Viewer will look like. Using a
ULINKplus or ULINKpro will not only process SWV better, but interrupts will be displayed in Event Viewer.
2. Select Debug/Debug
Settings.
3. Click on the Trace tab.
4. Enable ITM Stimulus Port
31. Event Viewer uses this
to collect its information.
5. Click OK twice.
6. Click on RUN.
7. Open Debug/OS Support
and select Event Viewer.
The window here opens up:
8. Note the main(1) thread.
This screen is scrolled to the
beginning after RESET.
Main() runs only once.
Important TIP: If SWV trace fails to work after this change, exit Debug, cycle the board power and re-enter Debug mode.
TIP: If Event Viewer is blank or erratic, or the LA variables are not displaying or blank: this is likely because the Serial Wire
Output pin is overloaded and dropping trace frames. Solutions are to delete some or all of the variables in the Logic Analyzer
to free up some bandwidth. Using a Keil ULINKplus or ULINLKpro provides much better SWV performance.
ULINKplus and ULINKpro provides more SWO bandwidth. These have been able to display both the Event and LA
windows. ULINKpro uses the faster Manchester format than the slower UART mode that ST-Link, ULINK2 and J-Link uses.
ULINKpro can also use the 4 bit Trace Port for faster operation for SWV. The Trace Port is mandatory for ETM trace.
9. Note on the Y axis each of the 5 running tasks plus the idle daemon. Each bar is an active task and shows you what
task is running, when and for how long. main runs only at the beginning and then is stopped by the program.
10. Click Stop in the Update Screen box.
11. Click on Zoom In so three or four tasks are displayed.
12. Select Cursor. Position the cursor over one set of bars and click once. A red line is set at the first arrow:
13. Move your cursor to the right over the
next set (where the second arrow is) and
total time and difference are displayed.
14. Note, since you enabled Show Cycles, the
total cycles and difference is also shown.
The 1 msec shown is the SysTick timer value.
This value is set in RTX_Conf_CM.c. You can
vary this to meet your needs.
TIP: ITM Port 31enables sending the Event
Viewer frames out the SWO port. Disabling this
can save bandwidth on the SWO port if you are not
using the Event Viewer.
Copyright © 2018 ARM Limited or its affiliates. All rights reserved
STMicroelectronics Discovery STM32F4 Lab with ARM® Keil™ MDK toolkit www.keil.com/st
23
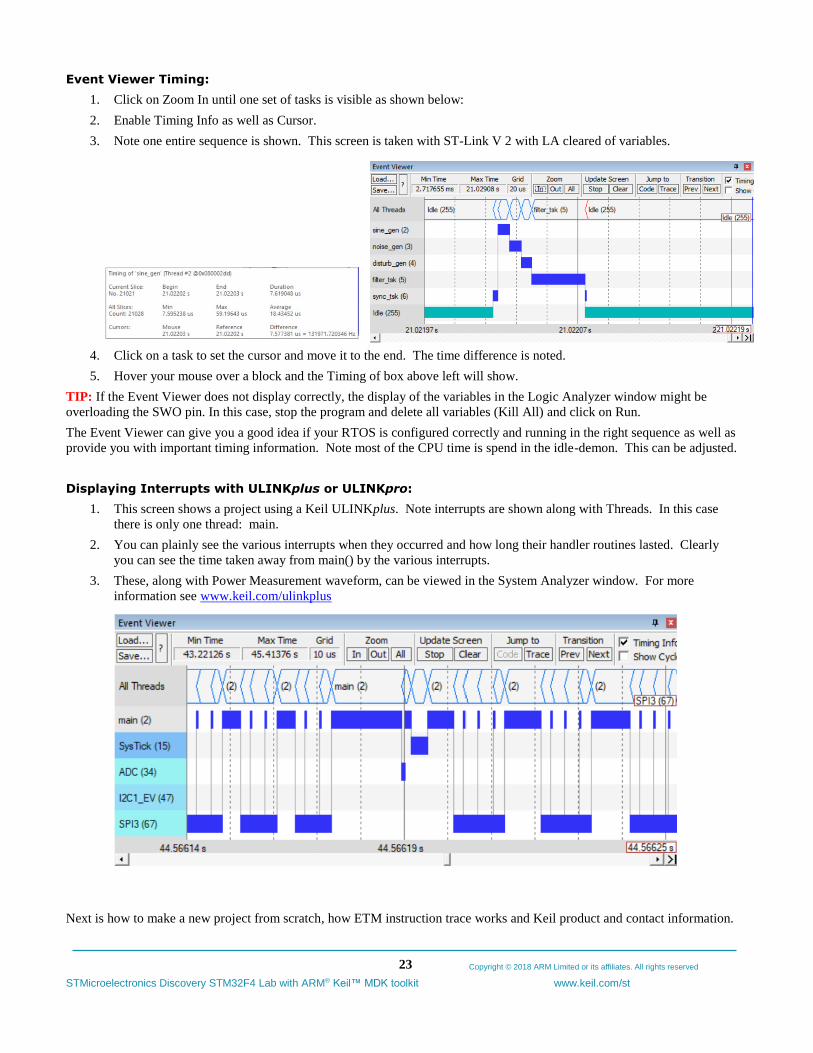
Event Viewer Timing:
1. Click on Zoom In until one set of tasks is visible as shown below:
2. Enable Timing Info as well as Cursor.
3. Note one entire sequence is shown. This screen is taken with ST-Link V 2 with LA cleared of variables.
4. Click on a task to set the cursor and move it to the end. The time difference is noted.
5. Hover your mouse over a block and the Timing of box above left will show.
TIP: If the Event Viewer does not display correctly, the display of the variables in the Logic Analyzer window might be
overloading the SWO pin. In this case, stop the program and delete all variables (Kill All) and click on Run.
The Event Viewer can give you a good idea if your RTOS is configured correctly and running in the right sequence as well as
provide you with important timing information. Note most of the CPU time is spend in the idle-demon. This can be adjusted.
Displaying Interrupts with ULINKplus or ULINKpro:
1. This screen shows a project using a Keil ULINKplus. Note interrupts are shown along with Threads. In this case
there is only one thread: main.
2. You can plainly see the various interrupts when they occurred and how long their handler routines lasted. Clearly
you can see the time taken away from main() by the various interrupts.
3. These, along with Power Measurement waveform, can be viewed in the System Analyzer window. For more
information see www.keil.com/ulinkplus
Next is how to make a new project from scratch, how ETM instruction trace works and Keil product and contact information.
Copyright © 2018 ARM Limited or its affiliates. All rights reserved
STMicroelectronics Discovery STM32F4 Lab with ARM® Keil™ MDK toolkit www.keil.com/st
24
25) Creating your own MDK 5 project from scratch:
All examples provided by Keil are pre-configured. All you need to do is compile them. You can use them as a template for
your own projects. However, we will start an example project from the beginning to illustrate how easy this process is. Once
you have the new project configured; you can build, load and run a simple Blinky example. The processor startup sequences
are present and you can easily add your own source code and/or files. You can use this process to create any new project,
including one using an RTOS. You can also obtain a µVison project that you configure and create with STM32Cube. This
will directly load into µVision. You can also use Keil Middleware in your programs. www.keil.com/middleware
Install the STM32 Software Pack for your processor:
1. Start µVision and leave in Edit mode. Do not be in Debug mode.
2. Pack Installer: The Pack for the STM32F4 processor must be installed. This has already been done on page 4.
3. You do not need to copy any examples over.
Create a new Folder and a New Project:
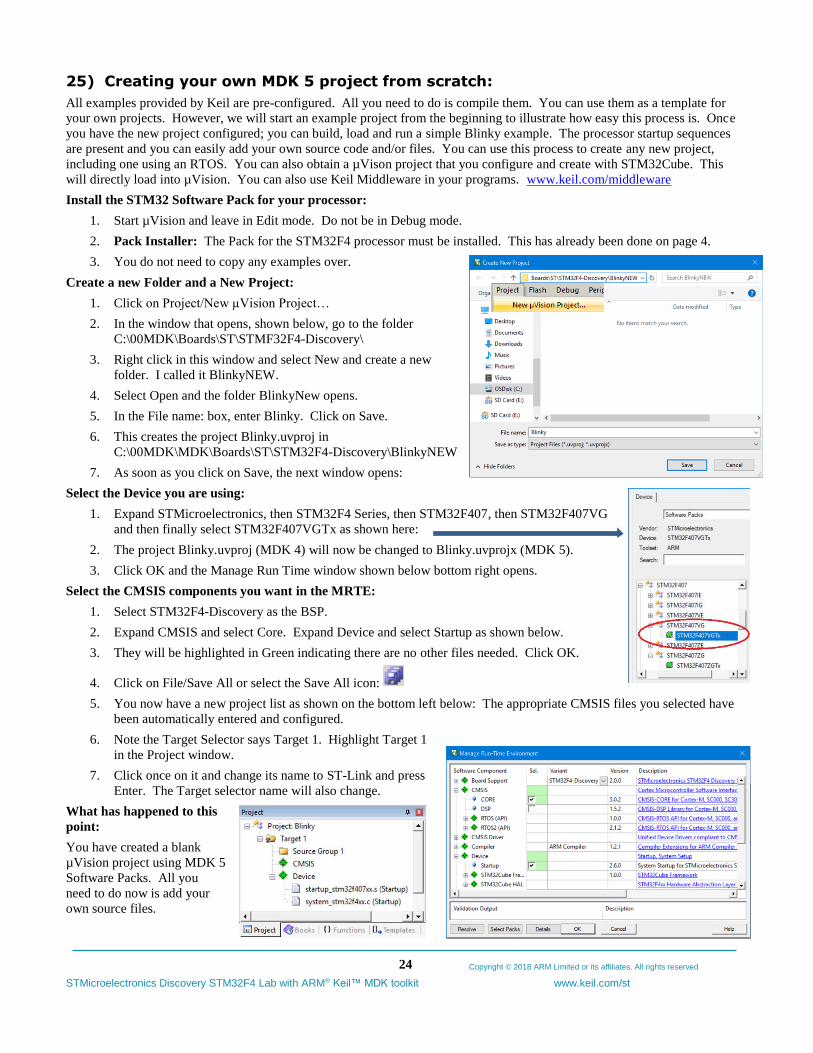
1. Click on Project/New µVision Project…
2. In the window that opens, shown below, go to the folder
C:\00MDK\Boards\ST\STMF32F4-Discovery\
3. Right click in this window and select New and create a new
folder. I called it BlinkyNEW.
4. Select Open and the folder BlinkyNew opens.
5. In the File name: box, enter Blinky. Click on Save.
6. This creates the project Blinky.uvproj in
C:\00MDK\MDK\Boards\ST\STM32F4-Discovery\BlinkyNEW
7. As soon as you click on Save, the next window opens:
Select the Device you are using:
1. Expand STMicroelectronics, then STM32F4 Series, then STM32F407, then STM32F407VG
and then finally select STM32F407VGTx as shown here:
2. The project Blinky.uvproj (MDK 4) will now be changed to Blinky.uvprojx (MDK 5).
3. Click OK and the Manage Run Time window shown below bottom right opens.
Select the CMSIS components you want in the MRTE:
1. Select STM32F4-Discovery as the BSP.
2. Expand CMSIS and select Core. Expand Device and select Startup as shown below.
3. They will be highlighted in Green indicating there are no other files needed. Click OK.
4. Click on File/Save All or select the Save All icon:
5. You now have a new project list as shown on the bottom left below: The appropriate CMSIS files you selected have
been automatically entered and configured.
6. Note the Target Selector says Target 1. Highlight Target 1
in the Project window.
7. Click once on it and change its name to ST-Link and press
Enter. The Target selector name will also change.
What has happened to this
point:
You have created a blank
µVision project using MDK 5
Software Packs. All you
need to do now is add your
own source files.
Copyright © 2018 ARM Limited or its affiliates. All rights reserved
STMicroelectronics Discovery STM32F4 Lab with ARM® Keil™ MDK toolkit www.keil.com/st
25
Create a blank C Source File:
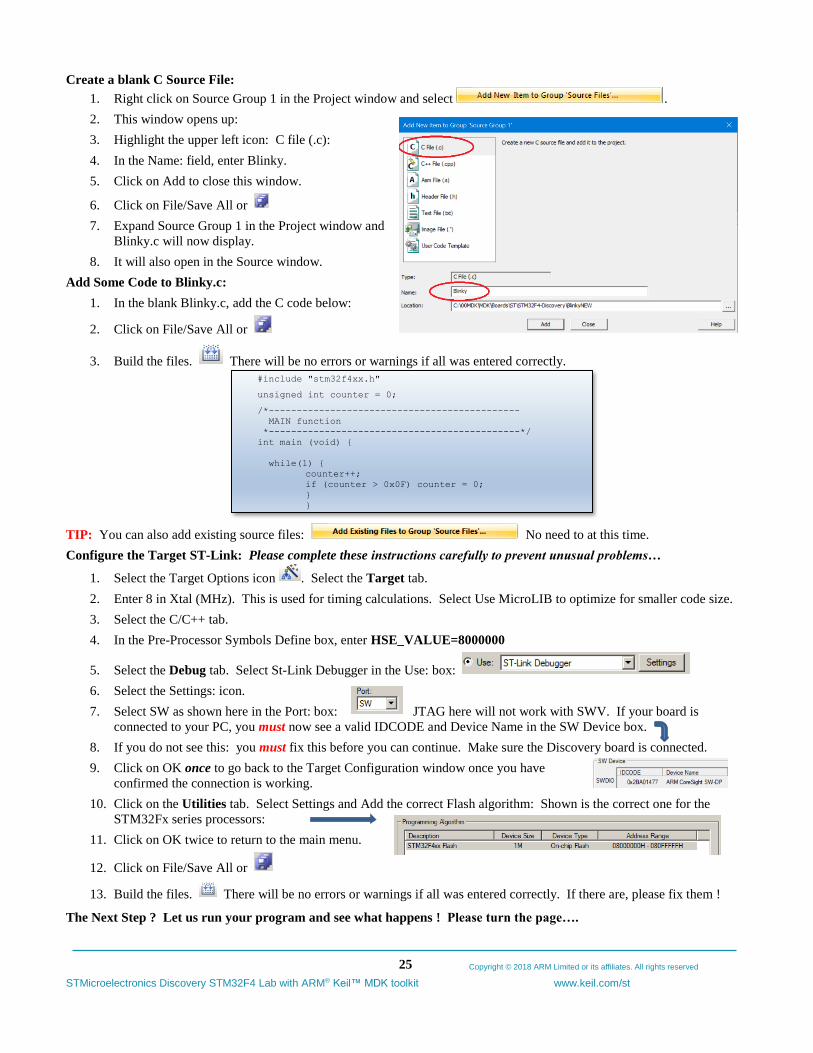
1. Right click on Source Group 1 in the Project window and select .
2. This window opens up:
3. Highlight the upper left icon: C file (.c):
4. In the Name: field, enter Blinky.
5. Click on Add to close this window.
6. Click on File/Save All or
7. Expand Source Group 1 in the Project window and
Blinky.c will now display.
8. It will also open in the Source window.
Add Some Code to Blinky.c:
1. In the blank Blinky.c, add the C code below:
2. Click on File/Save All or
3. Build the files. There will be no errors or warnings if all was entered correctly.
#include "stm32f4xx.h"
unsigned int counter = 0;
/*---------------------------------------------
MAIN function
*---------------------------------------------*/
int main (void) {
while(1) {
counter++;
if (counter > 0x0F) counter = 0;
}
}
TIP: You can also add existing source files: No need to at this time.
Configure the Target ST-Link: Please complete these instructions carefully to prevent unusual problems…
1. Select the Target Options icon . Select the Target tab.
2. Enter 8 in Xtal (MHz). This is used for timing calculations. Select Use MicroLIB to optimize for smaller code size.
3. Select the C/C++ tab.
4. In the Pre-Processor Symbols Define box, enter HSE_VALUE=8000000
5. Select the Debug tab. Select St-Link Debugger in the Use: box:
6. Select the Settings: icon.
7. Select SW as shown here in the Port: box: JTAG here will not work with SWV. If your board is
connected to your PC, you must now see a valid IDCODE and Device Name in the SW Device box.
8. If you do not see this: you must fix this before you can continue. Make sure the Discovery board is connected.
9. Click on OK once to go back to the Target Configuration window once you have
confirmed the connection is working.
10. Click on the Utilities tab. Select Settings and Add the correct Flash algorithm: Shown is the correct one for the
STM32Fx series processors:
11. Click on OK twice to return to the main menu.
12. Click on File/Save All or
13. Build the files. There will be no errors or warnings if all was entered correctly. If there are, please fix them !
The Next Step ? Let us run your program and see what happens ! Please turn the page….
Copyright © 2018 ARM Limited or its affiliates. All rights reserved
STMicroelectronics Discovery STM32F4 Lab with ARM® Keil™ MDK toolkit www.keil.com/st
26
Running Your Program:
1. Enter Debug mode by clicking on the Debug icon . Flash memory will be programmed with progress indicated.
2. Click on the RUN icon. Note: you stop the program with the STOP icon.
3. No LEDs will blink since there is no source to accomplish this task. You could add such code yourself.
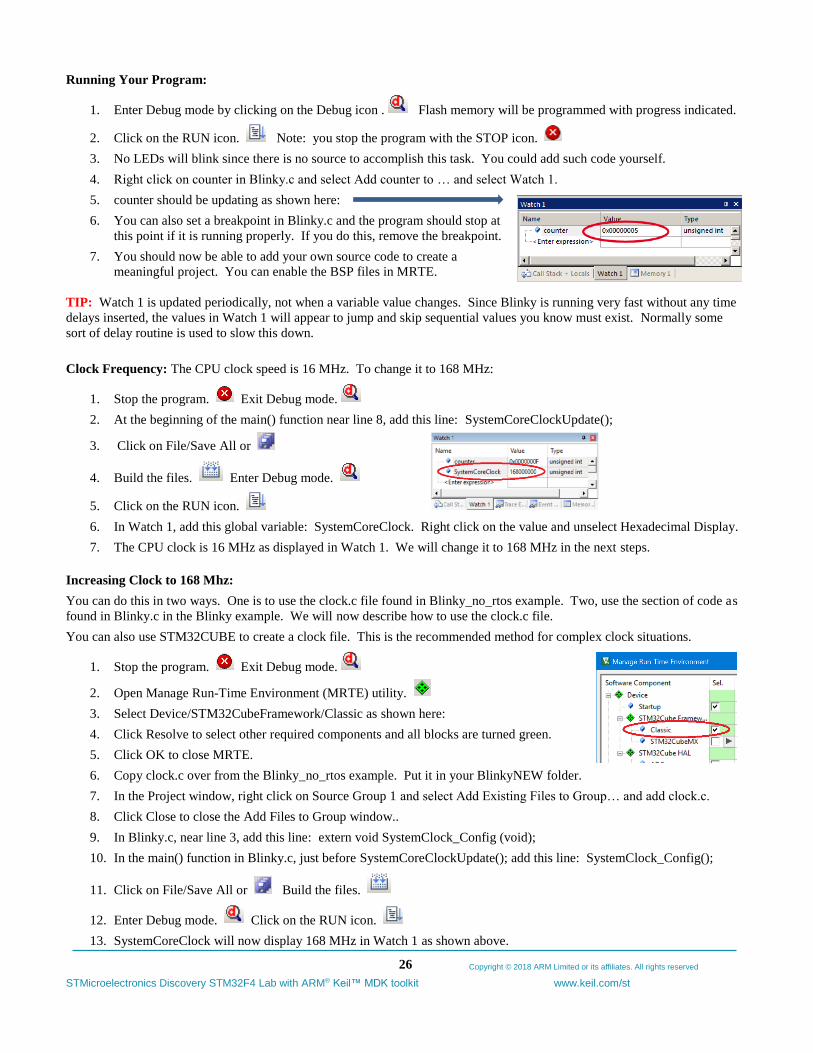
4. Right click on counter in Blinky.c and select Add counter to … and select Watch 1.
5. counter should be updating as shown here:
6. You can also set a breakpoint in Blinky.c and the program should stop at
this point if it is running properly. If you do this, remove the breakpoint.
7. You should now be able to add your own source code to create a
meaningful project. You can enable the BSP files in MRTE.
TIP: Watch 1 is updated periodically, not when a variable value changes. Since Blinky is running very fast without any time
delays inserted, the values in Watch 1 will appear to jump and skip sequential values you know must exist. Normally some
sort of delay routine is used to slow this down.
Clock Frequency: The CPU clock speed is 16 MHz. To change it to 168 MHz:
1. Stop the program. Exit Debug mode.
2. At the beginning of the main() function near line 8, add this line: SystemCoreClockUpdate();
3. Click on File/Save All or
4. Build the files. Enter Debug mode.
5. Click on the RUN icon.
6. In Watch 1, add this global variable: SystemCoreClock. Right click on the value and unselect Hexadecimal Display.
7. The CPU clock is 16 MHz as displayed in Watch 1. We will change it to 168 MHz in the next steps.
Increasing Clock to 168 Mhz:
You can do this in two ways. One is to use the clock.c file found in Blinky_no_rtos example. Two, use the section of code as
found in Blinky.c in the Blinky example. We will now describe how to use the clock.c file.
You can also use STM32CUBE to create a clock file. This is the recommended method for complex clock situations.
1. Stop the program. Exit Debug mode.
2. Open Manage Run-Time Environment (MRTE) utility.
3. Select Device/STM32CubeFramework/Classic as shown here:
4. Click Resolve to select other required components and all blocks are turned green.
5. Click OK to close MRTE.
6. Copy clock.c over from the Blinky_no_rtos example. Put it in your BlinkyNEW folder.
7. In the Project window, right click on Source Group 1 and select Add Existing Files to Group… and add clock.c.
8. Click Close to close the Add Files to Group window..
9. In Blinky.c, near line 3, add this line: extern void SystemClock_Config (void);
10. In the main() function in Blinky.c, just before SystemCoreClockUpdate(); add this line: SystemClock_Config();
11. Click on File/Save All or Build the files.
12. Enter Debug mode. Click on the RUN icon.
13. SystemCoreClock will now display 168 MHz in Watch 1 as shown above.
Copyright © 2018 ARM Limited or its affiliates. All rights reserved
STMicroelectronics Discovery STM32F4 Lab with ARM® Keil™ MDK toolkit www.keil.com/st
27
26) Adding RTX MDK 5 to your project:
The MDK Software Packs makes it easy to configure an RTX project. There are two versions of RTX: RTX 4 and RTX 5.
RTX 4 has a BSD license and RTX5 has Apache 2.0. RTX5 is located here: https://github.com/ARM-software/CMSIS_5
Configuring RTX is easy in MDK 5. These steps use the same configuration as in the preceding Blinky example.
1. Using the same example from the preceding pages, Stop the program and Exit Debug mode.
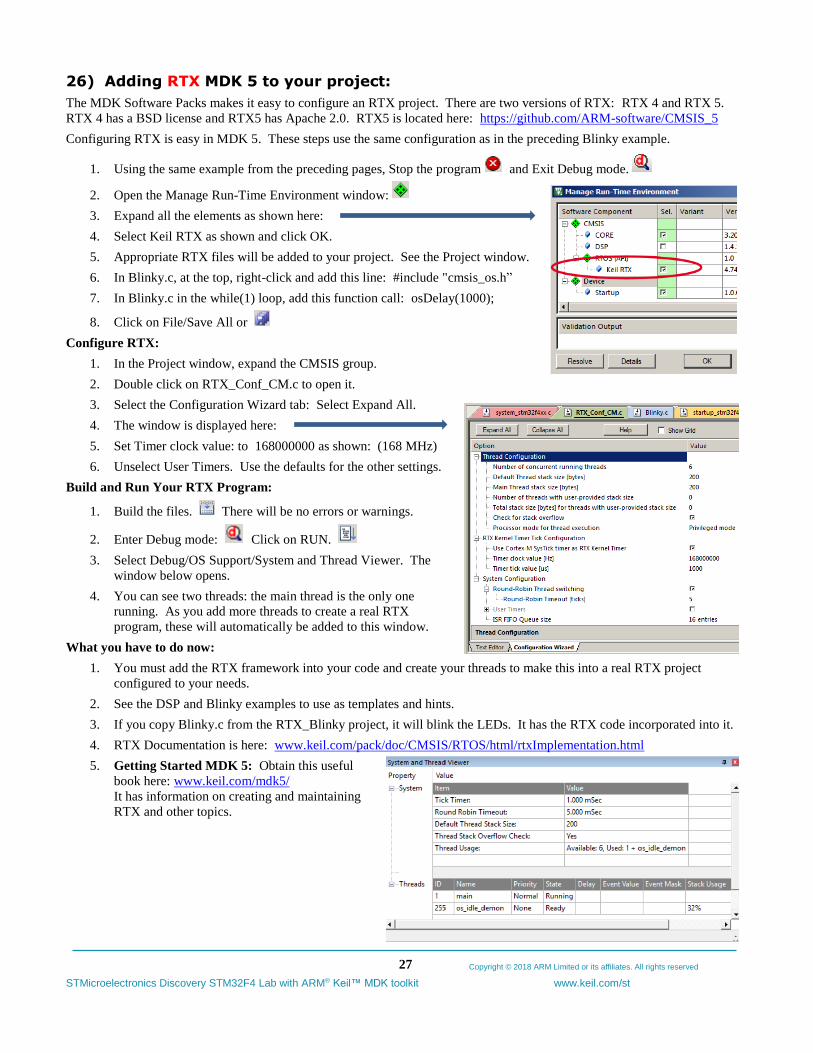
2. Open the Manage Run-Time Environment window:
3. Expand all the elements as shown here:
4. Select Keil RTX as shown and click OK.
5. Appropriate RTX files will be added to your project. See the Project window.
6. In Blinky.c, at the top, right-click and add this line: #include "cmsis_os.h”
7. In Blinky.c in the while(1) loop, add this function call: osDelay(1000);
8. Click on File/Save All or
Configure RTX:
1. In the Project window, expand the CMSIS group.
2. Double click on RTX_Conf_CM.c to open it.
3. Select the Configuration Wizard tab: Select Expand All.
4. The window is displayed here:
5. Set Timer clock value: to 168000000 as shown: (168 MHz)
6. Unselect User Timers. Use the defaults for the other settings.
Build and Run Your RTX Program:
1. Build the files. There will be no errors or warnings.
2. Enter Debug mode: Click on RUN.
3. Select Debug/OS Support/System and Thread Viewer. The
window below opens.
4. You can see two threads: the main thread is the only one
running. As you add more threads to create a real RTX
program, these will automatically be added to this window.
What you have to do now:
1. You must add the RTX framework into your code and create your threads to make this into a real RTX project
configured to your needs.
2. See the DSP and Blinky examples to use as templates and hints.
3. If you copy Blinky.c from the RTX_Blinky project, it will blink the LEDs. It has the RTX code incorporated into it.
4. RTX Documentation is here: www.keil.com/pack/doc/CMSIS/RTOS/html/rtxImplementation.html
5. Getting Started MDK 5: Obtain this useful
book here: www.keil.com/mdk5/
It has information on creating and maintaining
RTX and other topics.
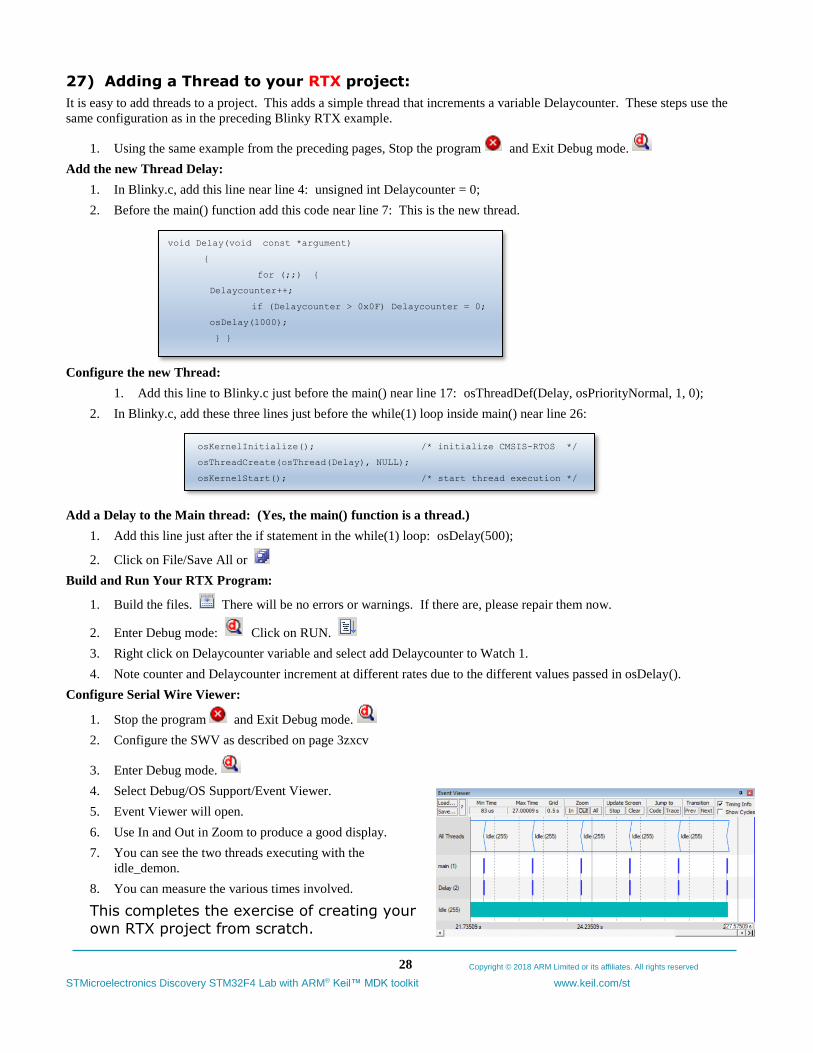
Copyright © 2018 ARM Limited or its affiliates. All rights reserved
STMicroelectronics Discovery STM32F4 Lab with ARM® Keil™ MDK toolkit www.keil.com/st
28
27) Adding a Thread to your RTX project:
It is easy to add threads to a project. This adds a simple thread that increments a variable Delaycounter. These steps use the
same configuration as in the preceding Blinky RTX example.
1. Using the same example from the preceding pages, Stop the program and Exit Debug mode.
Add the new Thread Delay:
1. In Blinky.c, add this line near line 4: unsigned int Delaycounter = 0;
2. Before the main() function add this code near line 7: This is the new thread.
void Delay(void const *argument)
{
for (;;) {
Delaycounter++;
if (Delaycounter > 0x0F) Delaycounter = 0;
osDelay(1000);
} }
Configure the new Thread:
1. Add this line to Blinky.c just before the main() near line 17: osThreadDef(Delay, osPriorityNormal, 1, 0);
2. In Blinky.c, add these three lines just before the while(1) loop inside main() near line 26:
osKernelInitialize(); /* initialize CMSIS-RTOS */
osThreadCreate(osThread(Delay), NULL);
osKernelStart(); /* start thread execution */
Add a Delay to the Main thread: (Yes, the main() function is a thread.)
1. Add this line just after the if statement in the while(1) loop: osDelay(500);
2. Click on File/Save All or
Build and Run Your RTX Program:
1. Build the files. There will be no errors or warnings. If there are, please repair them now.
2. Enter Debug mode: Click on RUN.
3. Right click on Delaycounter variable and select add Delaycounter to Watch 1.
4. Note counter and Delaycounter increment at different rates due to the different values passed in osDelay().
Configure Serial Wire Viewer:
1. Stop the program and Exit Debug mode.
2. Configure the SWV as described on page 3zxcv
3. Enter Debug mode.
4. Select Debug/OS Support/Event Viewer.
5. Event Viewer will open.
6. Use In and Out in Zoom to produce a good display.
7. You can see the two threads executing with the
idle_demon.
8. You can measure the various times involved.
This completes the exercise of creating your
own RTX project from scratch.
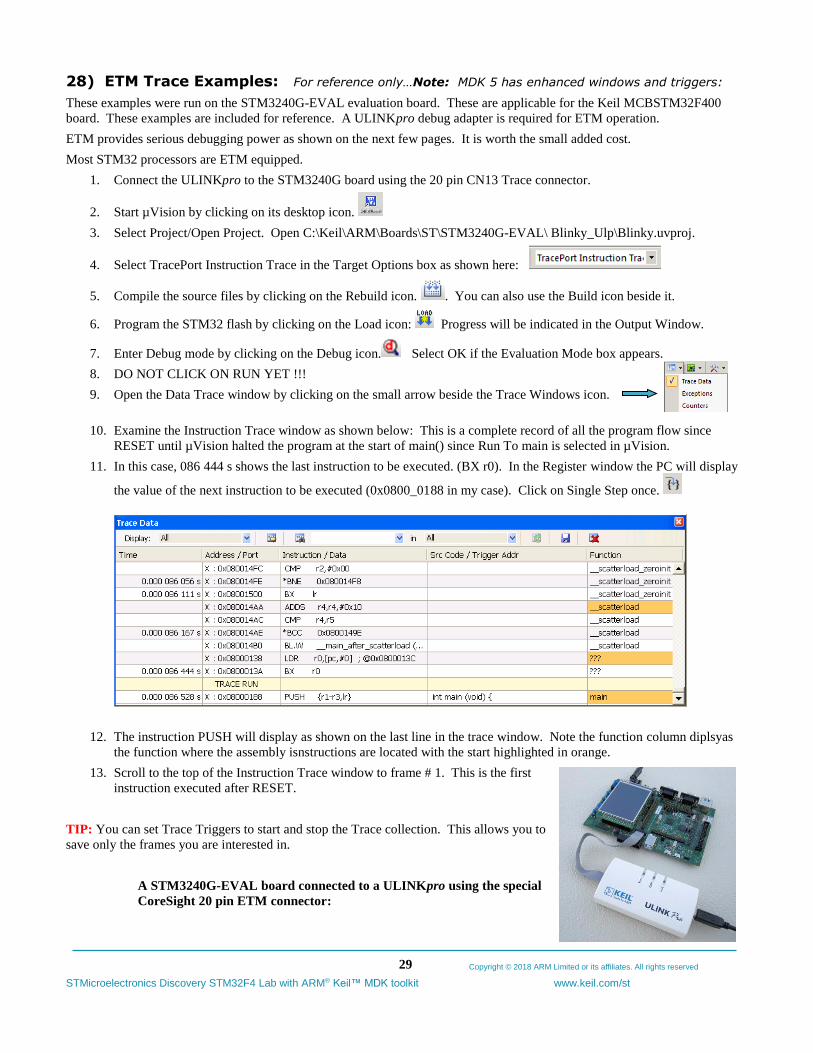
Copyright © 2018 ARM Limited or its affiliates. All rights reserved
STMicroelectronics Discovery STM32F4 Lab with ARM® Keil™ MDK toolkit www.keil.com/st
29
28) ETM Trace Examples: For reference only…Note: MDK 5 has enhanced windows and triggers:
These examples were run on the STM3240G-EVAL evaluation board. These are applicable for the Keil MCBSTM32F400
board. These examples are included for reference. A ULINKpro debug adapter is required for ETM operation.
ETM provides serious debugging power as shown on the next few pages. It is worth the small added cost.
Most STM32 processors are ETM equipped.
1. Connect the ULINKpro to the STM3240G board using the 20 pin CN13 Trace connector.
2. Start µVision by clicking on its desktop icon.
3. Select Project/Open Project. Open C:\Keil\ARM\Boards\ST\STM3240G-EVAL\ Blinky_Ulp\Blinky.uvproj.
4. Select TracePort Instruction Trace in the Target Options box as shown here:
5. Compile the source files by clicking on the Rebuild icon. . You can also use the Build icon beside it.
6. Program the STM32 flash by clicking on the Load icon: Progress will be indicated in the Output Window.
7. Enter Debug mode by clicking on the Debug icon. Select OK if the Evaluation Mode box appears.
8. DO NOT CLICK ON RUN YET !!!
9. Open the Data Trace window by clicking on the small arrow beside the Trace Windows icon.
10. Examine the Instruction Trace window as shown below: This is a complete record of all the program flow since
RESET until µVision halted the program at the start of main() since Run To main is selected in µVision.
11. In this case, 086 444 s shows the last instruction to be executed. (BX r0). In the Register window the PC will display
the value of the next instruction to be executed (0x0800_0188 in my case). Click on Single Step once.
12. The instruction PUSH will display as shown on the last line in the trace window. Note the function column diplsyas
the function where the assembly isnstructions are located with the start highlighted in orange.
13. Scroll to the top of the Instruction Trace window to frame # 1. This is the first
instruction executed after RESET.
TIP: You can set Trace Triggers to start and stop the Trace collection. This allows you to
save only the frames you are interested in.
A STM3240G-EVAL board connected to a ULINKpro using the special
CoreSight 20 pin ETM connector:
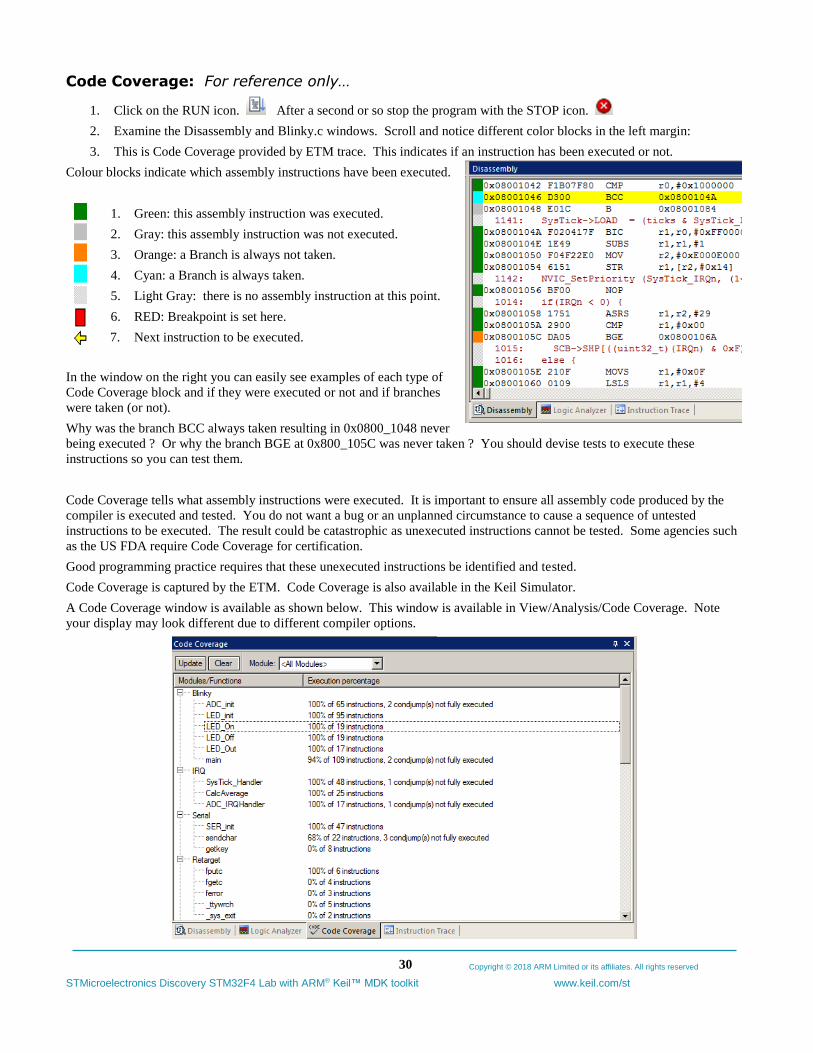
Copyright © 2018 ARM Limited or its affiliates. All rights reserved
STMicroelectronics Discovery STM32F4 Lab with ARM® Keil™ MDK toolkit www.keil.com/st
30
Code Coverage: For reference only…
1. Click on the RUN icon. After a second or so stop the program with the STOP icon.
2. Examine the Disassembly and Blinky.c windows. Scroll and notice different color blocks in the left margin:
3. This is Code Coverage provided by ETM trace. This indicates if an instruction has been executed or not.
Colour blocks indicate which assembly instructions have been executed.
1. Green: this assembly instruction was executed.
2. Gray: this assembly instruction was not executed.
3. Orange: a Branch is always not taken.
4. Cyan: a Branch is always taken.
5. Light Gray: there is no assembly instruction at this point.
6. RED: Breakpoint is set here.
7. Next instruction to be executed.
In the window on the right you can easily see examples of each type of
Code Coverage block and if they were executed or not and if branches
were taken (or not).
Why was the branch BCC always taken resulting in 0x0800_1048 never
being executed ? Or why the branch BGE at 0x800_105C was never taken ? You should devise tests to execute these
instructions so you can test them.
Code Coverage tells what assembly instructions were executed. It is important to ensure all assembly code produced by the
compiler is executed and tested. You do not want a bug or an unplanned circumstance to cause a sequence of untested
instructions to be executed. The result could be catastrophic as unexecuted instructions cannot be tested. Some agencies such
as the US FDA require Code Coverage for certification.
Good programming practice requires that these unexecuted instructions be identified and tested.
Code Coverage is captured by the ETM. Code Coverage is also available in the Keil Simulator.
A Code Coverage window is available as shown below. This window is available in View/Analysis/Code Coverage. Note
your display may look different due to different compiler options.
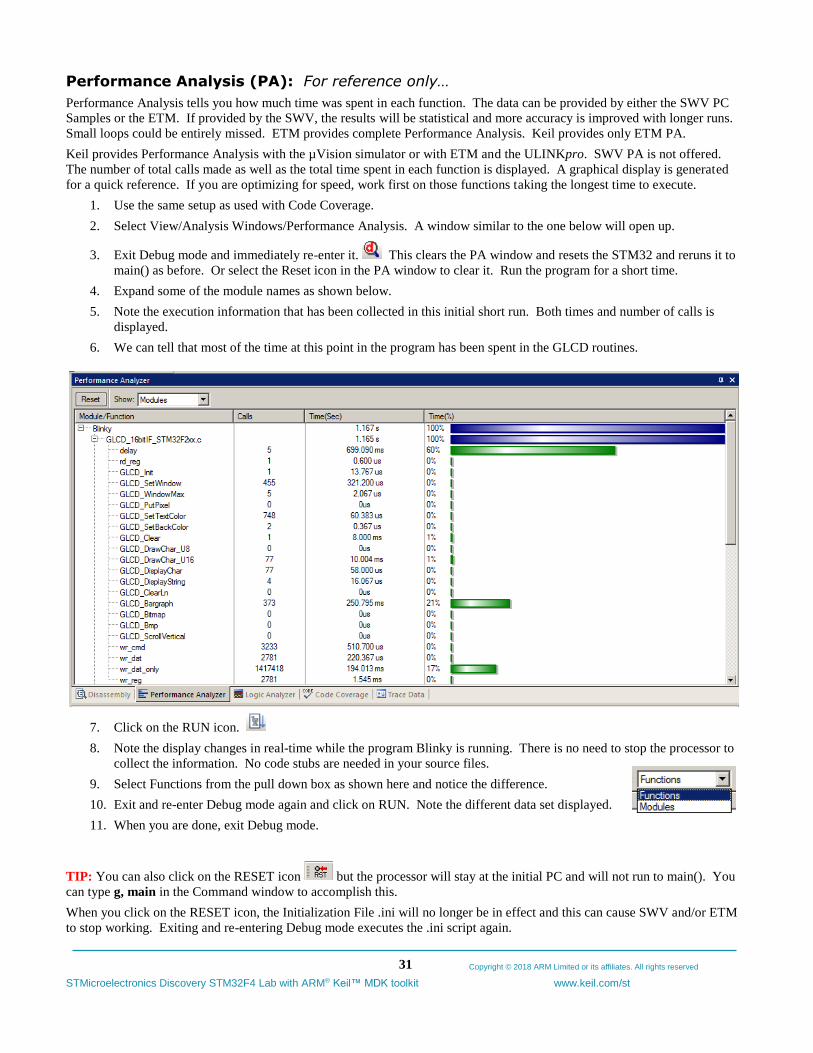
Copyright © 2018 ARM Limited or its affiliates. All rights reserved
STMicroelectronics Discovery STM32F4 Lab with ARM® Keil™ MDK toolkit www.keil.com/st
31
Performance Analysis (PA): For reference only…
Performance Analysis tells you how much time was spent in each function. The data can be provided by either the SWV PC
Samples or the ETM. If provided by the SWV, the results will be statistical and more accuracy is improved with longer runs.
Small loops could be entirely missed. ETM provides complete Performance Analysis. Keil provides only ETM PA.
Keil provides Performance Analysis with the µVision simulator or with ETM and the ULINKpro. SWV PA is not offered.
The number of total calls made as well as the total time spent in each function is displayed. A graphical display is generated
for a quick reference. If you are optimizing for speed, work first on those functions taking the longest time to execute.
1. Use the same setup as used with Code Coverage.
2. Select View/Analysis Windows/Performance Analysis. A window similar to the one below will open up.
3. Exit Debug mode and immediately re-enter it. This clears the PA window and resets the STM32 and reruns it to
main() as before. Or select the Reset icon in the PA window to clear it. Run the program for a short time.
4. Expand some of the module names as shown below.
5. Note the execution information that has been collected in this initial short run. Both times and number of calls is
displayed.
6. We can tell that most of the time at this point in the program has been spent in the GLCD routines.
7. Click on the RUN icon.
8. Note the display changes in real-time while the program Blinky is running. There is no need to stop the processor to
collect the information. No code stubs are needed in your source files.
9. Select Functions from the pull down box as shown here and notice the difference.
10. Exit and re-enter Debug mode again and click on RUN. Note the different data set displayed.
11. When you are done, exit Debug mode.
TIP: You can also click on the RESET icon but the processor will stay at the initial PC and will not run to main(). You
can type g, main in the Command window to accomplish this.
When you click on the RESET icon, the Initialization File .ini will no longer be in effect and this can cause SWV and/or ETM
to stop working. Exiting and re-entering Debug mode executes the .ini script again.
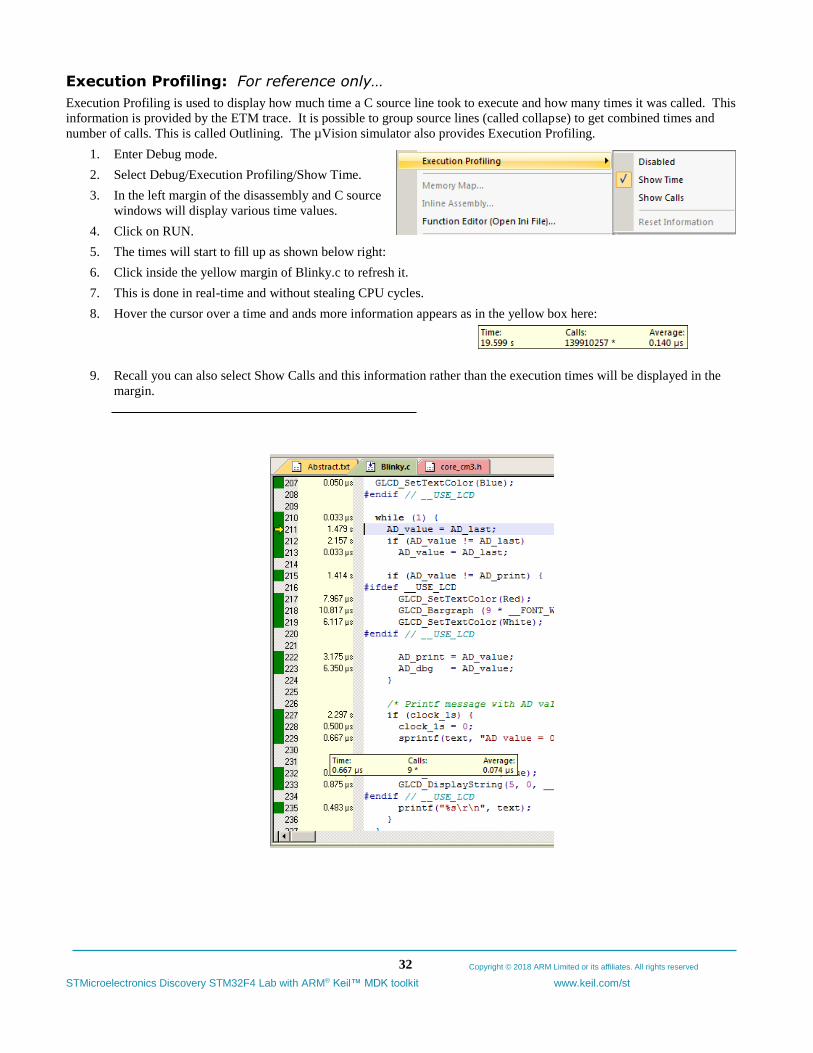
Copyright © 2018 ARM Limited or its affiliates. All rights reserved
STMicroelectronics Discovery STM32F4 Lab with ARM® Keil™ MDK toolkit www.keil.com/st
32
Execution Profiling: For reference only…
Execution Profiling is used to display how much time a C source line took to execute and how many times it was called. This
information is provided by the ETM trace. It is possible to group source lines (called collapse) to get combined times and
number of calls. This is called Outlining. The µVision simulator also provides Execution Profiling.
1. Enter Debug mode.
2. Select Debug/Execution Profiling/Show Time.
3. In the left margin of the disassembly and C source
windows will display various time values.
4. Click on RUN.
5. The times will start to fill up as shown below right:
6. Click inside the yellow margin of Blinky.c to refresh it.
7. This is done in real-time and without stealing CPU cycles.
8. Hover the cursor over a time and ands more information appears as in the yellow box here:
9. Recall you can also select Show Calls and this information rather than the execution times will be displayed in the
margin.
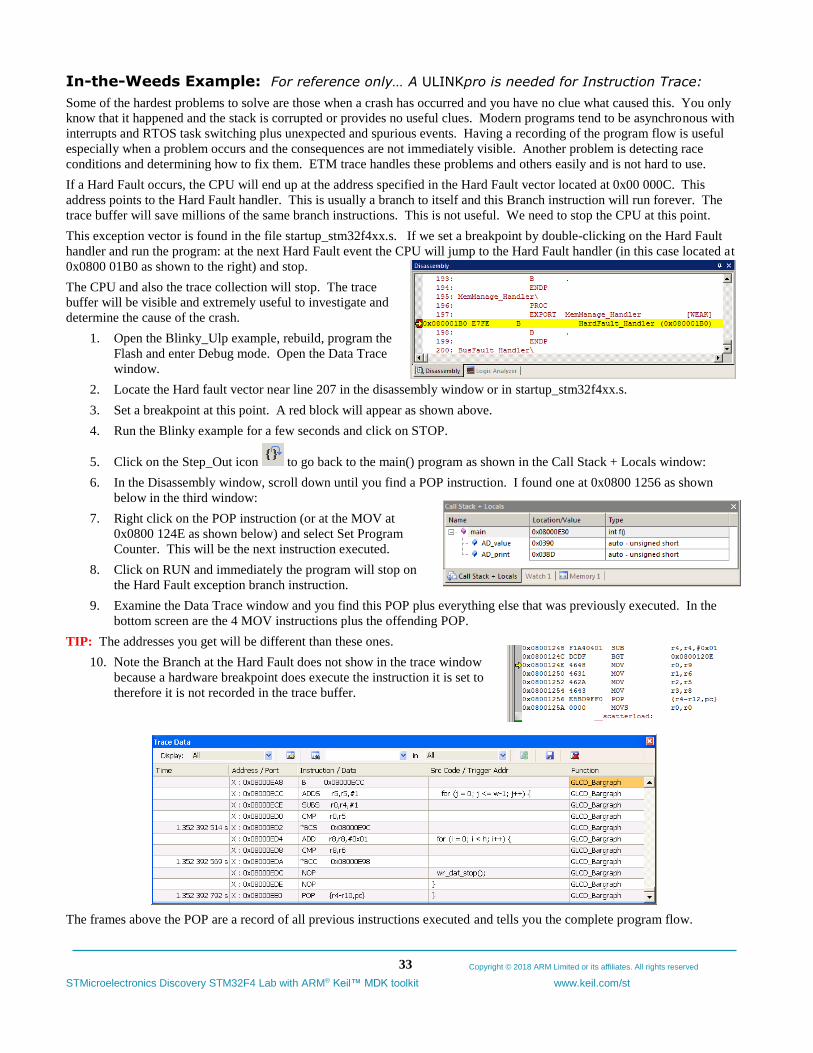
Copyright © 2018 ARM Limited or its affiliates. All rights reserved
STMicroelectronics Discovery STM32F4 Lab with ARM® Keil™ MDK toolkit www.keil.com/st
33
In-the-Weeds Example: For reference only… A ULINKpro is needed for Instruction Trace:
Some of the hardest problems to solve are those when a crash has occurred and you have no clue what caused this. You only
know that it happened and the stack is corrupted or provides no useful clues. Modern programs tend to be asynchronous with
interrupts and RTOS task switching plus unexpected and spurious events. Having a recording of the program flow is useful
especially when a problem occurs and the consequences are not immediately visible. Another problem is detecting race
conditions and determining how to fix them. ETM trace handles these problems and others easily and is not hard to use.
If a Hard Fault occurs, the CPU will end up at the address specified in the Hard Fault vector located at 0x00 000C. This
address points to the Hard Fault handler. This is usually a branch to itself and this Branch instruction will run forever. The
trace buffer will save millions of the same branch instructions. This is not useful. We need to stop the CPU at this point.
This exception vector is found in the file startup_stm32f4xx.s. If we set a breakpoint by double-clicking on the Hard Fault
handler and run the program: at the next Hard Fault event the CPU will jump to the Hard Fault handler (in this case located at
0x0800 01B0 as shown to the right) and stop.
The CPU and also the trace collection will stop. The trace
buffer will be visible and extremely useful to investigate and
determine the cause of the crash.
1. Open the Blinky_Ulp example, rebuild, program the
Flash and enter Debug mode. Open the Data Trace
window.
2. Locate the Hard fault vector near line 207 in the disassembly window or in startup_stm32f4xx.s.
3. Set a breakpoint at this point. A red block will appear as shown above.
4. Run the Blinky example for a few seconds and click on STOP.
5. Click on the Step_Out icon to go back to the main() program as shown in the Call Stack + Locals window:
6. In the Disassembly window, scroll down until you find a POP instruction. I found one at 0x0800 1256 as shown
below in the third window:
7. Right click on the POP instruction (or at the MOV at
0x0800 124E as shown below) and select Set Program
Counter. This will be the next instruction executed.
8. Click on RUN and immediately the program will stop on
the Hard Fault exception branch instruction.
9. Examine the Data Trace window and you find this POP plus everything else that was previously executed. In the
bottom screen are the 4 MOV instructions plus the offending POP.
TIP: The addresses you get will be different than these ones.
10. Note the Branch at the Hard Fault does not show in the trace window
because a hardware breakpoint does execute the instruction it is set to
therefore it is not recorded in the trace buffer.
The frames above the POP are a record of all previous instructions executed and tells you the complete program flow.
Copyright © 2018 ARM Limited or its affiliates. All rights reserved
STMicroelectronics Discovery STM32F4 Lab with ARM® Keil™ MDK toolkit www.keil.com/st
34
29) Serial Wire Viewer and ETM Trace Summary:
Serial Wire Viewer can see:
▪ Global variables.
▪ Static variables.
▪ Structures.
▪ Peripheral registers – just read or write to them.
▪ Can’t see local variables. (just make them global or static).
▪ Can’t see DMA transfers – DMA bypasses CPU and SWV by definition.
Serial Wire Viewer displays in various ways:
▪ PC Samples.
▪ Data reads and writes.
▪ Exception and interrupt events.
▪ CPU counters.
▪ Timestamps.
ETM Trace is good for:
▪ Trace adds significant power to debugging efforts. Tells where the program has been.
▪ A recorded history of the program execution in the order it happened.
▪ Trace can often find nasty problems very quickly. Weeks or months can be replaced by minutes.
▪ Especially where the bug occurs a long time before the consequences are seen.
▪ Or where the state of the system disappears with a change in scope(s).
▪ Plus - don’t have to stop the program. Crucial to some projects.
These are the types of problems that can be found with a quality ETM trace:
▪ Pointer problems. Illegal instructions and data aborts (such as misaligned writes).
▪ Code overwrites – writes to Flash, unexpected writes to peripheral registers (SFRs), a corrupted stack.
How did I get here ?
▪ Out of bounds data. Uninitialized variables and arrays.
▪ Stack overflows. What causes the stack to grow bigger than it should ?
▪ Runaway programs: your program has gone off into the weeds and you need to know what instruction caused this. Is
very tough to find these problems without a trace. ETM trace is best for this.
▪ Communication protocol and timing issues. System timing problems.
▪ ETM facilitates Code Coverage, Performance Analysis and program flow debugging and analysis.
For information on Instruction Trace (ETM) please visit www.keil.com/st for other labs discussing ETM.
Copyright © 2018 ARM Limited or its affiliates. All rights reserved
STMicroelectronics Discovery STM32F4 Lab with ARM® Keil™ MDK toolkit www.keil.com/st
35
30) Document Resources: See www.keil.com/st
Books:
1. NEW! Getting Started MDK 5: Obtain this free book here: www.keil.com/mdk5/.
2. There is a good selection of books available on ARM processors.
3. A list of resources is located at: https://developer.arm.com/support/arm-books/arm-embedded-systems-books
4. The Definitive Guide to the ARM Cortex-M0/M0+ by Joseph Yiu. Search the web for retailers.
5. The Definitive Guide to the ARM Cortex-M3/M4 by Joseph Yiu. Search the web for retailers.
6. Embedded Systems: Introduction to Arm Cortex-M Microcontrollers (3 volumes) by Jonathan Valvano.
7. µVision has a window titled Books. Documents for your selected processor including data sheets are located there.
Application Notes:
1. Using Cortex-M3 and Cortex-M4 Fault Exceptions www.keil.com/appnotes/files/apnt209.pdf
2. Segger emWin GUIBuilder with µVision™ www.keil.com/appnotes/files/apnt_234.pdf
3. Porting mbed Project to Keil MDK™ www.keil.com/appnotes/docs/apnt_207.asp
4. MDK-ARM™ Compiler Optimizations www.keil.com/appnotes/docs/apnt_202.asp
5. Using µVision with CodeSourcery GNU www.keil.com/appnotes/docs/apnt_199.asp
6. GCC Arm Developer: https://developer.arm.com/open-source/gnu-toolchain/gnu-rm/downloads
7. RTX CMSIS-RTOS www.keil.com/rtx https://github.com/ARM-software/CMSIS_5
8. Barrier Instructions http://infocenter.arm.com/help/topic/com.arm.doc.dai0321a/index.html
9. Lazy Stacking on the Cortex-M4: www.arm.com and search for DAI0298A
10. Cortex Debug Connectors: www.arm.com and search for cortex_debug_connectors.pdf
11. Sending ITM printf to external Windows applications: www.keil.com/appnotes/docs/apnt_240.asp
12. Migrating Cortex-M3/M4 to Cortex-M7 processors: www.keil.com/appnotes/docs/apnt_270.asp
13. ARMv8-M Architecture Technical Overview www.keil.com/appnotes/files/apnt_291.pdf
14. ARMv8-M Architecture Technical Overview: Joseph Yiu Search for this title and author.
15. Determining Cortex-M CPU Frequency using SWV www.keil.com/appnotes/docs/apnt_297.asp
Keil Tutorials for STMicroelectronics Boards: see www.keil.com/st
Useful ARM Websites:
1. CMSIS Standards: https://github.com/ARM-software/CMSIS_5 and www.arm.com/cmsis/
2. Keil and ARM Community Forums: www.keil.com/forum and https://developer.arm.com/
3. ARM University Program: www.arm.com/university. Email: [email protected]
4. mbed™: http://mbed.org
For more information:
Sales In Americas: [email protected] or 800-348-8051. Europe/Asia: [email protected] +49 89/456040-20
Keil Technical Support in USA: [email protected] or 800-348-8051. Outside the US: [email protected].
Global Inside Sales Contact Point: [email protected] Arm Keil World Distributors: www.keil.com/distis
Forums: www.keil.com/forum http://community.arm.com/groups/tools/content https://developer.arm.com/
For comments, additions or corrections please email [email protected]

Copyright © 2018 ARM Limited or its affiliates. All rights reserved
STMicroelectronics Discovery STM32F4 Lab with ARM® Keil™ MDK toolkit www.keil.com/st
36
31) Keil Products and Contact Information:
Keil Microcontroller Development Kit (MDK-ARM™)
▪ MDK-Lite™ (Evaluation version) up to 32K Code and Data Limit - $0
▪ MDK - for STM32L0 and STM32F0: www.keil.com/st $0
▪ New MDK-ARM-Essential™ For all Cortex-M series processors – unlimited code limit
▪ New MDK-Plus™ MiddleWare Level 1. ARM7™, ARM9™, Cortex-M, SecureCore®.
▪ New MDK-Professional™ MiddleWare Level 2. For details: www.keil.com/mdk5/version520.
For special promotional pricing and offers, please contact Keil Sales for details.
USB-JTAG adapters (for Flash programming too)
▪ ULINK2 - (ULINK2 and ME - SWV only – no ETM) ULINK-ME is equivalent to a ULINK2.
▪ New ULINKplus- Power Measurement and Cortex-Mx High performance SWV.
▪ ULINKpro - Cortex-Mx SWV & ETM instruction trace. Code Coverage and Performance Analysis.
▪ ULINKpro D - Cortex-Mx SWV no ETM trace ULINKpro also works with Arm DS-5.
MDK also supports ST-Link, CMSIS-DAP and Segger J-Link Debug adapters.
Keil RTX™ Real Time Operating System: www.keil.com/rtx
▪ RTX is provided free as part of Keil MDK. It is the full version of RTX.
▪ RTX is ported to other tools and including some Cortex-A processors.
▪ No royalties are required. It has a BSD or Apache 2.0 license.
▪ https://github.com/ARM-software/CMSIS_5
▪ RTX source code is included with all versions of MDK.
▪ Kernel Awareness visibility windows are integral to µVision.
Keil provides free DSP libraries with source code for Cortex-M processors.
Keil Sales and Technical Support can provide advice about the various tools
options available to you plus various labs and appnotes.
All products are available from stock.
All products include Technical Support for 1 year. This is easily renewed.
MDK supports STM32 Cortex-M3, Cortex-M4 and Cortex-M7 processors.
Keil supports many other ST processors including 8051, ARM7, ARM9™
and ST10 processors. See the Keil Device Database® on www.keil.com/dd for the
complete list of STMicroelectronics support. See www.keil.com/ST
Contact Keil Sales for USA prices. Contact [email protected] for pricing in other countries.
For the entire Keil catalog see www.keil.com or contact Keil or your local distributor.
For Linux, Android and bare metal (no OS) support on ST processors such as SPEAr, please see DS-5 www.arm.com/ds5.
For more information:
Sales In Americas: [email protected] or 800-348-8051. Europe/Asia: [email protected] +49 89/456040-20
Keil Technical Support in USA: [email protected] or 800-348-8051. Outside the US: [email protected].
Global Inside Sales Contact Point: [email protected] Arm Keil World Distributors: www.keil.com/distis
Forums: www.keil.com/forum http://community.arm.com/groups/tools/content https://developer.arm.com/