Embed Size (px)
Citation preview
IEEE TRANSACTIONS ON INTELLIGENT TRANSPORTATION SYSTEMS, VOL. 13, NO. 4, DECEMBER 2012 1803
Stochastic Modeling of Traffic Flow BreakdownPhenomenon: Application to Predicting
Travel Time ReliabilityJing Dong and Hani S. Mahmassani
Abstract—This paper presents a modeling approach in generat-ing random flow breakdowns on congested freeways and capturingsubsequent wave propagation among heterogeneous drivers. Theapproach is intended for predicting travel time variability causedby such stochastic phenomena. It is assumed that breakdown mayoccur at different flow levels with some probability and wouldsustain for a random duration. This is modeled at the micro-scopic level by considering speed changes that are initiated bya leading vehicle and propagated by the following vehicles withcorrelated–distributed behavioral parameters. Numerical resultsfrom a Monte Carlo simulation demonstrate that the proposedstochastic modeling approach produces a realistic macroscopictraffic flow behavior and can be used to generate travel timedistributions.
Index Terms—Car-following model, duration model, flowbreakdown probability, heterogeneous drivers, Monte Carlo sim-ulation, travel time reliability.
I. INTRODUCTION
TRAVEL time reliability has been recognized as an impor-tant factor in traveler decisions [1], [2], particularly under
congested traffic conditions where travel time is expected tobe less predictable. Many factors account for the uncertaintyassociated with travel time, including accidents, work zones,adverse weather, special events, traffic control devices, fluctu-ations in demand, and inadequate base capacity [3]. Althoughsignificant progress has recently been made in understandingand measurement of travel time reliability [2], [4]–[7], generat-ing realistic reliability measures as output in traffic simulationmodels and planning tools remains an open question. To eval-uate transportation network reliability performance measuresand assess both the short-term and long-running impacts ofmanagement interventions and policies aimed at improvingtravel time and service reliability, traffic models need to capturethe causes of unreliability and the underlying physics of theassociated processes and phenomena.
Manuscript received November 6, 2011; revised March 19, 2012; acceptedJune 5, 2012. Date of publication July 23, 2012; date of current versionNovember 27, 2012. This work of H. S. Mahmassani was supported in partby the National Science Foundation Civil Infrastructure Systems under Grant0928577. The Associate Editor for this paper was W.-H. Lin.
J. Dong is with Oak Ridge National Laboratory, Oak Ridge, TN 37831 USA(e-mail: [email protected]).
H. S. Mahmassani is with Northwestern University, Evanston, IL 60208 USA(e-mail: [email protected]).
Color versions of one or more of the figures in this paper are available onlineat http://ieeexplore.ieee.org.
Digital Object Identifier 10.1109/TITS.2012.2207433
Among many sources that contribute to travel time variabil-ity, flow breakdown is one of the causes that primarily residein traffic physics [8] and can be viewed as a collective phe-nomenon resulting from many individual decisions. Previousstudies have shown that traffic breakdown may occur with someprobability at various flow levels [9]–[11]. A systematic relationbetween the likelihood of breakdown and the prevailing trafficconditions has been established, yielding the probability of flowbreakdown as a function of the flow rate [10], [11]. In addition,the duration of the breakdown event can be viewed as a randomvariable and characterized by a hazard model [12]. Building onthese research findings, this study proposes a methodology toproduce random flow breakdowns, capture the subsequent wavepropagation among heterogeneous drivers, and thus generatetravel time distributions.
The rest of this paper is organized as follows: In the nextsection, the probabilistic characteristics associated with flowbreakdown are studied based on field observations. After that,a stochastic modeling approach that endogenously producesflow breakdown in traffic simulation models is introduced inSection III, followed by numerical results from a Monte Carlosimulation in Section IV. Finally, conclusions and remarkson possible directions for future investigation are stated inSection V.
II. PROBABILISTIC TRAFFIC FLOW BREAKDOWN
This section introduces the probabilistic flow breakdownphenomenon based on the analysis of real-world measurements.
To examine breakdown traffic characteristics, 5-min averagesof flow, speed, and density data measured by the detectorupstream from an on-ramp and averaged over all lanes on theI-405N Freeway (Irvine, CA) at the Jeffrey section were col-lected (source: Caltrans Performance Measurement System,website http://pems.dot.ca.gov). Note that the choice of aggre-gation time interval could affect the analysis results. In theliterature, 5-min [11]–[13] and 10-min [2] aggregation intervalshave been used in breakdown analysis of U.S., German, andDutch freeways.
Flow breakdown is detected when a substantial speed dropfrom the free mean speed occurs between two consecutivetime intervals. The speed drop between two consecutive timeintervals (i.e., the minimum speed difference) and the timeduration over which the low speed is sustained (i.e., the min-imum breakdown duration), when used together, have been
1524-9050/$31.00 © 2012 IEEE
1804 IEEE TRANSACTIONS ON INTELLIGENT TRANSPORTATION SYSTEMS, VOL. 13, NO. 4, DECEMBER 2012
suggested as an appropriate set of criteria to detect breakdownoccurrence [11]–[13]. The speed limit is 65 mi/h for the I-405NFreeway. When the speed drops below 55 mi/h and low speed issustained for at least three time intervals (i.e., 15 min), a trafficbreakdown is identified. The minimum breakdown duration isused to eliminate “false alarms” due to flow fluctuation. Threequantities are defined in this context.
1) prebreakdown flow rate: the flow rate, which is expressedas a per-lane equivalent hourly rate, observed immedi-ately before the onset of traffic breakdown;
2) breakdown flow rate, density, and speed: the averageflow rate, density, and speed observed after the onset ofbreakdown and before traffic recovery;
3) breakdown duration: the time period between the onsetof breakdown and the recovery of traffic flow.
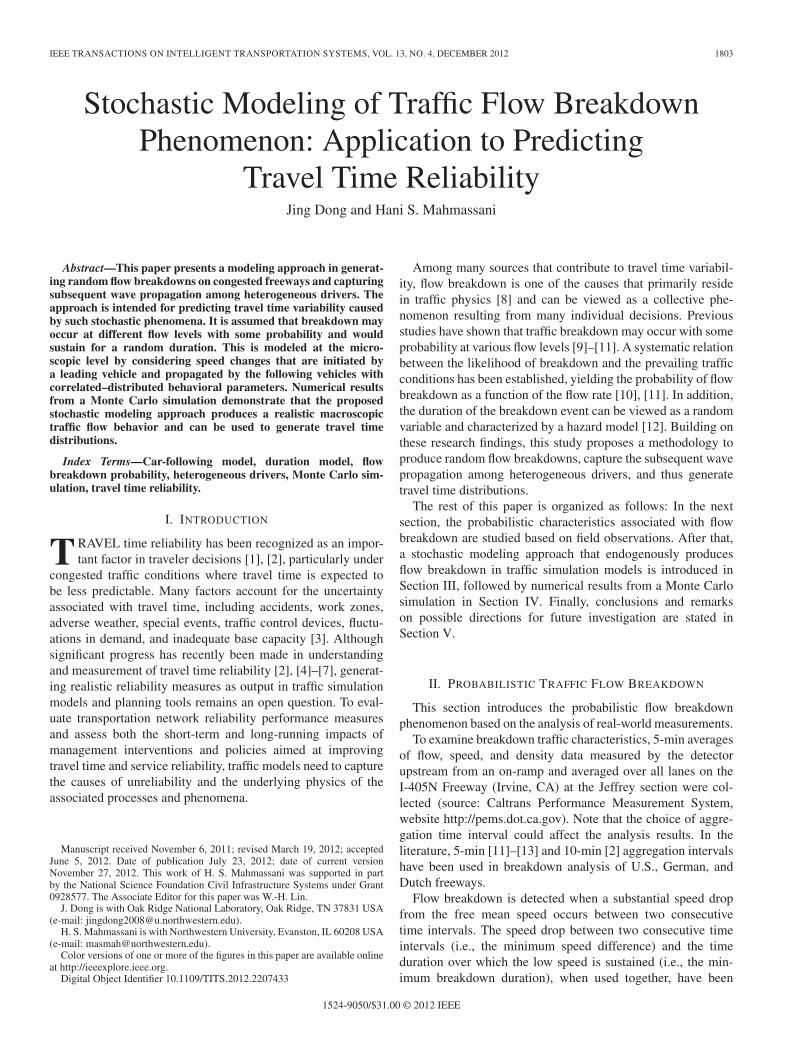
By analyzing traffic data observed on work days over aperiod of seven months, we identified 227 occurrences ofbreakdown, most of which happened during the morning orevening rush hours. The occurrence of these flow breakdownscould be due to a local perturbation in traffic flow at theconsidered freeway section (i.e., spontaneous breakdown) orcaused by an external disturbance associated with a queuespillback from a downstream location (i.e., induced breakdown)[2]. Fig. 1(a) plots the flow rate and density observed beforeand after breakdown. The scattering of observations indicatesthat flow breakdown occurs at various flow rates and results ina wide range of congested traffic states associated with differentspeeds, flows, and densities during breakdown. As the averagebreakdown speed and its duration largely determine the delaycaused by a certain breakdown event, the distributions of thesetwo variables are further examined and plotted in Fig. 1(b) and(c), respectively. The breakdown speeds are used to calibratea left-truncated normal distribution function, from which arandom breakdown speed can be drawn in the process of quan-tifying travel time reliability [see (9)]. The breakdown durationdata, in conjunction with the breakdown speeds, are used tocalibrate the hazard function [see (2)] describing the probabilitythat breakdown will end at a certain time, as discussed in thenext section.
III. METHODOLOGY
This section presents a modeling approach in endogenouslygenerating a random breakdown and its duration, capturing thewave propagation after the onset of breakdown, and conse-quently producing traffic flow patterns consistent with the ob-servations described in the previous section. As shown in Fig. 2,the likelihood of breakdown is modeled as a function of theprevailing flow rate [11], the breakdown speed is drawn from aprobability distribution [see Fig. 1(b)], and the breakdown du-ration is characterized by a hazard model [12]. At the start andthe end of a breakdown event, the leading vehicle changes thetravel speed, which propagates among heterogeneous driversaccording to a simplified car-following model with distributedbehavioral parameters [14]. The sudden reduction in speedmight be caused by different types of traffic flow behavior,including “bunching” of vehicles, intended interruptions, andvehicle merging maneuvers [3], and has been observed by
Fig. 1. Traffic characteristics of flow breakdown. The data were collectedon workdays from 6/1/2007 to 12/28/2007 on the I-405N Freeway at theJeffrey section. There are 227 occurrences of breakdown. (a) Flow anddensity scatter plots. The blue hollow squares represent traffic conditionsbefore breakdown; the red triangles represent average flows and densitiesduring breakdown. (b) Histogram of breakdown speed distribution (mean =35.8,median = 34.8, standard deviation = 6.66). (c) Histogram of breakdownduration distribution (mean = 90,median = 95, standard deviation = 54).
Fig. 2. Overview of the modeling methodology for incorporating stochastictraffic flow breakdown in network simulation models.
tracking individual vehicle trajectories [15]. Finally, the col-lective effects of individual drivers in terms of flow rates anddensities are projected on the fundamental diagram.
DONG AND MAHMASSANI: STOCHASTIC MODELING OF TRAFFIC FLOW BREAKDOWN PHENOMENON 1805
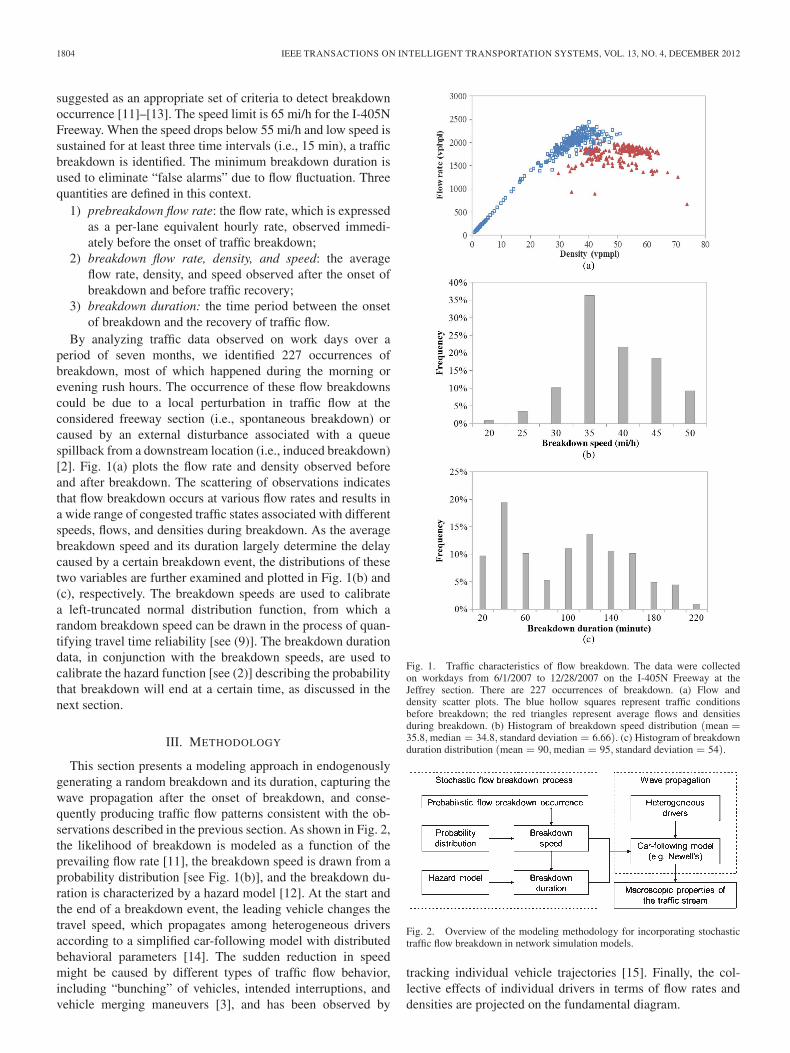
Fig. 3. Weibull distribution of prebreakdown flow rate. The solid line rep-resents the observed prebreakdown flow rates (up to 2300 vphpl). The dottedportion of the plot is used to complete the distribution curves and comprisesunrealistic flow rates.
A. Breakdown Probability and Duration
Higher flow rates are usually associated with greater like-lihood of traffic breakdown. One way of implementing prob-abilistic breakdown in traffic models is to introduce randomvariables for breakdown occurrence (with flow-dependent prob-ability) and breakdown duration. For each simulation run, i.e.,one realization of the underlying stochastic process, a MonteCarlo draw determines whether flow breakdown would occur atthe prevailing flow level. If a breakdown occurs, a realizationfrom a probabilistic duration model then determines how longthe heavily congested traffic state will sustain.
A systematic relation between the likelihood of breakdownand the prebreakdown flow rate, i.e., the flow rate observedimmediately before the onset of traffic breakdown, has beenestablished [10], [11]. The prebreakdown flow distributionfunction expresses the probability that traffic breaks down in thenext time interval (for a given time discretization). The analysisof data samples from freeway sections in California [11] andGermany [13] indicated that the Weibull distribution provideda good description of the prebreakdown flow rate
F (qbd) = 1 − e−(qbdσ )
s
(1)
whereF (·) probability distribution function;qbd prebreakdown flow rate;σ scale parameter;s shape parameter.Fig. 3 plots the cumulative distribution function and proba-
bility density function of a Weibull distribution calibrated usingthe data collected on I-405N Freeway at the Jeffrey section. Theobserved flow rate does not reach beyond 2300 vphpl at thisparticular location.
In addition, the breakdown duration is defined as the timeperiod between the occurrence of breakdown and the recovery.The recovery of traffic flow could be a result of congestionelimination or demand drop. In the latter case, the flow ratedoes not recover to the same level as the prebreakdown flowrate. Thus, the recovery of the breakdown is identified when thespeed is recovered to the free mean speed. Duration analysis islargely used to study the elapsed time until the occurrence of
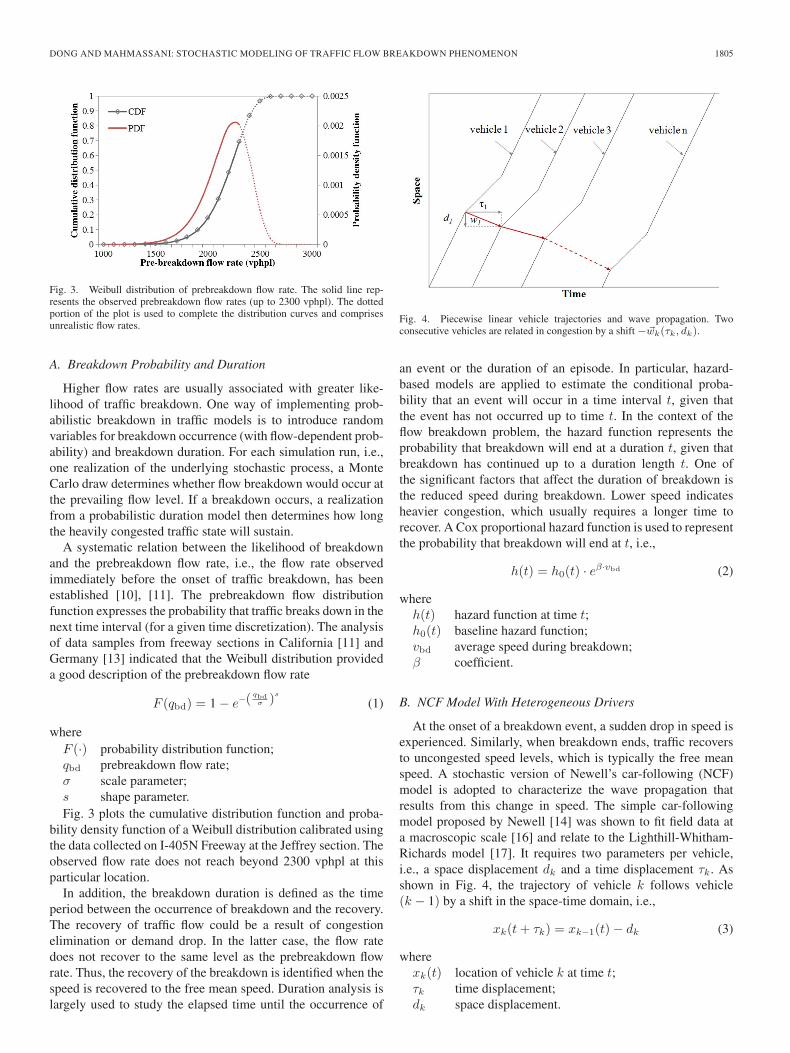
Fig. 4. Piecewise linear vehicle trajectories and wave propagation. Twoconsecutive vehicles are related in congestion by a shift −�wk(τk, dk).
an event or the duration of an episode. In particular, hazard-based models are applied to estimate the conditional proba-bility that an event will occur in a time interval t, given thatthe event has not occurred up to time t. In the context of theflow breakdown problem, the hazard function represents theprobability that breakdown will end at a duration t, given thatbreakdown has continued up to a duration length t. One ofthe significant factors that affect the duration of breakdown isthe reduced speed during breakdown. Lower speed indicatesheavier congestion, which usually requires a longer time torecover. A Cox proportional hazard function is used to representthe probability that breakdown will end at t, i.e.,
h(t) = h0(t) · eβ·vbd (2)
whereh(t) hazard function at time t;h0(t) baseline hazard function;vbd average speed during breakdown;β coefficient.
B. NCF Model With Heterogeneous Drivers
At the onset of a breakdown event, a sudden drop in speed isexperienced. Similarly, when breakdown ends, traffic recoversto uncongested speed levels, which is typically the free meanspeed. A stochastic version of Newell’s car-following (NCF)model is adopted to characterize the wave propagation thatresults from this change in speed. The simple car-followingmodel proposed by Newell [14] was shown to fit field data ata macroscopic scale [16] and relate to the Lighthill-Whitham-Richards model [17]. It requires two parameters per vehicle,i.e., a space displacement dk and a time displacement τk. Asshown in Fig. 4, the trajectory of vehicle k follows vehicle(k − 1) by a shift in the space-time domain, i.e.,
xk(t+ τk) = xk−1(t)− dk (3)
wherexk(t) location of vehicle k at time t;τk time displacement;dk space displacement.
1806 IEEE TRANSACTIONS ON INTELLIGENT TRANSPORTATION SYSTEMS, VOL. 13, NO. 4, DECEMBER 2012
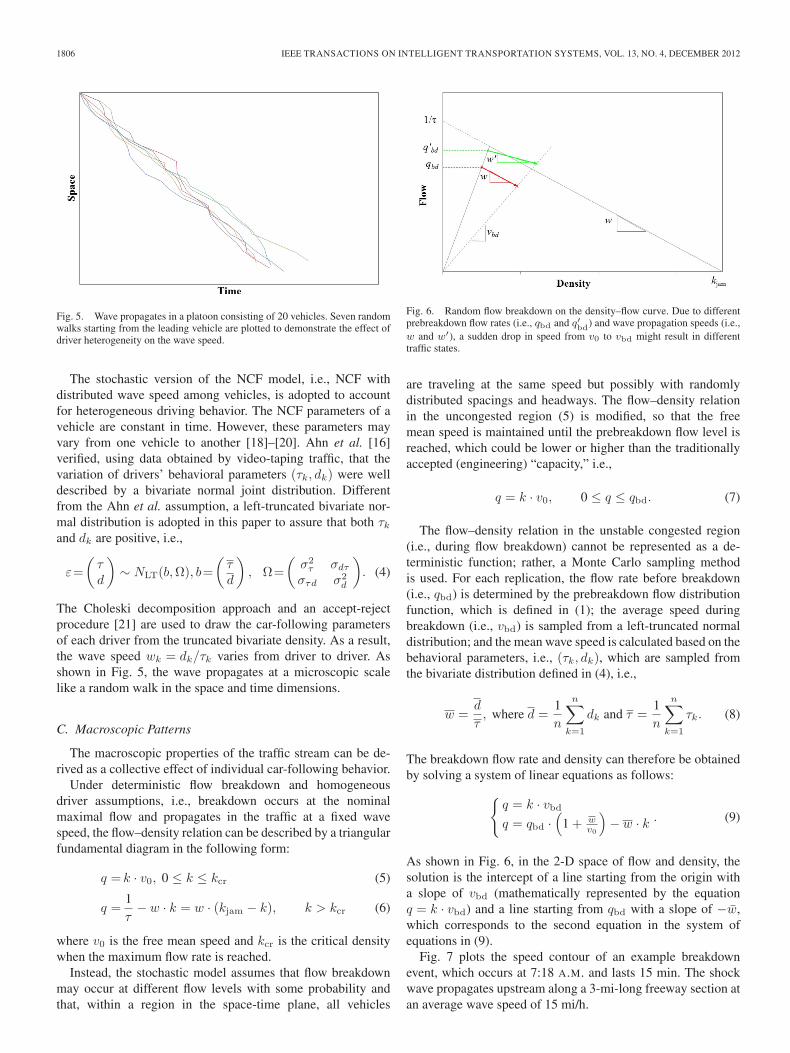
Fig. 5. Wave propagates in a platoon consisting of 20 vehicles. Seven randomwalks starting from the leading vehicle are plotted to demonstrate the effect ofdriver heterogeneity on the wave speed.
The stochastic version of the NCF model, i.e., NCF withdistributed wave speed among vehicles, is adopted to accountfor heterogeneous driving behavior. The NCF parameters of avehicle are constant in time. However, these parameters mayvary from one vehicle to another [18]–[20]. Ahn et al. [16]verified, using data obtained by video-taping traffic, that thevariation of drivers’ behavioral parameters (τk, dk) were welldescribed by a bivariate normal joint distribution. Differentfrom the Ahn et al. assumption, a left-truncated bivariate nor-mal distribution is adopted in this paper to assure that both τkand dk are positive, i.e.,
ε=
(τd
)∼ NLT(b,Ω), b=
(τd
), Ω=
(σ2τ σdτ
στd σ2d
). (4)
The Choleski decomposition approach and an accept-rejectprocedure [21] are used to draw the car-following parametersof each driver from the truncated bivariate density. As a result,the wave speed wk = dk/τk varies from driver to driver. Asshown in Fig. 5, the wave propagates at a microscopic scalelike a random walk in the space and time dimensions.
C. Macroscopic Patterns
The macroscopic properties of the traffic stream can be de-rived as a collective effect of individual car-following behavior.
Under deterministic flow breakdown and homogeneousdriver assumptions, i.e., breakdown occurs at the nominalmaximal flow and propagates in the traffic at a fixed wavespeed, the flow–density relation can be described by a triangularfundamental diagram in the following form:
q = k · v0, 0 ≤ k ≤ kcr (5)
q =1τ− w · k = w · (kjam − k), k > kcr (6)
where v0 is the free mean speed and kcr is the critical densitywhen the maximum flow rate is reached.
Instead, the stochastic model assumes that flow breakdownmay occur at different flow levels with some probability andthat, within a region in the space-time plane, all vehicles
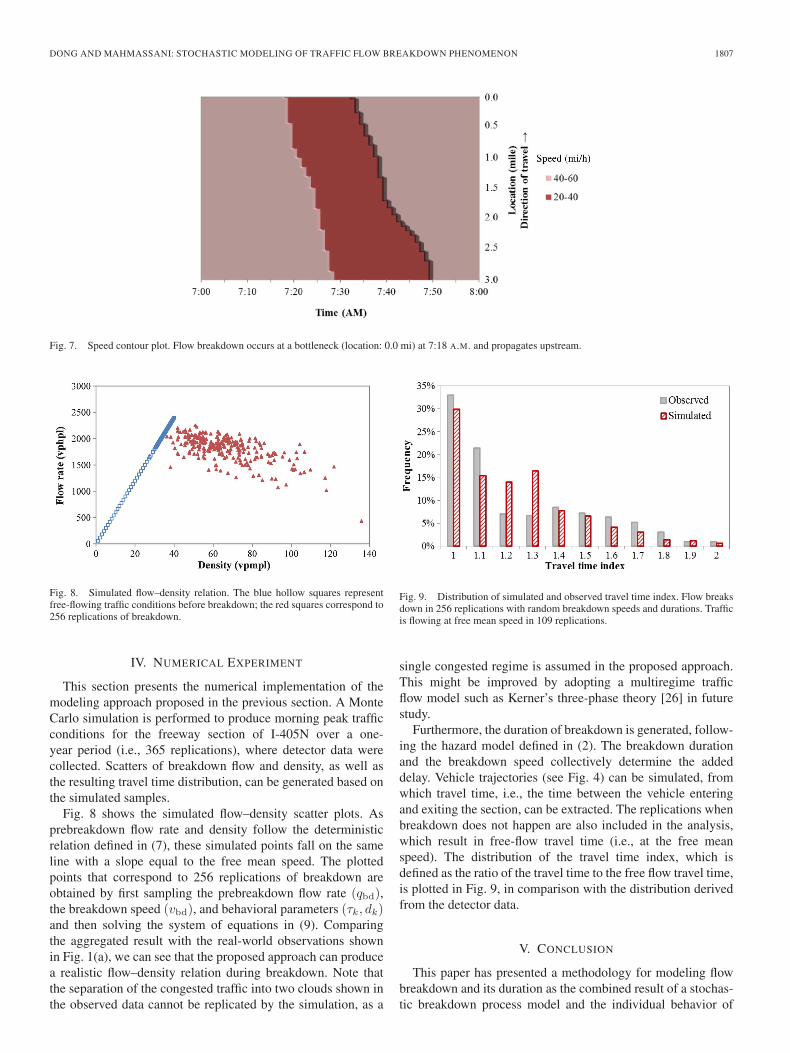
Fig. 6. Random flow breakdown on the density–flow curve. Due to differentprebreakdown flow rates (i.e., qbd and q′bd) and wave propagation speeds (i.e.,w and w′), a sudden drop in speed from v0 to vbd might result in differenttraffic states.
are traveling at the same speed but possibly with randomlydistributed spacings and headways. The flow–density relationin the uncongested region (5) is modified, so that the freemean speed is maintained until the prebreakdown flow level isreached, which could be lower or higher than the traditionallyaccepted (engineering) “capacity,” i.e.,
q = k · v0, 0 ≤ q ≤ qbd. (7)
The flow–density relation in the unstable congested region(i.e., during flow breakdown) cannot be represented as a de-terministic function; rather, a Monte Carlo sampling methodis used. For each replication, the flow rate before breakdown(i.e., qbd) is determined by the prebreakdown flow distributionfunction, which is defined in (1); the average speed duringbreakdown (i.e., vbd) is sampled from a left-truncated normaldistribution; and the mean wave speed is calculated based on thebehavioral parameters, i.e., (τk, dk), which are sampled fromthe bivariate distribution defined in (4), i.e.,
w =d
τ, where d =
1n
n∑k=1
dk and τ =1n
n∑k=1
τk. (8)
The breakdown flow rate and density can therefore be obtainedby solving a system of linear equations as follows:{
q = k · vbdq = qbd ·
(1 + w
v0
)− w · k . (9)
As shown in Fig. 6, in the 2-D space of flow and density, thesolution is the intercept of a line starting from the origin witha slope of vbd (mathematically represented by the equationq = k · vbd) and a line starting from qbd with a slope of −w̄,which corresponds to the second equation in the system ofequations in (9).
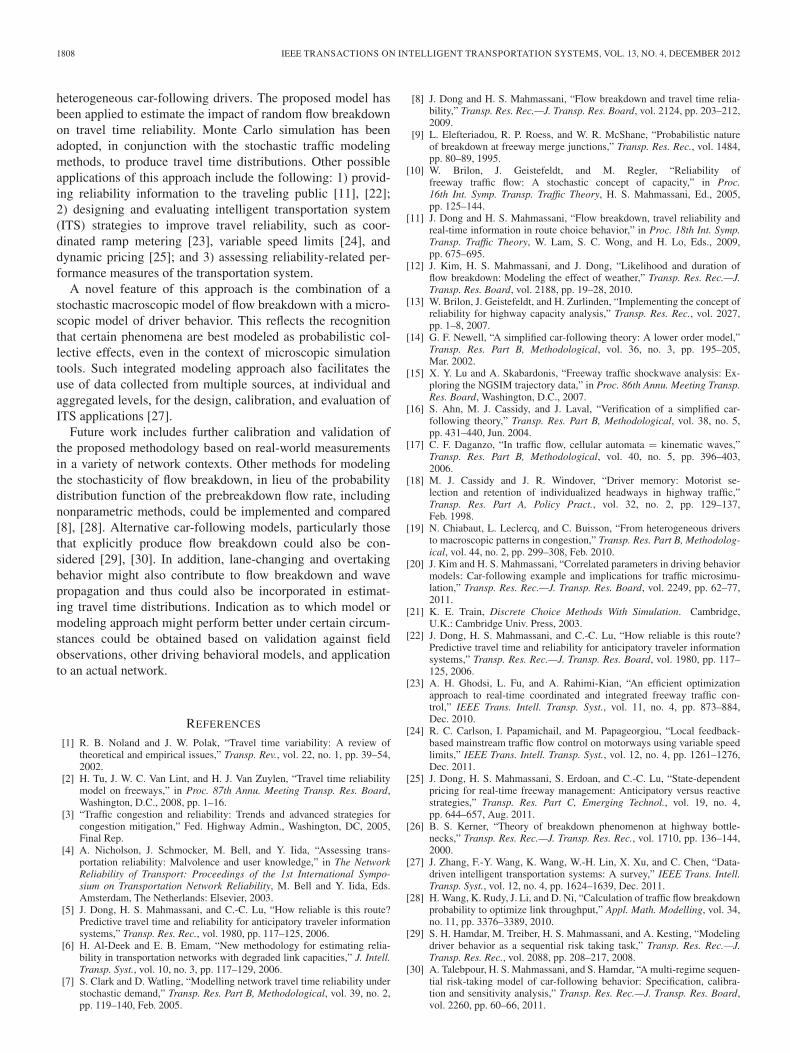
Fig. 7 plots the speed contour of an example breakdownevent, which occurs at 7:18 A.M. and lasts 15 min. The shockwave propagates upstream along a 3-mi-long freeway section atan average wave speed of 15 mi/h.
DONG AND MAHMASSANI: STOCHASTIC MODELING OF TRAFFIC FLOW BREAKDOWN PHENOMENON 1807
Fig. 7. Speed contour plot. Flow breakdown occurs at a bottleneck (location: 0.0 mi) at 7:18 A.M. and propagates upstream.
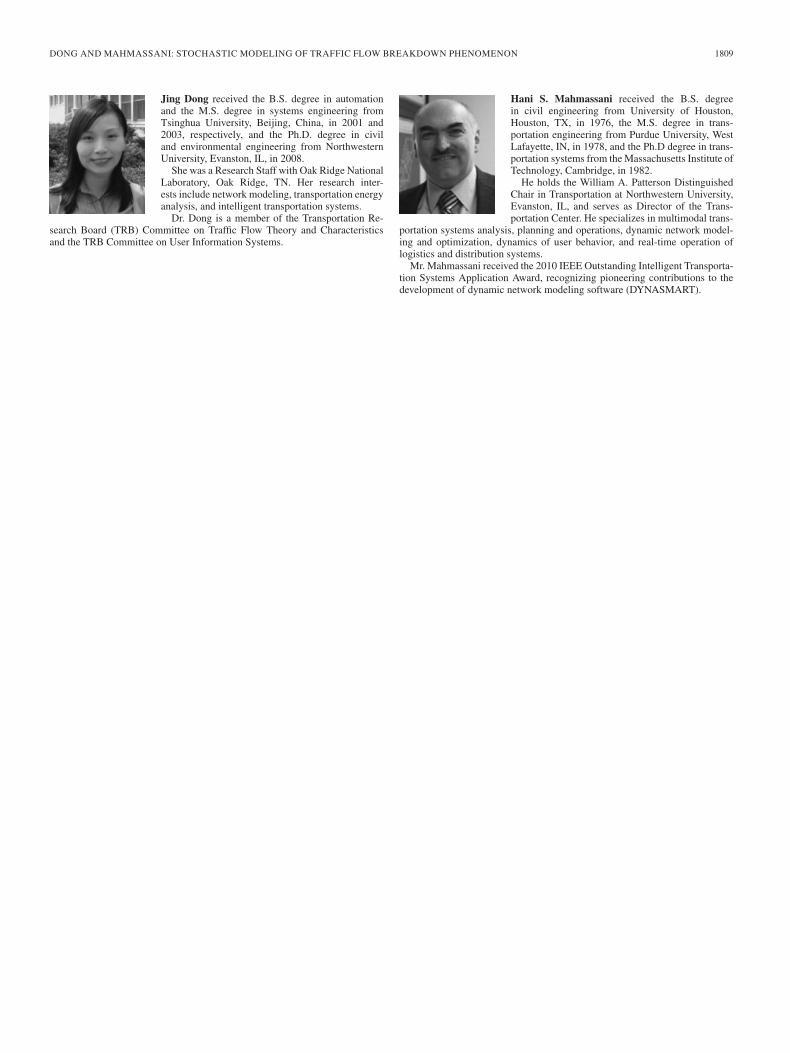
Fig. 8. Simulated flow–density relation. The blue hollow squares representfree-flowing traffic conditions before breakdown; the red squares correspond to256 replications of breakdown.
IV. NUMERICAL EXPERIMENT
This section presents the numerical implementation of themodeling approach proposed in the previous section. A MonteCarlo simulation is performed to produce morning peak trafficconditions for the freeway section of I-405N over a one-year period (i.e., 365 replications), where detector data werecollected. Scatters of breakdown flow and density, as well asthe resulting travel time distribution, can be generated based onthe simulated samples.
Fig. 8 shows the simulated flow–density scatter plots. Asprebreakdown flow rate and density follow the deterministicrelation defined in (7), these simulated points fall on the sameline with a slope equal to the free mean speed. The plottedpoints that correspond to 256 replications of breakdown areobtained by first sampling the prebreakdown flow rate (qbd),the breakdown speed (vbd), and behavioral parameters (τk, dk)and then solving the system of equations in (9). Comparingthe aggregated result with the real-world observations shownin Fig. 1(a), we can see that the proposed approach can producea realistic flow–density relation during breakdown. Note thatthe separation of the congested traffic into two clouds shown inthe observed data cannot be replicated by the simulation, as a
Fig. 9. Distribution of simulated and observed travel time index. Flow breaksdown in 256 replications with random breakdown speeds and durations. Trafficis flowing at free mean speed in 109 replications.
single congested regime is assumed in the proposed approach.This might be improved by adopting a multiregime trafficflow model such as Kerner’s three-phase theory [26] in futurestudy.
Furthermore, the duration of breakdown is generated, follow-ing the hazard model defined in (2). The breakdown durationand the breakdown speed collectively determine the addeddelay. Vehicle trajectories (see Fig. 4) can be simulated, fromwhich travel time, i.e., the time between the vehicle enteringand exiting the section, can be extracted. The replications whenbreakdown does not happen are also included in the analysis,which result in free-flow travel time (i.e., at the free meanspeed). The distribution of the travel time index, which isdefined as the ratio of the travel time to the free flow travel time,is plotted in Fig. 9, in comparison with the distribution derivedfrom the detector data.
V. CONCLUSION
This paper has presented a methodology for modeling flowbreakdown and its duration as the combined result of a stochas-tic breakdown process model and the individual behavior of
1808 IEEE TRANSACTIONS ON INTELLIGENT TRANSPORTATION SYSTEMS, VOL. 13, NO. 4, DECEMBER 2012
heterogeneous car-following drivers. The proposed model hasbeen applied to estimate the impact of random flow breakdownon travel time reliability. Monte Carlo simulation has beenadopted, in conjunction with the stochastic traffic modelingmethods, to produce travel time distributions. Other possibleapplications of this approach include the following: 1) provid-ing reliability information to the traveling public [11], [22];2) designing and evaluating intelligent transportation system(ITS) strategies to improve travel reliability, such as coor-dinated ramp metering [23], variable speed limits [24], anddynamic pricing [25]; and 3) assessing reliability-related per-formance measures of the transportation system.
A novel feature of this approach is the combination of astochastic macroscopic model of flow breakdown with a micro-scopic model of driver behavior. This reflects the recognitionthat certain phenomena are best modeled as probabilistic col-lective effects, even in the context of microscopic simulationtools. Such integrated modeling approach also facilitates theuse of data collected from multiple sources, at individual andaggregated levels, for the design, calibration, and evaluation ofITS applications [27].
Future work includes further calibration and validation ofthe proposed methodology based on real-world measurementsin a variety of network contexts. Other methods for modelingthe stochasticity of flow breakdown, in lieu of the probabilitydistribution function of the prebreakdown flow rate, includingnonparametric methods, could be implemented and compared[8], [28]. Alternative car-following models, particularly thosethat explicitly produce flow breakdown could also be con-sidered [29], [30]. In addition, lane-changing and overtakingbehavior might also contribute to flow breakdown and wavepropagation and thus could also be incorporated in estimat-ing travel time distributions. Indication as to which model ormodeling approach might perform better under certain circum-stances could be obtained based on validation against fieldobservations, other driving behavioral models, and applicationto an actual network.
REFERENCES
[1] R. B. Noland and J. W. Polak, “Travel time variability: A review oftheoretical and empirical issues,” Transp. Rev., vol. 22, no. 1, pp. 39–54,2002.
[2] H. Tu, J. W. C. Van Lint, and H. J. Van Zuylen, “Travel time reliabilitymodel on freeways,” in Proc. 87th Annu. Meeting Transp. Res. Board,Washington, D.C., 2008, pp. 1–16.
[3] “Traffic congestion and reliability: Trends and advanced strategies forcongestion mitigation,” Fed. Highway Admin., Washington, DC, 2005,Final Rep.
[4] A. Nicholson, J. Schmocker, M. Bell, and Y. Iida, “Assessing trans-portation reliability: Malvolence and user knowledge,” in The NetworkReliability of Transport: Proceedings of the 1st International Sympo-sium on Transportation Network Reliability, M. Bell and Y. Iida, Eds.Amsterdam, The Netherlands: Elsevier, 2003.
[5] J. Dong, H. S. Mahmassani, and C.-C. Lu, “How reliable is this route?Predictive travel time and reliability for anticipatory traveler informationsystems,” Transp. Res. Rec., vol. 1980, pp. 117–125, 2006.
[6] H. Al-Deek and E. B. Emam, “New methodology for estimating relia-bility in transportation networks with degraded link capacities,” J. Intell.Transp. Syst., vol. 10, no. 3, pp. 117–129, 2006.
[7] S. Clark and D. Watling, “Modelling network travel time reliability understochastic demand,” Transp. Res. Part B, Methodological, vol. 39, no. 2,pp. 119–140, Feb. 2005.
[8] J. Dong and H. S. Mahmassani, “Flow breakdown and travel time relia-bility,” Transp. Res. Rec.—J. Transp. Res. Board, vol. 2124, pp. 203–212,2009.
[9] L. Elefteriadou, R. P. Roess, and W. R. McShane, “Probabilistic natureof breakdown at freeway merge junctions,” Transp. Res. Rec., vol. 1484,pp. 80–89, 1995.
[10] W. Brilon, J. Geistefeldt, and M. Regler, “Reliability offreeway traffic flow: A stochastic concept of capacity,” in Proc.16th Int. Symp. Transp. Traffic Theory, H. S. Mahmassani, Ed., 2005,pp. 125–144.
[11] J. Dong and H. S. Mahmassani, “Flow breakdown, travel reliability andreal-time information in route choice behavior,” in Proc. 18th Int. Symp.Transp. Traffic Theory, W. Lam, S. C. Wong, and H. Lo, Eds., 2009,pp. 675–695.
[12] J. Kim, H. S. Mahmassani, and J. Dong, “Likelihood and duration offlow breakdown: Modeling the effect of weather,” Transp. Res. Rec.—J.Transp. Res. Board, vol. 2188, pp. 19–28, 2010.
[13] W. Brilon, J. Geistefeldt, and H. Zurlinden, “Implementing the concept ofreliability for highway capacity analysis,” Transp. Res. Rec., vol. 2027,pp. 1–8, 2007.
[14] G. F. Newell, “A simplified car-following theory: A lower order model,”Transp. Res. Part B, Methodological, vol. 36, no. 3, pp. 195–205,Mar. 2002.
[15] X. Y. Lu and A. Skabardonis, “Freeway traffic shockwave analysis: Ex-ploring the NGSIM trajectory data,” in Proc. 86th Annu. Meeting Transp.Res. Board, Washington, D.C., 2007.
[16] S. Ahn, M. J. Cassidy, and J. Laval, “Verification of a simplified car-following theory,” Transp. Res. Part B, Methodological, vol. 38, no. 5,pp. 431–440, Jun. 2004.
[17] C. F. Daganzo, “In traffic flow, cellular automata = kinematic waves,”Transp. Res. Part B, Methodological, vol. 40, no. 5, pp. 396–403,2006.
[18] M. J. Cassidy and J. R. Windover, “Driver memory: Motorist se-lection and retention of individualized headways in highway traffic,”Transp. Res. Part A, Policy Pract., vol. 32, no. 2, pp. 129–137,Feb. 1998.
[19] N. Chiabaut, L. Leclercq, and C. Buisson, “From heterogeneous driversto macroscopic patterns in congestion,” Transp. Res. Part B, Methodolog-ical, vol. 44, no. 2, pp. 299–308, Feb. 2010.
[20] J. Kim and H. S. Mahmassani, “Correlated parameters in driving behaviormodels: Car-following example and implications for traffic microsimu-lation,” Transp. Res. Rec.—J. Transp. Res. Board, vol. 2249, pp. 62–77,2011.
[21] K. E. Train, Discrete Choice Methods With Simulation. Cambridge,U.K.: Cambridge Univ. Press, 2003.
[22] J. Dong, H. S. Mahmassani, and C.-C. Lu, “How reliable is this route?Predictive travel time and reliability for anticipatory traveler informationsystems,” Transp. Res. Rec.—J. Transp. Res. Board, vol. 1980, pp. 117–125, 2006.
[23] A. H. Ghodsi, L. Fu, and A. Rahimi-Kian, “An efficient optimizationapproach to real-time coordinated and integrated freeway traffic con-trol,” IEEE Trans. Intell. Transp. Syst., vol. 11, no. 4, pp. 873–884,Dec. 2010.
[24] R. C. Carlson, I. Papamichail, and M. Papageorgiou, “Local feedback-based mainstream traffic flow control on motorways using variable speedlimits,” IEEE Trans. Intell. Transp. Syst., vol. 12, no. 4, pp. 1261–1276,Dec. 2011.
[25] J. Dong, H. S. Mahmassani, S. Erdoan, and C.-C. Lu, “State-dependentpricing for real-time freeway management: Anticipatory versus reactivestrategies,” Transp. Res. Part C, Emerging Technol., vol. 19, no. 4,pp. 644–657, Aug. 2011.
[26] B. S. Kerner, “Theory of breakdown phenomenon at highway bottle-necks,” Transp. Res. Rec.—J. Transp. Res. Rec., vol. 1710, pp. 136–144,2000.
[27] J. Zhang, F.-Y. Wang, K. Wang, W.-H. Lin, X. Xu, and C. Chen, “Data-driven intelligent transportation systems: A survey,” IEEE Trans. Intell.Transp. Syst., vol. 12, no. 4, pp. 1624–1639, Dec. 2011.
[28] H. Wang, K. Rudy, J. Li, and D. Ni, “Calculation of traffic flow breakdownprobability to optimize link throughput,” Appl. Math. Modelling, vol. 34,no. 11, pp. 3376–3389, 2010.
[29] S. H. Hamdar, M. Treiber, H. S. Mahmassani, and A. Kesting, “Modelingdriver behavior as a sequential risk taking task,” Transp. Res. Rec.—J.Transp. Res. Rec., vol. 2088, pp. 208–217, 2008.
[30] A. Talebpour, H. S. Mahmassani, and S. Hamdar, “A multi-regime sequen-tial risk-taking model of car-following behavior: Specification, calibra-tion and sensitivity analysis,” Transp. Res. Rec.—J. Transp. Res. Board,vol. 2260, pp. 60–66, 2011.
DONG AND MAHMASSANI: STOCHASTIC MODELING OF TRAFFIC FLOW BREAKDOWN PHENOMENON 1809
Jing Dong received the B.S. degree in automationand the M.S. degree in systems engineering fromTsinghua University, Beijing, China, in 2001 and2003, respectively, and the Ph.D. degree in civiland environmental engineering from NorthwesternUniversity, Evanston, IL, in 2008.
She was a Research Staff with Oak Ridge NationalLaboratory, Oak Ridge, TN. Her research inter-ests include network modeling, transportation energyanalysis, and intelligent transportation systems.
Dr. Dong is a member of the Transportation Re-search Board (TRB) Committee on Traffic Flow Theory and Characteristicsand the TRB Committee on User Information Systems.
Hani S. Mahmassani received the B.S. degreein civil engineering from University of Houston,Houston, TX, in 1976, the M.S. degree in trans-portation engineering from Purdue University, WestLafayette, IN, in 1978, and the Ph.D degree in trans-portation systems from the Massachusetts Institute ofTechnology, Cambridge, in 1982.
He holds the William A. Patterson DistinguishedChair in Transportation at Northwestern University,Evanston, IL, and serves as Director of the Trans-portation Center. He specializes in multimodal trans-
portation systems analysis, planning and operations, dynamic network model-ing and optimization, dynamics of user behavior, and real-time operation oflogistics and distribution systems.
Mr. Mahmassani received the 2010 IEEE Outstanding Intelligent Transporta-tion Systems Application Award, recognizing pioneering contributions to thedevelopment of dynamic network modeling software (DYNASMART).
![Space charge and its role in electric breakdown of solid ......accumulation and the breakdown phenomenon under DC conditions. [1-3] In 2005, Matsui [2] published a paper, which detected](https://img.pdfslide.net/doc/110x75/6110019302866a7e652b5355/space-charge-and-its-role-in-electric-breakdown-of-solid-accumulation-and.jpg)


![Predicting the Rise of EU Right-Wing Populism in Response to … · 2018-03-06 · 6 Complexity short-term. This phenomenon has been described in the literature.Betz[41]describeshowasubstantialincreasein](https://img.pdfslide.net/doc/110x75/5e4137325ad6f43ca62c8c88/predicting-the-rise-of-eu-right-wing-populism-in-response-to-2018-03-06-6-complexity.jpg)


![Effect of welding phenomenon on the microstructure and ... · The schaeffler diagram is considered relatively inaccurate for predicting ferrite microstructure [26, 44]. Other diagrams](https://img.pdfslide.net/doc/110x75/5acbcfb57f8b9a63398c2682/effect-of-welding-phenomenon-on-the-microstructure-and-schaeffler-diagram-is.jpg)