Embed Size (px)
Citation preview

Stock Analysiswith the
NAIC INVESTOR’S TOOLKIT
Stock Analysiswith the
NAIC INVESTOR’S TOOLKIT
NAICINVESTOR’S
TOOLKIT
AutomatiAutomating ng Your Your InvestmentInvestment
TasksTasks
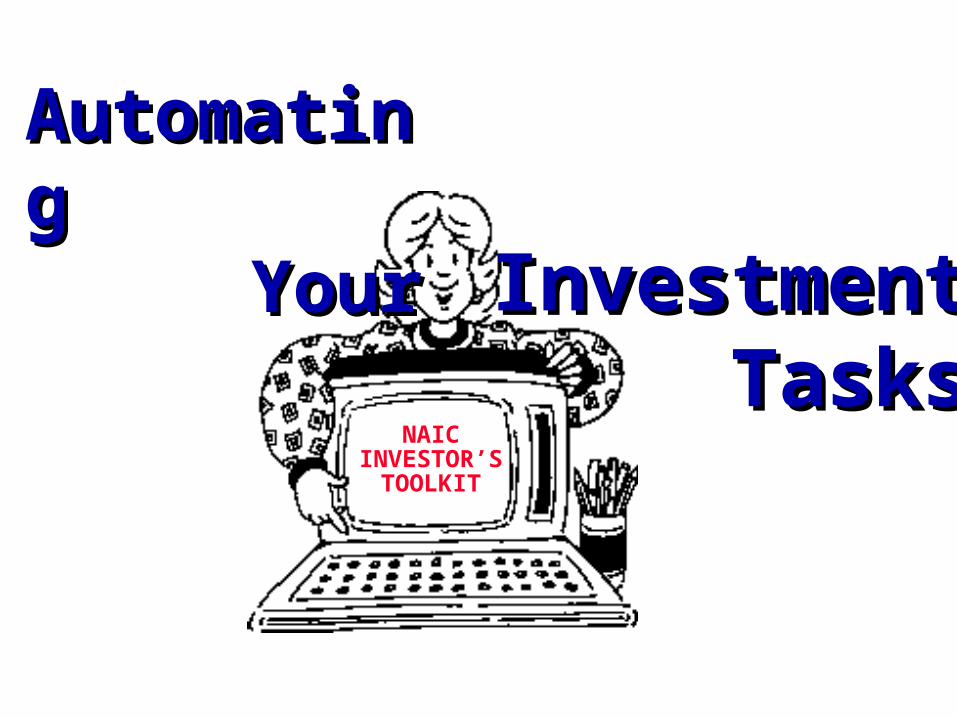
The Six Investment TasksThe Six Investment Tasks
1) Prospect for good quality 1) Prospect for good quality companiescompanies
2) Obtain the necessary data2) Obtain the necessary data
3) Analyze/Evaluate the data3) Analyze/Evaluate the data
4) Buy (Sell) stocks4) Buy (Sell) stocks
5) Manage your portfolio to weed 5) Manage your portfolio to weed out the “losers”out the “losers”
6) Monitor your portfolio’s 6) Monitor your portfolio’s performanceperformance
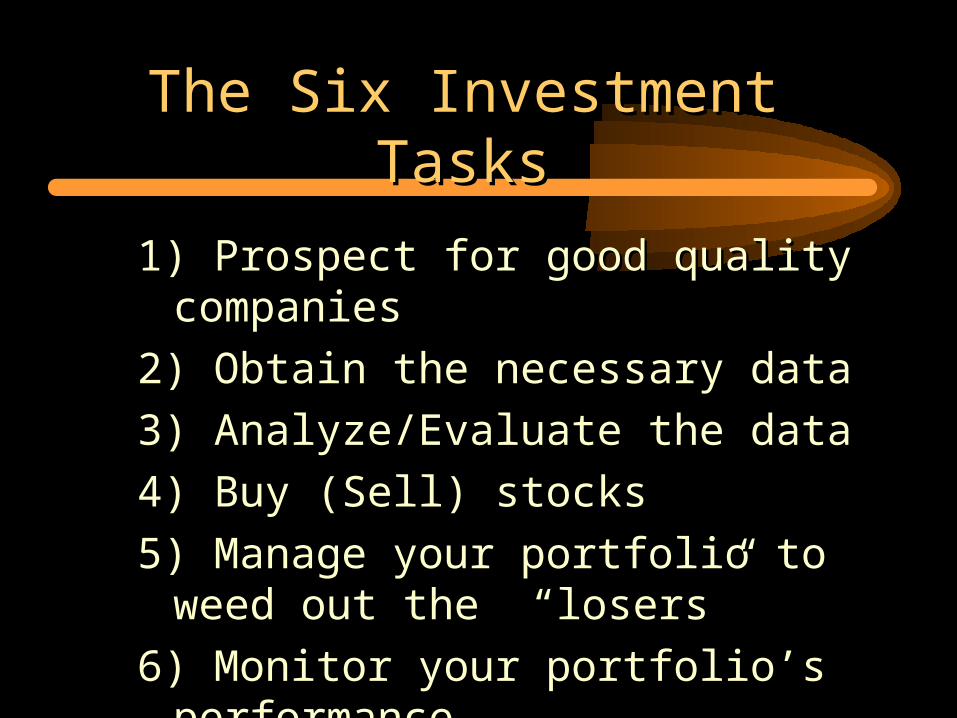
Tools to Accomplish the TasksTools to Accomplish the TasksProspecting
Stock Checklist Computer ScreeningObtaining Data
Printed Material NAIC/S&P Datafiles
Analysis/EvaluationStock Selection Guide Computerized
SSGStock Comparison Guide Compterized SCG
Buy/Sell StocksTelephone On-line
Portfolio ManagementPortfolio Mgt.Guide Computerized
PMGPERT Computerized
PERTPerformance Monitoring
Club/Individual Acctg. Computerized Programs
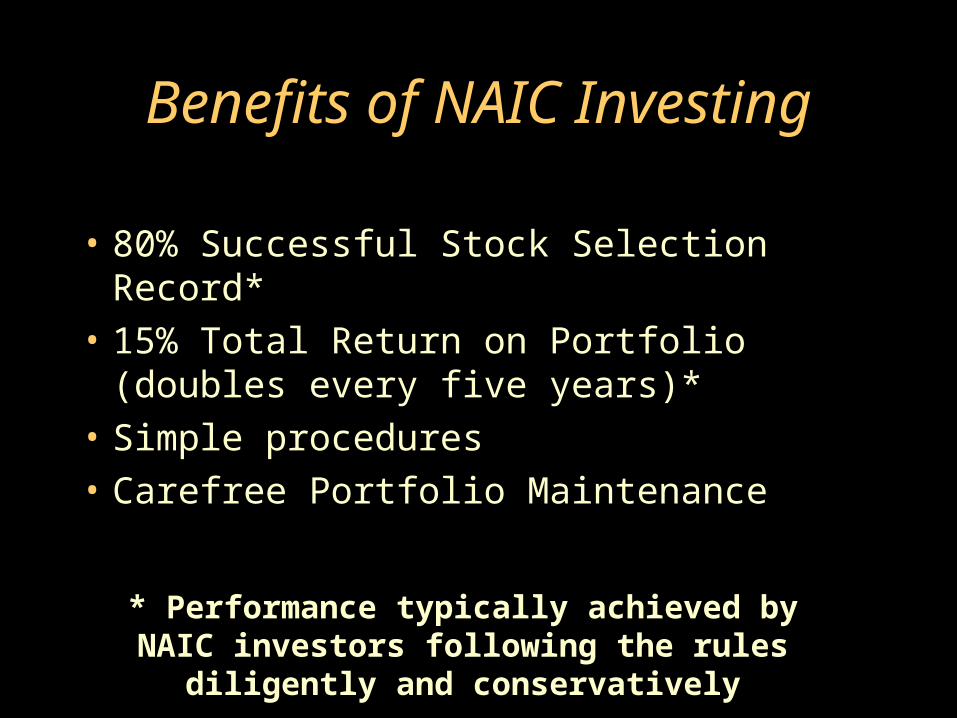
Benefits of NAIC Investing
• 80% Successful Stock Selection Record*
• 15% Total Return on Portfolio (doubles every five years)*
• Simple procedures• Carefree Portfolio Maintenance
* Performance typically achieved by NAIC investors following the rules diligently
and conservatively
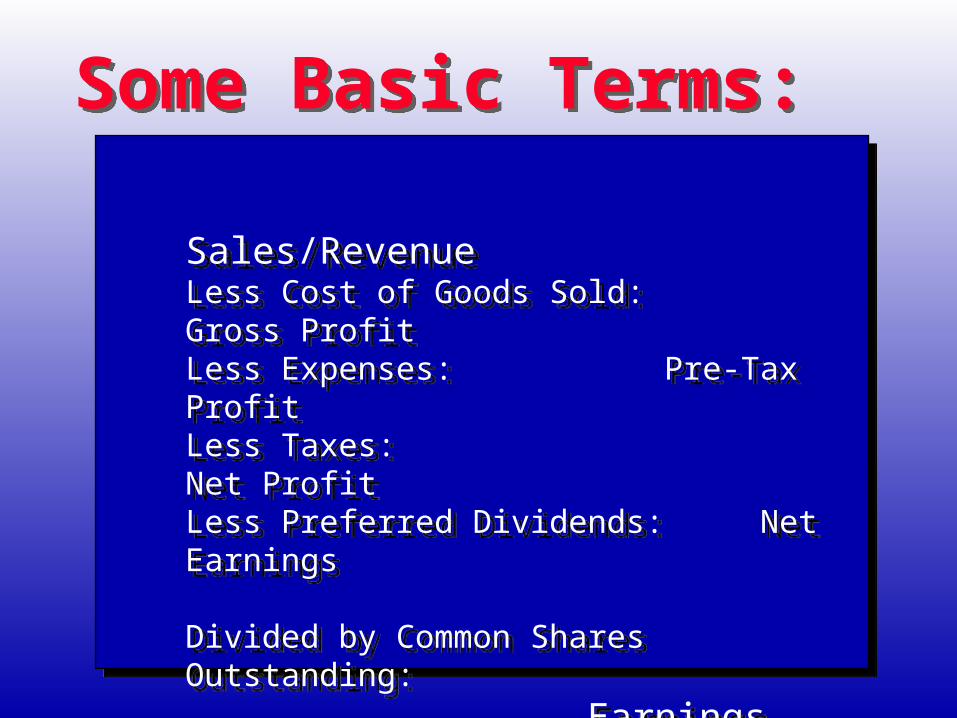
Some Basic Terms:Some Basic Terms:
Sales/RevenueLess Cost of Goods Sold: Gross ProfitLess Expenses: Pre-Tax ProfitLess Taxes: Net ProfitLess Preferred Dividends: Net Earnings
Divided by Common Shares Outstanding: Earnings per Share Price ÷ E/S = Price:Earnings Ratio (“P/E”, ”Multiple”)
Sales/RevenueLess Cost of Goods Sold: Gross ProfitLess Expenses: Pre-Tax ProfitLess Taxes: Net ProfitLess Preferred Dividends: Net Earnings
Divided by Common Shares Outstanding: Earnings per Share Price ÷ E/S = Price:Earnings Ratio (“P/E”, ”Multiple”)
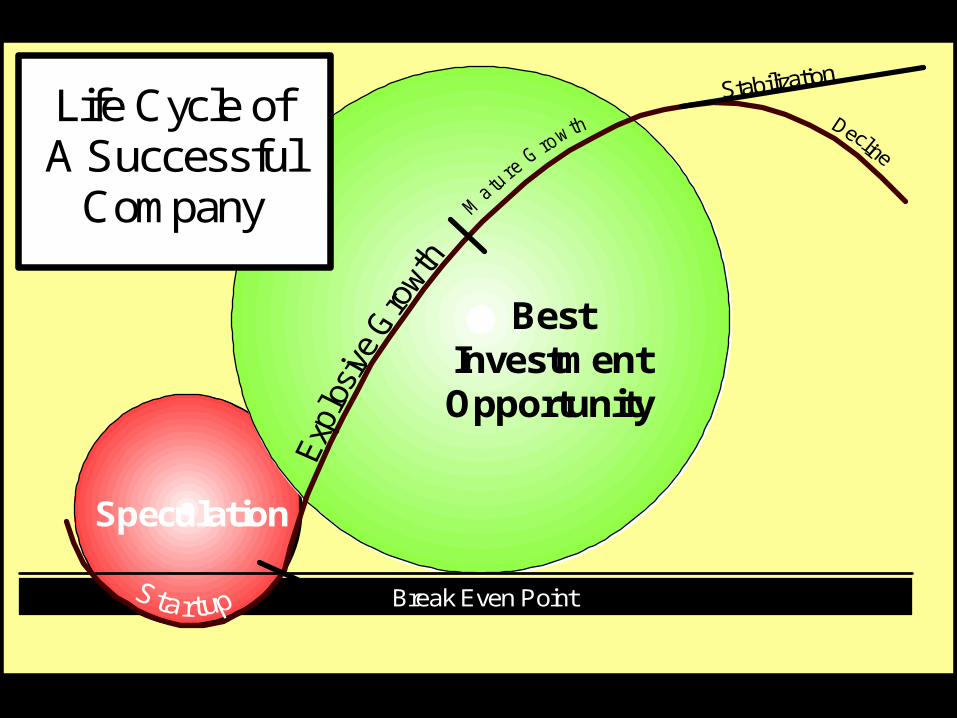
Break Even Point
BestInvestmentOpportunity
Speculation
Life Cycle ofA Successful
Company
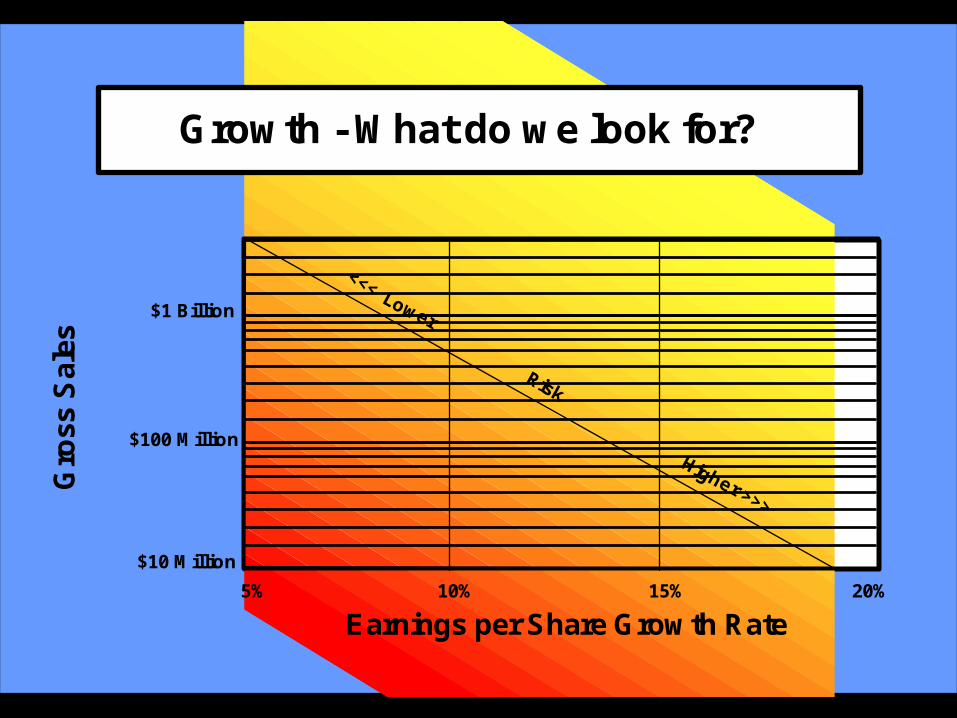
$10 Million
$100 Million
$1 Billion
5% 10% 15% 20%
<<< Lower
Risk
Higher >>>
Earnings per Share Growth Rate
Gro
ss S
ales
Growth - What do we look for?
What is the purpose of the NAIC Stock Selection
Guide?
• Is the company a good company to invest in?
• Is the stock a good value at the current price?
The company is a good company
if:• Sales and earnings growth is strong,
and stable.(SSG - Section 1)
• Management is capable of sustaining that growth.
(SSG - Section 2)
Management is capable of sustaining that growth if:
• Profit margins are strong, stable, and steady or rising.
(SSG - Section 2(a))• Return on Equity is strong, stable
and steady or rising.(SSG - Section 2(b))
Is the stock a good value?
• What’s the highest price it might sell for in 5 years?• What’s the lowest price it might sell for in 5 years?• How does the current price fit in that range?• How does the potential risk compare with the reward?• How does the current P/E compare with the average
P/E?• What return can you expect on your investment?
Seven Simple Steps to Successful
Stock Selection
Seven Simple Steps to Successful
Stock Selection
Step 1: Acquire the Data
• Manually input data from source such as Value Line
• Open and update an existing file• Import NAIC/S&P Compustat
Datafile
Step 2: Visual Analysis
• Check data to determine how relevant it is• Eliminate “outliers” (non-relevant data)
Step 3: Estimate Future Sales & Earnings
• Determine historical growth rates of Sales and Earnings
• Estimate future growth rates of Sales and Earnings
• Examine “Preferred Procedure” and select future Earnings
Step 4: Evaluate Management
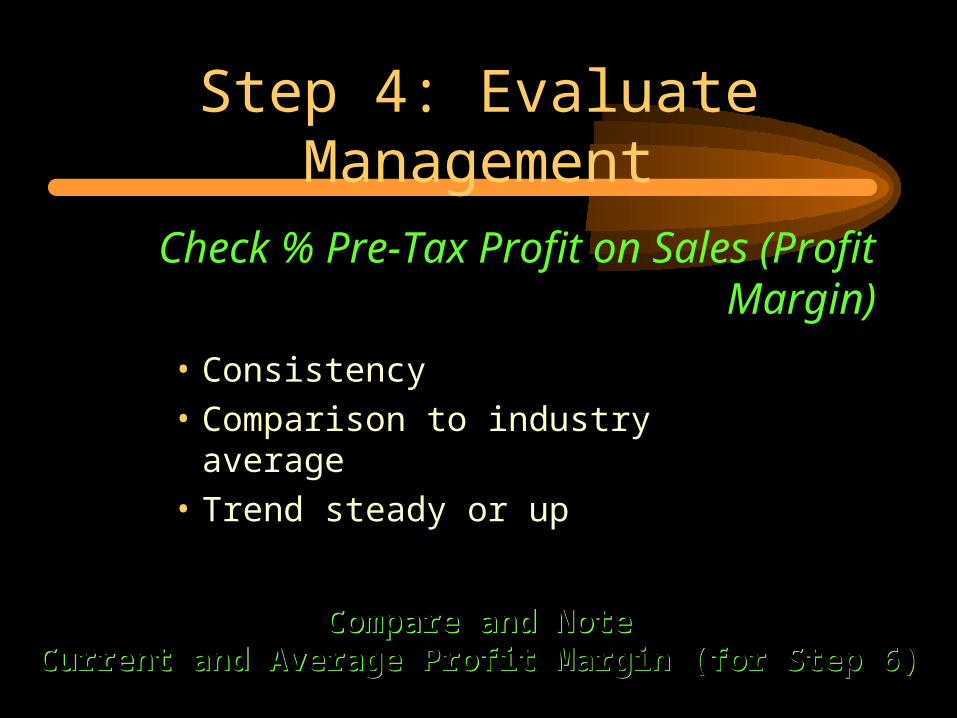
Check % Pre-Tax Profit on Sales (Profit Margin)
• Consistency• Comparison to industry average• Trend steady or up
Step 4: Evaluate Management
Compare and NoteCurrent and Average Profit Margin (for Step 6)
Compare and NoteCurrent and Average Profit Margin (for Step 6)
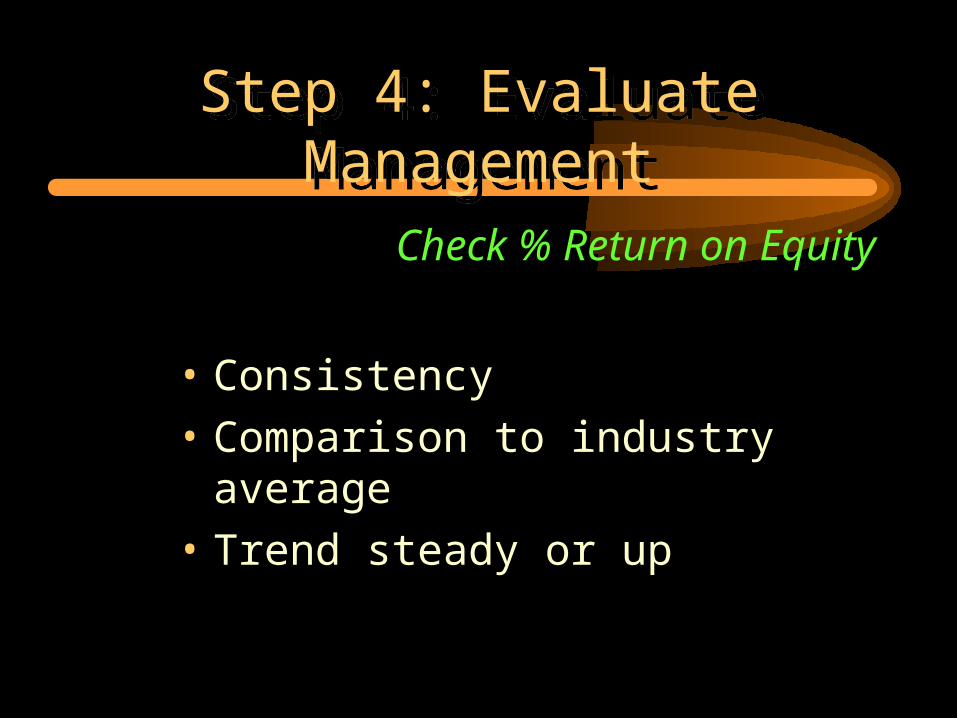
Check % Return on Equity
• Consistency• Comparison to industry
average• Trend steady or up
Step 4: Evaluate Management
Step 4: Evaluate Management
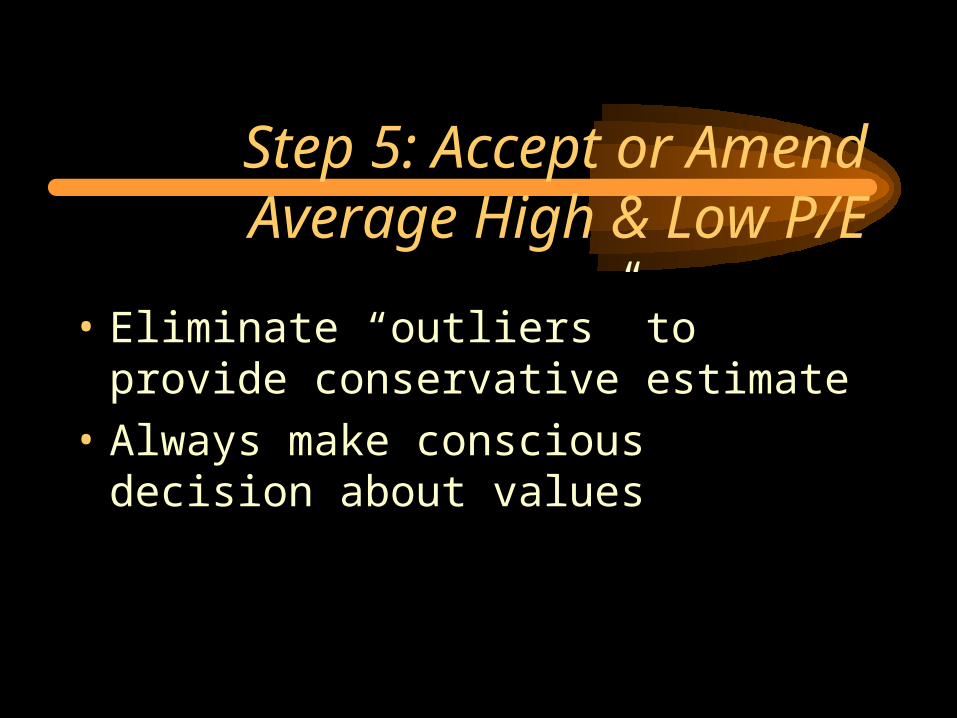
Step 5: Accept or Amend Average High & Low P/E
• Eliminate “outliers” to provide conservative estimate
• Always make conscious decision about values
Step 6: Re-estimate Future High Earnings
• Evaluate “Preferred Procedure” in view of Profit Margin Trend
Step 7: Select Low Price
• Use “Projected Low Price” for Growth Stocks
• Use “5-yr. Average” or “Severe Market Low” for Turnarounds or Cyclicals
• Use “Price the Dividend Will Support” for large companies whose total return includes a large dividend component.
Review Result and Decide
ü Price should be in the “Buy” rangeü Upside/Downside Ratio should be at least 3:1ü Relative Value should be below 110%ü Total Return good at 15% or more.
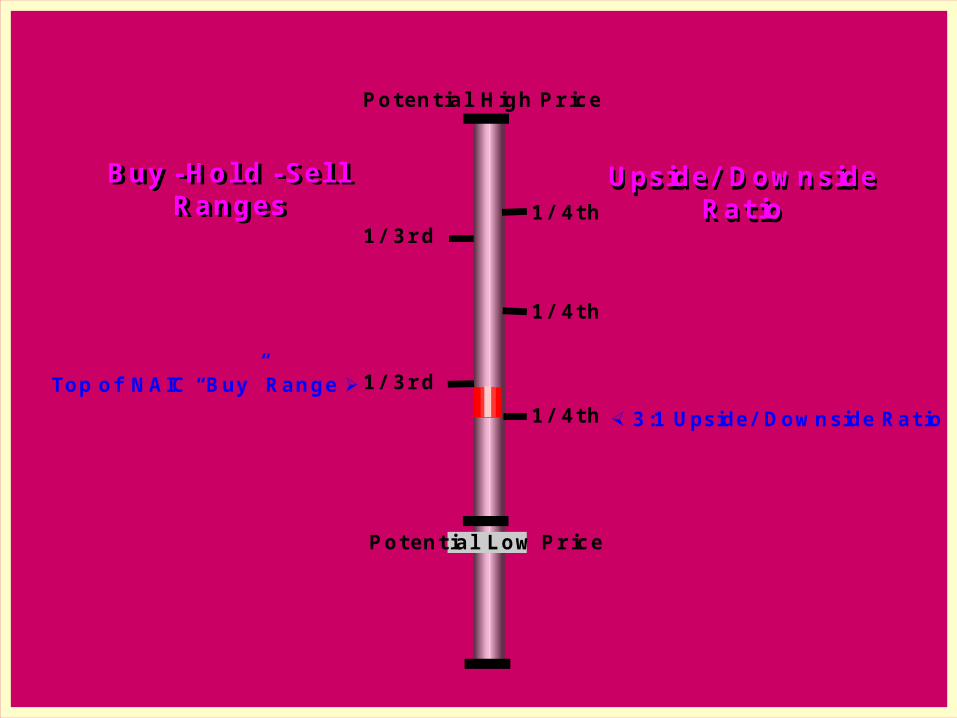
Upside/ DownsideRat io
Buy - Hol d - Sel lRanges
Buy - Hol d - Sel lRanges
Upside/ DownsideRat io
Potent ial H igh Pr ic e
Potent ial Low Pr ic e
1/ 4th
1/ 4th
1/ 4th
1/ 3r d
1/ 3r dTop of NAIC “Buy” Range
3:1 Upside/ Downside Rat io
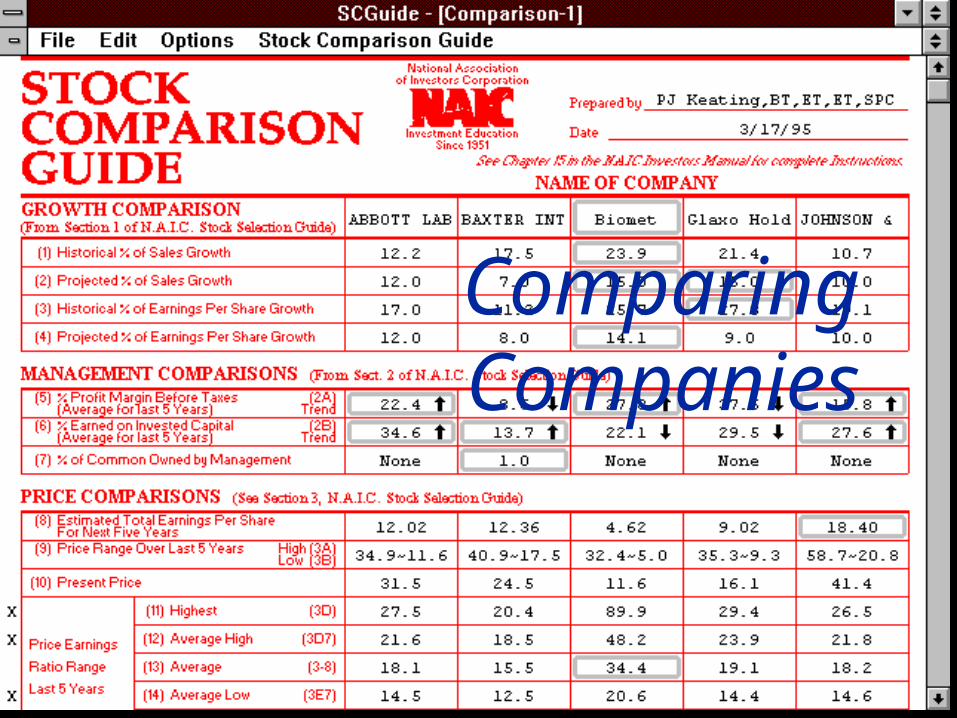
Comparing Companies
Step 1: Select Stocks to Compare
• Best if in same industry• May import selections
from SSG

Add Insider Ownership Information
Confirm/Select/Modify Custom Criteria
• Combined Estimated Yield vs. Total Return• Lines 27 & 28: Any two of six selections

Eliminate Criteria

Questions?
Questions? ?
?
?
?
??
?
?


Managing Your Portfoliowith the
NAIC INVESTOR’S TOOLKIT
Managing Your Portfoliowith the
NAIC INVESTOR’S TOOLKIT
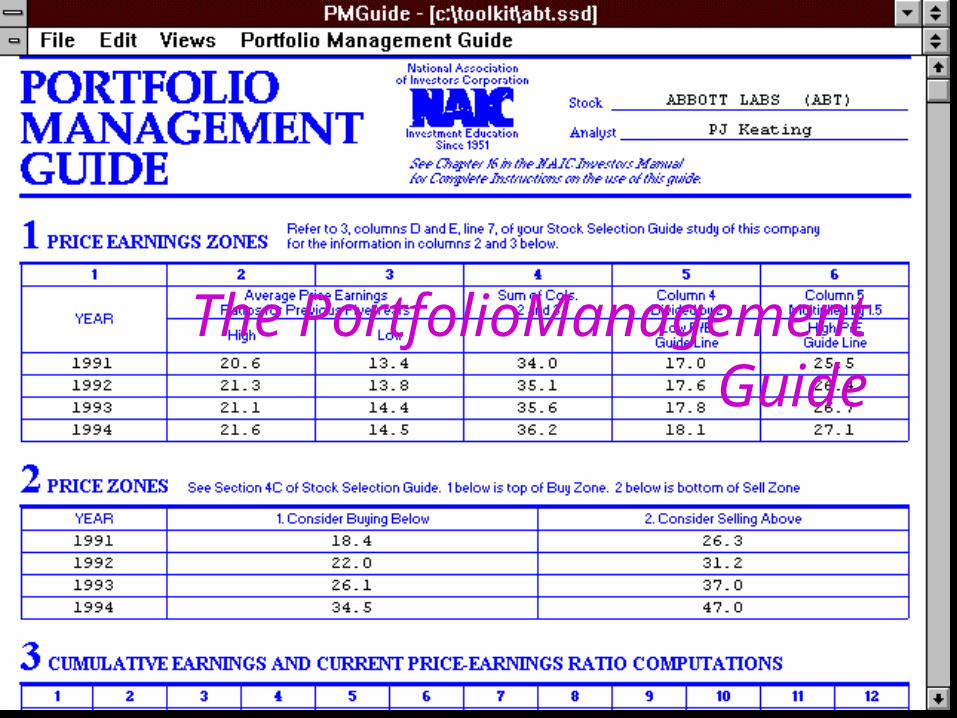
The PortfolioManagement Guide
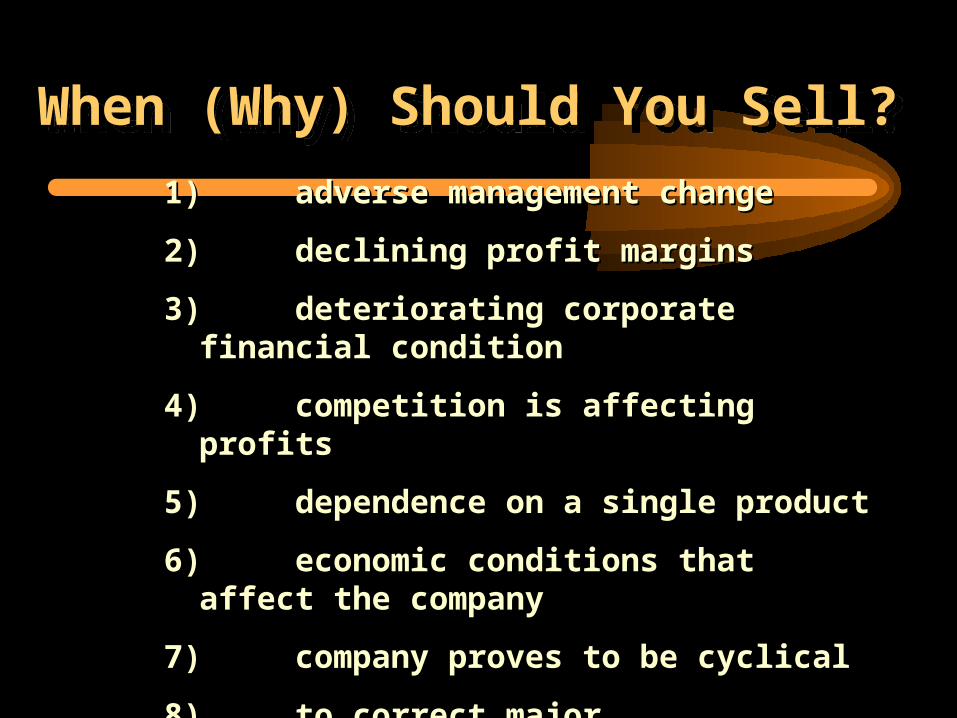
When (Why) Should You Sell?When (Why) Should You Sell?
1)1) adverse management changeadverse management change
2)2) declining profit marginsdeclining profit margins
3)3) deteriorating corporate financial deteriorating corporate financial conditioncondition
4)4) competition is affecting profitscompetition is affecting profits
5)5) dependence on a single productdependence on a single product
6)6) economic conditions that affect the economic conditions that affect the companycompany
7)7) company proves to be cyclicalcompany proves to be cyclical
8)8) to correct major diversification to correct major diversification imbalanceimbalance
9)9) the stock is grossly overvaluedthe stock is grossly overvalued
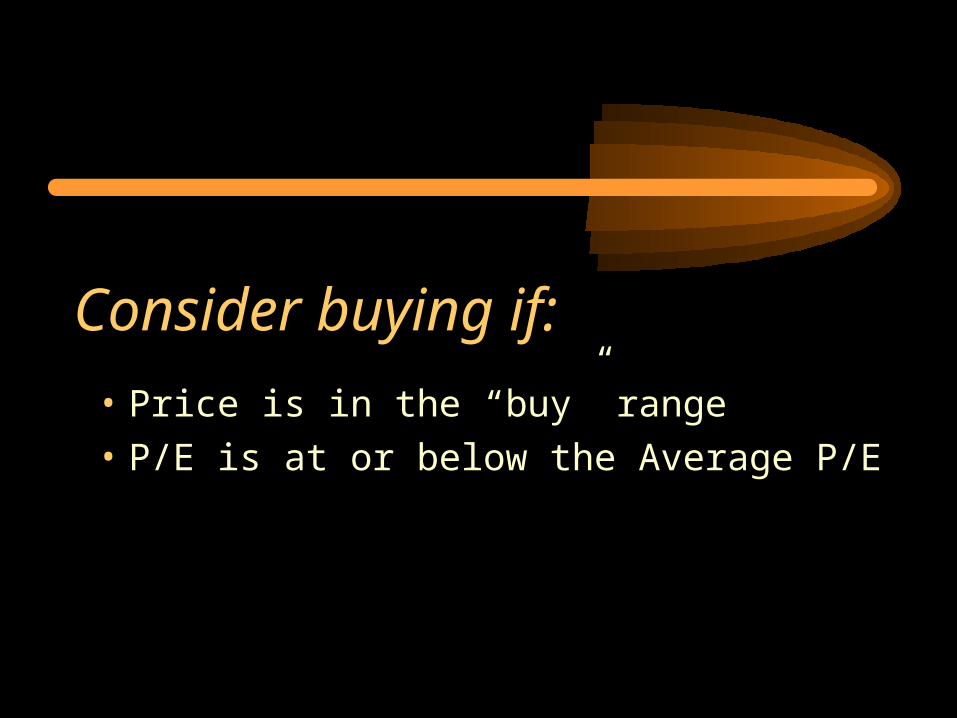
Consider buying if:
• Price is in the “buy” range• P/E is at or below the Average P/E
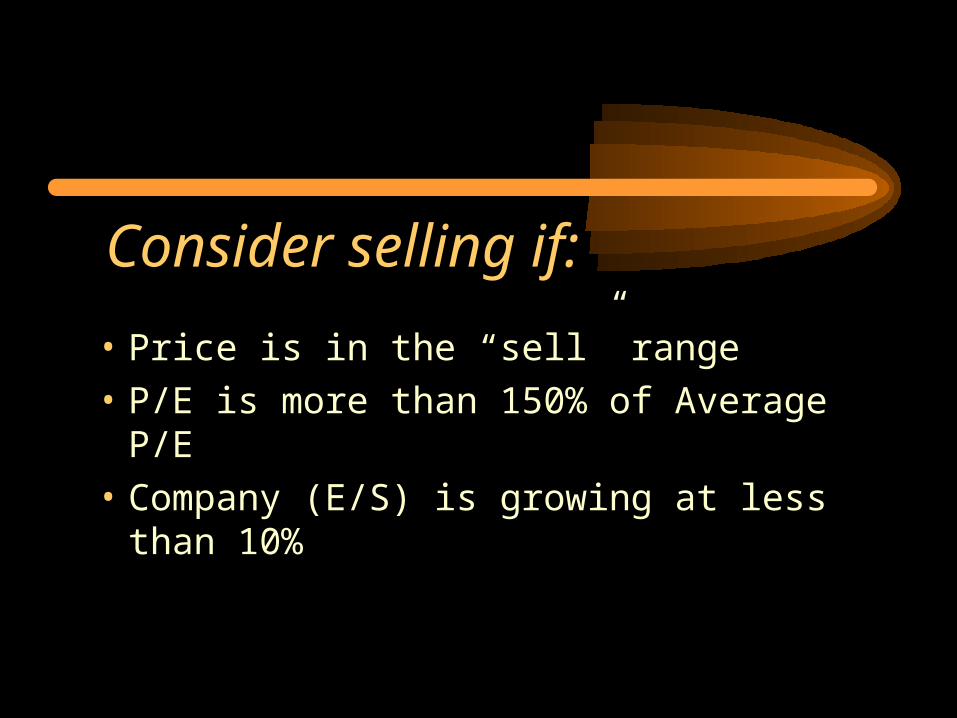
Consider selling if:
• Price is in the “sell” range• P/E is more than 150% of Average P/E• Company (E/S) is growing at less than
10%
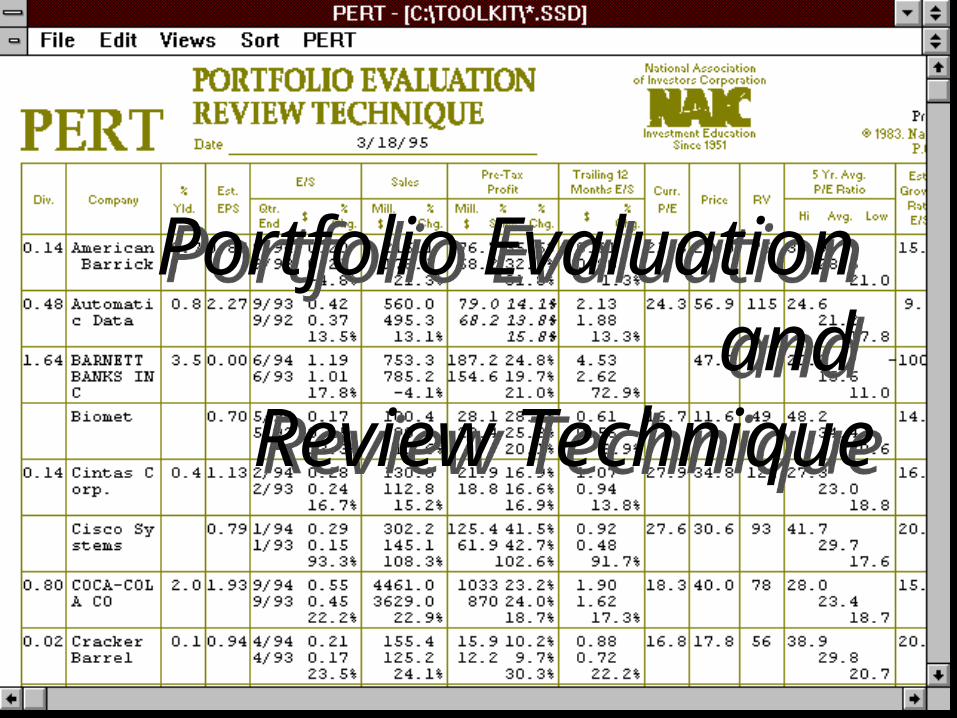
Portfolio Evaluation
and Review Technique
Portfolio Evaluation
and Review Technique
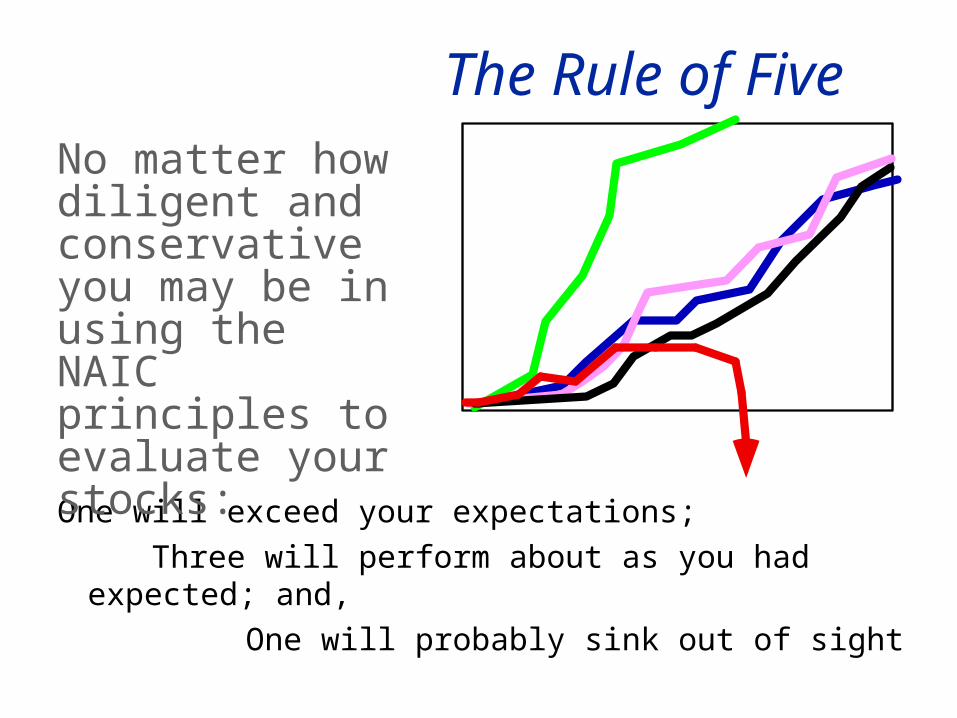
The Rule of Five
One will exceed your expectations; Three will perform about as you had
expected; and, One will probably sink out of sight
No matter how diligent and conservative you may be in using the NAIC principles to evaluate your stocks:
The PERT Form
• Analyzes company performance rather than price and P/E performance
• Provides ongoing measurement of investment potential
The Trend Report
• Adds previous quarter’s performance to provide “trend of the trends”
• Provides diversification analysis by size
• Consolidates Portfolio Management Guide recommendations

Questions?
Questions? ?
?
?
?
??
?
?

The EndThe End


Silicon Valley Investors’
Fair