Embed Size (px)
Citation preview
Recommendation: Buy
December 12th, 2012
Yum! Brands, Inc. (NYSE: YUM) Consumer Discretionary
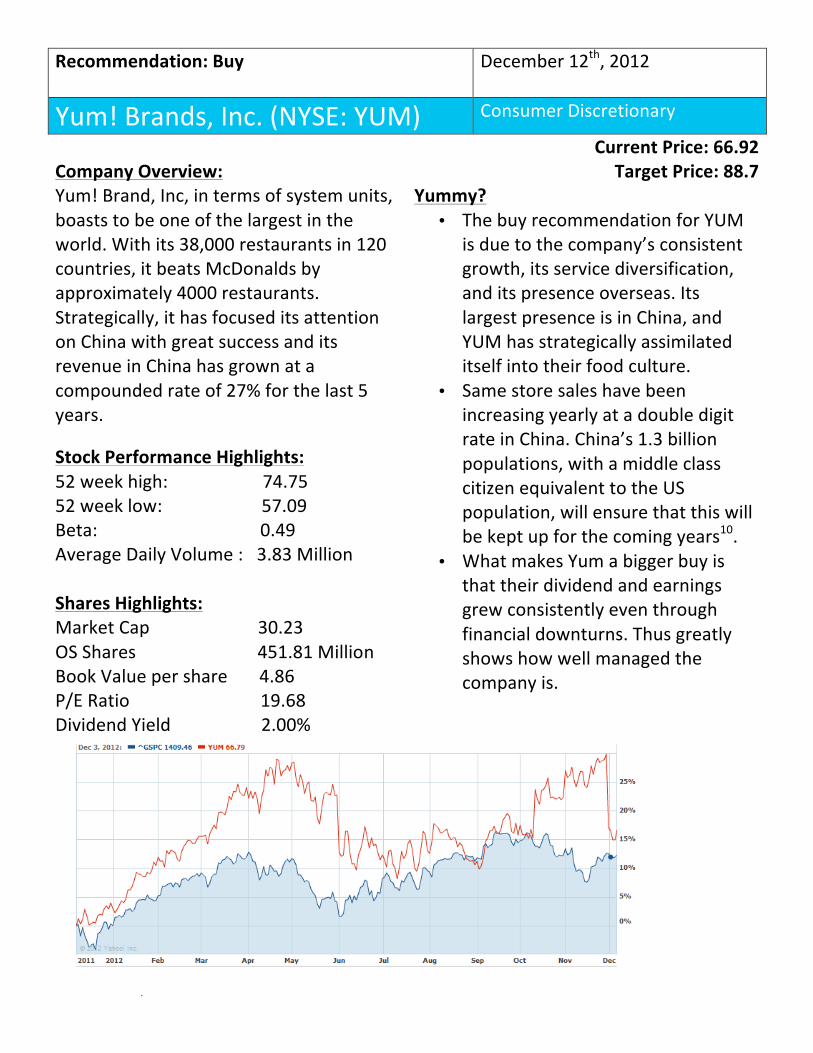
Company Overview: Yum! Brand, Inc, in terms of system units, boasts to be one of the largest in the world. With its 38,000 restaurants in 120 countries, it beats McDonalds by approximately 4000 restaurants. Strategically, it has focused its attention on China with great success and its revenue in China has grown at a compounded rate of 27% for the last 5 years.
Stock Performance Highlights: 52 week high: 74.75 52 week low: 57.09 Beta: 0.49 Average Daily Volume : 3.83 Million Shares Highlights: Market Cap 30.23 OS Shares 451.81 Million Book Value per share 4.86 P/E Ratio 19.68 Dividend Yield 2.00%
Current Price: 66.92 Target Price: 88.7
Yummy? • The buy recommendation for YUM
is due to the company’s consistent growth, its service diversification, and its presence overseas. Its largest presence is in China, and YUM has strategically assimilated itself into their food culture.
• Same store sales have been increasing yearly at a double digit rate in China. China’s 1.3 billion populations, with a middle class citizen equivalent to the US population, will ensure that this will be kept up for the coming years10.
• What makes Yum a bigger buy is that their dividend and earnings grew consistently even through financial downturns. Thus greatly shows how well managed the company is.
whats
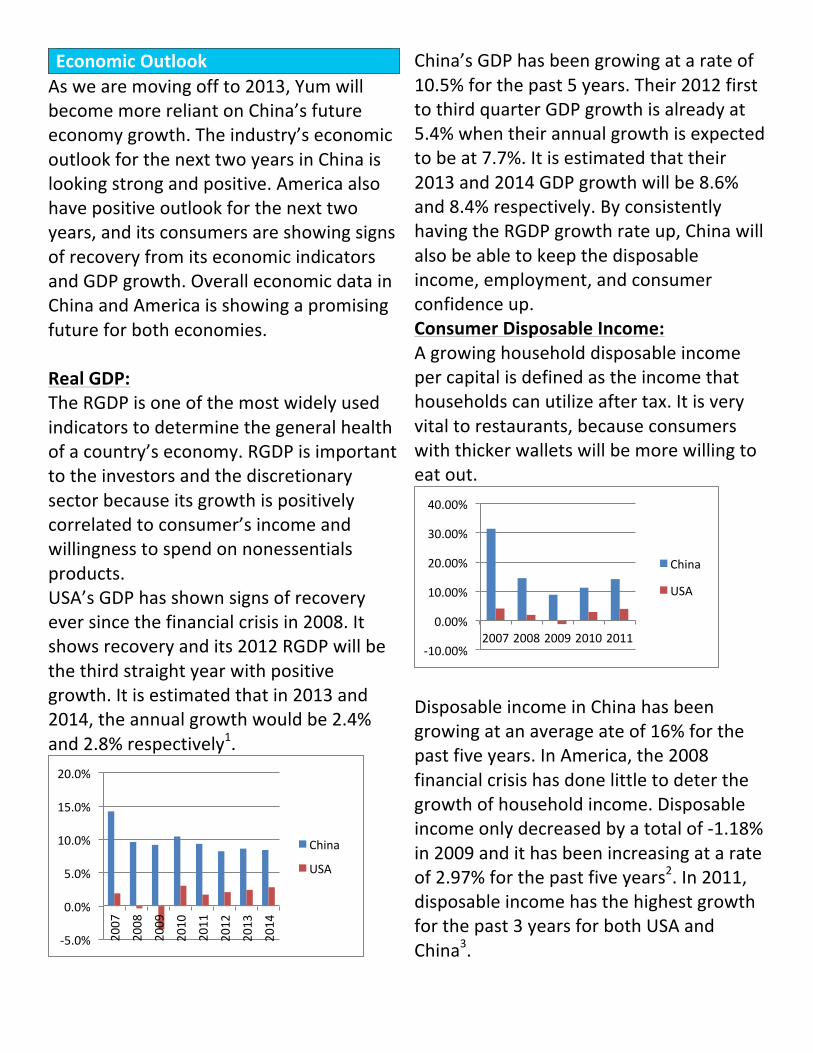
Economic Outlook As we are moving off to 2013, Yum will become more reliant on China’s future economy growth. The industry’s economic outlook for the next two years in China is looking strong and positive. America also have positive outlook for the next two years, and its consumers are showing signs of recovery from its economic indicators and GDP growth. Overall economic data in China and America is showing a promising future for both economies. Real GDP: The RGDP is one of the most widely used indicators to determine the general health of a country’s economy. RGDP is important to the investors and the discretionary sector because its growth is positively correlated to consumer’s income and willingness to spend on nonessentials products. USA’s GDP has shown signs of recovery ever since the financial crisis in 2008. It shows recovery and its 2012 RGDP will be the third straight year with positive growth. It is estimated that in 2013 and 2014, the annual growth would be 2.4% and 2.8% respectively1.
China’s GDP has been growing at a rate of 10.5% for the past 5 years. Their 2012 first to third quarter GDP growth is already at 5.4% when their annual growth is expected to be at 7.7%. It is estimated that their 2013 and 2014 GDP growth will be 8.6% and 8.4% respectively. By consistently having the RGDP growth rate up, China will also be able to keep the disposable income, employment, and consumer confidence up. Consumer Disposable Income: A growing household disposable income per capital is defined as the income that households can utilize after tax. It is very vital to restaurants, because consumers with thicker wallets will be more willing to eat out.
Disposable income in China has been growing at an average ate of 16% for the past five years. In America, the 2008 financial crisis has done little to deter the growth of household income. Disposable income only decreased by a total of -‐1.18% in 2009 and it has been increasing at a rate of 2.97% for the past five years2. In 2011, disposable income has the highest growth for the past 3 years for both USA and China3. -‐5.0%
0.0%
5.0%
10.0%
15.0%
20.0%
2007
2008
2009
2010
2011
2012
2013
2014
China
USA
-‐10.00%
0.00%
10.00%
20.00%
30.00%
40.00%
2007 2008 2009 2010 2011
China
USA
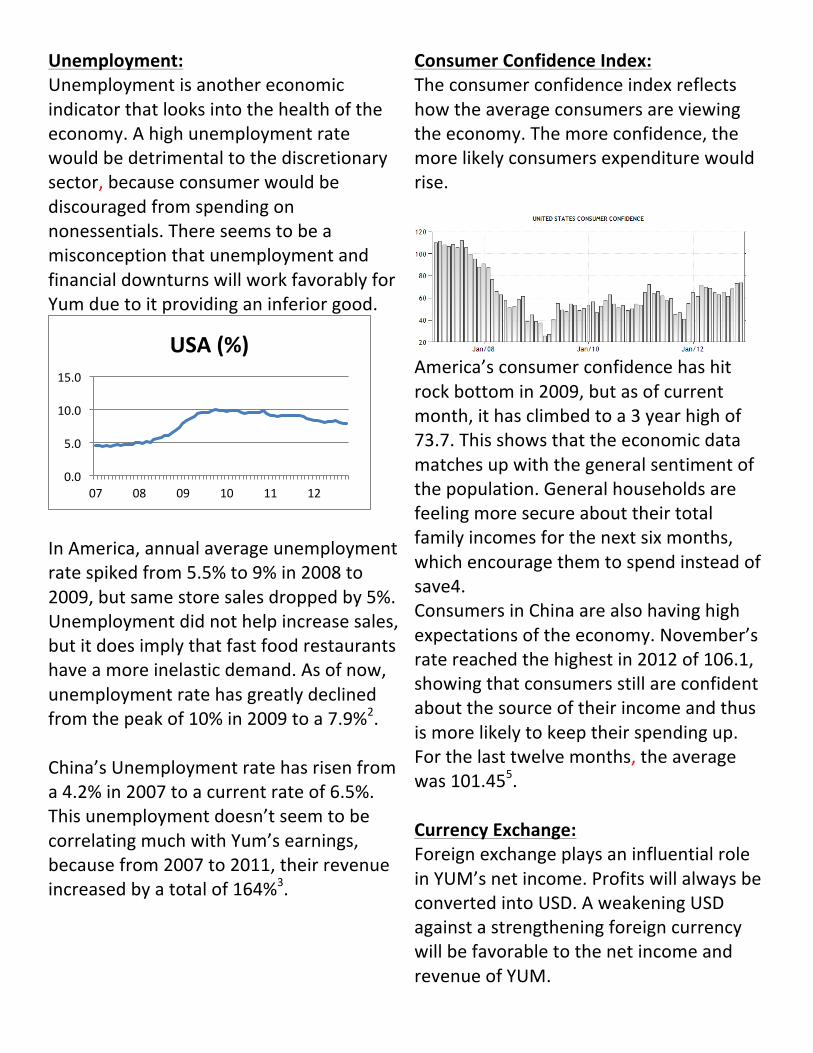
Unemployment: Unemployment is another economic indicator that looks into the health of the economy. A high unemployment rate would be detrimental to the discretionary sector, because consumer would be discouraged from spending on nonessentials. There seems to be a misconception that unemployment and financial downturns will work favorably for Yum due to it providing an inferior good.
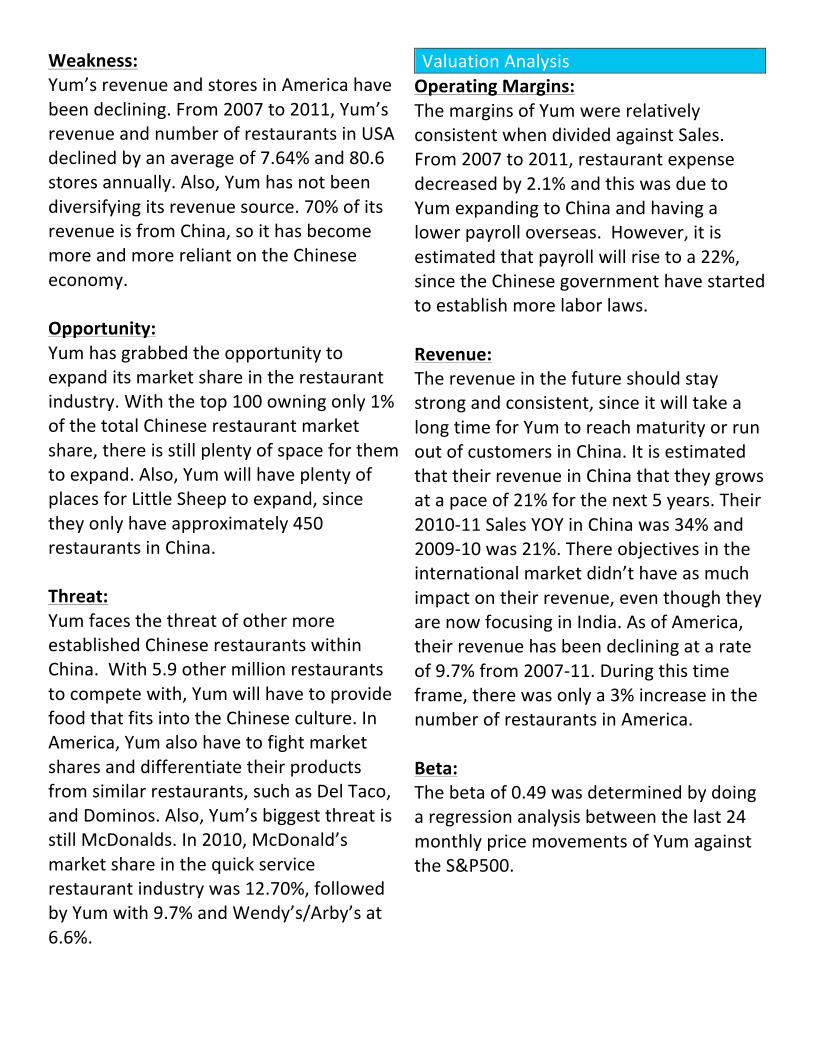
In America, annual average unemployment rate spiked from 5.5% to 9% in 2008 to 2009, but same store sales dropped by 5%. Unemployment did not help increase sales, but it does imply that fast food restaurants have a more inelastic demand. As of now, unemployment rate has greatly declined from the peak of 10% in 2009 to a 7.9%2. China’s Unemployment rate has risen from a 4.2% in 2007 to a current rate of 6.5%. This unemployment doesn’t seem to be correlating much with Yum’s earnings, because from 2007 to 2011, their revenue increased by a total of 164%3.
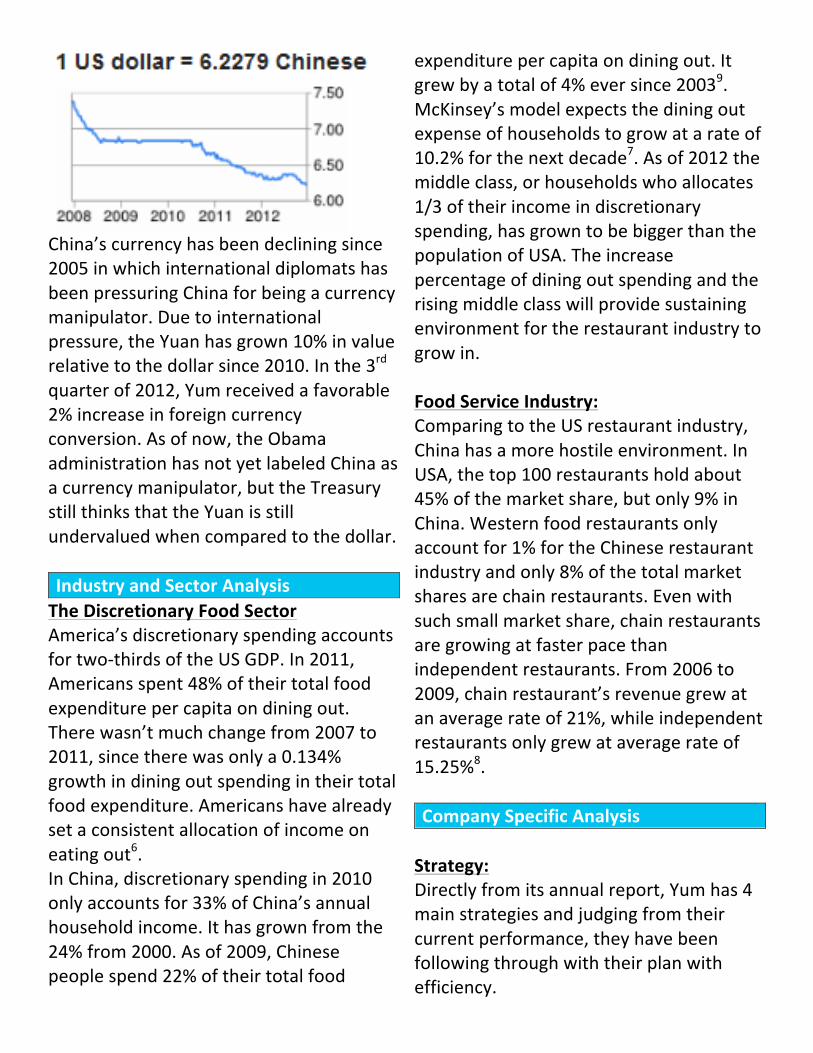
Consumer Confidence Index: The consumer confidence index reflects how the average consumers are viewing the economy. The more confidence, the more likely consumers expenditure would rise.
America’s consumer confidence has hit rock bottom in 2009, but as of current month, it has climbed to a 3 year high of 73.7. This shows that the economic data matches up with the general sentiment of the population. General households are feeling more secure about their total family incomes for the next six months, which encourage them to spend instead of save4. Consumers in China are also having high expectations of the economy. November’s rate reached the highest in 2012 of 106.1, showing that consumers still are confident about the source of their income and thus is more likely to keep their spending up. For the last twelve months, the average was 101.455. Currency Exchange: Foreign exchange plays an influential role in YUM’s net income. Profits will always be converted into USD. A weakening USD against a strengthening foreign currency will be favorable to the net income and revenue of YUM.
0.0
5.0
10.0
15.0
07 08 09 10 11 12
USA (%)
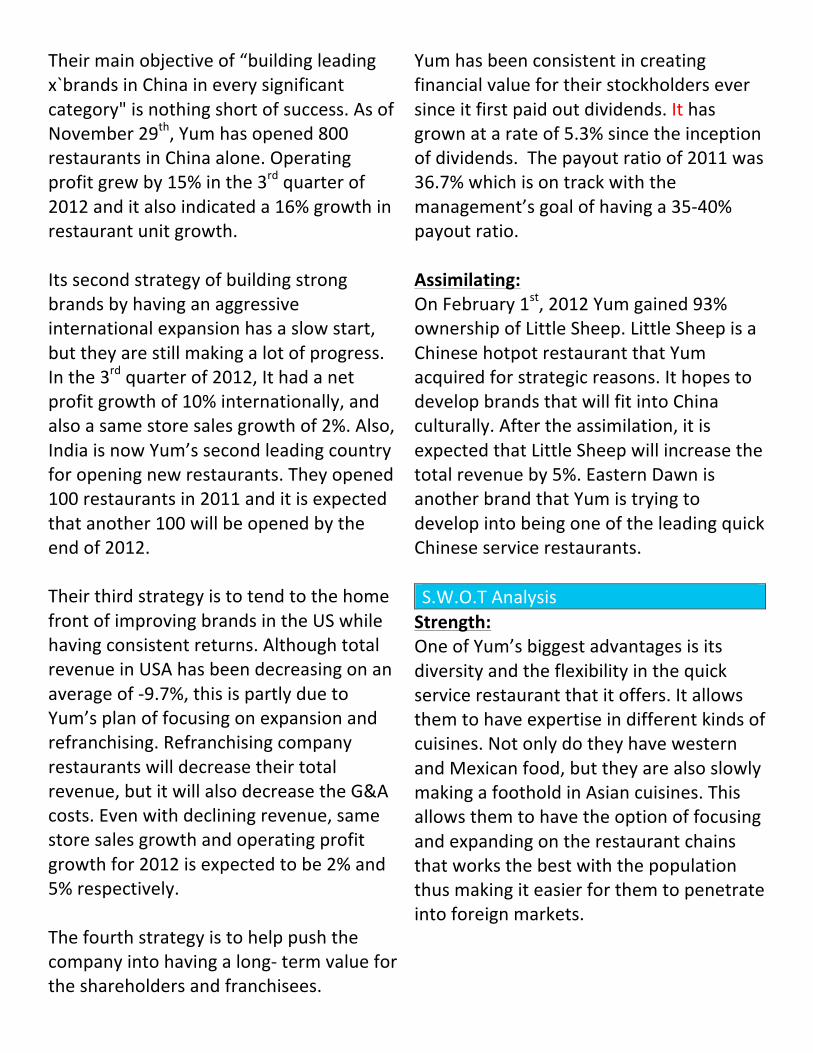
China’s currency has been declining since 2005 in which international diplomats has been pressuring China for being a currency manipulator. Due to international pressure, the Yuan has grown 10% in value relative to the dollar since 2010. In the 3rd quarter of 2012, Yum received a favorable 2% increase in foreign currency conversion. As of now, the Obama administration has not yet labeled China as a currency manipulator, but the Treasury still thinks that the Yuan is still undervalued when compared to the dollar. Industry and Sector Analysis The Discretionary Food Sector America’s discretionary spending accounts for two-‐thirds of the US GDP. In 2011, Americans spent 48% of their total food expenditure per capita on dining out. There wasn’t much change from 2007 to 2011, since there was only a 0.134% growth in dining out spending in their total food expenditure. Americans have already set a consistent allocation of income on eating out6. In China, discretionary spending in 2010 only accounts for 33% of China’s annual household income. It has grown from the 24% from 2000. As of 2009, Chinese people spend 22% of their total food
expenditure per capita on dining out. It grew by a total of 4% ever since 20039. McKinsey’s model expects the dining out expense of households to grow at a rate of 10.2% for the next decade7. As of 2012 the middle class, or households who allocates 1/3 of their income in discretionary spending, has grown to be bigger than the population of USA. The increase percentage of dining out spending and the rising middle class will provide sustaining environment for the restaurant industry to grow in. Food Service Industry: Comparing to the US restaurant industry, China has a more hostile environment. In USA, the top 100 restaurants hold about 45% of the market share, but only 9% in China. Western food restaurants only account for 1% for the Chinese restaurant industry and only 8% of the total market shares are chain restaurants. Even with such small market share, chain restaurants are growing at faster pace than independent restaurants. From 2006 to 2009, chain restaurant’s revenue grew at an average rate of 21%, while independent restaurants only grew at average rate of 15.25%8. Company Specific Analysis Strategy: Directly from its annual report, Yum has 4 main strategies and judging from their current performance, they have been following through with their plan with efficiency.
Their main objective of “building leading x`brands in China in every significant category" is nothing short of success. As of November 29th, Yum has opened 800 restaurants in China alone. Operating profit grew by 15% in the 3rd quarter of 2012 and it also indicated a 16% growth in restaurant unit growth. Its second strategy of building strong brands by having an aggressive international expansion has a slow start, but they are still making a lot of progress. In the 3rd quarter of 2012, It had a net profit growth of 10% internationally, and also a same store sales growth of 2%. Also, India is now Yum’s second leading country for opening new restaurants. They opened 100 restaurants in 2011 and it is expected that another 100 will be opened by the end of 2012. Their third strategy is to tend to the home front of improving brands in the US while having consistent returns. Although total revenue in USA has been decreasing on an average of -‐9.7%, this is partly due to Yum’s plan of focusing on expansion and refranchising. Refranchising company restaurants will decrease their total revenue, but it will also decrease the G&A costs. Even with declining revenue, same store sales growth and operating profit growth for 2012 is expected to be 2% and 5% respectively. The fourth strategy is to help push the company into having a long-‐ term value for the shareholders and franchisees.
Yum has been consistent in creating financial value for their stockholders ever since it first paid out dividends. It has grown at a rate of 5.3% since the inception of dividends. The payout ratio of 2011 was 36.7% which is on track with the management’s goal of having a 35-‐40% payout ratio. Assimilating: On February 1st, 2012 Yum gained 93% ownership of Little Sheep. Little Sheep is a Chinese hotpot restaurant that Yum acquired for strategic reasons. It hopes to develop brands that will fit into China culturally. After the assimilation, it is expected that Little Sheep will increase the total revenue by 5%. Eastern Dawn is another brand that Yum is trying to develop into being one of the leading quick Chinese service restaurants. S.W.O.T Analysis Strength: One of Yum’s biggest advantages is its diversity and the flexibility in the quick service restaurant that it offers. It allows them to have expertise in different kinds of cuisines. Not only do they have western and Mexican food, but they are also slowly making a foothold in Asian cuisines. This allows them to have the option of focusing and expanding on the restaurant chains that works the best with the population thus making it easier for them to penetrate into foreign markets.
Weakness: Yum’s revenue and stores in America have been declining. From 2007 to 2011, Yum’s revenue and number of restaurants in USA declined by an average of 7.64% and 80.6 stores annually. Also, Yum has not been diversifying its revenue source. 70% of its revenue is from China, so it has become more and more reliant on the Chinese economy. Opportunity: Yum has grabbed the opportunity to expand its market share in the restaurant industry. With the top 100 owning only 1% of the total Chinese restaurant market share, there is still plenty of space for them to expand. Also, Yum will have plenty of places for Little Sheep to expand, since they only have approximately 450 restaurants in China. Threat: Yum faces the threat of other more established Chinese restaurants within China. With 5.9 other million restaurants to compete with, Yum will have to provide food that fits into the Chinese culture. In America, Yum also have to fight market shares and differentiate their products from similar restaurants, such as Del Taco, and Dominos. Also, Yum’s biggest threat is still McDonalds. In 2010, McDonald’s market share in the quick service restaurant industry was 12.70%, followed by Yum with 9.7% and Wendy’s/Arby’s at 6.6%.
Valuation Analysis Operating Margins: The margins of Yum were relatively consistent when divided against Sales. From 2007 to 2011, restaurant expense decreased by 2.1% and this was due to Yum expanding to China and having a lower payroll overseas. However, it is estimated that payroll will rise to a 22%, since the Chinese government have started to establish more labor laws. Revenue: The revenue in the future should stay strong and consistent, since it will take a long time for Yum to reach maturity or run out of customers in China. It is estimated that their revenue in China that they grows at a pace of 21% for the next 5 years. Their 2010-‐11 Sales YOY in China was 34% and 2009-‐10 was 21%. There objectives in the international market didn’t have as much impact on their revenue, even though they are now focusing in India. As of America, their revenue has been declining at a rate of 9.7% from 2007-‐11. During this time frame, there was only a 3% increase in the number of restaurants in America. Beta: The beta of 0.49 was determined by doing a regression analysis between the last 24 monthly price movements of Yum against the S&P500.
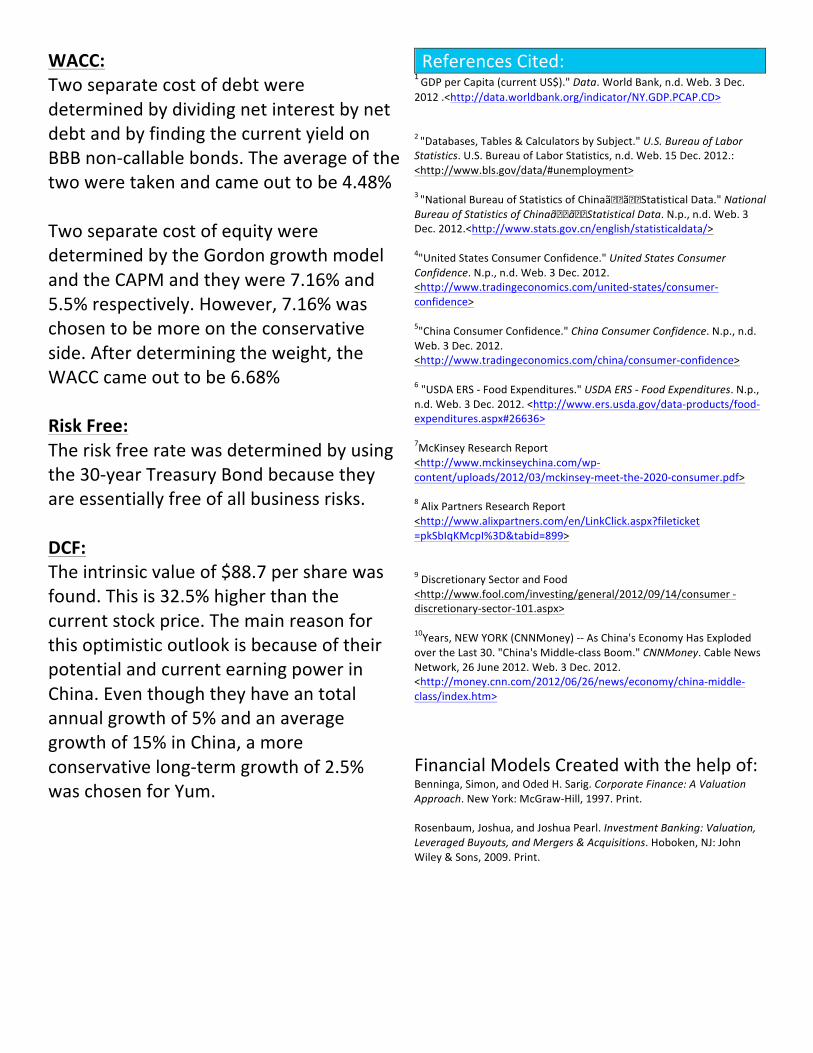
WACC: Two separate cost of debt were determined by dividing net interest by net debt and by finding the current yield on BBB non-‐callable bonds. The average of the two were taken and came out to be 4.48% Two separate cost of equity were determined by the Gordon growth model and the CAPM and they were 7.16% and 5.5% respectively. However, 7.16% was chosen to be more on the conservative side. After determining the weight, the WACC came out to be 6.68% Risk Free: The risk free rate was determined by using the 30-‐year Treasury Bond because they are essentially free of all business risks. DCF: The intrinsic value of $88.7 per share was found. This is 32.5% higher than the current stock price. The main reason for this optimistic outlook is because of their potential and current earning power in China. Even though they have an total annual growth of 5% and an average growth of 15% in China, a more conservative long-‐term growth of 2.5% was chosen for Yum.
References Cited: 1 GDP per Capita (current US$)." Data. World Bank, n.d. Web. 3 Dec. 2012 .<http://data.worldbank.org/indicator/NY.GDP.PCAP.CD> 2 "Databases, Tables & Calculators by Subject." U.S. Bureau of Labor Statistics. U.S. Bureau of Labor Statistics, n.d. Web. 15 Dec. 2012.: <http://www.bls.gov/data/#unemployment> 3 "National Bureau of Statistics of Chinaã��ã��Statistical Data." National Bureau of Statistics of Chinaã��ã��Statistical Data. N.p., n.d. Web. 3 Dec. 2012.<http://www.stats.gov.cn/english/statisticaldata/> 4"United States Consumer Confidence." United States Consumer Confidence. N.p., n.d. Web. 3 Dec. 2012. <http://www.tradingeconomics.com/united-‐states/consumer-‐confidence> 5"China Consumer Confidence." China Consumer Confidence. N.p., n.d. Web. 3 Dec. 2012. <http://www.tradingeconomics.com/china/consumer-‐confidence> 6 "USDA ERS -‐ Food Expenditures." USDA ERS -‐ Food Expenditures. N.p., n.d. Web. 3 Dec. 2012. <http://www.ers.usda.gov/data-‐products/food-‐expenditures.aspx#26636> 7McKinsey Research Report <http://www.mckinseychina.com/wp-‐content/uploads/2012/03/mckinsey-‐meet-‐the-‐2020-‐consumer.pdf> 8 Alix Partners Research Report <http://www.alixpartners.com/en/LinkClick.aspx?fileticket =pkSbIqKMcpI%3D&tabid=899> 9 Discretionary Sector and Food <http://www.fool.com/investing/general/2012/09/14/consumer -‐ discretionary-‐sector-‐101.aspx> 10Years, NEW YORK (CNNMoney) -‐-‐ As China's Economy Has Exploded over the Last 30. "China's Middle-‐class Boom." CNNMoney. Cable News Network, 26 June 2012. Web. 3 Dec. 2012. <http://money.cnn.com/2012/06/26/news/economy/china-‐middle-‐class/index.htm>
Financial Models Created with the help of: Benninga, Simon, and Oded H. Sarig. Corporate Finance: A Valuation Approach. New York: McGraw-‐Hill, 1997. Print. Rosenbaum, Joshua, and Joshua Pearl. Investment Banking: Valuation, Leveraged Buyouts, and Mergers & Acquisitions. Hoboken, NJ: John Wiley & Sons, 2009. Print.

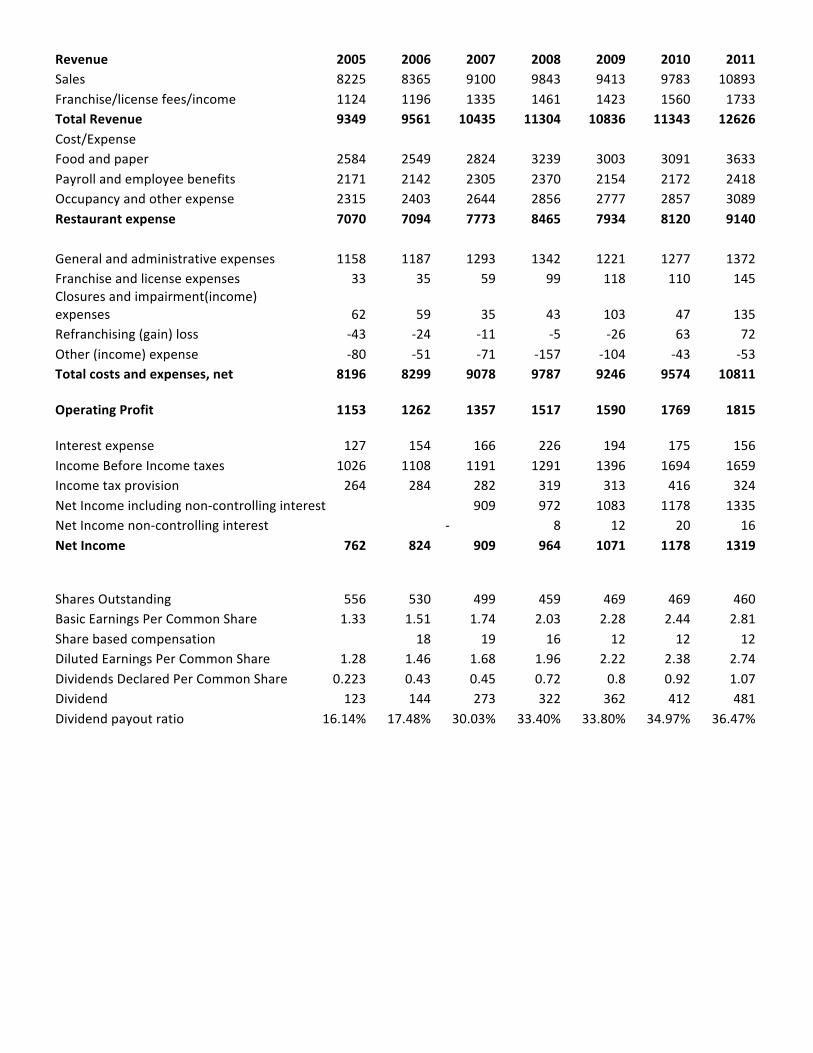
Revenue 2005 2006 2007 2008 2009 2010 2011 Sales 8225 8365 9100 9843 9413 9783 10893 Franchise/license fees/income 1124 1196 1335 1461 1423 1560 1733 Total Revenue 9349 9561 10435 11304 10836 11343 12626 Cost/Expense
Food and paper 2584 2549 2824 3239 3003 3091 3633 Payroll and employee benefits 2171 2142 2305 2370 2154 2172 2418 Occupancy and other expense 2315 2403 2644 2856 2777 2857 3089 Restaurant expense 7070 7094 7773 8465 7934 8120 9140
General and administrative expenses 1158 1187 1293 1342 1221 1277 1372 Franchise and license expenses 33 35 59 99 118 110 145 Closures and impairment(income) expenses 62 59 35 43 103 47 135 Refranchising (gain) loss -‐43 -‐24 -‐11 -‐5 -‐26 63 72 Other (income) expense -‐80 -‐51 -‐71 -‐157 -‐104 -‐43 -‐53 Total costs and expenses, net 8196 8299 9078 9787 9246 9574 10811 Operating Profit 1153 1262 1357 1517 1590 1769 1815 Interest expense 127 154 166 226 194 175 156 Income Before Income taxes 1026 1108 1191 1291 1396 1694 1659 Income tax provision 264 284 282 319 313 416 324 Net Income including non-‐controlling interest
909 972 1083 1178 1335
Net Income non-‐controlling interest
-‐ 8 12 20 16 Net Income 762 824 909 964 1071 1178 1319 Shares Outstanding 556 530 499 459 469 469 460 Basic Earnings Per Common Share 1.33 1.51 1.74 2.03 2.28 2.44 2.81 Share based compensation
18 19 16 12 12 12
Diluted Earnings Per Common Share 1.28 1.46 1.68 1.96 2.22 2.38 2.74 Dividends Declared Per Common Share 0.223 0.43 0.45 0.72 0.8 0.92 1.07 Dividend 123 144 273 322 362 412 481 Dividend payout ratio 16.14% 17.48% 30.03% 33.40% 33.80% 34.97% 36.47%
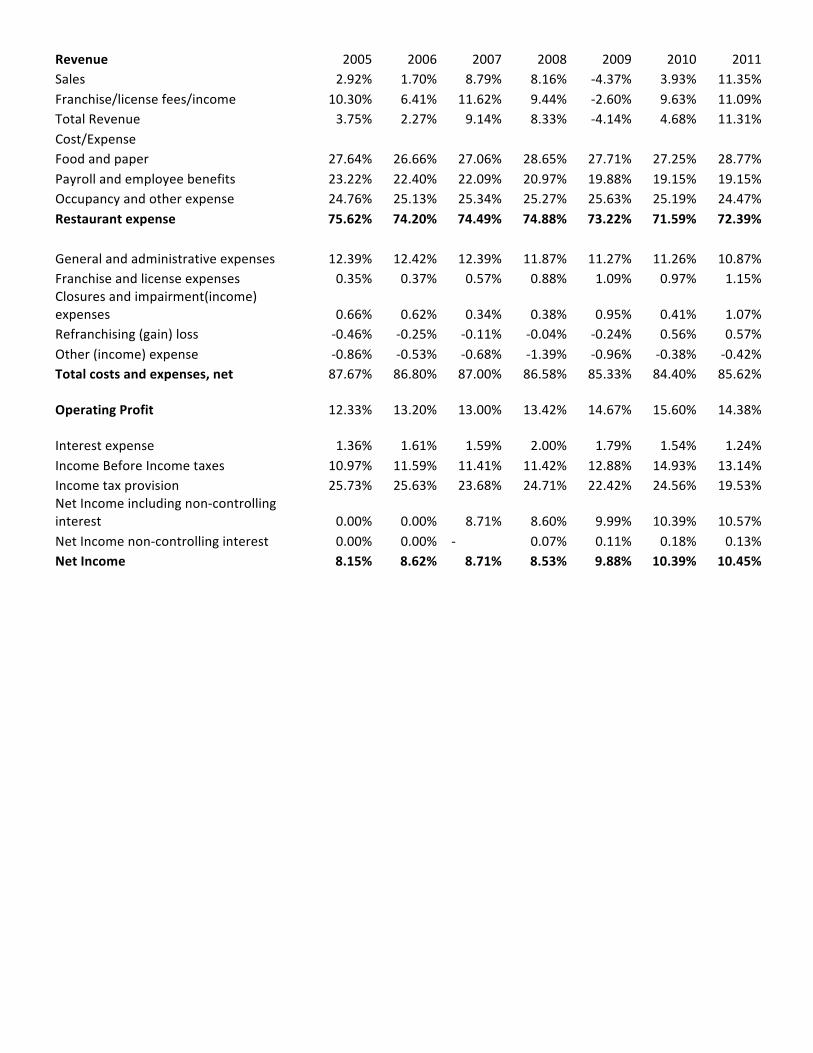
Revenue 2005 2006 2007 2008 2009 2010 2011 Sales 2.92% 1.70% 8.79% 8.16% -‐4.37% 3.93% 11.35% Franchise/license fees/income 10.30% 6.41% 11.62% 9.44% -‐2.60% 9.63% 11.09% Total Revenue 3.75% 2.27% 9.14% 8.33% -‐4.14% 4.68% 11.31% Cost/Expense Food and paper 27.64% 26.66% 27.06% 28.65% 27.71% 27.25% 28.77% Payroll and employee benefits 23.22% 22.40% 22.09% 20.97% 19.88% 19.15% 19.15% Occupancy and other expense 24.76% 25.13% 25.34% 25.27% 25.63% 25.19% 24.47% Restaurant expense 75.62% 74.20% 74.49% 74.88% 73.22% 71.59% 72.39% General and administrative expenses 12.39% 12.42% 12.39% 11.87% 11.27% 11.26% 10.87% Franchise and license expenses 0.35% 0.37% 0.57% 0.88% 1.09% 0.97% 1.15% Closures and impairment(income) expenses 0.66% 0.62% 0.34% 0.38% 0.95% 0.41% 1.07% Refranchising (gain) loss -‐0.46% -‐0.25% -‐0.11% -‐0.04% -‐0.24% 0.56% 0.57% Other (income) expense -‐0.86% -‐0.53% -‐0.68% -‐1.39% -‐0.96% -‐0.38% -‐0.42% Total costs and expenses, net 87.67% 86.80% 87.00% 86.58% 85.33% 84.40% 85.62% Operating Profit 12.33% 13.20% 13.00% 13.42% 14.67% 15.60% 14.38% Interest expense 1.36% 1.61% 1.59% 2.00% 1.79% 1.54% 1.24% Income Before Income taxes 10.97% 11.59% 11.41% 11.42% 12.88% 14.93% 13.14% Income tax provision 25.73% 25.63% 23.68% 24.71% 22.42% 24.56% 19.53% Net Income including non-‐controlling interest 0.00% 0.00% 8.71% 8.60% 9.99% 10.39% 10.57% Net Income non-‐controlling interest 0.00% 0.00% -‐ 0.07% 0.11% 0.18% 0.13% Net Income 8.15% 8.62% 8.71% 8.53% 9.88% 10.39% 10.45%
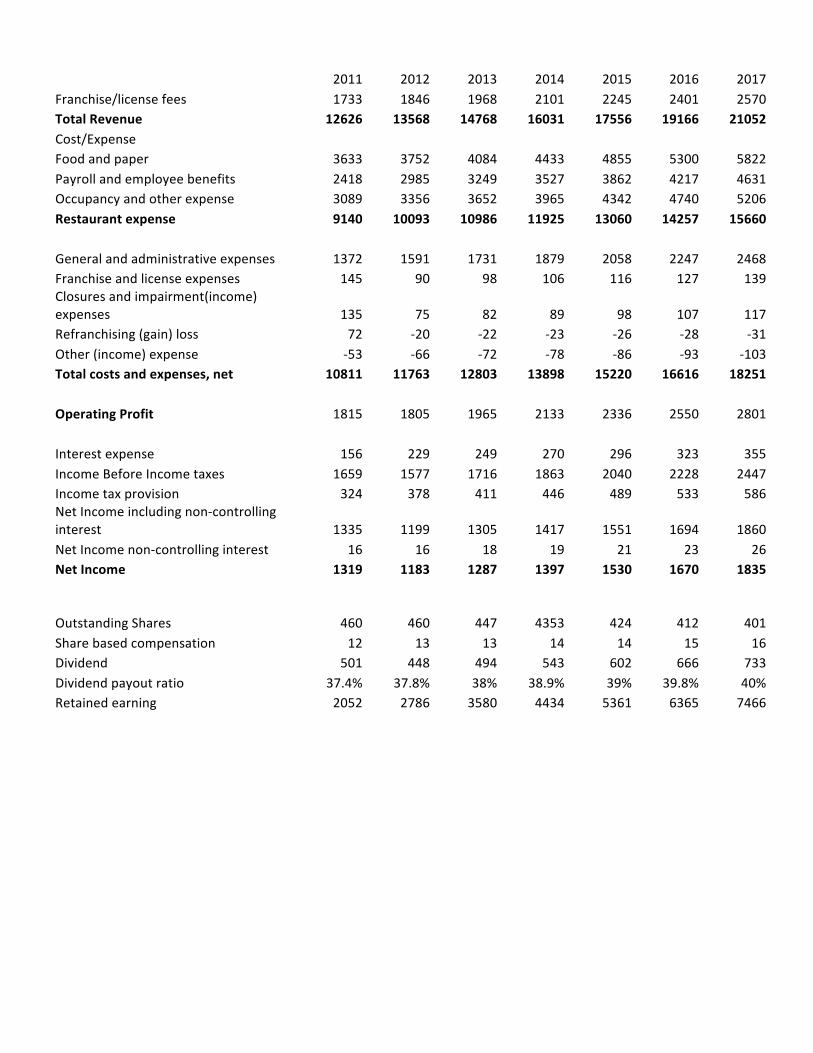
2011 2012 2013 2014 2015 2016 2017
Franchise/license fees 1733 1846 1968 2101 2245 2401 2570 Total Revenue 12626 13568 14768 16031 17556 19166 21052 Cost/Expense
Food and paper 3633 3752 4084 4433 4855 5300 5822 Payroll and employee benefits 2418 2985 3249 3527 3862 4217 4631 Occupancy and other expense 3089 3356 3652 3965 4342 4740 5206 Restaurant expense 9140 10093 10986 11925 13060 14257 15660
General and administrative expenses 1372 1591 1731 1879 2058 2247 2468 Franchise and license expenses 145 90 98 106 116 127 139 Closures and impairment(income) expenses 135 75 82 89 98 107 117 Refranchising (gain) loss 72 -‐20 -‐22 -‐23 -‐26 -‐28 -‐31 Other (income) expense -‐53 -‐66 -‐72 -‐78 -‐86 -‐93 -‐103 Total costs and expenses, net 10811 11763 12803 13898 15220 16616 18251
Operating Profit 1815 1805 1965 2133 2336 2550 2801
Interest expense 156 229 249 270 296 323 355 Income Before Income taxes 1659 1577 1716 1863 2040 2228 2447 Income tax provision 324 378 411 446 489 533 586 Net Income including non-‐controlling interest 1335 1199 1305 1417 1551 1694 1860 Net Income non-‐controlling interest 16 16 18 19 21 23 26 Net Income 1319 1183 1287 1397 1530 1670 1835 Outstanding Shares 460 460 447 4353 424 412 401 Share based compensation 12 13 13 14 14 15 16 Dividend 501 448 494 543 602 666 733 Dividend payout ratio 37.4% 37.8% 38% 38.9% 39% 39.8% 40% Retained earning 2052 2786 3580 4434 5361 6365 7466
2011 2012 2013 2014 2015 2016 2017
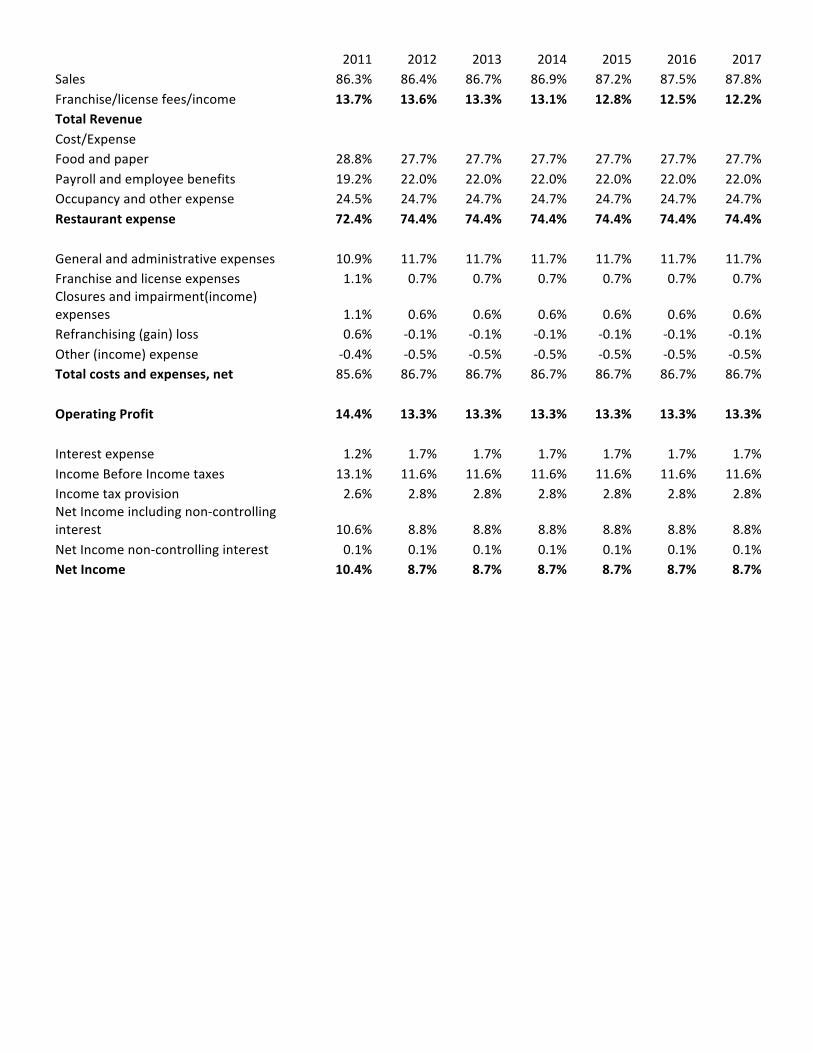
Sales 86.3% 86.4% 86.7% 86.9% 87.2% 87.5% 87.8% Franchise/license fees/income 13.7% 13.6% 13.3% 13.1% 12.8% 12.5% 12.2% Total Revenue
Cost/Expense Food and paper 28.8% 27.7% 27.7% 27.7% 27.7% 27.7% 27.7%
Payroll and employee benefits 19.2% 22.0% 22.0% 22.0% 22.0% 22.0% 22.0% Occupancy and other expense 24.5% 24.7% 24.7% 24.7% 24.7% 24.7% 24.7% Restaurant expense 72.4% 74.4% 74.4% 74.4% 74.4% 74.4% 74.4%
General and administrative expenses 10.9% 11.7% 11.7% 11.7% 11.7% 11.7% 11.7% Franchise and license expenses 1.1% 0.7% 0.7% 0.7% 0.7% 0.7% 0.7% Closures and impairment(income) expenses 1.1% 0.6% 0.6% 0.6% 0.6% 0.6% 0.6% Refranchising (gain) loss 0.6% -‐0.1% -‐0.1% -‐0.1% -‐0.1% -‐0.1% -‐0.1% Other (income) expense -‐0.4% -‐0.5% -‐0.5% -‐0.5% -‐0.5% -‐0.5% -‐0.5% Total costs and expenses, net 85.6% 86.7% 86.7% 86.7% 86.7% 86.7% 86.7%
Operating Profit 14.4% 13.3% 13.3% 13.3% 13.3% 13.3% 13.3%
Interest expense 1.2% 1.7% 1.7% 1.7% 1.7% 1.7% 1.7% Income Before Income taxes 13.1% 11.6% 11.6% 11.6% 11.6% 11.6% 11.6% Income tax provision 2.6% 2.8% 2.8% 2.8% 2.8% 2.8% 2.8% Net Income including non-‐controlling interest 10.6% 8.8% 8.8% 8.8% 8.8% 8.8% 8.8% Net Income non-‐controlling interest 0.1% 0.1% 0.1% 0.1% 0.1% 0.1% 0.1% Net Income 10.4% 8.7% 8.7% 8.7% 8.7% 8.7% 8.7%
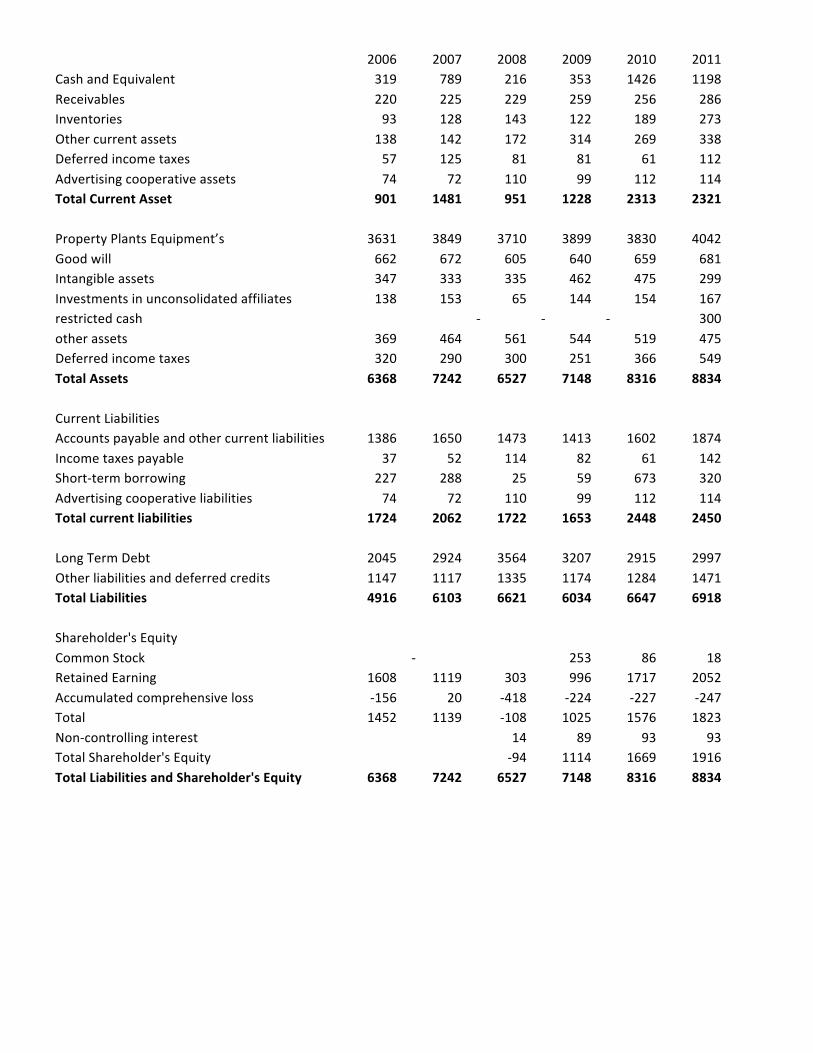
2006 2007 2008 2009 2010 2011
Cash and Equivalent 319 789 216 353 1426 1198 Receivables 220 225 229 259 256 286 Inventories 93 128 143 122 189 273 Other current assets 138 142 172 314 269 338 Deferred income taxes 57 125 81 81 61 112 Advertising cooperative assets 74 72 110 99 112 114 Total Current Asset 901 1481 951 1228 2313 2321
Property Plants Equipment’s 3631 3849 3710 3899 3830 4042 Good will 662 672 605 640 659 681 Intangible assets 347 333 335 462 475 299 Investments in unconsolidated affiliates 138 153 65 144 154 167 restricted cash
-‐ -‐ -‐ 300
other assets 369 464 561 544 519 475 Deferred income taxes 320 290 300 251 366 549 Total Assets 6368 7242 6527 7148 8316 8834
Current Liabilities Accounts payable and other current liabilities 1386 1650 1473 1413 1602 1874
Income taxes payable 37 52 114 82 61 142 Short-‐term borrowing 227 288 25 59 673 320 Advertising cooperative liabilities 74 72 110 99 112 114 Total current liabilities 1724 2062 1722 1653 2448 2450
Long Term Debt 2045 2924 3564 3207 2915 2997 Other liabilities and deferred credits 1147 1117 1335 1174 1284 1471 Total Liabilities 4916 6103 6621 6034 6647 6918
Shareholder's Equity Common Stock
-‐
253 86 18 Retained Earning 1608 1119 303 996 1717 2052 Accumulated comprehensive loss -‐156 20 -‐418 -‐224 -‐227 -‐247 Total 1452 1139 -‐108 1025 1576 1823 Non-‐controlling interest
14 89 93 93
Total Shareholder's Equity
-‐94 1114 1669 1916 Total Liabilities and Shareholder's Equity 6368 7242 6527 7148 8316 8834
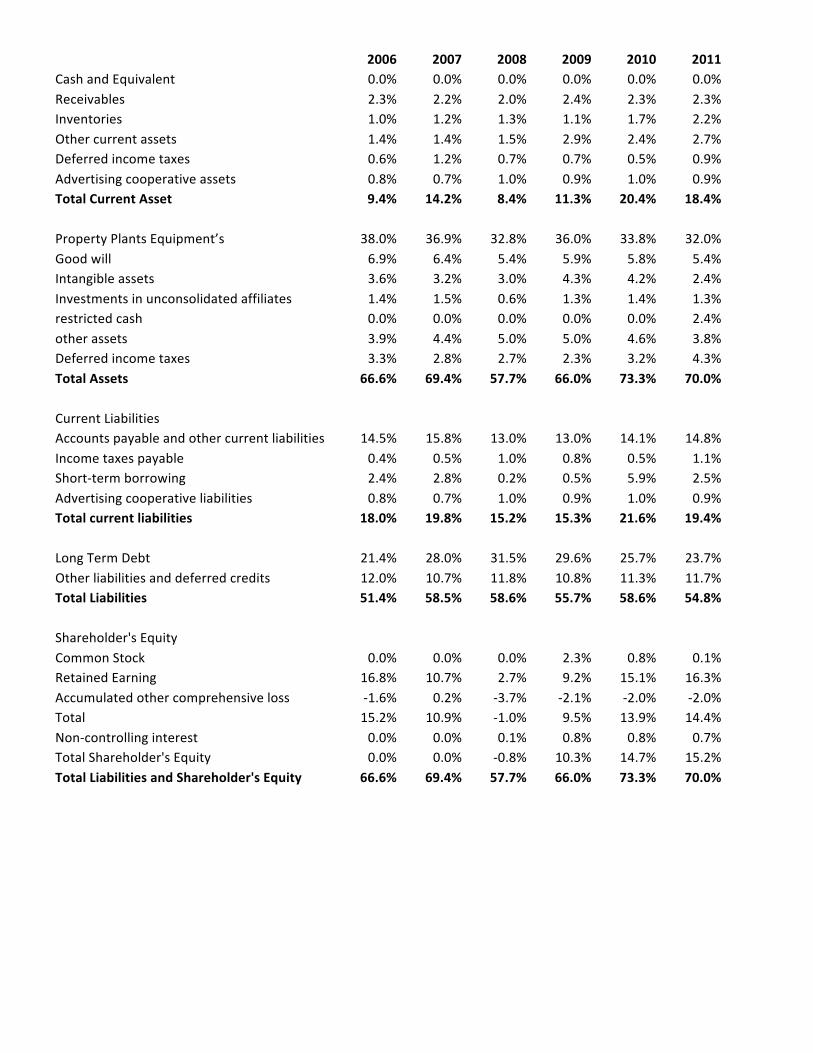
2006 2007 2008 2009 2010 2011 Cash and Equivalent 0.0% 0.0% 0.0% 0.0% 0.0% 0.0% Receivables 2.3% 2.2% 2.0% 2.4% 2.3% 2.3% Inventories 1.0% 1.2% 1.3% 1.1% 1.7% 2.2% Other current assets 1.4% 1.4% 1.5% 2.9% 2.4% 2.7% Deferred income taxes 0.6% 1.2% 0.7% 0.7% 0.5% 0.9% Advertising cooperative assets 0.8% 0.7% 1.0% 0.9% 1.0% 0.9% Total Current Asset 9.4% 14.2% 8.4% 11.3% 20.4% 18.4% Property Plants Equipment’s 38.0% 36.9% 32.8% 36.0% 33.8% 32.0% Good will 6.9% 6.4% 5.4% 5.9% 5.8% 5.4% Intangible assets 3.6% 3.2% 3.0% 4.3% 4.2% 2.4% Investments in unconsolidated affiliates 1.4% 1.5% 0.6% 1.3% 1.4% 1.3% restricted cash 0.0% 0.0% 0.0% 0.0% 0.0% 2.4% other assets 3.9% 4.4% 5.0% 5.0% 4.6% 3.8% Deferred income taxes 3.3% 2.8% 2.7% 2.3% 3.2% 4.3% Total Assets 66.6% 69.4% 57.7% 66.0% 73.3% 70.0% Current Liabilities Accounts payable and other current liabilities 14.5% 15.8% 13.0% 13.0% 14.1% 14.8% Income taxes payable 0.4% 0.5% 1.0% 0.8% 0.5% 1.1% Short-‐term borrowing 2.4% 2.8% 0.2% 0.5% 5.9% 2.5% Advertising cooperative liabilities 0.8% 0.7% 1.0% 0.9% 1.0% 0.9% Total current liabilities 18.0% 19.8% 15.2% 15.3% 21.6% 19.4% Long Term Debt 21.4% 28.0% 31.5% 29.6% 25.7% 23.7% Other liabilities and deferred credits 12.0% 10.7% 11.8% 10.8% 11.3% 11.7% Total Liabilities 51.4% 58.5% 58.6% 55.7% 58.6% 54.8% Shareholder's Equity Common Stock 0.0% 0.0% 0.0% 2.3% 0.8% 0.1% Retained Earning 16.8% 10.7% 2.7% 9.2% 15.1% 16.3% Accumulated other comprehensive loss -‐1.6% 0.2% -‐3.7% -‐2.1% -‐2.0% -‐2.0% Total 15.2% 10.9% -‐1.0% 9.5% 13.9% 14.4% Non-‐controlling interest 0.0% 0.0% 0.1% 0.8% 0.8% 0.7% Total Shareholder's Equity 0.0% 0.0% -‐0.8% 10.3% 14.7% 15.2% Total Liabilities and Shareholder's Equity 66.6% 69.4% 57.7% 66.0% 73.3% 70.0%
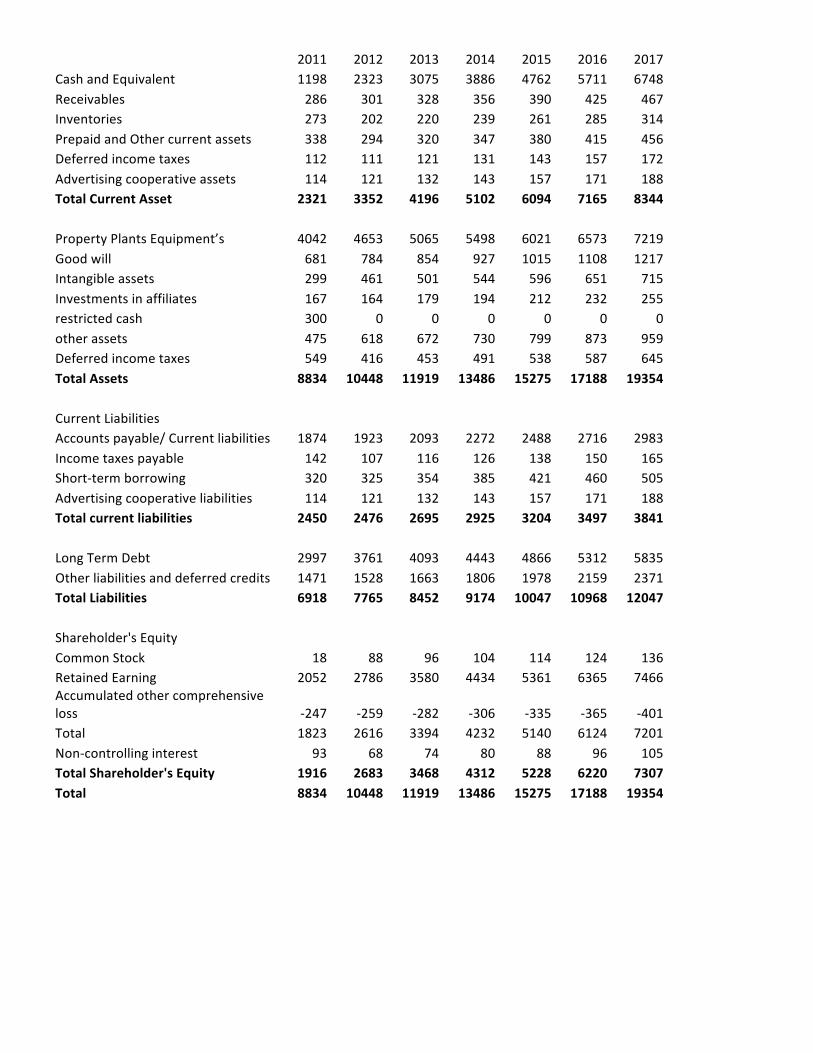
2011 2012 2013 2014 2015 2016 2017
Cash and Equivalent 1198 2323 3075 3886 4762 5711 6748 Receivables 286 301 328 356 390 425 467 Inventories 273 202 220 239 261 285 314 Prepaid and Other current assets 338 294 320 347 380 415 456 Deferred income taxes 112 111 121 131 143 157 172 Advertising cooperative assets 114 121 132 143 157 171 188 Total Current Asset 2321 3352 4196 5102 6094 7165 8344
Property Plants Equipment’s 4042 4653 5065 5498 6021 6573 7219 Good will 681 784 854 927 1015 1108 1217 Intangible assets 299 461 501 544 596 651 715 Investments in affiliates 167 164 179 194 212 232 255 restricted cash 300 0 0 0 0 0 0 other assets 475 618 672 730 799 873 959 Deferred income taxes 549 416 453 491 538 587 645 Total Assets 8834 10448 11919 13486 15275 17188 19354
Current Liabilities Accounts payable/ Current liabilities 1874 1923 2093 2272 2488 2716 2983
Income taxes payable 142 107 116 126 138 150 165 Short-‐term borrowing 320 325 354 385 421 460 505 Advertising cooperative liabilities 114 121 132 143 157 171 188 Total current liabilities 2450 2476 2695 2925 3204 3497 3841
Long Term Debt 2997 3761 4093 4443 4866 5312 5835 Other liabilities and deferred credits 1471 1528 1663 1806 1978 2159 2371 Total Liabilities 6918 7765 8452 9174 10047 10968 12047
Shareholder's Equity Common Stock 18 88 96 104 114 124 136
Retained Earning 2052 2786 3580 4434 5361 6365 7466 Accumulated other comprehensive loss -‐247 -‐259 -‐282 -‐306 -‐335 -‐365 -‐401 Total 1823 2616 3394 4232 5140 6124 7201 Non-‐controlling interest 93 68 74 80 88 96 105 Total Shareholder's Equity 1916 2683 3468 4312 5228 6220 7307 Total 8834 10448 11919 13486 15275 17188 19354
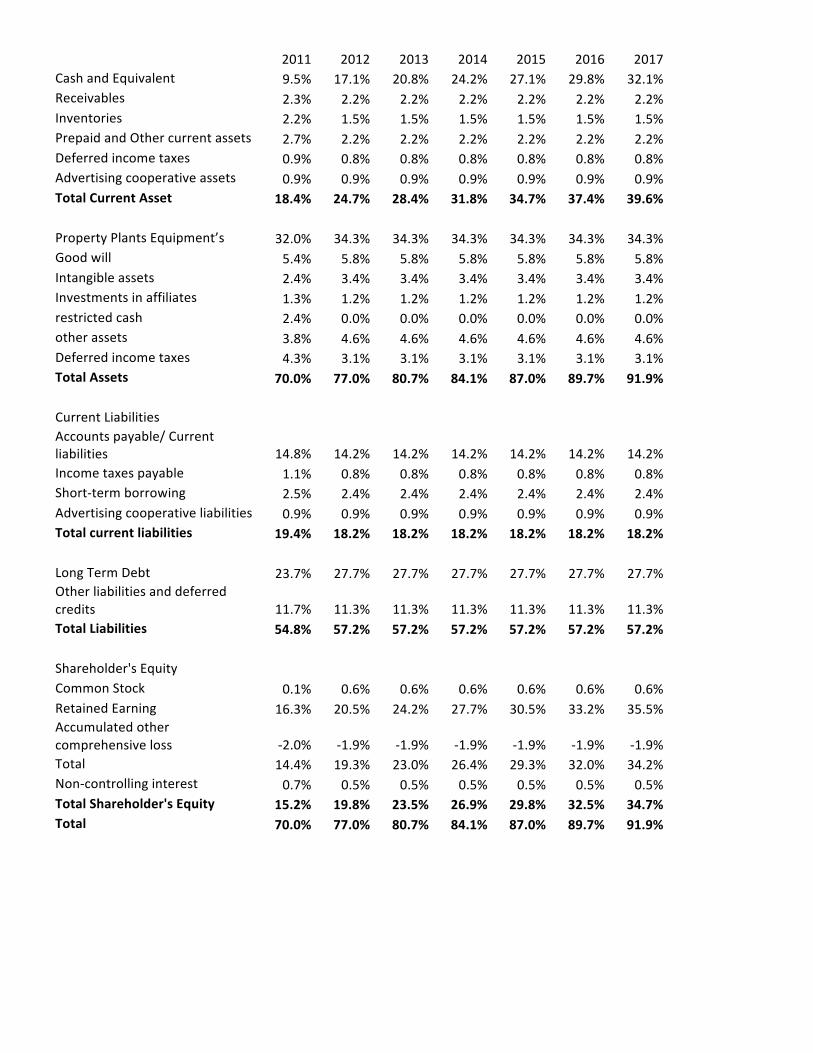
2011 2012 2013 2014 2015 2016 2017
Cash and Equivalent 9.5% 17.1% 20.8% 24.2% 27.1% 29.8% 32.1% Receivables 2.3% 2.2% 2.2% 2.2% 2.2% 2.2% 2.2% Inventories 2.2% 1.5% 1.5% 1.5% 1.5% 1.5% 1.5% Prepaid and Other current assets 2.7% 2.2% 2.2% 2.2% 2.2% 2.2% 2.2% Deferred income taxes 0.9% 0.8% 0.8% 0.8% 0.8% 0.8% 0.8% Advertising cooperative assets 0.9% 0.9% 0.9% 0.9% 0.9% 0.9% 0.9% Total Current Asset 18.4% 24.7% 28.4% 31.8% 34.7% 37.4% 39.6%
Property Plants Equipment’s 32.0% 34.3% 34.3% 34.3% 34.3% 34.3% 34.3% Good will 5.4% 5.8% 5.8% 5.8% 5.8% 5.8% 5.8% Intangible assets 2.4% 3.4% 3.4% 3.4% 3.4% 3.4% 3.4% Investments in affiliates 1.3% 1.2% 1.2% 1.2% 1.2% 1.2% 1.2% restricted cash 2.4% 0.0% 0.0% 0.0% 0.0% 0.0% 0.0% other assets 3.8% 4.6% 4.6% 4.6% 4.6% 4.6% 4.6% Deferred income taxes 4.3% 3.1% 3.1% 3.1% 3.1% 3.1% 3.1% Total Assets 70.0% 77.0% 80.7% 84.1% 87.0% 89.7% 91.9%
Current Liabilities Accounts payable/ Current
liabilities 14.8% 14.2% 14.2% 14.2% 14.2% 14.2% 14.2% Income taxes payable 1.1% 0.8% 0.8% 0.8% 0.8% 0.8% 0.8% Short-‐term borrowing 2.5% 2.4% 2.4% 2.4% 2.4% 2.4% 2.4% Advertising cooperative liabilities 0.9% 0.9% 0.9% 0.9% 0.9% 0.9% 0.9% Total current liabilities 19.4% 18.2% 18.2% 18.2% 18.2% 18.2% 18.2%
Long Term Debt 23.7% 27.7% 27.7% 27.7% 27.7% 27.7% 27.7% Other liabilities and deferred credits 11.7% 11.3% 11.3% 11.3% 11.3% 11.3% 11.3% Total Liabilities 54.8% 57.2% 57.2% 57.2% 57.2% 57.2% 57.2%
Shareholder's Equity Common Stock 0.1% 0.6% 0.6% 0.6% 0.6% 0.6% 0.6%
Retained Earning 16.3% 20.5% 24.2% 27.7% 30.5% 33.2% 35.5% Accumulated other comprehensive loss -‐2.0% -‐1.9% -‐1.9% -‐1.9% -‐1.9% -‐1.9% -‐1.9% Total 14.4% 19.3% 23.0% 26.4% 29.3% 32.0% 34.2% Non-‐controlling interest 0.7% 0.5% 0.5% 0.5% 0.5% 0.5% 0.5% Total Shareholder's Equity 15.2% 19.8% 23.5% 26.9% 29.8% 32.5% 34.7% Total 70.0% 77.0% 80.7% 84.1% 87.0% 89.7% 91.9%
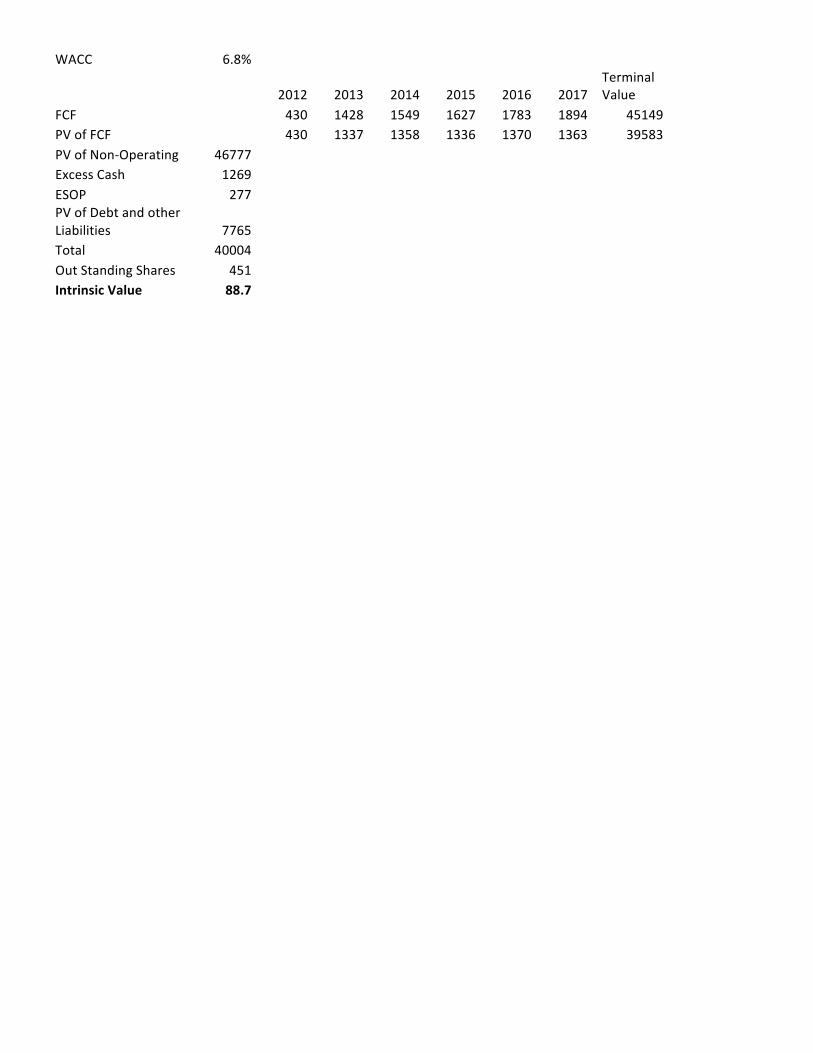
WACC 6.8%
2012 2013 2014 2015 2016 2017
Terminal Value
FCF
430 1428 1549 1627 1783 1894 45149 PV of FCF
430 1337 1358 1336 1370 1363 39583
PV of Non-‐Operating 46777 Excess Cash 1269 ESOP 277 PV of Debt and other
Liabilities 7765 Total 40004 Out Standing Shares 451 Intrinsic Value 88.7
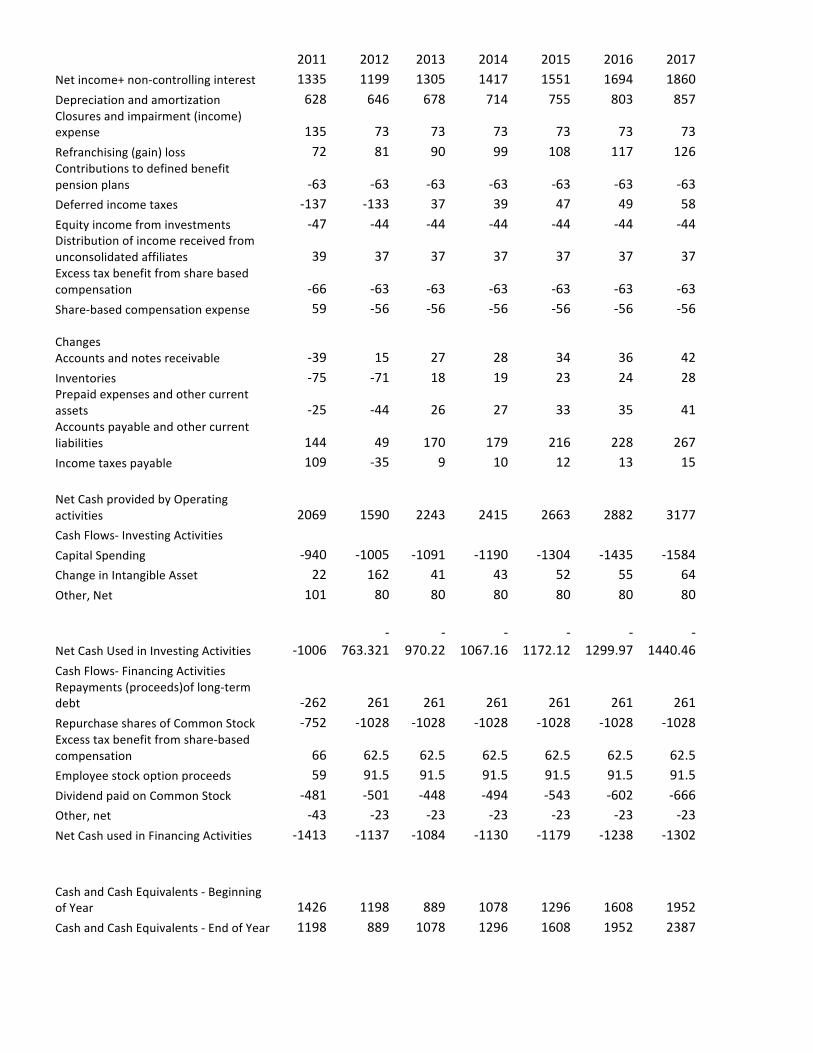
2011 2012 2013 2014 2015 2016 2017
Net income+ non-‐controlling interest 1335 1199 1305 1417 1551 1694 1860 Depreciation and amortization 628 646 678 714 755 803 857 Closures and impairment (income) expense 135 73 73 73 73 73 73 Refranchising (gain) loss 72 81 90 99 108 117 126 Contributions to defined benefit pension plans -‐63 -‐63 -‐63 -‐63 -‐63 -‐63 -‐63 Deferred income taxes -‐137 -‐133 37 39 47 49 58 Equity income from investments -‐47 -‐44 -‐44 -‐44 -‐44 -‐44 -‐44 Distribution of income received from unconsolidated affiliates 39 37 37 37 37 37 37 Excess tax benefit from share based compensation -‐66 -‐63 -‐63 -‐63 -‐63 -‐63 -‐63 Share-‐based compensation expense 59 -‐56 -‐56 -‐56 -‐56 -‐56 -‐56 Changes Accounts and notes receivable -‐39 15 27 28 34 36 42 Inventories -‐75 -‐71 18 19 23 24 28 Prepaid expenses and other current assets -‐25 -‐44 26 27 33 35 41 Accounts payable and other current liabilities 144 49 170 179 216 228 267 Income taxes payable 109 -‐35 9 10 12 13 15
Net Cash provided by Operating activities 2069 1590 2243 2415 2663 2882 3177 Cash Flows-‐ Investing Activities
Capital Spending -‐940 -‐1005 -‐1091 -‐1190 -‐1304 -‐1435 -‐1584 Change in Intangible Asset 22 162 41 43 52 55 64 Other, Net 101 80 80 80 80 80 80
Net Cash Used in Investing Activities -‐1006
-‐763.321
-‐970.22
-‐1067.16
-‐1172.12
-‐1299.97
-‐1440.46
Cash Flows-‐ Financing Activities Repayments (proceeds)of long-‐term
debt -‐262 261 261 261 261 261 261 Repurchase shares of Common Stock -‐752 -‐1028 -‐1028 -‐1028 -‐1028 -‐1028 -‐1028 Excess tax benefit from share-‐based compensation 66 62.5 62.5 62.5 62.5 62.5 62.5 Employee stock option proceeds 59 91.5 91.5 91.5 91.5 91.5 91.5 Dividend paid on Common Stock -‐481 -‐501 -‐448 -‐494 -‐543 -‐602 -‐666 Other, net -‐43 -‐23 -‐23 -‐23 -‐23 -‐23 -‐23 Net Cash used in Financing Activities -‐1413 -‐1137 -‐1084 -‐1130 -‐1179 -‐1238 -‐1302
Cash and Cash Equivalents -‐ Beginning of Year 1426 1198 889 1078 1296 1608 1952 Cash and Cash Equivalents -‐ End of Year 1198 889 1078 1296 1608 1952 2387
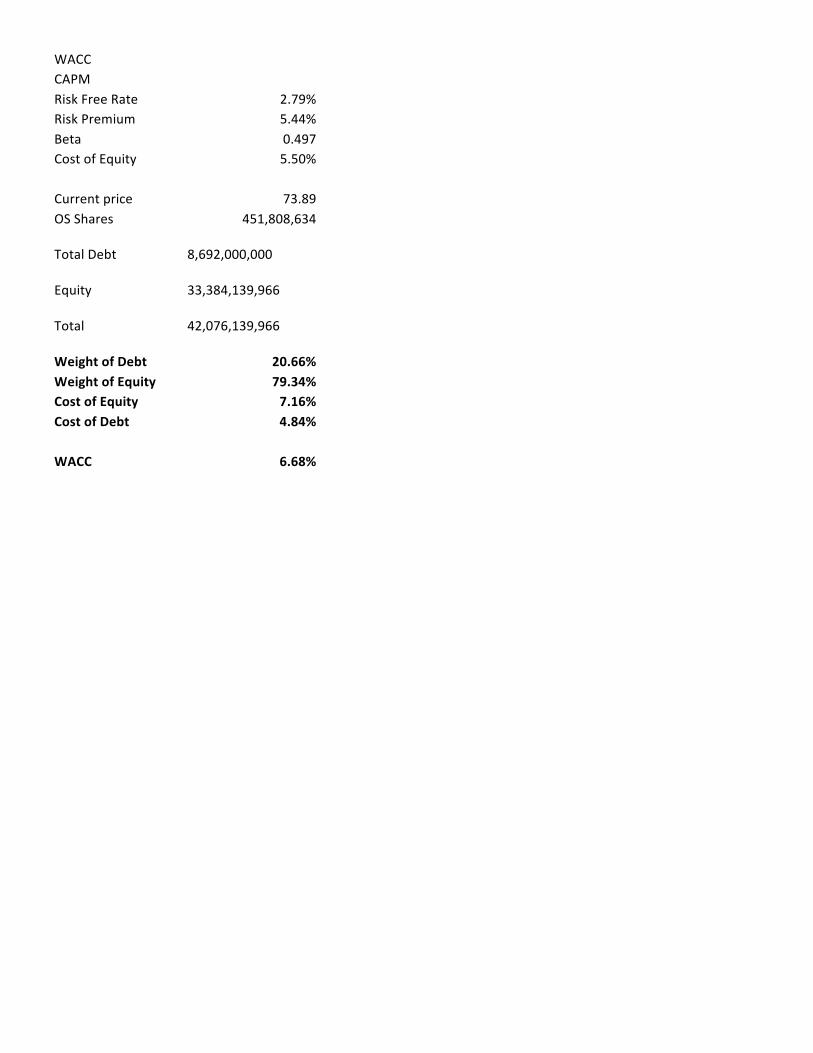
WACC CAPM Risk Free Rate 2.79%
Risk Premium 5.44% Beta 0.497 Cost of Equity 5.50%
Current price 73.89 OS Shares 451,808,634
Total Debt 8,692,000,000
Equity 33,384,139,966
Total 42,076,139,966
Weight of Debt 20.66% Weight of Equity 79.34% Cost of Equity 7.16% Cost of Debt 4.84%
WACC 6.68%