Embed Size (px)
Citation preview
Waste Management (NASDAQ: WM)
Justin Dent
Sin Tung Chan (Sindy)
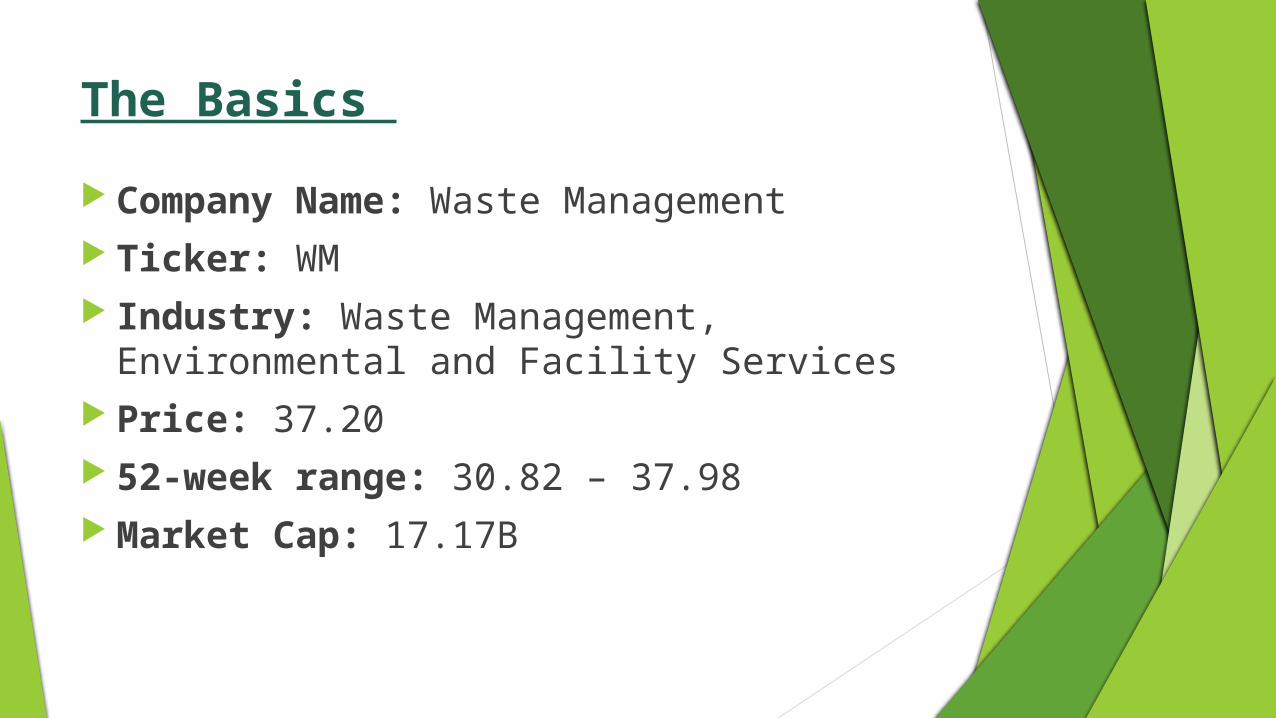
The Basics
Company Name: Waste Management Ticker: WM Industry: Waste Management, Environmental and
Facility Services Price: 37.20 52-week range: 30.82 – 37.98 Market Cap: 17.17B
Presentation Outline
Part I: The Economy & Industry
Part II: The Case of WM
Part III: The Numbers
Part IV: Recommendations

Part IThe Economy & Industry
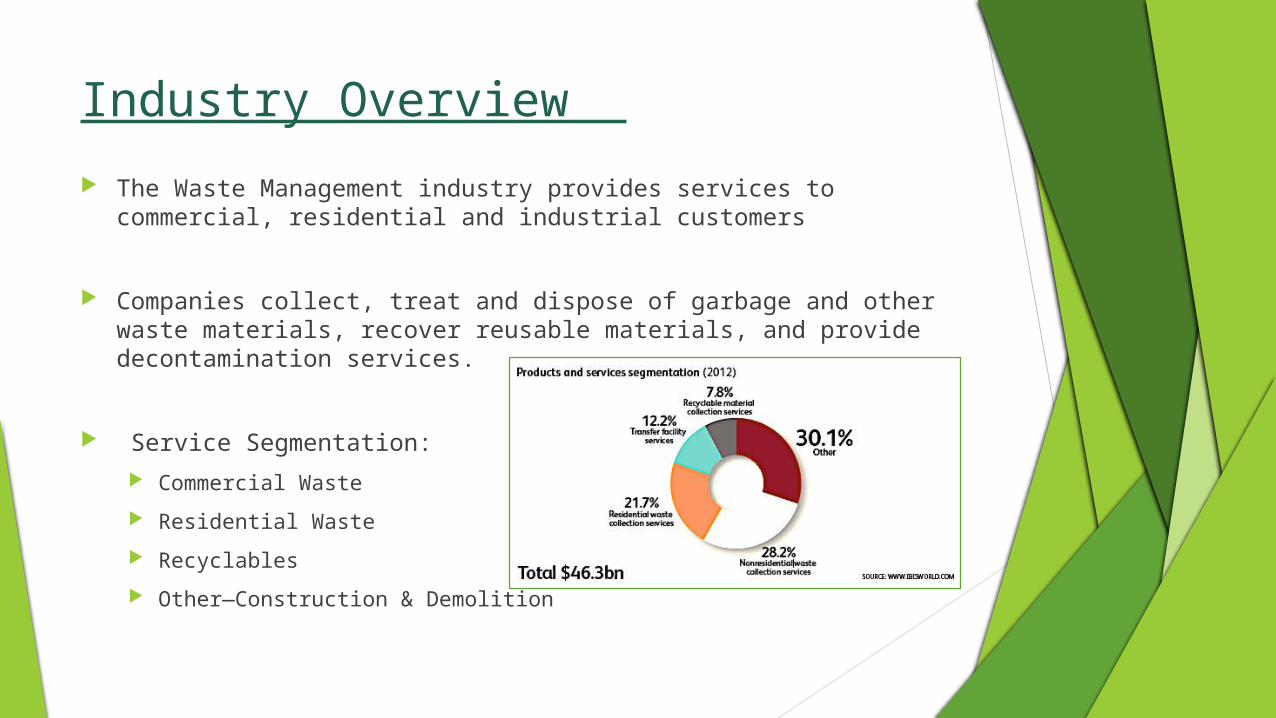
Industry Overview
The Waste Management industry provides services to commercial, residential and industrial customers
Companies collect, treat and dispose of garbage and other waste materials, recover reusable materials, and provide decontamination services.
Service Segmentation:
Commercial Waste
Residential Waste
Recyclables
Other—Construction & Demolition
Industry Overview (cont.)
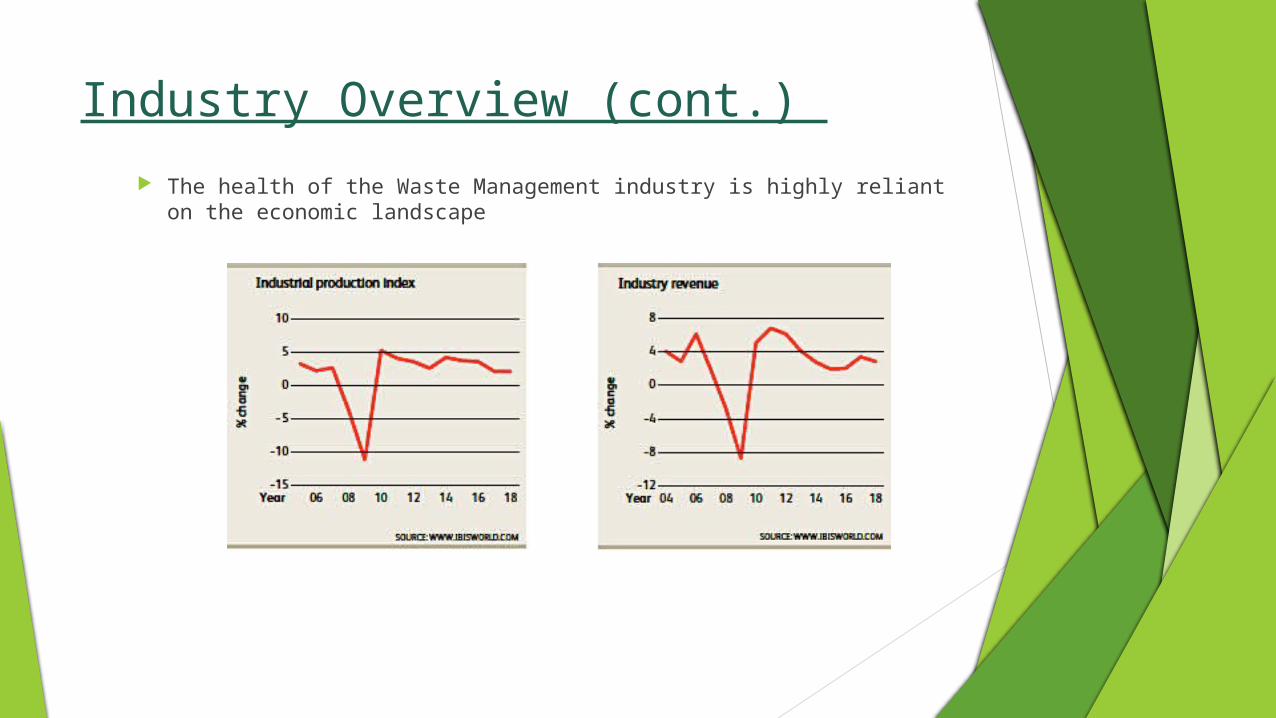
The health of the Waste Management industry is highly reliant on the economic landscape
Industry Trends
Firms are moving towards consolidation and vertical integration due to the increasingly capital-intensive nature of the industry.
A push towards recycling will likely increase the profitability of the collection of recycled goods and municipal contracts
Increased fuel prices and regulation has resulted in decreased profits of an average -0.2% per year.
Fuel and environmental levies (increased costs for consumers) have helped to mitigate these effects
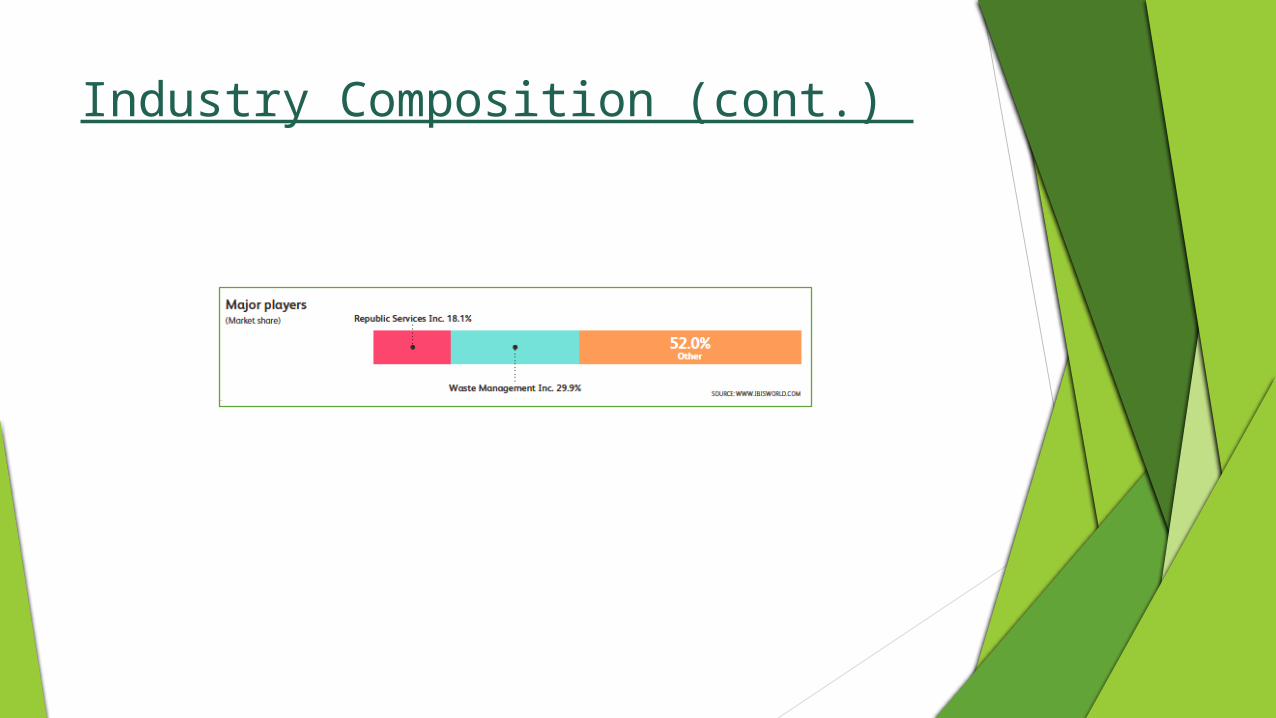
Industry Composition The Waste Management Industry is characterized by a decentralized
number of enterprises but centralized revenues.
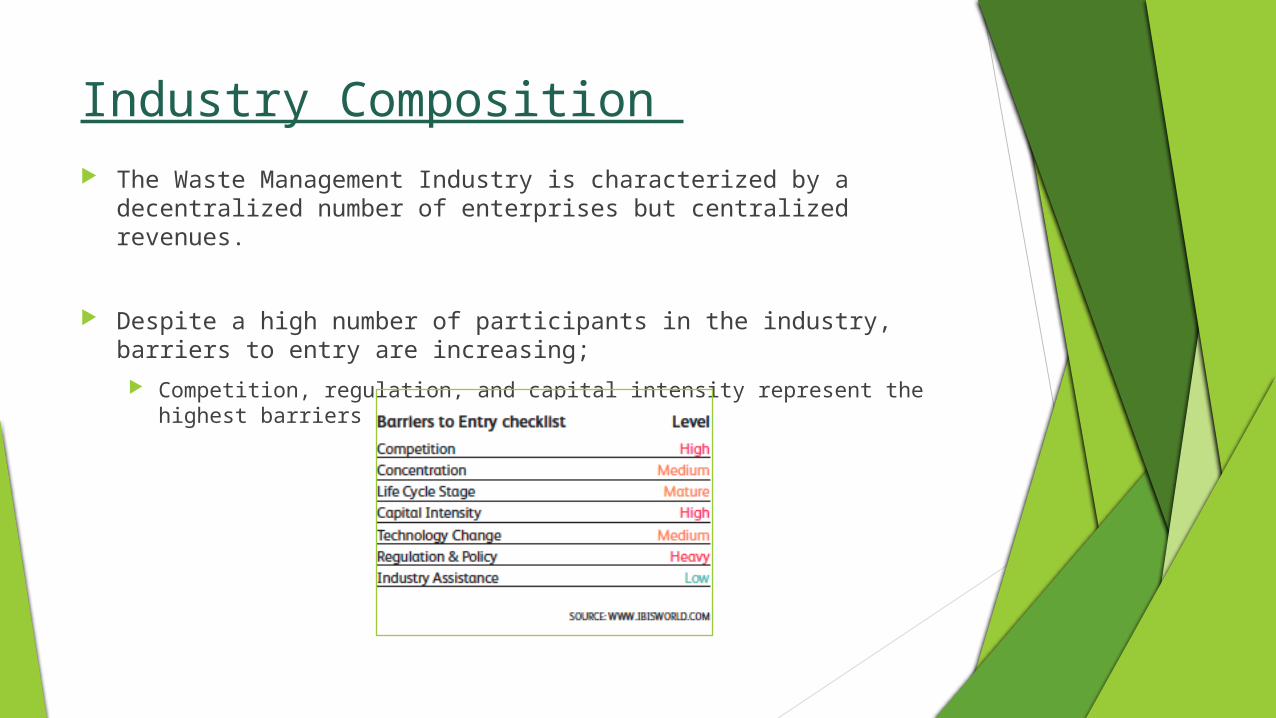
Despite a high number of participants in the industry, barriers to entry are increasing;
Competition, regulation, and capital intensity represent the highest barriers
Industry Composition (cont.)
Key Determinants of Growth
Population
Industrial Production
Consumption
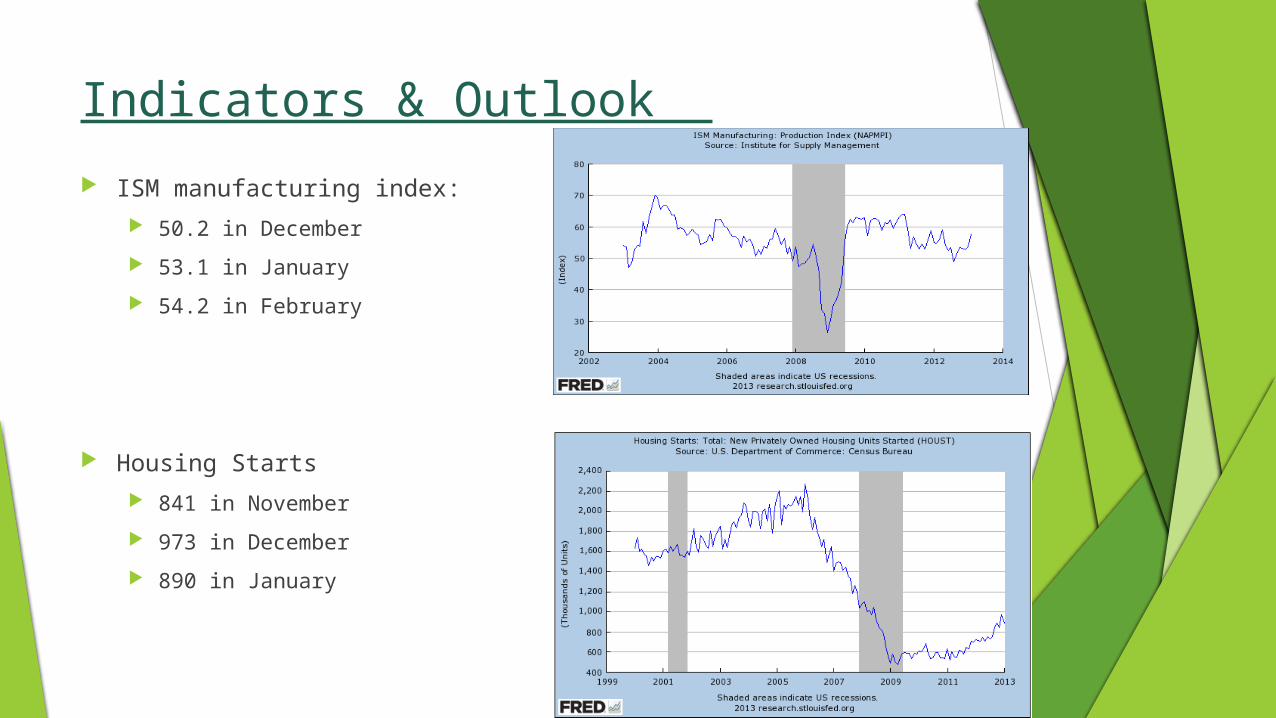
Indicators & Outlook
ISM manufacturing index:
50.2 in December
53.1 in January
54.2 in February
Housing Starts
841 in November
973 in December
890 in January
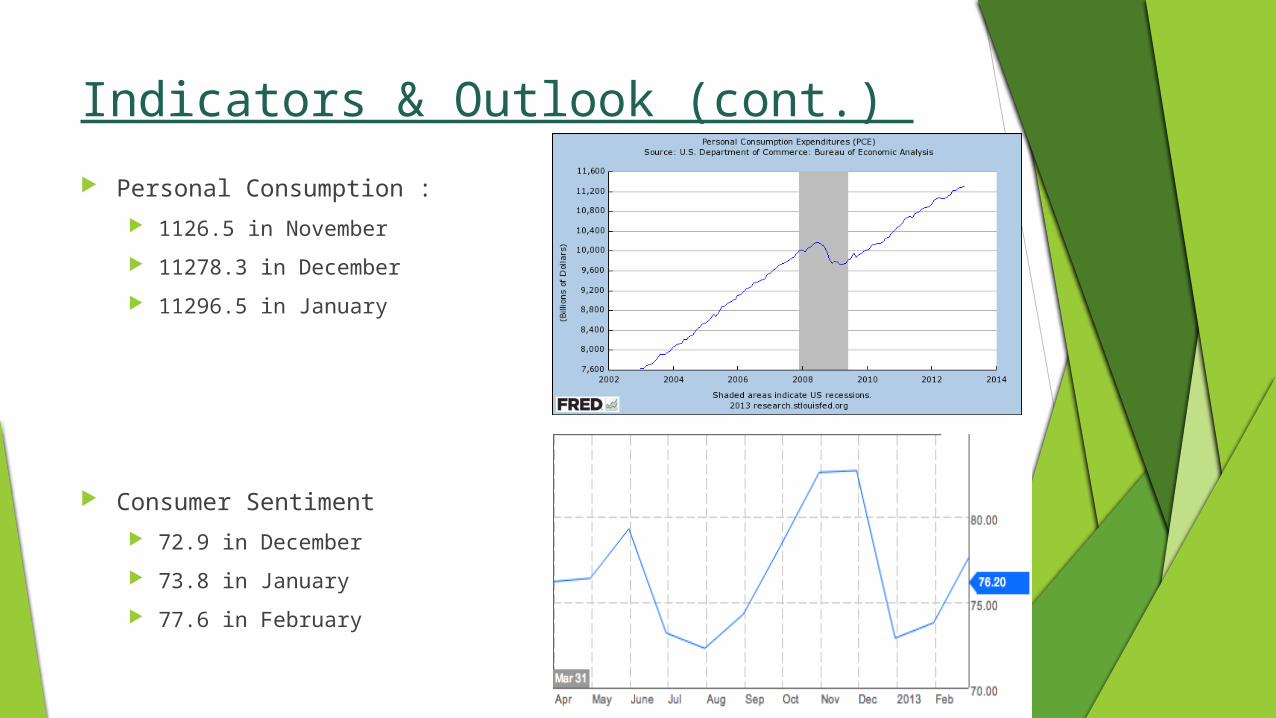
Indicators & Outlook (cont.)
Personal Consumption :
1126.5 in November
11278.3 in December
11296.5 in January
Consumer Sentiment
72.9 in December
73.8 in January
77.6 in February
Part IIThe Case of WM
Brief Overview
Founded and incorporated in Oklahoma in 1987 as USA Waste Services, Inc. Waste Management, Inc.(WM) was reincorporated in Delaware in 1995
Today, WM provides integrated waste management services in North America.
Landfill sites: 269
Transfer stations: 297
WM develops, operates and owns waste-to-energy and gas-to energy facilities in the United States
Waste Combustion Plants: 22
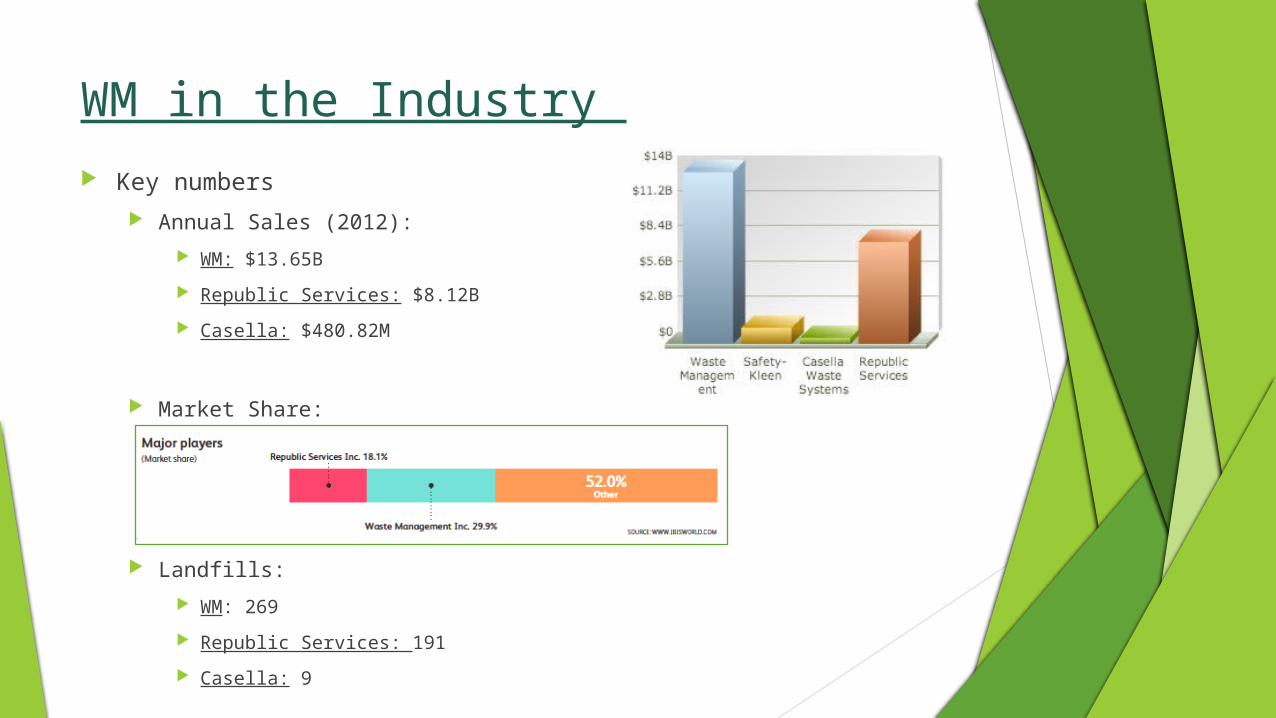
WM in the Industry Key numbers
Annual Sales (2012):
WM: $13.65B
Republic Services: $8.12B
Casella: $480.82M
Market Share:
Landfills:
WM: 269
Republic Services: 191
Casella: 9
WM in the Industry (cont.)
High levels of acquisition activity
Second largest waste-to-energy business
International motivations
Technological innovation
Competitive Advantage
Economies of Scale
Owns and operate the largest network of landfills in the industry
Technology
Increasing Barriers to Entry
Inelastic Demand
Foreign investments
Risky Business
Commodity headwinds
Competitive acquisitions/mergers
Regulations
Growth Opportunities
Diverse portfolio
Capital Investments
Acquisitions
Convert fleet to use alternative fuel sources
Expand and grow the Waste-to-Energy sector

Part III The Numbers
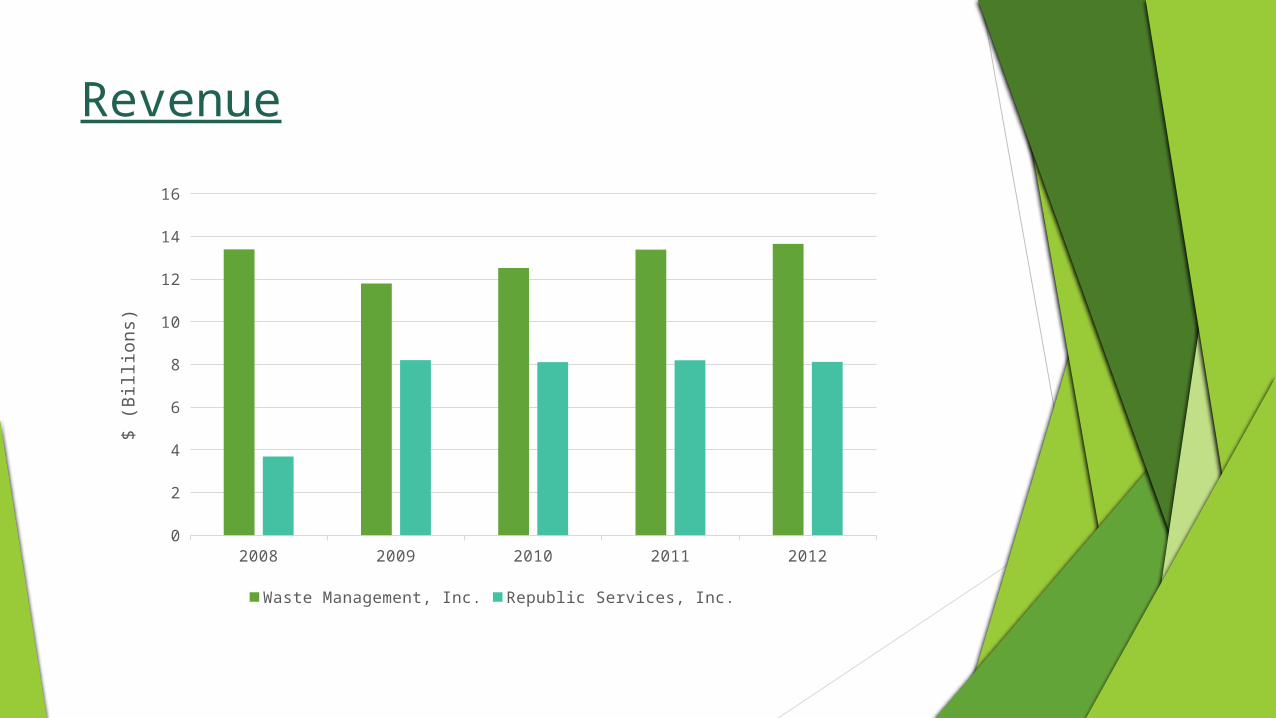
Revenue
2008 2009 2010 2011 20120
2
4
6
8
10
12
14
16
Waste Management, Inc. Republic Services, Inc.
$ (B
illio
ns)
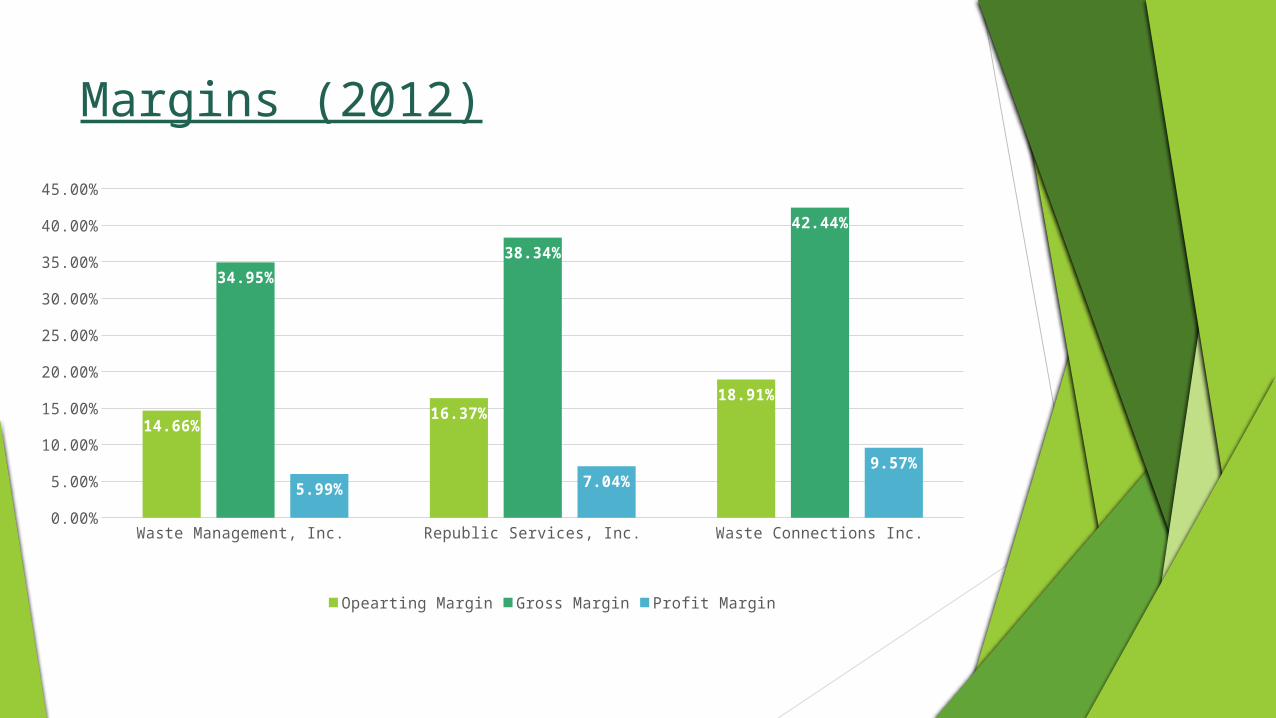
Margins (2012)
Waste Management, Inc. Republic Services, Inc. Waste Connections Inc.0.00%
5.00%
10.00%
15.00%
20.00%
25.00%
30.00%
35.00%
40.00%
45.00%
14.66%16.37%
18.91%
34.95%
38.34%
42.44%
5.99% 7.04%9.57%
Opearting Margin Gross Margin Profit Margin
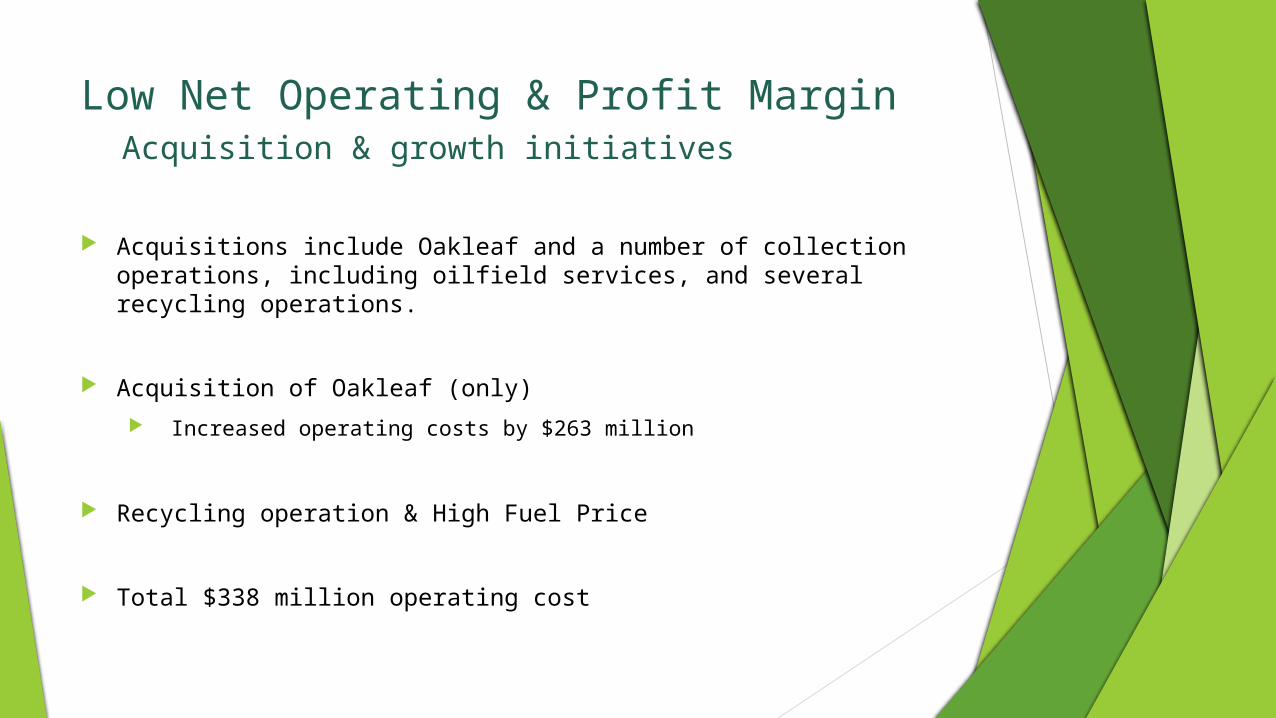
Low Net Operating & Profit MarginAcquisition & growth initiatives
Acquisitions include Oakleaf and a number of collection operations, including oilfield services, and several recycling operations.
Acquisition of Oakleaf (only) Increased operating costs by $263 million
Recycling operation & High Fuel Price
Total $338 million operating cost
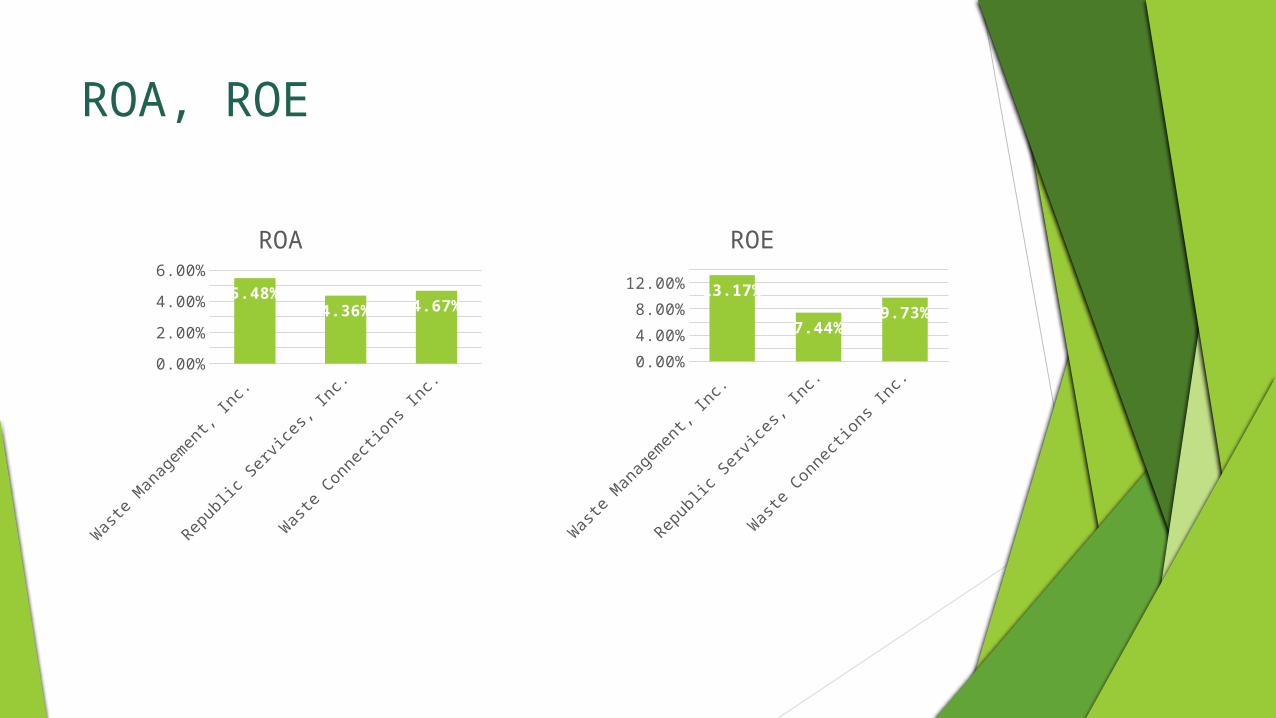
ROA, ROE
Waste
Management, I
nc.
Republic Se
rvice
s, Inc.
Waste
Connections I
nc.0.00%
1.00%
2.00%
3.00%
4.00%
5.00%
6.00%
5.48%
4.36% 4.67%
ROA
Waste
Management, I
nc.
Republic Se
rvice
s, Inc.
Waste
Connections I
nc.0.00%2.00%4.00%6.00%8.00%
10.00%12.00%14.00%
13.17%
7.44%9.73%
ROE
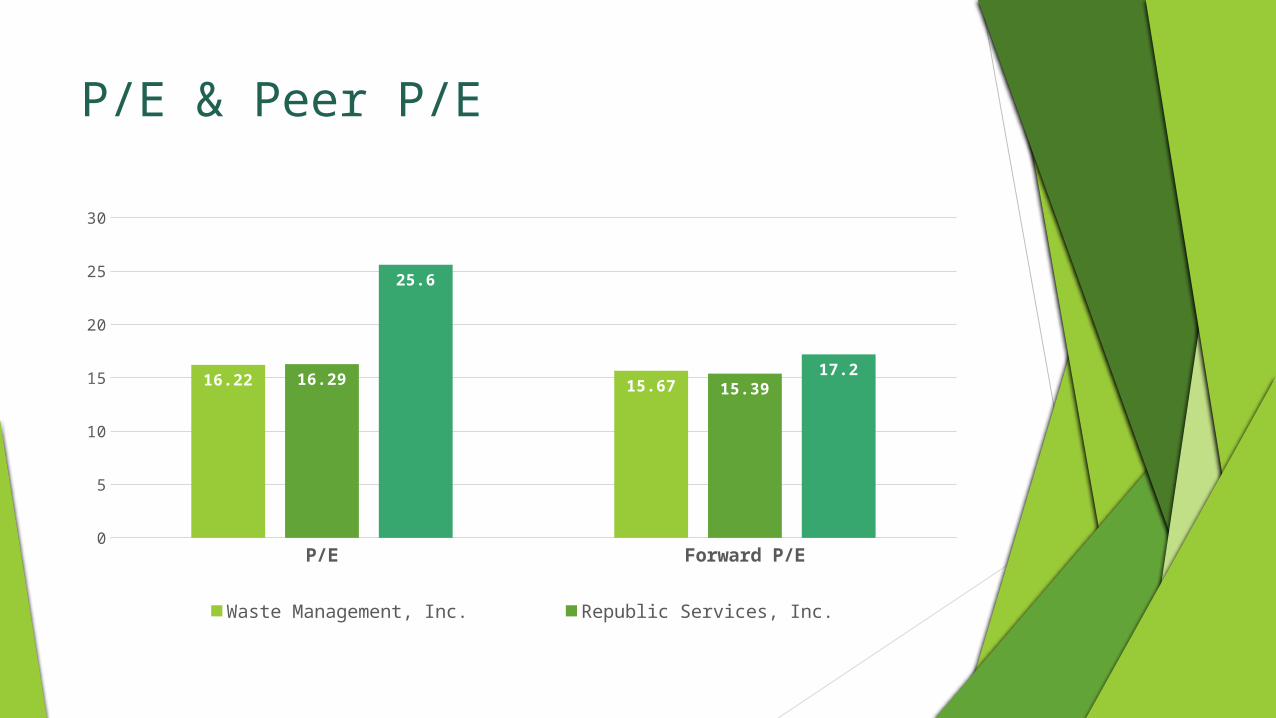
P/E & Peer P/E
P/E Forward P/E0
5
10
15
20
25
30
16.22 15.6716.29 15.39
25.6
17.2
Waste Management, Inc. Republic Services, Inc. Waste Connections Inc.
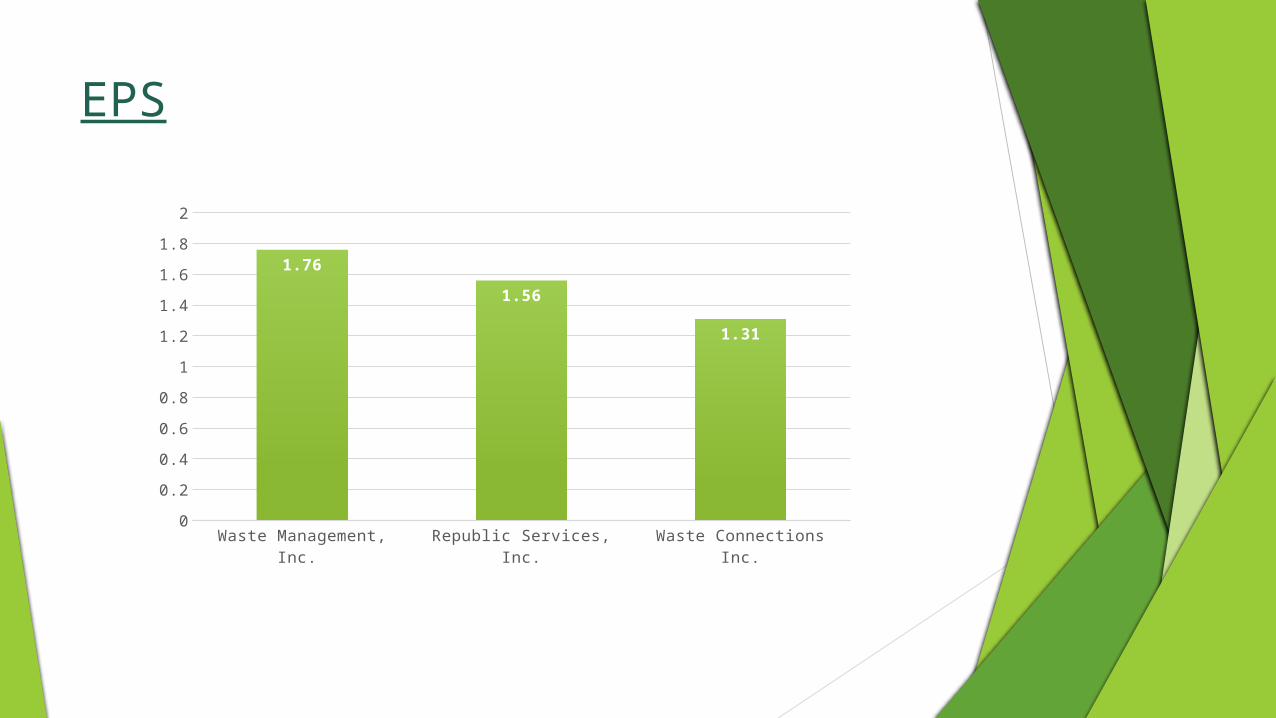
EPS
Waste Management, Inc. Republic Services, Inc. Waste Connections Inc.0
0.2
0.4
0.6
0.8
1
1.2
1.4
1.6
1.8
2
1.76
1.56
1.31
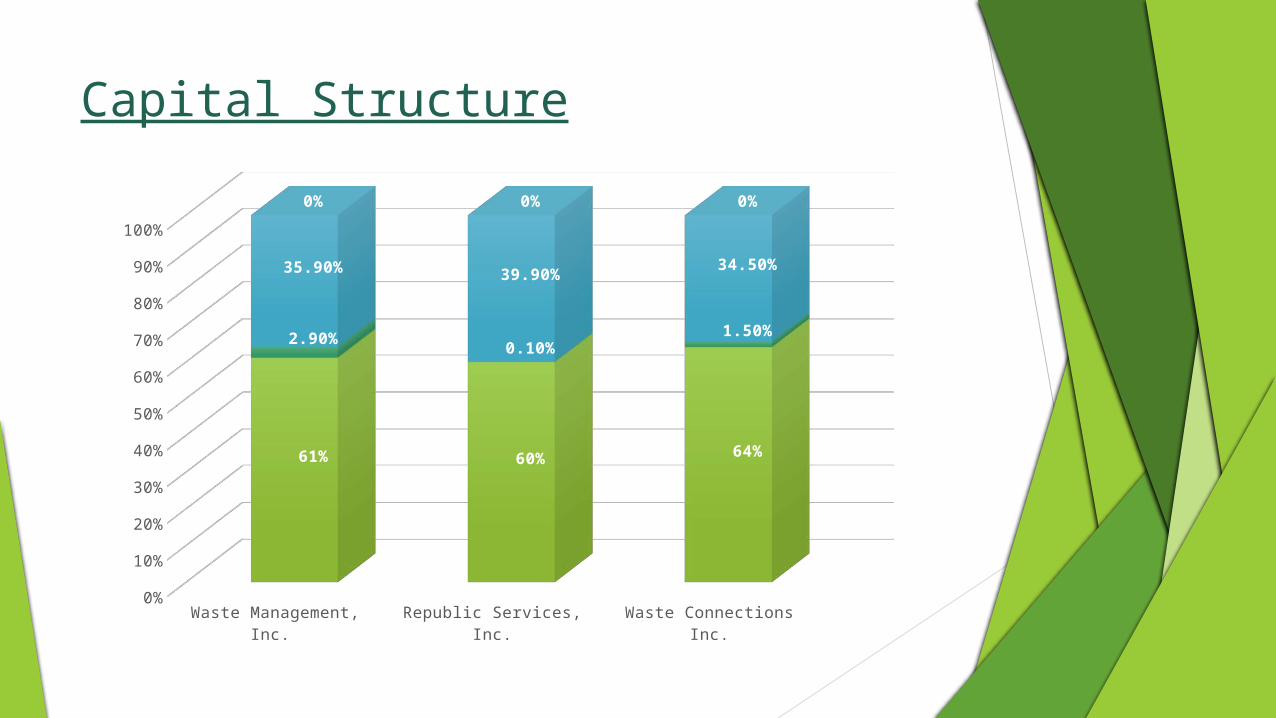
Capital Structure
Waste Management, Inc. Republic Services, Inc. Waste Connections Inc.
Market Cap 61% 60% 64%
ST Debt 2.90% 0.10% 1.50%
LT Debt 35.90% 39.90% 34.50%
Pref. Equity 0% 0% 0%
5%
15%
25%
35%
45%
55%
65%
75%
85%
95%
61% 60% 64%
2.90% 0.10%1.50%
35.90% 39.90% 34.50%
0% 0% 0%
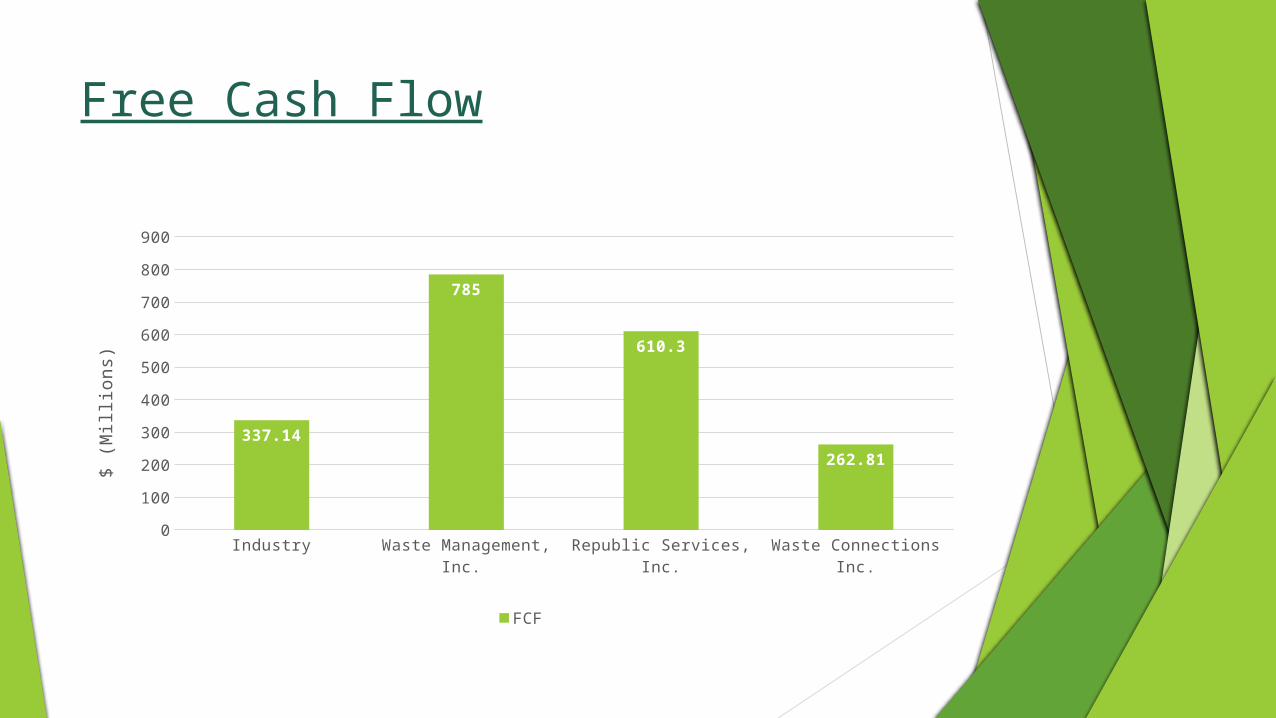
Free Cash Flow
Industry Waste Management, Inc. Republic Services, Inc. Waste Connections Inc.0
100
200
300
400
500
600
700
800
900
337.14
785
610.3
262.81
FCF
$ (M
illio
ns)
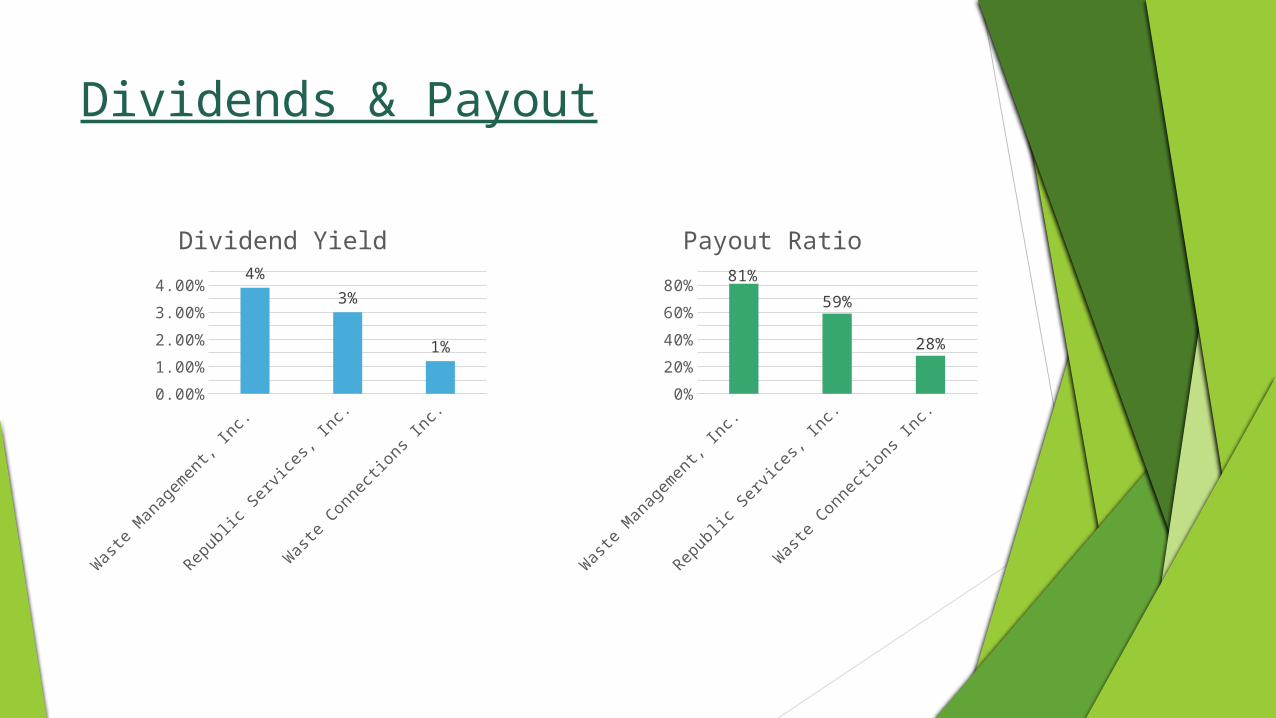
Dividends & Payout
Waste
Management, I
nc.
Republic Se
rvice
s, Inc.
Waste
Connections I
nc.0.00%0.50%1.00%1.50%2.00%2.50%3.00%3.50%4.00%4.50%
4%
3%
1%
Dividend Yield
Waste
Management, I
nc.
Republic Se
rvice
s, Inc.
Waste
Connections I
nc.0%
10%20%30%40%50%60%70%80%90%
81%
59%
28%
Payout Ratio
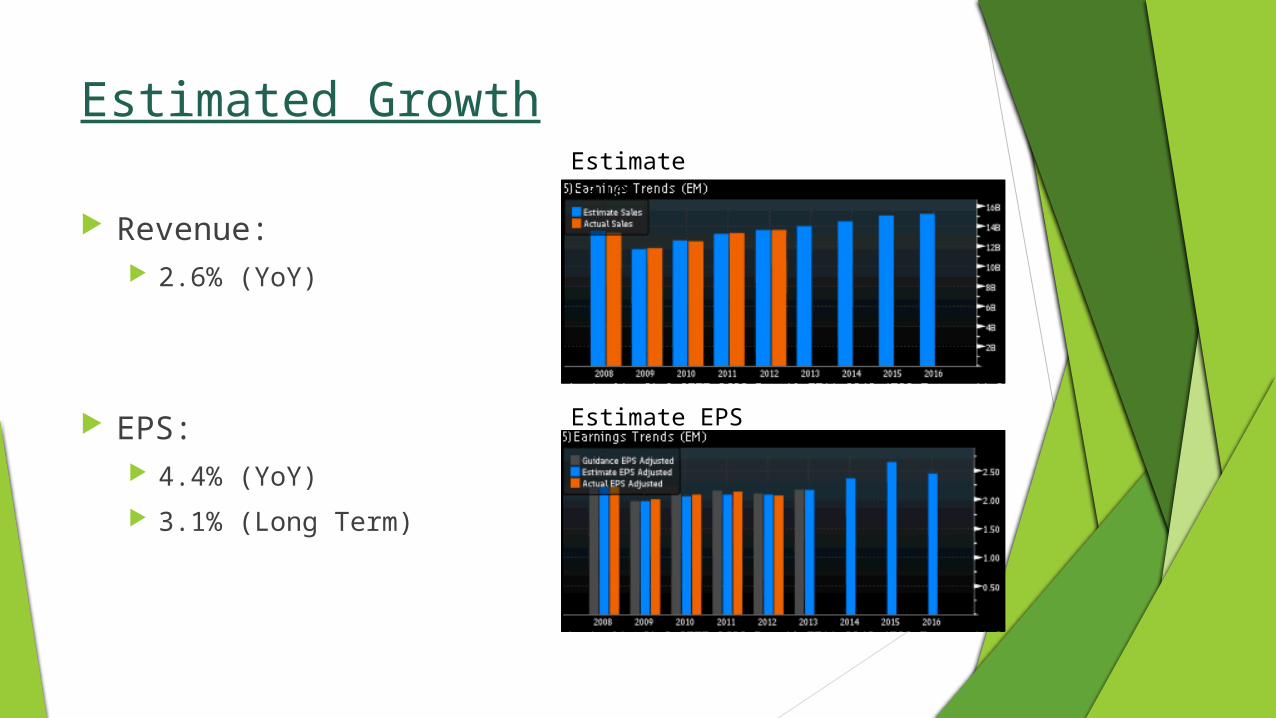
Estimated Growth
Revenue: 2.6% (YoY)
EPS: 4.4% (YoY) 3.1% (Long Term)
Estimate Sale
Estimate EPS

Part III The Recommendation
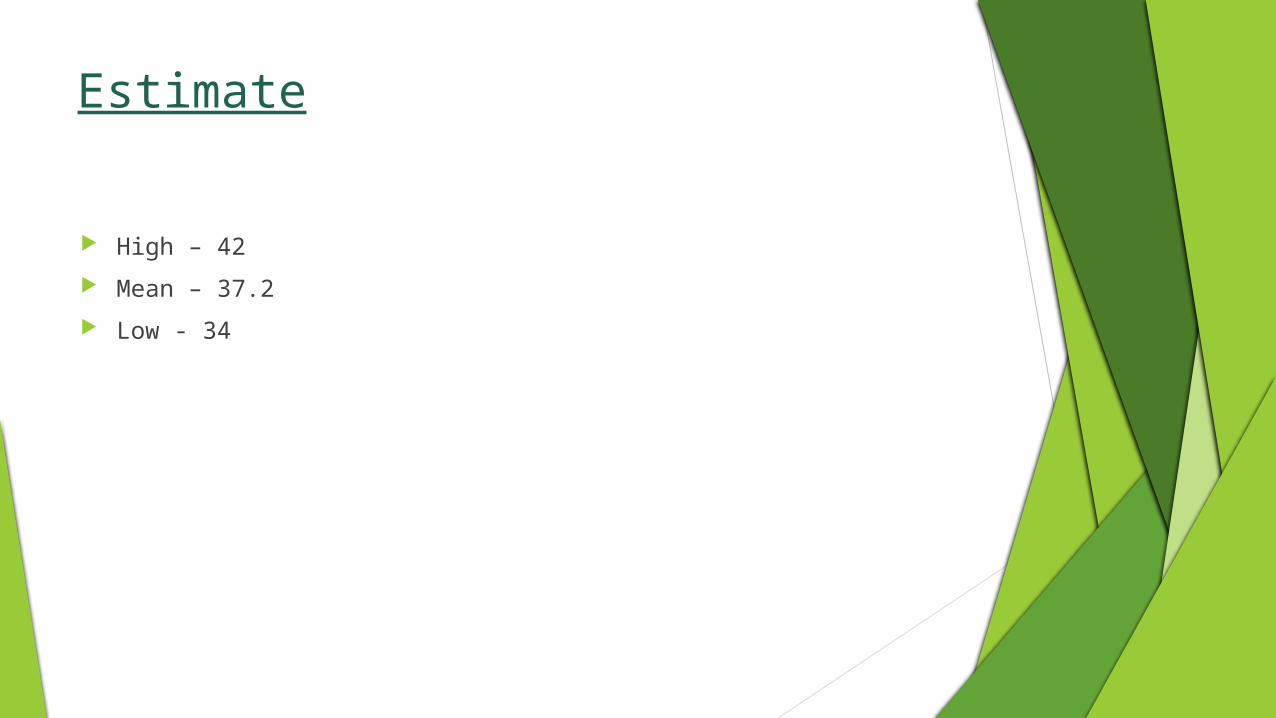
Estimate
High – 42
Mean – 37.2
Low - 34