Embed Size (px)
Citation preview
Storm Surge Modeling and Forecasting
Storm Surge Modeling and Forecasting
LTJG Jeffrey Pereira, NOAAStorm Surge Unit
National Hurricane CenterNOAA Storm Surge Workshop
May 2011
LTJG Jeffrey Pereira, NOAAStorm Surge Unit
National Hurricane CenterNOAA Storm Surge Workshop
May 2011
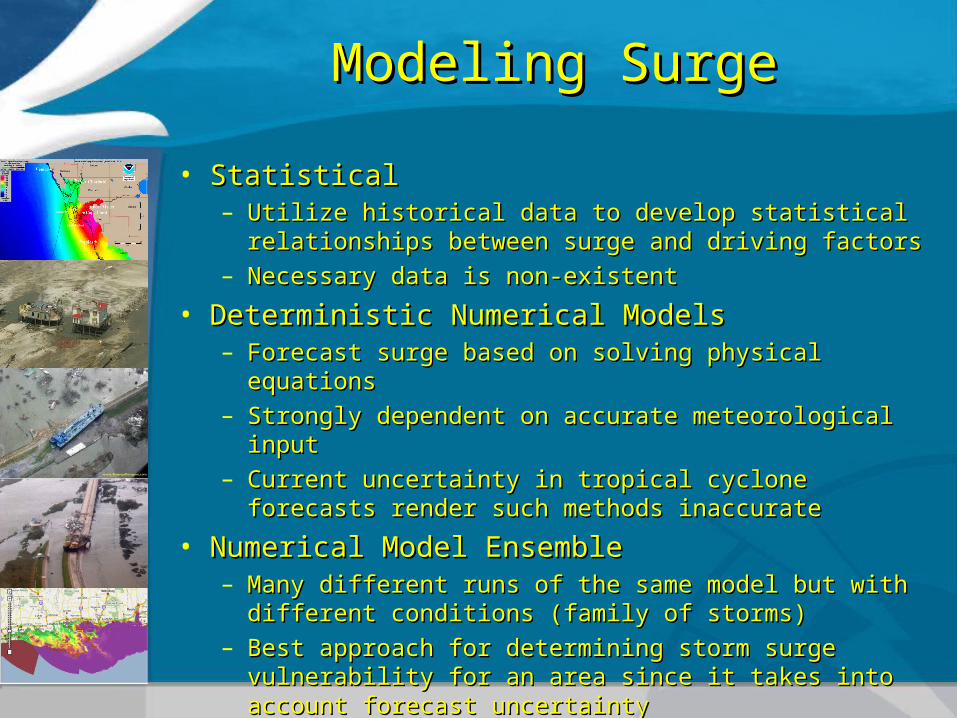
• Statistical Statistical – Utilize historical data to develop statistical relationships Utilize historical data to develop statistical relationships
between surge and driving factorsbetween surge and driving factors– Necessary data is non-existentNecessary data is non-existent
• Deterministic Numerical Models Deterministic Numerical Models – Forecast surge based on solving physical equations Forecast surge based on solving physical equations – Strongly dependent on accurate meteorological inputStrongly dependent on accurate meteorological input– Current uncertainty in tropical cyclone forecasts render such Current uncertainty in tropical cyclone forecasts render such
methods inaccuratemethods inaccurate• Numerical Model Ensemble Numerical Model Ensemble
– Many different runs of the same model but with different Many different runs of the same model but with different conditions (family of storms) conditions (family of storms)
– Best approach for determining storm surge vulnerability for an Best approach for determining storm surge vulnerability for an area since it takes into account forecast uncertaintyarea since it takes into account forecast uncertainty
Modeling SurgeModeling Surge
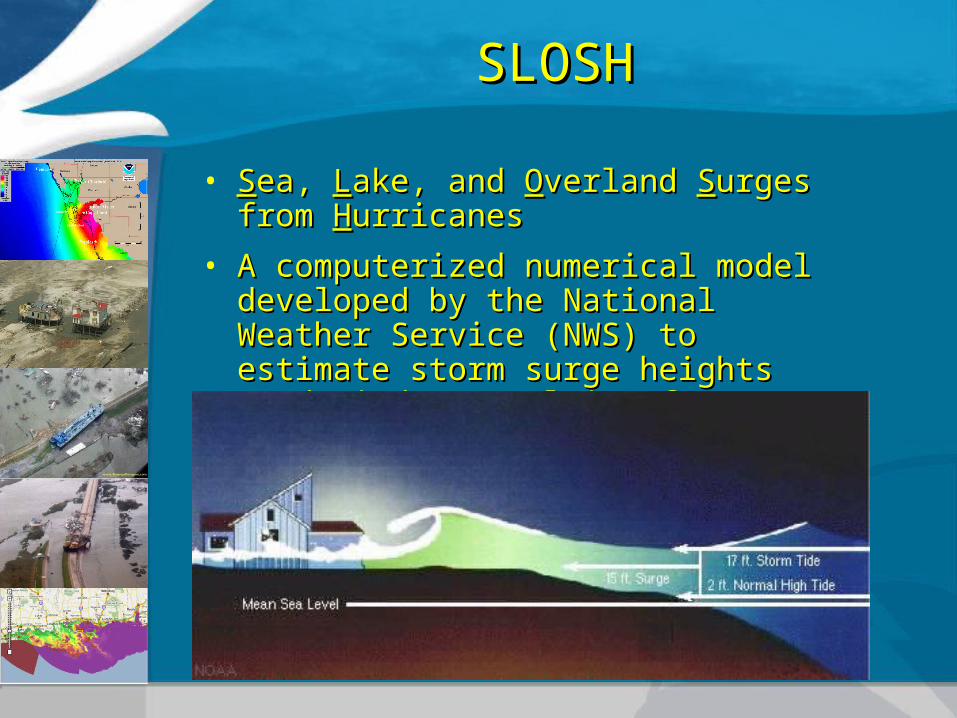
• SSea, ea, LLake, and ake, and OOverland verland SSurges from urges from HHurricanesurricanes• A computerized numerical model developed by A computerized numerical model developed by
the National Weather Service (NWS) to estimate the National Weather Service (NWS) to estimate storm surge heights (and winds) resulting from storm surge heights (and winds) resulting from historical, hypothetical, or predicted hurricaneshistorical, hypothetical, or predicted hurricanes
SLOSHSLOSH
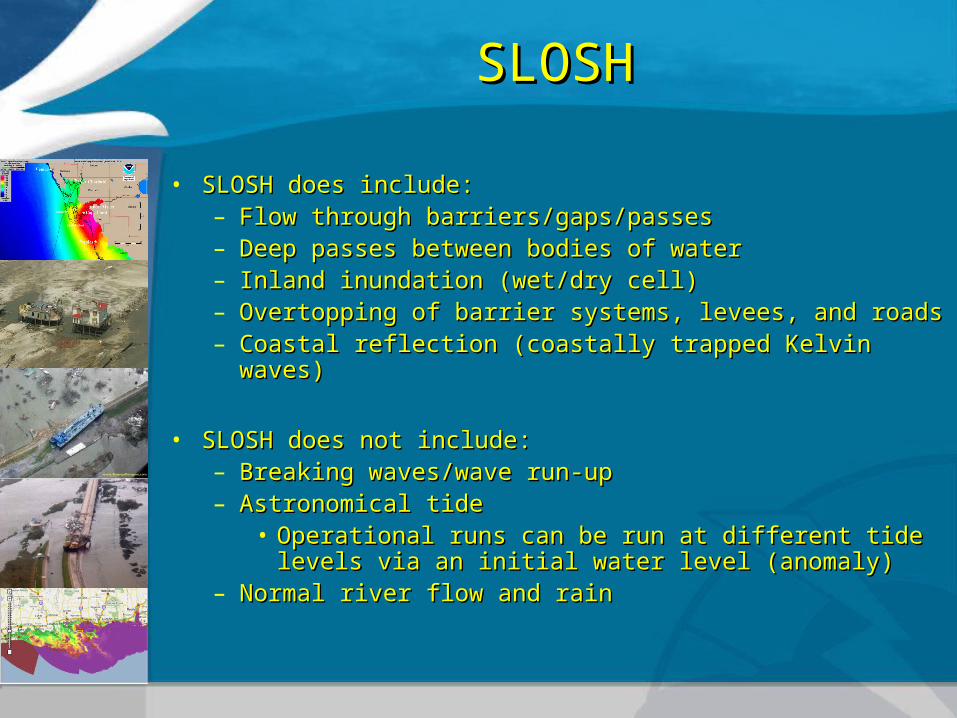
• SLOSH does include:SLOSH does include:– Flow through barriers/gaps/passesFlow through barriers/gaps/passes– Deep passes between bodies of waterDeep passes between bodies of water– Inland inundation (wet/dry cell)Inland inundation (wet/dry cell)– Overtopping of barrier systems, levees, and roadsOvertopping of barrier systems, levees, and roads– Coastal reflection (coastally trapped Kelvin waves)Coastal reflection (coastally trapped Kelvin waves)
• SLOSH does not include:SLOSH does not include:– Breaking waves/wave run-upBreaking waves/wave run-up– Astronomical tideAstronomical tide
• Operational runs can be run at different tide levels via an Operational runs can be run at different tide levels via an initial water level (anomaly)initial water level (anomaly)
– Normal river flow and rainNormal river flow and rain
SLOSHSLOSH
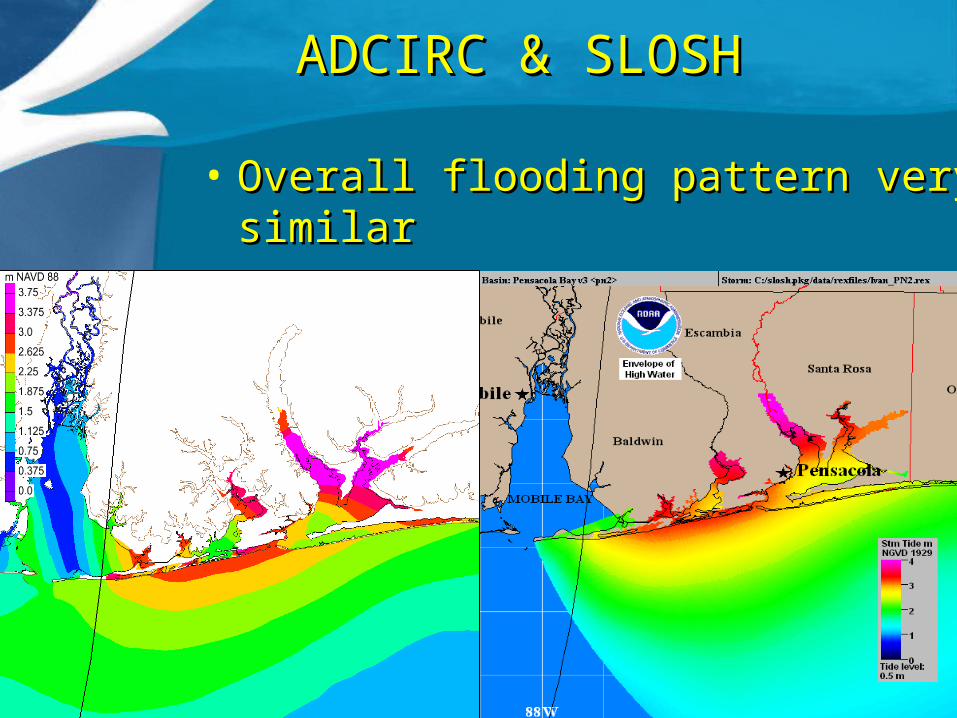
• Overall flooding pattern very similarOverall flooding pattern very similar
ADCIRC & SLOSHADCIRC & SLOSH
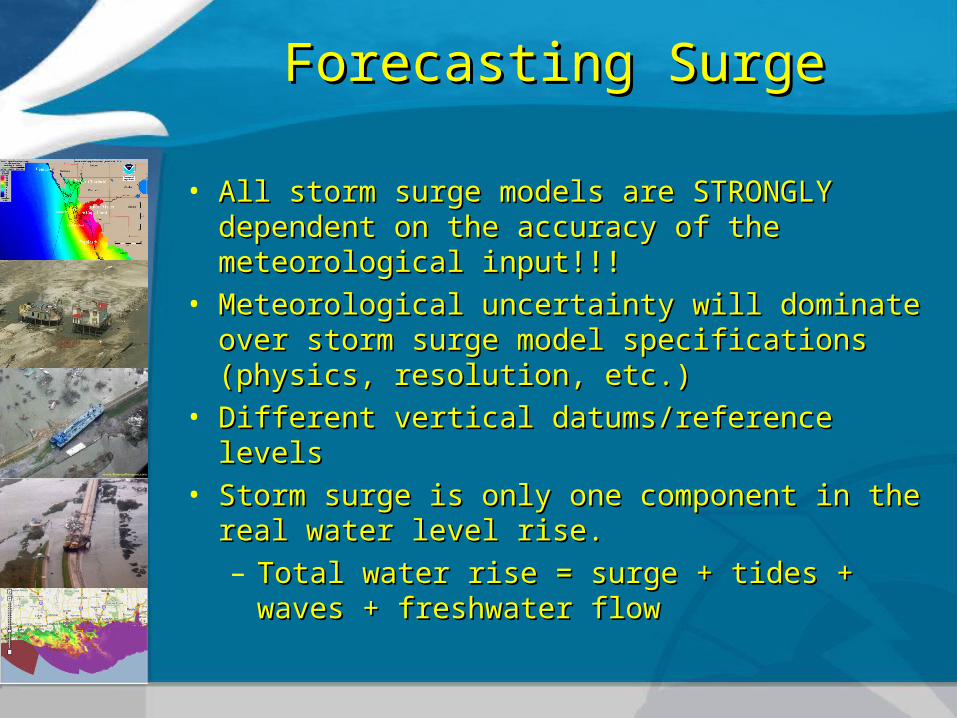
• All storm surge models are STRONGLY dependent on All storm surge models are STRONGLY dependent on the accuracy of the meteorological input!!!the accuracy of the meteorological input!!!
• Meteorological uncertainty will dominate over storm Meteorological uncertainty will dominate over storm surge model specifications (physics, resolution, etc.)surge model specifications (physics, resolution, etc.)
• Different vertical datums/reference levelsDifferent vertical datums/reference levels• Storm surge is only one component in the real water Storm surge is only one component in the real water
level rise. level rise. – Total water rise = surge + tides + waves + Total water rise = surge + tides + waves +
freshwater flowfreshwater flow
Forecasting SurgeForecasting Surge
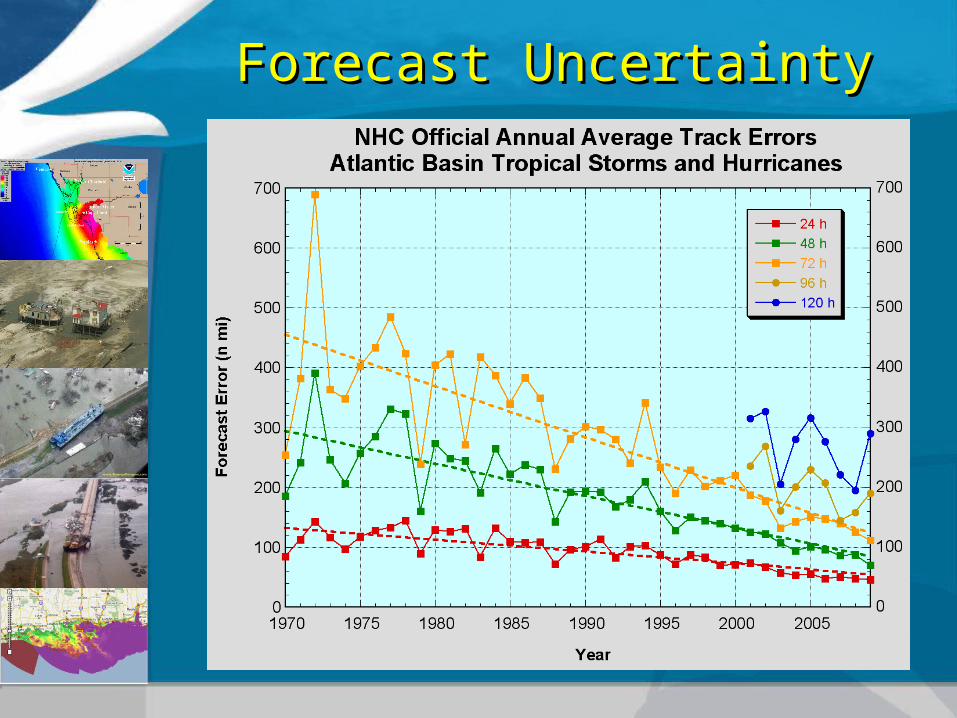
Forecast UncertaintyForecast Uncertainty
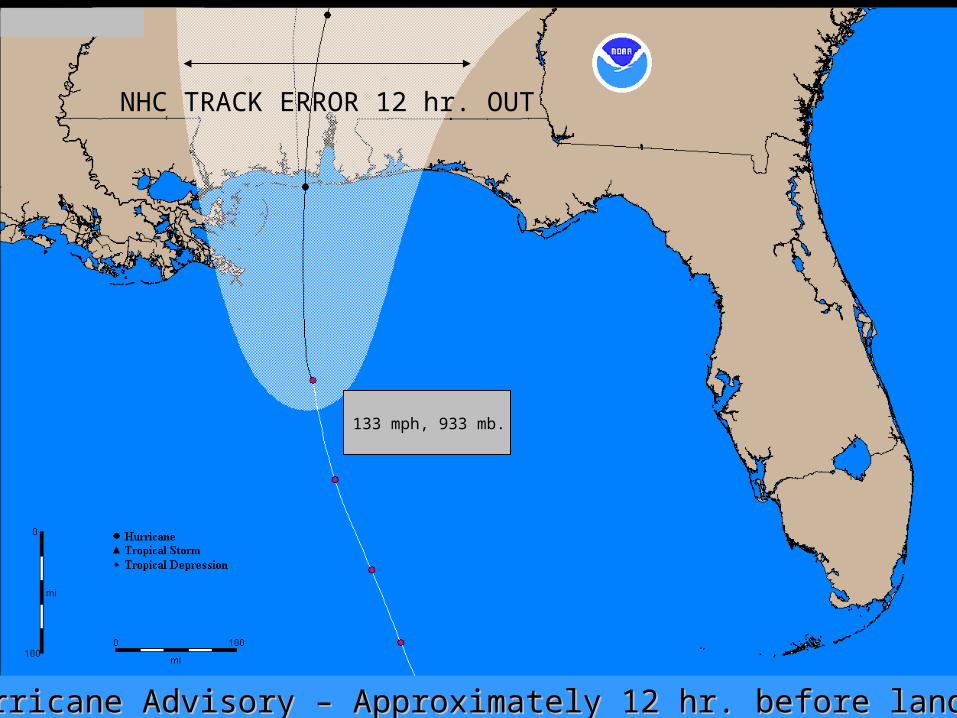
Hurricane Advisory – Approximately 12 hr. before landfallHurricane Advisory – Approximately 12 hr. before landfall
NHC TRACK ERROR 12 hr. OUT
133 mph, 933 mb.
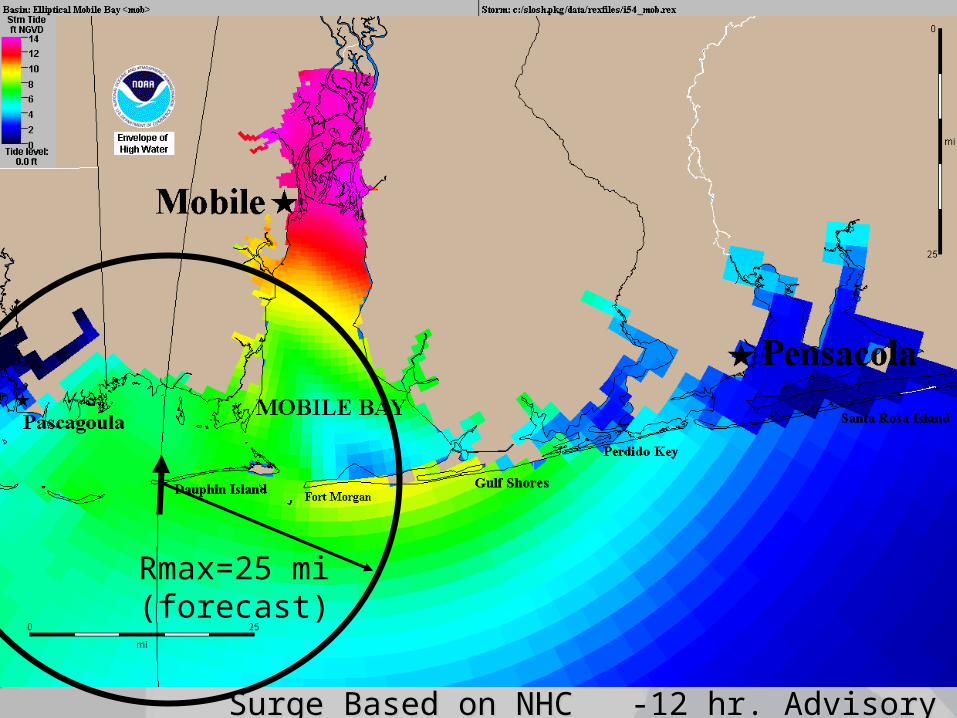
Rmax=25 mi(forecast)
Surge Based on NHC -12 hr. AdvisorySurge Based on NHC -12 hr. Advisory
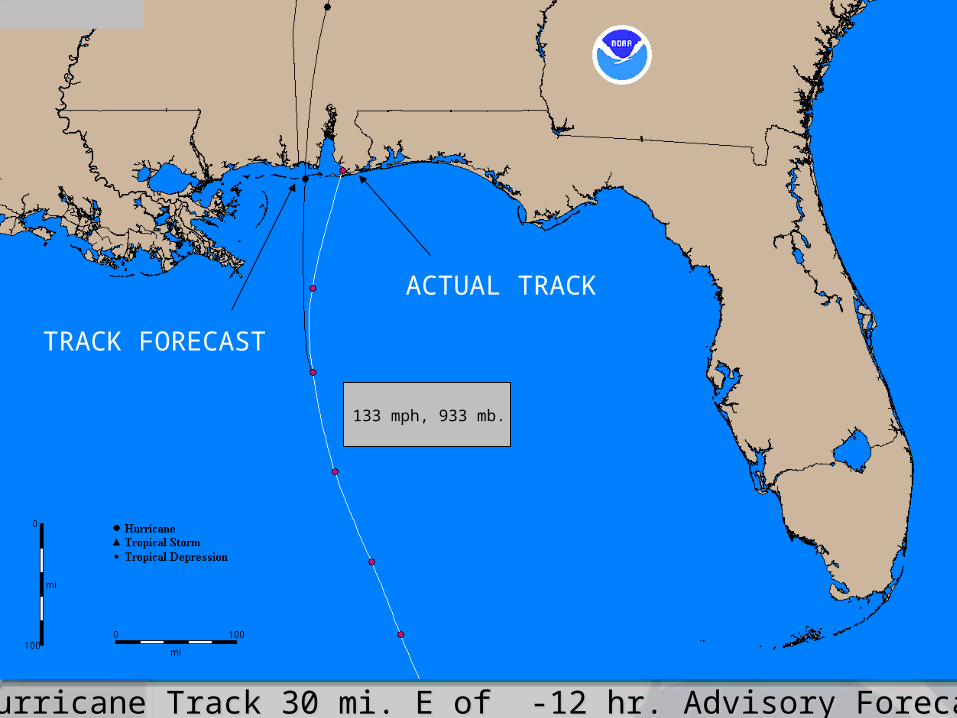
Actual Hurricane Track 30 mi. E of -12 hr. Advisory Forecast TrackActual Hurricane Track 30 mi. E of -12 hr. Advisory Forecast Track
TRACK FORECAST
ACTUAL TRACK
133 mph, 933 mb.
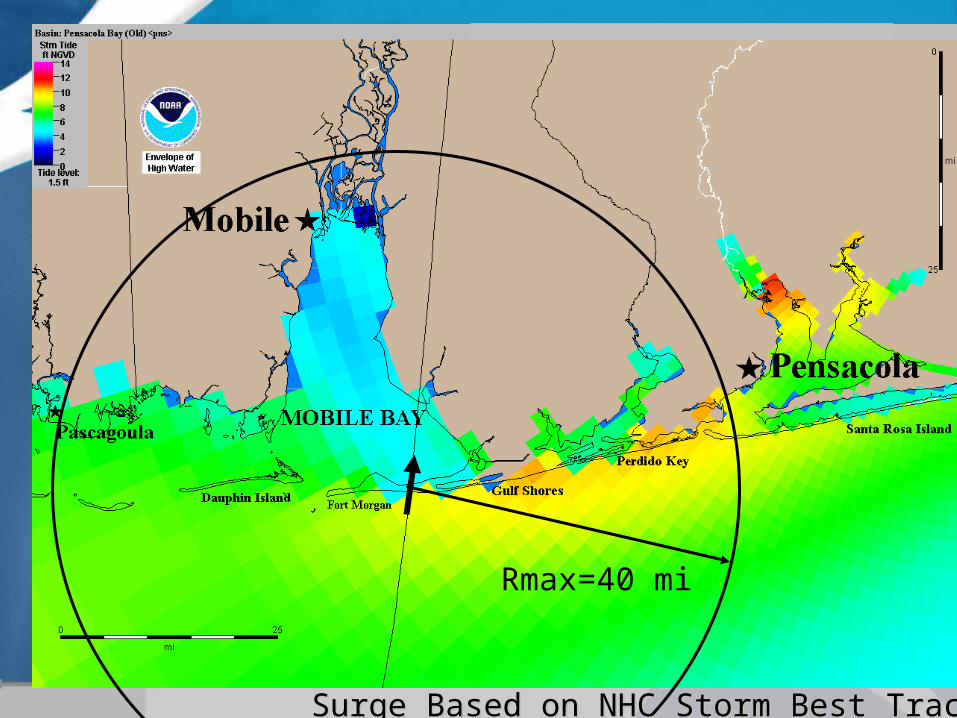
Rmax=40 mi
Surge Based on NHC Storm Best TrackSurge Based on NHC Storm Best Track
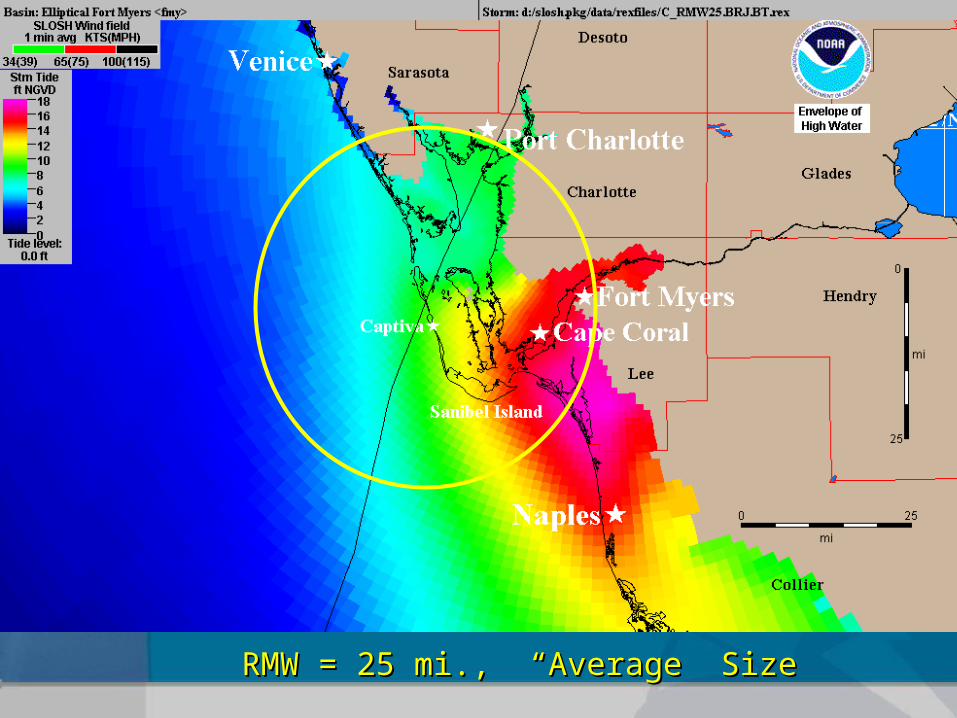
RMW = 25 mi., “Average” SizeRMW = 25 mi., “Average” Size
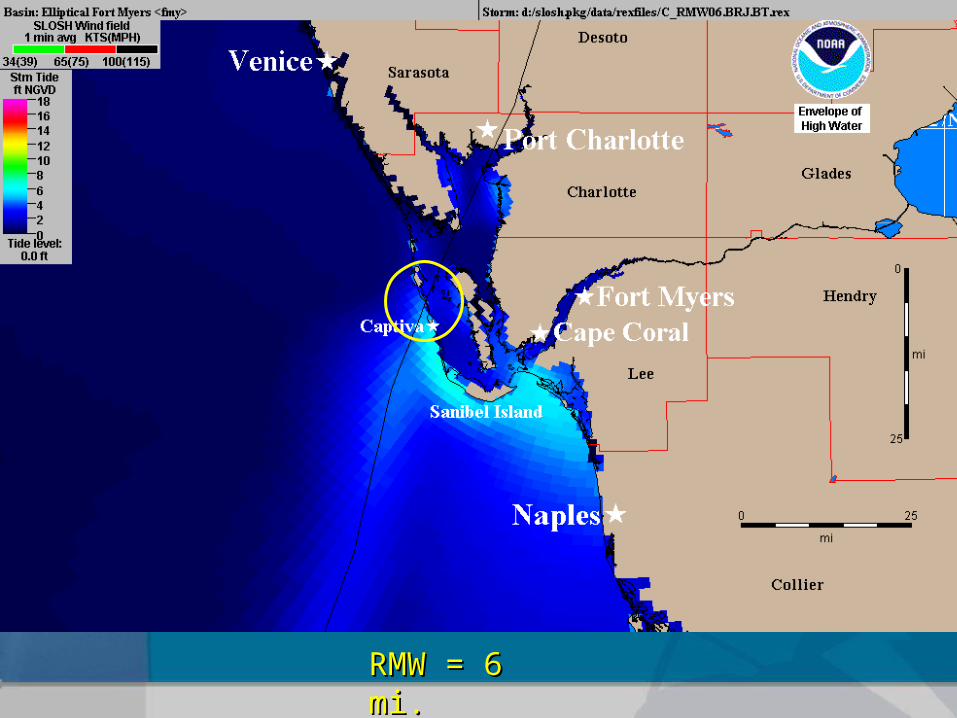
RMW = 6 mi.RMW = 6 mi.
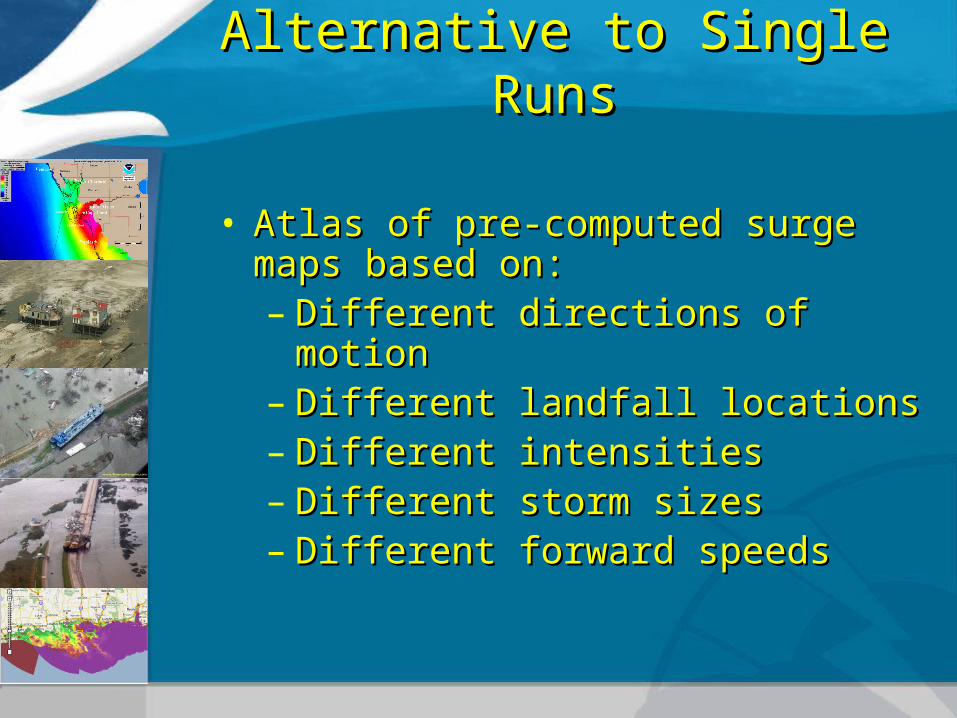
• Atlas of pre-computed surge maps based Atlas of pre-computed surge maps based on:on:– Different directions of motionDifferent directions of motion– Different landfall locationsDifferent landfall locations– Different intensitiesDifferent intensities– Different storm sizesDifferent storm sizes– Different forward speedsDifferent forward speeds
Alternative to Single RunsAlternative to Single Runs
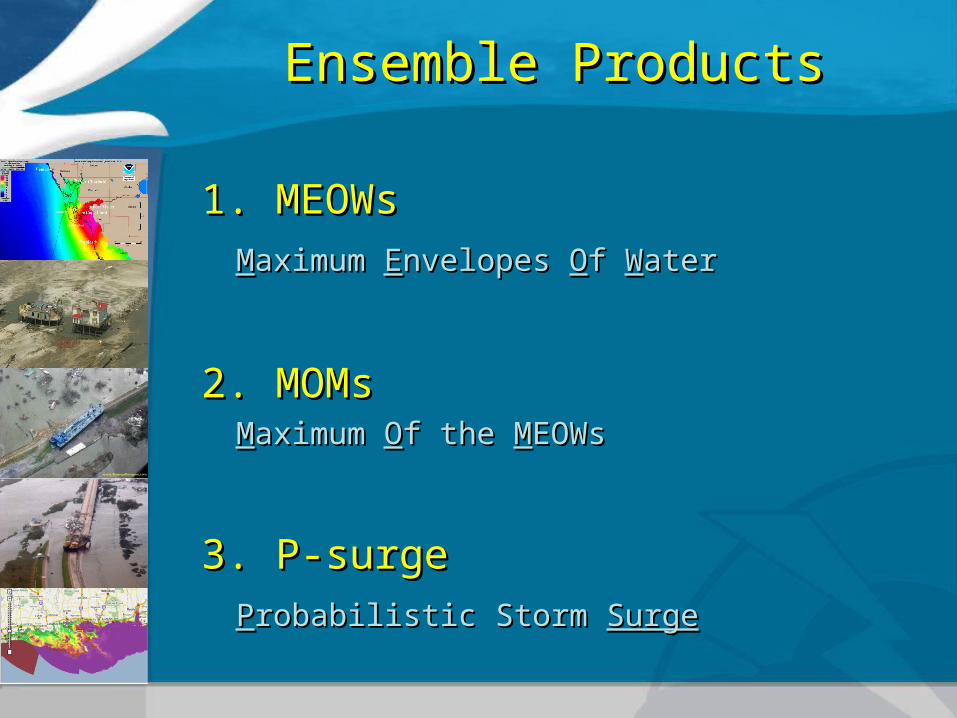
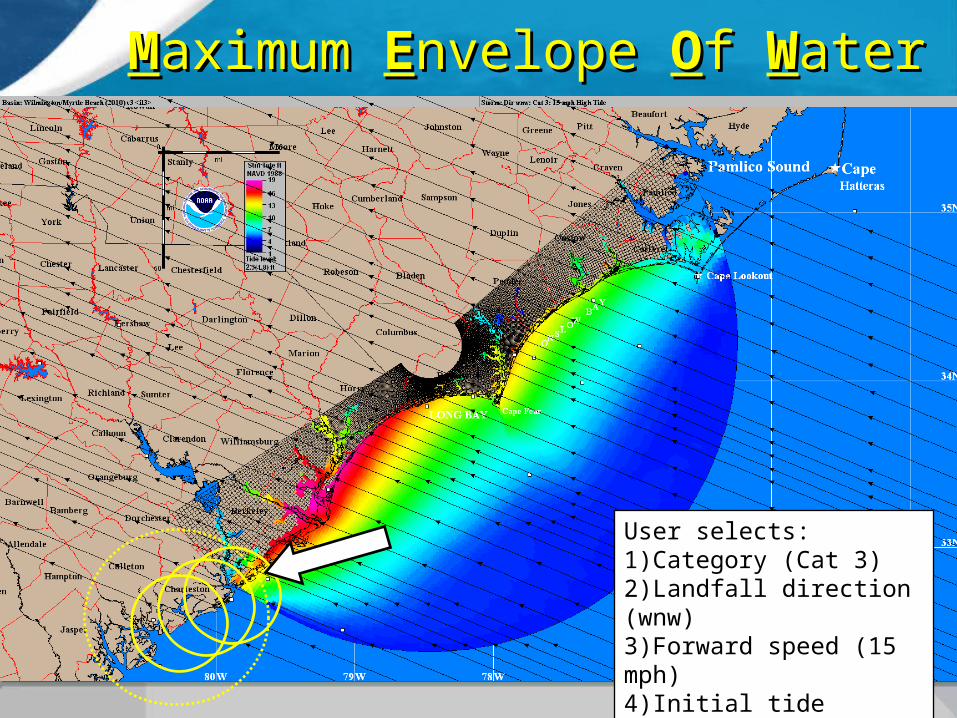
1. MEOWs1. MEOWsMMaximum aximum EEnvelopes nvelopes OOf f WWaterater
2. MOMs2. MOMsMMaximum aximum OOf the f the MMEOWsEOWs
3. P-surge3. P-surgePProbabilistic Storm robabilistic Storm SurgeSurge
Ensemble ProductsEnsemble Products
MEOWMEOWMMaximum aximum EEnvelope nvelope OOf f WWaterater
User selects:1)Category (Cat 3)2)Landfall direction (wnw)3)Forward speed (15 mph)4)Initial tide (High)
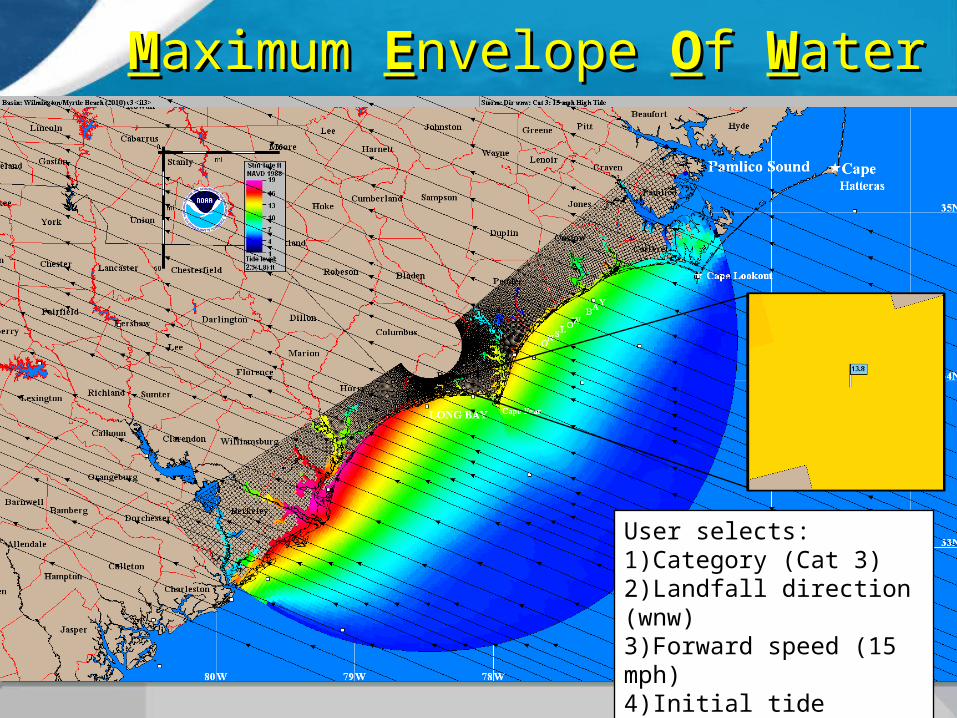
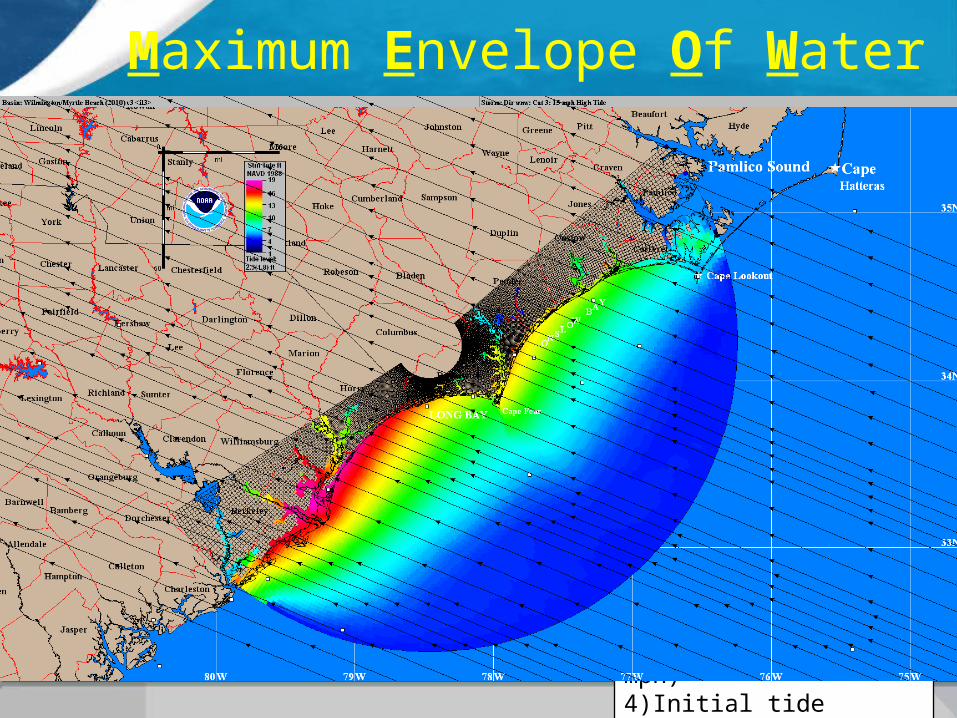
MMaximum aximum EEnvelope nvelope OOf f WWaterater
User selects:1)Category (Cat 3)2)Landfall direction (wnw)3)Forward speed (15 mph)4)Initial tide (High)
MMaximum aximum EEnvelope nvelope OOf f WWaterater
User selects:1)Category (Cat 3)2)Landfall direction (wnw)3)Forward speed (15 mph)4)Initial tide (High)
Maximum Envelope Of Water

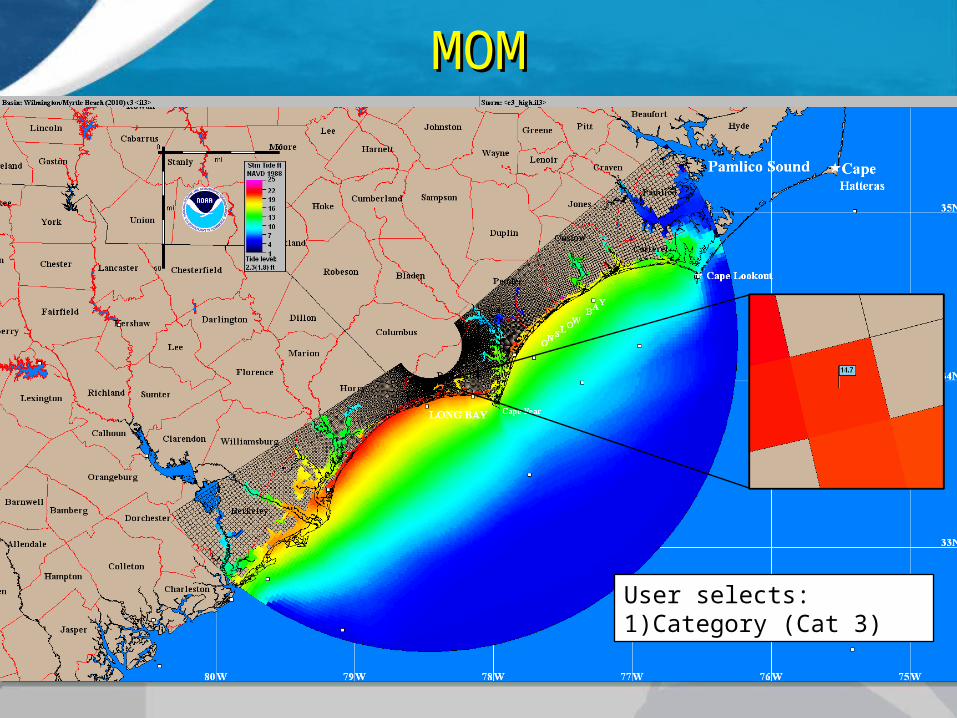
MOMMOMMMaximum aximum OOf the f the MMEOWsEOWs
MOMMOM
User selects:1)Category (Cat 3)
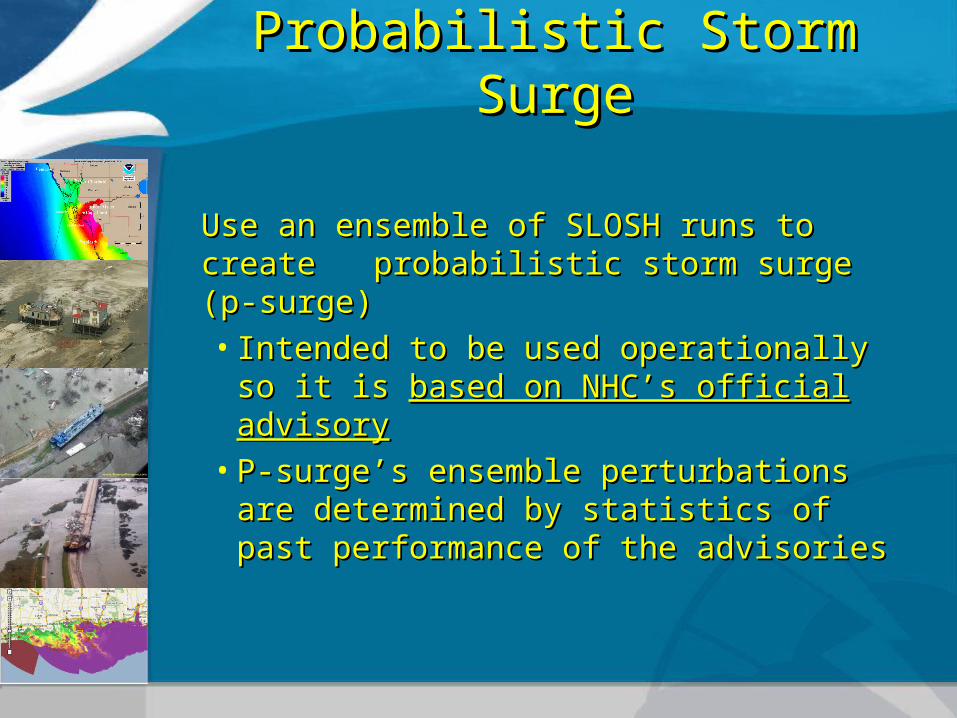
Use an ensemble of SLOSH runs to create Use an ensemble of SLOSH runs to create probabilistic storm surge (p-surge) probabilistic storm surge (p-surge) • Intended to be used operationally so it is Intended to be used operationally so it is based on based on
NHC’s official advisoryNHC’s official advisory• P-surge’s ensemble perturbations are determined P-surge’s ensemble perturbations are determined
by statistics of past performance of the advisoriesby statistics of past performance of the advisories
Probabilistic Storm SurgeProbabilistic Storm Surge
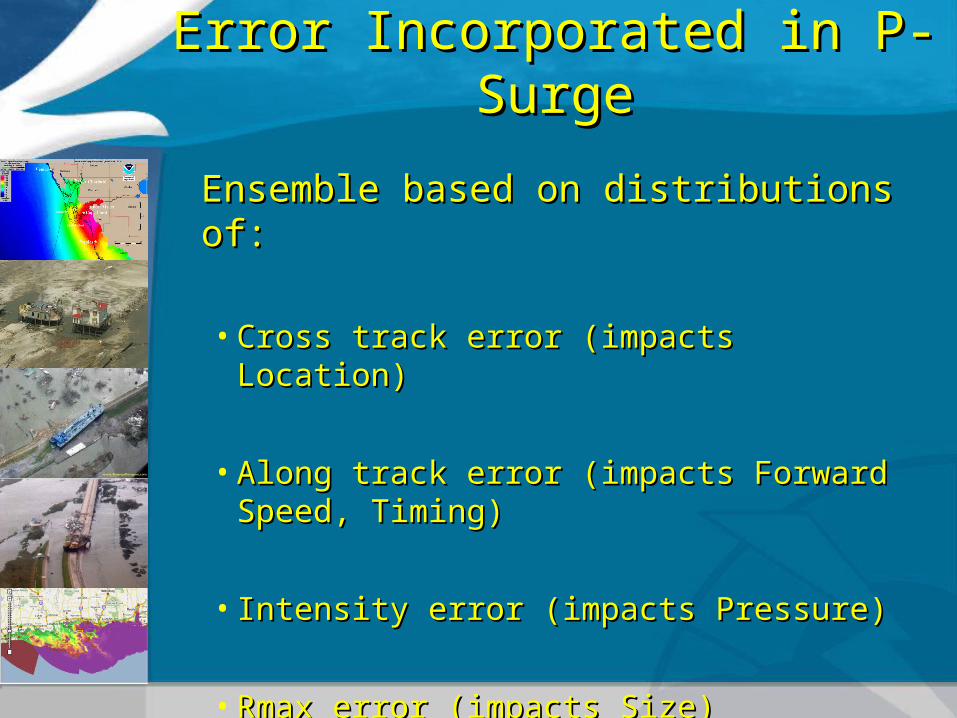
Ensemble based on distributions of:Ensemble based on distributions of:
• Cross track error (impacts Location)Cross track error (impacts Location)
• Along track error (impacts Forward Speed, Timing)Along track error (impacts Forward Speed, Timing)
• Intensity error (impacts Pressure)Intensity error (impacts Pressure)
• Rmax error (impacts Size)Rmax error (impacts Size)
Error Incorporated in P-SurgeError Incorporated in P-Surge
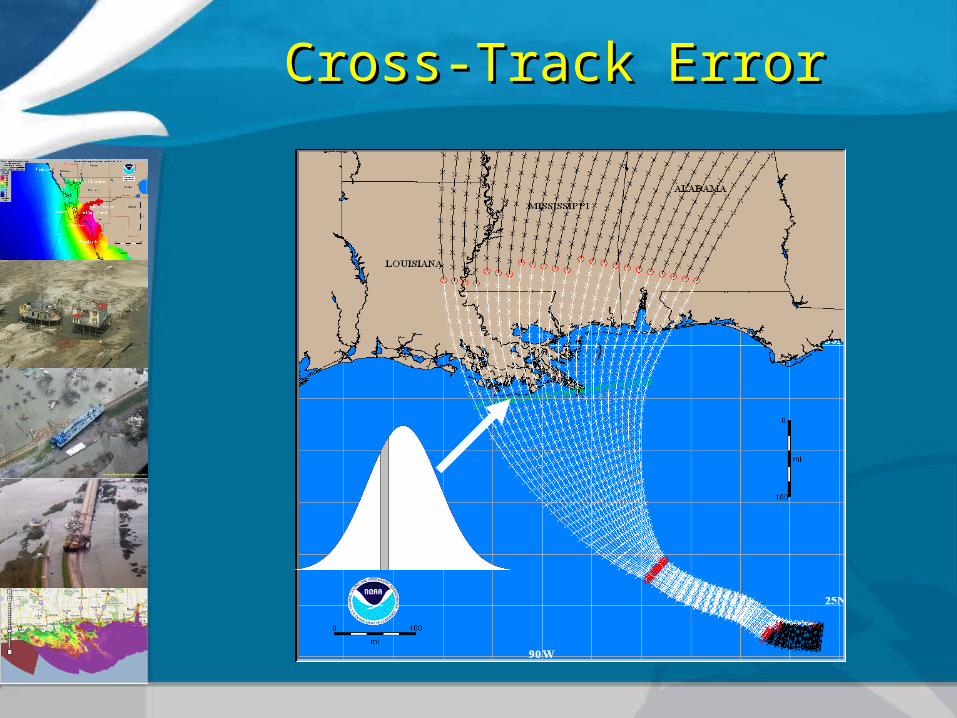
Cross-Track ErrorCross-Track Error
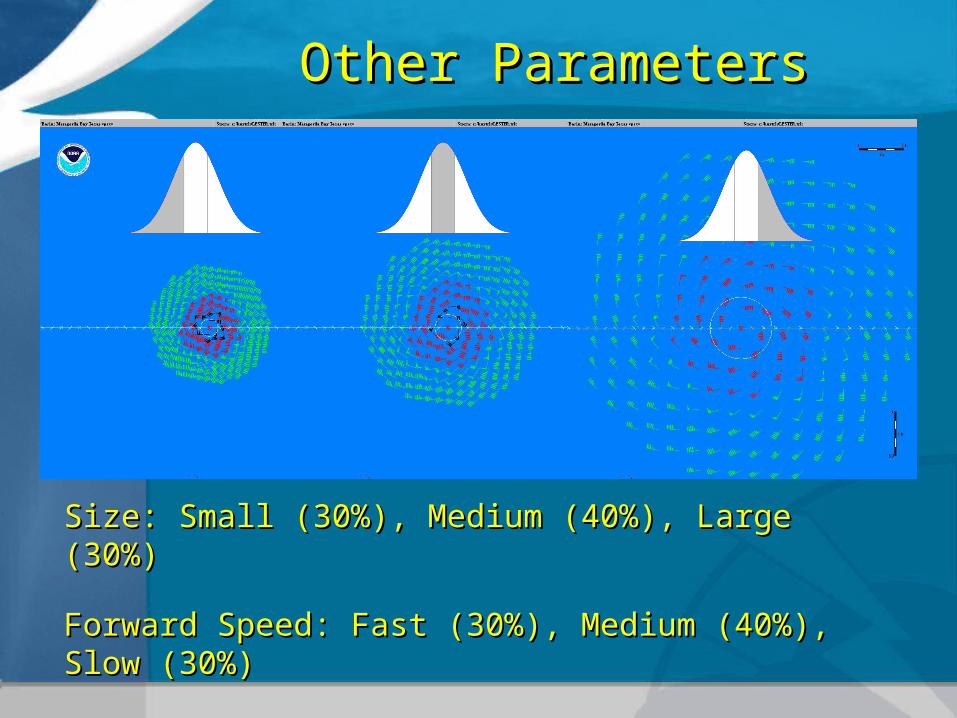
Other ParametersOther Parameters
Size: Small (30%), Medium (40%), Large (30%)Size: Small (30%), Medium (40%), Large (30%)
Forward Speed: Fast (30%), Medium (40%), Slow (30%)Forward Speed: Fast (30%), Medium (40%), Slow (30%)
Intensity: Strong (30%), Medium (40%), Weak (30%)Intensity: Strong (30%), Medium (40%), Weak (30%)
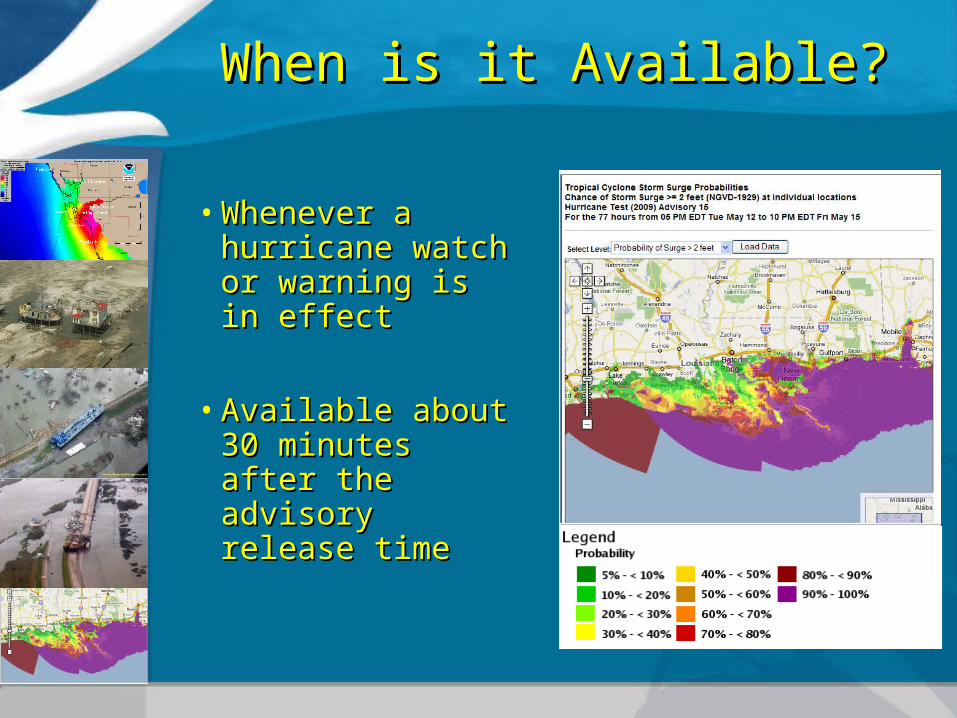
When is it Available?When is it Available?
• Whenever a hurricane Whenever a hurricane watch or warning is in watch or warning is in effecteffect
• Available about 30 Available about 30 minutes after the minutes after the advisory release timeadvisory release time
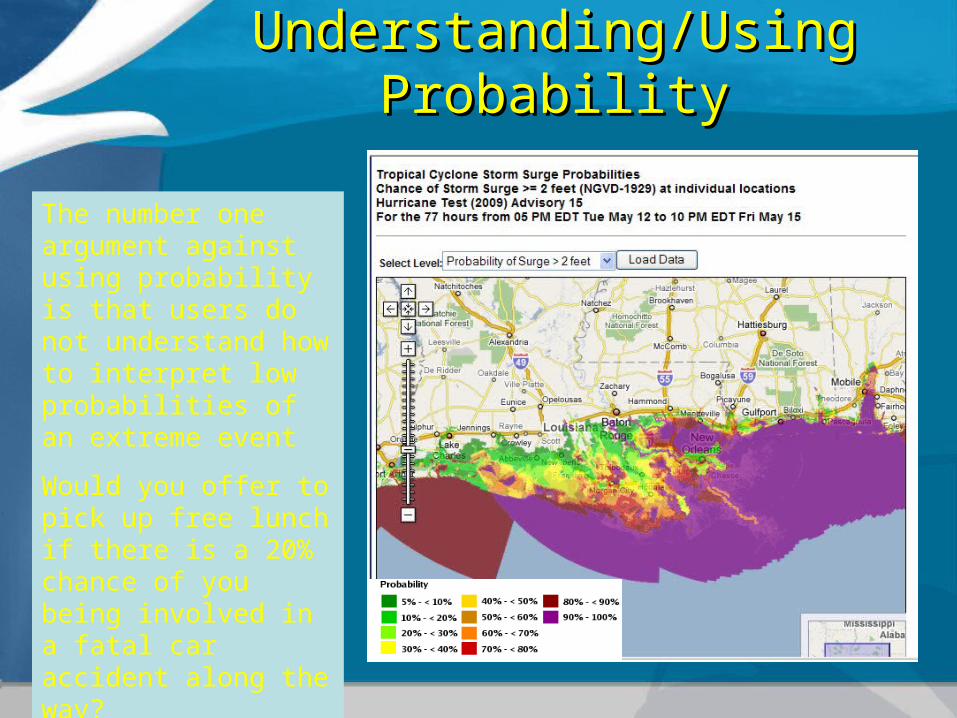
The number one argument against using probability is that users do not understand how to interpret low probabilities of an extreme event
Would you offer to pick up free lunch if there is a 20% chance of you being involved in a fatal car accident along the way?
Understanding/Using ProbabilityUnderstanding/Using Probability
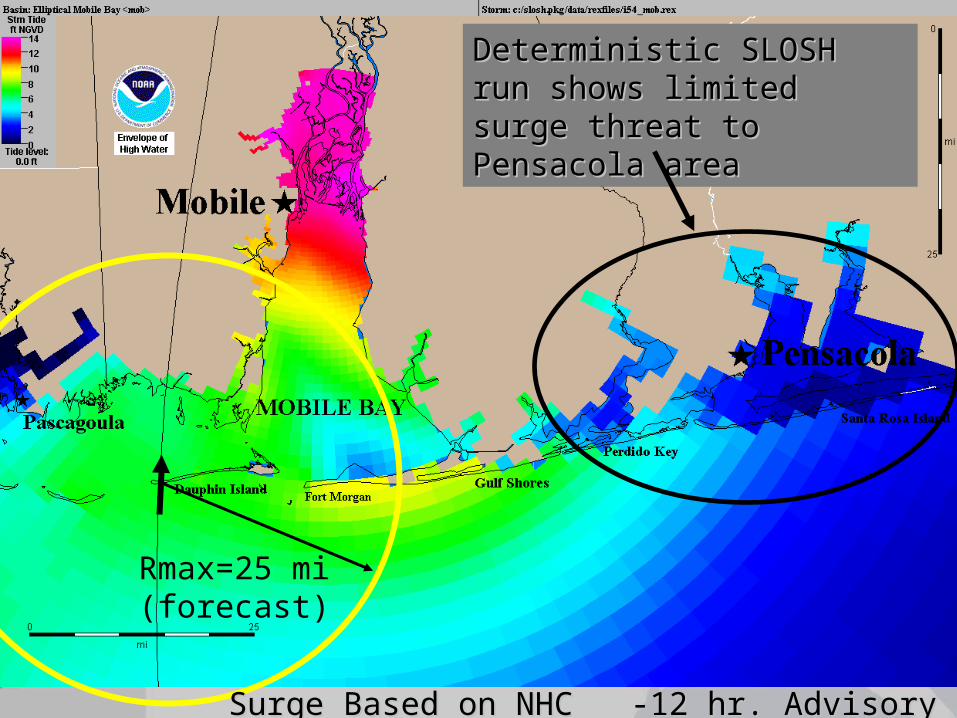
Rmax=25 mi(forecast)
Surge Based on NHC -12 hr. AdvisorySurge Based on NHC -12 hr. Advisory
Deterministic SLOSH run Deterministic SLOSH run shows limited surge threat to shows limited surge threat to Pensacola areaPensacola area
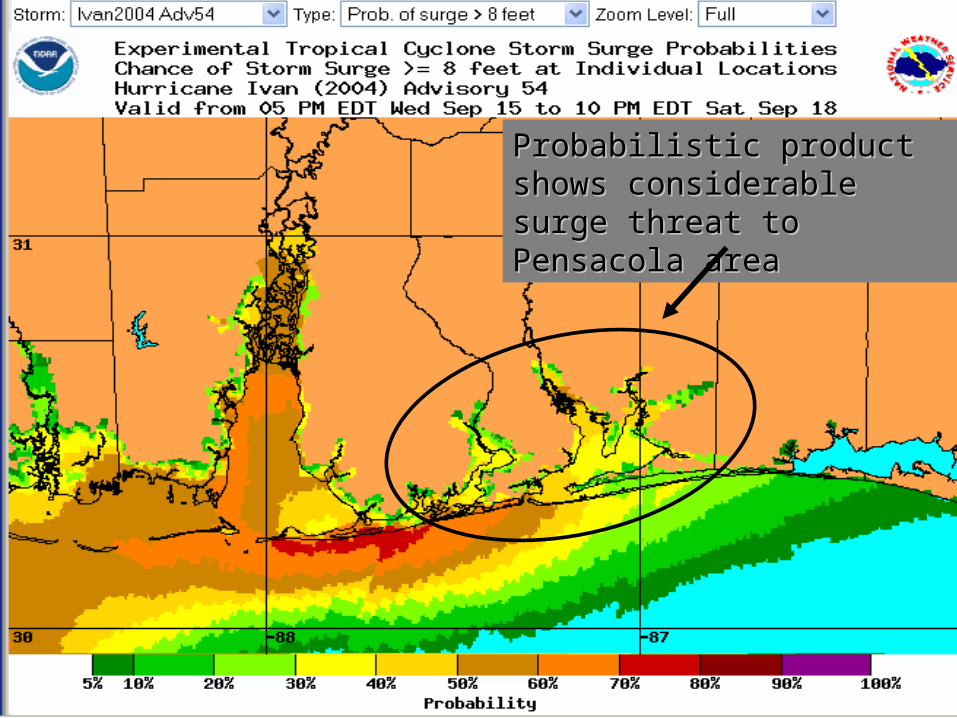
Probabilistic product shows Probabilistic product shows considerable surge threat to considerable surge threat to Pensacola areaPensacola area
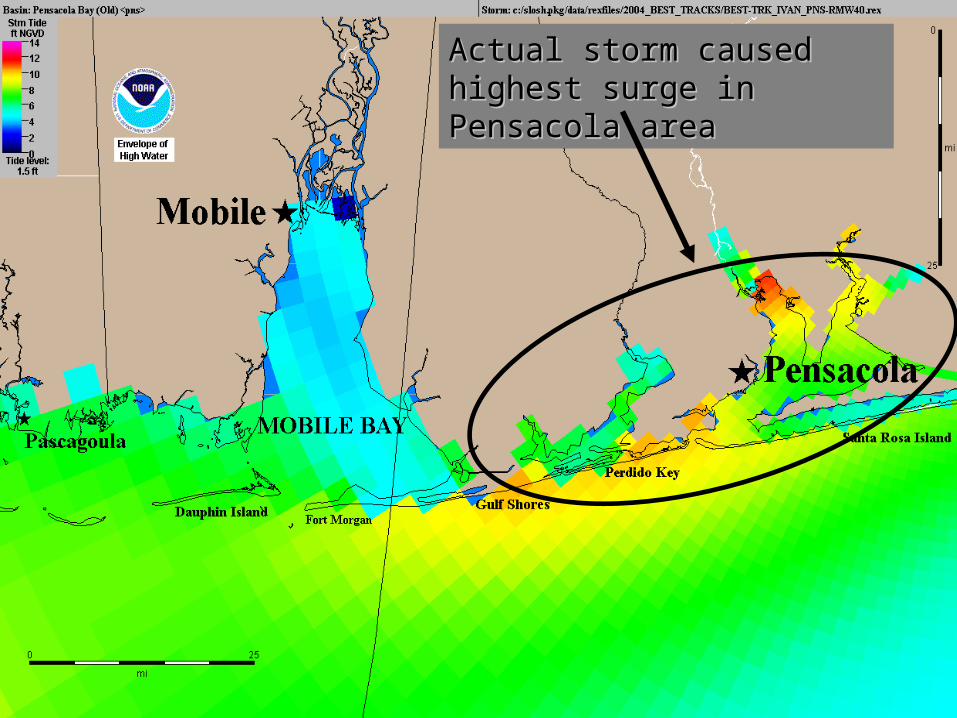
Actual storm caused highest Actual storm caused highest surge in Pensacola areasurge in Pensacola area
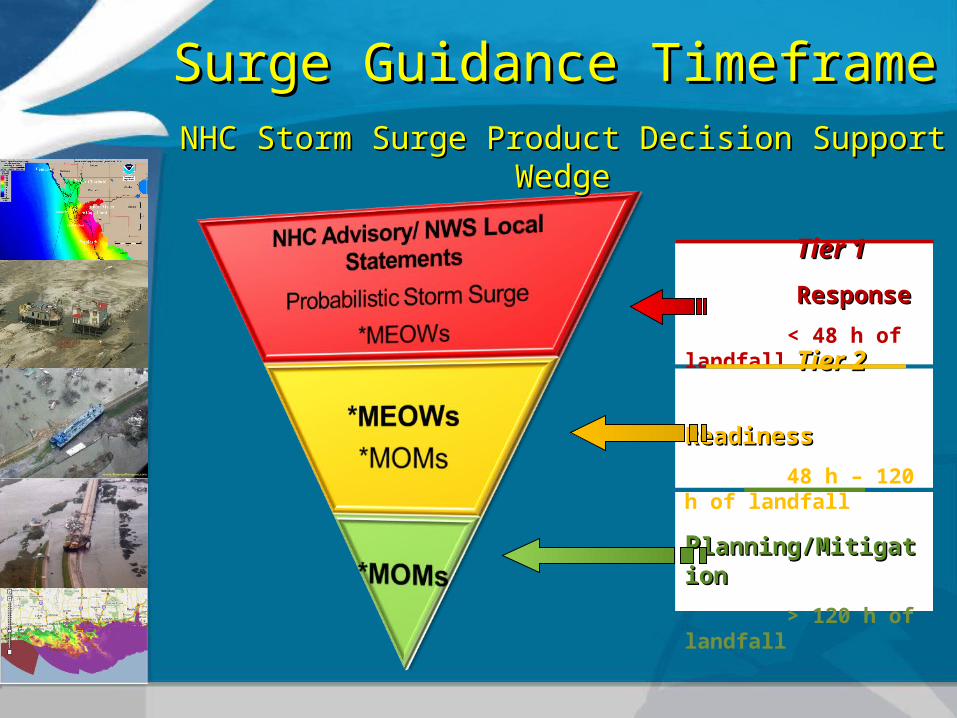
Surge Guidance TimeframeSurge Guidance Timeframe
Tier 1 Tier 1
ResponseResponse
< 48 h of landfall
Tier 3Tier 3
PPlanning/Mitigationlanning/Mitigation
> 120 h of landfall
Tier 2Tier 2
ReadinessReadiness
48 h – 120 h of landfall
NHC Storm Surge Product Decision Support WedgeNHC Storm Surge Product Decision Support Wedge