Embed Size (px)
Citation preview
STRATEGIC ECONOMIC DEVELOPMENT PLANSALT LAKE CITY | 2017–2020
MESSAGE FROM MAYOR BISKUPSKI
As the Crossroads of the West, Salt Lake City has always been a strategic place for business. With the right mix of infrastructure, space, workforce, culture, and location, Salt Lake City stands apart from cities in the state and across the region. Even with our natural advantages, Salt Lake City must do more to stay top-of-mind in an increasingly competitive global market. When I took office, I made it a priority to establish the City’s first Department of Economic Development, aligning our resources to streamline processes, and creating a team of experts to expand and leverage our advantages. These changes are to ensure we continue my administration’s goals of creating jobs for all people and building a city for everyone. The Department of Economic Development’s strategic plan has been created with previous research, new data, and a vision for the future economic state of Salt Lake City in mind. The staff worked extensively with business leaders, community stakeholders, and residents to create a plan that will guide the Department’s work over the next three years. Our team and our partners are prepared to tackle challenges like real estate and workforce for the long haul. We are committed to implementing new programs and leveraging innovation to create a resilient economy prepared for the future. We are driven by the value that Salt Lake City is more than simply a place to build a business; it’s a place to build a life.
Mayor Jackie Biskupski
STRATEGIC ECONOMIC DEVELOPMENT PLAN 3
INTRODUCTION
Salt Lake City is well-positioned to capitalize upon the human, cultural, economic, physical, and technological assets that provide distinct advantages over comparable communities. A talented and skilled workforce, unparalleled access to world-class recreation opportunities, and an entrepreneurial spirit position Salt Lake City for economic success in a global economy. The City has situated itself to be an economic leader with thriving commercial districts, the headquarters of a global church, and an international airport connecting to economies around the world.
Leading in a global economy means that Salt Lake City must recognize that the current shifting economic landscape is moving from production-based to information-based, which requires higher skill and education. Having a 3.5% * unemployment rate means employers are competing for workforce in a region with limited talent acquisition opportunity. The City’s workforce is becoming larger, younger, and much more diverse. As the economy evolves, access to economic opportunities for all the City’s residents will become increasingly important. Salt Lake City’s Department of Economic Development (SLC DED) will lead conversations not only on the recruitment and retention of employers, but also that of employees.
Part of the retention of talent will be allowing for the continued access to arts and culture, affordable housing, and vibrant places to live, work, and recreate. However, without the ability to earn similar wages as other cities competing for similar talent, the young and mobile workforce will seek employment opportunities outside of Salt Lake City.
Challenges facing Salt Lake City are not focused just on education and workforce—there are many considerations that will affect how the City remains competitive. Some of those considerations include the need to increase unique and flexible physical spaces, provide a variety of housing options, and improve infrastructure that is more focused on, and tailored to, public policies and trade programs. The Redevelopment Agency Division (RDA) of the SLC DED will lead efforts to invest in commercial districts and neighborhoods in ways that increase taxable value while fostering vibrancy. The Salt Lake City Arts Council (Arts Council), also a division of the SLC DED, will continue its work to support these efforts by creating vibrancy in the City, and striving to ensure that arts and culture are accessible to everyone.
SLC DED welcomes and encourages collaboration with other departments to solve the City's challenges and opportunities such as Salt Lake City's Climate Positive 2040 plan and initiatives to help populations with barriers to employment. In addition to the City priorities mentioned, we welcome leads and collaboration with other departments to recruit, retain, and expand companies that move the needle to build Salt Lake City as a vibrant, beautiful, prosperous, diverse, and authentic place.
The Strategic Plan establishes an assessment of existing economic conditions of Salt Lake City through analysis of quantitative and qualitative data. This information guided a strategic framework that builds on existing strengths and seeks to overcome identified challenges to ensure the City’s fiscal health, enhance its business climate, and promote economic growth.
*The Bureau of Labor Statistics lists the
May 2017 unemployment rate as 3.5%.
The preliminary June 2017 rate is 3.8%.
STRATEGIC ECONOMIC DEVELOPMENT PLAN 4
The SLC DED is currently gathering and analyzing additional data that will be helpful as we implement this strategic plan. We have software and resources to look at regional and local economic conditions on a real-time basis, including retail and sales captures. Salt Lake City’s Housing and Neighborhood Development’s ‘Growing SLC’ is a five-year housing plan intended to help find housing opportunities in the City that are safe, secure, and enrich lives and communities. The RDA continues its work on project areas with the approach to maximize opportunity for increasing tax increment growth and concentrate investment to gain economies of scale and leverage with other public and private investment. More information on these analyses can be found at www.slcgov.com.
STRATEGIC ECONOMIC DEVELOPMENT PLAN 5
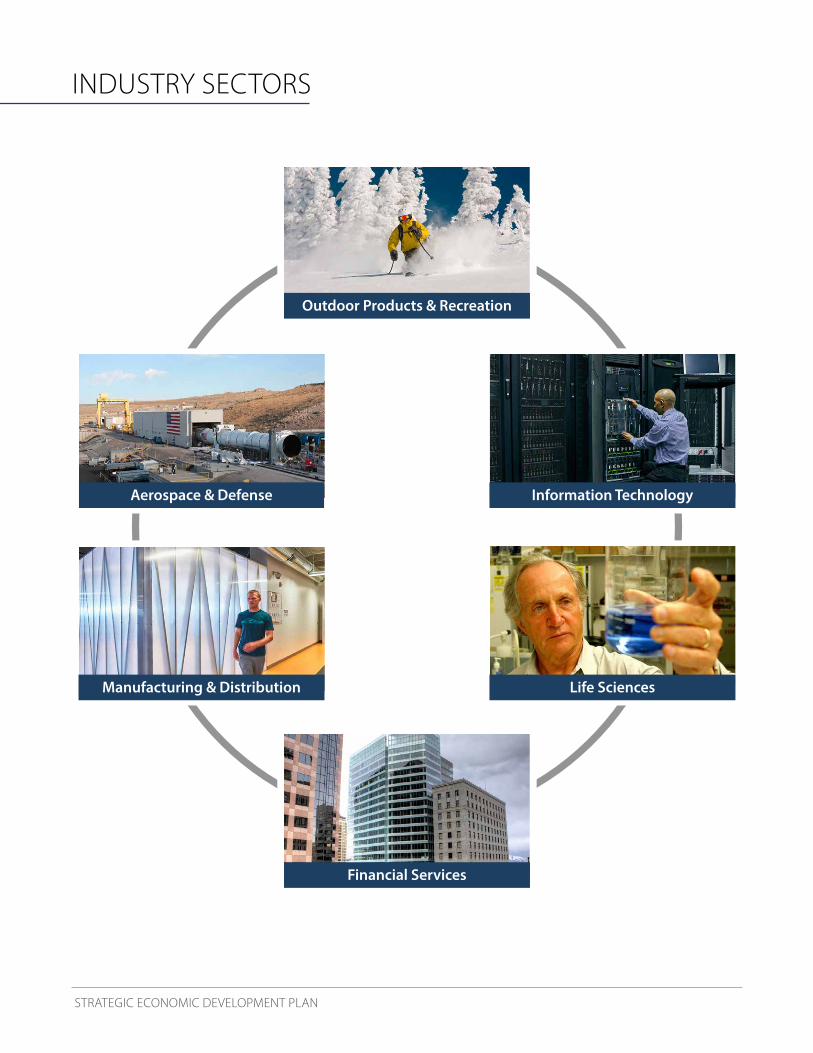
Outdoor Products & Recreation
Financial Services
Life SciencesManufacturing & Distribution
Information TechnologyAerospace & Defense
INDUSTRY SECTORS
STRATEGIC ECONOMIC DEVELOPMENT PLAN 6
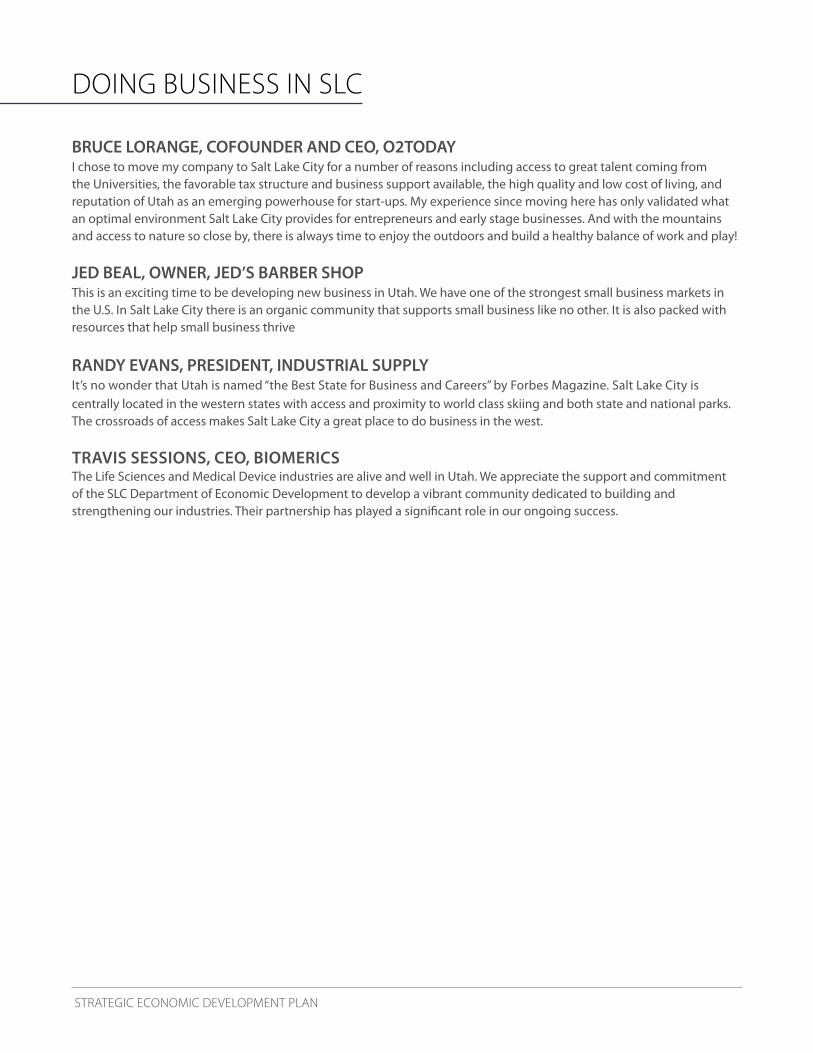
BRUCE LORANGE, COFOUNDER AND CEO, O2TODAYI chose to move my company to Salt Lake City for a number of reasons including access to great talent coming from the Universities, the favorable tax structure and business support available, the high quality and low cost of living, and reputation of Utah as an emerging powerhouse for start-ups. My experience since moving here has only validated what an optimal environment Salt Lake City provides for entrepreneurs and early stage businesses. And with the mountains and access to nature so close by, there is always time to enjoy the outdoors and build a healthy balance of work and play!
JED BEAL, OWNER, JED’S BARBER SHOPThis is an exciting time to be developing new business in Utah. We have one of the strongest small business markets in the U.S. In Salt Lake City there is an organic community that supports small business like no other. It is also packed with resources that help small business thrive RANDY EVANS, PRESIDENT, INDUSTRIAL SUPPLYIt’s no wonder that Utah is named “the Best State for Business and Careers” by Forbes Magazine. Salt Lake City is centrally located in the western states with access and proximity to world class skiing and both state and national parks. The crossroads of access makes Salt Lake City a great place to do business in the west.
TRAVIS SESSIONS, CEO, BIOMERICSThe Life Sciences and Medical Device industries are alive and well in Utah. We appreciate the support and commitment of the SLC Department of Economic Development to develop a vibrant community dedicated to building and strengthening our industries. Their partnership has played a significant role in our ongoing success.
DOING BUSINESS IN SLC
STRATEGIC ECONOMIC DEVELOPMENT PLAN 7
TABLE OF CONTENTS
STRENGTHS, CHALLENGES, OPPORTUNITIES, THREATS .............................................................................1
STEPS IN THE DEVELOPMENT OF THE STRATEGIC PLAN ...........................................................................4
STRATEGIC PLAN FRAMEWORK ...............................................................................................................................18
STRATEGIC OBJECTIVES ................................................................................................................................................19
ACTIONS ..................................................................................................................................................................................20
METRICS ...................................................................................................................................................................................24
BE PART OF THE STRATEGIC PLAN’S IMPLEMENTATION .........................................................................31
CONCLUSIONS ....................................................................................................................................................................32
NOTE OF THANKS ..............................................................................................................................................................33
Cover photo credit to Dana Sohm, Michael Schoenfeld, Douglas Pulsipher, Eric Schramm, DaveBrewerPhoto.com
STRATEGIC ECONOMIC DEVELOPMENT PLAN 1
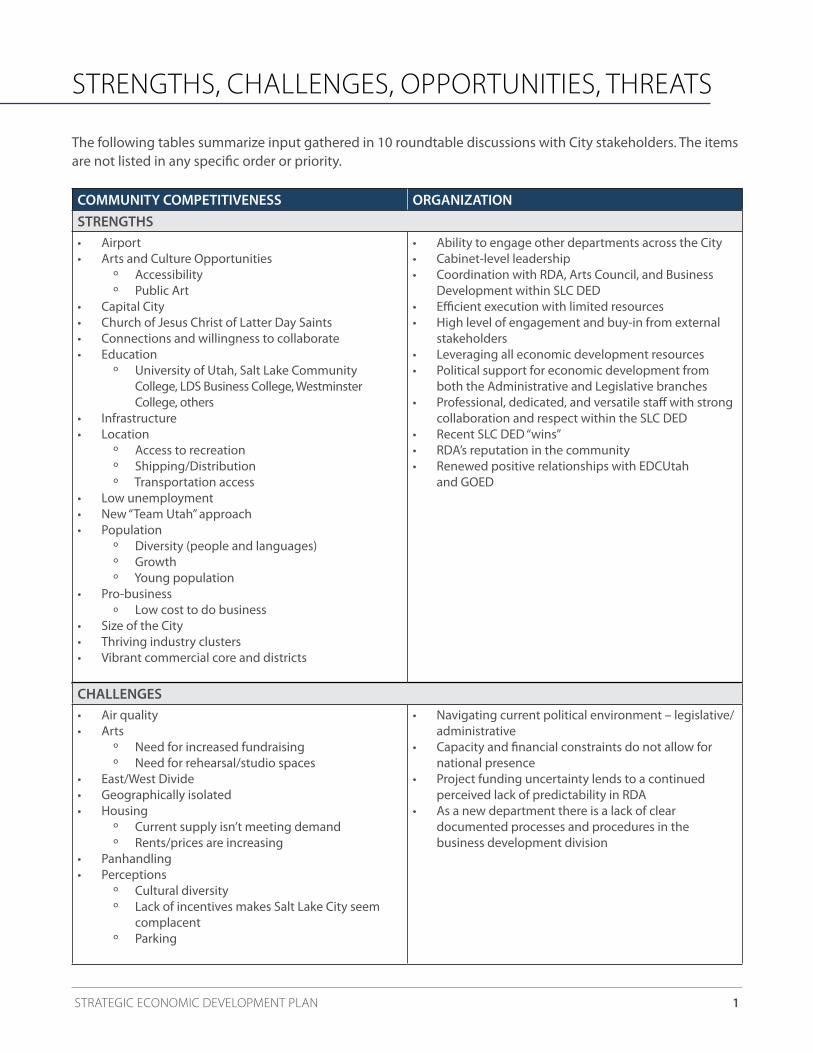
COMMUNITY COMPETITIVENESS ORGANIZATIONSTRENGTHS• Airport• Arts and Culture Opportunities
º Accessibilityº Public Art
• Capital City• Church of Jesus Christ of Latter Day Saints• Connections and willingness to collaborate• Education
º University of Utah, Salt Lake Community College, LDS Business College, Westminster College, others
• Infrastructure• Location
º Access to recreationº Shipping/Distributionº Transportation access
• Low unemployment• New “Team Utah” approach• Population
º Diversity (people and languages)º Growth º Young population
• Pro-businessº Low cost to do business
• Size of the City• Thriving industry clusters• Vibrant commercial core and districts
• Ability to engage other departments across the City• Cabinet-level leadership• Coordination with RDA, Arts Council, and Business
Development within SLC DED• Efficient execution with limited resources• High level of engagement and buy-in from external
stakeholders• Leveraging all economic development resources• Political support for economic development from
both the Administrative and Legislative branches• Professional, dedicated, and versatile staff with strong
collaboration and respect within the SLC DED• Recent SLC DED “wins”• RDA’s reputation in the community• Renewed positive relationships with EDCUtah
and GOED
STRENGTHS, CHALLENGES, OPPORTUNITIES, THREATS
The following tables summarize input gathered in 10 roundtable discussions with City stakeholders. The items are not listed in any specific order or priority.
CHALLENGES• Air quality• Arts
º Need for increased fundraisingº Need for rehearsal/studio spaces
• East/West Divide• Geographically isolated• Housing
º Current supply isn’t meeting demandº Rents/prices are increasing
• Panhandling• Perceptions
º Cultural diversityº Lack of incentives makes Salt Lake City seem
complacentº Parking
• Navigating current political environment – legislative/administrative
• Capacity and financial constraints do not allow for national presence
• Project funding uncertainty lends to a continued perceived lack of predictability in RDA
• As a new department there is a lack of clear documented processes and procedures in the business development division
STRATEGIC ECONOMIC DEVELOPMENT PLAN 2
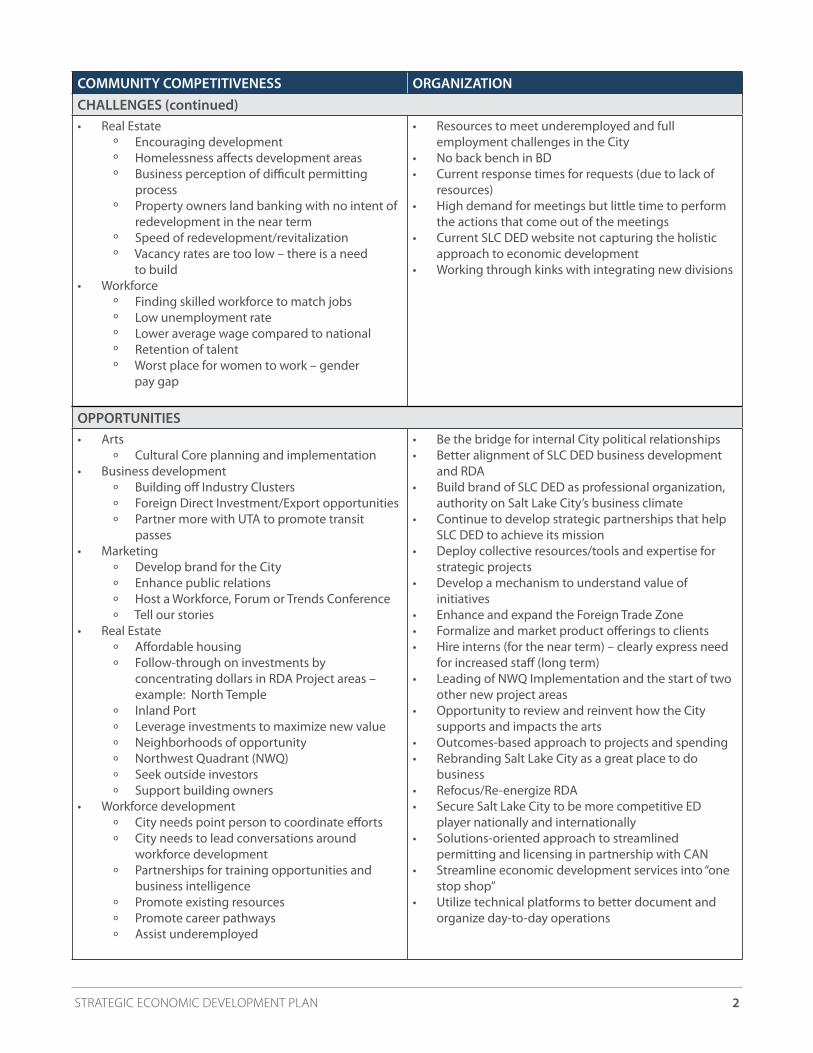
COMMUNITY COMPETITIVENESS ORGANIZATIONCHALLENGES (continued)• Real Estate
º Encouraging developmentº Homelessness affects development areas º Business perception of difficult permitting
processº Property owners land banking with no intent of
redevelopment in the near termº Speed of redevelopment/revitalizationº Vacancy rates are too low – there is a need
to build• Workforce
º Finding skilled workforce to match jobsº Low unemployment rateº Lower average wage compared to nationalº Retention of talentº Worst place for women to work – gender
pay gap
• Resources to meet underemployed and full employment challenges in the City
• No back bench in BD• Current response times for requests (due to lack of
resources)• High demand for meetings but little time to perform
the actions that come out of the meetings • Current SLC DED website not capturing the holistic
approach to economic development• Working through kinks with integrating new divisions
OPPORTUNITIES• Arts
º Cultural Core planning and implementation• Business development
º Building off Industry Clustersº Foreign Direct Investment/Export opportunitiesº Partner more with UTA to promote transit
passes• Marketing
º Develop brand for the Cityº Enhance public relationsº Host a Workforce, Forum or Trends Conferenceº Tell our stories
• Real Estateº Affordable housingº Follow-through on investments by
concentrating dollars in RDA Project areas – example: North Temple
º Inland Portº Leverage investments to maximize new valueº Neighborhoods of opportunityº Northwest Quadrant (NWQ)º Seek outside investorsº Support building owners
• Workforce developmentº City needs point person to coordinate efforts º City needs to lead conversations around
workforce developmentº Partnerships for training opportunities and
business intelligenceº Promote existing resourcesº Promote career pathways º Assist underemployed
• Be the bridge for internal City political relationships• Better alignment of SLC DED business development
and RDA• Build brand of SLC DED as professional organization,
authority on Salt Lake City’s business climate• Continue to develop strategic partnerships that help
SLC DED to achieve its mission• Deploy collective resources/tools and expertise for
strategic projects• Develop a mechanism to understand value of
initiatives • Enhance and expand the Foreign Trade Zone• Formalize and market product offerings to clients • Hire interns (for the near term) – clearly express need
for increased staff (long term)• Leading of NWQ Implementation and the start of two
other new project areas • Opportunity to review and reinvent how the City
supports and impacts the arts • Outcomes-based approach to projects and spending • Rebranding Salt Lake City as a great place to do
business• Refocus/Re-energize RDA• Secure Salt Lake City to be more competitive ED
player nationally and internationally• Solutions-oriented approach to streamlined
permitting and licensing in partnership with CAN• Streamline economic development services into “one
stop shop”• Utilize technical platforms to better document and
organize day-to-day operations
STRATEGIC ECONOMIC DEVELOPMENT PLAN 3
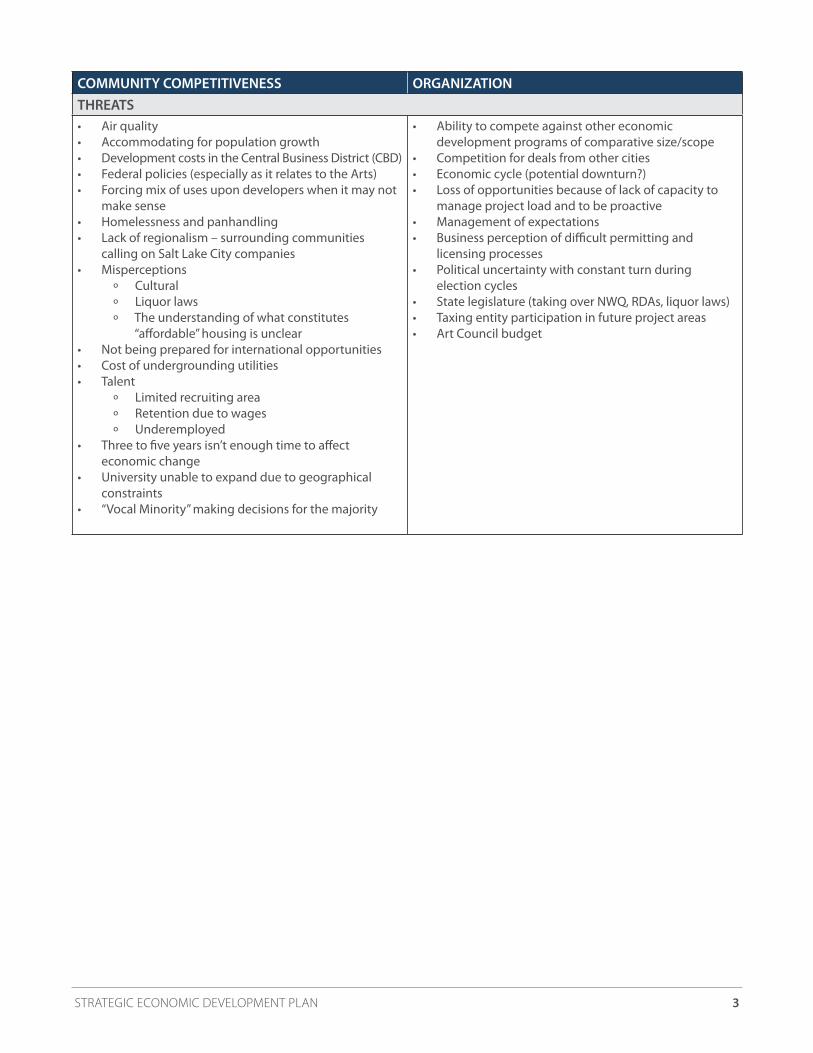
COMMUNITY COMPETITIVENESS ORGANIZATIONTHREATS• Air quality• Accommodating for population growth• Development costs in the Central Business District (CBD)• Federal policies (especially as it relates to the Arts)• Forcing mix of uses upon developers when it may not
make sense• Homelessness and panhandling• Lack of regionalism – surrounding communities
calling on Salt Lake City companies• Misperceptions
º Culturalº Liquor lawsº The understanding of what constitutes
“affordable” housing is unclear• Not being prepared for international opportunities• Cost of undergrounding utilities• Talent
º Limited recruiting areaº Retention due to wagesº Underemployed
• Three to five years isn’t enough time to affect economic change
• University unable to expand due to geographical constraints
• “Vocal Minority” making decisions for the majority
• Ability to compete against other economic development programs of comparative size/scope
• Competition for deals from other cities• Economic cycle (potential downturn?)• Loss of opportunities because of lack of capacity to
manage project load and to be proactive• Management of expectations• Business perception of difficult permitting and
licensing processes• Political uncertainty with constant turn during
election cycles• State legislature (taking over NWQ, RDAs, liquor laws)• Taxing entity participation in future project areas• Art Council budget
STRATEGIC ECONOMIC DEVELOPMENT PLAN 4
STEPS IN THE DEVELOPMENT OF THE STRATEGIC PLAN
COMMUNITY ENGAGEMENT AND GOALS DEVELOPMENTThe process of creating the Strategic Plan began with a review of best domestic and global economic development practices. This was followed by an electronic business survey of over 800 responding businesses across Salt Lake City assessing their challenges, opportunities, and perceptions, and 242 in-person business visits. The SLC DED also conducted further outreach by hosting 10 public-input roundtables representing over 60 companies and over 100 business leaders, meetings with local industry groups, input from the Business Advisory Board, and two larger public meetings to share initial findings. Over the course of these meetings, consensus developed around four goals:1. Position Salt Lake City to compete against like cities in capturing job opportunities for all residents while
seeking sustainable growth.2. Cultivate vibrancy throughout Salt Lake City by enhancing the arts, commercial districts, and housing
opportunities.3. Build on Salt Lake City’s reputation as a global, vital, and innovative community.4. Position the SLC DED to be the authority for economic opportunities in Salt Lake City.
The aforementioned research process for the Strategic Plan represents the continuation of an ongoing consensus development that began in 2015 with the enterpriseSLC effort (see page 17) and includes a review of plans that have been developed such as the Downtown Plan, the Northwest Quadrant Master Plan, and RDA Project Area Plans.
In addition to the recent research and outreach, the Strategic Plan is a culmination of a year of fostering and building partnerships. Partnerships will play an important role in the Strategic Plan’s implementation and success.
DATA REVIEWTo determine strategies, the first step was to fully understand the current economic drivers of Salt Lake City. The first step was determining the City’s key industry sectors.
The largest share of the Salt Lake City economy is based on the educational services, healthcare (life science/ medical device), retail (outdoor would be included), accommodations and food service, and manufacturing. This information confirms the industry sectors the SLC DED should market to.
STRATEGIC ECONOMIC DEVELOPMENT PLAN 5
Education
14.1% 12.5% 9.4% 3% 9.2% 3.4%
3.6%
2.8%
0.4%0.3%
8.4% 4.9% 10.3%
4.6%
5% 4.2%1.8%
Healthcare/Social
Prof./Scienti�c/Tech
Admin./Support/Waste Mgt.
Retail
Accommodation/Food Service
Arts/Entertain./Recreation
Manufacturing
Finance/Insurance
RealEstate
Construction
Other
Transportation/Warehouse
Information
Wholesale Trade 1.6%
Utilities 0.4%
Public Admin.
AgricultureMining/Oil/Gas
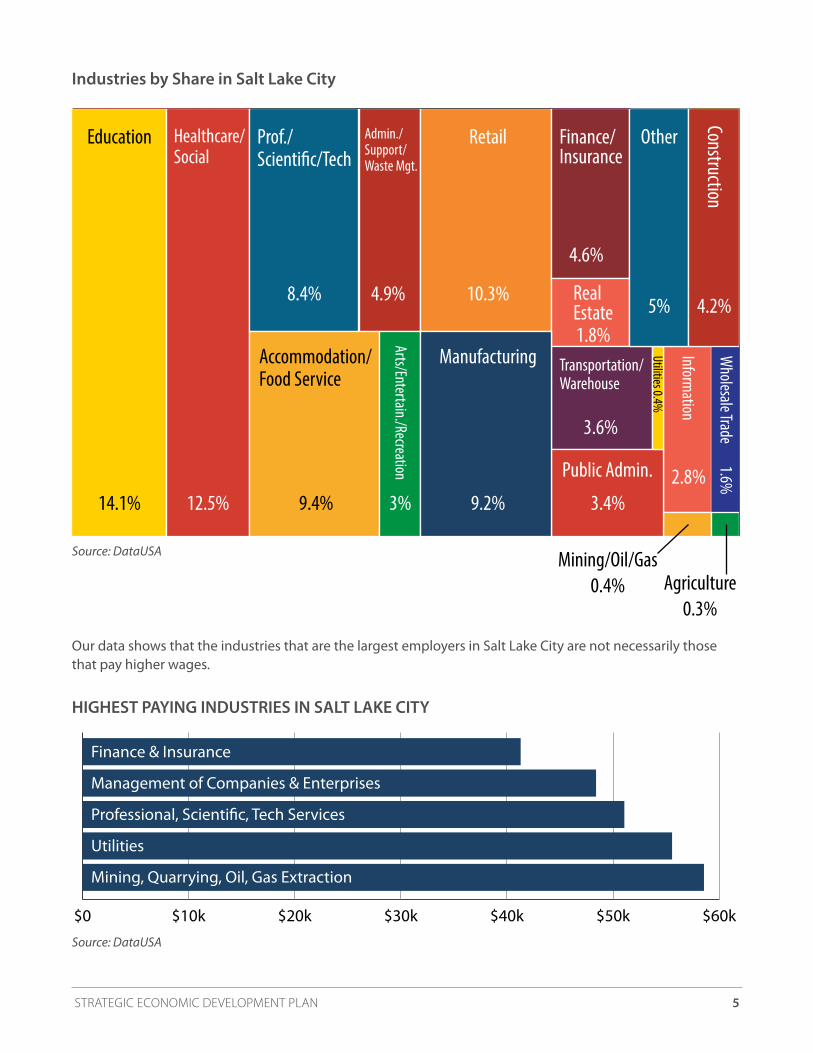
Industries by Share in Salt Lake City
Source: DataUSA
Our data shows that the industries that are the largest employers in Salt Lake City are not necessarily those that pay higher wages.
HIGHEST PAYING INDUSTRIES IN SALT LAKE CITY
$0 $10k $20k $30k $40k $50k $60k
Finance & Insurance
Management of Companies & Enterprises
Professional, Scienti�c, Tech Services
Utilities
Mining, Quarrying, Oil, Gas Extraction
$0 $5k $10k $15k $20k $25k $30k $35k
Accommodation & Food Service
Arts, Entertainment, Recreation
Admin., Support, Waste Management Services
Educational Services
Real Estate, Rental & Leasing
Source: DataUSA
STRATEGIC ECONOMIC DEVELOPMENT PLAN 6
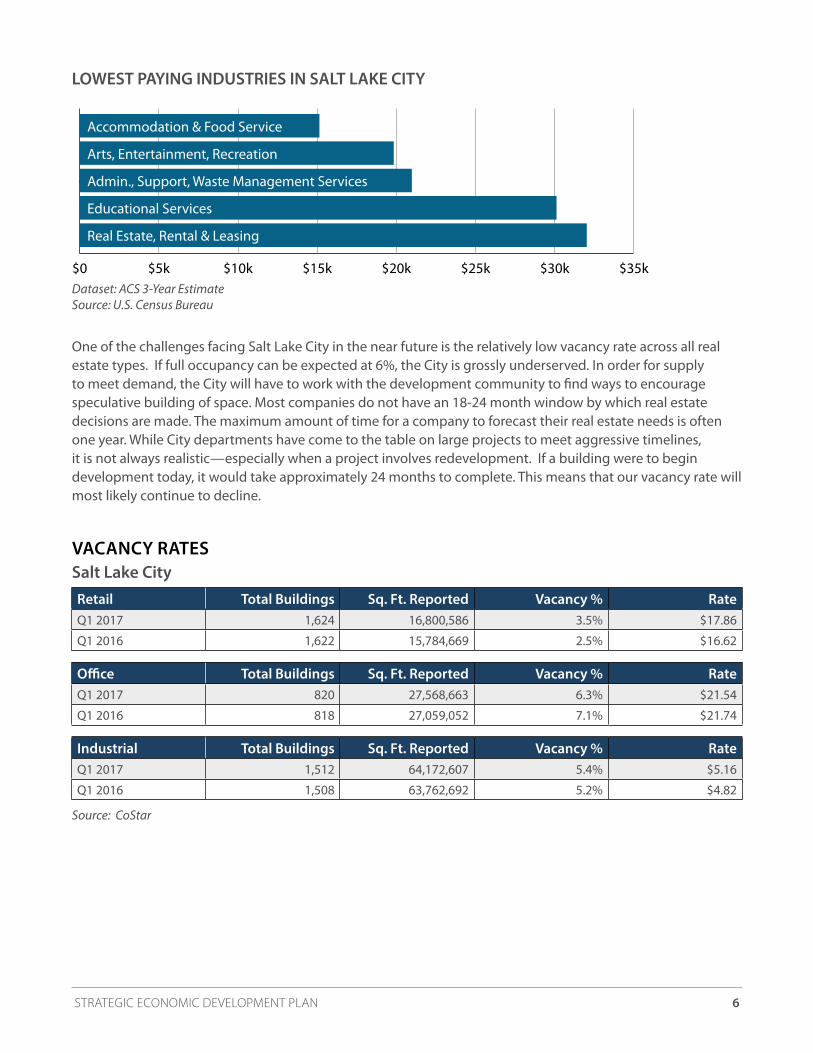
Retail Total Buildings Sq. Ft. Reported Vacancy % RateQ1 2017 1,624 16,800,586 3.5% $17.86
Q1 2016 1,622 15,784,669 2.5% $16.62
Office Total Buildings Sq. Ft. Reported Vacancy % RateQ1 2017 820 27,568,663 6.3% $21.54
Q1 2016 818 27,059,052 7.1% $21.74
Industrial Total Buildings Sq. Ft. Reported Vacancy % RateQ1 2017 1,512 64,172,607 5.4% $5.16
Q1 2016 1,508 63,762,692 5.2% $4.82
Source: CoStar
VACANCY RATESSalt Lake City
Dataset: ACS 3-Year Estimate Source: U.S. Census Bureau
LOWEST PAYING INDUSTRIES IN SALT LAKE CITY
$0 $10k $20k $30k $40k $50k $60k
Finance & Insurance
Management of Companies & Enterprises
Professional, Scienti�c, Tech Services
Utilities
Mining, Quarrying, Oil, Gas Extraction
$0 $5k $10k $15k $20k $25k $30k $35k
Accommodation & Food Service
Arts, Entertainment, Recreation
Admin., Support, Waste Management Services
Educational Services
Real Estate, Rental & Leasing
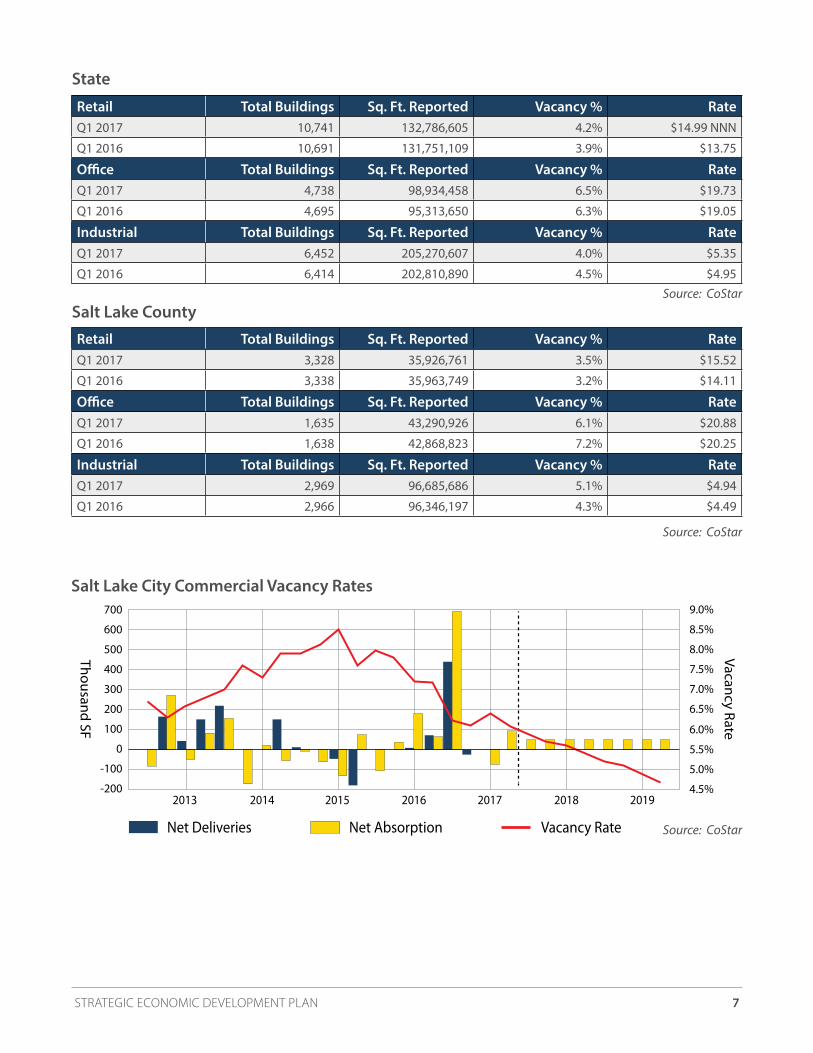
One of the challenges facing Salt Lake City in the near future is the relatively low vacancy rate across all real estate types. If full occupancy can be expected at 6%, the City is grossly underserved. In order for supply to meet demand, the City will have to work with the development community to find ways to encourage speculative building of space. Most companies do not have an 18-24 month window by which real estate decisions are made. The maximum amount of time for a company to forecast their real estate needs is often one year. While City departments have come to the table on large projects to meet aggressive timelines, it is not always realistic—especially when a project involves redevelopment. If a building were to begin development today, it would take approximately 24 months to complete. This means that our vacancy rate will most likely continue to decline.
STRATEGIC ECONOMIC DEVELOPMENT PLAN 7
700
600
500
400
300
200
100
0
-100
-200
9.0%
8.5%
8.0%
7.5%
7.0%
6.5%
6.0%
5.5%
5.0%
4.5%
Vacancy Rate
Thousand SF
Net Deliveries Net Absorption Vacancy Rate
2013 2014 2015 2016 2017 2018 2019
Retail Total Buildings Sq. Ft. Reported Vacancy % RateQ1 2017 10,741 132,786,605 4.2% $14.99 NNN
Q1 2016 10,691 131,751,109 3.9% $13.75
Office Total Buildings Sq. Ft. Reported Vacancy % RateQ1 2017 4,738 98,934,458 6.5% $19.73
Q1 2016 4,695 95,313,650 6.3% $19.05
Industrial Total Buildings Sq. Ft. Reported Vacancy % RateQ1 2017 6,452 205,270,607 4.0% $5.35
Q1 2016 6,414 202,810,890 4.5% $4.95
Retail Total Buildings Sq. Ft. Reported Vacancy % RateQ1 2017 3,328 35,926,761 3.5% $15.52
Q1 2016 3,338 35,963,749 3.2% $14.11
Office Total Buildings Sq. Ft. Reported Vacancy % RateQ1 2017 1,635 43,290,926 6.1% $20.88
Q1 2016 1,638 42,868,823 7.2% $20.25
Industrial Total Buildings Sq. Ft. Reported Vacancy % RateQ1 2017 2,969 96,685,686 5.1% $4.94
Q1 2016 2,966 96,346,197 4.3% $4.49
Source: CoStar
Source: CoStar
Source: CoStar
State
Salt Lake County
Salt Lake City Commercial Vacancy Rates
STRATEGIC ECONOMIC DEVELOPMENT PLAN 8
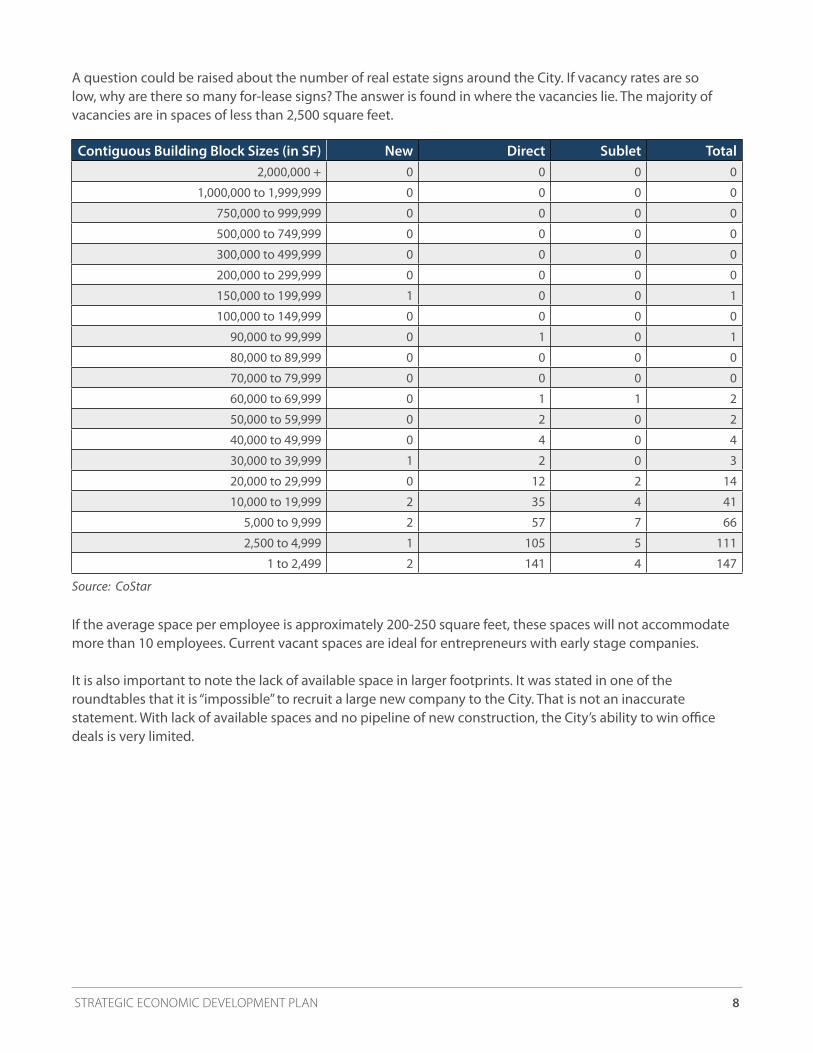
A question could be raised about the number of real estate signs around the City. If vacancy rates are so low, why are there so many for-lease signs? The answer is found in where the vacancies lie. The majority of vacancies are in spaces of less than 2,500 square feet.
If the average space per employee is approximately 200-250 square feet, these spaces will not accommodate more than 10 employees. Current vacant spaces are ideal for entrepreneurs with early stage companies.
It is also important to note the lack of available space in larger footprints. It was stated in one of the roundtables that it is “impossible” to recruit a large new company to the City. That is not an inaccurate statement. With lack of available spaces and no pipeline of new construction, the City’s ability to win office deals is very limited.
Contiguous Building Block Sizes (in SF) New Direct Sublet Total2,000,000 + 0 0 0 0
1,000,000 to 1,999,999 0 0 0 0
750,000 to 999,999 0 0 0 0
500,000 to 749,999 0 0 0 0
300,000 to 499,999 0 0 0 0
200,000 to 299,999 0 0 0 0
150,000 to 199,999 1 0 0 1
100,000 to 149,999 0 0 0 0
90,000 to 99,999 0 1 0 1
80,000 to 89,999 0 0 0 0
70,000 to 79,999 0 0 0 0
60,000 to 69,999 0 1 1 2
50,000 to 59,999 0 2 0 2
40,000 to 49,999 0 4 0 4
30,000 to 39,999 1 2 0 3
20,000 to 29,999 0 12 2 14
10,000 to 19,999 2 35 4 41
5,000 to 9,999 2 57 7 66
2,500 to 4,999 1 105 5 111
1 to 2,499 2 141 4 147
Source: CoStar
STRATEGIC ECONOMIC DEVELOPMENT PLAN 9
0
10,000
20,000
30,000
40,000
50,000
<5 5-17 18-24 25-34 35-44 45-54 55-59 60-61 62-64 65-74 75+
Age in Salt Lake City
Source: DataUSA
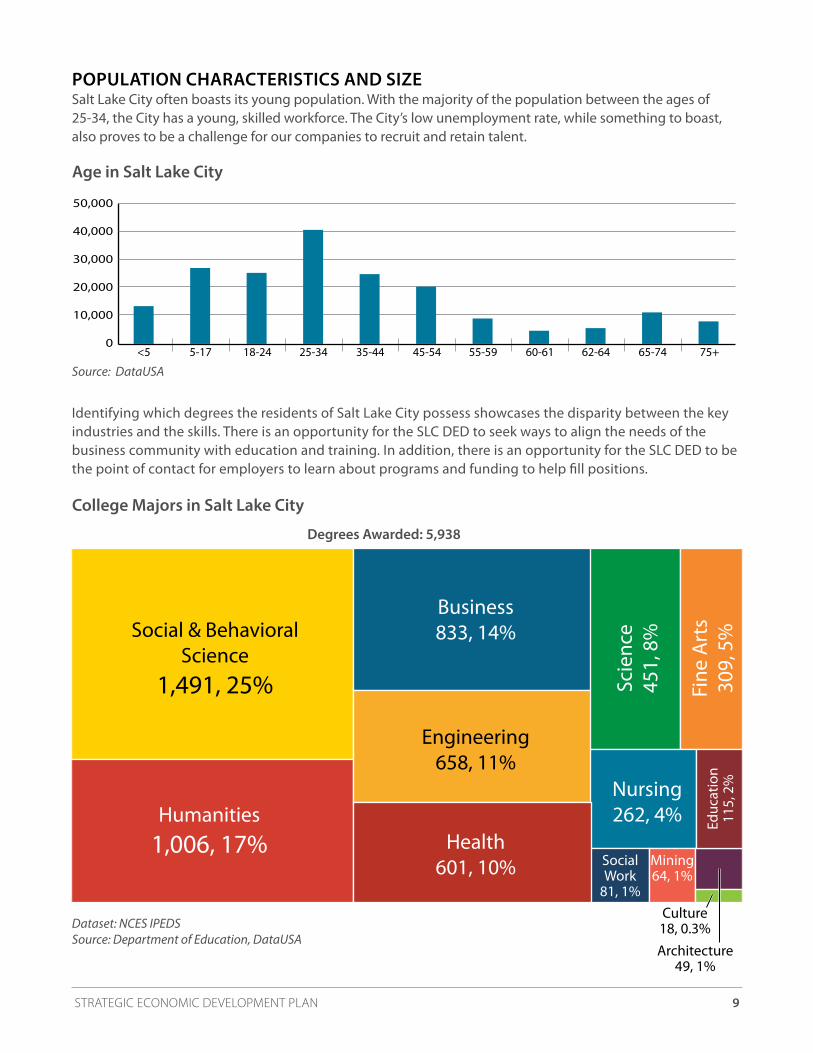
POPULATION CHARACTERISTICS AND SIZESalt Lake City often boasts its young population. With the majority of the population between the ages of 25-34, the City has a young, skilled workforce. The City’s low unemployment rate, while something to boast, also proves to be a challenge for our companies to recruit and retain talent.
Identifying which degrees the residents of Salt Lake City possess showcases the disparity between the key industries and the skills. There is an opportunity for the SLC DED to seek ways to align the needs of the business community with education and training. In addition, there is an opportunity for the SLC DED to be the point of contact for employers to learn about programs and funding to help fill positions.
Social & BehavioralScience
1,491, 25%
Humanities1,006, 17% Health
601, 10% SocialWork
81, 1%
Mining64, 1%
Culture18, 0.3%Architecture
49, 1%
Engineering658, 11%
Business833, 14%
Scie
nce
451,
8%
Fine
Art
s30
9, 5
%
Nursing262, 4% Ed
ucat
ion
115,
2%
College Majors in Salt Lake City
Dataset: NCES IPEDS Source: Department of Education, DataUSA
Degrees Awarded: 5,938
STRATEGIC ECONOMIC DEVELOPMENT PLAN 10
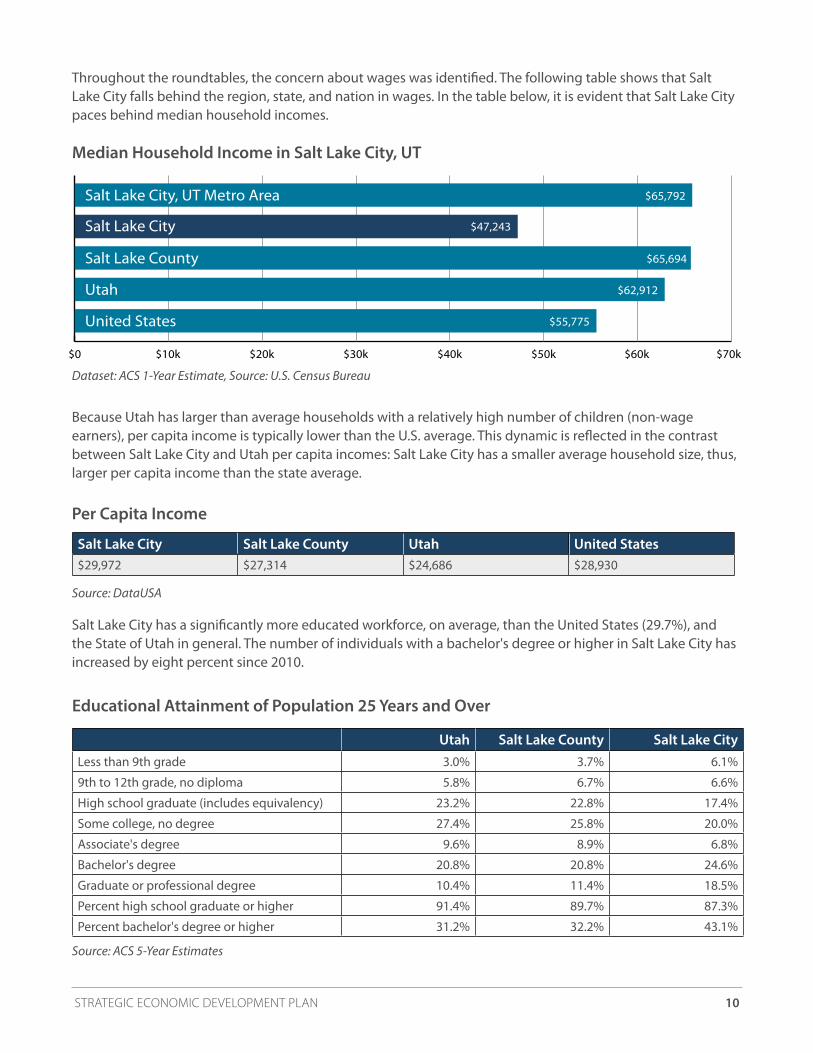
Median Household Income in Salt Lake City, UT
Dataset: ACS 1-Year Estimate, Source: U.S. Census Bureau
$0 $10k $20k $30k $40k $50k $60k $70k
Salt Lake City, UT Metro Area
United States
Utah
Salt Lake County
Salt Lake City
$65,792
$55,775
$62,912
$65,694
$47,243
Source: DataUSA
Per Capita Income
Salt Lake City Salt Lake County Utah United States$29,972 $27,314 $24,686 $28,930
Source: ACS 5-Year Estimates
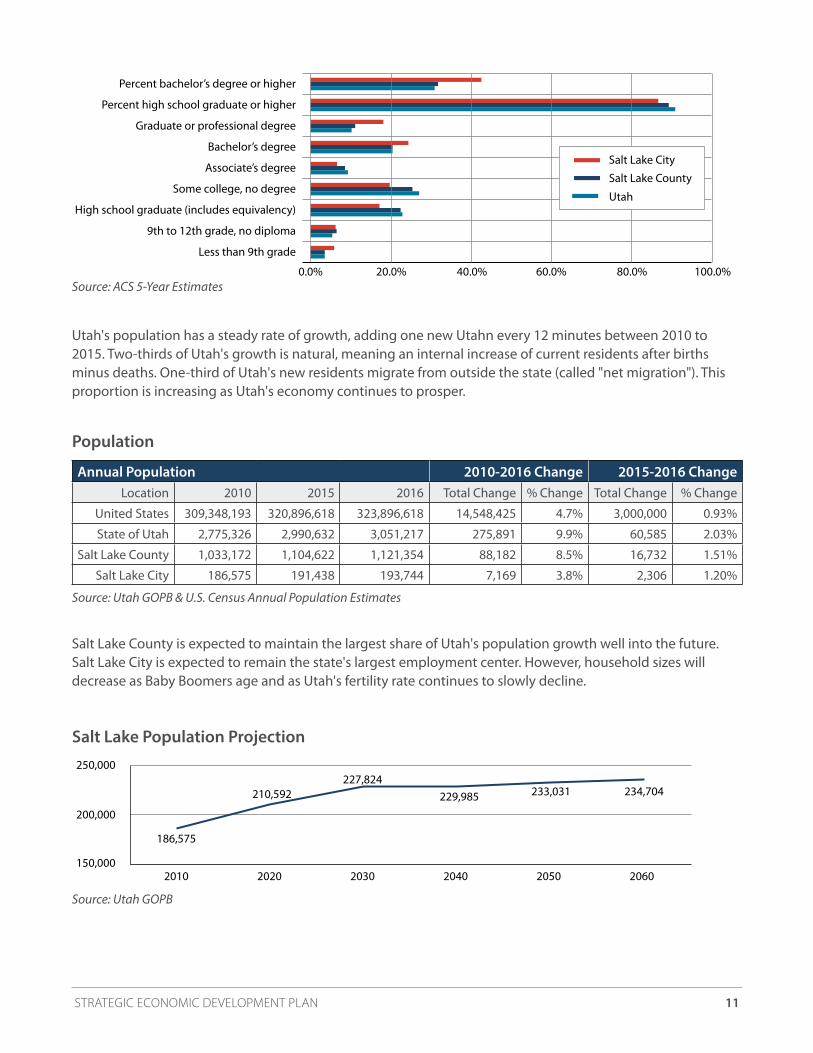
Utah Salt Lake County Salt Lake CityLess than 9th grade 3.0% 3.7% 6.1%
9th to 12th grade, no diploma 5.8% 6.7% 6.6%
High school graduate (includes equivalency) 23.2% 22.8% 17.4%
Some college, no degree 27.4% 25.8% 20.0%
Associate's degree 9.6% 8.9% 6.8%
Bachelor's degree 20.8% 20.8% 24.6%
Graduate or professional degree 10.4% 11.4% 18.5%
Percent high school graduate or higher 91.4% 89.7% 87.3%
Percent bachelor's degree or higher 31.2% 32.2% 43.1%
Educational Attainment of Population 25 Years and Over
Throughout the roundtables, the concern about wages was identified. The following table shows that Salt Lake City falls behind the region, state, and nation in wages. In the table below, it is evident that Salt Lake City paces behind median household incomes.
Because Utah has larger than average households with a relatively high number of children (non-wage earners), per capita income is typically lower than the U.S. average. This dynamic is reflected in the contrast between Salt Lake City and Utah per capita incomes: Salt Lake City has a smaller average household size, thus, larger per capita income than the state average.
Salt Lake City has a significantly more educated workforce, on average, than the United States (29.7%), and the State of Utah in general. The number of individuals with a bachelor's degree or higher in Salt Lake City has increased by eight percent since 2010.
STRATEGIC ECONOMIC DEVELOPMENT PLAN 11
Percent bachelor’s degree or higher
Percent high school graduate or higher
High school graduate (includes equivalency)
Graduate or professional degree
Bachelor’s degree
Associate’s degree
Some college, no degree
9th to 12th grade, no diploma
Less than 9th grade
0.0% 20.0% 40.0% 60.0% 80.0% 100.0%
Salt Lake City
Salt Lake County
Utah
Source: ACS 5-Year Estimates
Utah's population has a steady rate of growth, adding one new Utahn every 12 minutes between 2010 to 2015. Two-thirds of Utah's growth is natural, meaning an internal increase of current residents after births minus deaths. One-third of Utah's new residents migrate from outside the state (called "net migration"). This proportion is increasing as Utah's economy continues to prosper.
Salt Lake County is expected to maintain the largest share of Utah's population growth well into the future. Salt Lake City is expected to remain the state's largest employment center. However, household sizes will decrease as Baby Boomers age and as Utah's fertility rate continues to slowly decline.
Source: Utah GOPB & U.S. Census Annual Population Estimates
Population
Annual Population 2010-2016 Change 2015-2016 ChangeLocation 2010 2015 2016 Total Change % Change Total Change % Change
United States 309,348,193 320,896,618 323,896,618 14,548,425 4.7% 3,000,000 0.93%
State of Utah 2,775,326 2,990,632 3,051,217 275,891 9.9% 60,585 2.03%
Salt Lake County 1,033,172 1,104,622 1,121,354 88,182 8.5% 16,732 1.51%
Salt Lake City 186,575 191,438 193,744 7,169 3.8% 2,306 1.20%
Source: Utah GOPB
Salt Lake Population Projection
250,000
150,0002010
186,575
210,592227,824
229,985 233,031 234,704
2020 2030 2040 2050 2060
200,000
STRATEGIC ECONOMIC DEVELOPMENT PLAN 12
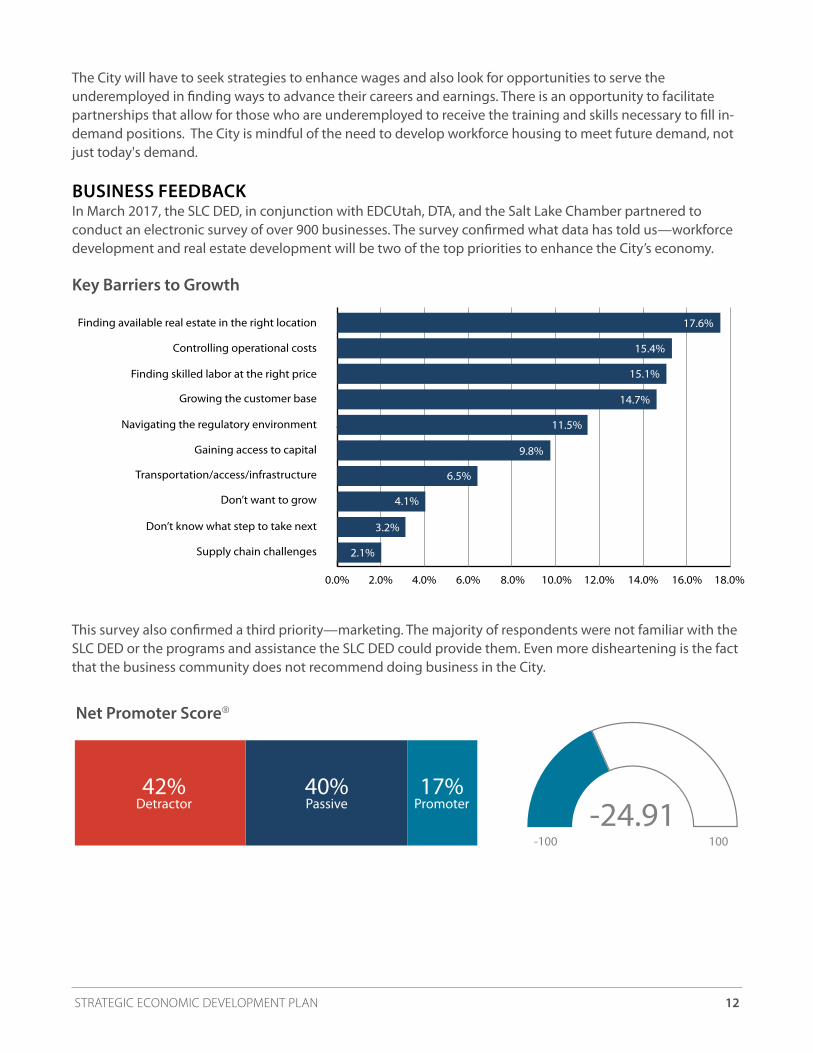
Key Barriers to Growth
The City will have to seek strategies to enhance wages and also look for opportunities to serve the underemployed in finding ways to advance their careers and earnings. There is an opportunity to facilitate partnerships that allow for those who are underemployed to receive the training and skills necessary to fill in-demand positions. The City is mindful of the need to develop workforce housing to meet future demand, not just today's demand.
0.0% 2.0% 10.0%8.0%6.0%4.0% 14.0%12.0% 16.0% 18.0%
17.6%Finding available real estate in the right location
15.4%Controlling operational costs
4.1%Don’t want to grow
Finding skilled labor at the right price 15.1%
Navigating the regulatory environment 11.5%
Gaining access to capital 9.8%
Growing the customer base 14.7%
Supply chain challenges 2.1%
Transportation/access/infrastructure 6.5%
Don’t know what step to take next 3.2%
This survey also confirmed a third priority—marketing. The majority of respondents were not familiar with the SLC DED or the programs and assistance the SLC DED could provide them. Even more disheartening is the fact that the business community does not recommend doing business in the City.
42%Detractor
40%Passive
17%Promoter -24.91
-100 100
Net Promoter Score®
BUSINESS FEEDBACKIn March 2017, the SLC DED, in conjunction with EDCUtah, DTA, and the Salt Lake Chamber partnered to conduct an electronic survey of over 900 businesses. The survey confirmed what data has told us—workforce development and real estate development will be two of the top priorities to enhance the City’s economy.
STRATEGIC ECONOMIC DEVELOPMENT PLAN 13
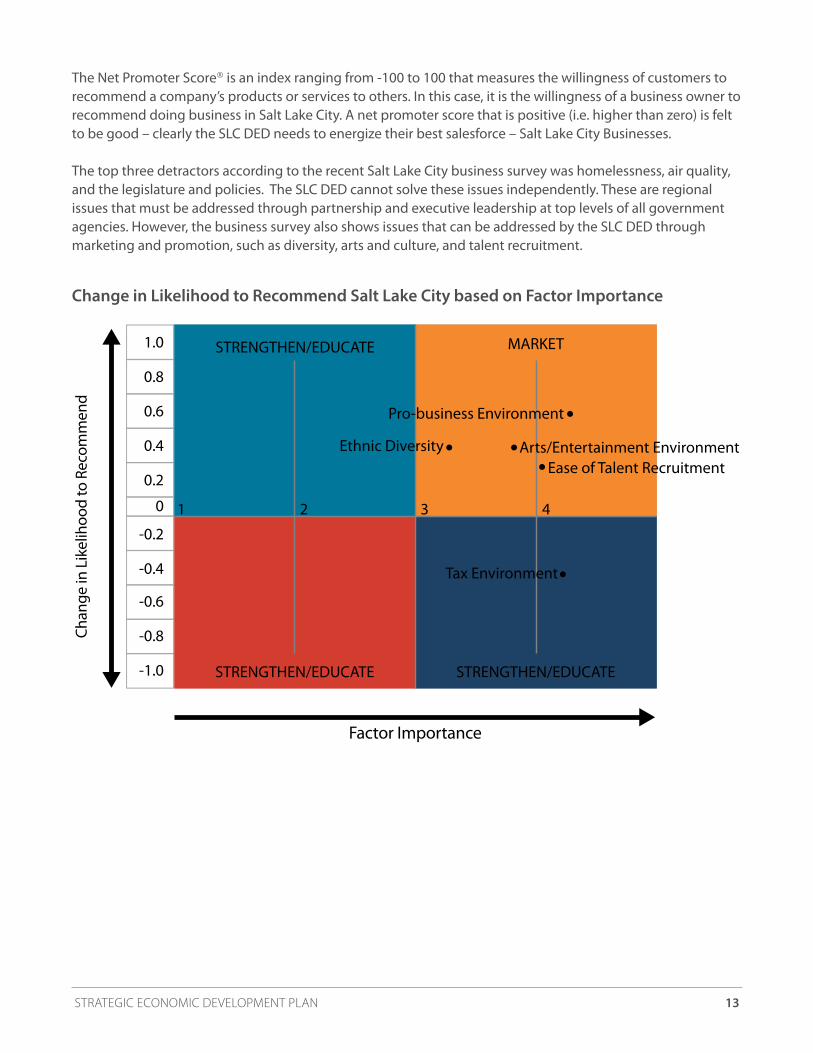
The Net Promoter Score® is an index ranging from -100 to 100 that measures the willingness of customers to recommend a company’s products or services to others. In this case, it is the willingness of a business owner to recommend doing business in Salt Lake City. A net promoter score that is positive (i.e. higher than zero) is felt to be good – clearly the SLC DED needs to energize their best salesforce – Salt Lake City Businesses.
The top three detractors according to the recent Salt Lake City business survey was homelessness, air quality, and the legislature and policies. The SLC DED cannot solve these issues independently. These are regional issues that must be addressed through partnership and executive leadership at top levels of all government agencies. However, the business survey also shows issues that can be addressed by the SLC DED through marketing and promotion, such as diversity, arts and culture, and talent recruitment.
Change in Likelihood to Recommend Salt Lake City based on Factor Importance
Factor Importance
Chan
ge in
Lik
elih
ood
to R
ecom
men
d
STRENGTHEN/EDUCATESTRENGTHEN/EDUCATE
MARKETSTRENGTHEN/EDUCATE
1 2 3 4
Pro-business Environment
Ethnic Diversity
1.0
0.8
0.6
0.4
0.2
-0.2
0
-0.4
-0.6
-0.8
-1.0
Arts/Entertainment EnvironmentEase of Talent Recruitment
Tax Environment
STRATEGIC ECONOMIC DEVELOPMENT PLAN 14
BEST PRACTICES Salt Lake City Department of Economic Development Organizational Best PracticesEconomic development is vital to the well-being and long-term sustainability of a community because it increases the quality of life for residents through job creation, increased wages, broader access to goods and services, and an enhanced tax base. A successful economic development strategy begins within the organization. To that end, the Department of Economic Development partnered with Lewis and Young to review what the best economic development organizations do well and how their best practices translate to Salt Lake City. While most of the policies outlined below are operational, those that are not will ultimately be recommended to Council for consideration. Review other City department’s policies and initiatives related to economic development – The SLC DED should have a working knowledge of the cost and process of doing business in the City (property taxes, utility rates, building license, permit fees, etc.). Ensuring competitive business costs with other local municipalities is crucial to economic development success. Public officials are ambassadors of economic development – Elected officials should champion economic development and the efforts of the SLC DED. Elected leaders can make a significant difference with existing businesses and advocating the City to new businesses. They need to know the local economic strengths and weaknesses, the department’s vision and goals, the department’s stakeholders and partners, the local regulatory environment, and the needs of the local business community. This is best achieved through regular city council updates, where staff provide updates on the current economic development department’s projects. This report should include talking points on each project, so that the city council may help champion economic development in the city. Establish an inclusive economic development policy – Inclusive economic development includes strategies that improve economic opportunity for all, with a focus on disadvantaged residents. These strategies may include attracting new businesses to underserved neighborhoods, creating programs that connect at-risk youth to workforce training in high-paying industries, entrepreneurship education to low-income individuals, women and minority populations. Economic development funding sources – Most local government’s budget for economic development activities using the city’s general fund (property taxes, sales tax, etc.) or redevelopment agency fund (tax increment) for certain projects. Local incentives may also directly or indirectly fund economic development. It is important that public officials and staff be familiar with all of funding options available, including:• State Resources – Economic Development Tax Increment Financing (EDTIF), Industrial Assistance Fund
(IAF), Utah Microenterprise Loan Fund (UMLF), etc.• Federal Resources – Community Development Block Grant (CDBG), Home Investment Partnership
Program, etc. Having a policy that supports public–private partnerships through dovetailing local incentives with state and federal incentives is critical to generating revenue needed for economic development. Coordinating with other departments and their resources will be valuable in this effort.
STRATEGIC ECONOMIC DEVELOPMENT PLAN 15
Workforce and education policy – Develop relationships and partnerships with the Salt Lake City School District (the “School District”), the Salt Lake Community College, the University of Utah, other local institutions of higher education, and the Division of Workforce Services. Implement career tracks and other relevant programs that focus on skills from key industries in the City. Ensure that the School District offers Career and Technical Education (CTE), especially the Information Technology Education and Technology and Engineering Education Programs. Encourage local businesses to provide internships to local college and high school students. Business incentive policy – Focus business assistance efforts first on retention, second expansion, and third recruitment of businesses. Existing businesses are usually a city’s greatest resource for attracting new jobs and investment, and a great ally in advocating our community to new business prospects. Identify key business clusters and adopt policy(s) that focus resources for business development on supporting and expanding these businesses clusters. Technology innovation & infrastructure – Encourage and promote investment in public infrastructure (transportation, transit, water, sewer, telecommunications and information technology) in order to promote the expansion of business and commerce. Promote innovation. Promote a diverse transportation system (walking, cycling, transit), urban parks, and natural areas as amenities that an educated, talented and dynamic workforce find desirable. Use desirable amenities for talent recruitment. Sustainability – Salt Lake City is a leader in sustainability efforts within the State of Utah. The City’s focus on sustainability is an economic asset and an advantage over peer cities in Utah and other states. Focusing on business development through commercializing sustainability practices, products and services will strengthen the local economy and the City’s sustainability efforts. Neighborhood development – Small businesses are key to economic strength. They offer diverse potential to improve job growth, raise wage levels and support community self-sufficiency. Focusing on commercial revitalization and business development tools to drive growth in neighborhoods will help local businesses compete in the regional economy and spur commercial activity and revitalization in underserved neighborhoods. Expand partnerships with community based organizations, foundations, and financial institutions to leverage more public and private investments in neighborhood developments. Follow up on goals and objectives outlined in strategic plan – Hold regular meetings to update the economic-development team, stakeholders and elected officials on the status of the strategic plan goals and action items.
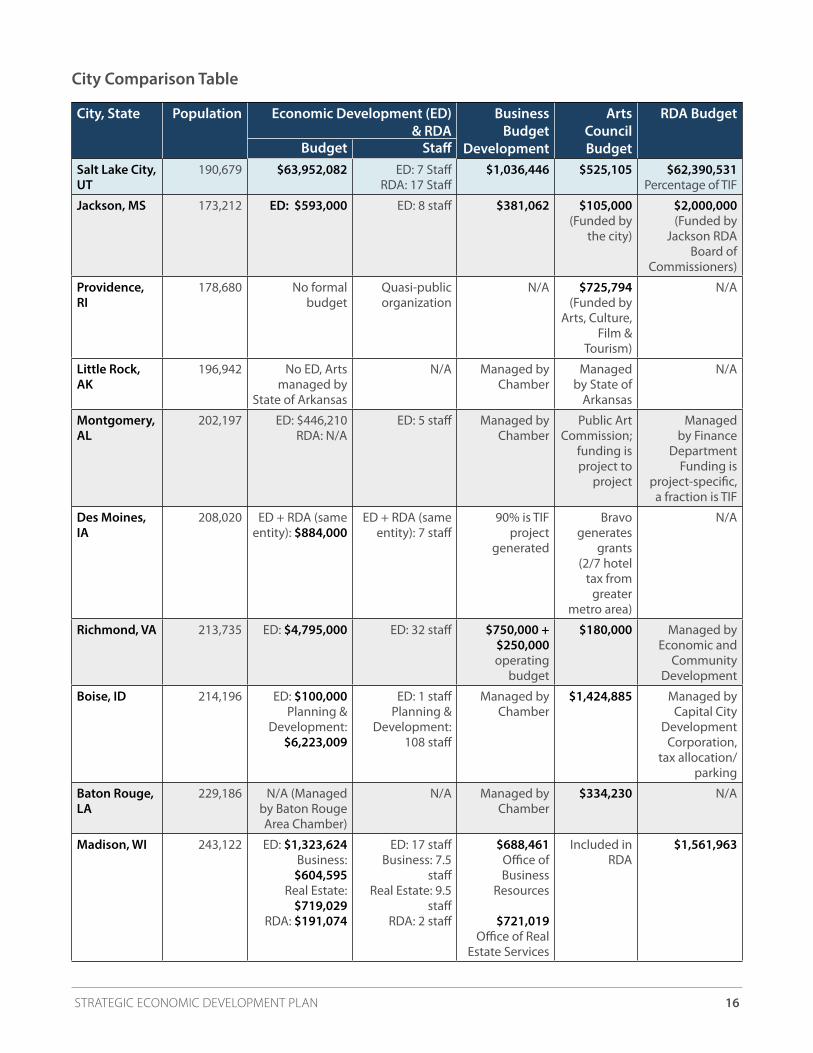
COMPARISONOften Salt Lake City is compared to other communities. However, the comparison cities, such as Seattle, Portland, Reno, and Austin have few similarities to Salt Lake City. It is more appropriate to compare Salt Lake City to like communities that are state capitols and have a large university presence. The following table shows those communities alongside Salt Lake City as it relates to their economic development, redevelopment, and arts and culture efforts.
STRATEGIC ECONOMIC DEVELOPMENT PLAN 16
City, State Population Economic Development (ED) & RDA
Business Budget
Development
Arts Council Budget
RDA Budget
Salt Lake City, UT
190,679 $63,952,082 ED: 7 Staff RDA: 17 Staff
$1,036,446 $525,105 $62,390,531Percentage of TIF
Jackson, MS 173,212 ED: $593,000 ED: 8 staff $381,062 $105,000 (Funded by
the city)
$2,000,000(Funded by
Jackson RDA Board of
Commissioners)
Providence, RI
178,680 No formal budget
Quasi-public organization
N/A $725,794 (Funded by
Arts, Culture, Film &
Tourism)
N/A
Little Rock, AK
196,942 No ED, Arts managed by
State of Arkansas
N/A Managed by Chamber
Managed by State of
Arkansas
N/A
Montgomery, AL
202,197 ED: $446,210 RDA: N/A
ED: 5 staff Managed by Chamber
Public Art Commission;
funding is project to
project
Managed by Finance
DepartmentFunding is
project-specific, a fraction is TIF
Des Moines, IA
208,020 ED + RDA (same entity): $884,000
ED + RDA (same entity): 7 staff
90% is TIF project
generated
Bravo generates
grants(2/7 hotel
tax from greater
metro area)
N/A
Richmond, VA 213,735 ED: $4,795,000 ED: 32 staff $750,000 + $250,000 operating
budget
$180,000 Managed by Economic and
Community Development
Boise, ID 214,196 ED: $100,000 Planning &
Development: $6,223,009
ED: 1 staffPlanning &
Development: 108 staff
Managed by Chamber
$1,424,885 Managed by Capital City
Development Corporation,
tax allocation/parking
Baton Rouge, LA
229,186 N/A (Managed by Baton Rouge Area Chamber)
N/A Managed by Chamber
$334,230 N/A
Madison, WI 243,122 ED: $1,323,624Business:
$604,595Real Estate:
$719,029RDA: $191,074
ED: 17 staffBusiness: 7.5
staffReal Estate: 9.5
staffRDA: 2 staff
$688,461 Office of Business
Resources
$721,019 Office of Real
Estate Services
Included in RDA
$1,561,963
Budget Staff
City Comparison Table
STRATEGIC ECONOMIC DEVELOPMENT PLAN 17
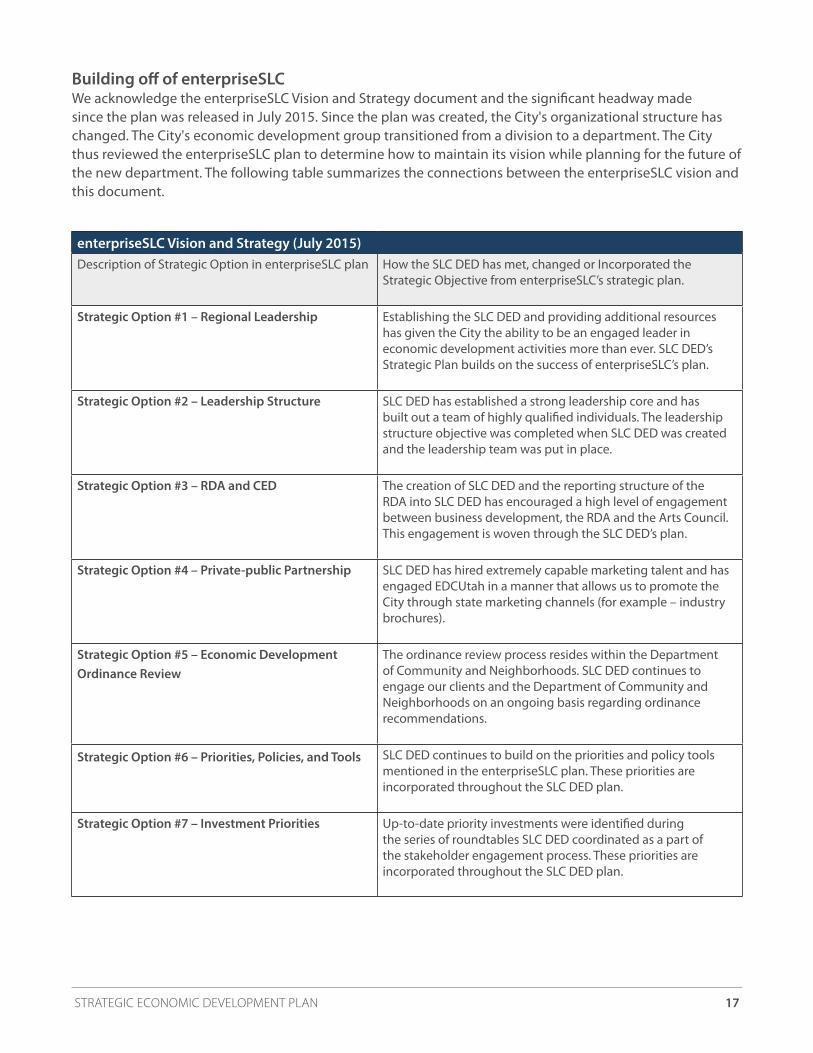
enterpriseSLC Vision and Strategy (July 2015)Description of Strategic Option in enterpriseSLC plan How the SLC DED has met, changed or Incorporated the
Strategic Objective from enterpriseSLC’s strategic plan.
Strategic Option #1 – Regional Leadership Establishing the SLC DED and providing additional resources has given the City the ability to be an engaged leader in economic development activities more than ever. SLC DED’s Strategic Plan builds on the success of enterpriseSLC’s plan.
Strategic Option #2 – Leadership Structure SLC DED has established a strong leadership core and has built out a team of highly qualified individuals. The leadership structure objective was completed when SLC DED was created and the leadership team was put in place.
Strategic Option #3 – RDA and CED The creation of SLC DED and the reporting structure of the RDA into SLC DED has encouraged a high level of engagement between business development, the RDA and the Arts Council. This engagement is woven through the SLC DED’s plan.
Strategic Option #4 – Private-public Partnership SLC DED has hired extremely capable marketing talent and has engaged EDCUtah in a manner that allows us to promote the City through state marketing channels (for example – industry brochures).
Strategic Option #5 – Economic Development Ordinance Review
The ordinance review process resides within the Department of Community and Neighborhoods. SLC DED continues to engage our clients and the Department of Community and Neighborhoods on an ongoing basis regarding ordinance recommendations.
Strategic Option #6 – Priorities, Policies, and Tools SLC DED continues to build on the priorities and policy tools mentioned in the enterpriseSLC plan. These priorities are incorporated throughout the SLC DED plan.
Strategic Option #7 – Investment Priorities Up-to-date priority investments were identified during the series of roundtables SLC DED coordinated as a part of the stakeholder engagement process. These priorities are incorporated throughout the SLC DED plan.
Building off of enterpriseSLCWe acknowledge the enterpriseSLC Vision and Strategy document and the significant headway made since the plan was released in July 2015. Since the plan was created, the City's organizational structure has changed. The City's economic development group transitioned from a division to a department. The City thus reviewed the enterpriseSLC plan to determine how to maintain its vision while planning for the future of the new department. The following table summarizes the connections between the enterpriseSLC vision and this document.
STRATEGIC ECONOMIC DEVELOPMENT PLAN 18
STRATEGIC PLAN FRAMEWORK
Upon reviewing the public input on the City’s strengths, challenges, opportunities, and threats, four key areas emerged and were used as the guiding principles for the development of the Strategic Vision. These principles are: Economic Opportunities for All, Globally Connected, Vitality, and Innovation. The SLC DED created the following vision and mission with these principles in mind. The staff then determined the core ethos they needed in order to help achieve the mission and vision.
MISSIONWe build Salt Lake City as a vibrant, beautiful, prosperous, diverse, and authentic place. We do this as a professional organization through partnerships, business development, arts and culture, place-making, revitalization, and redevelopment, while promoting the City’s many attributes.
VISIONSalt Lake City, the capital city of Utah, seeks to serve as a regional leader for commerce, culture and recreation, research and innovation, sustainability, and inclusiveness.
ETHOSThere are six core traits the staff will bring to any effort to support the Salt Lake City economy. The team intends to be:
• Accountable • Bold
• Collaborative• Engaged
• Equitable• Pioneering
STRATEGIC ECONOMIC DEVELOPMENT PLAN 19
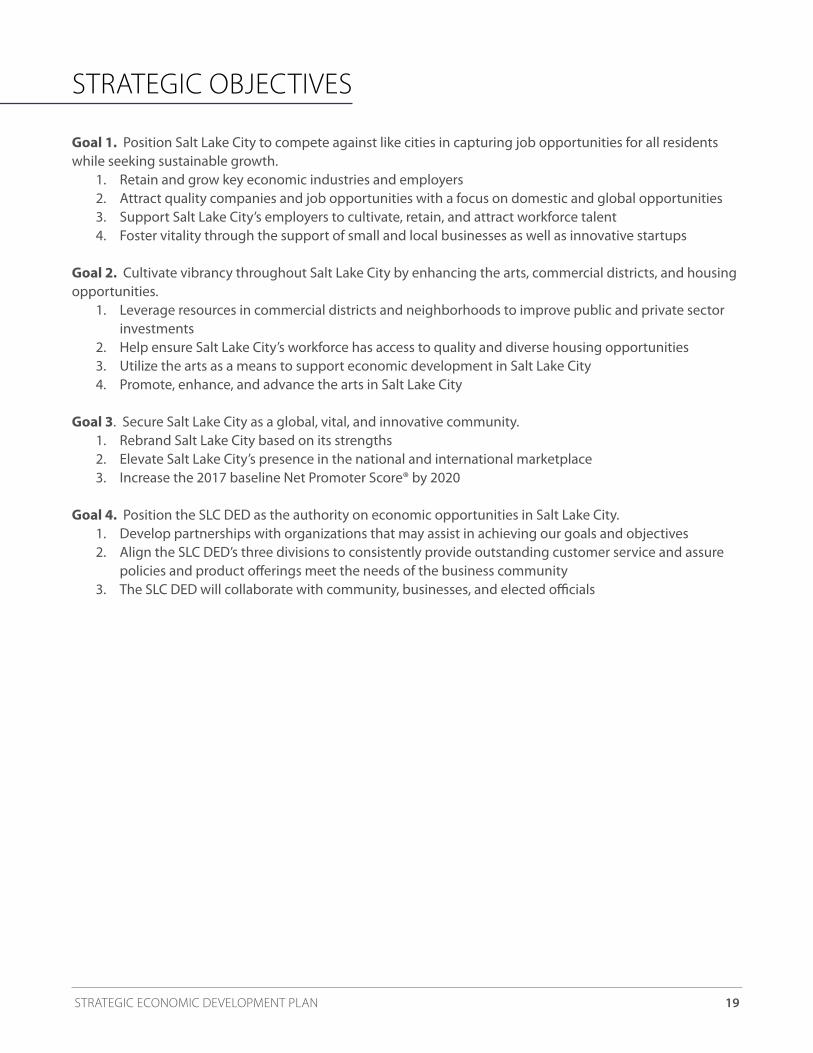
STRATEGIC OBJECTIVES
Goal 1. Position Salt Lake City to compete against like cities in capturing job opportunities for all residents while seeking sustainable growth.
1. Retain and grow key economic industries and employers2. Attract quality companies and job opportunities with a focus on domestic and global opportunities3. Support Salt Lake City’s employers to cultivate, retain, and attract workforce talent4. Foster vitality through the support of small and local businesses as well as innovative startups
Goal 2. Cultivate vibrancy throughout Salt Lake City by enhancing the arts, commercial districts, and housing opportunities.
1. Leverage resources in commercial districts and neighborhoods to improve public and private sector investments
2. Help ensure Salt Lake City’s workforce has access to quality and diverse housing opportunities 3. Utilize the arts as a means to support economic development in Salt Lake City4. Promote, enhance, and advance the arts in Salt Lake City
Goal 3. Secure Salt Lake City as a global, vital, and innovative community.
1. Rebrand Salt Lake City based on its strengths2. Elevate Salt Lake City’s presence in the national and international marketplace3. Increase the 2017 baseline Net Promoter Score® by 2020
Goal 4. Position the SLC DED as the authority on economic opportunities in Salt Lake City.1. Develop partnerships with organizations that may assist in achieving our goals and objectives2. Align the SLC DED’s three divisions to consistently provide outstanding customer service and assure
policies and product offerings meet the needs of the business community3. The SLC DED will collaborate with community, businesses, and elected officials
STRATEGIC ECONOMIC DEVELOPMENT PLAN 20
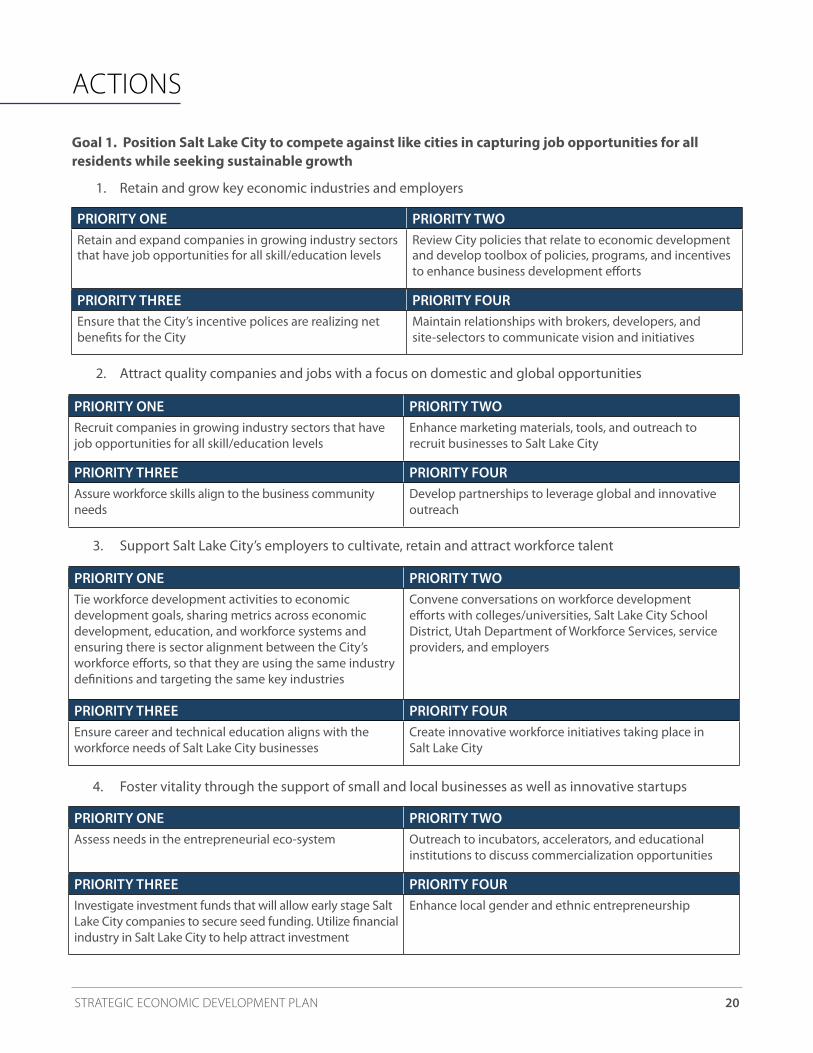
ACTIONS
Goal 1. Position Salt Lake City to compete against like cities in capturing job opportunities for all residents while seeking sustainable growth
3. Support Salt Lake City’s employers to cultivate, retain and attract workforce talent
PRIORITY ONE PRIORITY TWOTie workforce development activities to economic development goals, sharing metrics across economic development, education, and workforce systems and ensuring there is sector alignment between the City’s workforce efforts, so that they are using the same industry definitions and targeting the same key industries
Convene conversations on workforce development efforts with colleges/universities, Salt Lake City School District, Utah Department of Workforce Services, service providers, and employers
PRIORITY THREE PRIORITY FOUREnsure career and technical education aligns with the workforce needs of Salt Lake City businesses
Create innovative workforce initiatives taking place in Salt Lake City
4. Foster vitality through the support of small and local businesses as well as innovative startups
PRIORITY ONE PRIORITY TWOAssess needs in the entrepreneurial eco-system Outreach to incubators, accelerators, and educational
institutions to discuss commercialization opportunities
PRIORITY THREE PRIORITY FOURInvestigate investment funds that will allow early stage Salt Lake City companies to secure seed funding. Utilize financial industry in Salt Lake City to help attract investment
Enhance local gender and ethnic entrepreneurship
2. Attract quality companies and jobs with a focus on domestic and global opportunities
PRIORITY ONE PRIORITY TWORecruit companies in growing industry sectors that have job opportunities for all skill/education levels
Enhance marketing materials, tools, and outreach to recruit businesses to Salt Lake City
PRIORITY THREE PRIORITY FOURAssure workforce skills align to the business community needs
Develop partnerships to leverage global and innovative outreach
PRIORITY ONE PRIORITY TWORetain and expand companies in growing industry sectors that have job opportunities for all skill/education levels
Review City policies that relate to economic development and develop toolbox of policies, programs, and incentives to enhance business development efforts
PRIORITY THREE PRIORITY FOUREnsure that the City’s incentive polices are realizing net benefits for the City
Maintain relationships with brokers, developers, and site-selectors to communicate vision and initiatives
1. Retain and grow key economic industries and employers
STRATEGIC ECONOMIC DEVELOPMENT PLAN 21
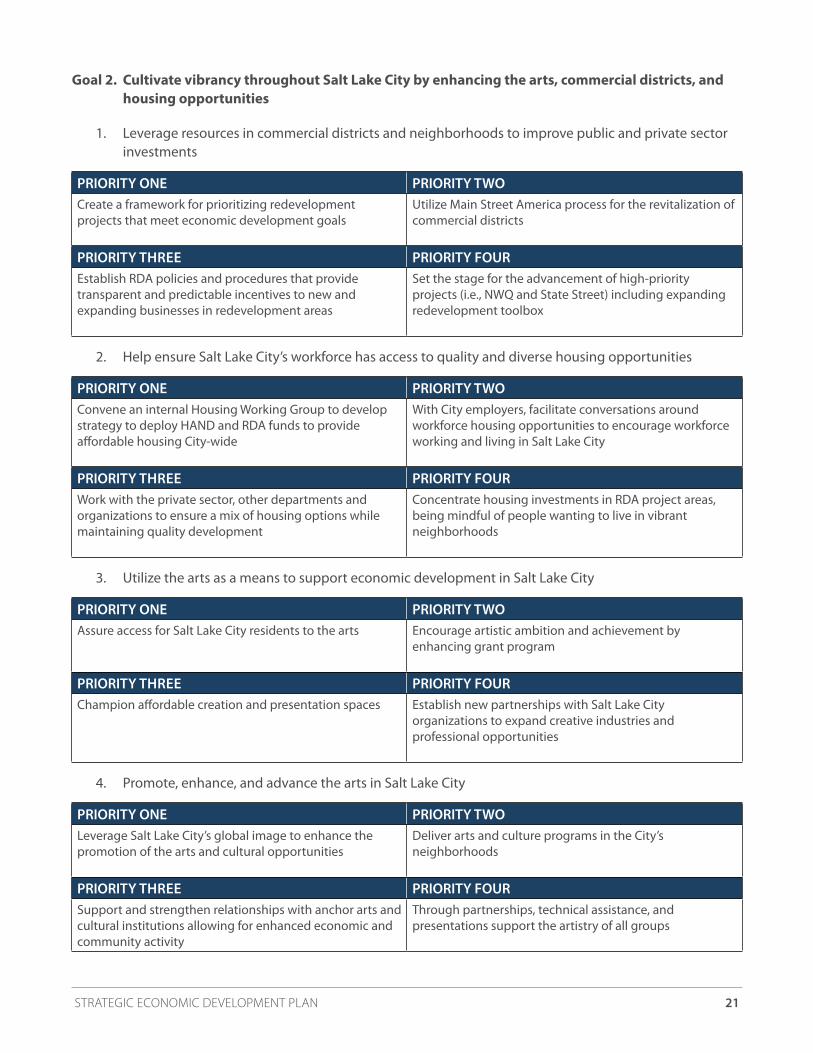
Goal 2. Cultivate vibrancy throughout Salt Lake City by enhancing the arts, commercial districts, and housing opportunities
1. Leverage resources in commercial districts and neighborhoods to improve public and private sector investments
PRIORITY ONE PRIORITY TWOCreate a framework for prioritizing redevelopment projects that meet economic development goals
Utilize Main Street America process for the revitalization of commercial districts
PRIORITY THREE PRIORITY FOUREstablish RDA policies and procedures that provide transparent and predictable incentives to new and expanding businesses in redevelopment areas
Set the stage for the advancement of high-priority projects (i.e., NWQ and State Street) including expanding redevelopment toolbox
2. Help ensure Salt Lake City’s workforce has access to quality and diverse housing opportunities
PRIORITY ONE PRIORITY TWOConvene an internal Housing Working Group to develop strategy to deploy HAND and RDA funds to provide affordable housing City-wide
With City employers, facilitate conversations around workforce housing opportunities to encourage workforce working and living in Salt Lake City
PRIORITY THREE PRIORITY FOURWork with the private sector, other departments and organizations to ensure a mix of housing options while maintaining quality development
Concentrate housing investments in RDA project areas, being mindful of people wanting to live in vibrant neighborhoods
3. Utilize the arts as a means to support economic development in Salt Lake City
PRIORITY ONE PRIORITY TWOAssure access for Salt Lake City residents to the arts Encourage artistic ambition and achievement by
enhancing grant program
PRIORITY THREE PRIORITY FOURChampion affordable creation and presentation spaces Establish new partnerships with Salt Lake City
organizations to expand creative industries and professional opportunities
4. Promote, enhance, and advance the arts in Salt Lake City
PRIORITY ONE PRIORITY TWOLeverage Salt Lake City’s global image to enhance the promotion of the arts and cultural opportunities
Deliver arts and culture programs in the City’s neighborhoods
PRIORITY THREE PRIORITY FOURSupport and strengthen relationships with anchor arts and cultural institutions allowing for enhanced economic and community activity
Through partnerships, technical assistance, and presentations support the artistry of all groups
STRATEGIC ECONOMIC DEVELOPMENT PLAN 22
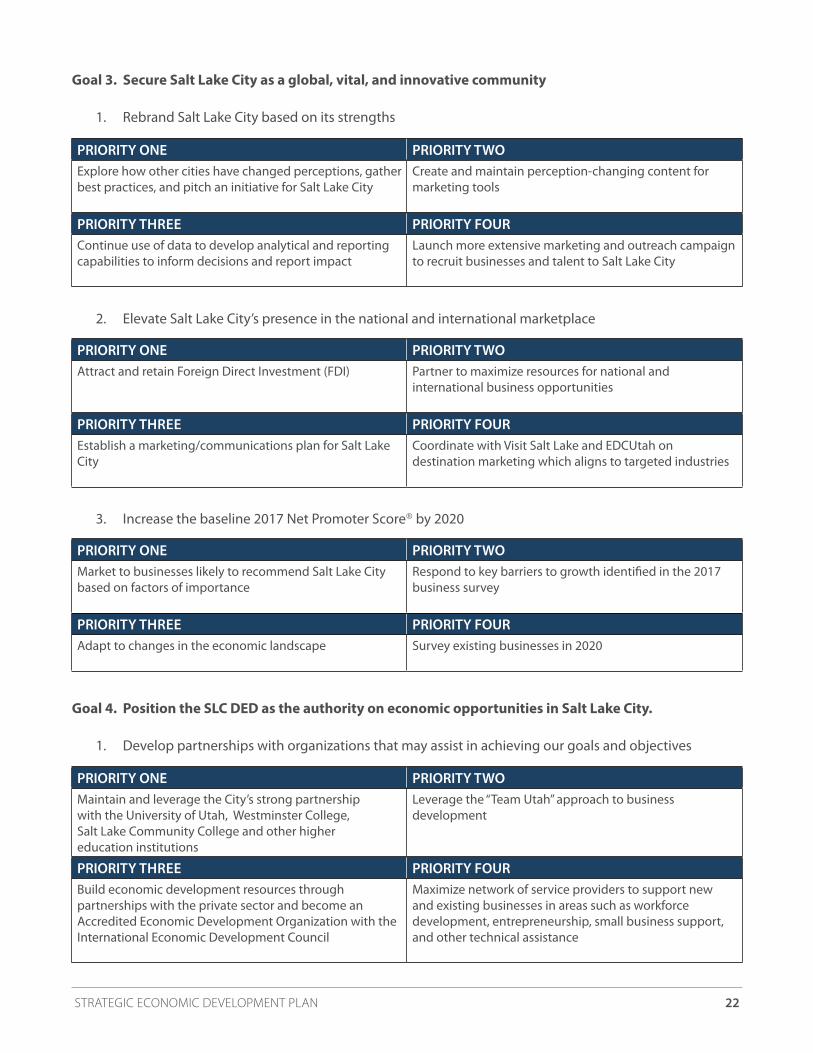
Goal 3. Secure Salt Lake City as a global, vital, and innovative community
1. Rebrand Salt Lake City based on its strengths
PRIORITY ONE PRIORITY TWOExplore how other cities have changed perceptions, gather best practices, and pitch an initiative for Salt Lake City
Create and maintain perception-changing content for marketing tools
PRIORITY THREE PRIORITY FOURContinue use of data to develop analytical and reporting capabilities to inform decisions and report impact
Launch more extensive marketing and outreach campaign to recruit businesses and talent to Salt Lake City
Goal 4. Position the SLC DED as the authority on economic opportunities in Salt Lake City.
1. Develop partnerships with organizations that may assist in achieving our goals and objectives
PRIORITY ONE PRIORITY TWOMaintain and leverage the City’s strong partnership with the University of Utah, Westminster College, Salt Lake Community College and other higher education institutions
Leverage the “Team Utah” approach to business development
PRIORITY THREE PRIORITY FOURBuild economic development resources through partnerships with the private sector and become an Accredited Economic Development Organization with the International Economic Development Council
Maximize network of service providers to support new and existing businesses in areas such as workforce development, entrepreneurship, small business support, and other technical assistance
2. Elevate Salt Lake City’s presence in the national and international marketplace
PRIORITY ONE PRIORITY TWOAttract and retain Foreign Direct Investment (FDI) Partner to maximize resources for national and
international business opportunities
PRIORITY THREE PRIORITY FOUREstablish a marketing/communications plan for Salt Lake City
Coordinate with Visit Salt Lake and EDCUtah on destination marketing which aligns to targeted industries
3. Increase the baseline 2017 Net Promoter Score® by 2020
PRIORITY ONE PRIORITY TWOMarket to businesses likely to recommend Salt Lake City based on factors of importance
Respond to key barriers to growth identified in the 2017 business survey
PRIORITY THREE PRIORITY FOURAdapt to changes in the economic landscape Survey existing businesses in 2020
STRATEGIC ECONOMIC DEVELOPMENT PLAN 23
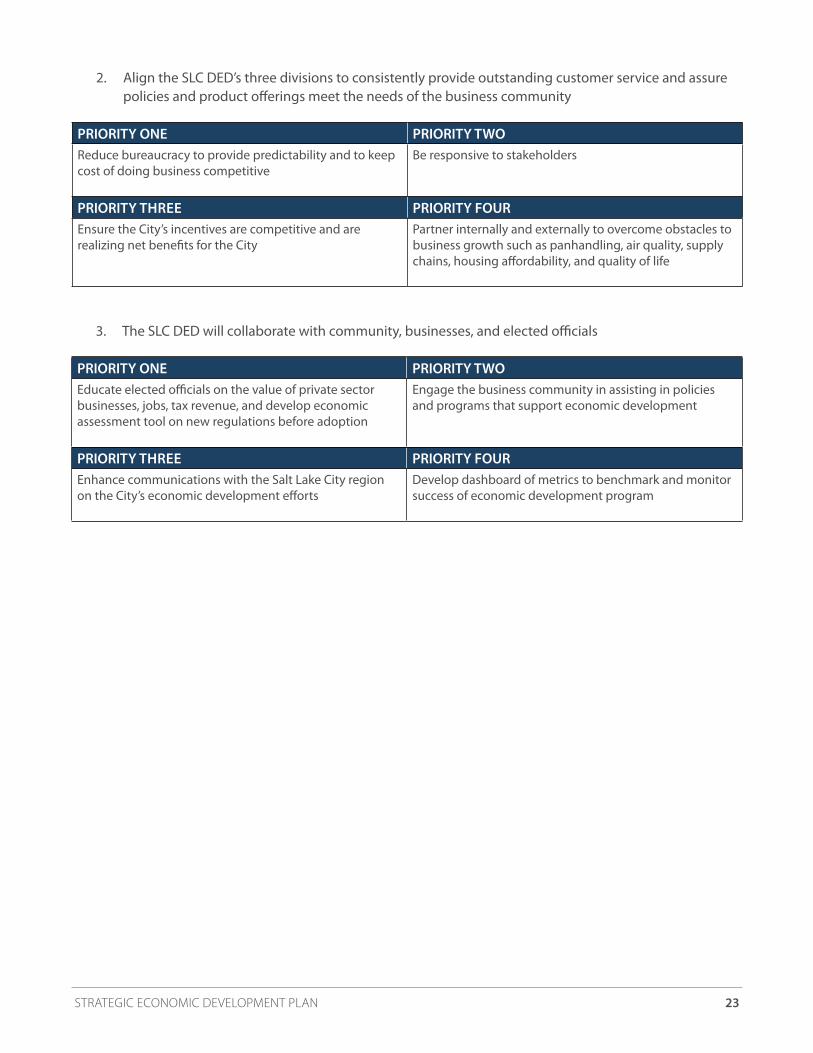
3. The SLC DED will collaborate with community, businesses, and elected officials
PRIORITY ONE PRIORITY TWOEducate elected officials on the value of private sector businesses, jobs, tax revenue, and develop economic assessment tool on new regulations before adoption
Engage the business community in assisting in policies and programs that support economic development
PRIORITY THREE PRIORITY FOUREnhance communications with the Salt Lake City region on the City’s economic development efforts
Develop dashboard of metrics to benchmark and monitor success of economic development program
2. Align the SLC DED’s three divisions to consistently provide outstanding customer service and assure policies and product offerings meet the needs of the business community
PRIORITY ONE PRIORITY TWOReduce bureaucracy to provide predictability and to keep cost of doing business competitive
Be responsive to stakeholders
PRIORITY THREE PRIORITY FOUREnsure the City’s incentives are competitive and are realizing net benefits for the City
Partner internally and externally to overcome obstacles to business growth such as panhandling, air quality, supply chains, housing affordability, and quality of life
STRATEGIC ECONOMIC DEVELOPMENT PLAN 24
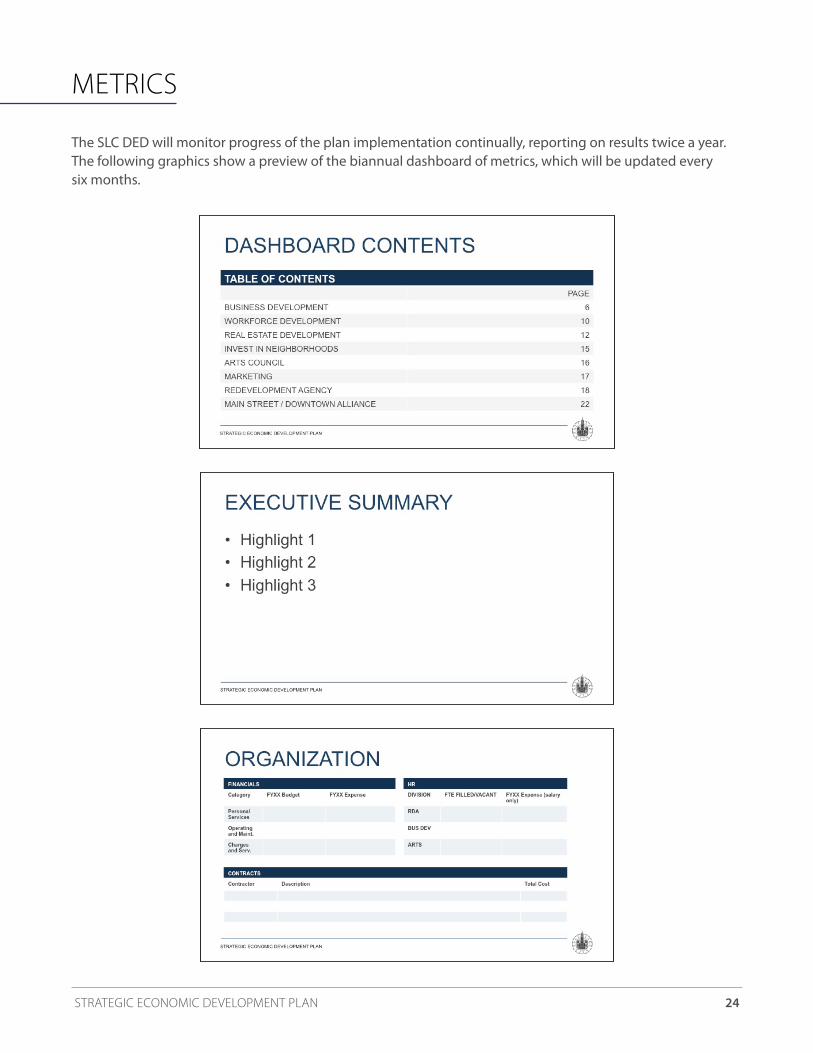
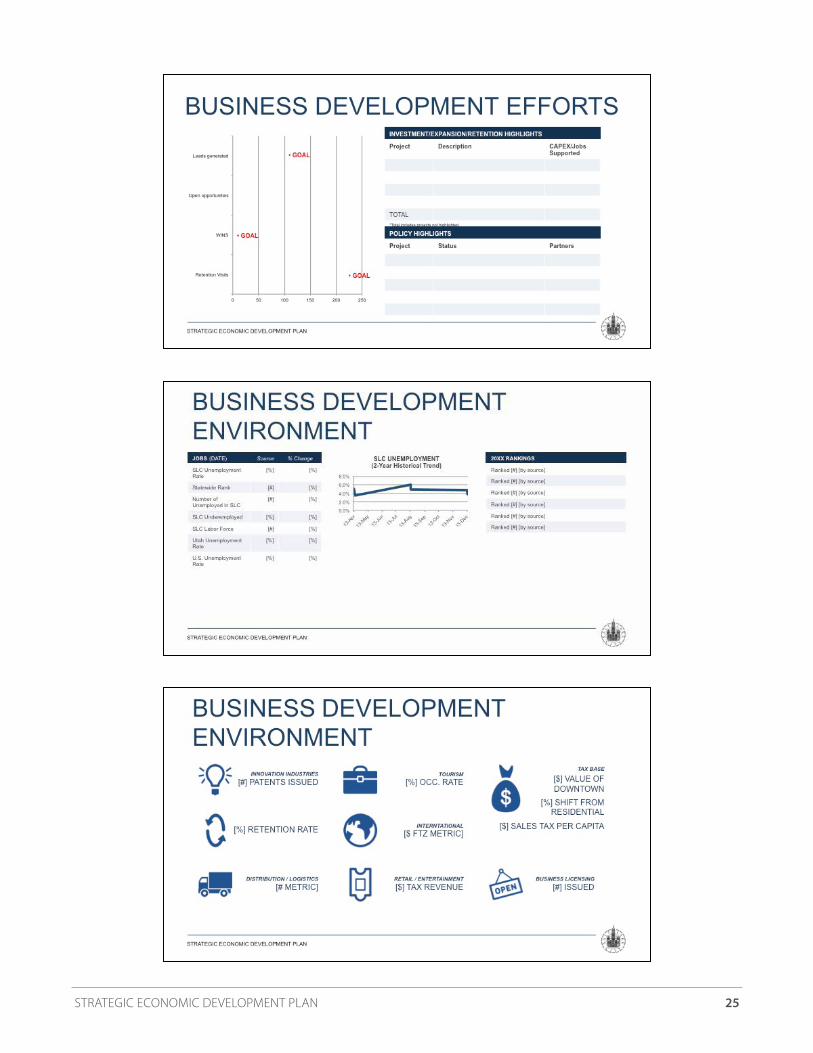
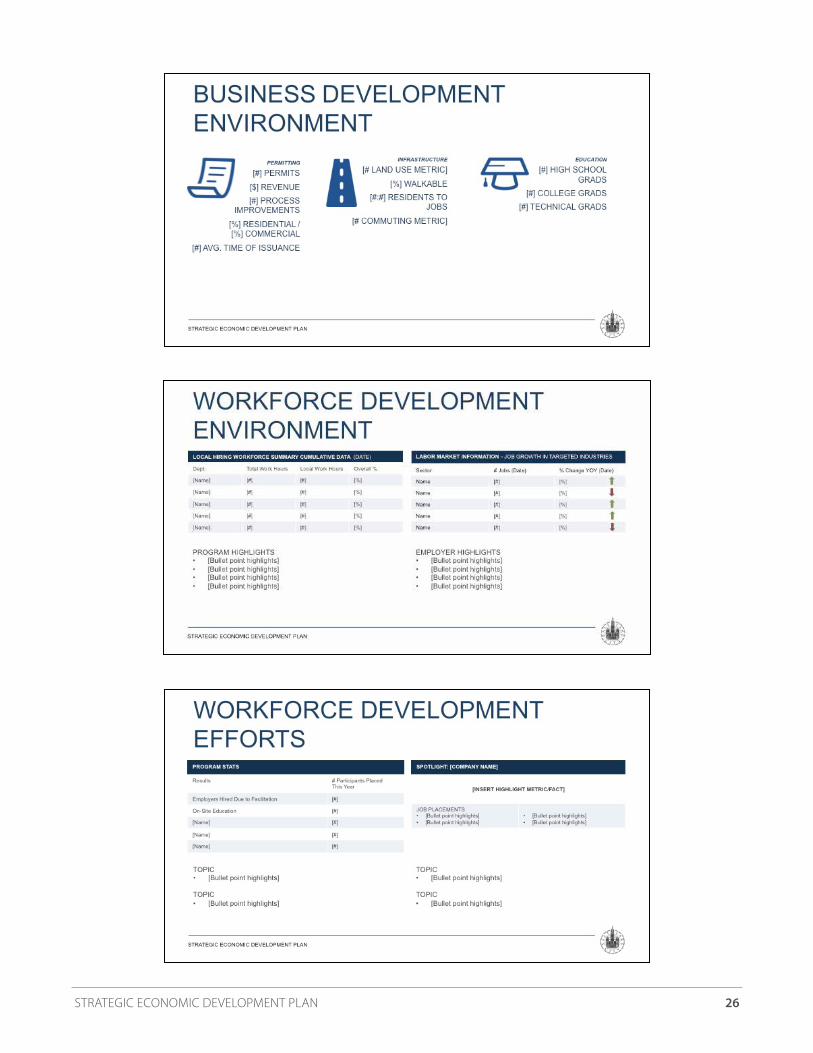
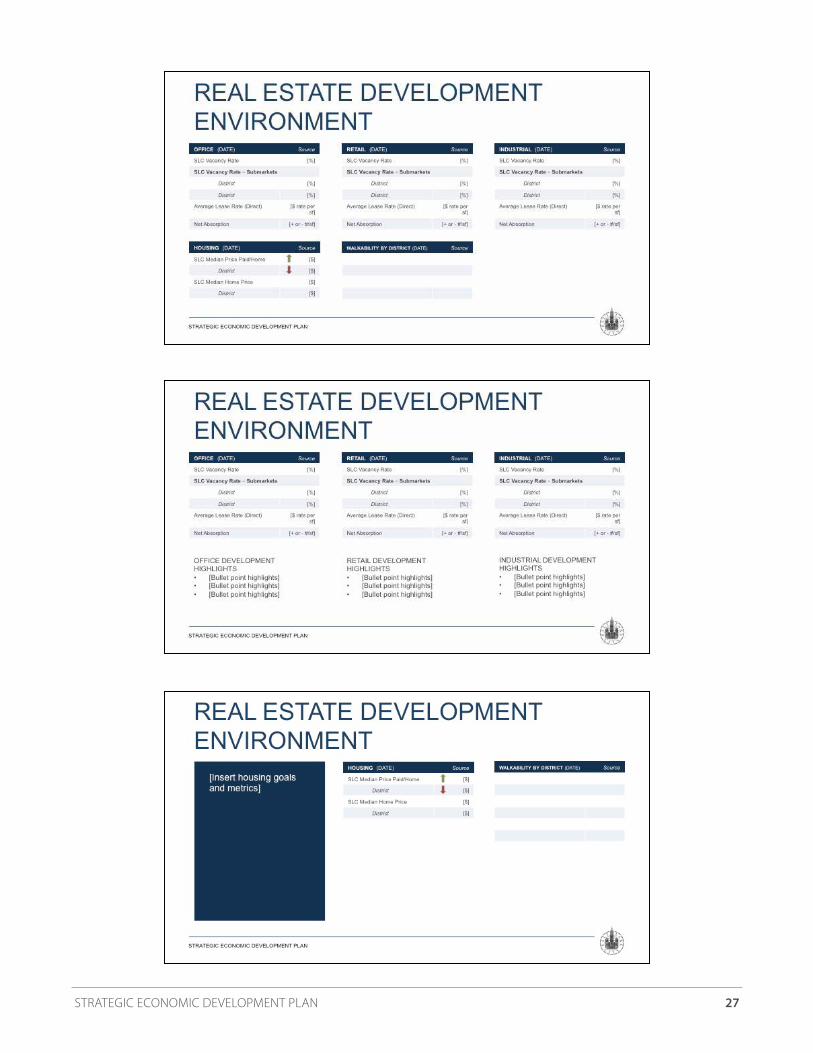
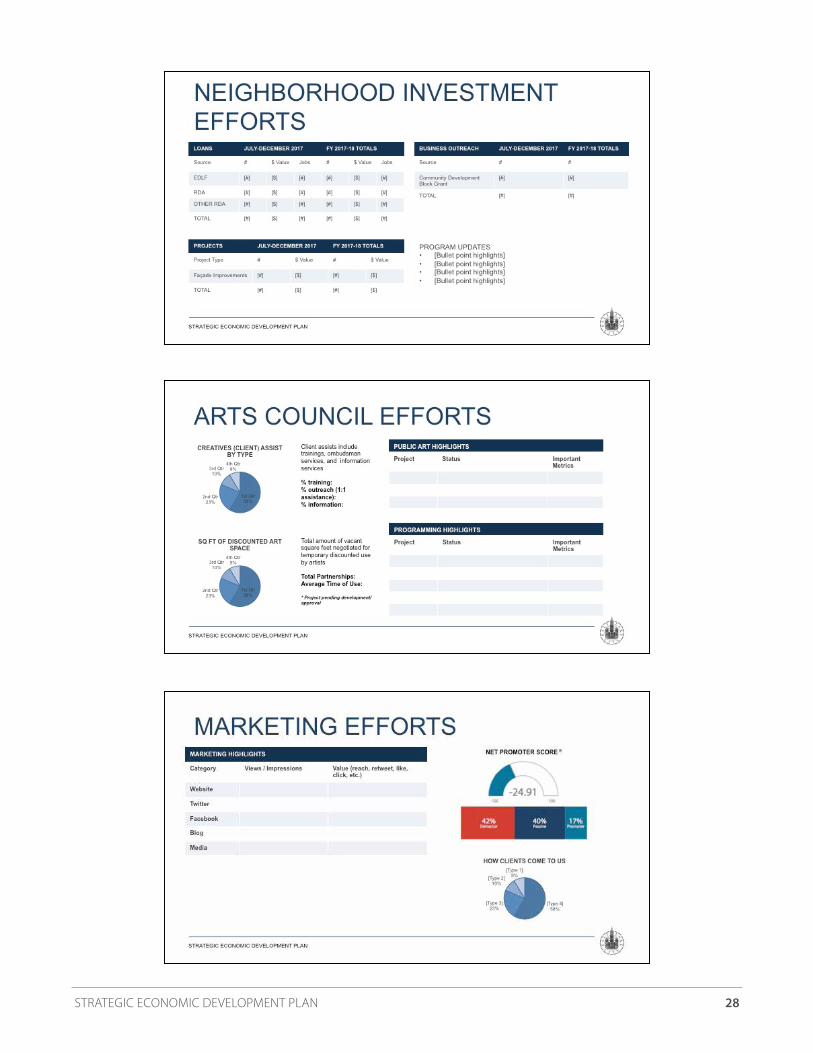
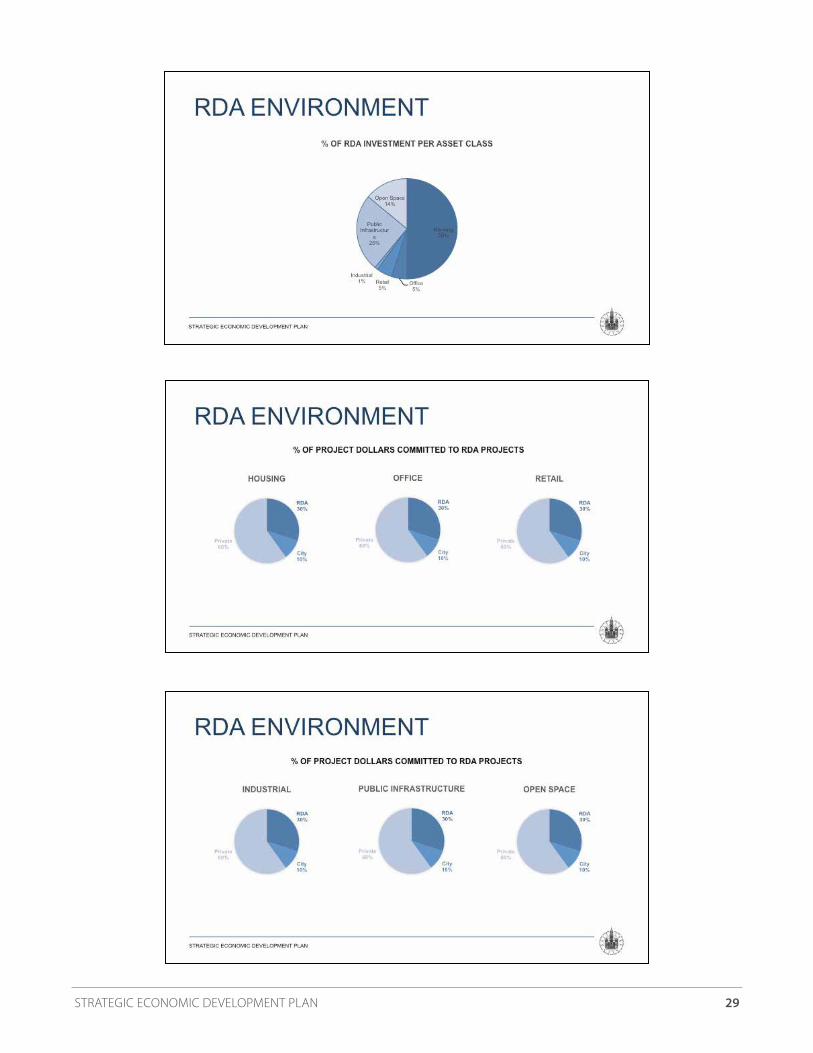
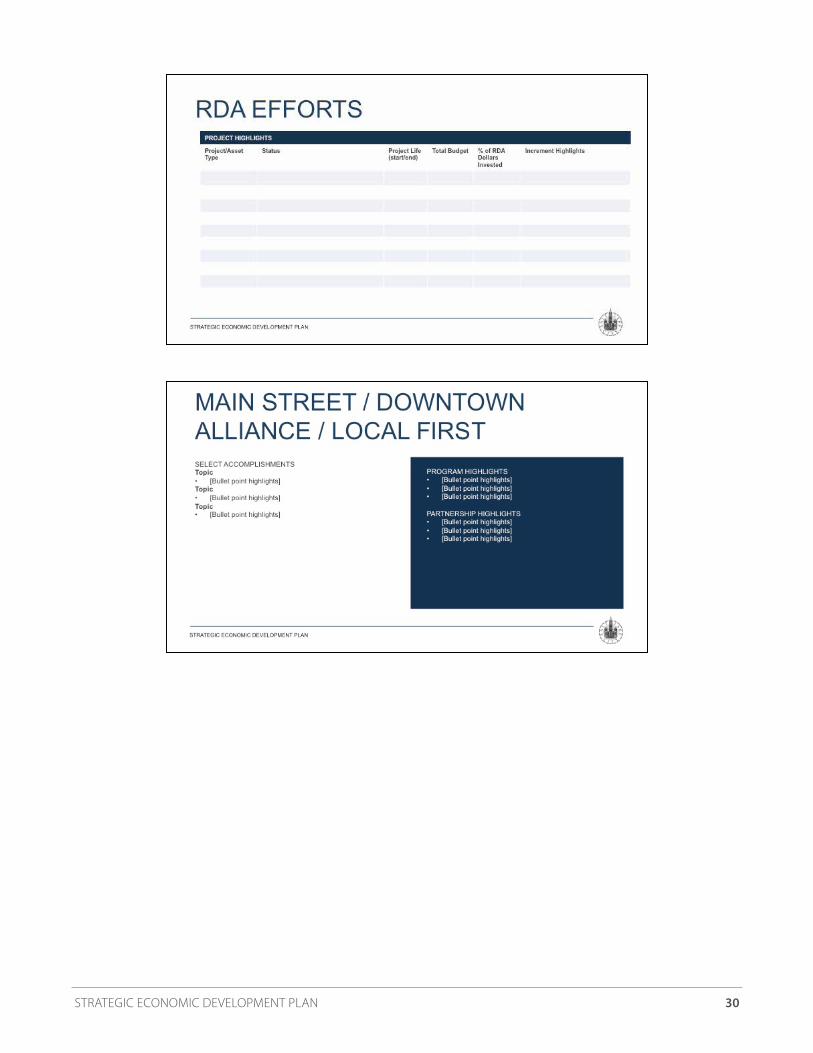
METRICS
The SLC DED will monitor progress of the plan implementation continually, reporting on results twice a year. The following graphics show a preview of the biannual dashboard of metrics, which will be updated every six months.
STRATEGIC ECONOMIC DEVELOPMENT PLAN 25
STRATEGIC ECONOMIC DEVELOPMENT PLAN 26
STRATEGIC ECONOMIC DEVELOPMENT PLAN 27
STRATEGIC ECONOMIC DEVELOPMENT PLAN 28
STRATEGIC ECONOMIC DEVELOPMENT PLAN 29
STRATEGIC ECONOMIC DEVELOPMENT PLAN 30
STRATEGIC ECONOMIC DEVELOPMENT PLAN 31
BE PART OF THE STRATEGIC PLAN’S IMPLEMENTATION
REQUEST A SPEAKERIf your organization would like someone from the SLC DED to speak about the Strategic Plan and its implementation, please contact Annie Davis, Manager of Research and Marketing at [email protected]
ENDORSE THE STRATEGIC PLANFor the Strategic Plan to be successful, it needs to be shared. Encourage public, nonprofit, community, labor, faith-based, education, business, and other stakeholders to advance the strategies and tactics developed.
STRATEGIC ECONOMIC DEVELOPMENT PLAN 32
CONCLUSIONS
As SLC DED approaches its first anniversary, this Strategic Plan will serve as a blueprint for the continued work, growth, and development of the SLC DED over the next three years. We will align our human, physical, cultural, technological, and financial resources to meet the goals identified in this plan.
With this Strategic Plan as a guide, SLC DED will meet the goals of building a globally connected, vital, and innovative Salt Lake City with economic opportunities for all. We will do this by focusing on business recruitment and retention at all levels, enhancing the arts, commercial districts, and housing opportunities, elevating the City’s presence in the national and international marketplace, and securing the SLC DED as the authority on economic opportunities in Salt Lake City.
This plan aims to be comprehensive, addressing practical needs at the city level, along with broader state and social concerns. As a result, the list of goals and actions for such a new department are extensive. It is essential that the City leadership, community, and stakeholder commitment to the SLC DED thus far continues.
The SLC DED’s success will be measured using a customized dashboard of key performance indicators (KPIs). Metrics and KPIs in this dashboard will be reviewed bi-annually to ensure the SLC DED’s actions remain aligned with key objectives outlined in this plan.
This is an ambitious but manageable plan with many actionable elements. Through the successful implantation of this plan, SLC DED will achieve its mission to build Salt Lake City as a vibrant, beautiful, prosperous, diverse, and authentic place – doing so through partnerships, a professional organization, business development, arts and culture, place-making, revitalization and redevelopment, while promoting the City’s many attributes.
SLC DED would like to express its gratitude for those who contributed their thoughts and expertise during the creation of this Strategic Plan, and to those who remain our partners as the highlighted goals are achieved.
STRATEGIC ECONOMIC DEVELOPMENT PLAN 33
NOTE OF THANKS
The SLC DED would like to thank the following companies for the time and effort their staff have dedicated to this effort:
ROUNDTABLE AND INTERVIEW PARTICIPANTS
Albany Engineered CompositesAmerican Estate Management Corp ArtSpaceBallet WestBio UtahBoeingCBC Advisors CBRE – SLCChurch of Jesus Christ of Latter Day SaintsCity Creek ReserveCushman WakefieldDowntown AllianceEconomic Development Corporation of UtahFORM DevelopmentGiv GroupGovernor’s Office of Economic DevelopmentGunn Consulting Cooperative, LLCHamilton PartnersHarmonsHASLCHER MagazineIndustrial SupplyIntermountain HealthcareIPG Real EstateKenworth Sales CompanyKomatsu Equipment CompanyKUERL3 CorporationLiving Zenith/Red FishLocal First Utah
Method CommunicationsNatalie Gochnour, Director, Kem C. Gardner Policy Institute, University of UtahNeighborworksNewmark Grubb AcresOkland ConstructionPacific Rim Consulting GroupPenna PowersRed Iguana, Red Iguana II and Taste of Red IguanaSahara, Inc.SALT DevelopmentSalt Lake Chamber of CommerceSalt Lake Community CollegeSalt Lake County Economic Development DivisionSLUG MagazineU.S. Department of CommerceU.S. Small Business AdministrationUT Division of Arts and MuseumsUtah Arts AllianceUtah Department of Workforce ServicesUtah Division of Arts and MuseumsUtah Manufacturers AssociationUtah Museum of Fine ArtsUtah PresentsVentureCapital.orgVestar Visit Salt LakeWasatch Residential GroupWestern Nonprofit Housing Corp.Women’s Technology CouncilWorld Trade Center of UtahZion’s Bank
STRATEGIC ECONOMIC DEVELOPMENT PLAN 34
SALT LAKE CITY CORPORATION
Jackie Biskupski, Mayor
Salt Lake City Council James Rogers, District 1 Andrew Johnston, District 2 Stan Penfold, District 3 Derek Kitchen, District 4 Erin Mendenhall, District 5 Charlie Luke, District 6 Lisa Adams, District 7
Business Advisory Board
Salt Lake City Department of Economic Development Business Development Salt Lake City Arts Council Redevelopment Agency of Salt Lake City
Department of Community and NeighborhoodsMichael Reberg, Director Civic Engagement Housing and Neighborhoods Real Estate Building Services
Department of SustainabilityVicki Bennett, Director of Sustainability