Embed Size (px)
Citation preview
Strategic Meetings Management
Peter Moen
Vice President, Carlson Meetings and Events
Strategic Meetings Management
I. Industry Changes
II. What is Driving Change?
III. What is Strategic Meetings Management?
IV. Where are the Savings?
V. What are my Options and Critical Success Factors?
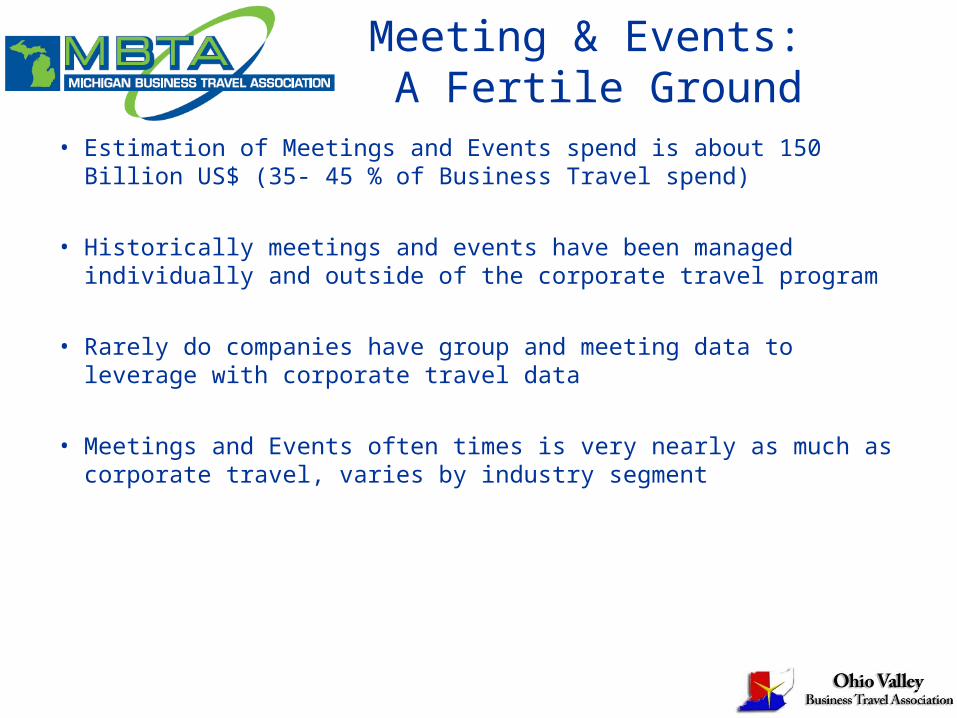
Meeting & Events: A Fertile Ground
• Estimation of Meetings and Events spend is about 150 Billion US$ (35- 45 % of Business Travel spend)
• Historically meetings and events have been managed individually and outside of the corporate travel program
• Rarely do companies have group and meeting data to leverage with corporate travel data
• Meetings and Events often times is very nearly as much as corporate travel, varies by industry segment
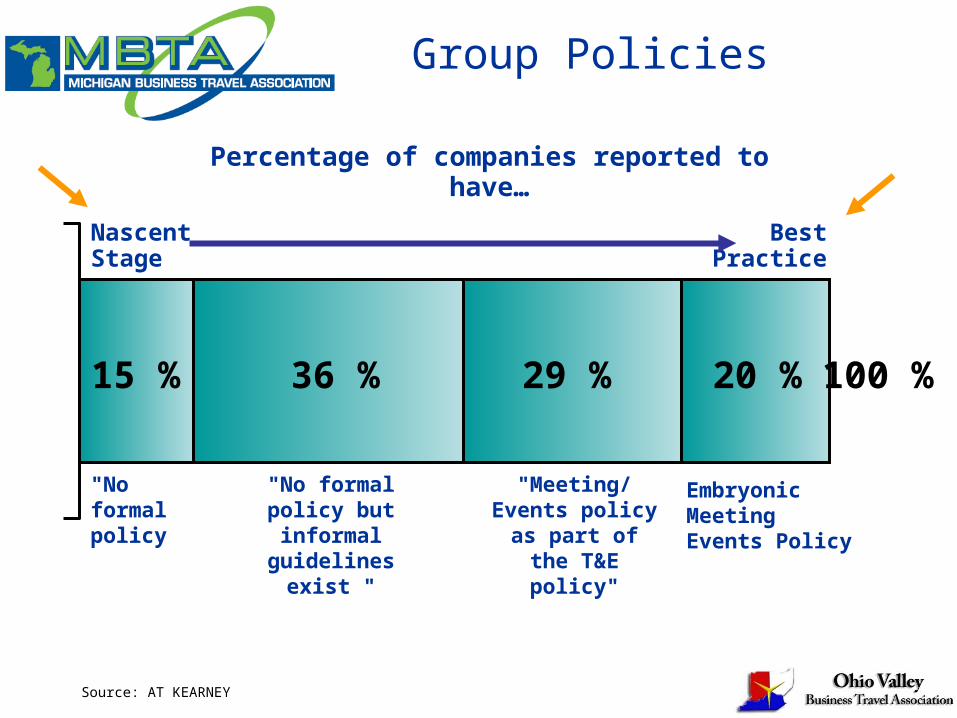
Group Policies
Source: AT KEARNEY
Percentage of companies reported to have…
"No formal policy
"No formal policy but informal
guidelines exist "
"Meeting/Events policy as part of the T&E policy"
Embryonic MeetingEvents Policy
15 % 36 % 29 % 20 % 100 %
NascentStage
BestPractice
0
10
20
30
40
50
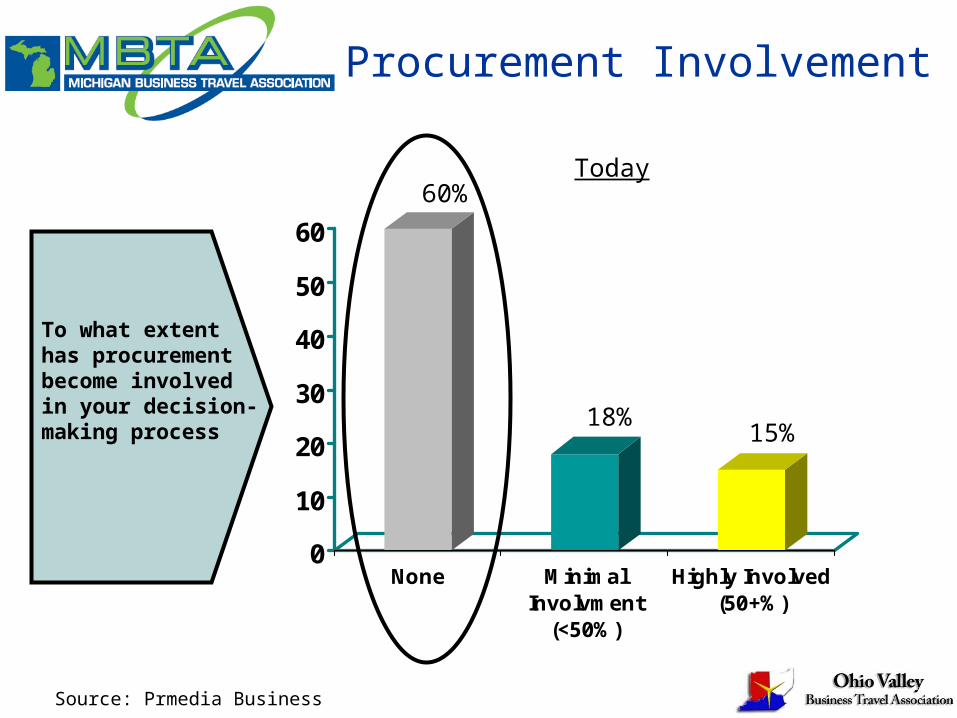
60
None MinimalInvolvment
(<50%)
Highly Involved(50+%)
Procurement Involvement
60%
18%15%
Source: Prmedia Business
Today
To what extent has procurement become involved in your decision-making process
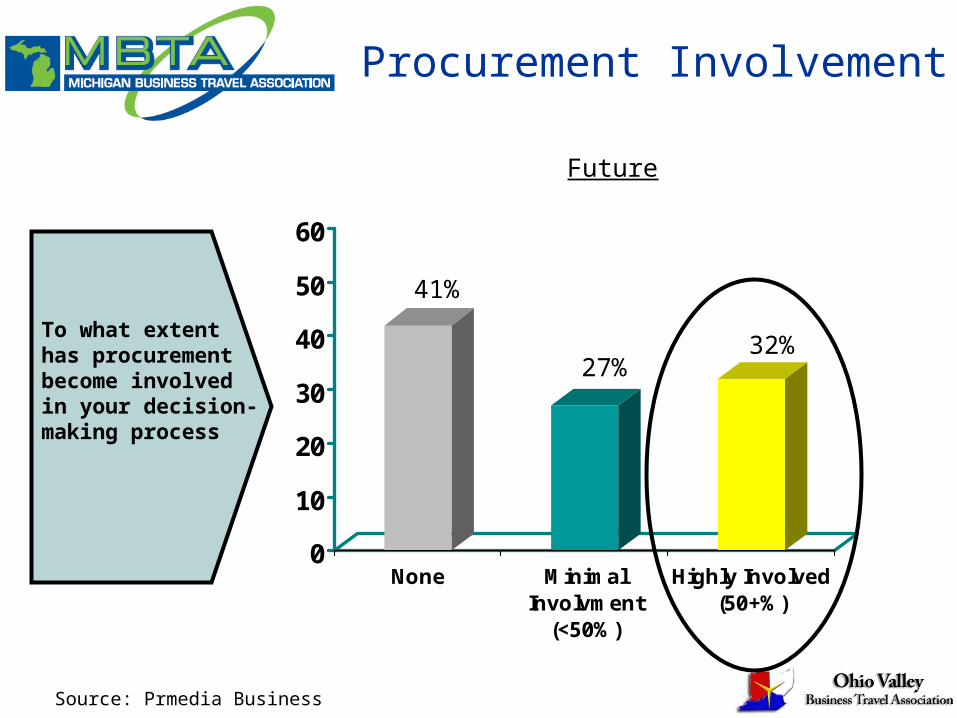
0
10
20
30
40
50
60
None MinimalInvolvment
(<50%)
Highly Involved(50+%)
Procurement Involvement
To what extent has procurement become involved in your decision-making process
41%
27%32%
Source: Prmedia Business
Future

What is driving this Change?
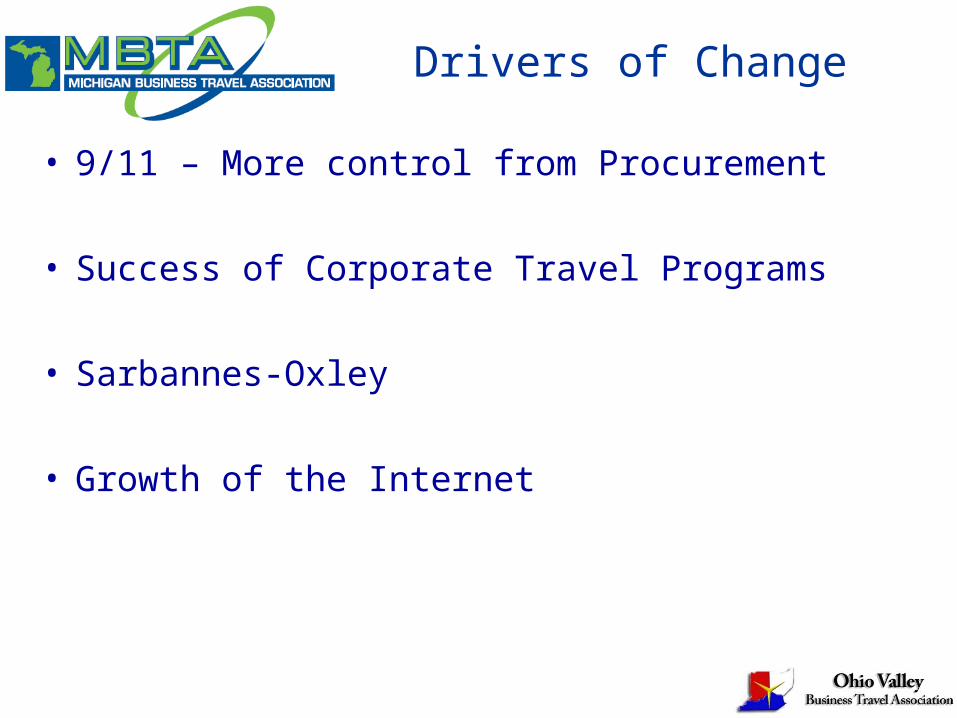
Drivers of Change
• 9/11 – More control from Procurement
• Success of Corporate Travel Programs
• Sarbannes-Oxley
• Growth of the Internet
What is Strategic Meetings
Management?
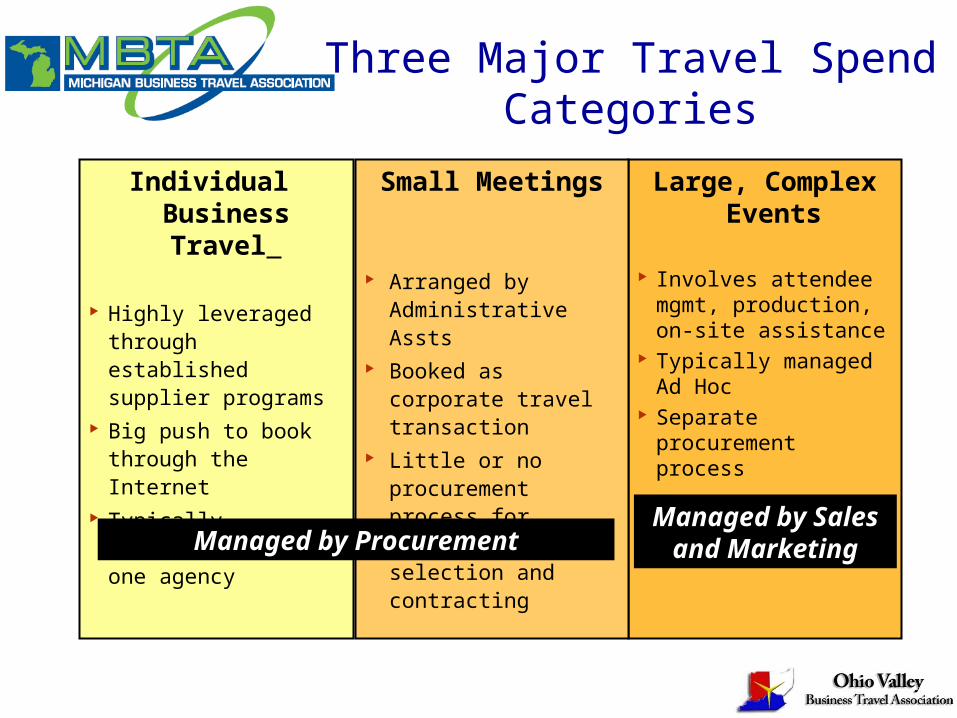
Individual Business Travel
Highly leveraged through established supplier programs
Big push to book through the Internet
Typically consolidated with one agency
Large, Complex Events
Involves attendee mgmt, production, on-site assistance
Typically managed Ad Hoc
Separate procurement process
Small Meetings
Arranged by Administrative Assts
Booked as corporate travel transaction
Little or no procurement process for airline or hotel selection and contracting
Managed by Sales and MarketingManaged by Procurement
Three Major Travel Spend Categories
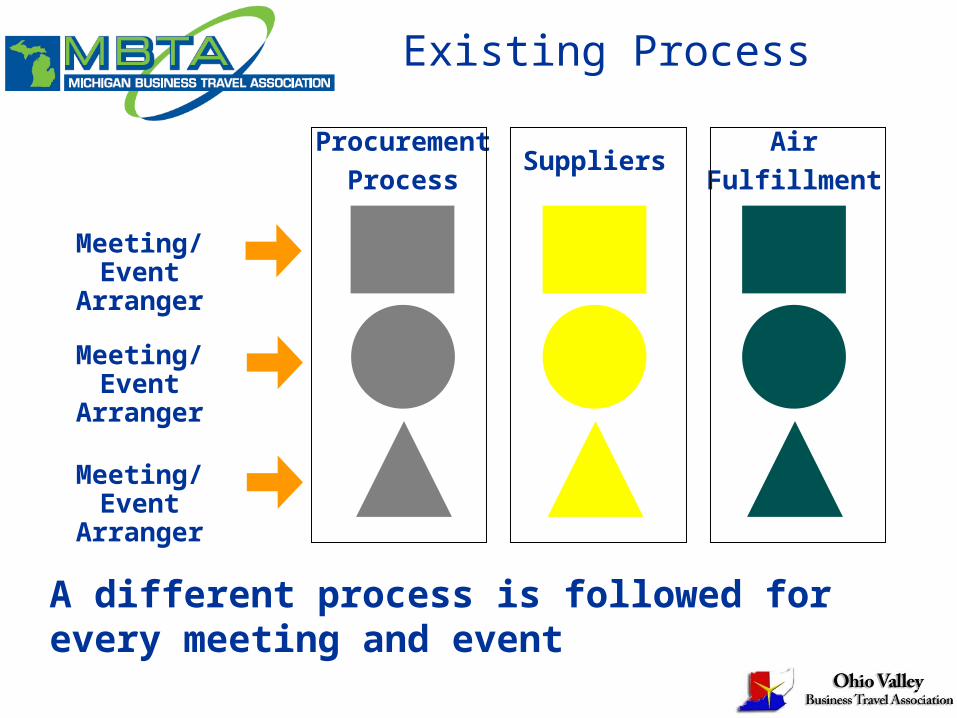
A different process is followed for every meeting and event
Existing Process
Meeting/Event Arranger
Meeting/Event Arranger
Meeting/Event Arranger
Procurement
ProcessSuppliers
Air
Fulfillment
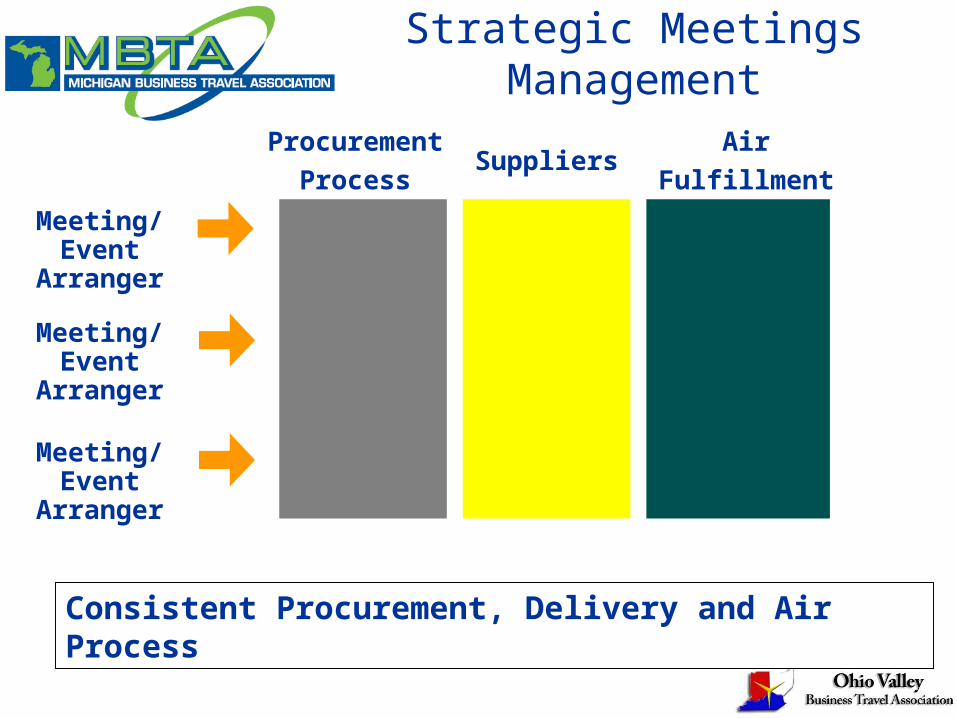
Consistent Procurement, Delivery and Air Process
Meeting/Event Arranger
Meeting/Event Arranger
Meeting/Event Arranger
Procurement
ProcessSuppliers
Air
Fulfillment
Strategic Meetings Management
Where are the Savings?
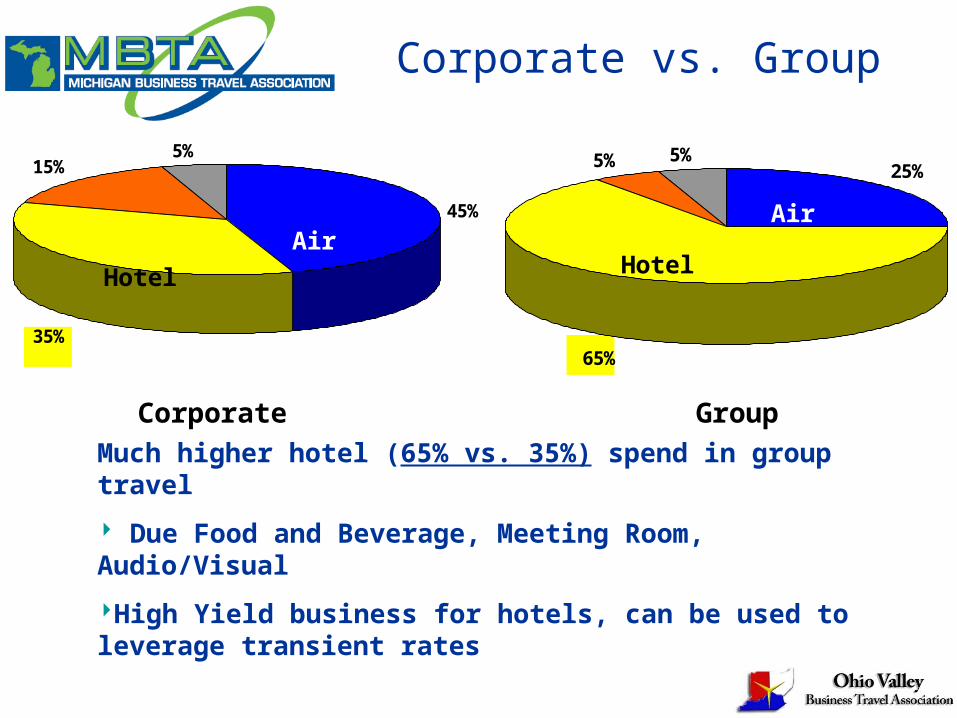
Corporate vs. Group
45%
35%
15%5%
Air Hotel Ground Misc
25%
65%
5% 5%
Air Hotel Ground Misc
Corporate Group
AirAir
Hotel Hotel
Much higher hotel (65% vs. 35%) spend in group travel
Due Food and Beverage, Meeting Room, Audio/Visual
High Yield business for hotels, can be used to leverage transient rates
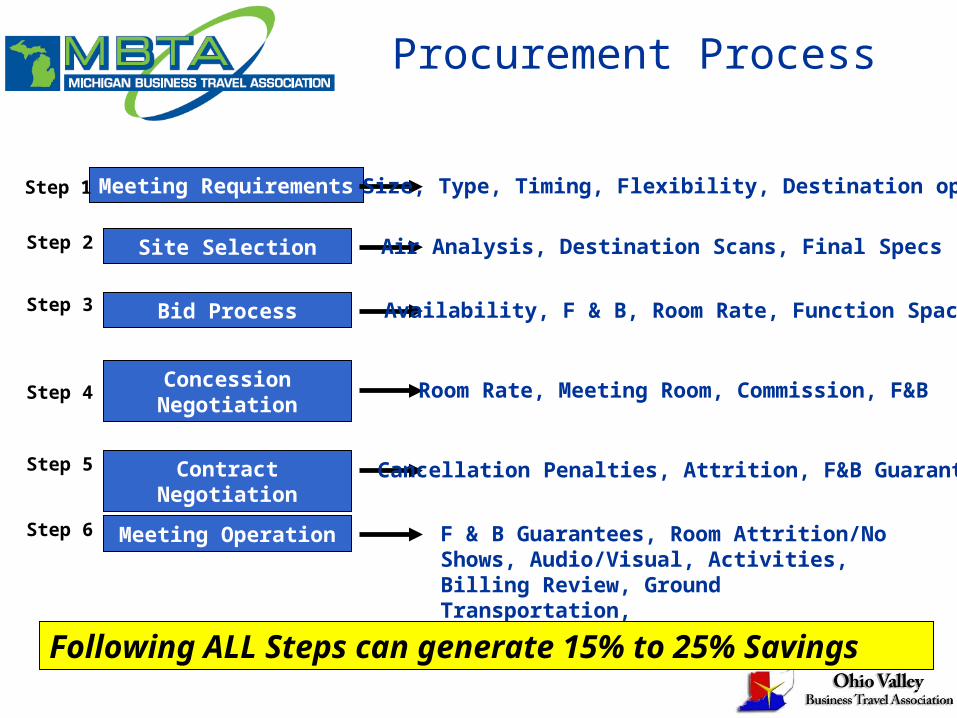
Procurement Process
Meeting Requirements
Site Selection
Bid Process
Concession Negotiation
Contract Negotiation
Meeting Operation
Step 1
Step 2
Step 3
Step 4
Step 5
Step 6
Size, Type, Timing, Flexibility, Destination options
Air Analysis, Destination Scans, Final Specs
Availability, F & B, Room Rate, Function Space
Room Rate, Meeting Room, Commission, F&B
Cancellation Penalties, Attrition, F&B Guarantees
F & B Guarantees, Room Attrition/No Shows, Audio/Visual, Activities, Billing Review, Ground Transportation,
Following ALL Steps can generate 15% to 25% Savings
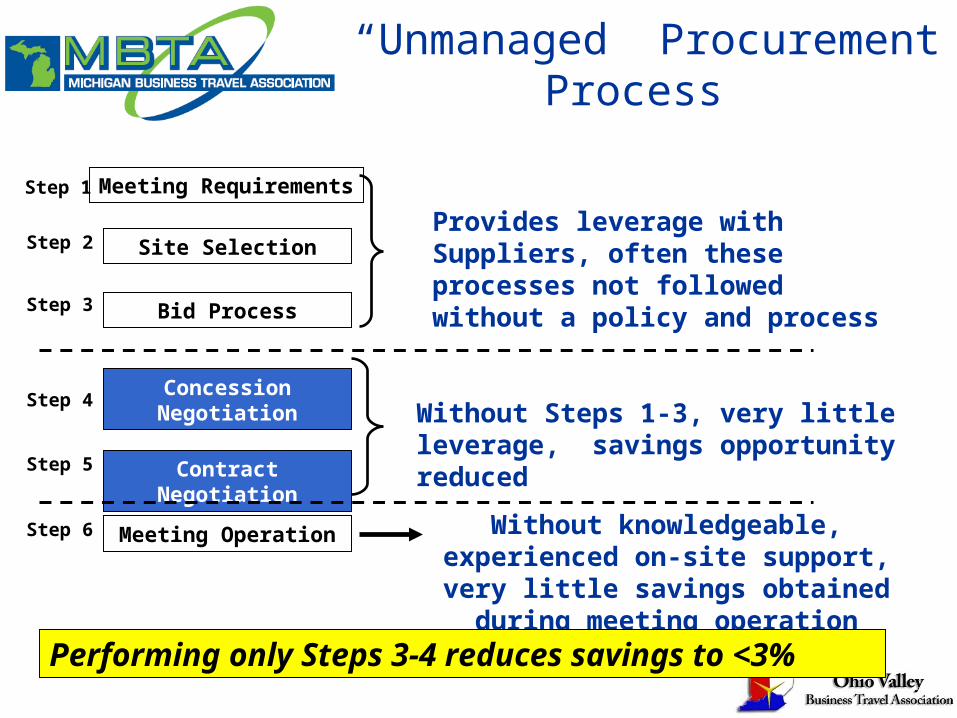
“Unmanaged” Procurement Process
Meeting Requirements
Site Selection
Bid Process
Concession Negotiation
Contract Negotiation
Meeting Operation
Without Steps 1-3, very little leverage, savings opportunity reduced
Without knowledgeable, experienced on-site support, very little savings obtained during meeting operation
Provides leverage with Suppliers, often these processes not followed without a policy and process
Performing only Steps 3-4 reduces savings to <3%
Step 1
Step 2
Step 3
Step 4
Step 5
Step 6
Meeting Requirements
Site Selection
Bid Process
Concession Negotiation
Contract Negotiation
Meeting Operation
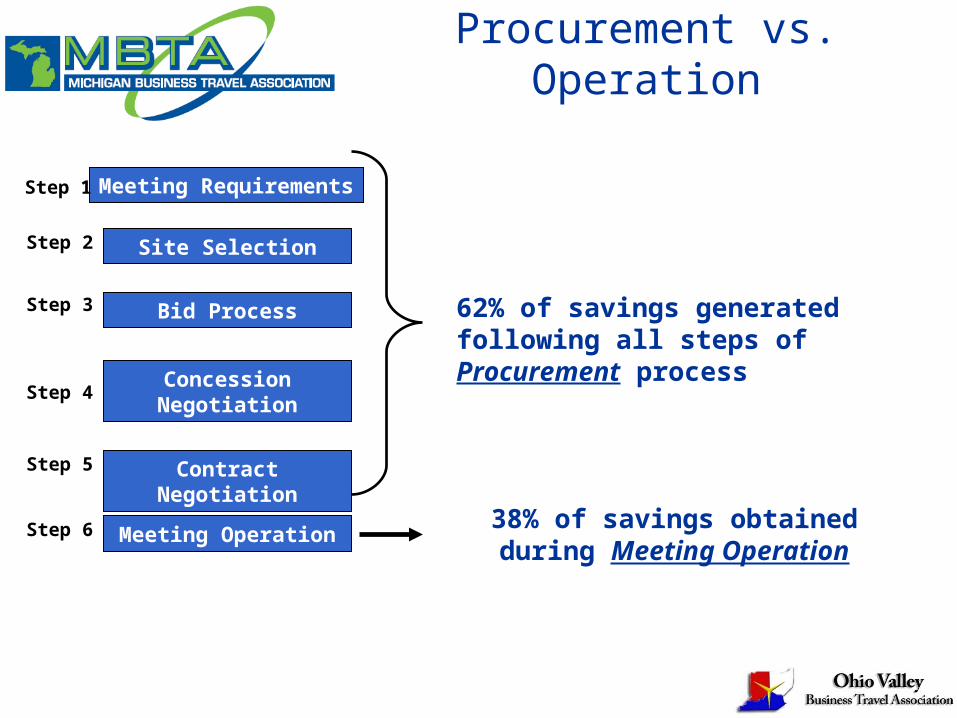
62% of savings generated following all steps of Procurement process
38% of savings obtained during Meeting Operation
Step 1
Step 2
Step 3
Step 4
Step 5
Step 6
Procurement vs. Operation
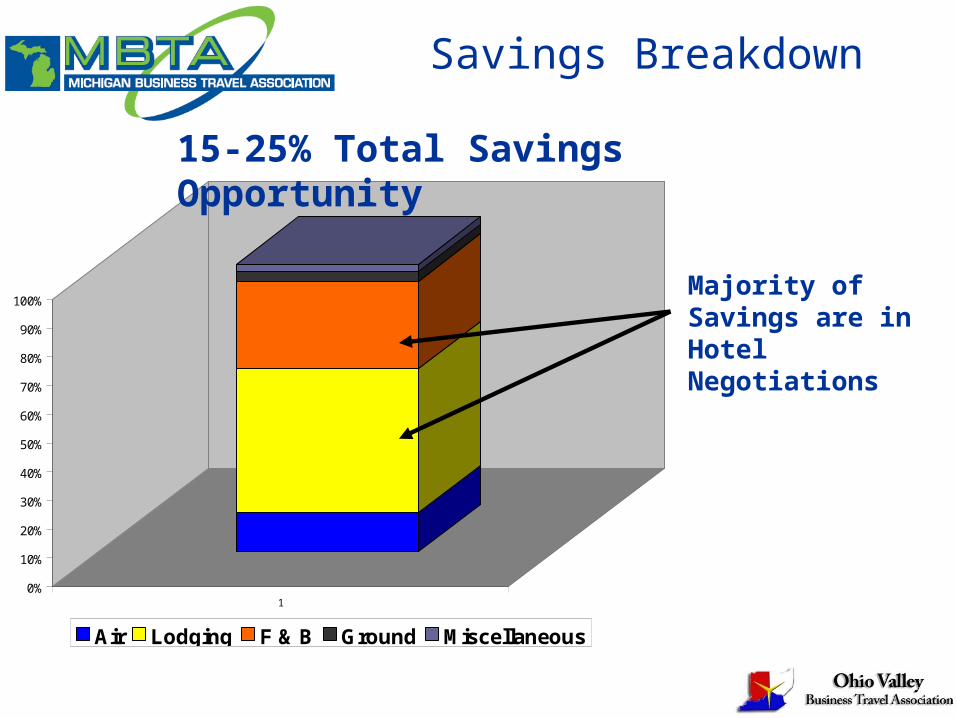
Savings Breakdown
0%
10%
20%
30%
40%
50%
60%
70%
80%
90%
100%
1
Air Lodging F & B Ground Miscellaneous
Majority of Savings are in Hotel Negotiations
15-25% Total Savings Opportunity
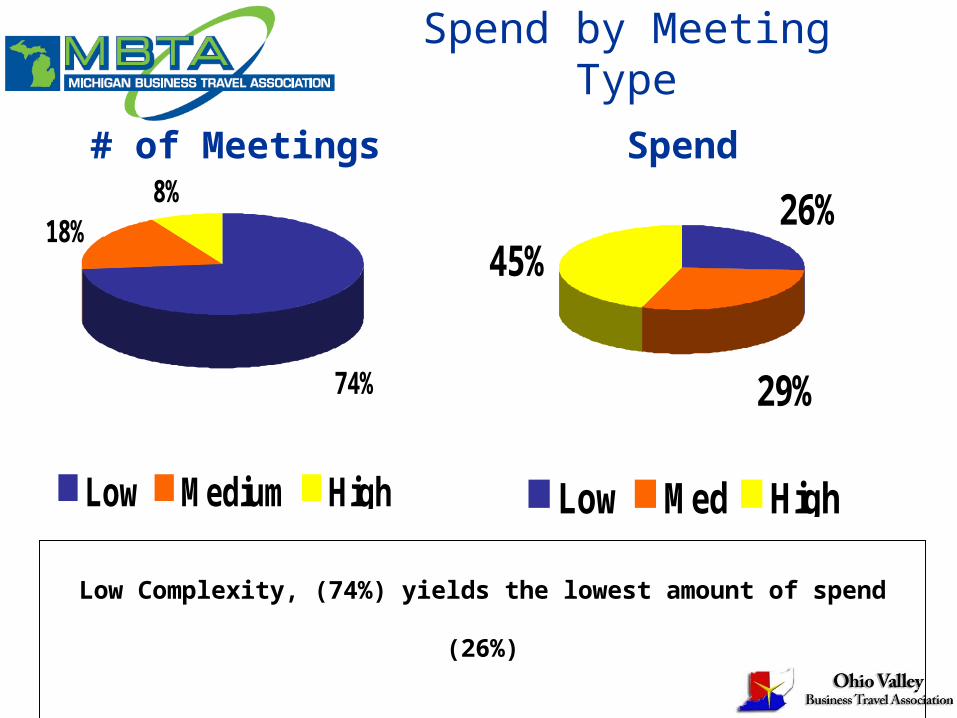
Spend by Meeting Type
26%
29%
45%
Low Med High
Low Complexity, (74%) yields the lowest amount of spend (26%)
High Complexity, (8%) yields the greatest amount of spend (45%)
74%
18%8%
Low Medium High
# of Meetings Spend
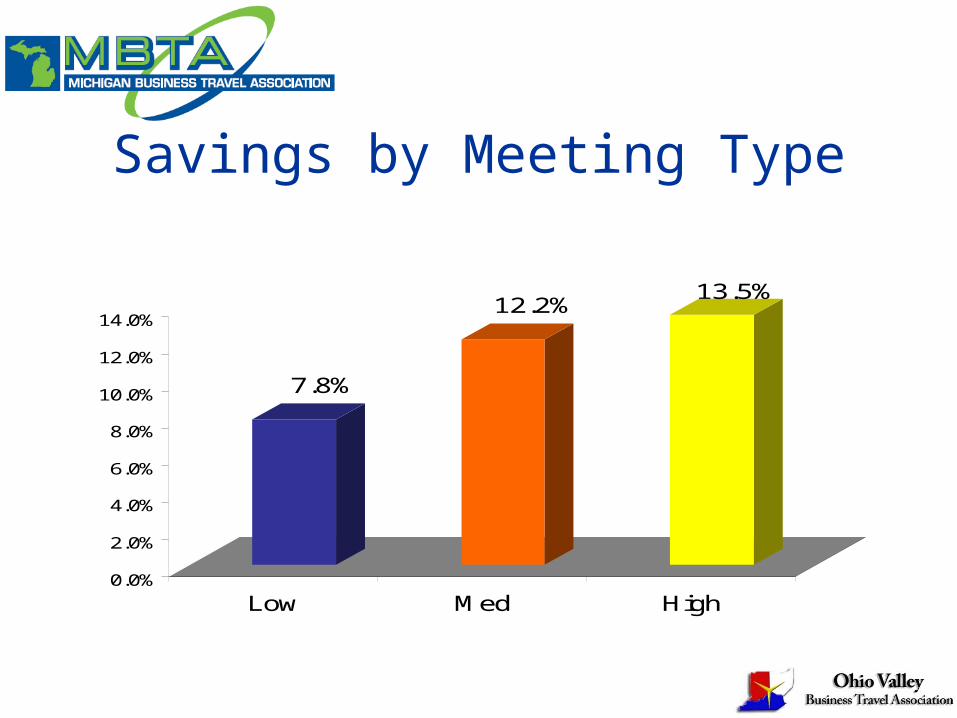
Savings by Meeting Type
7.8%
12.2%13.5%
0.0%
2.0%
4.0%
6.0%
8.0%
10.0%
12.0%
14.0%
Low Med High
What are my options?
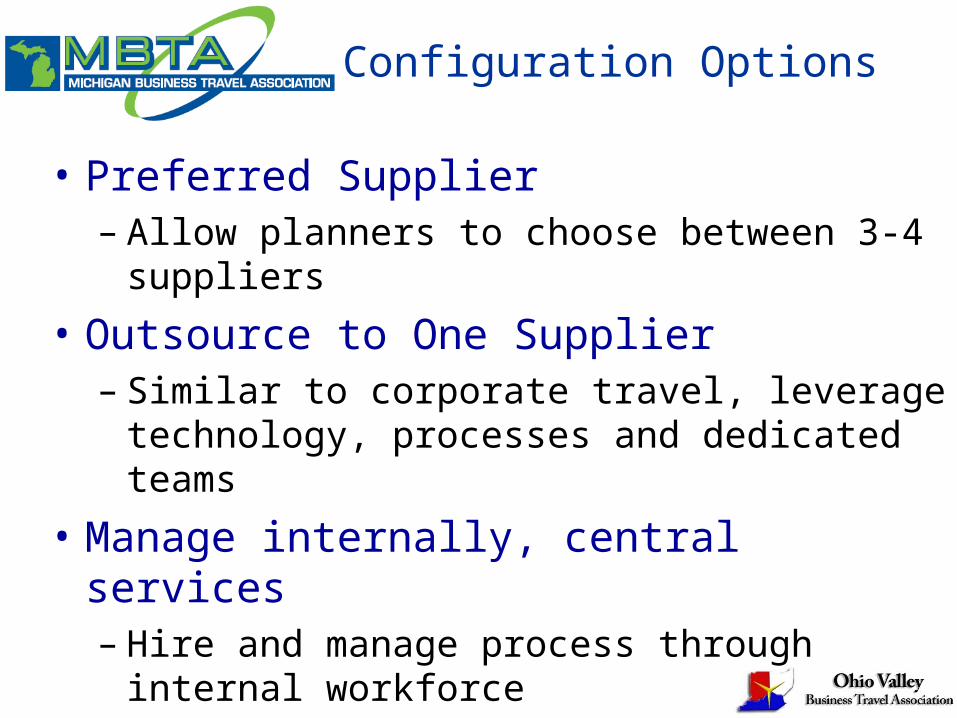
Configuration Options
• Preferred Supplier– Allow planners to choose between 3-4 suppliers
• Outsource to One Supplier– Similar to corporate travel, leverage technology,
processes and dedicated teams
• Manage internally, central services– Hire and manage process through internal
workforce
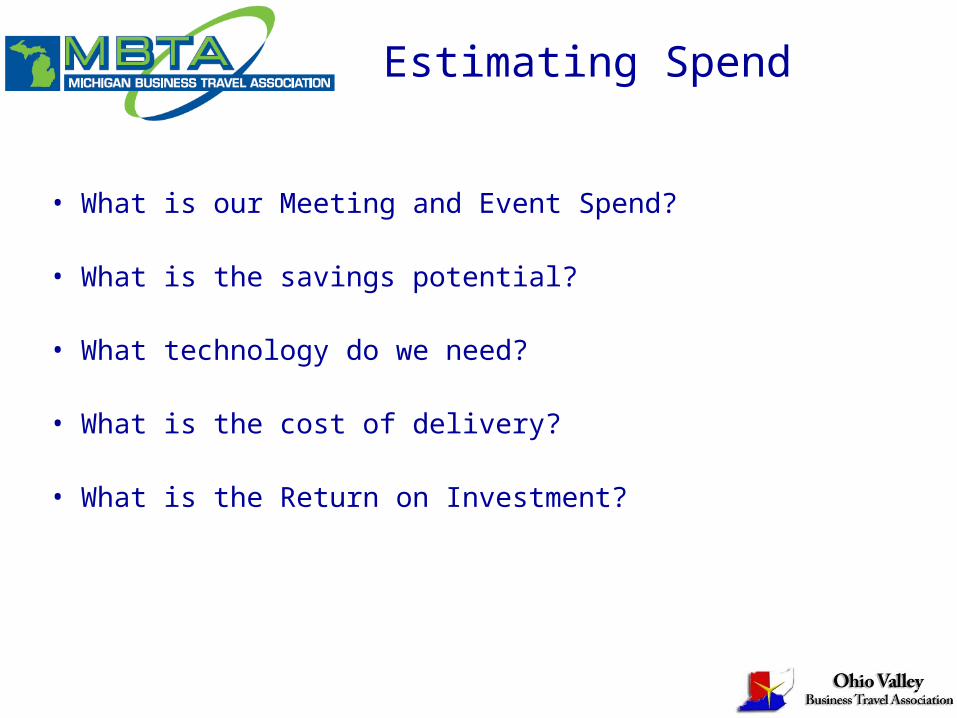
Estimating Spend
• What is our Meeting and Event Spend?
• What is the savings potential?
• What technology do we need?
• What is the cost of delivery?
• What is the Return on Investment?
Estimating Spend
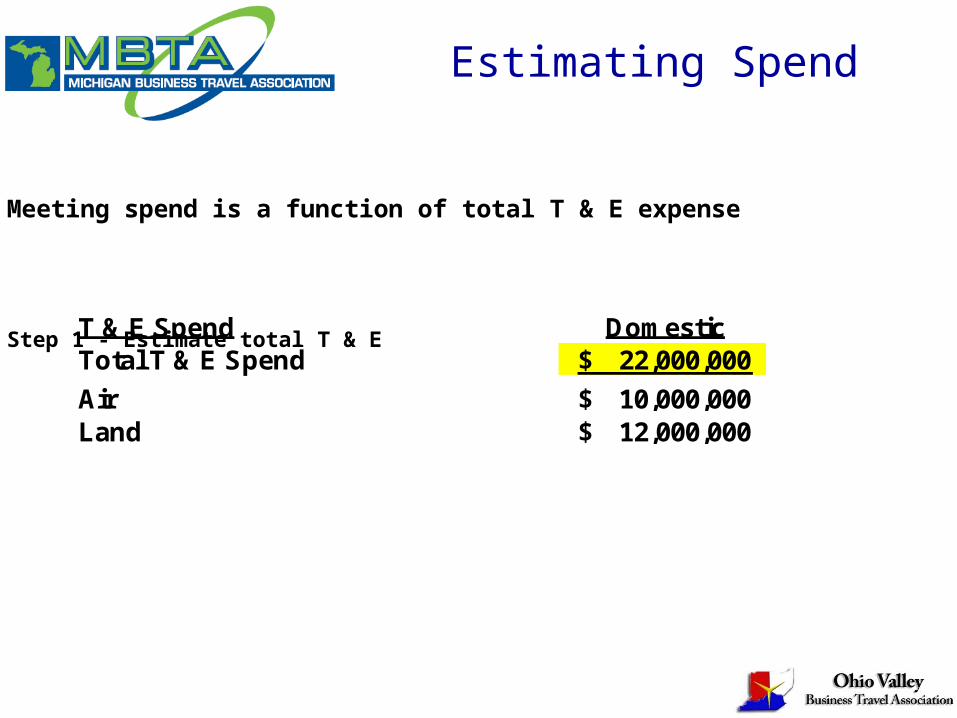
T & E Spend DomesticTotal T & E Spend 22,000,000$
Air 10,000,000$ Land 12,000,000$
Meeting spend is a function of total T & E expense
Step 1 - Estimate total T & E
Estimating Spend
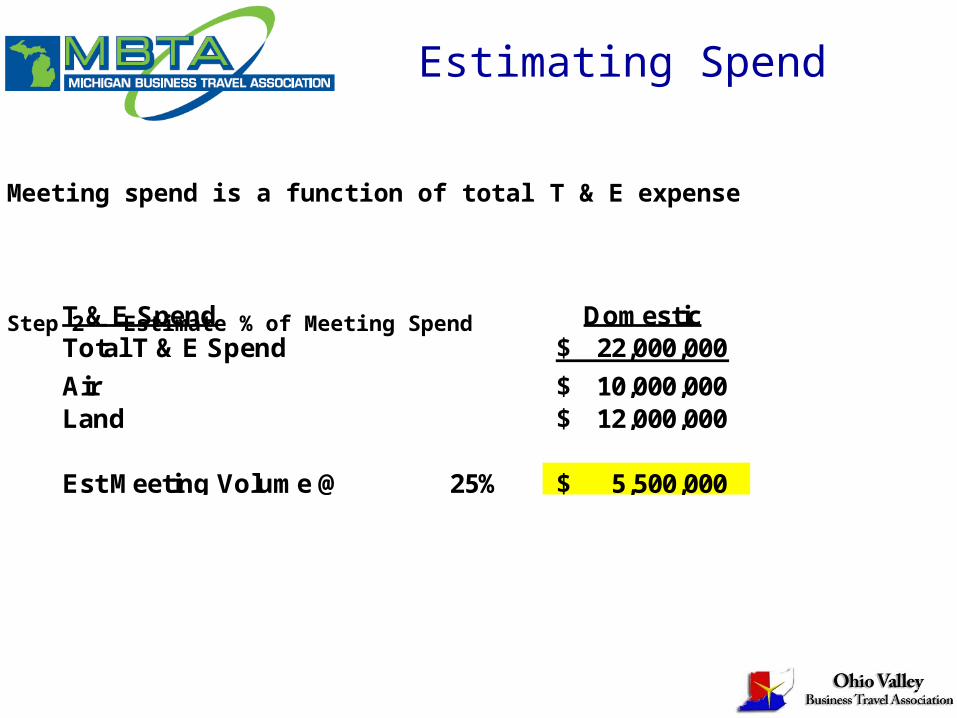
Meeting spend is a function of total T & E expense
Step 2 - Estimate % of Meeting SpendT & E Spend DomesticTotal T & E Spend 22,000,000$
Air 10,000,000$ Land 12,000,000$
Est Meeting Volume @ 25% 5,500,000$
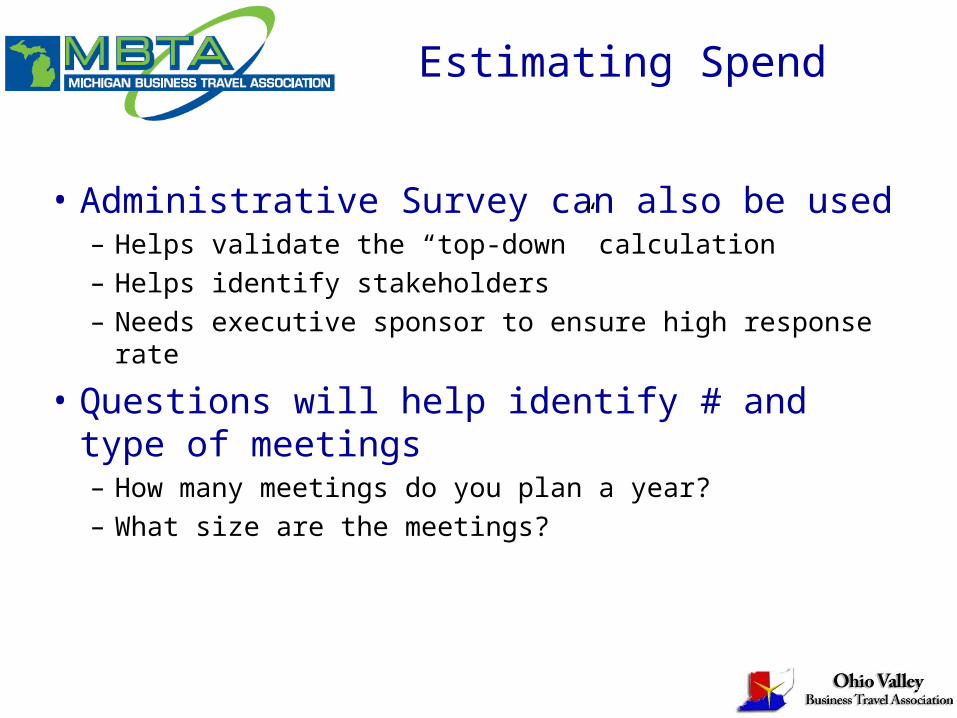
Estimating Spend
• Administrative Survey can also be used– Helps validate the “top-down” calculation
– Helps identify stakeholders
– Needs executive sponsor to ensure high response rate
• Questions will help identify # and type of meetings– How many meetings do you plan a year?
– What size are the meetings?
T & E Spend DomesticTotal T & E Spend 22,000,000$
Air 10,000,000$ Land 12,000,000$
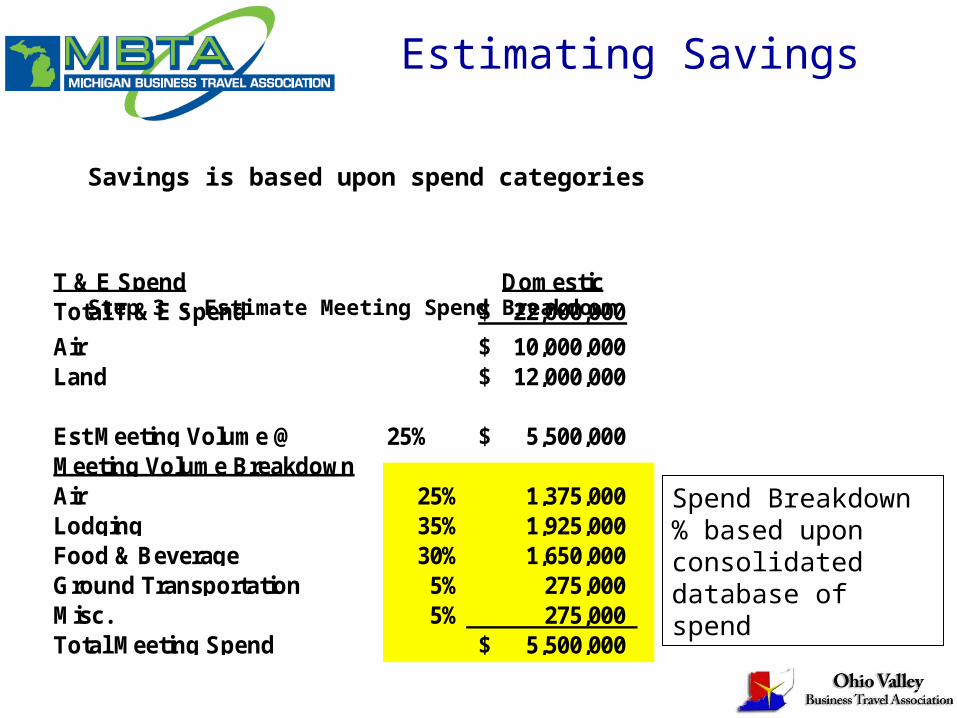
Est Meeting Volume @ 25% 5,500,000$ Meeting Volume Breakdown Air 25% 1,375,000 Lodging 35% 1,925,000 Food & Beverage 30% 1,650,000 Ground Transportation 5% 275,000 Misc. 5% 275,000 Total Meeting Spend 5,500,000$
Estimating Savings
Savings is based upon spend categories
Step 3 - Estimate Meeting Spend Breakdown
Spend Breakdown % based upon consolidated database of spend
T & E Spend DomesticTotal T & E Spend 22,000,000$
Air 10,000,000$ Land 12,000,000$
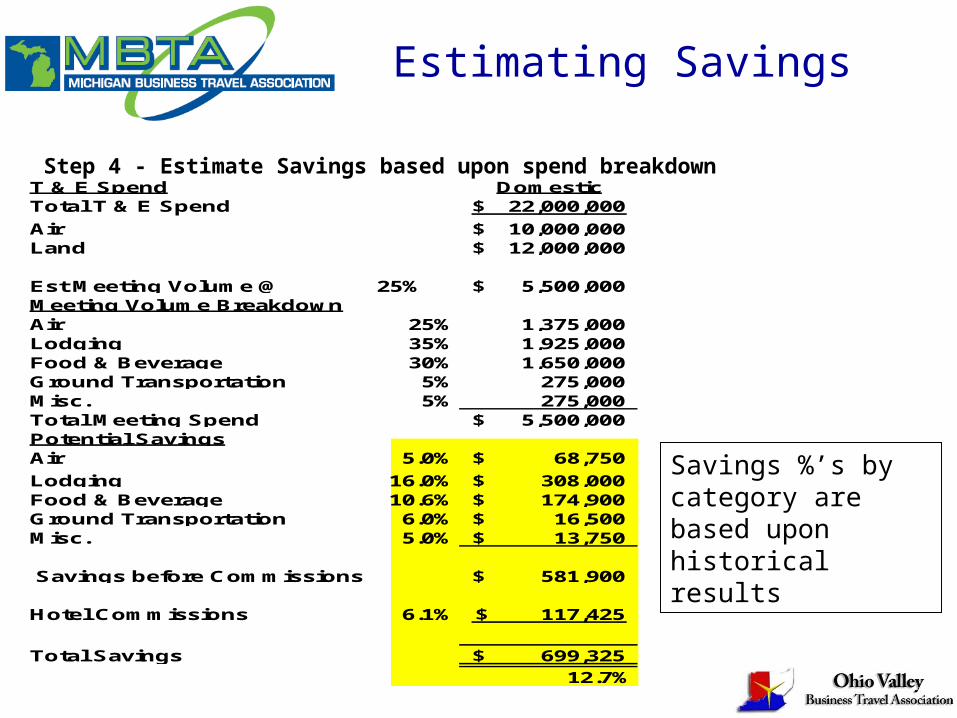
Est Meeting Volume @ 25% 5,500,000$ Meeting Volume Breakdown Air 25% 1,375,000 Lodging 35% 1,925,000 Food & Beverage 30% 1,650,000 Ground Transportation 5% 275,000 Misc. 5% 275,000 Total Meeting Spend 5,500,000$ Potential Savings Air 5.0% 68,750$
Lodging 16.0% 308,000$ Food & Beverage 10.6% 174,900$ Ground Transportation 6.0% 16,500$ Misc. 5.0% 13,750$
Savings before Commissions 581,900$
Hotel Commissions 6.1% 117,425$
Total Savings 699,325$
12.7%
Estimating Savings
Step 4 - Estimate Savings based upon spend breakdown
Savings %’s by category are based upon historical results
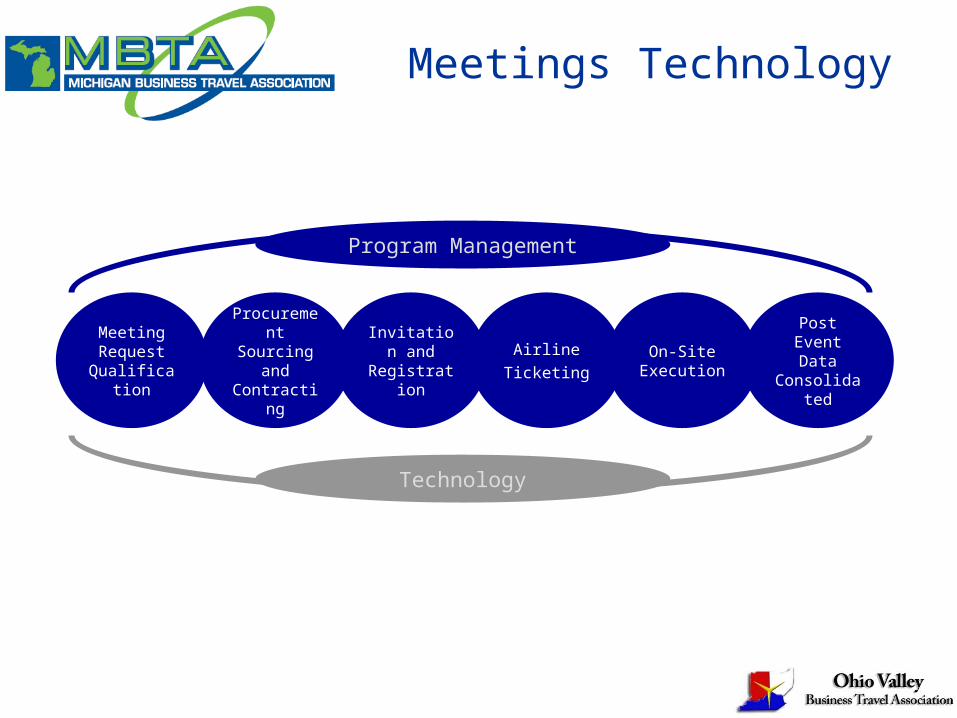
Meetings Technology
Meeting Request
Qualification
Procurement
Sourcing and
Contracting
Invitation and
Registration
AirlineTicketing
On-Site Execution
Post Event Data
Consolidated
Program Management
Technology