Embed Size (px)
Citation preview

invent
introduce
Strategic Mine [email protected]
www.crcore.org.au
Carlos EspejelMine PlanningEngineer
GRADE ENGINEERING STUDY FRAMEWORK
CRC ORE 2
• Measure & quantify the Grade Engineering® responses of the orebody
• Conducted through combination of physical testing & data analytics1. Characterisation
• Understand geological controls on Grade Engineering® responses
• Spatially map responses defining Grade Engineering® domains
2. Geometallurgy & Spatial Analysis
• Define Grade Engineering® “circuit”, equipment design & specifications
• Quantify process simulation responses across mining value chain
3. Process Design & Simulation
• Develop strategic mine plan incorporating Grade Engineering® • Define impact on equipment, layout, material movement, mine development
4. Strategic Mine Planning
• Quantify the economic impact utilising Scenario Analysis
• Define implementation options and viability5. Project Evaluation
• Technical validation at production scale of Grade Engineering® technology
• Detailed testing, validation, reconciliation process6. Pilot/Production Trials
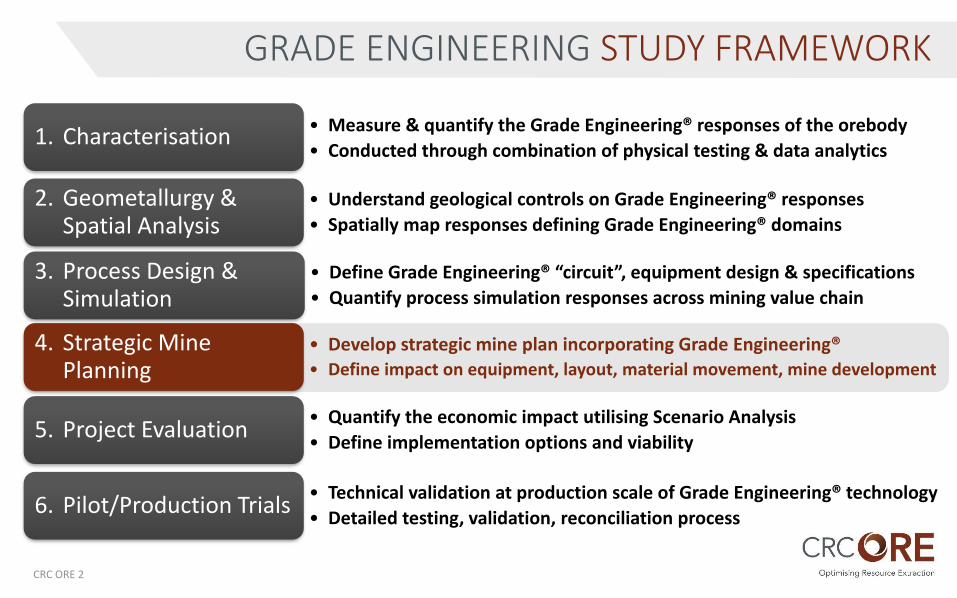
Long Term Mine Planning
5 to 100 YearsProject Overall Net Present
Value (NPV)Internal Rate of Return (IRR)Metal Production (Commitment)Life of Mine (Years?)
1 to 5 YearsRefines the LTMPFollows the LTMPNPV is the target
Weekly, monthly up to 1 YearTries to achieve LTMP TargetsTPH to MillHead Grades to MillCost ReductionAnnual Cash Flow
Strategic TacticStrategic
Medium Term Mine Planning Short Term Mine Planning
MINE PLANNING STAGES AND INDIVIDUAL TARGETS
CRC ORE 3
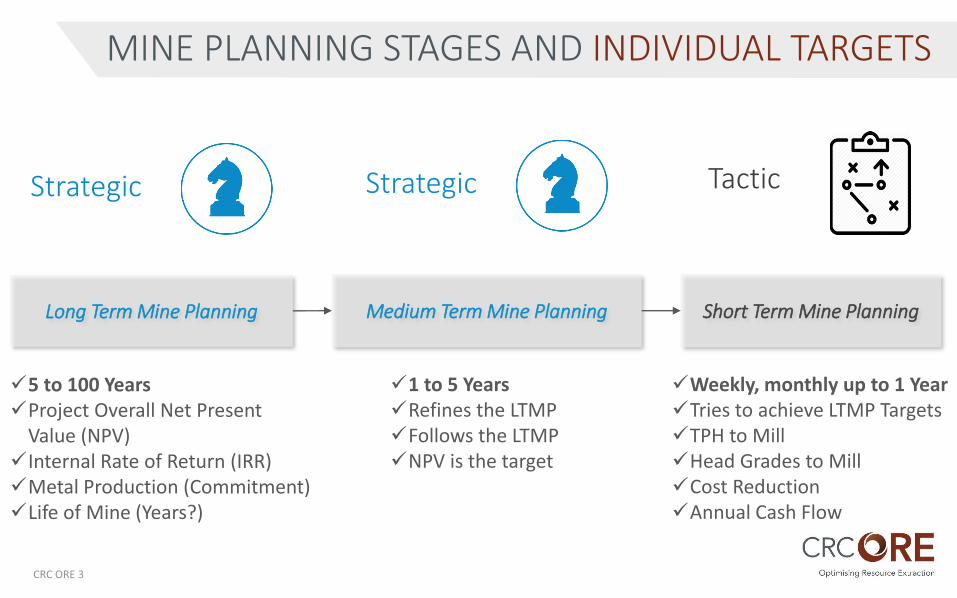
STRATEGIC LONG TERM MINE PLANNING (LTMP)
“An ‘Ore Reserve’ is the economically mineable part of aMeasured and/or Indicated Mineral Resource.” JORC 2014
One of the Main Targets of LTMP is to convert Ore Resources into Ore Reserves
The Main Target of LTMP is to achieve the economic and strategic targets of the Company / Shareholders
Net Present Value (NPV)Internal Rate of Return (IRR)Metal Production (Commitment)Life of Mine (Years?)
CRC ORE 4
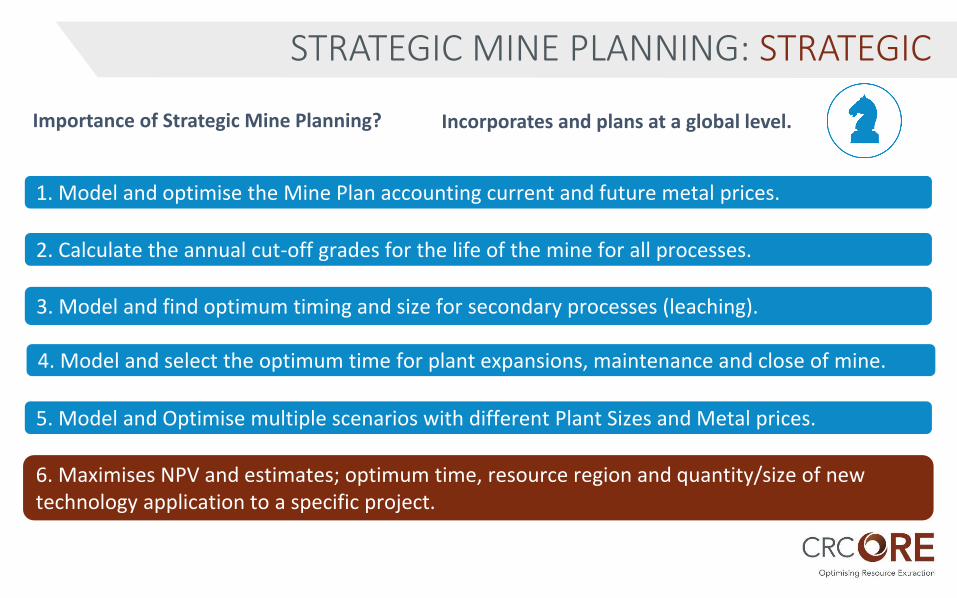
STRATEGIC MINE PLANNING: STRATEGIC
1. Model and optimise the Mine Plan accounting current and future metal prices.
2. Calculate the annual cut-off grades for the life of the mine for all processes.
4. Model and select the optimum time for plant expansions, maintenance and close of mine.
3. Model and find optimum timing and size for secondary processes (leaching).
Importance of Strategic Mine Planning?
6. Maximises NPV and estimates; optimum time, resource region and quantity/size of new technology application to a specific project.
Incorporates and plans at a global level.
5. Model and Optimise multiple scenarios with different Plant Sizes and Metal prices.
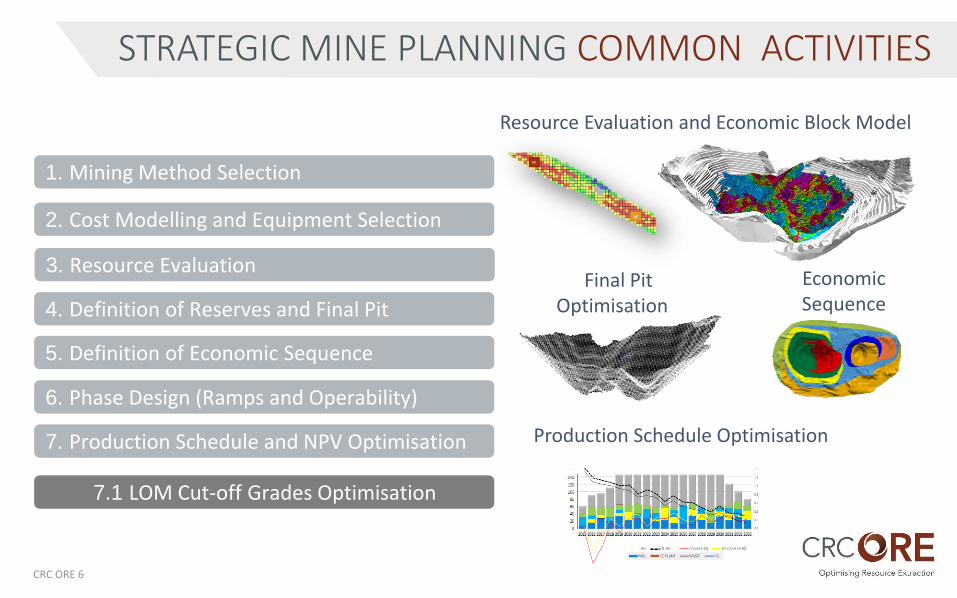
STRATEGIC MINE PLANNING COMMON ACTIVITIES
Final Pit Optimisation
Economic Sequence
Production Schedule Optimisation
1. Mining Method Selection
3. Resource Evaluation
4. Definition of Reserves and Final Pit
5. Definition of Economic Sequence
6. Phase Design (Ramps and Operability)
2. Cost Modelling and Equipment Selection
7. Production Schedule and NPV Optimisation
Resource Evaluation and Economic Block Model
7.1 LOM Cut-off Grades Optimisation
CRC ORE 6
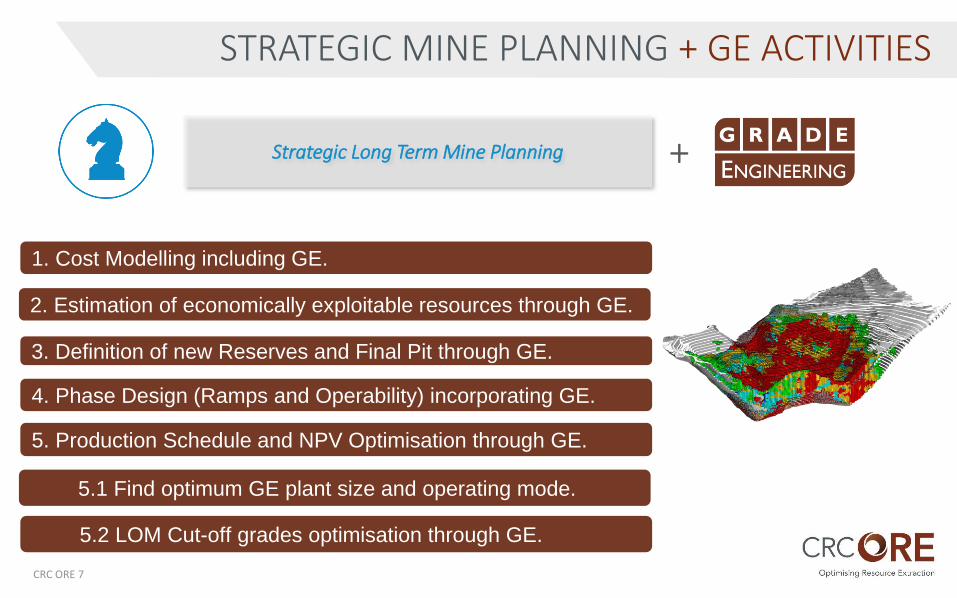
STRATEGIC MINE PLANNING + GE ACTIVITIES
Strategic Long Term Mine Planning +
1. Cost Modelling including GE.
3. Definition of new Reserves and Final Pit through GE.
4. Phase Design (Ramps and Operability) incorporating GE.
5. Production Schedule and NPV Optimisation through GE.
5.2 LOM Cut-off grades optimisation through GE.
5.1 Find optimum GE plant size and operating mode.
2. Estimation of economically exploitable resources through GE.
CRC ORE 7
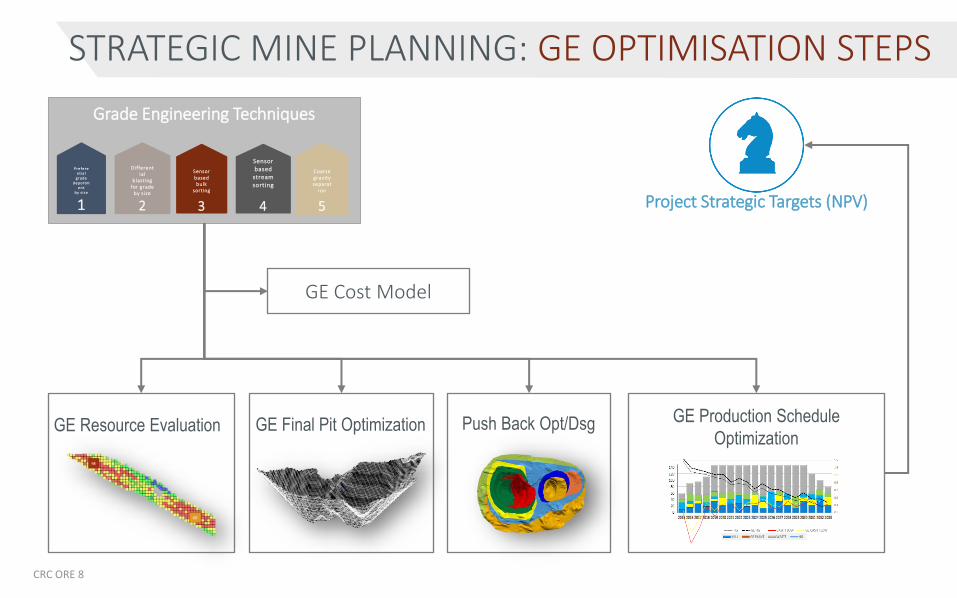
STRATEGIC MINE PLANNING: GE OPTIMISATION STEPS
Grade Engineering Techniques
Differential
blasting for grade
by s ize
2
Sensor based
stream sorting
4
Coarse gravity separat
ion
5
P r e fe ren t ia l
g r ade d e portm
e n t b y s ize
1
Sensor based bulk
sorting
3
GE Resource Evaluation GE Final Pit Optimization Push Back Opt/Dsg GE Production Schedule
Optimization
Project Strategic Targets (NPV)
GE Cost Model
CRC ORE 8
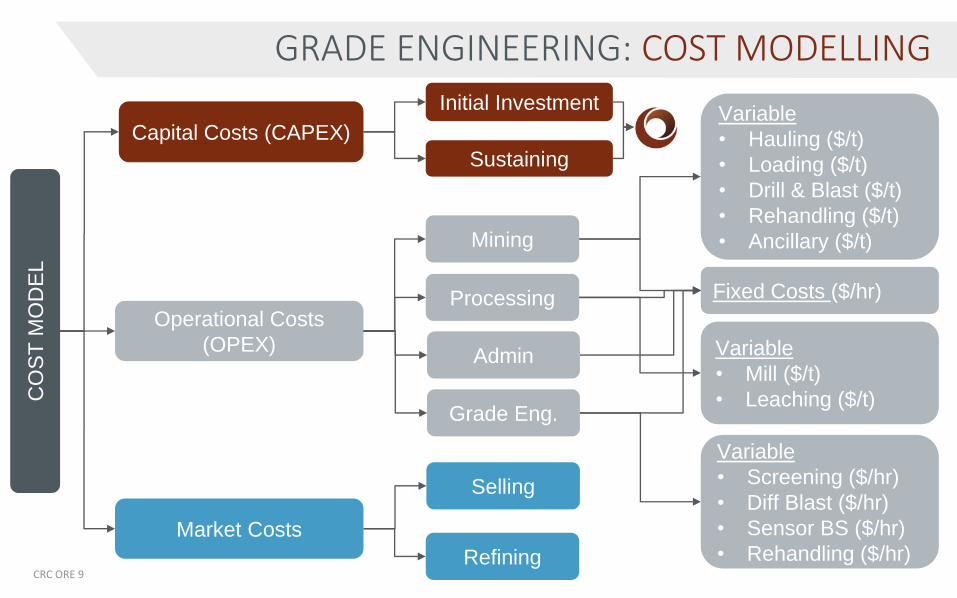
GRADE ENGINEERING: COST MODELLINGC
OS
T M
OD
EL
Capital Costs (CAPEX)
Operational Costs
(OPEX)
Initial Investment
Sustaining
Mining
Processing
Admin
Selling
Refining
Variable
• Mill ($/t)
• Leaching ($/t)
Variable
• Hauling ($/t)
• Loading ($/t)
• Drill & Blast ($/t)
• Rehandling ($/t)
• Ancillary ($/t)
Fixed Costs ($/hr)
Grade Eng.
Market Costs
Variable
• Screening ($/hr)
• Diff Blast ($/hr)
• Sensor BS ($/hr)
• Rehandling ($/hr)CRC ORE 9
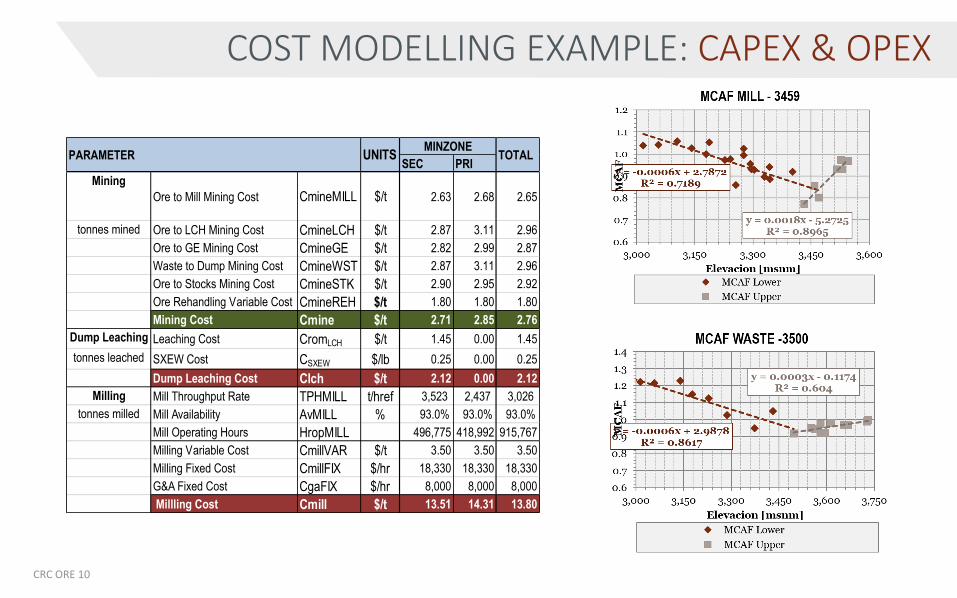
COST MODELLING EXAMPLE: CAPEX & OPEX
SEC PRI
Mining
Ore to Mill Mining Cost CmineMILL $/t 2.63 2.68 2.65
tonnes mined Ore to LCH Mining Cost CmineLCH $/t 2.87 3.11 2.96
Ore to GE Mining Cost CmineGE $/t 2.82 2.99 2.87
Waste to Dump Mining Cost CmineWST $/t 2.87 3.11 2.96
Ore to Stocks Mining Cost CmineSTK $/t 2.90 2.95 2.92
Ore Rehandling Variable Cost CmineREH $/t 1.80 1.80 1.80
Mining Cost Cmine $/t 2.71 2.85 2.76
Dump Leaching Leaching Cost CromLCH $/t 1.45 0.00 1.45
tonnes leached SXEW Cost CSXEW $/lb 0.25 0.00 0.25
Dump Leaching Cost Clch $/t 2.12 0.00 2.12
Milling Mill Throughput Rate TPHMILL t/href 3,523 2,437 3,026
tonnes milled Mill Availability AvMILL % 93.0% 93.0% 93.0%
Mill Operating Hours HropMILL 496,775 418,992 915,767
Milling Variable Cost CmillVAR $/t 3.50 3.50 3.50
Milling Fixed Cost CmillFIX $/hr 18,330 18,330 18,330
G&A Fixed Cost CgaFIX $/hr 8,000 8,000 8,000
Millling Cost Cmill $/t 13.51 14.31 13.80
MINZONEPARAMETER UNITS TOTAL
CRC ORE 10
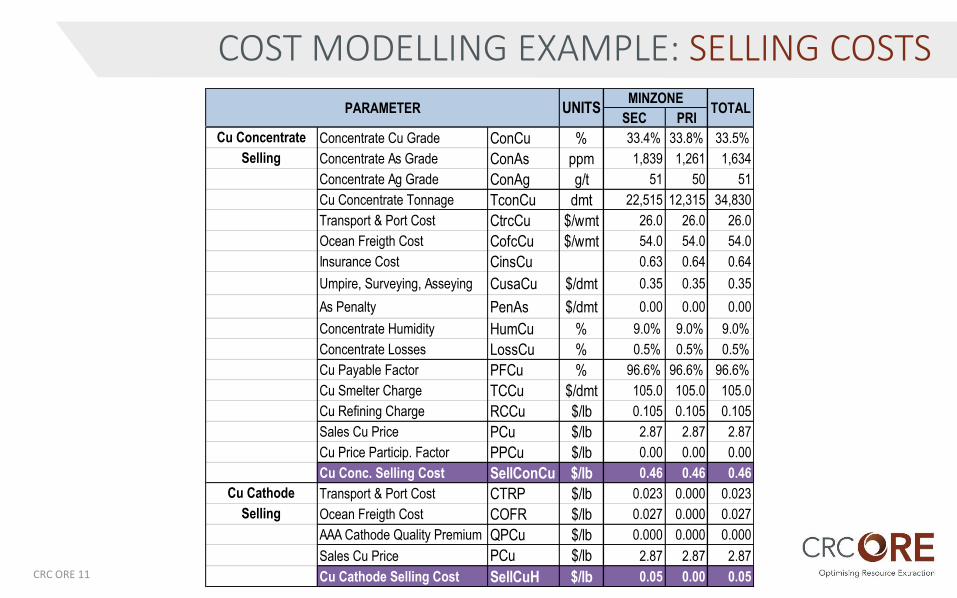
COST MODELLING EXAMPLE: SELLING COSTS
SEC PRI
Cu Concentrate Concentrate Cu Grade ConCu % 33.4% 33.8% 33.5%
Selling Concentrate As Grade ConAs ppm 1,839 1,261 1,634
Concentrate Ag Grade ConAg g/t 51 50 51
Cu Concentrate Tonnage TconCu dmt 22,515 12,315 34,830
Transport & Port Cost CtrcCu $/wmt 26.0 26.0 26.0
Ocean Freigth Cost CofcCu $/wmt 54.0 54.0 54.0
Insurance Cost CinsCu 0.63 0.64 0.64
Umpire, Surveying, Asseying CusaCu $/dmt 0.35 0.35 0.35
As Penalty PenAs $/dmt 0.00 0.00 0.00
Concentrate Humidity HumCu % 9.0% 9.0% 9.0%
Concentrate Losses LossCu % 0.5% 0.5% 0.5%
Cu Payable Factor PFCu % 96.6% 96.6% 96.6%
Cu Smelter Charge TCCu $/dmt 105.0 105.0 105.0
Cu Refining Charge RCCu $/lb 0.105 0.105 0.105
Sales Cu Price PCu $/lb 2.87 2.87 2.87
Cu Price Particip. Factor PPCu $/lb 0.00 0.00 0.00
Cu Conc. Selling Cost SellConCu $/lb 0.46 0.46 0.46
Cu Cathode Transport & Port Cost CTRP $/lb 0.023 0.000 0.023
Selling Ocean Freigth Cost COFR $/lb 0.027 0.000 0.027
AAA Cathode Quality Premium QPCu $/lb 0.000 0.000 0.000
Sales Cu Price PCu $/lb 2.87 2.87 2.87
Cu Cathode Selling Cost SellCuH $/lb 0.05 0.00 0.05
MINZONEPARAMETER UNITS TOTAL
CRC ORE 11
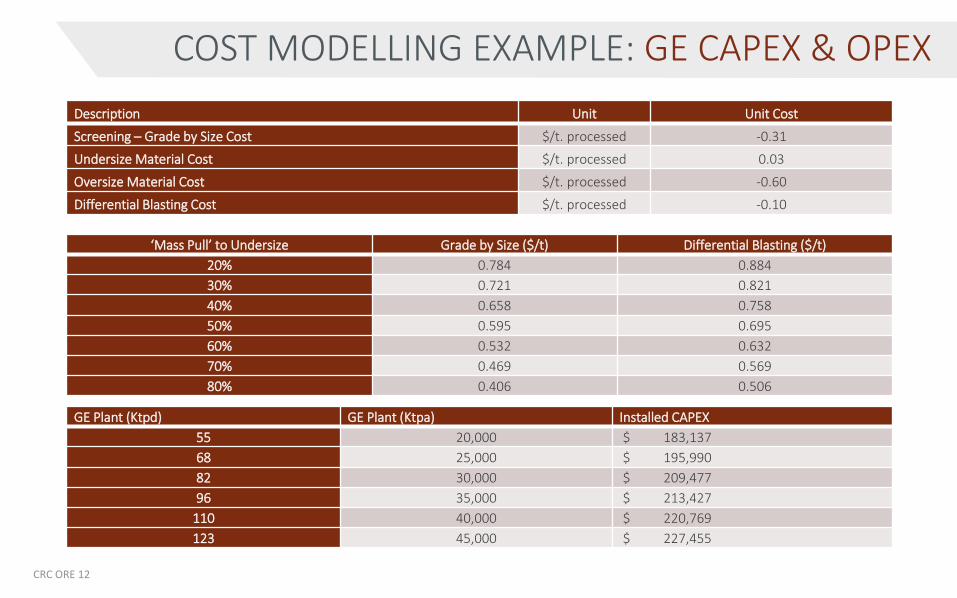
COST MODELLING EXAMPLE: GE CAPEX & OPEX
Description Unit Unit Cost
Screening – Grade by Size Cost $/t. processed -0.31
Undersize Material Cost $/t. processed 0.03
Oversize Material Cost $/t. processed -0.60
Differential Blasting Cost $/t. processed -0.10
‘Mass Pull’ to Undersize Grade by Size ($/t) Differential Blasting ($/t)
20% 0.784 0.884
30% 0.721 0.821
40% 0.658 0.758
50% 0.595 0.695
60% 0.532 0.632
70% 0.469 0.569
80% 0.406 0.506
GE Plant (Ktpd) GE Plant (Ktpa) Installed CAPEX
55 20,000 $ 183,137
68 25,000 $ 195,990
82 30,000 $ 209,477
96 35,000 $ 213,427
110 40,000 $ 220,769
123 45,000 $ 227,455
CRC ORE 12
GE
GE GE
G
E
G
E
G
E
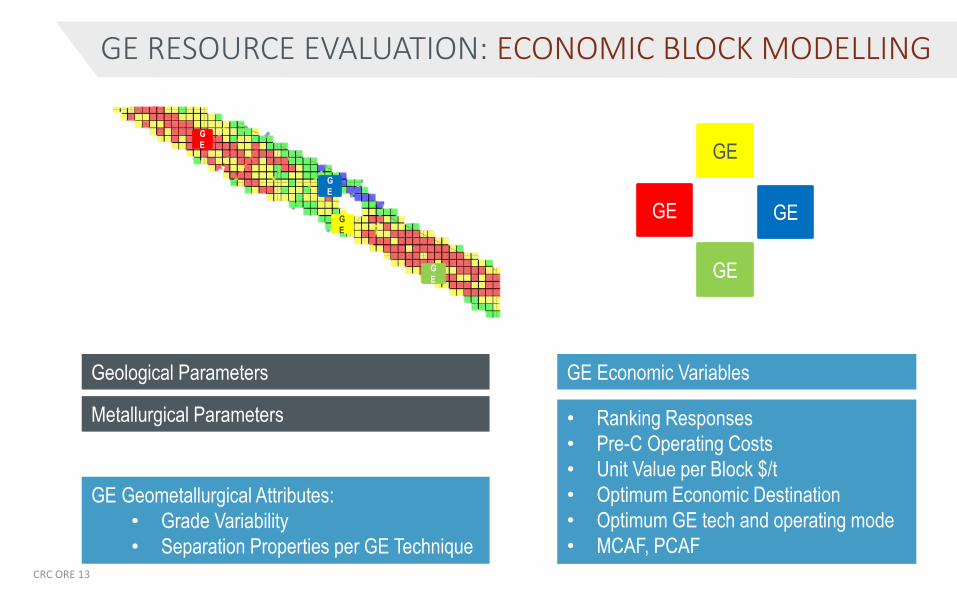
GE Economic Variables
GE
G
E
• Ranking Responses
• Pre-C Operating Costs
• Unit Value per Block $/t
• Optimum Economic Destination
• Optimum GE tech and operating mode
• MCAF, PCAF
GE Geometallurgical Attributes:
• Grade Variability
• Separation Properties per GE Technique
Geological Parameters
Metallurgical Parameters
CRC ORE 13
GE RESOURCE EVALUATION: ECONOMIC BLOCK MODELLING
GE RESOURCE EVALUATION: BLOCK VALUE & DESTINATION
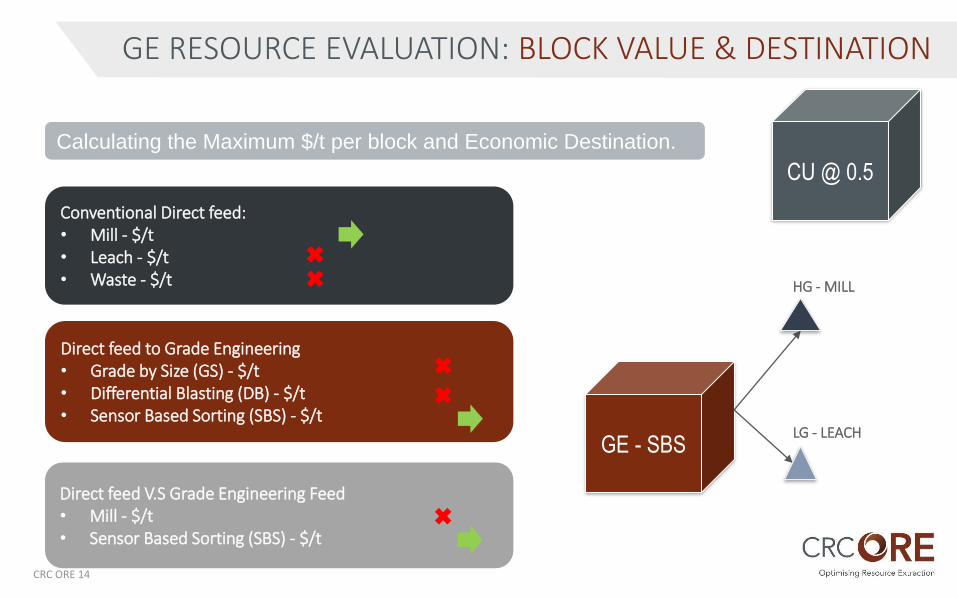
Calculating the Maximum $/t per block and Economic Destination.
CU @ 0.5
Conventional Direct feed:• Mill - $/t• Leach - $/t• Waste - $/t
Direct feed to Grade Engineering• Grade by Size (GS) - $/t• Differential Blasting (DB) - $/t• Sensor Based Sorting (SBS) - $/t
Direct feed V.S Grade Engineering Feed• Mill - $/t• Sensor Based Sorting (SBS) - $/t
GE - SBS
HG - MILL
LG - LEACH
CRC ORE 14
GE RESOURCE EVALUATION: RANKING RESPONSE & MASS PULL
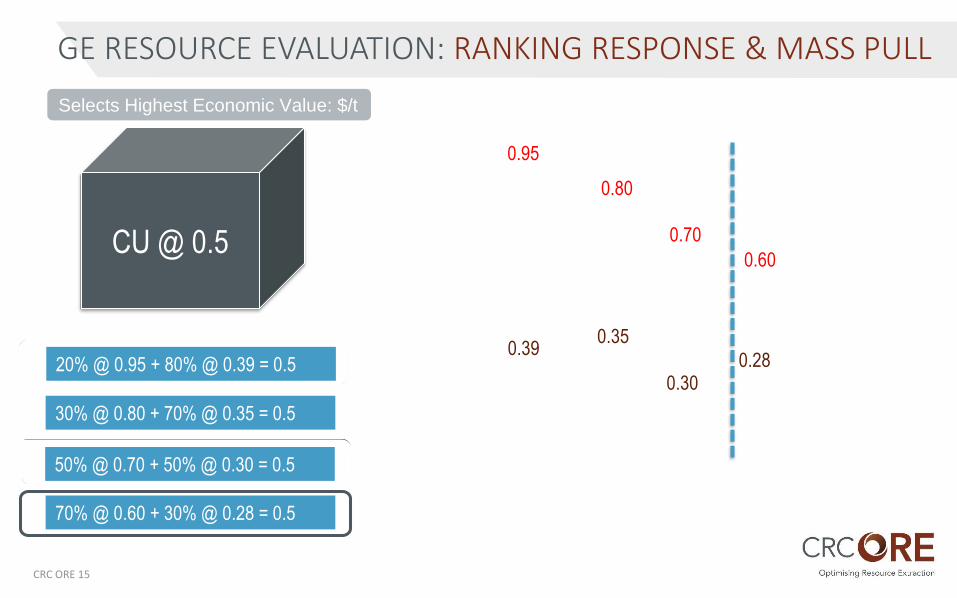
CU @ 0.5
20% @ 0.95 + 80% @ 0.39 = 0.5
30% @ 0.80 + 70% @ 0.35 = 0.5
50% @ 0.70 + 50% @ 0.30 = 0.5
0.95
0.39
0.80
0.35
0.70
0.30
70% @ 0.60 + 30% @ 0.28 = 0.5
0.60
0.28
Selects Highest Economic Value: $/t
CRC ORE 15
GE RESOURCE EVALUATION: BLOCK VALUE & DESTINATION
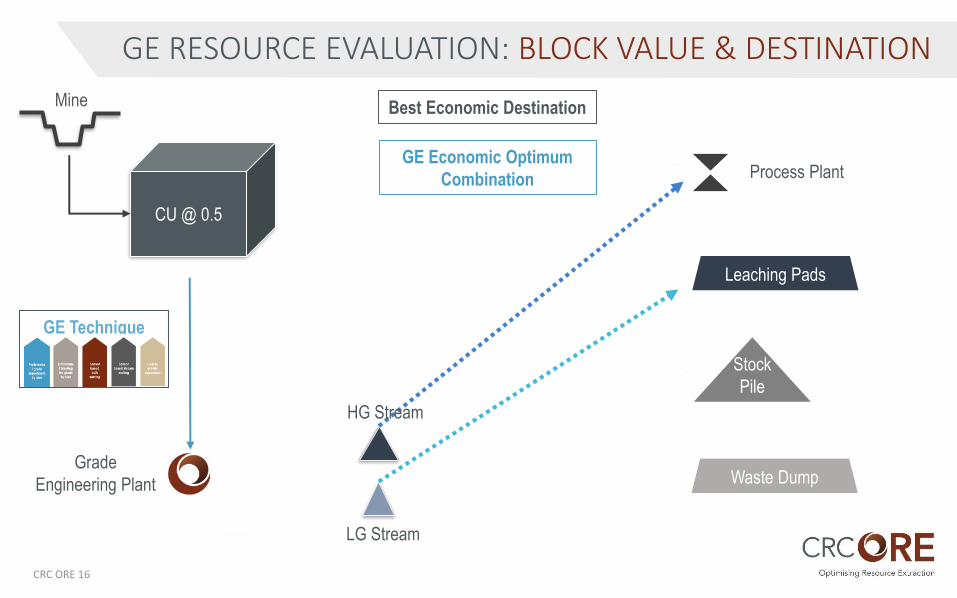
CU @ 0.5
Grade
Engineering Plant Waste Dump
Leaching Pads
Stock
Pile
Process Plant
Best Economic Destination
LG Stream
HG Stream
GE Economic Optimum
Combination
Mine
GE Technique
CRC ORE 16
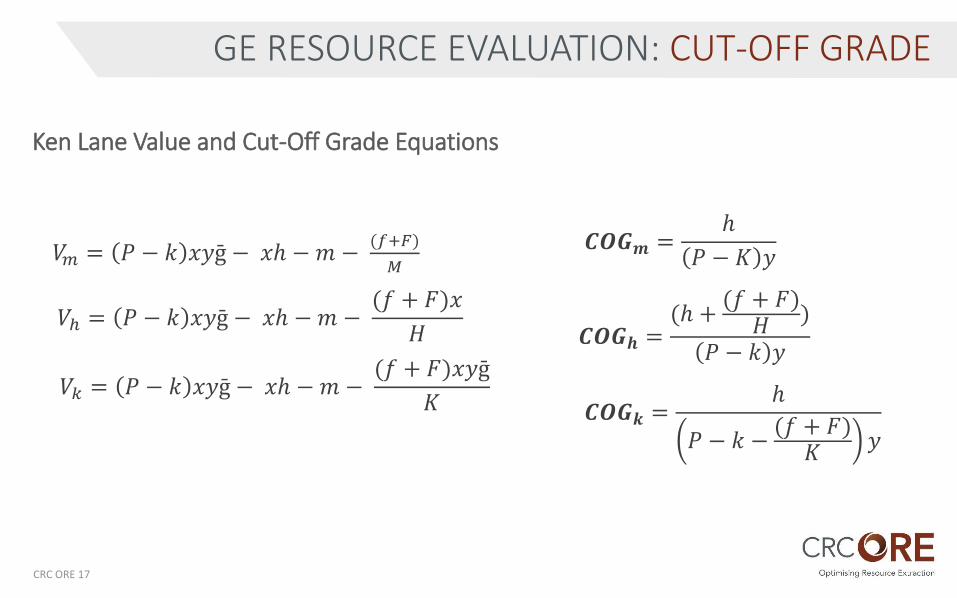
GE RESOURCE EVALUATION: CUT-OFF GRADE
𝑪𝑶𝑮𝒎 =ℎ
𝑃 − 𝐾 𝑦
𝑪𝑶𝑮𝒉 =(ℎ +
(𝑓 + 𝐹)𝐻
)
𝑃 − 𝑘 𝑦
𝑪𝑶𝑮𝒌 =ℎ
𝑃 − 𝑘 −(𝑓 + 𝐹)𝐾
𝑦
Ken Lane Value and Cut-Off Grade Equations
𝑉𝑚 = 𝑃 − 𝑘 𝑥𝑦ḡ − 𝑥ℎ −𝑚 −(𝑓+𝐹)
𝑀
𝑉ℎ = 𝑃 − 𝑘 𝑥𝑦ḡ − 𝑥ℎ −𝑚 −(𝑓 + 𝐹)𝑥
𝐻
𝑉𝑘 = 𝑃 − 𝑘 𝑥𝑦ḡ − 𝑥ℎ −𝑚 −(𝑓 + 𝐹)𝑥𝑦ḡ
𝐾
CRC ORE 17
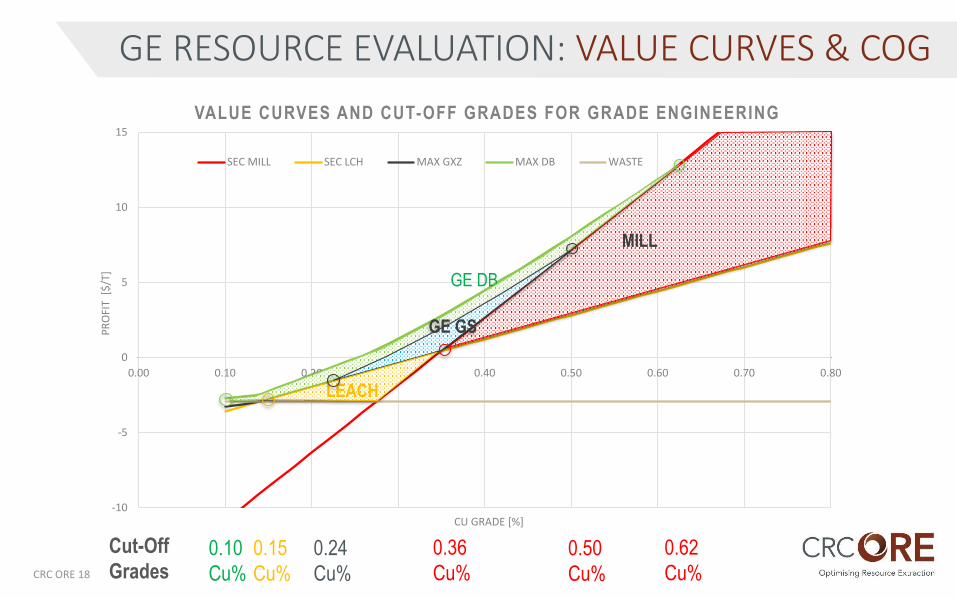
GE RESOURCE EVALUATION: VALUE CURVES & COG
-10
-5
0
5
10
15
0.00 0.10 0.20 0.30 0.40 0.50 0.60 0.70 0.80
PR
OFI
T [
$/T
]
CU GRADE [%]
VALUE CURVES AND CUT-OFF GRADES FOR GRADE ENGINEERING
SEC MILL SEC LCH MAX GXZ MAX DB WASTE
GE DB
MILL
GE GS
0.36
Cu%0.50
Cu%
0.24
Cu%
0.10
Cu%
0.62
Cu%
LEACH
0.15
Cu%
Cut-Off
GradesCRC ORE 18
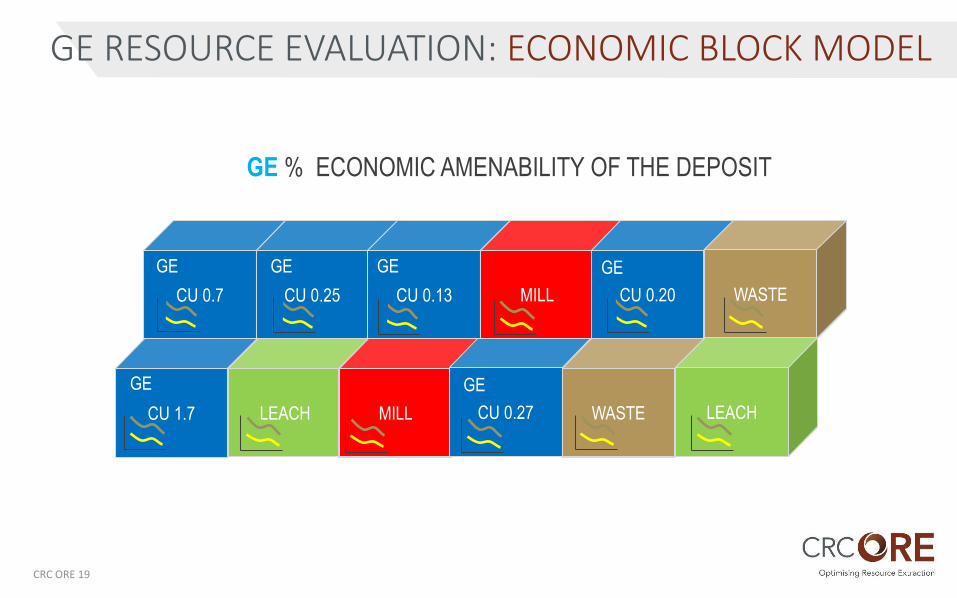
CU 1.7 CU 0.27LEACH CU 1.3MILL CU 0.27
CU 0.7 CU 0.25 CU 0.13 CU 1.0MILL CU 0.20 CU 0.10WASTE
GE % ECONOMIC AMENABILITY OF THE DEPOSIT
GE GE GE GE
GEGE
CU 0.15 CU 0.25WASTE LEACH
GE
CRC ORE 19
GE RESOURCE EVALUATION: ECONOMIC BLOCK MODEL
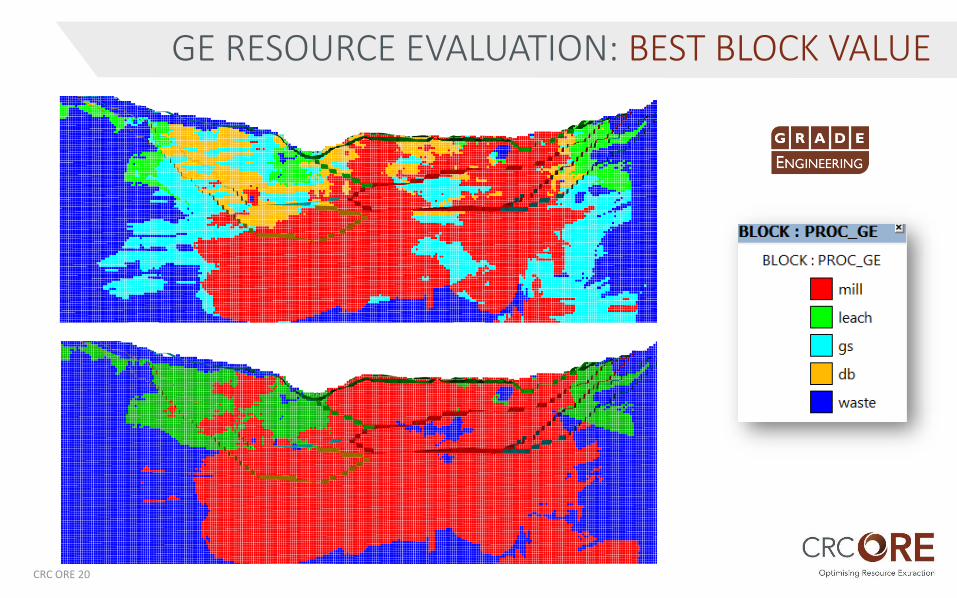
GE RESOURCE EVALUATION: BEST BLOCK VALUE
CRC ORE 20
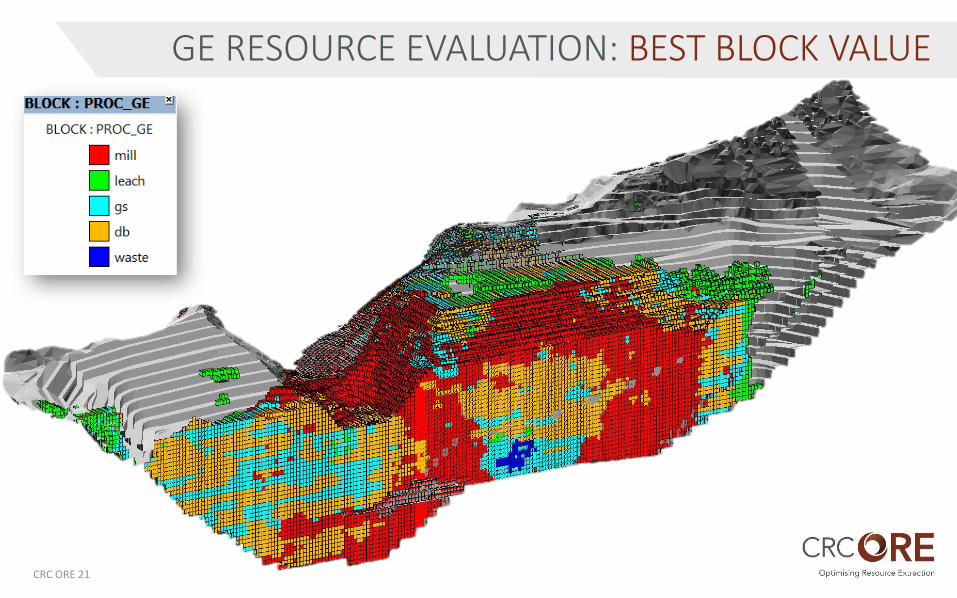
GE RESOURCE EVALUATION: BEST BLOCK VALUE
CRC ORE 21
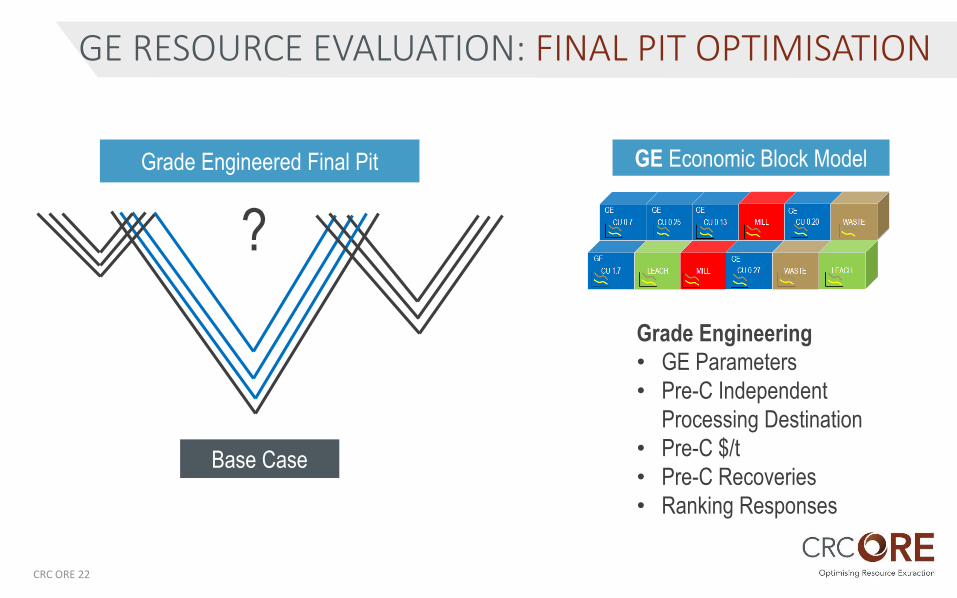
GE RESOURCE EVALUATION: FINAL PIT OPTIMISATION
?
Grade Engineered Final Pit GE Economic Block Model
Grade Engineering
• GE Parameters
• Pre-C Independent
Processing Destination
• Pre-C $/t
• Pre-C Recoveries
• Ranking Responses
Base Case
CRC ORE 22
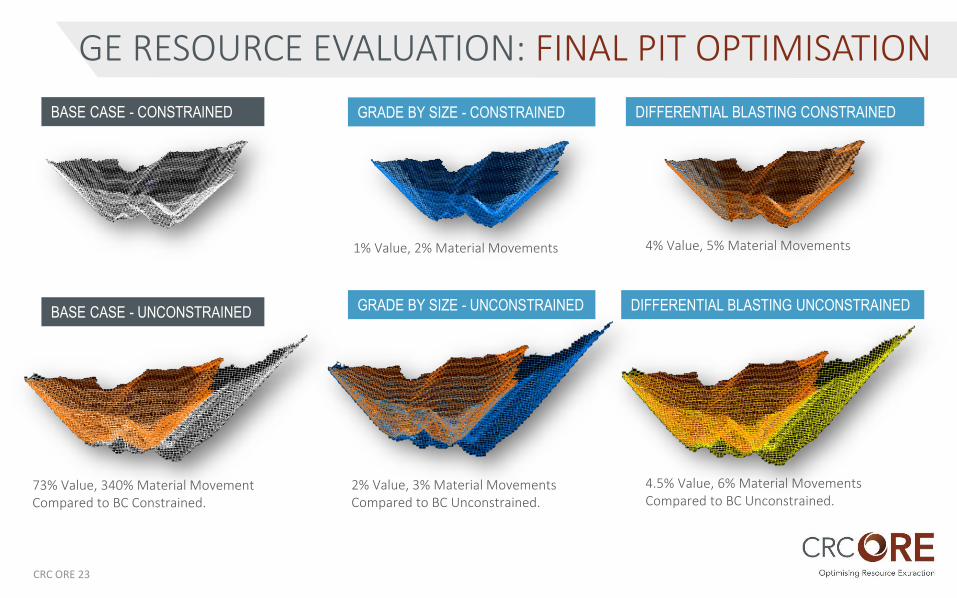
GE RESOURCE EVALUATION: FINAL PIT OPTIMISATION
BASE CASE - CONSTRAINED GRADE BY SIZE - CONSTRAINED DIFFERENTIAL BLASTING CONSTRAINED
BASE CASE - UNCONSTRAINED GRADE BY SIZE - UNCONSTRAINED DIFFERENTIAL BLASTING UNCONSTRAINED
1% Value, 2% Material Movements 4% Value, 5% Material Movements
2% Value, 3% Material Movements Compared to BC Unconstrained.
4.5% Value, 6% Material MovementsCompared to BC Unconstrained.
73% Value, 340% Material MovementCompared to BC Constrained.
CRC ORE 23
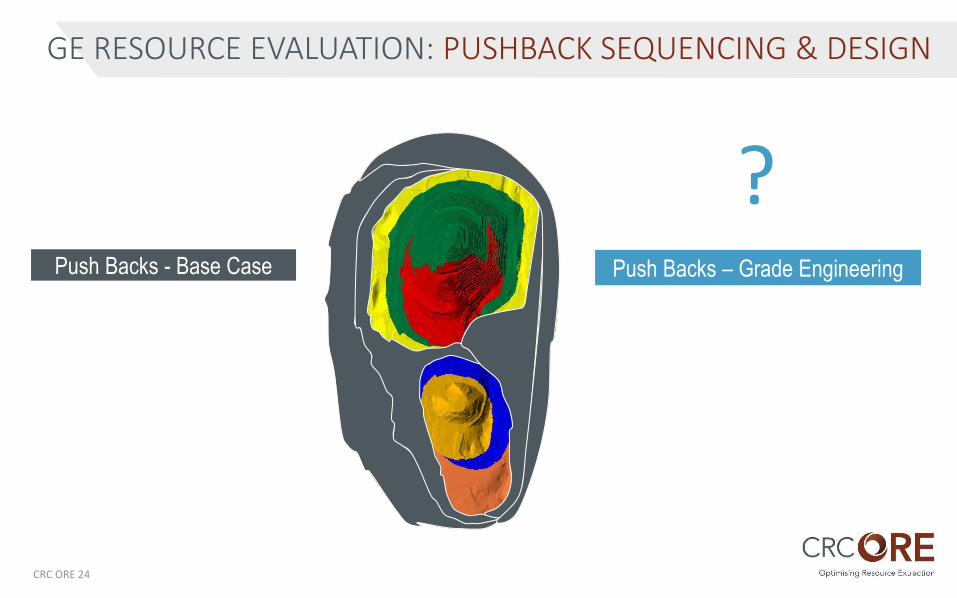
GE RESOURCE EVALUATION: PUSHBACK SEQUENCING & DESIGN
?Push Backs - Base Case Push Backs – Grade Engineering
CRC ORE 24
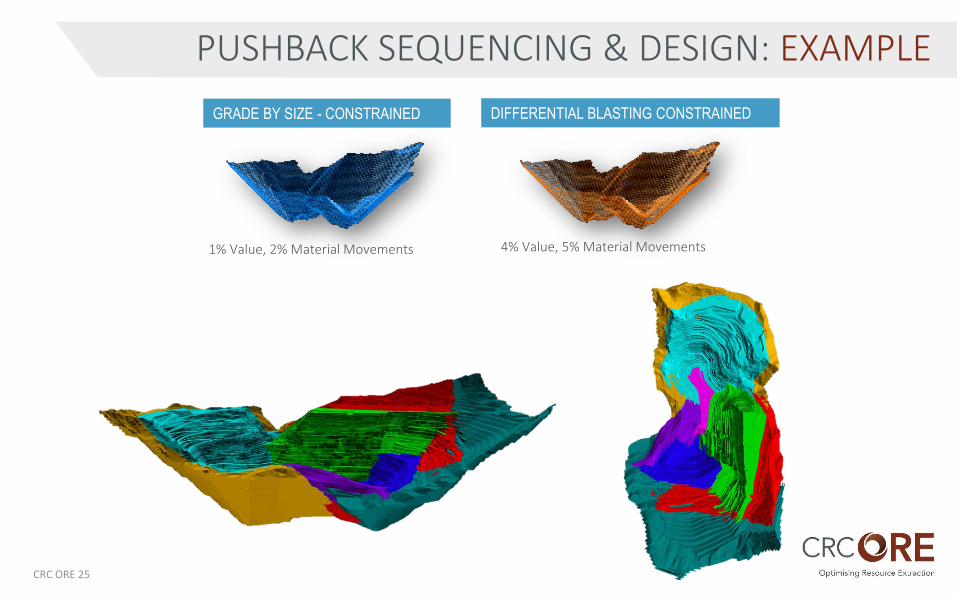
PUSHBACK SEQUENCING & DESIGN: EXAMPLE
GRADE BY SIZE - CONSTRAINED DIFFERENTIAL BLASTING CONSTRAINED
1% Value, 2% Material Movements 4% Value, 5% Material Movements
CRC ORE 25
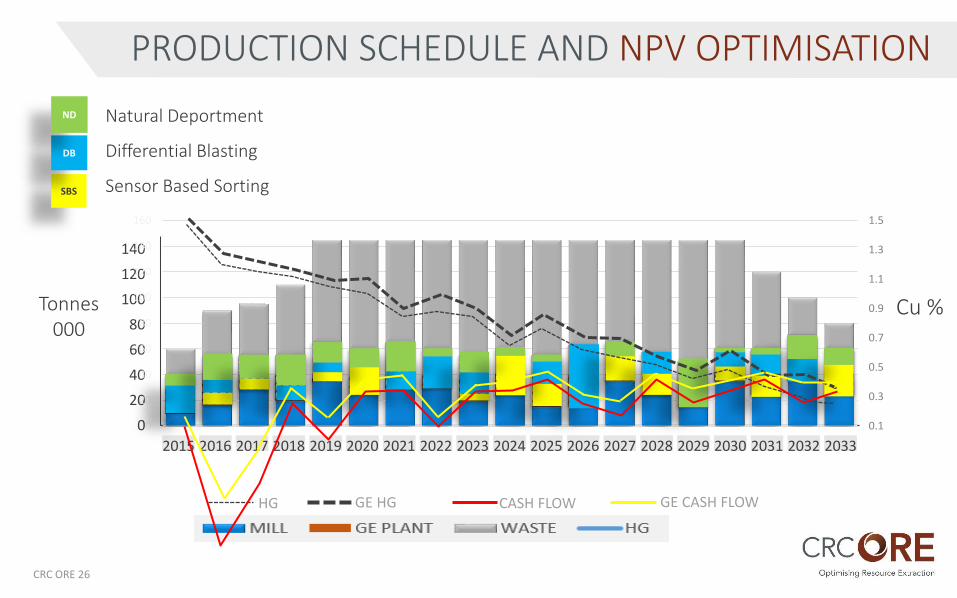
PRODUCTION SCHEDULE AND NPV OPTIMISATION
0
20
40
60
80
100
120
140
2015 2016 2017 2018 2019 2020 2021 2022 2023 2024 2025 2026 2027 2028 2029 2030 2031 2032 2033
0.1
0.3
0.5
0.7
0.9
1.1
1.3
1.5
0
20
40
60
80
100
120
140
160
SBS
DB
ND Natural Deportment
Differential Blasting
Sensor Based Sorting
GE
GE
GE
GE
GE
GE
GE
GE
GE
GE
GE
GE G
E
GE G
E
GE
GE
GE
GE
HG GE HG CASH FLOW GE CASH FLOW
Tonnes000
Cu %
CRC ORE 26
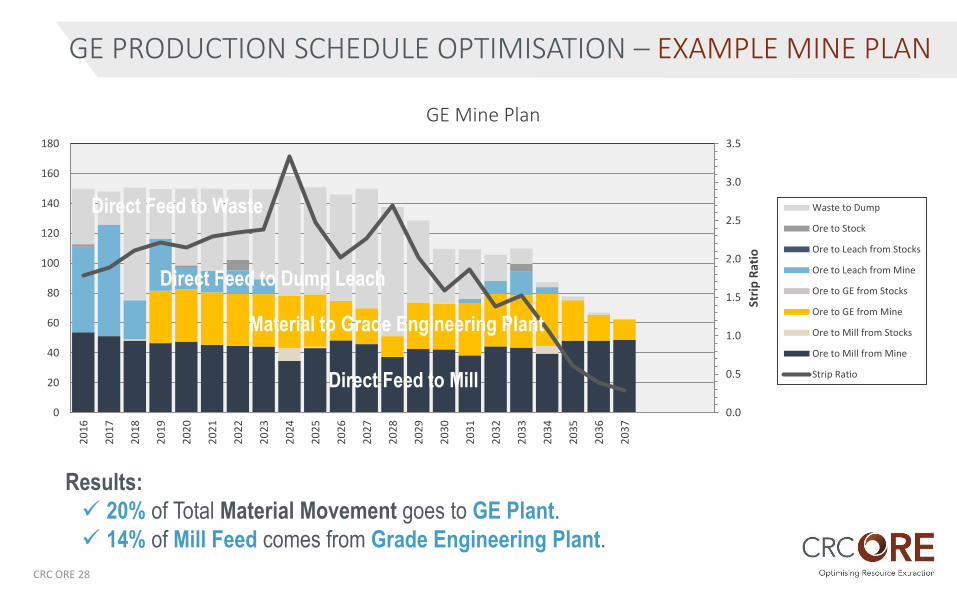
GE PRODUCTION SCHEDULE OPTIMISATION – EXAMPLE MINE PLAN
0.0
0.5
1.0
1.5
2.0
2.5
3.0
3.5
0
20
40
60
80
100
120
140
160
180
20
16
20
17
20
18
20
19
20
20
20
21
20
22
20
23
20
24
20
25
20
26
20
27
20
28
20
29
20
30
20
31
20
32
20
33
20
34
20
35
20
36
20
37
Stri
p R
atio
GE Mine Plan
Waste to Dump
Ore to Stock
Ore to Leach from Stocks
Ore to Leach from Mine
Ore to GE from Stocks
Ore to GE from Mine
Ore to Mill from Stocks
Ore to Mill from Mine
Strip Ratio
Results:
20% of Total Material Movement goes to GE Plant.
14% of Mill Feed comes from Grade Engineering Plant.
Material to Grade Engineering Plant
Direct Feed to Waste
Direct Feed to Mill
Direct Feed to Dump Leach
CRC ORE 28
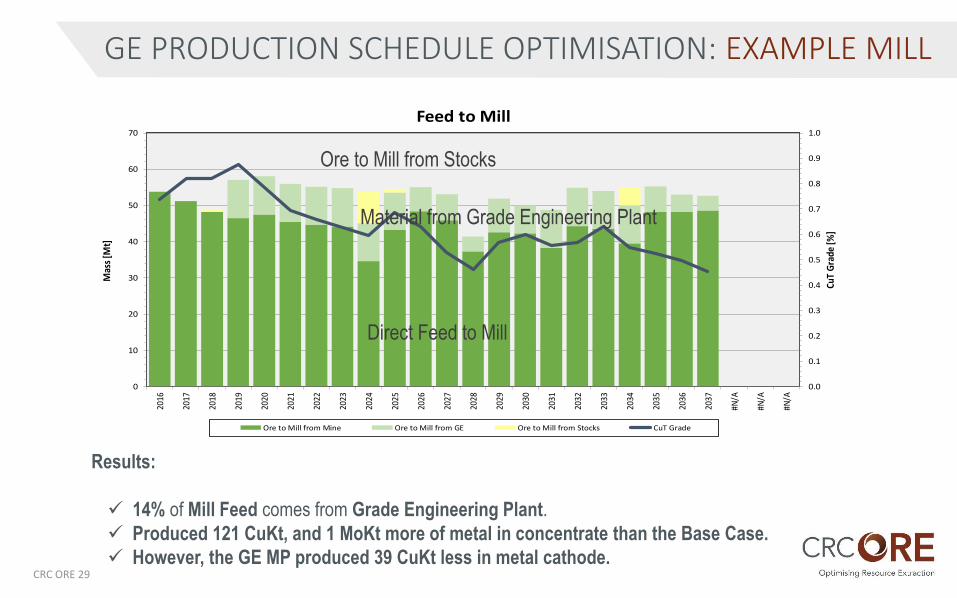
GE PRODUCTION SCHEDULE OPTIMISATION: EXAMPLE MILL
0.0
0.1
0.2
0.3
0.4
0.5
0.6
0.7
0.8
0.9
1.0
0
10
20
30
40
50
60
70
2016
2017
2018
2019
2020
2021
2022
2023
2024
2025
2026
2027
2028
2029
2030
2031
2032
2033
2034
2035
2036
2037
#N/A
#N/A
#N/A
CuT
Gra
de [%
]
Mas
s [M
t]Feed to Mill
Ore to Mill from Mine Ore to Mill from GE Ore to Mill from Stocks CuT Grade
Results:
14% of Mill Feed comes from Grade Engineering Plant.
Produced 121 CuKt, and 1 MoKt more of metal in concentrate than the Base Case.
However, the GE MP produced 39 CuKt less in metal cathode.
Material from Grade Engineering Plant
Direct Feed to Mill
Ore to Mill from Stocks
CRC ORE 29
GE PRODUCTION SCHEDULE OPTIMISATION: EXAMPLE GE PLANT
0
0.1
0.2
0.3
0.4
0.5
0.6
0.7
0.8
0.9
1
0
5
10
15
20
25
30
35
40
2016 2017 2018 2019 2020 2021 2022 2023 2024 2025 2026 2027 2028 2029 2030 2031 2032 2033 2034 2035 2036 2037
MIl
lion
To
nn
es
Material Feed to Grade Engineering Plant
Total Ore to Mill from GE Total Ore to Dump Leach from GE Total Wast to Waste Dump from GE
Ore to Mill from GE CuT Grade (%) Ore to Mill from GE CuT Grade (%) Waste to Waste Dump from GE CuT Grade (%)
Total Ore to GE CuT Grade (%)
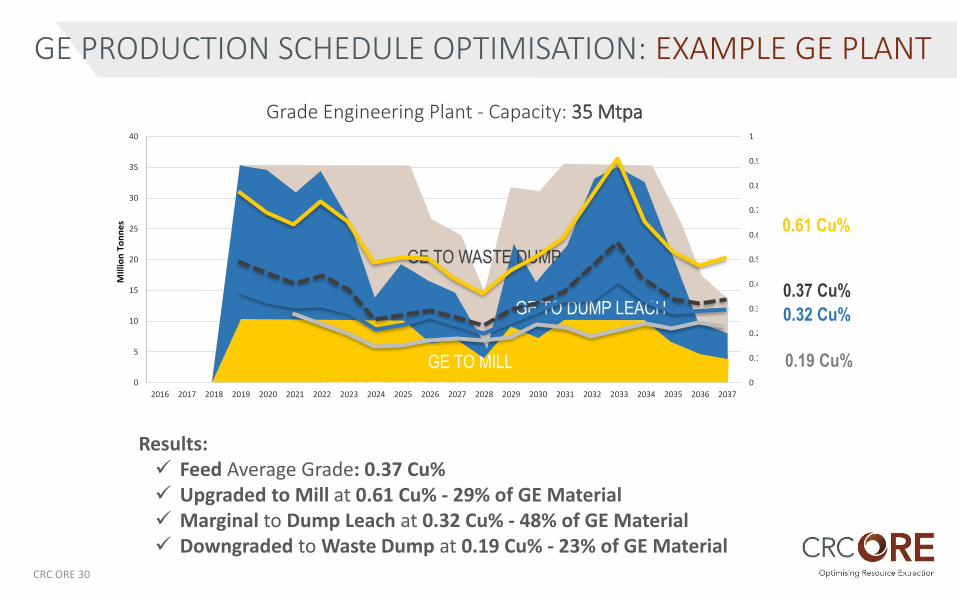
Grade Engineering Plant - Capacity: 35 Mtpa
Results: Feed Average Grade: 0.37 Cu% Upgraded to Mill at 0.61 Cu% - 29% of GE Material Marginal to Dump Leach at 0.32 Cu% - 48% of GE Material Downgraded to Waste Dump at 0.19 Cu% - 23% of GE Material
Upgraded Material to Mill
Dowgraded Material to Dump LeachGE FEED
GE TO MILL
GE TO DUMP LEACH
GE TO WASTE DUMP
0.37 Cu%
0.32 Cu%
0.61 Cu%
0.19 Cu%
CRC ORE 30
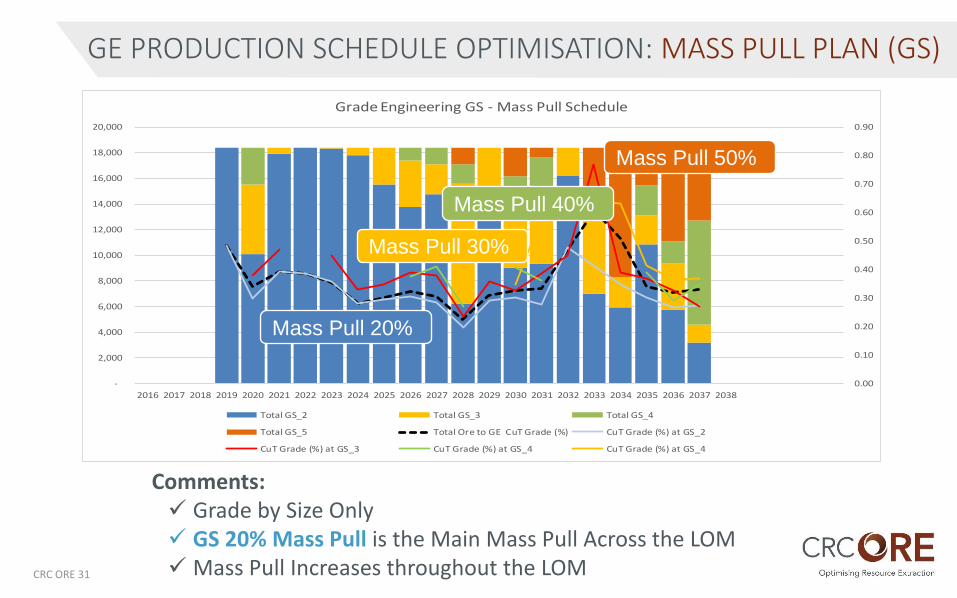
GE PRODUCTION SCHEDULE OPTIMISATION: MASS PULL PLAN (GS)
Comments: Grade by Size Only GS 20% Mass Pull is the Main Mass Pull Across the LOM Mass Pull Increases throughout the LOM
0.00
0.10
0.20
0.30
0.40
0.50
0.60
0.70
0.80
0.90
-
2,000
4,000
6,000
8,000
10,000
12,000
14,000
16,000
18,000
20,000
2016 2017 2018 2019 2020 2021 2022 2023 2024 2025 2026 2027 2028 2029 2030 2031 2032 2033 2034 2035 2036 2037 2038
Grade Engineering GS - Mass Pull Schedule
Total GS_2 Total GS_3 Total GS_4
Total GS_5 Total Ore to GE CuT Grade (%) CuT Grade (%) at GS_2
CuT Grade (%) at GS_3 CuT Grade (%) at GS_4 CuT Grade (%) at GS_4
CRC ORE 31
Mass Pull 20%
Mass Pull 30%
Mass Pull 40%
Mass Pull 50%
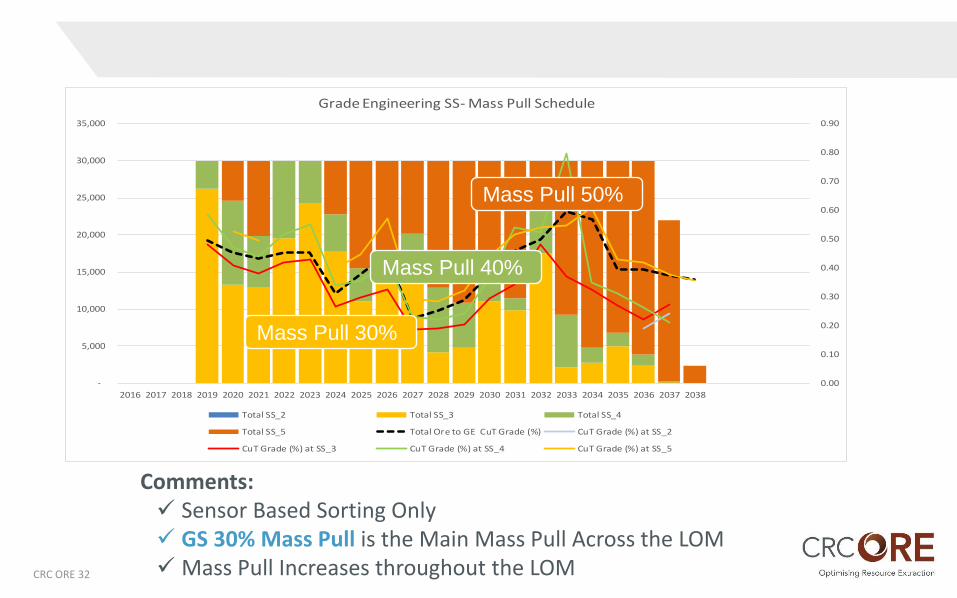
Comments: Sensor Based Sorting Only GS 30% Mass Pull is the Main Mass Pull Across the LOM Mass Pull Increases throughout the LOM
0.00
0.10
0.20
0.30
0.40
0.50
0.60
0.70
0.80
0.90
-
5,000
10,000
15,000
20,000
25,000
30,000
35,000
2016 2017 2018 2019 2020 2021 2022 2023 2024 2025 2026 2027 2028 2029 2030 2031 2032 2033 2034 2035 2036 2037 2038
Grade Engineering SS- Mass Pull Schedule
Total SS_2 Total SS_3 Total SS_4
Total SS_5 Total Ore to GE CuT Grade (%) CuT Grade (%) at SS_2
CuT Grade (%) at SS_3 CuT Grade (%) at SS_4 CuT Grade (%) at SS_5
CRC ORE 32
Mass Pull 30%
Mass Pull 40%
Mass Pull 50%
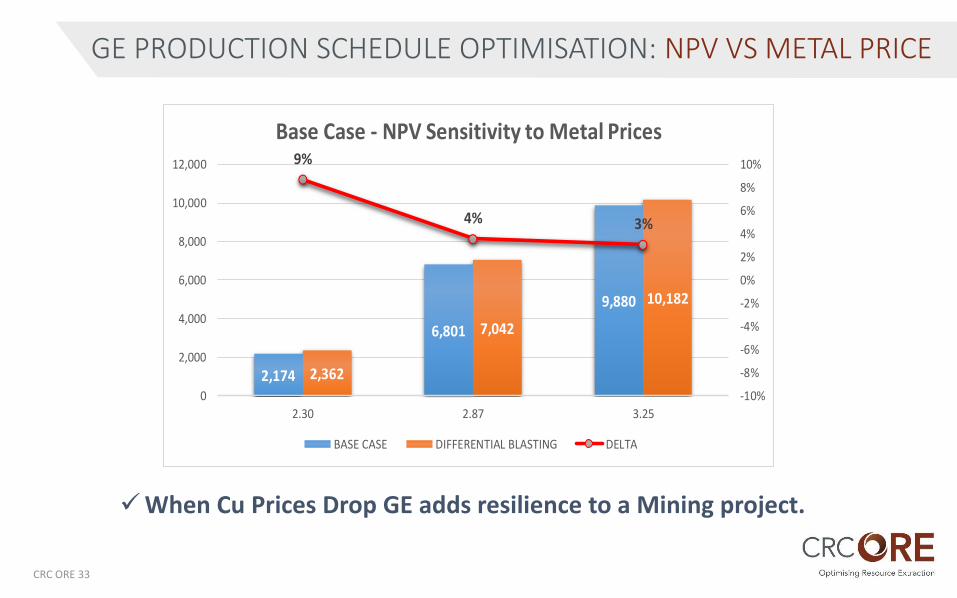
GE PRODUCTION SCHEDULE OPTIMISATION: NPV VS METAL PRICE
2,174
6,801
9,880
2,362
7,042
10,182
9%
4% 3%
-10%
-8%
-6%
-4%
-2%
0%
2%
4%
6%
8%
10%
0
2,000
4,000
6,000
8,000
10,000
12,000
2.30 2.87 3.25
Base Case - NPV Sensitivity to Metal Prices
BASE CASE DIFFERENTIAL BLASTING DELTA
When Cu Prices Drop GE adds resilience to a Mining project.
CRC ORE 33
STRATEGIC MINE PLANNING: CONCLUSIONS
Grade Engineering Amenability
Every Deposit is Different
Every Deposit will have different heterogeneity, grade variability.
Every Project will be amenable to different Grade Engineering Techniques and at different scales.
GE Full Mine Planning Optimisation aids to reach and improve Strategic Goals.
NPV Improvement of 3% to 15% achieved through GE fully optimised mine plans
Head Grade Improvement from 3% to 15%, per year and for LOM.
Improvement in Metal in Cu concentrate
Improvement in Metal in Mo concentrate
Reduction in Metal in Cu cathode
When Cu Prices Drop GE adds resilience to the project.
CRC ORE 34

invent
introduce
Strategic Mine [email protected]
www.crcore.org.au
Carlos EspejelMine PlanningEngineer