Embed Size (px)
Citation preview
Objective: Outline the Objective: Outline the strategies used in strategies used in
various dimensions of various dimensions of production planningproduction planning
Objective: Outline the Objective: Outline the strategies used in strategies used in
various dimensions of various dimensions of production planningproduction planning
Strategies for Production Planning
• Forecasting Techniques• Product Design Planning • Layout of Business• Scheduling
Forecasting Techniques• Sales force composite• Delphi method• Consumer surveys• Jury of experts• Moving averages• Least squares regression

Forecasting • Forecasting is the art and science
of predicting future events.• There are two approaches to
forecasting, namely: - Qualitative and- Quantitative approaches
Qualitative Forecasting Techniques
• Jury of Executive Opinion (Jury of Experts)
• Sales Force Composite• Delphi Method• Consumer Market Surveys
(consumer surveys)
Jury of Experts• Under this method, the opinions of
a group of high-level managers, often in combination with statistical models, are pooled to arrive at a group estimate of demand
Sales Force Composite• In this approach, each salesperson
estimates what sales will be in his or her region.
• These forecasts are then reviewed to ensure they are realistic and then combined at the district and national levels to reach an overall forecast.
Delphi Method• There are three different types of participants in the Delphi
Method:- decision makers- Staff personnel and- Respondents• The decision makers usually consist of a group of 5 to 10
experts who will be making the actual forecast.• The staff personnel assist the decision makers by preparing,
distributing, collecting and summarizing a series of questionnaires and survey results.
• The respondents are a group of people, often located in different places, whose judgments are valued and are being sought.
• This group provides inputs to the decision makers before the forecast is made. See example

The State of Alaska used the Delphi Method
Alaska’s economy is dominated by oil. An amazing 90% of the state’s budget is derived from 1.5 million barrels of oil pumped daily through a pipeline at Prudhoe Bay. To develop a long-range economic forecast, the State of Alaska turned to the Delphi Method. The large Delphi panel of experts had to represent all groups and opinions in the state and all geographic areas. But Delphi was the perfect forecasting tool because panelist travel could be avoided. It also meant leading Alaskans could participate because their schedules were not impacted by meetings and distances.

Consumer Market Survey
• This method solicits input from customers or potential customers regarding their future purchasing plans.
• It can help not only in preparing a forecast, but also in improving product design and planning for new products
Overview of Quantitative Methods Quantitative approaches to forecasting include:
• Naïve approach• Moving averages• Exponential smoothing• Trend projection• Linear-regression causal model• Least Squares Regression
These models can be further classified into two categories, namely, time-series models and causal models.
Time-series ModelsTime-series models predict on the assumption that the future is a function of the past. In other words, they look at what has happened over a period of time and use a series of past data to make a forecast. If we are predicting weekly sales of lawn mowers, we use the past weekly sales for lawn mowers in making the forecast. Examples of time-series models are as follows:
• Naïve approach• Moving averages• Exponential smoothing• Trend projection
Causal Model• Causal models, such as linear regression,
incorporate the variables or factors that might influence the quantity being forecast. For example, a causal model for lawn-mower sales might include factors such as new advertising budget, and competitors’ prices.
• Example of a causal model is the Linear-regression causal model and Least Square Regression
Moving Averages• A moving average forecast uses a number of recent actual data
values to generate a forecast.• Moving averages are one of the most popular and easy to use tools
available to the technical analyst. They smooth a data series and make it easier to spot trends, something that is especially helpful in volatile markets. They also form the building blocks for many other technical indicators and overlays.
• A moving average series can be calculated for any time series, but is most often applied to stock prices, returns or trading volumes. Moving averages are used to smooth out short-term fluctuations, thus highlighting longer-term trends or cycles. The threshold between short-term and long-term depends on the application, and the parameters of the moving average will be set accordingly.
• Moving average is also useful if we can assume that sales will stay fairly steady over time. A 4-month moving average is found by simply summing the demand during the past 4 months and dividing by 4.
• With each passing month, the most recent month’s data are added to the sum of the previous 3 months’ data, and the earliest is
• dropped. This tends to smooth out short-term irregularities • in the data series.
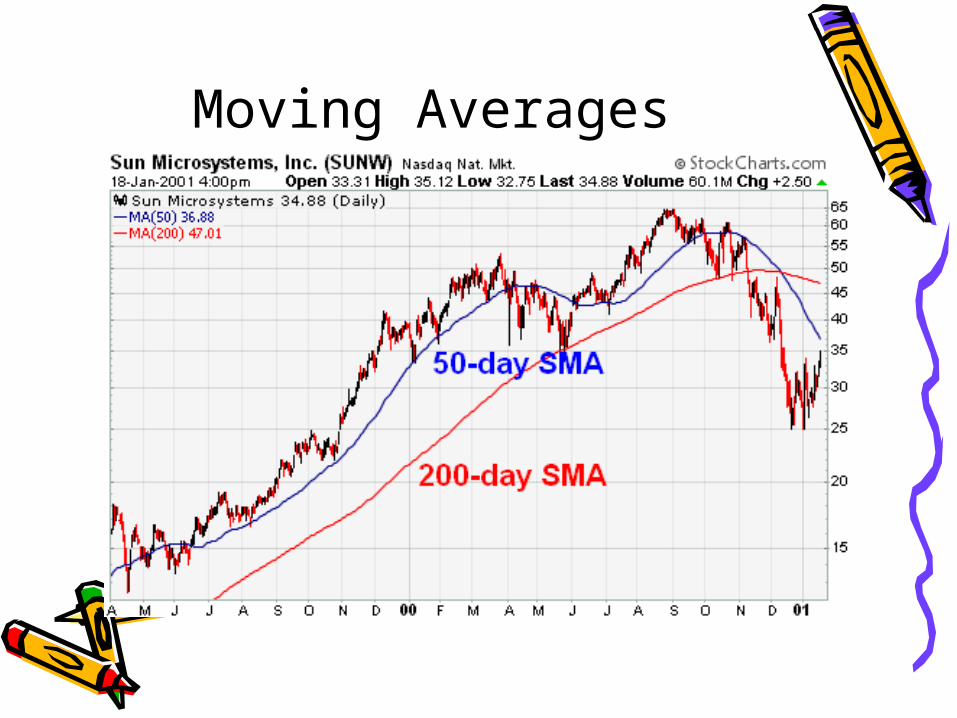
Moving Averages
Simple Moving Average (SMA)
• Again. A simple moving average is formed by computing the average (mean) price of a security over a specified number of periods. While it is possible to create moving averages from the Open, the High, and the Low data points, most moving averages are created using the closing price. For example: a 5-day simple moving average is calculated by adding the closing prices for the last 5 days and dividing the total by 5.
EXAMPLE• The calculation is repeated for each price
bar on the chart. The averages are then joined to form a smooth curving line - the moving average line. Continuing our example, if the next closing price in the average is 15, then this new period would be added and the oldest day, which is 10, would be dropped. The new 5-day simple moving average would be calculated as follows:
• Over the last 2 days, the SMA moved from 12 to 13. As new days are added, the old days will be subtracted and the moving average will continue to move over time.

• In the example above, using closing prices from Eastman Kodak (EK), day 10 is the first day possible to calculate a 10-day simple moving average. As the calculation continues, the newest day is added and the oldest day is subtracted. The 10-day SMA for day 11 is calculated by adding the prices of day 2 through day 11 and dividing by 10. The averaging process then moves on to the next day where the 10-day SMA for day 12 is calculated by adding the prices of day 3 through day 12 and dividing by 10.
Using Least Square Regression Analysis to
Forecast• We can use mathematical models
…….
Product Design Planning
• Modularization• Miniaturization• integration
Layout of Business• Process layout• Production layout• Fixed position layout
Layout
• There is no standard method of factory layout because different products need different techniques. Also, different companies producing the same product might choose different methods. For example, both Bass Charrington and Brakspears produce beers, but the layouts of their breweries are very different. Brakspears uses very traditional brewing techniques. Bass Charrington uses up more up-to-date methods.
• What are the common types of layout? Process layout Product layout Fixed position layout
Process layout:
• this system involves performing similar operations on all products in one area or at one work station. For example, all of the steps taken in making Wellington boots is carried out at each work station. So each workstation will carry out mixing the raw materials, moulding, trimming and packing the boots to make them ready for distribution.
• This type of layout is often used with batch or cell production because of its flexibility. Planning is needed to avoid machines being overloaded or remaining
• idle. See diagram.
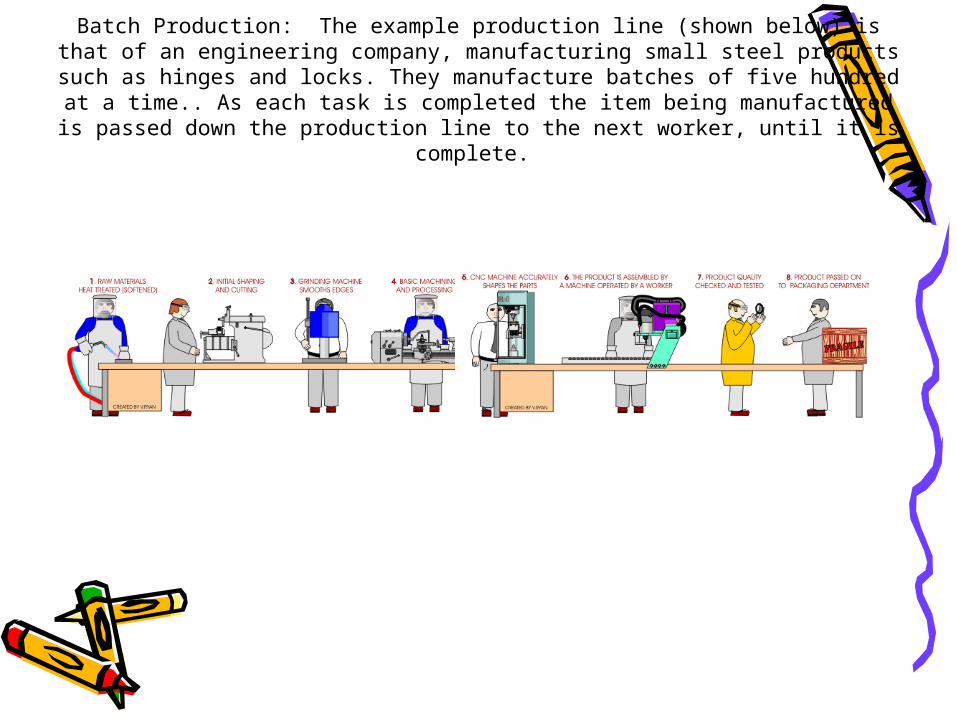
Batch Production: The example production line (shown below) is that of an engineering company, manufacturing small steel products such as hinges and
locks. They manufacture batches of five hundred at a time.. As each task is completed the item being manufactured is passed down the production line to
the next worker, until it is complete.
Product Layout
• With this method, machinery and tasks are set out in the order required to make the product.
• The production ‘flow’ from one machine or task to another. Flow production techniques use this method. It is popular because handling time is reduced and there is greater control. However, it can only be used if there is large demand for the product.
Fixed Production Layout
• This involves performing operations on the work-in-progress and then returning it to a fixed location after each process.
• Alternatively, resources are taken to a site at which production occurs. An example would be the construction of a bridge.
Scheduling• Critical Path Method (CPM)• Project Evaluation and Review
Technique• Preparation and use of decision
trees and simulation


![Planning production ]](https://img.pdfslide.net/doc/110x75/5585c016d8b42af75f8b4fa5/planning-production-.jpg)