Embed Size (px)
Citation preview

Strathprints Institutional Repository
Chaichana, A. and Syed, M. H. and Burt, G. M. (2016) Vulnerability
mitigation of transmission line outages using demand response
approach with distribution factors. In: 16 IEEE International Conference
on Environment and Electrical Engineering. IEEE. (In Press) ,
This version is available at http://strathprints.strath.ac.uk/56441/
Strathprints is designed to allow users to access the research output of the University of
Strathclyde. Unless otherwise explicitly stated on the manuscript, Copyright © and Moral Rights
for the papers on this site are retained by the individual authors and/or other copyright owners.
Please check the manuscript for details of any other licences that may have been applied. You
may not engage in further distribution of the material for any profitmaking activities or any
commercial gain. You may freely distribute both the url (http://strathprints.strath.ac.uk/) and the
content of this paper for research or private study, educational, or not-for-profit purposes without
prior permission or charge.
Any correspondence concerning this service should be sent to Strathprints administrator:
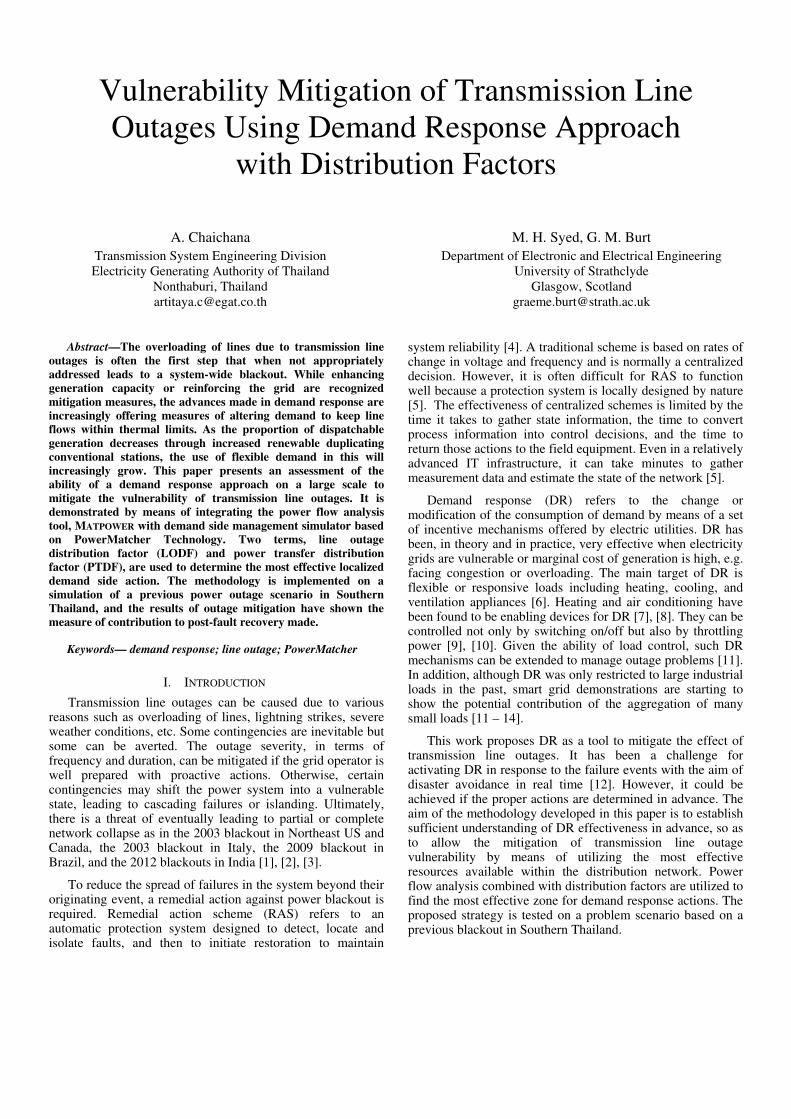
Vulnerability Mitigation of Transmission Line
Outages Using Demand Response Approach
with Distribution Factors
A. Chaichana
Transmission System Engineering Division
Electricity Generating Authority of Thailand
Nonthaburi, Thailand
M. H. Syed, G. M. Burt
Department of Electronic and Electrical Engineering
University of Strathclyde
Glasgow, Scotland
Abstract—The overloading of lines due to transmission line
outages is often the first step that when not appropriately
addressed leads to a system-wide blackout. While enhancing
generation capacity or reinforcing the grid are recognized
mitigation measures, the advances made in demand response are
increasingly offering measures of altering demand to keep line
flows within thermal limits. As the proportion of dispatchable
generation decreases through increased renewable duplicating
conventional stations, the use of flexible demand in this will
increasingly grow. This paper presents an assessment of the
ability of a demand response approach on a large scale to
mitigate the vulnerability of transmission line outages. It is
demonstrated by means of integrating the power flow analysis
tool, MATPOWER with demand side management simulator based
on PowerMatcher Technology. Two terms, line outage
distribution factor (LODF) and power transfer distribution
factor (PTDF), are used to determine the most effective localized
demand side action. The methodology is implemented on a
simulation of a previous power outage scenario in Southern
Thailand, and the results of outage mitigation have shown the
measure of contribution to post-fault recovery made.
Keywords— demand response; line outage; PowerMatcher
I. INTRODUCTION
Transmission line outages can be caused due to various reasons such as overloading of lines, lightning strikes, severe weather conditions, etc. Some contingencies are inevitable but some can be averted. The outage severity, in terms of frequency and duration, can be mitigated if the grid operator is well prepared with proactive actions. Otherwise, certain contingencies may shift the power system into a vulnerable state, leading to cascading failures or islanding. Ultimately, there is a threat of eventually leading to partial or complete network collapse as in the 2003 blackout in Northeast US and Canada, the 2003 blackout in Italy, the 2009 blackout in Brazil, and the 2012 blackouts in India [1], [2], [3].
To reduce the spread of failures in the system beyond their originating event, a remedial action against power blackout is required. Remedial action scheme (RAS) refers to an automatic protection system designed to detect, locate and isolate faults, and then to initiate restoration to maintain
system reliability [4]. A traditional scheme is based on rates of change in voltage and frequency and is normally a centralized decision. However, it is often difficult for RAS to function well because a protection system is locally designed by nature [5]. The effectiveness of centralized schemes is limited by the time it takes to gather state information, the time to convert process information into control decisions, and the time to return those actions to the field equipment. Even in a relatively advanced IT infrastructure, it can take minutes to gather measurement data and estimate the state of the network [5].
Demand response (DR) refers to the change or modification of the consumption of demand by means of a set of incentive mechanisms offered by electric utilities. DR has been, in theory and in practice, very effective when electricity grids are vulnerable or marginal cost of generation is high, e.g. facing congestion or overloading. The main target of DR is flexible or responsive loads including heating, cooling, and ventilation appliances [6]. Heating and air conditioning have been found to be enabling devices for DR [7], [8]. They can be controlled not only by switching on/off but also by throttling power [9], [10]. Given the ability of load control, such DR mechanisms can be extended to manage outage problems [11]. In addition, although DR was only restricted to large industrial loads in the past, smart grid demonstrations are starting to show the potential contribution of the aggregation of many small loads [11 – 14].
This work proposes DR as a tool to mitigate the effect of transmission line outages. It has been a challenge for activating DR in response to the failure events with the aim of disaster avoidance in real time [12]. However, it could be achieved if the proper actions are determined in advance. The aim of the methodology developed in this paper is to establish sufficient understanding of DR effectiveness in advance, so as to allow the mitigation of transmission line outage vulnerability by means of utilizing the most effective resources available within the distribution network. Power flow analysis combined with distribution factors are utilized to find the most effective zone for demand response actions. The proposed strategy is tested on a problem scenario based on a previous blackout in Southern Thailand.
The remainder of this paper is organized as follows. Section II describes the PowerMatcher DR technology. Section III explains the methodology to determine the most effective zone for utilizing DR to mitigate the vulnerability. Section IV represents the problem scenario and test model. Section V identifies the test scenarios and describes modules in the co-simulation platform and the integration between them. Section VI provides simulation evaluations and results. Finally, conclusions and future work are summarized in Section VII.
II. POWERMATCHER
PowerMatcher (PM) is a technology for supply and demand coordination in power systems [14]. The control concept is market-based and relies on multi-agent modeling, allowing distributed generations (DGs), energy storage and electric vehicles to participate in DR with ease. Each device is represented by a control agent and can be categorized into classes based on its controllability. The demand and supply of each cluster of devices are coordinated by a bidding process. The equilibrium price is determined by the so-called Auctioneer agent. The PM has three basic tasks: a) take bids from clusters or devices, b) calculate the equilibrium price, and c) maintain secure and economic operation [15]. The main advantage over other demand side management technologies is that it is simple and does not involve any complex central optimization [16] and hence the model is scalable and computationally efficient. Thus, this work proposes to adopt the PM as a demand-side technology for transmission line outage mitigation using a DR approach.
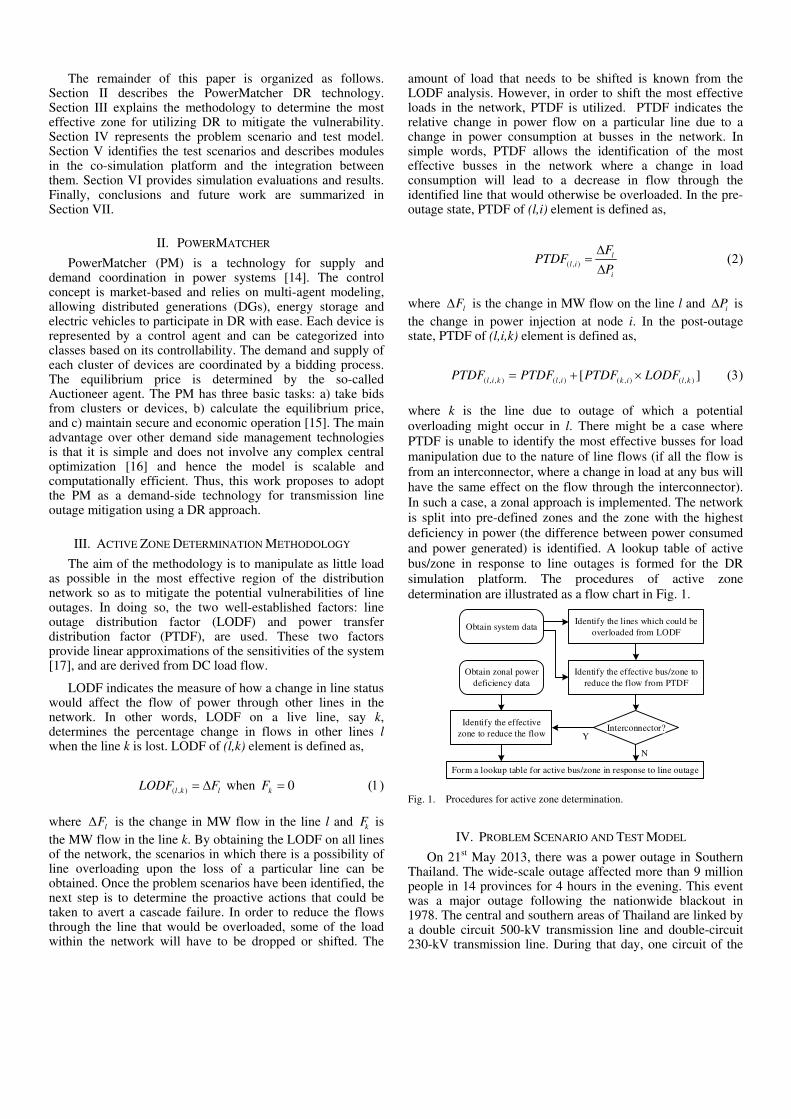
III. ACTIVE ZONE DETERMINATION METHODOLOGY
The aim of the methodology is to manipulate as little load as possible in the most effective region of the distribution network so as to mitigate the potential vulnerabilities of line outages. In doing so, the two well-established factors: line outage distribution factor (LODF) and power transfer distribution factor (PTDF), are used. These two factors provide linear approximations of the sensitivities of the system [17], and are derived from DC load flow.
LODF indicates the measure of how a change in line status would affect the flow of power through other lines in the network. In other words, LODF on a live line, say k, determines the percentage change in flows in other lines l when the line k is lost. LODF of (l,k) element is defined as,
( , )l k lLODF F when 0k
F
where lF is the change in MW flow in the line l and k
F is
the MW flow in the line k. By obtaining the LODF on all lines of the network, the scenarios in which there is a possibility of line overloading upon the loss of a particular line can be obtained. Once the problem scenarios have been identified, the next step is to determine the proactive actions that could be taken to avert a cascade failure. In order to reduce the flows through the line that would be overloaded, some of the load within the network will have to be dropped or shifted. The
amount of load that needs to be shifted is known from the LODF analysis. However, in order to shift the most effective loads in the network, PTDF is utilized. PTDF indicates the relative change in power flow on a particular line due to a change in power consumption at busses in the network. In simple words, PTDF allows the identification of the most effective busses in the network where a change in load consumption will lead to a decrease in flow through the identified line that would otherwise be overloaded. In the pre-outage state, PTDF of (l,i) element is defined as,
( , )
l
l i
i
FPTDF
P
where lF is the change in MW flow on the line l and i
P is
the change in power injection at node i. In the post-outage state, PTDF of (l,i,k) element is defined as,
( , , ) ( , ) ( , ) ( , )[ ]l i k l i k i l kPTDF PTDF PTDF LODF
where k is the line due to outage of which a potential
overloading might occur in l. There might be a case where
PTDF is unable to identify the most effective busses for load
manipulation due to the nature of line flows (if all the flow is
from an interconnector, where a change in load at any bus will
have the same effect on the flow through the interconnector).
In such a case, a zonal approach is implemented. The network
is split into pre-defined zones and the zone with the highest
deficiency in power (the difference between power consumed
and power generated) is identified. A lookup table of active
bus/zone in response to line outages is formed for the DR
simulation platform. The procedures of active zone
determination are illustrated as a flow chart in Fig. 1.
Obtain system data
Obtain zonal power
deficiency data
Identify the effective
zone to reduce the flow
Form a lookup table for active bus/zone in response to line outage
Identify the lines which could be
overloaded from LODF
Identify the effective bus/zone to
reduce the flow from PTDF
Interconnector?Y
N
Fig. 1. Procedures for active zone determination.
IV. PROBLEM SCENARIO AND TEST MODEL
On 21st May 2013, there was a power outage in Southern Thailand. The wide-scale outage affected more than 9 million people in 14 provinces for 4 hours in the evening. This event was a major outage following the nationwide blackout in 1978. The central and southern areas of Thailand are linked by a double circuit 500-kV transmission line and double-circuit 230-kV transmission line. During that day, one circuit of the
A3
A2
A1 A4
To central grid
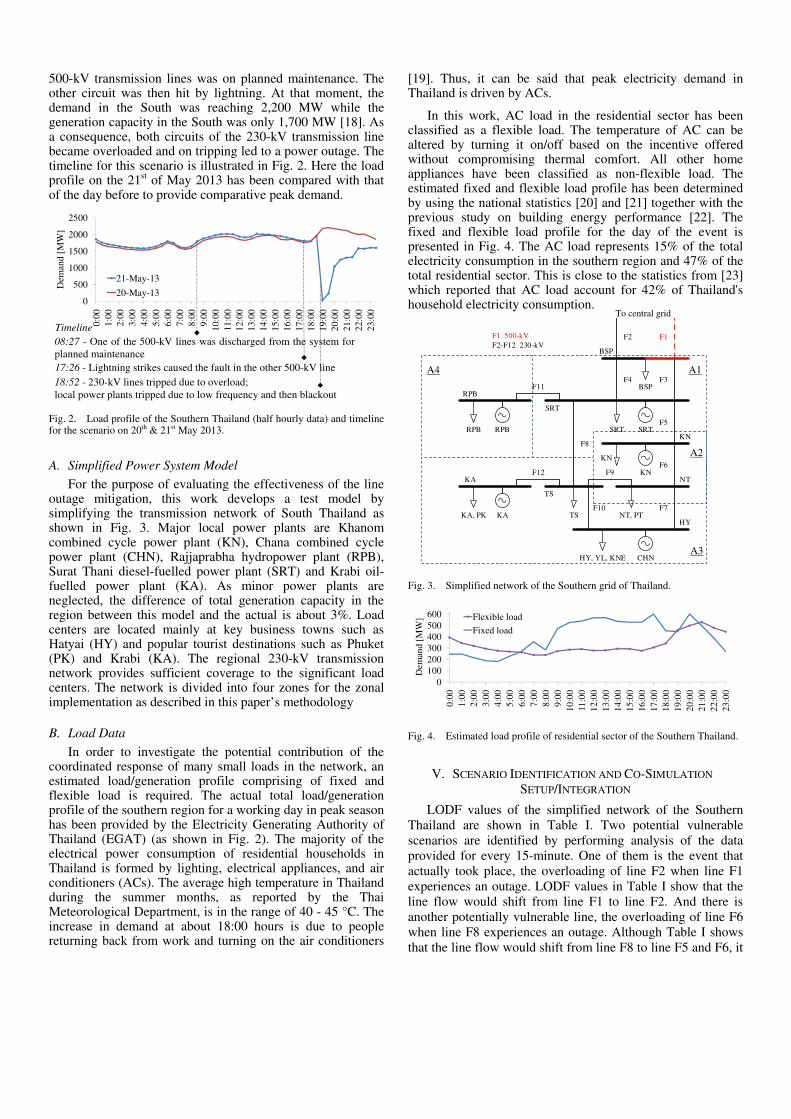
500-kV transmission lines was on planned maintenance. The other circuit was then hit by lightning. At that moment, the demand in the South was reaching 2,200 MW while the generation capacity in the South was only 1,700 MW [18]. As a consequence, both circuits of the 230-kV transmission line became overloaded and on tripping led to a power outage. The timeline for this scenario is illustrated in Fig. 2. Here the load profile on the 21st of May 2013 has been compared with that of the day before to provide comparative peak demand.
0
500
1000
1500
2000
2500
0:0
0
1:0
0
2:0
0
3:0
0
4:0
0
5:0
0
6:0
0
7:0
0
8:0
0
9:0
0
10
:00
11
:00
12
:00
13
:00
14
:00
15
:00
16
:00
17
:00
18
:00
19
:00
20
:00
21
:00
22
:00
23
:00
Dem
and
[M
W]
21-May-13
20-May-13
Fig. 2. Load profile of the Southern Thailand (half hourly data) and timeline for the scenario on 20th & 21st May 2013.
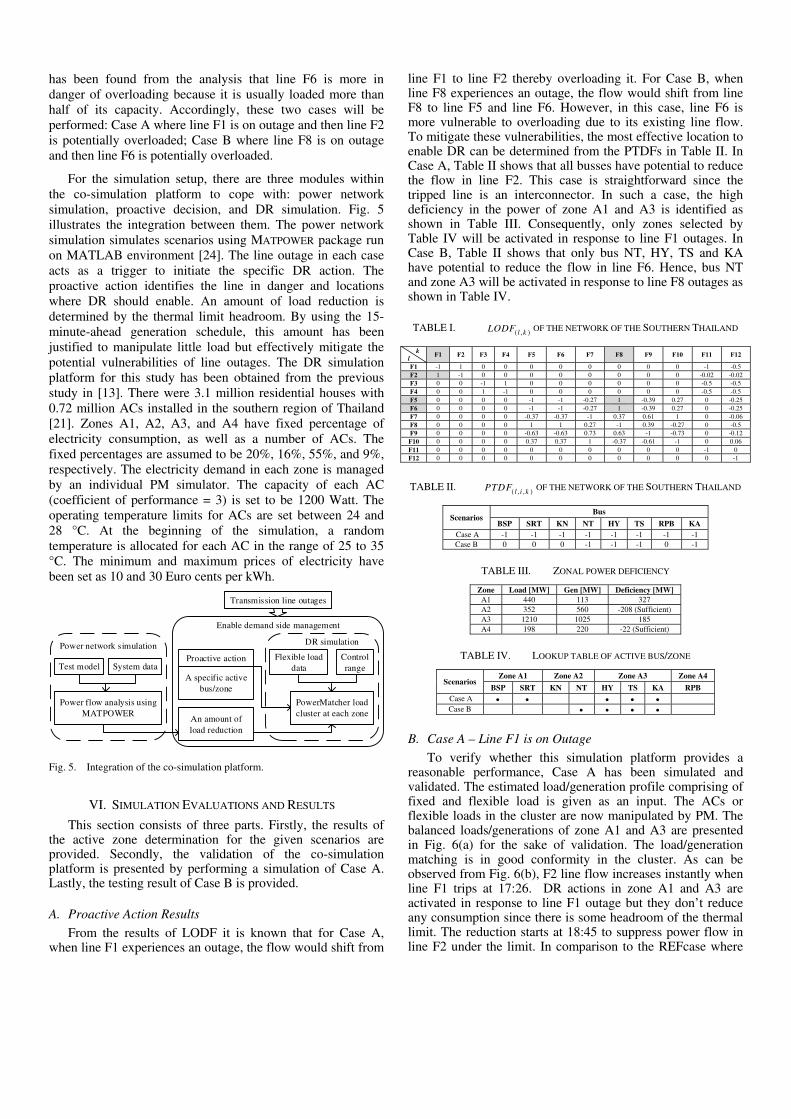
A. Simplified Power System Model
For the purpose of evaluating the effectiveness of the line outage mitigation, this work develops a test model by simplifying the transmission network of South Thailand as shown in Fig. 3. Major local power plants are Khanom combined cycle power plant (KN), Chana combined cycle power plant (CHN), Rajjaprabha hydropower plant (RPB), Surat Thani diesel-fuelled power plant (SRT) and Krabi oil-fuelled power plant (KA). As minor power plants are neglected, the difference of total generation capacity in the region between this model and the actual is about 3%. Load centers are located mainly at key business towns such as Hatyai (HY) and popular tourist destinations such as Phuket (PK) and Krabi (KA). The regional 230-kV transmission network provides sufficient coverage to the significant load centers. The network is divided into four zones for the zonal implementation as described in this paper’s methodology
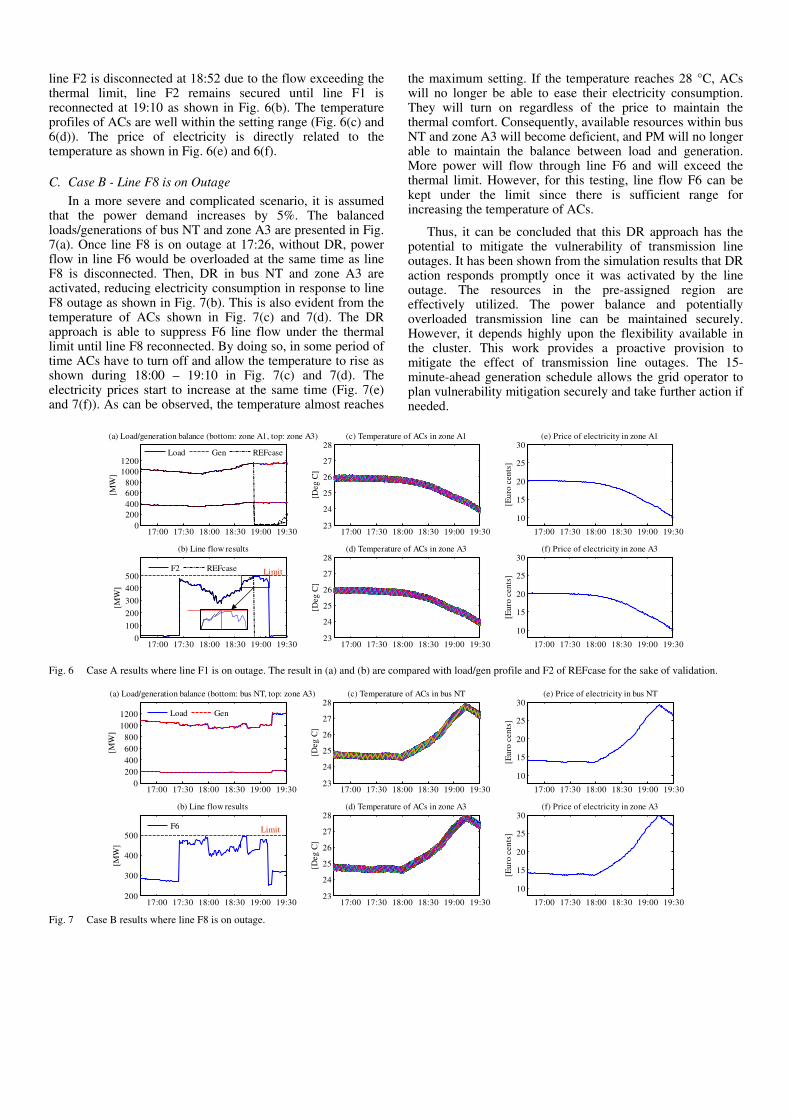
B. Load Data
In order to investigate the potential contribution of the coordinated response of many small loads in the network, an estimated load/generation profile comprising of fixed and flexible load is required. The actual total load/generation profile of the southern region for a working day in peak season has been provided by the Electricity Generating Authority of Thailand (EGAT) (as shown in Fig. 2). The majority of the electrical power consumption of residential households in Thailand is formed by lighting, electrical appliances, and air conditioners (ACs). The average high temperature in Thailand during the summer months, as reported by the Thai Meteorological Department, is in the range of 40 - 45 °C. The increase in demand at about 18:00 hours is due to people returning back from work and turning on the air conditioners
[19]. Thus, it can be said that peak electricity demand in Thailand is driven by ACs.
In this work, AC load in the residential sector has been classified as a flexible load. The temperature of AC can be altered by turning it on/off based on the incentive offered without compromising thermal comfort. All other home appliances have been classified as non-flexible load. The estimated fixed and flexible load profile has been determined by using the national statistics [20] and [21] together with the previous study on building energy performance [22]. The fixed and flexible load profile for the day of the event is presented in Fig. 4. The AC load represents 15% of the total electricity consumption in the southern region and 47% of the total residential sector. This is close to the statistics from [23] which reported that AC load account for 42% of Thailand's household electricity consumption.
BSP
BSP
F1F2
F3F4
SRT
KN
NT
HY
SRT SRTF5
F8
KN
KNF6
NT, PTF7
F9
TS
F12
TSKA, PK KA
KA
F11
RPB RPB
RPB
F10
CHNHY, YL, KNE
F1 500-kV
F2-F12 230-kV
Fig. 3. Simplified network of the Southern grid of Thailand.
0
100
200
300
400
500
600
0:0
0
1:0
0
2:0
0
3:0
0
4:0
0
5:0
0
6:0
0
7:0
0
8:0
0
9:0
0
10
:00
11
:00
12
:00
13
:00
14
:00
15
:00
16
:00
17
:00
18
:00
19
:00
20
:00
21
:00
22
:00
23
:00
Dem
and
[M
W] Flexible load
Fixed load
Fig. 4. Estimated load profile of residential sector of the Southern Thailand.
V. SCENARIO IDENTIFICATION AND CO-SIMULATION
SETUP/INTEGRATION
LODF values of the simplified network of the Southern
Thailand are shown in Table I. Two potential vulnerable
scenarios are identified by performing analysis of the data
provided for every 15-minute. One of them is the event that
actually took place, the overloading of line F2 when line F1
experiences an outage. LODF values in Table I show that the
line flow would shift from line F1 to line F2. And there is
another potentially vulnerable line, the overloading of line F6
when line F8 experiences an outage. Although Table I shows
that the line flow would shift from line F8 to line F5 and F6, it
08:27 - One of the 500-kV lines was discharged from the system for
planned maintenance
17:26 - Lightning strikes caused the fault in the other 500-kV line
18:52 - 230-kV lines tripped due to overload;
local power plants tripped due to low frequency and then blackout
Timeline
has been found from the analysis that line F6 is more in
danger of overloading because it is usually loaded more than
half of its capacity. Accordingly, these two cases will be
performed: Case A where line F1 is on outage and then line F2
is potentially overloaded; Case B where line F8 is on outage
and then line F6 is potentially overloaded.
For the simulation setup, there are three modules within
the co-simulation platform to cope with: power network
simulation, proactive decision, and DR simulation. Fig. 5
illustrates the integration between them. The power network
simulation simulates scenarios using MATPOWER package run
on MATLAB environment [24]. The line outage in each case
acts as a trigger to initiate the specific DR action. The
proactive action identifies the line in danger and locations
where DR should enable. An amount of load reduction is
determined by the thermal limit headroom. By using the 15-
minute-ahead generation schedule, this amount has been
justified to manipulate little load but effectively mitigate the
potential vulnerabilities of line outages. The DR simulation
platform for this study has been obtained from the previous
study in [13]. There were 3.1 million residential houses with
0.72 million ACs installed in the southern region of Thailand
[21]. Zones A1, A2, A3, and A4 have fixed percentage of
electricity consumption, as well as a number of ACs. The
fixed percentages are assumed to be 20%, 16%, 55%, and 9%,
respectively. The electricity demand in each zone is managed
by an individual PM simulator. The capacity of each AC
(coefficient of performance = 3) is set to be 1200 Watt. The
operating temperature limits for ACs are set between 24 and
28 °C. At the beginning of the simulation, a random
temperature is allocated for each AC in the range of 25 to 35
°C. The minimum and maximum prices of electricity have
been set as 10 and 30 Euro cents per kWh.
Transmission line outages
Proactive action
A specific active
bus/zone
An amount of
load reduction
Flexible load
data
Control
range
PowerMatcher load
cluster at each zone
Test model System data
Power flow analysis using
MATPOWER
Power network simulationDR simulation
Enable demand side management
Fig. 5. Integration of the co-simulation platform.
VI. SIMULATION EVALUATIONS AND RESULTS
This section consists of three parts. Firstly, the results of the active zone determination for the given scenarios are provided. Secondly, the validation of the co-simulation platform is presented by performing a simulation of Case A. Lastly, the testing result of Case B is provided.
A. Proactive Action Results
From the results of LODF it is known that for Case A, when line F1 experiences an outage, the flow would shift from
line F1 to line F2 thereby overloading it. For Case B, when line F8 experiences an outage, the flow would shift from line F8 to line F5 and line F6. However, in this case, line F6 is more vulnerable to overloading due to its existing line flow. To mitigate these vulnerabilities, the most effective location to enable DR can be determined from the PTDFs in Table II. In Case A, Table II shows that all busses have potential to reduce the flow in line F2. This case is straightforward since the tripped line is an interconnector. In such a case, the high deficiency in the power of zone A1 and A3 is identified as shown in Table III. Consequently, only zones selected by Table IV will be activated in response to line F1 outages. In Case B, Table II shows that only bus NT, HY, TS and KA have potential to reduce the flow in line F6. Hence, bus NT and zone A3 will be activated in response to line F8 outages as shown in Table IV.
TABLE I. ( , )l kLODF OF THE NETWORK OF THE SOUTHERN THAILAND
k
l F1 F2 F3 F4 F5 F6 F7 F8 F9 F10 F11 F12
F1 -1 1 0 0 0 0 0 0 0 0 -1 -0.5
F2 1 -1 0 0 0 0 0 0 0 0 -0.02 -0.02
F3 0 0 -1 1 0 0 0 0 0 0 -0.5 -0.5
F4 0 0 1 -1 0 0 0 0 0 0 -0.5 -0.5
F5 0 0 0 0 -1 -1 -0.27 1 -0.39 0.27 0 -0.25
F6 0 0 0 0 -1 -1 -0.27 1 -0.39 0.27 0 -0.25
F7 0 0 0 0 -0.37 -0.37 -1 0.37 0.61 1 0 -0.06
F8 0 0 0 0 1 1 0.27 -1 0.39 -0.27 0 -0.5
F9 0 0 0 0 -0.63 -0.63 0.73 0.63 -1 -0.73 0 -0.12
F10 0 0 0 0 0.37 0.37 1 -0.37 -0.61 -1 0 0.06
F11 0 0 0 0 0 0 0 0 0 0 -1 0
F12 0 0 0 0 0 0 0 0 0 0 0 -1
TABLE II. ( , , )l i k
PTDF OF THE NETWORK OF THE SOUTHERN THAILAND
Scenarios Bus
BSP SRT KN NT HY TS RPB KA
Case A -1 -1 -1 -1 -1 -1 -1 -1
Case B 0 0 0 -1 -1 -1 0 -1
TABLE III. ZONAL POWER DEFICIENCY
Zone Load [MW] Gen [MW] Deficiency [MW]
A1 440 113 327
A2 352 560 -208 (Sufficient)
A3 1210 1025 185
A4 198 220 -22 (Sufficient)
TABLE IV. LOOKUP TABLE OF ACTIVE BUS/ZONE
Scenarios Zone A1 Zone A2 Zone A3 Zone A4
BSP SRT KN NT HY TS KA RPB
Case A Case B
B. Case A – Line F1 is on Outage
To verify whether this simulation platform provides a reasonable performance, Case A has been simulated and validated. The estimated load/generation profile comprising of fixed and flexible load is given as an input. The ACs or flexible loads in the cluster are now manipulated by PM. The balanced loads/generations of zone A1 and A3 are presented in Fig. 6(a) for the sake of validation. The load/generation matching is in good conformity in the cluster. As can be observed from Fig. 6(b), F2 line flow increases instantly when line F1 trips at 17:26. DR actions in zone A1 and A3 are activated in response to line F1 outage but they don’t reduce any consumption since there is some headroom of the thermal limit. The reduction starts at 18:45 to suppress power flow in line F2 under the limit. In comparison to the REFcase where
line F2 is disconnected at 18:52 due to the flow exceeding the thermal limit, line F2 remains secured until line F1 is reconnected at 19:10 as shown in Fig. 6(b). The temperature profiles of ACs are well within the setting range (Fig. 6(c) and 6(d)). The price of electricity is directly related to the temperature as shown in Fig. 6(e) and 6(f).
C. Case B - Line F8 is on Outage
In a more severe and complicated scenario, it is assumed that the power demand increases by 5%. The balanced loads/generations of bus NT and zone A3 are presented in Fig. 7(a). Once line F8 is on outage at 17:26, without DR, power flow in line F6 would be overloaded at the same time as line F8 is disconnected. Then, DR in bus NT and zone A3 are activated, reducing electricity consumption in response to line F8 outage as shown in Fig. 7(b). This is also evident from the temperature of ACs shown in Fig. 7(c) and 7(d). The DR approach is able to suppress F6 line flow under the thermal limit until line F8 reconnected. By doing so, in some period of time ACs have to turn off and allow the temperature to rise as shown during 18:00 – 19:10 in Fig. 7(c) and 7(d). The electricity prices start to increase at the same time (Fig. 7(e) and 7(f)). As can be observed, the temperature almost reaches
the maximum setting. If the temperature reaches 28 °C, ACs will no longer be able to ease their electricity consumption. They will turn on regardless of the price to maintain the thermal comfort. Consequently, available resources within bus NT and zone A3 will become deficient, and PM will no longer able to maintain the balance between load and generation. More power will flow through line F6 and will exceed the thermal limit. However, for this testing, line flow F6 can be kept under the limit since there is sufficient range for increasing the temperature of ACs.
Thus, it can be concluded that this DR approach has the potential to mitigate the vulnerability of transmission line outages. It has been shown from the simulation results that DR action responds promptly once it was activated by the line outage. The resources in the pre-assigned region are effectively utilized. The power balance and potentially overloaded transmission line can be maintained securely. However, it depends highly upon the flexibility available in the cluster. This work provides a proactive provision to mitigate the effect of transmission line outages. The 15-minute-ahead generation schedule allows the grid operator to plan vulnerability mitigation securely and take further action if needed.
17:00 17:30 18:00 18:30 19:00 19:300
200
400
600
800
1000
1200
(a) Load/generation balance (bottom: zone A1, top: zone A3)
[MW
]
17:00 17:30 18:00 18:30 19:00 19:300
100
200
300
400
500
(b) Line flow results
[MW
]
17:00 17:30 18:00 18:30 19:00 19:3023
24
25
26
27
28(c) Temperature of ACs in zone A1
[Deg
C]
17:00 17:30 18:00 18:30 19:00 19:3023
24
25
26
27
28(d) Temperature of ACs in zone A3
[Deg
C]
17:00 17:30 18:00 18:30 19:00 19:30
10
15
20
25
30(e) Price of electricity in zone A1
[Eu
ro c
en
ts]
17:00 17:30 18:00 18:30 19:00 19:30
10
15
20
25
30(f) Price of electricity in zone A3
[Eu
ro c
en
ts]
Load Gen REFcase
F2 REFcase Limit
Fig. 6 Case A results where line F1 is on outage. The result in (a) and (b) are compared with load/gen profile and F2 of REFcase for the sake of validation.
17:00 17:30 18:00 18:30 19:00 19:300
200
400
600
800
1000
1200
(a) Load/generation balance (bottom: bus NT, top: zone A3)
[MW
]
17:00 17:30 18:00 18:30 19:00 19:30200
300
400
500
(b) Line flow results
[MW
]
17:00 17:30 18:00 18:30 19:00 19:3023
24
25
26
27
28(c) Temperature of ACs in bus NT
[Deg
C]
17:00 17:30 18:00 18:30 19:00 19:3023
24
25
26
27
28(d) Temperature of ACs in zone A3
[Deg
C]
17:00 17:30 18:00 18:30 19:00 19:30
10
15
20
25
30(e) Price of electricity in bus NT
[Eu
ro c
en
ts]
17:00 17:30 18:00 18:30 19:00 19:30
10
15
20
25
30(f) Price of electricity in zone A3
[Eu
ro c
en
ts]
Load Gen
F6 Limit
Fig. 7 Case B results where line F8 is on outage.
VII. CONCLUSIONS AND FUTURE WORK
In this paper, the strategy to mitigate transmission line overloading caused by single-line outages using DR is proposed. The control concept involves manipulating loads in the most effective region of the distribution network. Power flow analysis and distribution factors can identify the most effective bus/zone and the amount of the load shifts needed. The simulator based on PowerMatcher Technology is used as a tool to simulate DR actions to attain the objective. The proposed strategy is implemented and evaluated by using a previous scenario of power outage in Southern Thailand. The result illustrates the potential contribution of this DR approach to avert a cascade failure, and moreover the demand is altered without compromising the level of customer comfort. While the DR measures may not always fully recover the system condition, its mitigation of vulnerability is such as to afford more time for slower post fault actions.
The future large-scale integration of variable generation
such as wind turbines and photovoltaics will also contribute to
the energy balancing and network vulnerability problems. The
contribution of the study is to introduce an alternative measure
to reduce network vulnerability. The approach can be
extended to manage similar problems such as generation loss
or change in dispatch.
ACKNOWLEDGMENT
The authors would like to thank the EGAT for providing data of the 2013 blackout in the South of Thailand. This work has been partly funded by the Energy Technology Partnership, Scotland and in part by the European Commission under the FP7 project ELECTRA IRP (grant no: 609687). Any opinions, findings and conclusions or recommendations expressed in this material are those of the authors and do not necessarily reflect those of the European Commission.
REFERENCES
[1] Y.B. Makarov, V.I. Reshetov, V.A Stroev, and N.I. Voropai, “Blackouts in North America and Europe: Analysis and generalization,” in Proc.
IEEE Russia PowerTech, St. Petersburg, Russia, 27-30 Jun. 2005, pp. 1-7.
[2] L.L. Lai, H.T Zhang, C.S. Lai, F.Y. Xu, and S. Mishra, “Investigation of July 2012 Indian blackout,” in Proc. 2013 International Conference on
Machine Learning and Cybernetics, Tianjin, China, 14-17 Jul. 2013, pp. 92-97.
[3] B. Zeng, S. Ouyang, J. Zhang, H. Shi, G. Wu, and M. Zeng, “An analysis of previous blackouts in the world: Lessons for China’s power industry,” Renewable and Sustainable Energy Reviews, vol. 42, pp. 1151-1163, 2015.
[4] M. Vaiman, P. Hines, J. Jiang, S. Norris, M. Papic, A. Pitto, Y. Wang, and G. Zweigle, “Mitigation and prevention of cascading outages: Methodologies and practical applications,” in Proc. 2013 PES General
Meeting, Vancouver, Canada, 21-25 Jul. 2013, pp. 1-5.
[5] P. Hines, K. Balasubramaniam, and E. C. Sanchez, “Cascading failures in power grids,” IEEE Potentials, vol.28, no.5, pp. 24-30, Sep./Oct. 2009.
[6] P. Siano, “Demand response and smart grid – A survey,” Renewable and
Sustainable Energy Reviews, vol. 30, pp. 461-478, 2014.
[7] D. Picault, O. Cottet, and T. Ruez, “Demand response: A solution to manage loads in the smart grid,” in Proc. IEEE 15th EEEIC, Rome, Italy, 10-13 Jun. 2015, pp. 352-356.
[8] R. Smith, K. Meng, Z. Dong, and R. Simpson, “Demand response: A strategy to address residential air-conditioning peak load in Australia,” J.
Mod. Power Syst Clean Energy, vol. 1, no. 3, pp. 223-230, 2013.
[9] Y.I. Khalid, N.U. Hassan, C. Yuen, and S. Huang, “Demand response for power throttling air conditioning loads in residential smart grids,” in Proc. IEEE Smart Grid Comm, Venice, Italy, 3-6 Nov. 2014, pp. 650-655.
[10] M. Pipattanasomporn, M. Kuzlu, and S. Rahman, “An algorithm for intelligent home energy management and demand response analysis,” IEEE Trans. Smart Grid, vol. 3, no. 4, pp. 2166–2173, Dec. 2012.
[11] M. Rastegar, and M. Fotuhi-Firuzabad, “Outage management in demand response programs,” IEEE Trans. Smart Grid, vol. 6, no. 3, pp. 1453-1462, May 2015.
[12] A. Avritzer , S. Suresh , D. S. Menasché , R. M. M. Leão , E. de Souza e Silva , M. C. Diniz, K. Trivedi , L. Happe , and A. Koziolek, “Survivability models for the assessment of smart grid distribution automation network designs,” in Proc. ACM/SPEC ICPE, Prague, Czech Republic, 21-24 Apr. 2013.
[13] M. H. Syed, P. Crolla, G. M. Burt, and J. K. Kok, “Ancillary service provision by demand side management: A real-time power hardware-in-the-loop co-simulation demonstration,” in Proc. 2015 International
Symposium on Smart Electric Distribution Systems and Technologies
(EDST), Vienna, Austria, 8-11 Sep. 2015, pp. 492-498.
[14] K. Kok, B. Roossien, P. MacDougall, O. van Pruissen, G. Venekamp, R. Kamphuis, J. Laarakkers and C. Warmer, “Dynamic pricing by scalable energy management systems – Field experiences and simulation results using Powermatcher,” in Proc. IEEE PES General Meeting, San Diego, CA, 22-26 Jul. 2012, pp. 1-8.
[15] M. H. Syed, P. Crolla, G. M. Burt and J. K. Kok, “Development of an assessment framework for supply/demand coordination mechanisms based on systems engineering approach," in Proc. CIRED Workshop, Rome, Italy, 11-12 Jun. 2014, pp. 1-5.
[16] M.P.F. Hommelberg, C.J. Warmer, I.G. Kamphuis, J.K. Kok, and G.J. Schaeffer, “Distributed control concept using multi-agent technology and automatic markets: An indispensable feature of smart power grids,” in Proc. IEEE PES General Meeting, Tampa, FL, 24-28 Jun. 2007, pp. 1-7.
[17] P. W. Sauer, K. E. Reinhard, and T. J. Overbye, “Extended factors for linear contingency analysis,” in Proc. 34th HICSS, Maui, HI, 3-6 Jan. 2001, pp. 697-703.
[18] Electricity Generating Authority of Thailand, 2013 annual report, 2014. [Online]. Available: http://www.egat.co.th/en/images/annual-report/2013/egat-annual-eng-2013.pdf [Accessed: 23 Mar. 2016].
[19] Energy Policy and Planning Office, Thailand electrical power load
forecasting, 2007. [Online]. Available: http://www.eppo.go.th/load/LF-2007-03-26.pdf [Accessed: 23 Mar. 2016].
[20] Energy Policy and Planning Office, Energy statistics of Thailand 2014, 2014. [Online]. Available: http://www.eppo.go.th/info/cd-2014/ pdf/ cha5.pdf [Accessed: 23 Mar. 2016].
[21] National Statistic Office, The 2013 household energy consumption, 2014. [Online]. Available: http://web.nso.go.th/en/survey/env/data_env/ 580121_Pocket%20Book_13.pdf [Accessed: 23 Mar. 2016].
[22] C. Chungrakkiat, “Renewable energy system for household in Thailand,” M.Sc. thesis, University of Strathclyde, Glasgow, Scotland, 2011.
[23] Asia-Pacific Economic Cooperation, PEER review on energy efficiency
in Thailand, 2010. [Online]. Available: http://www.ieej.or.jp/aperc/ PREE/PREE_Thailand.pdf [Accessed: 23 Mar. 2016].
[24] R. D. Zimmerman, C. E. Murillo-Sánchez, and R. J. Thomas, “MATPOWER: Steady-state operations, planning and analysis tools for power systems research and education,” IEEE Trans. Power Systems, vol. 26, no. 1, pp. 12-19, Feb. 2011.


![pppppppppppppppppppppppppppppppppppppppppppppppppppppppppp ...unitaryplan.aucklandcouncil.govt.nz/Images/Printable PDFs... · 3huvldq/lodf 0holdd]hgdudfk 6w/xnhv 5rdg /rw '3 3huvldq/lodf](https://img.pdfslide.net/doc/110x75/5be29d3409d3f288328c7a1b/pppppppppppppppppppppppppppppppppppppppppppppppppppppppppp-pdfs-3huvldqlodf.jpg)