Embed Size (px)
Citation preview
Strongly enhanced bacterial bioluminescence with theilux operon for single-cell imagingCarola Gregora,1, Klaus C. Gwoscha, Steffen J. Sahla, and Stefan W. Hella,b,1
aDepartment of NanoBiophotonics, Max Planck Institute for Biophysical Chemistry, 37077 Göttingen, Germany; and bDepartment of Optical Nanoscopy,Max Planck Institute for Medical Research, 69120 Heidelberg, Germany
Contributed by Stefan W. Hell, December 8, 2017 (sent for review September 12, 2017; reviewed by David W. Piston and Alice Y. Ting)
Bioluminescence imaging of single cells is often complicated by therequirement of exogenous luciferins that can be poorly cell-permeable or produce high background signal. Bacterial biolumi-nescence is unique in that it uses reduced flavin mononucleotideas a luciferin, which is abundant in all cells, making this systempurely genetically encodable by the lux operon. Unfortunately, theuse of bacterial bioluminescence has been limited by its lowbrightness compared with other luciferases. Here, we report thegeneration of an improved lux operon named iluxwith an approx-imately sevenfold increased brightness when expressed in Escheri-chia coli; ilux can be used to image single E. coli cells with enhancedspatiotemporal resolution over several days. In addition, since onlymetabolically active cells produce bioluminescent signal, we showthat ilux can be used to observe the effect of different antibiotics oncell viability on the single-cell level.
bioluminescence | luciferase | antibiotics | bacteria | microscopy
Bioluminescent cells generate light by a chemical reaction.The bioluminescence reaction is catalyzed by an enzyme
called luciferase, with a luciferin required as substrate. Moleculesof luciferin are converted into a product in an electronically excitedstate and emit a photon on return to the ground state, with visiblelight emitted in the process. There are many different luciferasesand corresponding luciferins found in nature, indicating that bio-luminescence has evolved more than 40 times independently dur-ing evolution (1), although in several cases, its biological functionremains not fully understood. Most luciferins are only produced byorganisms that express the corresponding luciferase, with the ex-ception of the bacterial luciferin FMNH2, reduced flavin mono-nucleotide (FMN), which is abundant in all cells.The bacterial bioluminescence reaction is catalyzed by an
αβ-heterodimeric luciferase coded by the genes luxA and luxB. Inaddition to FMNH2, the luciferase binds molecular oxygen and along-chain fatty aldehyde. The fatty aldehyde is oxidized to thecorresponding fatty acid, and FMNH2 is oxidized to FMN, therebyemitting a blue photon with a wavelength around the spectralemission maximum λmax of ∼490 nm:
FMNH2 +RCHO+O2 →FMN+RCOOH+H2O+ hν.
To keep this reaction ongoing, the fatty aldehyde must becontinuously regenerated. This is performed by the fatty acid re-ductase complex, which consists of a fatty acid reductase, trans-ferase, and synthetase coded by luxC, luxD, and luxE, respectively.Since an FMN reductase that generates FMNH2 is present inEscherichia coli, introduction of the luxCDABE operon is suffi-cient to produce a bioluminescence output in these cells.Due to its very low light levels compared with fluorescence,
bioluminescence imaging is not routinely applied so far. However,bioluminescence provides several benefits compared with fluo-rescence measurements. First, there is virtually no backgroundbecause of the lack of autofluorescence. Bioluminescence back-ground levels in living cells are extremely low, making bio-luminescence up to 50 times more sensitive than fluorescence (ref.2 and references therein). Second, no excitation light source and
filters are required, making the setup very simple. In addition, it ispossible to study processes where the intense excitation light re-quired for fluorescence measurements would be disturbing, suchas circadian rhythms or Ca2+ activity in the retina (3, 4). Third, nophototoxicity or bleaching occurs, allowing image acquisition overarbitrary timespans. Furthermore, bioluminescence is dependenton metabolic energy, and hence, only metabolically active cells arevisible, preventing artifacts due to the observation of severelydamaged or dead cells.In addition to the limitation by their low brightness, the lucif-
erases that are most commonly used exhibit several drawbacks, asthe luciferin must be externally supplied. Limited solubility, sta-bility, or cell permeability of the luciferin may, in some cases,hamper its usability (5–7). Administering of excess amounts of theluciferin is readily done for standard single-layered cell cultures,but luciferin consumption within larger collections of cells, such astumors, is more rapid. In these situations, the luciferin concen-tration is not constant over time, and the signal decays sometimeswithin minutes (8, 9). Therefore, the luciferin has to be appliedrepeatedly for long-term imaging, which complicates quantifica-tion of the signal. Moreover, autooxidation of coelenterazine, thesubstrate of commonly used Renilla and Gaussia luciferase, canproduce luminescence background signal (6, 10). Bacterial lucif-erase is the only luciferase to circumvent all of these problems,since FMN is present in all cell types and can be converted intofree FMNH2 by additional expression of an FMN reductase. Itsmain limitation is the poor brightness that is several orders ofmagnitude lower than that of other luciferases (11). Several at-tempts have been made to improve the brightness of bacterialbioluminescence, including splitting the lux operon for enhancedexpression, codon optimization and additional expression of an
Significance
The emission of light generated in a process referred to as bio-luminescence can be used for imaging of living cells over longtimespans without phototoxicity or bleaching. The amounts oflight produced in the bioluminescence process are very low, andexogenous substrate molecules are often required. We improvedthe brightness of bacterial bioluminescence, a system that featuresthe advantage that all of the required molecular components aregenetically encoded within a single operon. Consequently, wehave engineered an improved operon ilux, which enables long-term visualization of single bacterial cells while simultaneouslyproviding information about cellular viability.
Author contributions: C.G. and S.W.H. designed research; C.G. performed research; K.C.G.contributed new reagents/analytic tools; C.G. analyzed data; and C.G., S.J.S., and S.W.H.wrote the paper.
Reviewers: D.W.P., Washington University in St. Louis; and A.Y.T., Stanford University.
The authors declare no conflict of interest.
This open access article is distributed under Creative Commons Attribution-NonCommercial-NoDerivatives License 4.0 (CC BY-NC-ND).1To whom correspondence may be addressed. Email: [email protected] or [email protected].
This article contains supporting information online at www.pnas.org/lookup/suppl/doi:10.1073/pnas.1715946115/-/DCSupplemental.
962–967 | PNAS | January 30, 2018 | vol. 115 | no. 5 www.pnas.org/cgi/doi/10.1073/pnas.1715946115
Dow
nloa
ded
by g
uest
on
Feb
ruar
y 9,
202
0
FMN reductase in mammalian cells, and exogenous addition ofthe fatty aldehyde (12–15). However, to our knowledge, intro-duction of mutations in the luxCDABE operon to increase thebrightness has so far been unsuccessful. Here, we show that bio-luminescence from the lux operon from Photorhabdus luminescensexpressed in E. coli can be substantially enhanced by coexpressionof an additional FMN reductase and subsequent error-pronemutagenesis of the complete lux operon. The improved lux operondubbed ilux can be used to image single E. coli cells for extendedtime periods and to assay cell viability in the presence of dif-ferent antibiotics.
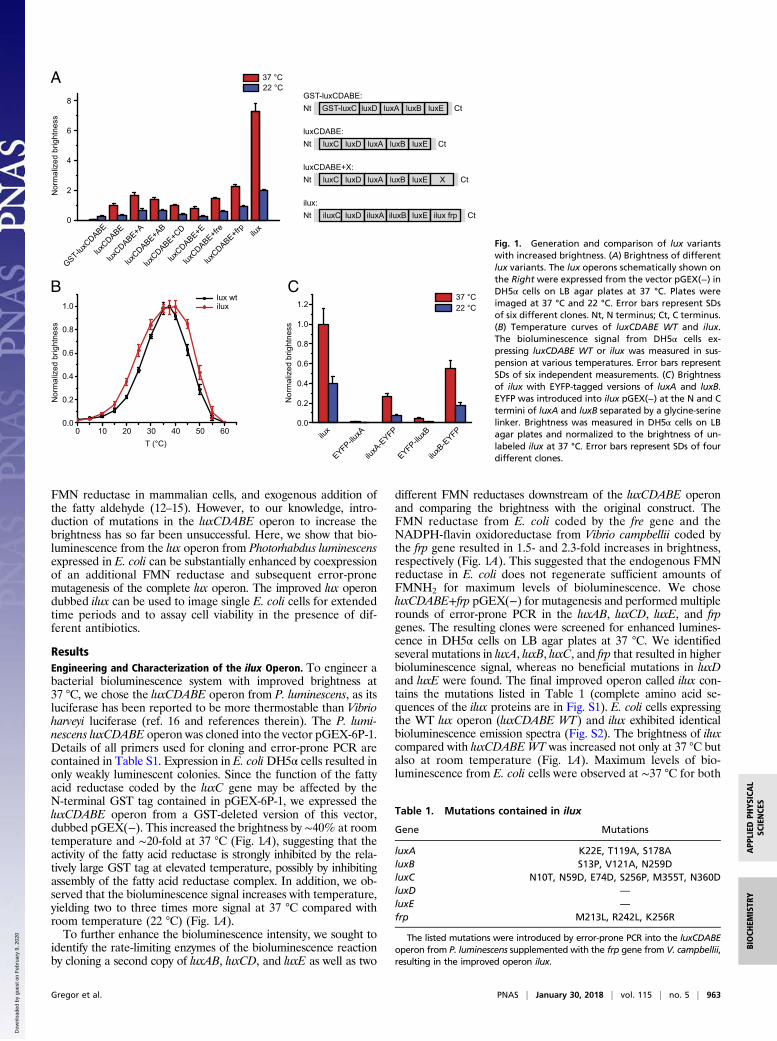
ResultsEngineering and Characterization of the ilux Operon. To engineer abacterial bioluminescence system with improved brightness at37 °C, we chose the luxCDABE operon from P. luminescens, as itsluciferase has been reported to be more thermostable than Vibrioharveyi luciferase (ref. 16 and references therein). The P. lumi-nescens luxCDABE operon was cloned into the vector pGEX-6P-1.Details of all primers used for cloning and error-prone PCR arecontained in Table S1. Expression in E. coliDH5α cells resulted inonly weakly luminescent colonies. Since the function of the fattyacid reductase coded by the luxC gene may be affected by theN-terminal GST tag contained in pGEX-6P-1, we expressed theluxCDABE operon from a GST-deleted version of this vector,dubbed pGEX(−). This increased the brightness by ∼40% at roomtemperature and ∼20-fold at 37 °C (Fig. 1A), suggesting that theactivity of the fatty acid reductase is strongly inhibited by the rela-tively large GST tag at elevated temperature, possibly by inhibitingassembly of the fatty acid reductase complex. In addition, we ob-served that the bioluminescence signal increases with temperature,yielding two to three times more signal at 37 °C compared withroom temperature (22 °C) (Fig. 1A).To further enhance the bioluminescence intensity, we sought to
identify the rate-limiting enzymes of the bioluminescence reactionby cloning a second copy of luxAB, luxCD, and luxE as well as two
different FMN reductases downstream of the luxCDABE operonand comparing the brightness with the original construct. TheFMN reductase from E. coli coded by the fre gene and theNADPH-flavin oxidoreductase from Vibrio campbellii coded bythe frp gene resulted in 1.5- and 2.3-fold increases in brightness,respectively (Fig. 1A). This suggested that the endogenous FMNreductase in E. coli does not regenerate sufficient amounts ofFMNH2 for maximum levels of bioluminescence. We choseluxCDABE+frp pGEX(−) for mutagenesis and performed multiplerounds of error-prone PCR in the luxAB, luxCD, luxE, and frpgenes. The resulting clones were screened for enhanced lumines-cence in DH5α cells on LB agar plates at 37 °C. We identifiedseveral mutations in luxA, luxB, luxC, and frp that resulted in higherbioluminescence signal, whereas no beneficial mutations in luxDand luxE were found. The final improved operon called ilux con-tains the mutations listed in Table 1 (complete amino acid se-quences of the ilux proteins are in Fig. S1). E. coli cells expressingthe WT lux operon (luxCDABE WT) and ilux exhibited identicalbioluminescence emission spectra (Fig. S2). The brightness of iluxcompared with luxCDABE WT was increased not only at 37 °C butalso at room temperature (Fig. 1A). Maximum levels of bio-luminescence from E. coli cells were observed at ∼37 °C for both
GST-luxCDABE:
luxCDABE:
luxCDABE+X:
ilux:
GST-luxC luxD tCtN
37 °C22 °C
GST-lux
CDABE
luxCDABE
luxCDABE+fr
e
luxCDABE+E
luxCDABE+C
D
luxCDABE+A
B
luxCDABE+A
luxCDABE+fr
pilu
x
Nor
mal
ized
brig
htne
ss
A
luxA luxB luxE
luxC luxD tCtN luxA luxB luxE
luxC luxD tCtN luxA luxB luxE X
iluxC luxD tCtN iluxA iluxB luxE ilux frp0
2
4
6
8
lux wtilux
Nor
mal
ized
brig
htne
ss
0.2
0.0
1.0
0.4
0.6
0.8
0 10 20 30 40 50 60T (°C)
CB
1.0
0.2
37 °C22 °C
ilux
EYFP-iluxA
iluxA
-EYFP
EYFP-iluxB
iluxB
-EYFP
0.8
1.2
0.4
0.0
0.6
Nor
mal
ized
brig
htne
ss
Fig. 1. Generation and comparison of lux variantswith increased brightness. (A) Brightness of differentlux variants. The lux operons schematically shown onthe Right were expressed from the vector pGEX(−) inDH5α cells on LB agar plates at 37 °C. Plates wereimaged at 37 °C and 22 °C. Error bars represent SDsof six different clones. Nt, N terminus; Ct, C terminus.(B) Temperature curves of luxCDABE WT and ilux.The bioluminescence signal from DH5α cells ex-pressing luxCDABE WT or ilux was measured in sus-pension at various temperatures. Error bars representSDs of six independent measurements. (C) Brightnessof ilux with EYFP-tagged versions of luxA and luxB.EYFP was introduced into ilux pGEX(−) at the N and Ctermini of luxA and luxB separated by a glycine-serinelinker. Brightness was measured in DH5α cells on LBagar plates and normalized to the brightness of un-labeled ilux at 37 °C. Error bars represent SDs of fourdifferent clones.
Table 1. Mutations contained in ilux
Gene Mutations
luxA K22E, T119A, S178AluxB S13P, V121A, N259DluxC N10T, N59D, E74D, S256P, M355T, N360DluxD —
luxE —
frp M213L, R242L, K256R
The listed mutations were introduced by error-prone PCR into the luxCDABEoperon from P. luminescens supplemented with the frp gene from V. campbellii,resulting in the improved operon ilux.
Gregor et al. PNAS | January 30, 2018 | vol. 115 | no. 5 | 963
BIOCH
EMISTR
YAPP
LIED
PHYS
ICAL
SCIENCE
S
Dow
nloa
ded
by g
uest
on
Feb
ruar
y 9,
202
0
luxCDABE WT and ilux, with a slightly broader temperaturecurve for ilux (Fig. 1B). Since we were not able to further im-prove the cellular signal intensity enabled by the ilux operon(“brightness of ilux”) by error-prone mutagenesis, we attemptedto increase its brightness by bioluminescence resonance energytransfer from the luciferase to an acceptor with high fluorescencequantum yield. For this purpose, we chose the fluorescent pro-tein EYFP [Φfl = 0.61 (17)] and fused it N- and C-terminally toboth the luciferase α and β subunit. However, this did not im-prove the brightness (Fig. 1C).To investigate whether the increase in brightness of ilux is due
to enhanced enzymatic activity or elevated expression of the luxproteins, we quantified protein levels by Western blot analysis ofcell lysates (Fig. S3). Since antibodies for the lux proteins from P.luminescens were not available, single proteins in the luxCDABEWT and ilux operon were expressed with a C-terminal His tag anddetected with an anti-His antibody. To control whether the His tagitself affects protein expression, the brightness of cells expressingthe His-tagged lux operons was compared with the lux operonwithout His tag. The brightness of ilux luxC-His and frp-His wasstrongly reduced (Fig. S4), whereas for the other His-taggedproteins the brightness remained comparable with the nontaggedoperon (Fig. 2A). Therefore, luxC and frp were instead expressedwith an N-terminal His tag, which influenced the brightness lessstrongly (Fig. 2A). However, the His antibody failed to detect His-frp (Fig. S3). Expression of the detectable functional fusion pro-teins luxA-His, luxB-His, His-luxC, luxD-His, and luxE-His in bothluxCDABE+frp and ilux was quantified by Western blot (Fig. 2B).Whereas expression of luxA-His and His-luxC was increased by30 and 25%, respectively, expression of luxB-His, luxD-His, andluxE-His remained unaffected. Therefore, the increased brightness
of ilux seems to be partly due to enhanced expression and partlydue to increased activity of the lux proteins.
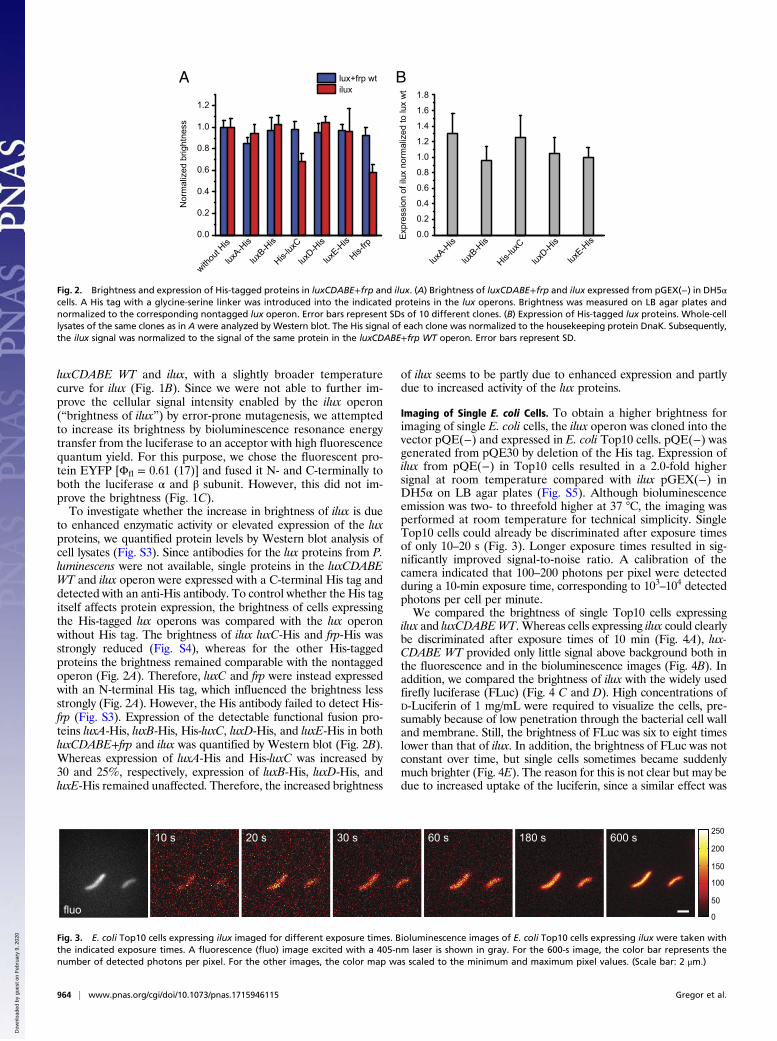
Imaging of Single E. coli Cells. To obtain a higher brightness forimaging of single E. coli cells, the ilux operon was cloned into thevector pQE(−) and expressed in E. coli Top10 cells. pQE(−) wasgenerated from pQE30 by deletion of the His tag. Expression ofilux from pQE(−) in Top10 cells resulted in a 2.0-fold highersignal at room temperature compared with ilux pGEX(−) inDH5α on LB agar plates (Fig. S5). Although bioluminescenceemission was two- to threefold higher at 37 °C, the imaging wasperformed at room temperature for technical simplicity. SingleTop10 cells could already be discriminated after exposure timesof only 10–20 s (Fig. 3). Longer exposure times resulted in sig-nificantly improved signal-to-noise ratio. A calibration of thecamera indicated that 100–200 photons per pixel were detectedduring a 10-min exposure time, corresponding to 103–104 detectedphotons per cell per minute.We compared the brightness of single Top10 cells expressing
ilux and luxCDABEWT. Whereas cells expressing ilux could clearlybe discriminated after exposure times of 10 min (Fig. 4A), lux-CDABE WT provided only little signal above background both inthe fluorescence and in the bioluminescence images (Fig. 4B). Inaddition, we compared the brightness of ilux with the widely usedfirefly luciferase (FLuc) (Fig. 4 C and D). High concentrations ofD-Luciferin of 1 mg/mL were required to visualize the cells, pre-sumably because of low penetration through the bacterial cell walland membrane. Still, the brightness of FLuc was six to eight timeslower than that of ilux. In addition, the brightness of FLuc was notconstant over time, but single cells sometimes became suddenlymuch brighter (Fig. 4E). The reason for this is not clear but may bedue to increased uptake of the luciferin, since a similar effect was
withou
t His
luxA-H
is
luxB-H
is
His-lux
C
luxD-H
is
luxE-H
is
luxA-H
is
luxB-H
is
His-lux
C
luxD-H
is
luxE-H
is
Nor
mal
ized
brig
htne
ss
Exp
ress
ion
of il
ux n
orm
aliz
ed to
lux
wt
lux+frp wtilux
1.2
1.0
0.8
0.6
0.4
0.2
0.0
1.8
1.6
1.4
1.2
1.0
0.8
0.6
0.4
0.2
0.0
BA
His-frp
Fig. 2. Brightness and expression of His-tagged proteins in luxCDABE+frp and ilux. (A) Brightness of luxCDABE+frp and ilux expressed from pGEX(−) in DH5αcells. A His tag with a glycine-serine linker was introduced into the indicated proteins in the lux operons. Brightness was measured on LB agar plates andnormalized to the corresponding nontagged lux operon. Error bars represent SDs of 10 different clones. (B) Expression of His-tagged lux proteins. Whole-celllysates of the same clones as in A were analyzed by Western blot. The His signal of each clone was normalized to the housekeeping protein DnaK. Subsequently,the ilux signal was normalized to the signal of the same protein in the luxCDABE+frp WT operon. Error bars represent SD.
20 s s006s081s06s03s01
fluo0
50
100
150
200
250
Fig. 3. E. coli Top10 cells expressing ilux imaged for different exposure times. Bioluminescence images of E. coli Top10 cells expressing ilux were taken withthe indicated exposure times. A fluorescence (fluo) image excited with a 405-nm laser is shown in gray. For the 600-s image, the color bar represents thenumber of detected photons per pixel. For the other images, the color map was scaled to the minimum and maximum pixel values. (Scale bar: 2 μm.)
964 | www.pnas.org/cgi/doi/10.1073/pnas.1715946115 Gregor et al.
Dow
nloa
ded
by g
uest
on
Feb
ruar
y 9,
202
0
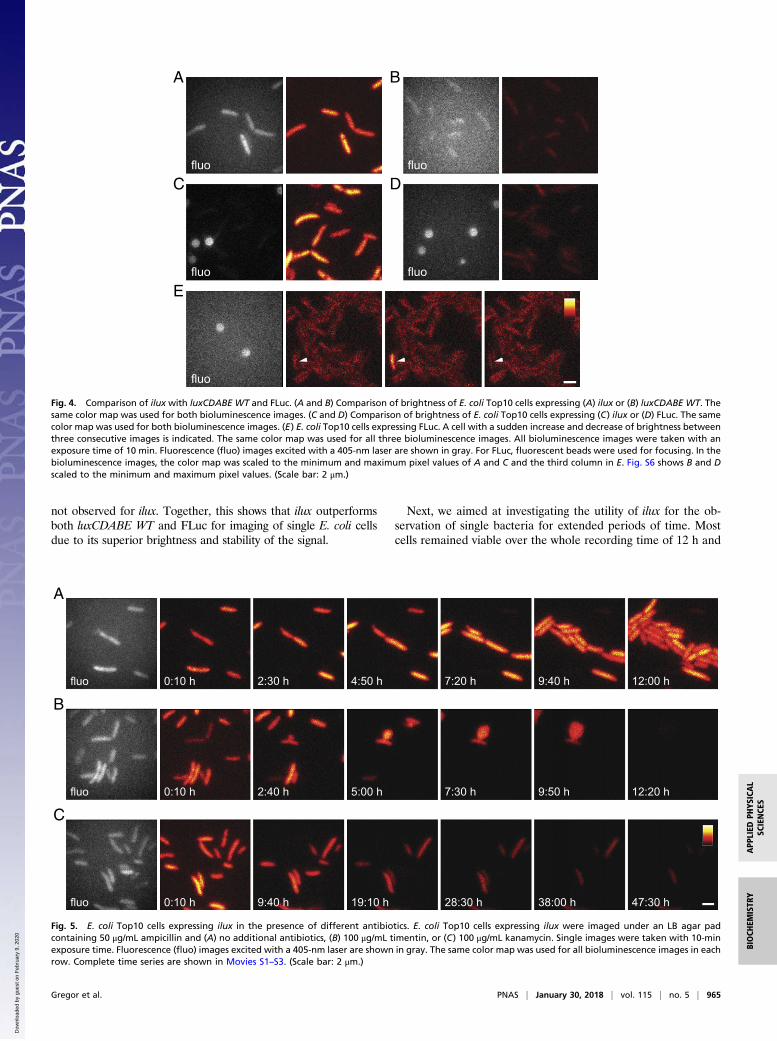
not observed for ilux. Together, this shows that ilux outperformsboth luxCDABE WT and FLuc for imaging of single E. coli cellsdue to its superior brightness and stability of the signal.
Next, we aimed at investigating the utility of ilux for the ob-servation of single bacteria for extended periods of time. Mostcells remained viable over the whole recording time of 12 h and
fluo
oulfoulf
fluo
BA
DC
E
fluo
Fig. 4. Comparison of ilux with luxCDABE WT and FLuc. (A and B) Comparison of brightness of E. coli Top10 cells expressing (A) ilux or (B) luxCDABE WT. Thesame color map was used for both bioluminescence images. (C and D) Comparison of brightness of E. coli Top10 cells expressing (C) ilux or (D) FLuc. The samecolor map was used for both bioluminescence images. (E) E. coli Top10 cells expressing FLuc. A cell with a sudden increase and decrease of brightness betweenthree consecutive images is indicated. The same color map was used for all three bioluminescence images. All bioluminescence images were taken with anexposure time of 10 min. Fluorescence (fluo) images excited with a 405-nm laser are shown in gray. For FLuc, fluorescent beads were used for focusing. In thebioluminescence images, the color map was scaled to the minimum and maximum pixel values of A and C and the third column in E. Fig. S6 shows B and Dscaled to the minimum and maximum pixel values. (Scale bar: 2 μm.)
C
B
A
0:10 h 2:30 h 4:50 h 7:20 h 9:40 h 12:00 h
0:10 h 2:40 h 5:00 h 7:30 h 9:50 h 12:20 h
0:10 h 9:40 h 19:10 h 28:30 h 38:00 h 47:30 h
fluo
fluo
fluo
Fig. 5. E. coli Top10 cells expressing ilux in the presence of different antibiotics. E. coli Top10 cells expressing ilux were imaged under an LB agar padcontaining 50 μg/mL ampicillin and (A) no additional antibiotics, (B) 100 μg/mL timentin, or (C) 100 μg/mL kanamycin. Single images were taken with 10-minexposure time. Fluorescence (fluo) images excited with a 405-nm laser are shown in gray. The same color map was used for all bioluminescence images in eachrow. Complete time series are shown in Movies S1–S3. (Scale bar: 2 μm.)
Gregor et al. PNAS | January 30, 2018 | vol. 115 | no. 5 | 965
BIOCH
EMISTR
YAPP
LIED
PHYS
ICAL
SCIENCE
S
Dow
nloa
ded
by g
uest
on
Feb
ruar
y 9,
202
0
divided several times while maintaining an almost constant bio-luminescence signal (Fig. 5A). Subsequently, we investigated theeffect of different antibiotics on cell viability. Since continuoussupply of ATP and NADPH is required for the regeneration offatty aldehyde and FMNH2 to keep the bioluminescence re-action ongoing, the signal is expected to disappear on cell death.We imaged Top10 cells in the presence of timentin, a mixture ofthe β-lactame antibiotic ticarcillin and clavulanic acid. SincepQE(−) contains a β-lactamase resistance marker, cells expressingilux are expected to be resistant to ticarcillin. However, since theβ-lactamase is inhibited by clavulanic acid, the cells becomesusceptible for the cell wall-disrupting effects of ticarcillin andampicillin. On cell division, this leads to the formation of smallholes in the cell wall. As a result, the inner membrane occa-sionally forms large protrusions due to osmotic pressure (Fig.5B). This finally leads to cell lysis. After 12 h, all cells in the fieldof view had died.The second antibiotic that we examined was kanamycin, an in-
hibitor of protein synthesis (Fig. 5C). The brightness decreasedcontinuously, consistent with a reduction of protein levels of the luxenzymes. Most cells died within the 48-h observation time; never-theless, bioluminescence was still detectable from a few cells. Thisshows that, even at high kanamycin concentrations of 100 μg/mL,cellular metabolism continues for relatively long timespans, al-though cell division is prevented immediately.Interestingly, we often observed “blinking” of cells before cell
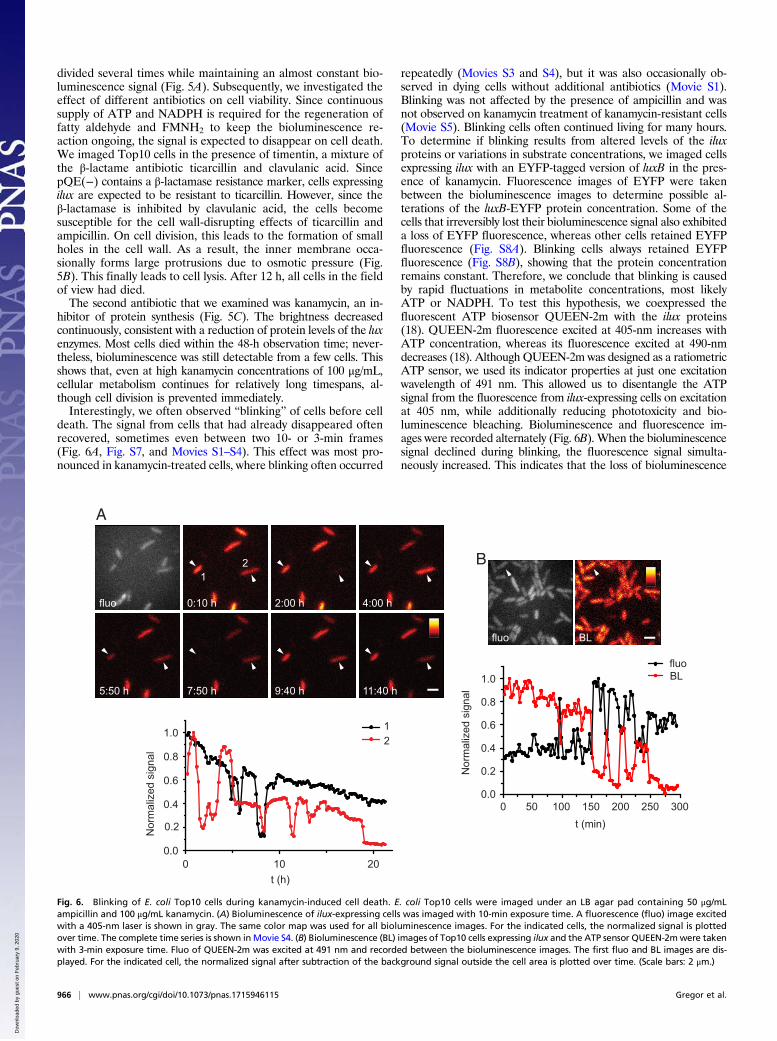
death. The signal from cells that had already disappeared oftenrecovered, sometimes even between two 10- or 3-min frames(Fig. 6A, Fig. S7, and Movies S1–S4). This effect was most pro-nounced in kanamycin-treated cells, where blinking often occurred
repeatedly (Movies S3 and S4), but it was also occasionally ob-served in dying cells without additional antibiotics (Movie S1).Blinking was not affected by the presence of ampicillin and wasnot observed on kanamycin treatment of kanamycin-resistant cells(Movie S5). Blinking cells often continued living for many hours.To determine if blinking results from altered levels of the iluxproteins or variations in substrate concentrations, we imaged cellsexpressing ilux with an EYFP-tagged version of luxB in the pres-ence of kanamycin. Fluorescence images of EYFP were takenbetween the bioluminescence images to determine possible al-terations of the luxB-EYFP protein concentration. Some of thecells that irreversibly lost their bioluminescence signal also exhibiteda loss of EYFP fluorescence, whereas other cells retained EYFPfluorescence (Fig. S8A). Blinking cells always retained EYFPfluorescence (Fig. S8B), showing that the protein concentrationremains constant. Therefore, we conclude that blinking is causedby rapid fluctuations in metabolite concentrations, most likelyATP or NADPH. To test this hypothesis, we coexpressed thefluorescent ATP biosensor QUEEN-2m with the ilux proteins(18). QUEEN-2m fluorescence excited at 405-nm increases withATP concentration, whereas its fluorescence excited at 490-nmdecreases (18). Although QUEEN-2m was designed as a ratiometricATP sensor, we used its indicator properties at just one excitationwavelength of 491 nm. This allowed us to disentangle the ATPsignal from the fluorescence from ilux-expressing cells on excitationat 405 nm, while additionally reducing phototoxicity and bio-luminescence bleaching. Bioluminescence and fluorescence im-ages were recorded alternately (Fig. 6B). When the bioluminescencesignal declined during blinking, the fluorescence signal simulta-neously increased. This indicates that the loss of bioluminescence
t (h)
Nor
mal
ized
sig
nal
12
0 10 20
1.0
0.8
0.6
0.4
0.2
0.0
A
12
fluo 2:00 h 4:00 h0:10 h
5:50 h 7:50 h 9:40 h1.0
0.8
0.6
0.4
0.2
0.00 50 100 150 200 250 300
fluoBL
t (min)
Nor
mal
ized
sig
nal
BLfluo
B
11:40 h
Fig. 6. Blinking of E. coli Top10 cells during kanamycin-induced cell death. E. coli Top10 cells were imaged under an LB agar pad containing 50 μg/mLampicillin and 100 μg/mL kanamycin. (A) Bioluminescence of ilux-expressing cells was imaged with 10-min exposure time. A fluorescence (fluo) image excitedwith a 405-nm laser is shown in gray. The same color map was used for all bioluminescence images. For the indicated cells, the normalized signal is plottedover time. The complete time series is shown inMovie S4. (B) Bioluminescence (BL) images of Top10 cells expressing ilux and the ATP sensor QUEEN-2mwere takenwith 3-min exposure time. Fluo of QUEEN-2m was excited at 491 nm and recorded between the bioluminescence images. The first fluo and BL images are dis-played. For the indicated cell, the normalized signal after subtraction of the background signal outside the cell area is plotted over time. (Scale bars: 2 μm.)
966 | www.pnas.org/cgi/doi/10.1073/pnas.1715946115 Gregor et al.
Dow
nloa
ded
by g
uest
on
Feb
ruar
y 9,
202
0
signal during kanamycin-induced cell death in blinking cells is ac-companied by a decrease in ATP concentration.
Discussion and ConclusionsOur results show that bacterial bioluminescence from E. coli cellscan be enhanced by mutagenesis of the luxCDABE genes incombination with introduction of an additional FMN reductase.This allows imaging of single E. coli cells with improved spatio-temporal resolution in comparison with previous approaches ofsingle-cell imaging using bacterial bioluminescence (3, 15, 19)without the need of exogenous aldehyde supply. Since the bright-ness of ilux is increased two- to threefold at 37 °C compared withroom temperature, heating of the sample during imaging is expectedto reduce the necessary recording times further. We have shown thatilux can be used to observe processes, such as division and death ofsingle E. coli cells, extending the range of applications of bacterialbioluminescence imaging.The spreading of bacterial antibiotic resistances is becoming an
increasing problem for the treatment of human diseases. There-fore, the development of improved and new antibiotics as well asmethods to investigate their influence on bacterial viability areurgently required. Taking individual differences between bacteriain the response to antibiotics into account, these methods shouldpreferentially examine bacteria on the single-cell level. A com-monly used test for the viability of individual bacteria is the stainingwith membrane-impermeable dyes, such as propidium iodide (PI),assuming that the dye only enters dead cells with impaired mem-brane integrity. However, this does not necessarily reflect theirmetabolic state. Using a FRET-based ATP biosensor, it has beenfound that not all PI-negative cells of Mycobacterium smegmatisexhibit high ATP levels (20), indicating that the membrane mayremain intact after cell death. In addition, the authors also ob-served PI-negative cells with high ATP levels that did not resumegrowth after antibiotic washout, showing the need to distinguishbetween membrane integrity, metabolic activity, and the abilityof bacteria to divide; ilux provides a means for continuous long-term imaging of single bacteria that simultaneously providesinformation about the metabolic state of the cell.Unexpectedly, we observed that kanamycin-treated dying cells
that lost their bioluminescence can temporarily recover. Giventhat the protein concentration of luxB remains constant during thisprocess and that kanamycin would inhibit the synthesis of newfunctional proteins, it seems likely that this blinking is not causedby changes in cellular protein levels but rather by altered substrate
concentrations. Fluorescence imaging with the ATP sensor QUEEN-2m showed that the loss of bioluminescence during blinking is cor-related with a decrease in the cellular ATP concentration. A possibleexplanation for this observation is a breakdown of the proton gradientdue to the transient formation of membrane defects, which mightinhibit ATP synthesis. Indeed, it has been described that amino-glycoside antibiotics can increase cellular permeability by the in-corporation of mistranslated membrane proteins (21, 22). Therefore,cell death in kanamycin-treated cells might be the final result ofpronounced membrane damage. This would also explain the rapidloss of EYFP fluorescence observed in some kanamycin-treatedcells expressing luxB-EYFP, as membrane defects might lead toleakage of cellular proteins. Although different explanations forthe blinking cannot be excluded, this effect points at interestingapplications of ilux by providing information about the metabolicactivity of the cell.The independence from exogenous luciferin makes the lux
system particularly interesting for long-term imaging studies, al-though its utility has so far been limited by its low brightnesscompared with other luciferases. Codon-optimized versions of thelux proteins have been shown to be functional in eukaryotic cells(13, 14), facilitating observation of bacterial bioluminescence fromcell types other than bacteria. Therefore, ilux holds promise as avaluable future tool for the observation of mammalian cells aswell. In addition, it might be possible to image cellular structuresby fusing the luciferase to a protein of interest, allowing its usagein a similar way as fluorescent proteins.
Materials and MethodsDetails of the cloning andmutagenesis of the lux constructs, measurement oftemperature curves, Western blot analysis, and the imaging are described inSI Materials and Methods. Briefly, bioluminescence imaging was performedon a custom microscopy setup (Fig. S9) equipped with an oil immersionobjective (1.4 N.A.) and an electron multiplying charge-coupled device(EMCCD) camera. The setup additionally contained laser sources for wide-field fluorescence excitation at 405 and 491 nm and a focus lock system forlong-term imaging.
ACKNOWLEDGMENTS. We thank Prof. Hiromi Imamura (Kyoto University)for donation of the QUEEN-2m sensor. We thank Dr. Grazvydas Lukinavicius,Torsten Hartmann, and Dr. Waja Wegner for helpful discussions and criticalreading of the manuscript and Jasmin Pape for assistance with microscopebuilding. K.C.G. received funding through a graduate scholarship by theCusanuswerk.
1. Haddock SH, Moline MA, Case JF (2010) Bioluminescence in the sea. Annu Rev Mar Sci2:443–493.
2. Welsh DK, Noguchi T (2012) Cellular bioluminescence imaging. Cold Spring HarbProtoc, 10.1101/pdb.top070607.
3. Mihalcescu I, Hsing W, Leibler S (2004) Resilient circadian oscillator revealed in indi-vidual cyanobacteria. Nature 430:81–85.
4. Agulhon C, et al. (2007) Bioluminescent imaging of Ca2+ activity reveals spatiotem-poral dynamics in glial networks of dark-adapted mouse retina. J Physiol 583:945–958.
5. Teranishi K, Shimomura O (1997) Solubilizing coelenterazine in water with hydroxy-propyl-β-cyclodextrin. Biosci Biotechnol Biochem 61:1219–1220.
6. Shimomura O, Kishi Y, Inouye S (1993) The relative rate of aequorin regenerationfrom apoaequorin and coelenterazine analogues. Biochem J 296:549–551.
7. de Wet JR, Wood KV, DeLuca M, Helinski DR, Subramani S (1987) Firefly luciferasegene: Structure and expression in mammalian cells. Mol Cell Biol 7:725–737.
8. Inoue Y, et al. (2011) Gaussia luciferase for bioluminescence tumor monitoring incomparison with firefly luciferase. Mol Imaging 10:377–385.
9. Stacer AC, et al. (2013) NanoLuc reporter for dual luciferase imaging in living animals.Mol Imaging 12:1–13.
10. Zhao H, et al. (2004) Characterization of coelenterazine analogs for measurements ofRenilla luciferase activity in live cells and living animals. Mol Imaging 3:43–54.
11. Close DM, et al. (2011) Comparison of human optimized bacterial luciferase, fireflyluciferase, and green fluorescent protein for continuous imaging of cell culture andanimal models. J Biomed Opt 16:047003.
12. Yagur-Kroll S, Belkin S (2011) Upgrading bioluminescent bacterial bioreporter per-formance by splitting the lux operon. Anal Bioanal Chem 400:1071–1082.
13. Close DM, et al. (2010) Autonomous bioluminescent expression of the bacterial lu-ciferase gene cassette (lux) in a mammalian cell line. PLoS One 5:e12441.
14. Xu T, Ripp S, Sayler GS, Close DM (2014) Expression of a humanized viral 2A-mediatedlux operon efficiently generates autonomous bioluminescence in human cells. PLoSOne 9:e96347.
15. Sternberg C, Eberl L, Poulsen LK, Molin S (1997) Detection of bioluminescence fromindividual bacterial cells: A comparison of two different low-light imaging systems.J Biolumin Chemilumin 12:7–13.
16. Westerlund-Karlsson A, Saviranta P, Karp M (2002) Generation of thermostable mo-nomeric luciferases from Photorhabdus luminescens. Biochem Biophys Res Commun296:1072–1076.
17. Patterson G, Day RN, Piston D (2001) Fluorescent protein spectra. J Cell Sci 114:837–838.
18. Yaginuma H, et al. (2014) Diversity in ATP concentrations in a single bacterial cellpopulation revealed by quantitative single-cell imaging. Sci Rep 4:6522.
19. Phiefer CB, Palmer RJJ, Jr, White DC (1999) Comparison of relative photon flux fromsingle cells of the bioluminescent marine bacteria Vibrio fischeri and Vibrio harveyiusing photon-counting microscopy. Luminescence 14:147–151.
20. Maglica Ž, Özdemir E, McKinney JD (2015) Single-cell tracking reveals antibiotic-induced changes in mycobacterial energy metabolism. MBio 6:e02236–14.
21. Davis BD, Chen LL, Tai PC (1986) Misread protein creates membrane channels: Anessential step in the bactericidal action of aminoglycosides. Proc Natl Acad Sci USA 83:6164–6168.
22. Kohanski MA, Dwyer DJ, Collins JJ (2010) How antibiotics kill bacteria: From targets tonetworks. Nat Rev Microbiol 8:423–435.
Gregor et al. PNAS | January 30, 2018 | vol. 115 | no. 5 | 967
BIOCH
EMISTR
YAPP
LIED
PHYS
ICAL
SCIENCE
S
Dow
nloa
ded
by g
uest
on
Feb
ruar
y 9,
202
0