Embed Size (px)
Citation preview
Strongyloidiasis and Infective Dermatitis Alter Human TLymphotropic Virus-1 Clonality in vivoNicolas A. Gillet1,2*, Lucy Cook1, Daniel J. Laydon1, Carol Hlela1, Kristien Verdonck3,4, Carolina Alvarez3,
Eduardo Gotuzzo3, Daniel Clark3, Lourdes Farre5, Achilea Bittencourt6, Becca Asquith1,
Graham P. Taylor7, Charles R. M. Bangham1*
1 Section of Immunology, Wright-Fleming Institute, Imperial College London, London, United Kingdom, 2 Molecular and Cellular Epigenetics, Interdisciplinary Cluster for
Applied Genoproteomics (GIGA) of University of Liege (ULg), Liege, Belgium, 3 Instituto de Medicina Tropical Alexander von Humboldt and Hospital Nacional Cayetano
Heredia, Universidad Peruana Cayetano Heredia, Lima, Peru, 4 Institute of Tropical Medicine, Antwerp, Belgium, 5 Laboratory of Experimental Pathology, Oswaldo Cruz
Foundation, Salvador, Bahia, Brazil, 6 Complexo Hospitalar Universitario Prof. Edgard Santos, Department of Pathology, Federal University of Bahia, Salvador, Bahia, Brazil,
7 Section of Infectious Diseases, Wright-Fleming Institute, Imperial College London, London, United Kingdom
Abstract
Human T-lymphotropic Virus-1 (HTLV-1) is a retrovirus that persists lifelong by driving clonal proliferation of infected T-cells.HTLV-1 causes a neuroinflammatory disease and adult T-cell leukemia/lymphoma. Strongyloidiasis, a gastrointestinalinfection by the helminth Strongyloides stercoralis, and Infective Dermatitis associated with HTLV-1 (IDH), appear to be riskfactors for the development of HTLV-1 related diseases. We used high-throughput sequencing to map and quantify theinsertion sites of the provirus in order to monitor the clonality of the HTLV-1-infected T-cell population (i.e. the number ofdistinct clones and abundance of each clone). A newly developed biodiversity estimator called ‘‘DivE’’ was used to estimatethe total number of clones in the blood. We found that the major determinant of proviral load in all subjects withoutleukemia/lymphoma was the total number of HTLV-1-infected clones. Nevertheless, the significantly higher proviral load inpatients with strongyloidiasis or IDH was due to an increase in the mean clone abundance, not to an increase in the numberof infected clones. These patients appear to be less capable of restricting clone abundance than those with HTLV-1 alone. Inpatients co-infected with Strongyloides there was an increased degree of oligoclonal expansion and a higher rate of turnover(i.e. appearance and disappearance) of HTLV-1-infected clones. In Strongyloides co-infected patients and those with IDH,proliferation of the most abundant HTLV-1+ T-cell clones is independent of the genomic environment of the provirus, insharp contrast to patients with HTLV-1 infection alone. This implies that new selection forces are driving oligoclonalproliferation in Strongyloides co-infection and IDH. We conclude that strongyloidiasis and IDH increase the risk ofdevelopment of HTLV-1-associated diseases by increasing the rate of infection of new clones and the abundance of existingHTLV-1+ clones.
Citation: Gillet NA, Cook L, Laydon DJ, Hlela C, Verdonck K, et al. (2013) Strongyloidiasis and Infective Dermatitis Alter Human T Lymphotropic Virus-1 Clonality invivo. PLoS Pathog 9(4): e1003263. doi:10.1371/journal.ppat.1003263
Editor: William C. Gause, University of Medicine & Denistry New Jersey, United States of America
Received November 11, 2012; Accepted February 5, 2013; Published April 4, 2013
Copyright: � 2013 Gillet et al. This is an open-access article distributed under the terms of the Creative Commons Attribution License, which permitsunrestricted use, distribution, and reproduction in any medium, provided the original author and source are credited.
Funding: We thank the Wellcome Trust, the FNRS (Fonds de la Recherche Scientifique), the Leukaemia and Lymphoma Research, F-3, the Medical ResearchCouncil and VLIR project from Belgium for funding. The funders had no role in study design, data collection and analysis, decision to publish, or preparation of themanuscript.
Competing Interests: The authors have declared that no competing interests exist.
* E-mail: [email protected] (NAG); [email protected] (CRMB)
Introduction
Human T-lymphotropic virus type 1 (HTLV-1) causes adult T-
cell leukemia-lymphoma (ATLL) and HTLV-1-associated mye-
lopathy/tropical spastic paraparesis (HAM/TSP). It has been
estimated that 10 to 20 million persons live with HTLV-1 infection
worldwide. A small proportion (up to 7%, depending on the area)
of HTLV-1-infected individuals develop disease, while the
majority remain asymptomatic carriers (ACs). Infection occurs
via breastfeeding, transfusion of infected cellular blood products,
or sexual intercourse. Symptoms usually appear after a long period
(years or decades) of clinical latency [1]. The HTLV-1 proviral
load remains stable within each infected person and correlates
with the outcome of infection. However, the proviral load varies
widely among infected people, even within a particular diagnostic
group [2,3,4]. Infectious transmission of HTLV-1 across the
virological synapse [5] is believed to be important early in
infection, whereas mitotic replication is thought to be mainlyresponsible for maintaining proviral load once a persistentinfection has been established and has reached equilibrium withthe immune response [6]. We recently showed that the abundanceof each established HTLV-1 clones is determined by genomicfeatures of the host DNA flanking the provirus. HTLV-1 clonalexpansion in vivo is enhanced by proviral integration in an activelytranscribed area of the genome [7].
The helminth Strongyloides stercoralis (St) is estimated to infect 50-
100 million individuals, mainly in the tropics and subtropics. Most
people with strongyloidiasis have mild diarrhea, vague abdominal
complaints, pruritus, perianal rash or simply remain asymptom-
atic. The Strongyloides stercoralis larvae migrate to a range of sites like
the lung, liver, kidney, and central nervous system. The larvae can
carry bacteria from the colon and cause fatal sepsis and meningitis.
A severe form of the disease named strongyloides hyperinfection
syndrome, characterized by abundant disseminated parasites, has
PLOS Pathogens | www.plospathogens.org 1 April 2013 | Volume 9 | Issue 4 | e1003263
been described in patients with corticosteroid therapy, severe
malnutrition, transplantation, haematological malignancies (espe-
cially lymphoma) and HTLV-1 infection [8]. Epidemiological
evidence shows that HTLV-1 is associated with a high frequency
of Strongyloides stercoralis infection, a high risk of the strongyloides
hyperinfection syndrome, and with relapse after treatment with
ivermectin, thiabendazole, or albendazole [9,10,11,12,13,14].
Patients with HTLV-1 and Strongyloides stercoralis co-infection had
a higher HTLV-1 proviral load and a higher Strongyloides stercoralis
burden than patients with either infection alone [13,15]. The high
proviral load measured in Strongyloides stercoralis co-infected patients
has been linked with oligoclonal expansion of HTLV-1 infected T-
cells [16]. Strongyloides stercoralis co-infection is suspected to be a risk
factor for the development of ATLL, but the mechanism is still
unclear [17,18,19,20,21,22,23,24].
Infective dermatitis (IDH) is a severe, chronic, relapsing
dermatitis associated with HTLV-1. IDH has been reported in
several populations with endemic HTLV-1 infection, including
South Africa, Jamaica, Trinidad, Brazil, Colombia, Peru and
Japan. Staphylococcus aureus and/or beta-hemolytic Streptococci are
commonly cultured from the skin lesions. The average age at
disease onset is 2 years. The disease decreases in severity with age
and rarely continues until adulthood [25]. IDH patients typically
have a high HTLV-1 proviral load, comparable to HAM/TSP
patients [26]. IDH is suspected to increase the risk of HAM/TSP
or ATLL development [26,27,28,29], but the evidence is not
conclusive.
The aim of this study was to identify and quantify the impact of
co-infection on HTLV-1 clonality. Because HTLV-1 proviral load
and oligoclonality are closely correlated with disease status, we
aimed to test the hypothesis that each co-infection increases the
risk of HTLV-1-associated diseases by increasing the number or
the abundance of HTLV-1-infected T-cell clones. We used a
newly developed method to map and quantify thousands of
HTLV-1 proviral insertion sites. We demonstrate that co-
infections significantly alter the HTLV-1 clonality. Patients with
strongyloidiasis or IDH had a higher proviral load and a higher
average clone abundance than did asymptomatic HTLV-1
carriers even though the major determinant of proviral load was
still the number of clones. The degree of oligoclonality of HTLV-1
was higher, and less stable over time, in patients with strongyloi-
diasis than in patients with neither co-infection nor ATLL, and
there was a higher rate of turnover (i.e. appearance or
disappearance) of HTLV-1-infected clones in the co-infected
patients. Finally, we show that co-infections drive the proliferation
of HTLV-1+ T-cell clones regardless of the genomic environment
of the provirus, in contrast to infection with HTLV-1 alone, in
which selective clonal expansion is favored by specific features of
the proviral integration site in that clone.
Results
Co-infections alter HTLV-1 proviral load, average cloneabundance and clonal distribution
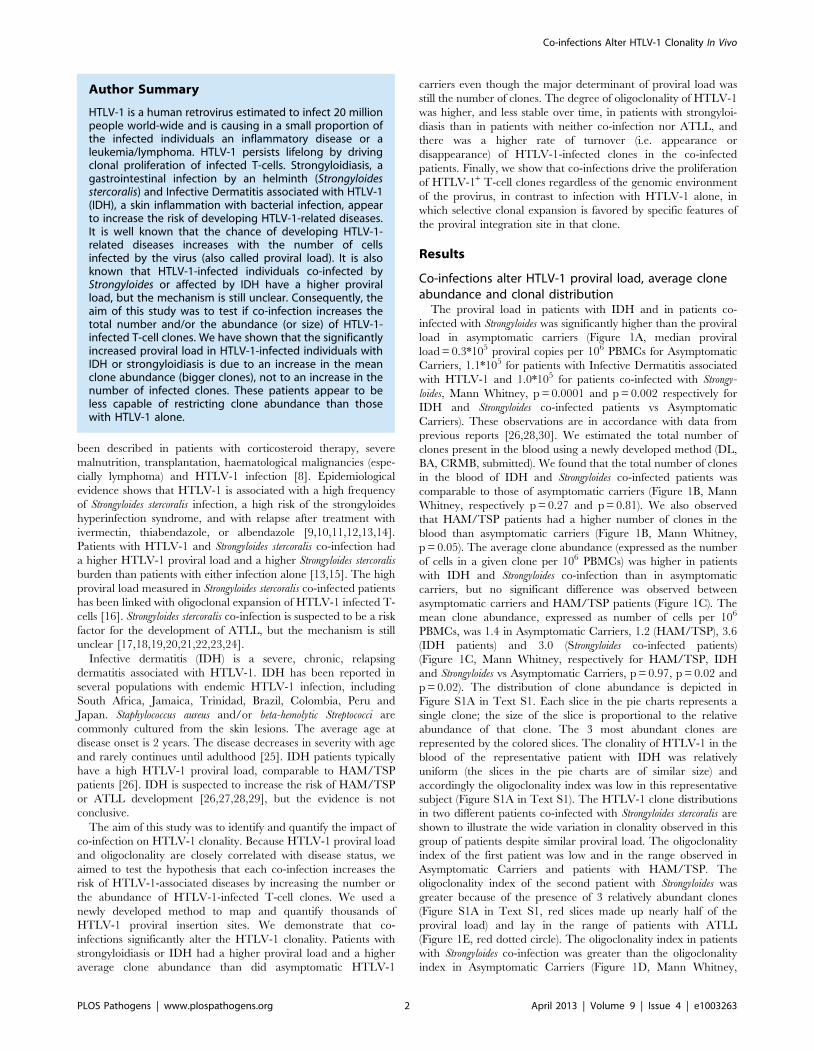
The proviral load in patients with IDH and in patients co-
infected with Strongyloides was significantly higher than the proviral
load in asymptomatic carriers (Figure 1A, median proviral
load = 0.3*105 proviral copies per 106 PBMCs for Asymptomatic
Carriers, 1.1*105 for patients with Infective Dermatitis associated
with HTLV-1 and 1.0*105 for patients co-infected with Strongy-
loides, Mann Whitney, p = 0.0001 and p = 0.002 respectively for
IDH and Strongyloides co-infected patients vs Asymptomatic
Carriers). These observations are in accordance with data from
previous reports [26,28,30]. We estimated the total number of
clones present in the blood using a newly developed method (DL,
BA, CRMB, submitted). We found that the total number of clones
in the blood of IDH and Strongyloides co-infected patients was
comparable to those of asymptomatic carriers (Figure 1B, Mann
Whitney, respectively p = 0.27 and p = 0.81). We also observed
that HAM/TSP patients had a higher number of clones in the
blood than asymptomatic carriers (Figure 1B, Mann Whitney,
p = 0.05). The average clone abundance (expressed as the number
of cells in a given clone per 106 PBMCs) was higher in patients
with IDH and Strongyloides co-infection than in asymptomatic
carriers, but no significant difference was observed between
asymptomatic carriers and HAM/TSP patients (Figure 1C). The
mean clone abundance, expressed as number of cells per 106
PBMCs, was 1.4 in Asymptomatic Carriers, 1.2 (HAM/TSP), 3.6
(IDH patients) and 3.0 (Strongyloides co-infected patients)
(Figure 1C, Mann Whitney, respectively for HAM/TSP, IDH
and Strongyloides vs Asymptomatic Carriers, p = 0.97, p = 0.02 and
p = 0.02). The distribution of clone abundance is depicted in
Figure S1A in Text S1. Each slice in the pie charts represents a
single clone; the size of the slice is proportional to the relative
abundance of that clone. The 3 most abundant clones are
represented by the colored slices. The clonality of HTLV-1 in the
blood of the representative patient with IDH was relatively
uniform (the slices in the pie charts are of similar size) and
accordingly the oligoclonality index was low in this representative
subject (Figure S1A in Text S1). The HTLV-1 clone distributions
in two different patients co-infected with Strongyloides stercoralis are
shown to illustrate the wide variation in clonality observed in this
group of patients despite similar proviral load. The oligoclonality
index of the first patient was low and in the range observed in
Asymptomatic Carriers and patients with HAM/TSP. The
oligoclonality index of the second patient with Strongyloides was
greater because of the presence of 3 relatively abundant clones
(Figure S1A in Text S1, red slices made up nearly half of the
proviral load) and lay in the range of patients with ATLL
(Figure 1E, red dotted circle). The oligoclonality index in patients
with Strongyloides co-infection was greater than the oligoclonality
index in Asymptomatic Carriers (Figure 1D, Mann Whitney,
Author Summary
HTLV-1 is a human retrovirus estimated to infect 20 millionpeople world-wide and is causing in a small proportion ofthe infected individuals an inflammatory disease or aleukemia/lymphoma. HTLV-1 persists lifelong by drivingclonal proliferation of infected T-cells. Strongyloidiasis, agastrointestinal infection by an helminth (Strongyloidesstercoralis) and Infective Dermatitis associated with HTLV-1(IDH), a skin inflammation with bacterial infection, appearto increase the risk of developing HTLV-1-related diseases.It is well known that the chance of developing HTLV-1-related diseases increases with the number of cellsinfected by the virus (also called proviral load). It is alsoknown that HTLV-1-infected individuals co-infected byStrongyloides or affected by IDH have a higher proviralload, but the mechanism is still unclear. Consequently, theaim of this study was to test if co-infection increases thetotal number and/or the abundance (or size) of HTLV-1-infected T-cell clones. We have shown that the significantlyincreased proviral load in HTLV-1-infected individuals withIDH or strongyloidiasis is due to an increase in the meanclone abundance (bigger clones), not to an increase in thenumber of infected clones. These patients appear to beless capable of restricting clone abundance than thosewith HTLV-1 alone.
Co-infections Alter HTLV-1 Clonality In Vivo
PLOS Pathogens | www.plospathogens.org 2 April 2013 | Volume 9 | Issue 4 | e1003263
Figure 1. HTLV-1 clonal structure in the blood of subjects with HTLV-1 infection alone and those with co-infections. A. The meanproviral load of patients with IDH or Strongyloides co-infection was higher than the proviral load of asymptomatic carriers (ACs) (Mann Whitney,respectively p = 0.0001 and p = 0.002). B. The estimated total number of clones in the blood of co-infected patients was comparable to the totalnumber of clones of ACs (Mann Whitney, respectively for IDH and Strongyloides co-infected vs AC, p = 0.27 and p = 0.81). By contrast, the estimatedtotal number of clones in the blood of HAM-TSP patients was higher than those of ACs (Mann Whitney, p = 0.03) C. On average, the infected clones inthe blood of IDH and Strongyloides co-infected patients were more abundant than those in ACs (Mann Whitney, respectively for IDH and Strongyloidesco-infected vs AC, p = 0.02, and p = 0.02) and those in HAM/TSP patients (Mann Whitney, respectively for IDH and St vs HAM/TSP, p = 0.006, andp = 0.002). D. The oligoclonality index in the blood of IDH patients was not significantly different from that in ACs (Mann Whitney, p = 0.08). On thecontrary, the oligoclonality index in peripheral blood of Strongyloides co-infected patients was higher than that in ACs (Mann Whitney, p = 0.01). E.proviral load and oligoclonality index were not correlated in any of the cohorts except ATLL (Spearman, respectively for AC, HAM/TSP, IDH,Strongyloides co-infected and ATLL, p = 0.34, p = 0.27, p = 0.92, p = 0.58 and p = 0.004). F. Proviral load was correlated with the total number of clonesin the blood in each cohort (Spearman, respectively for AC, HAM-TSP, IDH and St, p = 0.02, p = 0.0008, p = 0.05 and p = 0.04). G. oligoclonality indexand total number of clones in the blood did not correlate in any cohorts (Spearman, respectively for AC, HAM-TSP, IDH and St, p = 0.46, p = 0.27,p = 0.64 and p = 0.58). In panels A, D and E, data on patients infected with HTLV-1 infection alone are shown for comparison purposes and wereoriginally published in Blood. Gillet et al. The host genomic environment of the provirus determines the abundance of HTLV-1-infected T-cell clones.Blood. 2011; 117: 3113–3122. These data are shown by empty whiskers or grey symbols to distinguish them from new data in color.doi:10.1371/journal.ppat.1003263.g001
Co-infections Alter HTLV-1 Clonality In Vivo
PLOS Pathogens | www.plospathogens.org 3 April 2013 | Volume 9 | Issue 4 | e1003263
p = 0.01) confirming the previous observation of oligoclonal
expansion of HTLV-1 infected T-cells [16]. There was no
significant difference in oligoclonality index between Asymptom-
atic Carriers and IDH patients (Figure 1D, Mann Whitney,
p = 0.10). Two patients out of the 14 co-infected with Strongyloides
had a very high oligoclonality index (0.76 and 0.78 respectively)
due to oligoclonal expansion of infected clones (Figure 1E, dotted
red circle). Their proviral load and clonal distribution were in the
range of patients with ATLL. In patients without malignant
disease, proviral load did not correlate with oligoclonality index
(Figure 1E). However, proviral load was positively correlated with
the total number of clones in each cohort (Figure 1F) and by
contrast no correlation was observed between the number of
clones and oligoclonality index in any cohort (Figure 1G). The
mean oligoclonality index in patients with Strongyloides did not vary
significantly after anti-helminth treatment (Figure S1B and Table
S2 in Text S1), although there was a large decrease in
oligoclonality index after Strongyloides clearance in the patient with
the most oligoclonal distribution in the cohort (Figure S1B in Text
S1, patient St6).
These data show that, in individuals without ATLL, strongy-
loidiasis or IDH, the proviral load of HTLV-1, which correlates
with the risk of inflammatory and malignant diseases, is
determined mainly by the number of infected T-cell clones and
not, as previously believed, by the amount of oligoclonal
proliferation. The significantly increased proviral load in HTLV-
1-infected individuals with IDH or co-infected with Strongyloides is
due to an increase in the mean clone abundance, not to a further
increase in the number of infected clones. Moreover, the degree of
oligoclonal expansion in patients with Strongyloides was significantly
higher than that in asymptomatic carriers, whereas no significant
difference in oligoclonality index was observed between IDH
patients and asymptomatic carriers.
HTLV-1 clonality is less stable over time in Strongyloidesstercoralis co-infected patients
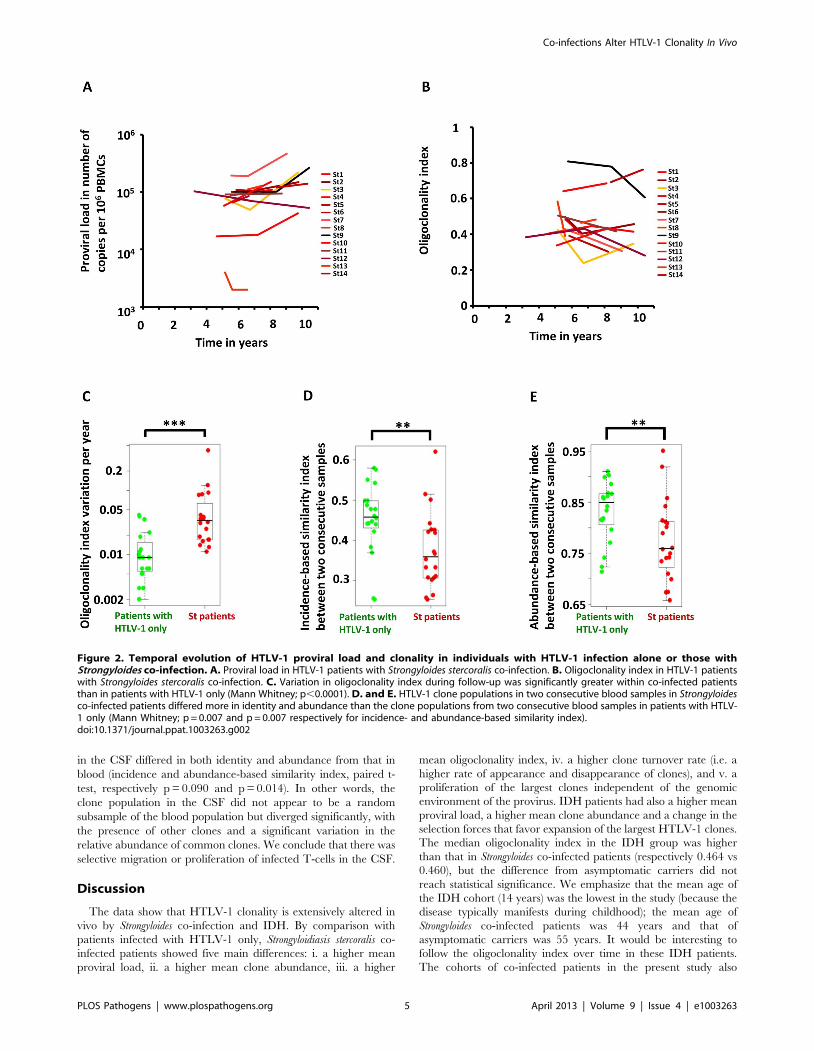
Figure 2A shows the evolution of proviral load with time in
Strongyloides co-infected patients. Figure 2B shows the evolution of
oligoclonality index with time in Strongyloides co-infected patients.
The data show that the oligoclonality index in Strongyloides co-
infected patients was more variable over time than in patients with
HTLV-1 infection alone as described previously [7]. This
conclusion was confirmed by the data shown in Figure 2C, which
depicts the absolute variation in oligoclonality index per year. The
oligoclonality index varied on average by 0.01 per year in patients
with HTLV-1 only and by 0.04 per year in Strongyloides co-infected
patients (Mann Whitney, p,0.0001). The similarity between the
populations of HTLV-1-infected T-cell clones at two consecutive
time points is shown in Figure 2D and 2E. To compare these two
populations we used the SØrensen similarity indices, which were
developed to assess the similarity between two ecosystems in term
of species shared. A clone is here the equivalent of a species. The
indices range from 0 to 1, with 0 indicating that no clones are
shared between the two time points and 1 indicating complete
identity (see Materials and Methods). Figure S2 in Text S1 shows
the incidence- and abundance-based similarity indices from
biological replicates (i.e. clonality analyses made in triplicate from
the same blood sample of patients with HTLV-1 only with non-
malignant infection). The results show that HTLV-1 clone
populations in two consecutive blood samples in Strongyloides co-
infected patients differed more in identity and abundance than the
clone populations from two consecutive blood samples in patients
with HTLV-1 only (Figure 2D and 2E, Mann Whitney; p = 0.007
and p = 0.007 respectively for incidence- and abundance-based
similarity index).
We conclude that HTLV-1 clonality was less stable in
Strongyloides co-infected patients, in whom there was a higher rate
of turnover of clones. This observation raised the question: does
co-infection with Strongyloides alter the selection forces that favor
selective expansion of HTLV-1+ clones?
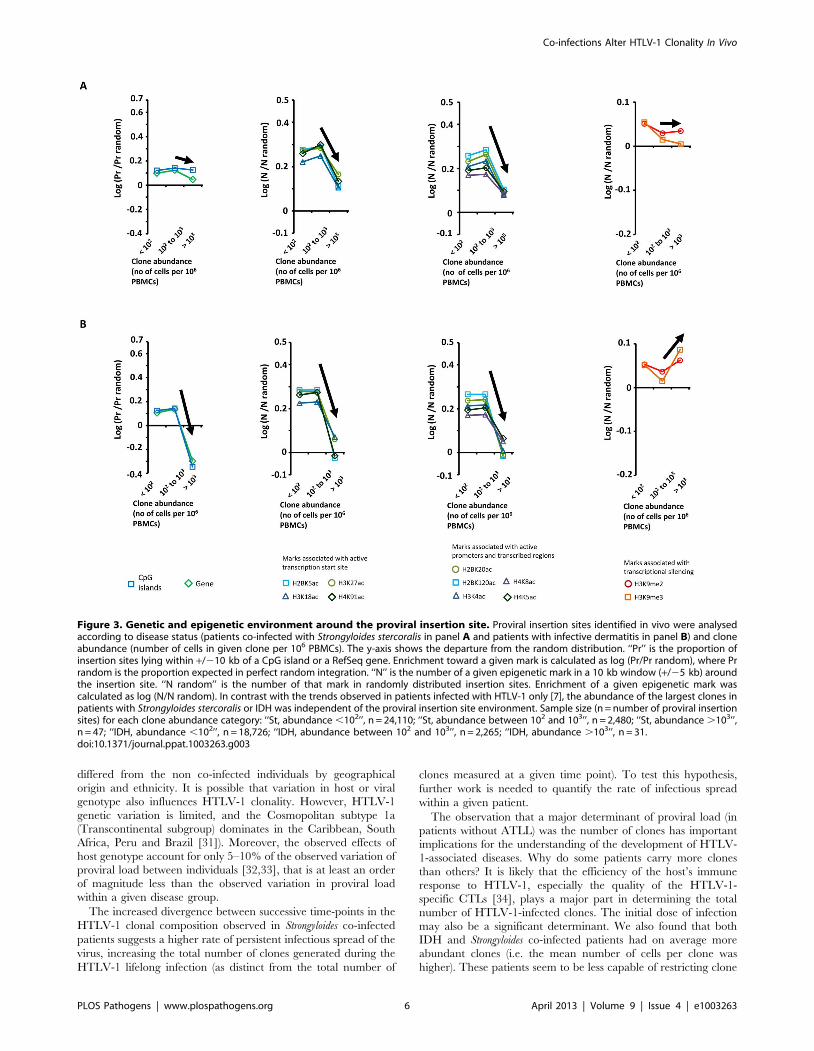
Co-infections drive the proliferation of clones regardlessof the genomic environment of the provirus
In patients with HTLV-1 alone, we previously reported [7] a
positive correlation between clone abundance and proximity to
CpG islands and host genes, a positive correlation between clone
abundance and markers of active transcription, and a negative
correlation with repressive epigenetic marks. We concluded from
these data [7] that transcriptional activity of the flanking host
genome favors selective expansion of the HTLV-1+ T-cell clone.
In contrast, in patients with Strongyloides co-infection or IDH, we
did not observe these trends linking clone abundance and a
particular genomic environment of the proviral integration site
(Figure 3, see black arrows). Specifically, the most abundant clones
(clone having more than 103 cells per 106 PBMCs) had a genomic
environment of the provirus similar to the random distribution; i.e.
the environment of the provirus does not determine the
abundance of the major clones in co-infected patients.
We conclude that the abundance of the largest clones in patients
with Strongyloides co-infection or IDH is independent of the
genomic environment of the proviral insertion site.
Low oligoclonality index in the skin lesions from IDHpatients
We quantified HTLV-1 clonality in two types of sample in
which the infected T-cells present are believed to play a direct role
in the pathogenesis of the respective inflammatory disease: CSF
from patients with HAM/TSP and skin lesions from patients with
IDH. The rationale was two-fold: first, over-representation of a
few infected clones in these tissues may indicate immune activation
of antigen-specific T-cells. Second, we wished to test whether the
selectively expanded clones in these tissues are also abundant in
the bloodstream.
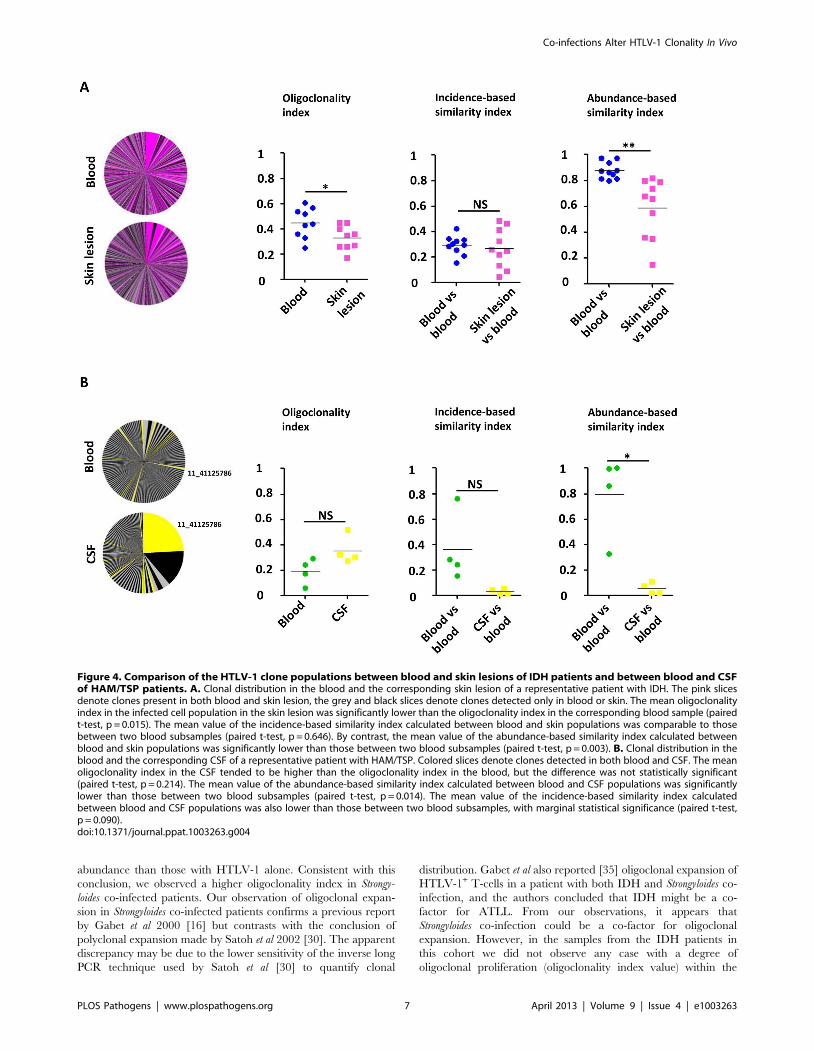
Figure 4A illustrates the overlap between the HTLV-1 infected
cell populations from blood and from the skin lesion. The pink
slices denote clones present in both blood and skin lesion, the grey
and black slices denote clones detected only in blood or skin. The
results show that a high proportion of the observed clones were
present in both skin and blood samples. The infected cell
population in the skin did not differ from the blood populations
in the identity of the clones (incidence-based similarity index,
paired t-test, p = 0.646), but differed by the relative abundance of
the common clones (abundance-based similarity index, paired t-
test, p = 0.003). The mean oligoclonality index in the infected cell
population in the skin lesion was significantly lower than the
oligoclonality index in the corresponding blood sample (paired t-
test, p = 0.015). That is, all HTLV-1-infected T-cell clones present
in the skin lesion had approximately the same relative abundance,
and there was no evidence of selective expansion of a specific
subset of infected cells.
Figure 4B illustrates the small overlap observed between blood
and CSF HTLV-1 infected cell populations. As above the yellow
slices show the clones found in both blood and CSF. The largest
clone in the CSF contained a provirus inserted in chromosome 11
(coordinate 41125786): this clone was also detected in blood but at
a much lower relative abundance. The infected clone population
Co-infections Alter HTLV-1 Clonality In Vivo
PLOS Pathogens | www.plospathogens.org 4 April 2013 | Volume 9 | Issue 4 | e1003263
in the CSF differed in both identity and abundance from that in
blood (incidence and abundance-based similarity index, paired t-
test, respectively p = 0.090 and p = 0.014). In other words, the
clone population in the CSF did not appear to be a random
subsample of the blood population but diverged significantly, with
the presence of other clones and a significant variation in the
relative abundance of common clones. We conclude that there was
selective migration or proliferation of infected T-cells in the CSF.
Discussion
The data show that HTLV-1 clonality is extensively altered in
vivo by Strongyloides co-infection and IDH. By comparison with
patients infected with HTLV-1 only, Strongyloidiasis stercoralis co-
infected patients showed five main differences: i. a higher mean
proviral load, ii. a higher mean clone abundance, iii. a higher
mean oligoclonality index, iv. a higher clone turnover rate (i.e. a
higher rate of appearance and disappearance of clones), and v. a
proliferation of the largest clones independent of the genomic
environment of the provirus. IDH patients had also a higher mean
proviral load, a higher mean clone abundance and a change in the
selection forces that favor expansion of the largest HTLV-1 clones.
The median oligoclonality index in the IDH group was higher
than that in Strongyloides co-infected patients (respectively 0.464 vs
0.460), but the difference from asymptomatic carriers did not
reach statistical significance. We emphasize that the mean age of
the IDH cohort (14 years) was the lowest in the study (because the
disease typically manifests during childhood); the mean age of
Strongyloides co-infected patients was 44 years and that of
asymptomatic carriers was 55 years. It would be interesting to
follow the oligoclonality index over time in these IDH patients.
The cohorts of co-infected patients in the present study also
Figure 2. Temporal evolution of HTLV-1 proviral load and clonality in individuals with HTLV-1 infection alone or those withStrongyloides co-infection. A. Proviral load in HTLV-1 patients with Strongyloides stercoralis co-infection. B. Oligoclonality index in HTLV-1 patientswith Strongyloides stercoralis co-infection. C. Variation in oligoclonality index during follow-up was significantly greater within co-infected patientsthan in patients with HTLV-1 only (Mann Whitney; p,0.0001). D. and E. HTLV-1 clone populations in two consecutive blood samples in Strongyloidesco-infected patients differed more in identity and abundance than the clone populations from two consecutive blood samples in patients with HTLV-1 only (Mann Whitney; p = 0.007 and p = 0.007 respectively for incidence- and abundance-based similarity index).doi:10.1371/journal.ppat.1003263.g002
Co-infections Alter HTLV-1 Clonality In Vivo
PLOS Pathogens | www.plospathogens.org 5 April 2013 | Volume 9 | Issue 4 | e1003263
differed from the non co-infected individuals by geographicalorigin and ethnicity. It is possible that variation in host or viralgenotype also influences HTLV-1 clonality. However, HTLV-1genetic variation is limited, and the Cosmopolitan subtype 1a(Transcontinental subgroup) dominates in the Caribbean, SouthAfrica, Peru and Brazil [31]). Moreover, the observed effects ofhost genotype account for only 5–10% of the observed variation ofproviral load between individuals [32,33], that is at least an orderof magnitude less than the observed variation in proviral loadwithin a given disease group.
The increased divergence between successive time-points in the
HTLV-1 clonal composition observed in Strongyloides co-infected
patients suggests a higher rate of persistent infectious spread of the
virus, increasing the total number of clones generated during the
HTLV-1 lifelong infection (as distinct from the total number of
clones measured at a given time point). To test this hypothesis,
further work is needed to quantify the rate of infectious spread
within a given patient.
The observation that a major determinant of proviral load (inpatients without ATLL) was the number of clones has importantimplications for the understanding of the development of HTLV-1-associated diseases. Why do some patients carry more clones
than others? It is likely that the efficiency of the host’s immuneresponse to HTLV-1, especially the quality of the HTLV-1-specific CTLs [34], plays a major part in determining the totalnumber of HTLV-1-infected clones. The initial dose of infectionmay also be a significant determinant. We also found that bothIDH and Strongyloides co-infected patients had on average moreabundant clones (i.e. the mean number of cells per clone was
higher). These patients seem to be less capable of restricting clone
Figure 3. Genetic and epigenetic environment around the proviral insertion site. Proviral insertion sites identified in vivo were analysedaccording to disease status (patients co-infected with Strongyloides stercoralis in panel A and patients with infective dermatitis in panel B) and cloneabundance (number of cells in given clone per 106 PBMCs). The y-axis shows the departure from the random distribution. ‘‘Pr’’ is the proportion ofinsertion sites lying within +/210 kb of a CpG island or a RefSeq gene. Enrichment toward a given mark is calculated as log (Pr/Pr random), where Prrandom is the proportion expected in perfect random integration. ‘‘N’’ is the number of a given epigenetic mark in a 10 kb window (+/25 kb) aroundthe insertion site. ‘‘N random’’ is the number of that mark in randomly distributed insertion sites. Enrichment of a given epigenetic mark wascalculated as log (N/N random). In contrast with the trends observed in patients infected with HTLV-1 only [7], the abundance of the largest clones inpatients with Strongyloides stercoralis or IDH was independent of the proviral insertion site environment. Sample size (n = number of proviral insertionsites) for each clone abundance category: ‘‘St, abundance ,102’’, n = 24,110; ‘‘St, abundance between 102 and 103’’, n = 2,480; ‘‘St, abundance .103’’,n = 47; ‘‘IDH, abundance ,102’’, n = 18,726; ‘‘IDH, abundance between 102 and 103’’, n = 2,265; ‘‘IDH, abundance .103’’, n = 31.doi:10.1371/journal.ppat.1003263.g003
Co-infections Alter HTLV-1 Clonality In Vivo
PLOS Pathogens | www.plospathogens.org 6 April 2013 | Volume 9 | Issue 4 | e1003263
abundance than those with HTLV-1 alone. Consistent with this
conclusion, we observed a higher oligoclonality index in Strongy-
loides co-infected patients. Our observation of oligoclonal expan-
sion in Strongyloides co-infected patients confirms a previous report
by Gabet et al 2000 [16] but contrasts with the conclusion of
polyclonal expansion made by Satoh et al 2002 [30]. The apparent
discrepancy may be due to the lower sensitivity of the inverse long
PCR technique used by Satoh et al [30] to quantify clonal
distribution. Gabet et al also reported [35] oligoclonal expansion of
HTLV-1+ T-cells in a patient with both IDH and Strongyloides co-
infection, and the authors concluded that IDH might be a co-
factor for ATLL. From our observations, it appears that
Strongyloides co-infection could be a co-factor for oligoclonal
expansion. However, in the samples from the IDH patients in
this cohort we did not observe any case with a degree of
oligoclonal proliferation (oligoclonality index value) within the
Figure 4. Comparison of the HTLV-1 clone populations between blood and skin lesions of IDH patients and between blood and CSFof HAM/TSP patients. A. Clonal distribution in the blood and the corresponding skin lesion of a representative patient with IDH. The pink slicesdenote clones present in both blood and skin lesion, the grey and black slices denote clones detected only in blood or skin. The mean oligoclonalityindex in the infected cell population in the skin lesion was significantly lower than the oligoclonality index in the corresponding blood sample (pairedt-test, p = 0.015). The mean value of the incidence-based similarity index calculated between blood and skin populations was comparable to thosebetween two blood subsamples (paired t-test, p = 0.646). By contrast, the mean value of the abundance-based similarity index calculated betweenblood and skin populations was significantly lower than those between two blood subsamples (paired t-test, p = 0.003). B. Clonal distribution in theblood and the corresponding CSF of a representative patient with HAM/TSP. Colored slices denote clones detected in both blood and CSF. The meanoligoclonality index in the CSF tended to be higher than the oligoclonality index in the blood, but the difference was not statistically significant(paired t-test, p = 0.214). The mean value of the abundance-based similarity index calculated between blood and CSF populations was significantlylower than those between two blood subsamples (paired t-test, p = 0.014). The mean value of the incidence-based similarity index calculatedbetween blood and CSF populations was also lower than those between two blood subsamples, with marginal statistical significance (paired t-test,p = 0.090).doi:10.1371/journal.ppat.1003263.g004
Co-infections Alter HTLV-1 Clonality In Vivo
PLOS Pathogens | www.plospathogens.org 7 April 2013 | Volume 9 | Issue 4 | e1003263
ATLL range; and the oligoclonality index of HTLV-1-infected
cells in the skin in IDH was significantly lower than that in the
blood (see below).
Based on observations in a mouse model, it has been shown that
immune activation of HTLV-1-infected CD4+ T-cells induces
HTLV-1 Tax expression, T-cell proliferation, and may culminate
in the development of ATLL [36]. Ratner et al [37] reported a case
of a patient with HTLV-1-associated chronic ATLL and
Strongyloides infection, in whom active HTLV-1 transcription
resolved with anti-helminthic therapy [37]. This observation
supports the idea that Strongyloides co-infection can induce
HTLV-1 transcription via T-cell immune activation. Nevertheless,
little is known about the nature of the hypothetical activating
signals induced by the co-infection. We considered two possible
explanations, which are not mutually exclusive: i. co-infection
induces immune activation of the few infected clones that are
specific to the co-infecting pathogen (such as Strongyloides stercoralis,
Staphylococcus or Streptococcus); ii. co-infection favours expansion of
all HTLV-1 infected clones (either by inducing non specific
immune activation of the HTLV-1 infected clones or by impairing
immune surveillance against the HTLV-1 infected cells). To
answer this question we compared the HTLV-1 infected T-cells
present in the skin lesion from IDH patients with the infected cells
from the corresponding blood sample. As a reference point, we
also compared the HTLV-1 infected T-cells present in the CSF in
HAM/TSP patients with the infected cells from the corresponding
blood sample. We observed that the major clone in the CSF can
be rare or undetectable in the bloodstream (Figure S4 in Text S1).
This supports the idea that certain infected clones present in the
CSF can expand in the central nervous system (CNS), perhaps
through antigenic stimulation; the relatively inefficient immune
surveillance (the ‘immune privilege’) in the CNS may also allow
unrestricted clonal expansion. By contrast, the presence of
numerous HTLV-1 clones with an approximately equal abun-
dance in the skin lesions of IDH patients suggests that the
dermatitis does not involve the selective proliferation of HTLV-1
infected T-cells specific to Staphylococcus (or Streptococcus) antigens,
but rather the non-specific proliferation of the entire population of
infiltrating T-cells. HTLV-1 infection in endemic regions
frequently occurs during breast-feeding and so predates infection
with Strongyloides or Streptococcus/Staphylococcus. Consequently, it is
unlikely that HTLV-1 infection is biased towards T-cells specific to
Strongyloides or Streptococcus. It remains possible that chronic antigen
stimulation favours the expansion of such T-cells in co-infected
subjects. However, since the degree of oligoclonality of infected T-
cells observed in patients with infective dermatitis was lower in the
skin lesion than in blood, we infer that antigen specificity was a
minor contributor to selective clonal expansion in these co-infected
individuals. It remains possible that stimulation by Strongyloides
antigens contributes to clonal expansion in individuals with
Strongyloides co-infection. Our observation that the abundance of
the largest clones in patients with Strongyloides co-infection or IDH
is independent of the proviral insertion site environment supports
the idea that Strongyloides co-infection and IDH change the
selection forces that favour expansion of HTLV-1-infected clones.
HTLV-1 infection causes activation and proliferation of the
infected T-cells. The HTLV-1 Tax protein activates the canonical
NF-kB pathway (review by Qu et al [38]), upregulates expression of
the interleukin-2 receptor alpha (IL-2Ra) [39] and promotes cell
proliferation [40]. Additionally, the frequency of CD4+FoxP3+
regulatory T-cells is abnormally high in HTLV-1 patients [41] and
the rate of CTL-mediated lysis of autologous HTLV-1-infected cells
is negatively correlated with the frequency of CD4+FoxP3+ T-cells
[41]. The frequency of CD4+FoxP3+ regulatory T-cells is increased
further in Strongyloides stercoralis co-infected patients [15]. These
observations suggest the existence of a vicious circle in which each
pathogen favors the other. We suggest that two principal factors
contribute to the increased clonal proliferation of HTLV-1+ T-cells
observed in Strongyloides co-infection. First, an autocrine IL2/IL-2R
loop was reported by Satoh et al [30] in patients with this co-
infection. Second, the high frequency of CD4+FoxP3+ T-cells may
impair the host T-cell response to HTLV-1 infection.
In summary, co-infection with Strongyloides is associated with an
increase in the rate of formation of new HTLV-1-infected T-cell
clones, oligoclonal proliferation of certain HTLV-1+ clones, and a
higher mean clone abundance. IDH, similarly, is associated with an
increase in the mean abundance of HTLV-1+ T-cells in the
circulation and a change of the selection forces that favour
expansion of HTLV-1+ clones. We propose that repeated activation
of a large number of HTLV-1-infected T-cell clones causes
abundant proviral expression, resulting in both infectious spread
(infection of new T-cell clones) and mitotic spread (proliferation of
existing infected T-cell clones) thereby increasing the risk of both
inflammatory disease and malignant transformation.
Materials and Methods
Blood, skin lesion and cerebrospinal fluid samplesWe studied 61 individuals (75% of Afrocaribbean ethnicity,
18% of Caucasian and 7% of Asian ethnicity) infected with
HTLV-1 alone (14 asymptomatic HTLV-1 carriers, mean age 55
years; 1 patient with uveitis; 26 patients with HAM/TSP, mean
age 62 years; 20 patients with ATLL, mean age 53 years). All
individuals attended the clinic at the National Centre for Human
Retrovirology (Imperial College Healthcare NHS Trust, St.
Mary’s Hospital, London, UK), and donated blood samples. Four
HAM/TSP patients (2 from the UK, 2 from Brazil) also donated
samples of cerebrospinal fluid (CSF). Fourteen individuals (11 from
Peru, 3 Caribbean, mean age 44 years) infected with HTLV-1 and
affected by strongyloidiasis donated blood samples. These patients
had microbiology confirmed stool positive samples for Strongyloides
stercoralis and confirmed negative post anti-helminth treatment.
Seventeen individuals with IDH (10 from South Africa and 7 from
Brazil, mean age 14 years) donated blood and skin lesion samples.
These patients had active disease at time of blood sampling and
biopsy. Table S1 in Text S1 details the microbiological isolates
from a skin swab of each patient. PBMCs were isolated using
Histopaque-1077 (Sigma-Aldrich). Cells were washed and cryo-
preserved in fetal calf serum (Invitrogen) with 10% DMSO
(Sigma-Aldrich). Skin lesion samples were frozen directly after
sampling in liquid nitrogen. DNA was extracted from PBMCs,
skin tissue or CSF using DNeasy Blood and Tissue kit (Qiagen).
Ethics statementAll subjects gave fully informed, written consent and all clinical
investigations have been conducted according to the principles
expressed in the Declaration of Helsinki. This study was approved
by the UK National Research Ethics Service (NRES reference 09/
H0606/106).
HTLV-1 proviral load measurementDNA was amplified for HTLV-1 DNA (using the Tax
sequence-specific primers SK43 and SK44) and for b-actin (as a
measure of genomic DNA using ActFw and ActRev primers)
(SK43:59CGGATACCCAGTCTACGTGT, SK44:59GAGCC-
GATAACGCGTCCATCG, ActFw:59TCACCCACACTGTG-
CCCATCTATGA, ActRev:59CATCGGAACCGCTCATTGC-
CGATAG). Three dilutions of DNA were amplified by real time
Co-infections Alter HTLV-1 Clonality In Vivo
PLOS Pathogens | www.plospathogens.org 8 April 2013 | Volume 9 | Issue 4 | e1003263
quantitative PCR in a Roche light cycler using SYBR Green 1
Dye incorporation (Roche Applied Science). Standard curves were
generated using the rat cell line TARL2 which contains 1 copy per
cell of the HTLV-1 provirus [42]. The sample copy number was
estimated by interpolation from the standard curve, calculated as
an average of the 3 dilutions, and expressed as the number of
copies per 106 PBMCs.
Selective amplification and quantification of proviralinsertion sites
We used a newly developed protocol to map and quantify
thousands of HTLV-1 proviral insertion sites, as previously
described [7], [43]. We define an HTLV-1 clone as a population
of cells that carry an integrated HTLV-1 provirus in a particular
insertion site in the host genome. We have demonstrated that
there is a single proviral copy per cell in non-transformed cells
naturally infected with HTLV-1 [44], and leukemic clones
typically carry one (complete or defective) provirus per cell [45]
[46]. DNA was extracted from uncultured PBMCs, skin lesion or
CSF of HTLV-1-infected individuals and sheared by sonication. A
partially double-stranded DNA linker containing a 6 nt index tag
was ligated to the sheared DNA and nested PCR was performed
between the HTLV-1 LTR and the linker. Nested PCR products
were pooled to construct the library of DNA for high-throughput
sequencing. Fifty-nucleotide paired-end reads (read 1 and read 2)
and a 6 nucleotide index tag read were acquired on an Illumina
Genome Analyzer II or an Illumina HiSeq. Read 1 and read 2
were mapped against the human genome (build hg18) and the
proviral insertion site and the shear site were deduced. For each
unique insertion site, we counted the number of amplicons of
different length (i.e. different shear sites) to enumerate the number
of sister cells of that infected T-cell clone. The absolute abundance
of a given clone i (number of cells per 106 PBMCs) was calculated
from the number of sister cells and the measurement of the
proviral load as follow:
Aabs(i)~Xi
PDi~1 Xi
� PVL
where Xi is the number of sister cells of the ith clone, D the number
of observed clones and PVL the proviral load.
The relative abundance of a given clone i (in percent of the
proviral load) was expressed as follow:
Arel(i)~Xi
PDi~1 Xi
� 100
Oligoclonality indexTo measure the clonality of the infected cell population, i.e. the
non-uniformity of the clone abundance distribution, we used the
oligoclonality index [7], based on the Gini coefficient [47].
Oligoclonality index = 1 indicates perfect monoclonality (only
one clone constitutes the total proviral load), while oligoclonality
index = 0 indicates perfect polyclonality (all clones have the same
abundance).
Similarity indicesQuantitative measures of similarity (or overlap) between two
populations play an important role in statistical ecology. The first
similarity indices developed were based on the presence or absence
of species between the two populations. The widely used SØrensen
incidence-based similarity index ranges from 0 to 1, with 0
indicating that no clones are shared between the two populations
and 1 indicating complete identity (all the clones present in
population 1 were also present in population 2 and vice versa). The
former index was subsequently improved to take into consider-
ation the abundance of each clone and named SØrensen
abundance-based similarity index. Because this index takes clone
abundance into account, populations that contain the same clones
but have different clone abundance will have an index value of less
than 1. Details of the calculations are given in supplemental data.
In Figure 2, the similarity index was calculated in each case by
comparing two samples of equal numbers of sister cells, to
preclude a bias toward the clone distribution in one sample. When
samples from 3 time points for a given patient were analysed, we
calculated the similarity index twice, between time point 1 and
time point 2 and between time point 2 and time point 3
respectively. In Figure 4, to compare blood and skin clone
populations or blood and CSF clone populations from the same
patient, we first created subsamples of clones from the blood
clonality analysis by randomly drawing 10% of the sister cells
detected in the blood. We calculated the similarity index by
comparing 2 different subsamples from the blood population (BLD
vs BLD values). We then created a subsample of clones from the
blood by randomly drawing the same number of sister cells
detected in the corresponding skin lesion (or CSF) and calculated
the similarity index between the blood subsample and the skin (or
CSF) (BLD vs SKN or BLD vs CSF respectively).
Genetic and epigenetic environment around the proviralinsertion site
We used the Integration Site Pipeline and Database (INSIPID)
from the Bushman laboratory (Department of Microbiology,
University of Pennsylvania School of Medicine, Pennsylvania,
Philadelphia, United States of America) (http://microb215.med.
upenn.edu/insipid/). This web-based tool houses sequences of
newly inserted elements in vertebrate genomes, together with
specific genomic annotations, to facilitate analysis of the
environment of the genomic insertion site: see Figure S3 in Text
S1.
Total number of clones in the blood and average cloneabundance in the blood
The diversity estimation approach (DivE) (Daniel Laydon,
Charles Bangham, Becca Asquith, submitted) used to estimate the
total number of clones (observed and unobserved) involves fitting
many mathematical models to species-accumulation data, and to
successively smaller nested subsamples thereof. Novel criteria are
used to score models in how consistently they can reproduce existing
observations from incomplete data. The estimates from the best
performing models are aggregated (using the geometric mean) to
estimate the number of clones in the circulation. We have shown
that, when applied to HTLV-1 infection and other microbiological
populations, DivE significantly outperforms several classical eco-
logical estimators of unseen species (namely the Chao, Bootstrap
and Good-Turing estimators, and species-accumulation curves). Let
Sobs be the total number of clones observed, and let SSobs be an
estimate of Sobs from a subsample of data. We define the accuracy of
a given estimator as the percentage error between SSobs and Sobs (i.e.
100 � (SSobs{Sobs)=Sobs). When applied to HTLV-1 infection, the
mean accuracy of DivE was 3.5%, compared to accuracies of
61.5%, 35.3%, 35.0%, and 29.1% for the Chao, Bootstrap and
Good-Turing estimators, and the species-accumulation curves
respectively (using two-tailed paired Mann-Whitney tests,
Co-infections Alter HTLV-1 Clonality In Vivo
PLOS Pathogens | www.plospathogens.org 9 April 2013 | Volume 9 | Issue 4 | e1003263
p,0.0001 for all comparisons with DivE). DivE was optimized for
clonal distribution of patients with non-malignant HTLV-1
infection and further work will be necessary to estimate with the
same confidence the total number of clones in ATLL patients.
Therefore, within this paper we do not estimate the total number of
clones in patients with ATLL.
The average clone abundance was calculated from the proviral
load divided by the estimated total number of clones in the blood
and expressed as the number of cells per 106 PBMCs.
Aaverage~PVL
S
where PVL is the proviral load and S the estimated total number of
clones.
StatisticsStatistical tests were performed using GraphPad Prism and R
softwares and were two tailed when possible. The symbol *** was
used when p,0.001, ** when p,0.01, * when p,0.05, NS (Non
Significant) when p.0.05.
Accession numbers (RefSeqGene)CXCR4, NG_011587.1; CCR5, NG_012637.1; IL-2Ra,
NG_007403.1; IFN-c, NG_015840.1; IL-10, NG_012088.1; TGF-
b, NG_013364.1; HTLV-1 Tax, NC_001436.1.
Supporting Information
Text S1 The supporting file Text S1 contains supporting figures
S1, S2, S3 and S4, supporting methods for similarity indices
calculation and supporting tables S1 and S2.
(PDF)
Acknowledgments
We thank the members of the Genomics Laboratory of the MRC Clinical
Sciences Centre, Hammersmith, London (Dr. Laurence Game, Adam
Giess, Dr Michael Jones, Nathalie Lambie, Frederique Maheo and
Elizabeth Webb). We thank Nirav Malani and Frederic D. Bushman
(Department of Microbiology, University of Pennsylvania School of
Medicine, Pennsylvania, Philadelphia, USA) for providing the software
tools to interrogate genomic databases.
Author Contributions
Obtained the ethical approvals, managed and recruited the patients,
conducted the longitudinal clinical studies, collected the biological samples
(blood, CSF and skin lesion): CH KV CA EG DC LF AB GPT. All authors
critically revised the manuscript and approved the final submitted version.
Conceived and designed the experiments: NAG LC DJL CRMB.
Performed the experiments: NAG LC. Analyzed the data: NAG LC
DJL. Contributed reagents/materials/analysis tools: DJL BA CH KV CA
EG DC LF AB GPT. Wrote the paper: NAG CRMB.
References
1. Proietti FA, Carneiro-Proietti AB, Catalan-Soares BC, Murphy EL (2005)
Global epidemiology of HTLV-I infection and associated diseases. Oncogene
24: 6058–6068.
2. Kubota R, Fujiyoshi T, Izumo S, Yashiki S, Maruyama I, et al. (1993)
Fluctuation of HTLV-I proviral DNA in peripheral blood mononuclear cells of
HTLV-I-associated myelopathy. J Neuroimmunol 42: 147–154.
3. Nagai M, Usuku K, Matsumoto W, Kodama D, Takenouchi N, et al. (1998)
Analysis of HTLV-I proviral load in 202 HAM/TSP patients and 243
asymptomatic HTLV-I carriers: high proviral load strongly predisposes to
HAM/TSP. J Neurovirol 4: 586–593.
4. Etoh K, Yamaguchi K, Tokudome S, Watanabe T, Okayama A, et al. (1999)
Rapid quantification of HTLV-I provirus load: detection of monoclonal
proliferation of HTLV-I-infected cells among blood donors. Int J Cancer 81:
859–864.
5. Nejmeddine M, Bangham CR (2010) The HTLV-1 Virological Synapse.
Viruses 2: 1427–1447.
6. Bangham CR, Osame M (2005) Cellular immune response to HTLV-1.
Oncogene 24: 6035–6046.
7. Gillet NA, Malani N, Melamed A, Gormley N, Carter R, et al. (2011) The host
genomic environment of the provirus determines the abundance of HTLV-1-
infected T-cell clones. Blood 117: 3113–3122.
8. Marcos LA, Terashima A, Dupont HL, Gotuzzo E (2008) Strongyloides
hyperinfection syndrome: an emerging global infectious disease. Trans R Soc
Trop Med Hyg 102: 314–318.
9. Robinson RD, Lindo JF, Neva FA, Gam AA, Vogel P, et al. (1994)
Immunoepidemiologic studies of Strongyloides stercoralis and human T
lymphotropic virus type I infections in Jamaica. J Infect Dis 169: 692–696.
10. Gotuzzo E, Terashima A, Alvarez H, Tello R, Infante R, et al. (1999)
Strongyloides stercoralis hyperinfection associated with human T cell lympho-
tropic virus type-1 infection in Peru. Am J Trop Med Hyg 60: 146–149.
11. Courouble G, Rouet F, Hermann-Storck C, Nicolas M, Candolfi E, et al. (2000)
Human T-cell lymphotropic virus Type I association with Strongyloides
stercoralis: a case control study among Caribbean blood donors from
Guadeloupe (French West Indies). J Clin Microbiol 38: 3903–3904.
12. Terashima A, Alvarez H, Tello R, Infante R, Freedman DO, et al. (2002)
Treatment failure in intestinal strongyloidiasis: an indicator of HTLV-I
infection. Int J Infect Dis 6: 28–30.
13. Satoh M, Toma H, Sato Y, Takara M, Shiroma Y, et al. (2002) Reduced
efficacy of treatment of strongyloidiasis in HTLV-I carriers related to enhanced
expression of IFN-gamma and TGF-beta1. Clin Exp Immunol 127: 354–359.
14. Hirata T, Uchima N, Kishimoto K, Zaha O, Kinjo N, et al. (2006) Impairment
of host immune response against strongyloides stercoralis by human T cell
lymphotropic virus type 1 infection. Am J Trop Med Hyg 74: 246–249.
15. Montes M, Sanchez C, Verdonck K, Lake JE, Gonzalez E, et al. (2009)
Regulatory T cell expansion in HTLV-1 and strongyloidiasis co-infection is
associated with reduced IL-5 responses to Strongyloides stercoralis antigen.
PLoS Negl Trop Dis 3: e456.
16. Gabet AS, Mortreux F, Talarmin A, Plumelle Y, Leclercq I, et al. (2000) High
circulating proviral load with oligoclonal expansion of HTLV-1 bearing T cells
in HTLV-1 carriers with strongyloidiasis. Oncogene 19: 4954–4960.
17. Pagliuca A, Layton DM, Allen S, Mufti GJ (1988) Hyperinfection with
strongyloides after treatment for adult T cell leukaemia-lymphoma in an African
immigrant. BMJ 297: 1456–1457.
18. Massey AC, Weinstein DL, Petri WA, Williams ME, Hess CE (1990) ATLL
complicated by strongyloidiasis and isosporiasis: case report. Va Med Q 117:
311–316.
19. Phelps KR (1993) Strongyloides hyperinfection in patients coinfected with
HTLV-I and S. stercoralis. Am J Med 94: 447–449.
20. Phelps KR, Ginsberg SS, Cunningham AW, Tschachler E, Dosik H (1991) Case
report: adult T-cell leukemia/lymphoma associated with recurrent strongyloides
hyperinfection. Am J Med Sci 302: 224–228.
21. Plumelle Y, Gonin C, Edouard A, Bucher BJ, Thomas L, et al. (1997) Effect of
Strongyloides stercoralis infection and eosinophilia on age at onset and prognosis
of adult T-cell leukemia. Am J Clin Pathol 107: 81–87.
22. Plumelle Y, Pascaline N, Nguyen D, Panelatti G, Jouannelle A, et al. (1993)
Adult T-cell leukemia-lymphoma: a clinico-pathologic study of twenty-six
patients from Martinique. Hematol Pathol 7: 251–262.
23. Agape P, Copin MC, Cavrois M, Panelatti G, Plumelle Y, et al. (1999)
Implication of HTLV-I infection, strongyloidiasis, and P53 overexpression in the
development, response to treatment, and evolution of non-Hodgkin’s lympho-
mas in an endemic area (Martinique, French West Indies). J Acquir Immune
Defic Syndr Hum Retrovirol 20: 394–402.
24. Pagliuca A (1999) Strongyloides hyperinfection in adult T-cell leukaemia/
lymphoma. Br J Haematol 105: 1.
25. Lee R, Schwartz RA (2011) Human T-lymphotrophic virus type 1-associated
infective dermatitis: a comprehensive review. J Am Acad Dermatol 64: 152–160.
26. Primo J, Siqueira I, Nascimento MC, Oliveira MF, Farre L, et al. (2009) High
HTLV-1 proviral load, a marker for HTLV-1 associated myelopathy/tropical
spastic paraparesis, is also detected in patients with infective dermatitis
associated with HTLV-1. Braz J Med Biol Res 42: 761–764.
27. de Oliveira Mde F, Bittencourt AL, Brites C, Soares G, Hermes C, et al. (2004)
HTLV-I associated myelopathy/tropical spastic paraparesis in a 7-year-old boy
associated with infective dermatitis. J Neurol Sci 222: 35–38.
28. Nascimento MC, Primo J, Bittencourt A, Siqueira I, de Fatima Oliveira M, et al.
(2009) Infective dermatitis has similar immunological features to human T
lymphotropic virus-type 1-associated myelopathy/tropical spastic paraparesis.
Clin Exp Immunol 156: 455–462.
29. de Oliveira Mde F, Vieira MG, Primo J, Siqueira IC, Carvalho EM, et al. (2010)
Flower cells in patients with infective dermatitis associated with HTLV-1. J Clin
Virol 48: 288–290.
Co-infections Alter HTLV-1 Clonality In Vivo
PLOS Pathogens | www.plospathogens.org 10 April 2013 | Volume 9 | Issue 4 | e1003263
30. Satoh M, Toma H, Sugahara K, Etoh K, Shiroma Y, et al. (2002) Involvement
of IL-2/IL-2R system activation by parasite antigen in polyclonal expansion ofCD4(+)25(+) HTLV-1-infected T-cells in human carriers of both HTLV-1 and
S. stercoralis. Oncogene 21: 2466–2475.
31. Gessain A, Cassar O (2012) Epidemiological Aspects and World Distribution ofHTLV-1 Infection. Front Microbiol 3: 388.
32. Vine AM, Witkover AD, Lloyd AL, Jeffery KJ, Siddiqui A, et al. (2002)Polygenic control of human T lymphotropic virus type I (HTLV-I) provirus load
and the risk of HTLV-I-associated myelopathy/tropical spastic paraparesis.
J Infect Dis 186: 932–939.33. Jeffery KJ, Usuku K, Hall SE, Matsumoto W, Taylor GP, et al. (1999) HLA
alleles determine human T-lymphotropic virus-I (HTLV-I) proviral load and therisk of HTLV-I-associated myelopathy. Proc Natl Acad Sci U S A 96: 3848–
3853.34. Bangham CR (2009) CTL quality and the control of human retroviral infections.
Eur J Immunol 39: 1700–1712.
35. Gabet AS, Kazanji M, Couppie P, Clity E, Pouliquen JF, et al. (2003) Adult T-cell leukaemia/lymphoma-like human T-cell leukaemia virus-1 replication in
infective dermatitis. Br J Haematol 123: 406–412.36. Swaims AY, Khani F, Zhang Y, Roberts AI, Devadas S, et al. (2010) Immune
activation induces immortalization of HTLV-1 LTR-Tax transgenic CD4+ T
cells. Blood 116: 2994–3003.37. Ratner L, Grant C, Zimmerman B, Fritz J, Weil G, et al. (2007) Effect of
treatment of Strongyloides infection on HTLV-1 expression in a patient withadult T-cell leukemia. Am J Hematol 82: 929–931.
38. Qu Z, Xiao G (2011) Human T-cell lymphotropic virus: a model of NF-kappaB-associated tumorigenesis. Viruses 3: 714–749.
39. Ballard DW, Bohnlein E, Lowenthal JW, Wano Y, Franza BR, et al. (1988)
HTLV-I tax induces cellular proteins that activate the kappa B element in the
IL-2 receptor alpha gene. Science 241: 1652–1655.
40. Asquith B, Zhang Y, Mosley AJ, de Lara CM, Wallace DL, et al. (2007) In vivo
T lymphocyte dynamics in humans and the impact of human T-lymphotropic
virus 1 infection. Proc Natl Acad Sci U S A 104: 8035–8040.
41. Toulza F, Heaps A, Tanaka Y, Taylor GP, Bangham CR (2008) High frequency
of CD4+FoxP3+ cells in HTLV-1 infection: inverse correlation with HTLV-1-
specific CTL response. Blood 111: 5047–5053.
42. Tateno M, Kondo N, Itoh T, Chubachi T, Togashi T, et al. (1984) Rat
lymphoid cell lines with human T cell leukemia virus production. I. Biological
and serological characterization. J Exp Med 159: 1105–1116.
43. Berry CC, Gillet NA, Melamed A, Gormley N, Bangham CR, et al. (2012)
Estimating abundances of retroviral insertion sites from DNA fragment length
data. Bioinformatics 28: 755–762.
44. Cook LB, Rowan AG, Melamed A, Taylor GP, Bangham CR (2012) HTLV-1-
infected T cells contain a single integrated provirus in natural infection. Blood
120: 3488–90.
45. Tamiya S, Matsuoka M, Etoh K, Watanabe T, Kamihira S, et al. (1996) Two
types of defective human T-lymphotropic virus type I provirus in adult T-cell
leukemia. Blood 88: 3065–3073.
46. Ohshima K, Ohgami A, Matsuoka M, Etoh K, Utsunomiya A, et al. (1998)
Random integration of HTLV-1 provirus: increasing chromosomal instability.
Cancer Lett 132: 203–212.
47. Gini C (1914) Sulla misura della concentrazione e della variabilita dei caratteri:
Transactions of the Real Istituto Veneto di Scienze. Ferrari.
Co-infections Alter HTLV-1 Clonality In Vivo
PLOS Pathogens | www.plospathogens.org 11 April 2013 | Volume 9 | Issue 4 | e1003263


![IntaRNA 2.0 - enhanced and customizable prediction of RNA ......FnrS b1531 marA 54 96 - [14] FnrS b1656 sodB 667 118 64 [19] FnrS b1841 yobA 5 5 5 [19] FnrS b2153 folE 512 539 284](https://img.pdfslide.net/doc/110x75/60d80aafb25aa079a16b7e73/intarna-20-enhanced-and-customizable-prediction-of-rna-fnrs-b1531-mara.jpg)