Embed Size (px)
Citation preview
STRUCTURAL ANALYSIS OF NUCLEOTIDE BINDING SITES
OF ANTIMICROBIAL RIBONUCLEASES
JOSÉ ANTONIO BLANCO BARRERA
Barcelona, 2015

STRUCTURAL ANALYSIS OF NUCLEOTIDE BINDING SITES
OF ANTIMICROBIAL RIBONUCLEASES Tesis presentada por José Antonio Blanco Barrera bajo la dirección de la doctora Ester Boix Borràs, miembro del Departamento de Bioquímica y Biología Molecular de la Facultad de Biociencias de la Universidad Autónoma de Barcelona.
José Antonio Blanco Barrera
Dra. Ester Boix Borràs José Antonio Blanco Barrera
Cerdanyola del Vallès (Barcelona), septiembre de 2015
The picture appearing at the first page depicts the protein packing at the crystal cell unit cell of the double mutant RNase A (RNase A/K7H‐R10H) – 3’‐CMP complex.
A mi familia y a Danipor su apoyo y amor

AGRADECIMIENTOS
El trabajo de esta Tesis se ha realizado en el Departamento de Bioquímica y Biología Molecular de la Facultad de Biociencias de la Universidad Autónoma de Barcelona. Comencé con este proyecto en 2010 motivado por todo lo que la investigación lleva asociado: fallar, descubrir y aprender. Doy por ello las gracias a Ester Boix por aceptarme en su grupo de investigación, aguantar durante todos estos años y las necesarias correcciones de este trabajo, a Helen McNally por las observaciones en cuanto a la expresión escrita en inglés, a Mohammed Moussaoui y Maria Victòria Nogués por sus evaluaciones y necesarias llamadas de atención, la inestimable ayuda y los consejos en el trabajo. A mis compañeros de grupo y demás personal del Departamento por su paciencia y por las tan agradecidas charlas sobre trivialidades. Durante todo este tiempo en el departamento he tenido asimismo la oportunidad de formarme como persona y comprobar efectivamente aquello de caminante no hay camino, se hace camino al andar. Las pocas pero a la vez satisfactorias alegrías, junto con las muchas decepciones exigentes de paciencia, me han hecho ver que este camino no es sino la experiencia de la propia vida, que lo que concluye con esta especie de memoria es una de sus etapas y que sólo uno mismo puede realizarla. Nadie más debe ni puede recorrerlo ni, de hecho, lo hará, ya sea por razones lógicas de desinterés o porque ya tienen suficiente en su propio camino como para ocuparse de recorrer el de los demás. Y a pesar del pesimismo que muy a menudo me ha caracterizado durante estos años, me doy cuenta a la vez de que a lo mejor la vida no es tan negra. Cuando echo la vista atrás, me veo rodeado de personas que siempre me han ayudado cuando lo he necesitado. Amigos y familiares con los que contar en momentos de alegrías, momentos malos o merecidas desconexiones, con los que he madurado por las buenas y por las malas y que a pesar de la distancia no han dudado en ningún momento en hacer todo lo posible para animarme, darme esperanzas y hacer que la botella estuviera medio llena. Debo agradecer enormemente a mis padres y a mi hermana el haber estado a mi lado en los numerosos momentos de desánimo y hartazgo, cuando uno piensa que ciertos esfuerzos no valen la pena. Siempre han creído en mí y les debo tanto durante estos últimos años que las palabras de esta página se me quedan cortas. Doy las gracias también a los amigos que me han visto crecer durante estos años y que tamibién han contribuido a que no desista de mi idea de dedicarme a la investigación. Reír, viajar y, en definitiva, poder contar con ellos para desconectar y disfrutar es el mejor remedio para las malas rachas y es algo que cambio por nada. Gracias a Iván, Miguel, Edu, Pili, Carlos, Rocío, Pablo, Inma y al resto de gente de Barcelona y Córdoba. No se os olvida. Y, por último, a quien ha estado a mi lado desde el comienzo, que siempre ha creído en mí, que ha soportado como nadie mis arrebatos de desilusión, pesadumbre y odio hacia el mundo y que, a pesar de todo, me hace seguir adelante cada día en mi camino: Dani. Gracias a todos por ayudarme a llegar a esta meta. Muchas gracias.
No te arrepientas de aquello que hayas hecho. Si es bueno, es un recuerdo; si es malo, una experiencia.
Arrepiéntete de lo que hayas dejado de hacer por miedo a los demás.

Index
i
Index ..................................................................................................................................... i Abbreviation list ....................................................................................................................v Summary.............................................................................................................................vii Resumen ..............................................................................................................................ix
CHAPTER 1: INTRODUCTION ................................................................................ 1 1. Ribonucleases ................................................................................................................ 3 2. Types and functions of ribonucleases ............................................................................. 3
3. Pyrimidine‐specific ribonuclease superfamily ................................................................. 5
3.1. The superfamily of ribonuclease A..................................................................................5 3.1.1. Ribonucleases 1 to 8............................................................................................7
4. Ribonuclease activity.....................................................................................................12
4.1. Mechanism of catalysis in RNase A superfamily...........................................................12 4.2. Interaction of RNase A with the RNA substrate............................................................13 4.3. Conformational flexibility in protein dynamics.............................................................15 4.4. Nucleotide binding architecture in secreted cytotoxic endoribonucleases .................16
5. Biological properties .....................................................................................................17 5.1. Antimicrobial RNases ....................................................................................................17
5.1.1. Antimicrobial mechanism of action ..................................................................17 5.1.2. Properties of antimicrobial peptides .................................................................20
5.2. Eosinophil ribonucleases...............................................................................................20 5.2.1. The eosinophil cationic protein (ECP) or RNase 3: biological properties...........21
Antipathogenic activities of ECP..............................................................................21 Other biological properties......................................................................................22
5.3. Factors determining cytotoxicity ..................................................................................23 5.3.1. Interaction with cell membranes ......................................................................24 5.3.2. Intracellular traffic and translocation into cytoplasm ......................................25 5.3.3. Action of ribonuclease inhibitor ........................................................................25 5.3.4. Catalytic activity ................................................................................................26 5.3.5. Protein stability .................................................................................................26 5.3.6. Protein aggregation ..........................................................................................26
5.4. Bactericidal mechanism of action .................................................................................27 5.4.1. Action at bacterial cell membranes ..................................................................27 5.4.2. Action at bacterial cell walls .............................................................................27
Wall structure of Gram‐negative species ................................................................28 Wall structure of Gram‐positive species .................................................................28
5.5. Structural determinants of ECP antimicrobial activity..................................................29 5.6. Secretory ribonucleases................................................................................................31
5.6.1. Vertebrate RNases ............................................................................................31 5.6.2. RNases of plants, bacteria and fungi ................................................................33
AIMS OF THE THESIS............................................................................................................35
CHAPTER 2: MATERIALS AND METHODS............................................................ 37 1. Equipment and chemical products.................................................................................39
Index
ii
2. Statistical analysis of nucleotide protein complex structures.........................................39 3. Basic experimental methods .........................................................................................40
3.1. Extraction of plasmidic DNA .........................................................................................40 3.2. Transformation of competent cells with plasmidic DNA ..............................................41
4. Methods in protein analysis ..........................................................................................42
4.1. Recombinant protein expression and purification from inclusion bodies (IB) .............42 4.1.1. Expression procedure in E. coli ..........................................................................43 4.1.2. Protein solubilisation and refolding ..................................................................43 4.1.3. Protein concentration and purification .............................................................44
4.2. Characterisation methods.............................................................................................45 4.2.1. Protein electrophoresis .....................................................................................45 4.2.2. Protein N‐terminal sequencing and MALDI‐TOF mass spectrometry................47
5. Protein crystallisation and crystal handling ...................................................................47
5.1. Vapour diffusion methods ...........................................................................................48 5.1.1. Hanging drop method .......................................................................................48 5.1.2. Sitting drop method ..........................................................................................49
5.2. Crystal visualisation.......................................................................................................50 5.3. Cryofreezing of protein crystals ....................................................................................51
6. Structure solving by X‐ray crystallography.....................................................................52 6.1. Data collection ..............................................................................................................52 6.2. Data processing ............................................................................................................53
6.2.1. Indexing .............................................................................................................53 6.2.2. Scaling ...............................................................................................................55
6.3. Molecular replacement.................................................................................................56 6.4. Refinement and manual building..................................................................................56 6.5. Structure validation.......................................................................................................58
CHAPTER 3: RESULTS and DISCUSSION............................................................... 65 1. Analysis of nucleotide binding architecture ...................................................................67
1.1. Overall recognition patterns for protein nucleotide binding........................................67 1.2. Binding patterns for the RNase A superfamily..............................................................76
1.2.1. Other representative members .........................................................................84 1.2.2. Comparison of binding patterns with microbial RNase superfamily.................84
2. Protein purification .......................................................................................................87
2.1. Protein characterisation : gel electrophoresis ..............................................................87 2.2. Protein chromatographic purification ..........................................................................87
3. Protein crystallisation experiments ...............................................................................88
3.1. Crystallisation trials: screening and optimisation of conditions ...................................88 3.1.1. RNase A crystallisation conditions ....................................................................89 3.1.2. RNase 3/ECP crystallisation conditions .............................................................89 3.1.3. RNase 6 crystallisation conditions.....................................................................92 3.1.4. RNase 7 crystallisation conditions.....................................................................93
3.2. Data collection and structure solving ...........................................................................96
Index
iii
4. 3D structural analyses by X‐ray crystallography.............................................................97
4.1. Structural studies of RNase A........................................................................................97 4.1.1. Crystallisation, data collection, processing and structure solving ...................98
RNase A/H7H10 in complex with 3’‐CMP................................................................98 Native RNase A crystal crystal in complex with 3’‐CMP at atomic resolution ........99
4.1.2. Structural analysis of RNase A double mutant (RNase A ‐ K7H/R10H) in complex with 3’‐CMP...................................................................................101
Active site groove environment ............................................................................103 Structural changes at p2 subsite ............................................................................105 Structural changes at p1 subsite ............................................................................107 Changes at protein N‐terminus .............................................................................109
4.1.3. Structural analysis of the wild‐type RNase A – 3’‐CMP complex at atomic resolution ........................................................................................110
Active site environment.........................................................................................111 Interactions of sulphate and other ions ................................................................114 Nucleotide interactions .........................................................................................116 Analysis of structural details at atomic resolution ................................................119
4.2. Structural studies of ECP.............................................................................................120 4.2.1. Crystallisation, data collection, processing and structure solving ..................121
Crystallisation conditions.......................................................................................121 Data processing and structure solving ..................................................................121
4.2.2. Structural analysis of ECP/H15A and ECP/H128N crystal complexes .............123 Active site residues ................................................................................................123 Active site environment.........................................................................................126 Analysis of the mutation‐induced structural changes at the active site ...............127 Overall comparative analysis of mutant structures with the high resolution native ECP complexes ............................................................................................131
4.2.3. Native ECP crystals at high resolution.............................................................132 Visualisation of new features at high resolution...................................................133 Comparison of ligands bound between the two crystallisation forms .................135
4.3. Structural analysis of RNase 6.....................................................................................137 4.3.1. Crystallisation, crystal diffraction, data processing and structure solving .....137 4.3.2. Overall features ...............................................................................................139 4.3.3. Crystal packing ................................................................................................140 4.3.4. Active site ........................................................................................................142 4.3.5. Sulphate interaction sites................................................................................142 4.3.6. Prediction studies: interactions with mono‐ and dinucleotides ......................143
4.4. RNases’ sulphate interaction sites ..............................................................................147 4.4.1. Location and comparison of anion interaction sites in RNase A,
RNase 3/ECP and RNase 6...............................................................................147 GENERAL DISCUSSION .......................................................................................................153
CHAPTER 4: CONCLUSIONS ...............................................................................157 1. Architecture of nucleotide binding .............................................................................159 2. Structural study of RNase A superfamily members by X‐ray crystallography................159
2.1 Structural study of RNase A ........................................................................................159 2.1.1. Crystal structure of the RNase A/H7H10 double mutant
in complex with 3’‐CMP...................................................................................159
Index
iv
2.1.2. Atomic resolution crystal structure of RNase A – 3’‐CMP ...............................159 2.2 Structural study of RNase 3/ECP.................................................................................160
2.2.1. Study of active site in mutant crystal structures .............................................160 2.2.2. High‐resolution native RNase 3/ECP complex structures................................160
2.3 Structural study of RNase 6.........................................................................................160 2.4 Overall comparison of RNases’ sulphate interaction sites .........................................160
BIBLIOGRAPHY .......................................................................................................163
ANNEX ....................................................................................................................... I 1. Papers related to the PhD thesis.................................................................................... III
1.1. Nucleotide binding architecture for secreted cytotoxic endoribonucleases................ IV 1.2. Crystal structure of human RNase 6 in complex with sulphate ions .........................XLIII
2. Validation reports for all the crystal structures submitted to the Protein Data Bank
2.1. Structure of the RNase A double mutant (RNase A/H7H10) in complex with 3’‐CMP at 2.10 Å.......................................................................................................XLVIII
2.2. Structure of RNase A at high resolution in complex with 3‐CMP at 1.16 Å (PDB ID: 4U7R) .............................................................................................................LVI 2.3. Structure of ECP with sulphate anions at 1.50 Å (PDB ID: 4OXB) ..............................LXIV 2.4. Structure of ECP with citrate ions at 1.50 Å (PDB ID: 4OXF)....................................LXXIII 2.5. Structure of ECP/H15A mutant at 1.47 Å (PDB ID: 4OWZ) ....................................LXXXXI 2.6. Structure of ECP/H128N mutant with sulphate anions at 1.34 Å (PDB ID: 4X08) .LXXXIX 2.7. Structure of human RNase 6 in complex with sulphate anions at 1.72 Å (PDB ID: 4X09) ........................................................................................................ XCVIII
Abbreviation list
v
ABBREVIATION LIST ACN acetonitrile
ADE adenine
ADP atomic displacement parameter AMP antimicrobial peptide
Amp ampicillin
Ang angiogenin
ASU (crystal) asymmetric unit
BS‐RNase bovine seminal ribonuclease
C>p cytidine 2',3' cyclic phosphate
3’‐CMP, C3P cytidine 3’‐monophosphate
D‐Gal D‐galactose
(dC)6 2’‐deoxycytidine hexanucleotide
DHAP dihydroxyacetone phosphate
D‐Glc D‐glucose
D‐Man D‐mannose
DNA deoxyribonucleic acid
DSC differential scanning calorimetry
DTT dithiothreitol
d(UpA) 2’‐deoxyuridylyl‐3’,5’‐phospho‐2’‐deoxyadenosine
D‐Xyl D‐xylose
EAR, mEAR (mouse) eosinophil associated ribonuclease
ECP eosinophil cationic protein
EDN eosinophil derived neurotoxin
EPO eosinophil peroxidase
FPLC fast protein liquid chromatography
FTIR‐spectroscopy Fourier transform infrared spectroscopy
Glc‐N2S, Glc‐N6S 2’ / 6’‐sulpho‐N‐acetylglucosamine
GSH reduced glutathione
GSSG oxidised glutathione
GUN guanine
Hep‐4, Hep‐6 heparin tetra‐ / hexasaccharide
HEPES 4‐(2‐hydroxyethyl)‐1‐piperazineethanesulfonic acid
HES hypereosinophilic syndrome
IB inclusion bodies
IFN interferon
IPTG isopropyl β‐D‐1‐thiogalactopyranoside
kbp kilobase pair
LB Luria‐Bertani broth
L‐Fuc L‐fucose
LPS lipopolysaccharide
LTA lipoteichoic acid
LUV large unilamellar vesicle
MALDI‐TOF matrix‐assisted laser desorption/ionisation time‐of‐flight
MBP major basic protein
MES 2‐(N‐morpholino)ethanesulfonic acid
MOPS 3‐(N‐morpholino)propanesulfonic acid
MPD 3‐methyl‐2,4‐pentanediol
MR molecular replacement
NAG N‐acetylglucosamine
NAM N‐acetylmuramic (acid)
NMR nuclear magnetic resonance
OD600 optical density at 600 nm
Abbreviation list
vi
ORF open reading frame
PAGE polyacrylamide gel electrophoresis
PEGn polyethylene glycol (of average molar mass n)
PGN peptidoglycan
PGRP peptidoglycan recognition protein
pI isoelectric point
poly (A) polyadenilic acid
poly (C) polycytidylic acid
poly (U) polyuridylic acid
RI, hRI, rRI (human/recombinant) ribonuclease inhibitor rmsd root‐mean‐square deviation
RNase ribonuclease
ptRNase pancreatic type ribonuclease
SBL sialic binding protein
SDS sodium dodecylsulphate
TA teichoic acid
TB terrific broth
TEMED N, N, N', N'‐tetramethylethylenediamine
TFG transforming growth factor
TLS (refinement) translation, libration and screw‐motion
Tm denaturation midpoint
TNF tumour necrosis factor
TRIS tris(hydroxymethyl)aminomethane
U>p uridine 2',3' cyclic phosphate
URA uracil
XRD X‐ray diffraction
Summary
vii
SUMMARY This thesis is focused on the structural and functional analysis of antimicrobial ribonucleases. An analysis of nucleotide‐type ligand interaction sites has been carried out using RNase A as a reference protein. With this aim, RNase complexes were analysed by both statistical structural analysis and X‐ray crystallography. Together with the catalytic triad, other secondary interaction subsites were also defined at the surface of the protein, globally designated as p1‐pn. The bovine pancreatic ribonuclease or RNase A superfamily embraces a family of ribonucleases whose various functions are not necessarily related to RNase activity. RNase family members with antimicrobial properties are characterised by a high isoelectric point value due to the large amount of surface cationic residues. The most studied antimicrobial RNase is RNase 3, secreted by eosinophils, also named eosinophil cationic protein (ECP). Its high cationicity explains many of its diverse biological properties. The high number of cationic residues of antimicrobial RNases, arginines and/or lysines, explains not only their high affinity to membrane components, but also their stability and cytotoxicity. However, a noticeably lower RNase activity is seen for cationic RNases owing to the lack of key residues important for catalysis and correct substrate alignment.
Initially, the different nucleotide‐type substrate binding and recognition patterns were analysed in order to better characterise the secreted cytotoxic endoribonucleases. These patterns were deduced from general structural complex statistic reports taken from the Protein Data Bank database and compared to the particular traits of selected families of representative endoribonucleases (RNase A and RNase T1). A large amount of mono‐ and dinucleotide protein complexes was analysed. The results provided a general model of protein‐nucleotide interactions. Preferred amino acids and atoms frequently involved in the recognition interactions were identified, thus defining the three‐dimensional motifs for phosphate, ribose and nitrogenated base within the RNase A superfamily. Together with the conserved catalytic triad at the main active site, residue variability is commonly observed throughout the secondary binding subsites, in agreement with the RNase preferential binding patterns, the different alignment capability, substrate specificity and variable catalytic efficiency. Results were complemented with molecular modelling predictions and evolutive comparisons by sequence alignment and structural overlapping. A final side‐by‐side comparison with the microbial RNase T1 superfamily has allowed an analysis of the common and particular features of substrate recognition processes, thereby building a general interaction architecture applicable to recognition for polyanionic biomolecules like nucleotide‐type polymers or heterosaccharides, which can set a structural basis for the design of new drugs.
Finally, structural studies by X‐ray crystallography were carried out. Recombinant wild‐type RNases and mutant variants were expressed and purified in a high‐yield prokaryotic system. Structures of RNase A, RNase 3 and RNase 6 were solved. Crystallisation conditions were also investigated for RNase 7 without any successful screening hit. Notwithstanding, a crystallisation condition has been discovered for human RNase 6 (RNase k6) and the first crystal structure was solved, thus setting the basis for further analysis of interactions with nucleotide molecules and other putative
Summary
viii
ligands. Also, an RNase A mutant (RNase A/H7H10), where the secondary phosphate binding site p2 has been converted into a second active site, was crystallised. The RNase A/H7H10 – 3’‐CMP complex enabled the visualisation of induced conformational changes at the neighbouring environment. A second RNase A – 3’‐CMP complex, obtained at atomic resolution (1.16 Å) has enabled a more detailed analysis with respect to previously reported lower‐resolution protein‐nucleotide complexes together with a side‐by‐side study of subsite environments with the RNase A/H7H10–3’‐CMP complex, explaining the mutant catalytic properties. The atomic resolution also enabled the visualisation of the protonation state of residues that play a key role in catalysis. Following, the two RNase 3/ECP active site mutants (ECP/H15A, ECP/H128N) crystals were crystallised. The overall 3D structures and local conformational changes were compared with the wild‐type protein. Structural studies confirmed the previous kinetic experiments and ensured that the His15Ala mutant was a useful model for functional studies of the catalytically inactive enzyme. Also, two native ECP crystals at higher resolution than previously reported studies were used for a comparison of the different unit cell packing, residue side chain variability and anion recognition sites. Finally, the structures of RNase A, RNase 3/ECP and RNase 6 with bound sulphate anions were compared on their interactions with sulphate ions, analogue to nucleotide phosphate groups. The identification of the different substrate recognition subsites in the three enzymes confirmed the higher affinity of ECP due to the many cationic arginine residues, which may lead to the extensive identification of protein regions prone to host nucleotides or heterosaccharide derivatives.
Summary
ix
RESUMEN La presente tesis abarca el estudio estructural y funcional de ribonucleasas antimicrobianas. Se ha procedido al análisis de los centros de interacción con ligandos de tipo nucleótido, tomando la RNasa A como proteína de referencia, a partir de complejos de RNasas, mediante un análisis estructural estadístico y cristalografía de rayos X. La superfamilia de la ribonucleasa pancreática bovina o RNasa A comprende una serie de RNasas cuyas funciones no se relacionan necesariamente con la propia actividad RNasa. Junto con la triada catalítica, se han definido otros subcentros secundarios de interacción en la superficie de la proteína, designados globalmente como p1‐pn. Los miembros de la familia con propiedades antimicrobianas se caracterizan por un elevado punto isoeléctrico debido al elevado número de residuos catiónicos. La RNasa antimicrobiana más estudiada (RNasa 3) es segregada por eosinófilos, de ahí su nombre alternativo de proteína catiónica de eosinófilos o ECP. Su alta cationicidad permite también explicar muchas de sus diversas propiedades biológicas. El gran número de residuos catiónicos en las RNasas antimicrobianas, argininas y/o lisinas, justifica no sólo su alta afinidad por componentes de membrana, sino también su estabilidad y citotoxicidad. No obstante, se ha observado una actividad RNasa notablemente baja en las RNasas catiónicas como consecuencia de la ausencia de residuos clave en catálisis o alineamiento del sustrato. Inicialmente, para una mejor caracterización de las endorribonucleasas citotóxicas de secreción, se han analizado los patrones de reconocimiento y unión de sustratos de tipo nucleótido, deducidos a partir de estadísticas generales de complejos estructurales tomados del Protein Data Bank y comparados con los rasgos particulares de familias seleccionadas de endorribonucleasas representativas (RNasa A y RNasa T1). Se han analizado una gran cantidad de complejos de proteínas con mono‐ y dinucleótidos. Los resultados describen modelos generales de interacción proteína‐nucleótido, aminoácidos preferenciales y átomos mayormente involucrados en el reconocimiento y definición de los motivos tridimensionales para los grupos fosfato, ribosa y bases nitrogenadas dentro de la superfamilia de la RNasa A. Junto con la triada catalítica, conservada en el centro activo principal, se observa gran variabilidad en los centros de unión secundarios en función de los patrones preferenciales de unión de las RNasas y, por extensión, la especificidad de sustrato y eficiencia catalítica. Los resultados se complementan con predicciones de modelado molecular (docking) y comparaciones evolutivas mediante alineamiento de secuencia y solapamiento estructural. Una última comparación con la familia de RNasas microbianas (RNasa T1) ha permitido ver los rasgos comunes y concretos del reconocimiento de sustratos en esta superfamilia, elaborándose una arquitectura general de interacciones aplicable a terapias de reconocimiento de biomoléculas polianiónicas como polímeros de tipo nucleótido o heterosacáridos, sentándose las bases para el diseño de nuevos fármacos.
Por último, se han llevado a cabo estudios de cristalografía de rayos X con distintas RNasas recombinantes de tipo nativo, así como variantes mutantes, expresadas en un sistema procariota de alto rendimiento. Se han resuelto las estructuras de las RNasa A, la RNasa 3/ECP y la RNasa 6. Para la RNasa 7 se ha llevado a cabo un estudio de distintas condiciones de cristalización, sin obtener ningún resultado satisfactorio. No
Summary
x
obstante, se ha descubierto una condición de cristalización nueva para la ribonucleasa 6 humana (RNasa k6). La resolución de la primera estructura del enzima sienta las bases para posteriores análisis de interacciones entre la proteína con moléculas de tipo nucleótido y sustratos relacionados. Se ha cristalizado igualmente un mutante de RNasa A (RNasa A/H7H10) en el que el centro secundario de unión de fosfatos p2 se ha convertido en un segundo centro activo. El complejo RNasa A/H7H10 – 3’‐CMP ha permitido la identificación de cambios en las regiones cercanas. Con un segundo complejo de RNasa A con 3’‐CMP, obtenido a alta resolución (1,16 Å) se ha realizado un análisis más detallado en comparación con complejos de proteína‐nucleótido descritos a menor resolución junto con un estudio en paralelo de cada subcentro en comparación con el complejo RNasa A/H7H10–3’‐CMP, permitiendo explicar las propiedades catalíticas del mutante. La resolución a nivel atómico ha permitido además observar el estado de protonación de los residuos involucrados en la catálisis. A continuación se cristalizaron dos mutantes de la RNasa 3/ECP (ECP/H15A, H128N). Las comparaciones de sus estructuras tridimensionales globales con la de la proteína nativa, así como de los cambios conformacionales globales, han confirmado los estudios cinéticos previos y corroboran que el mutante His15Ala es un modelo óptimo para la realización de estudios funcionales con la variante catalíticamente inactiva. Adicionalmente, dos cristales de ECP nativa, resueltos a mayor resolución que en estudios previos, se utilizaron para la comparación estructural basada en el empaquetamiento de las dos formas cristalógraficas, la variabilidad de las cadenas laterales o los centros de reconocimiento de aniones. Finalmente, se ha realizado una comparación de las estructuras de la RNasa A, RNasa 3/ECP y RNasa 6 con iones sulfato a nivel de centros de reconocimiento de este anión, análogo a los grupos fosfato de nucleótidos, en estas estructuras, lo cual ha permitido confirmar la mayor afinidad de la ECP debido principalmente a la mayor cantidad de residuos catiónicos de tipo arginina, y la identificación, por otro lado, de regiones potenciales de reconocimiento de nucleótidos o derivados heterosacáridos.

CHAPTER 1 INTRODUCTION

Introduction
3
1. Ribonucleases
Ribonucleases (RNases) are a group of enzymes that catalyse the degradation of ribonucleic acids (RNA). They participate in the hydrolytic cleavage of nucleotide phosphodiester linkages, the degradation being both unspecific and including various ways of RNA processing. They are widely found in nearly all animal and plant kingdoms tissues as well as microorganisms.
2. Types and functions of ribonucleases
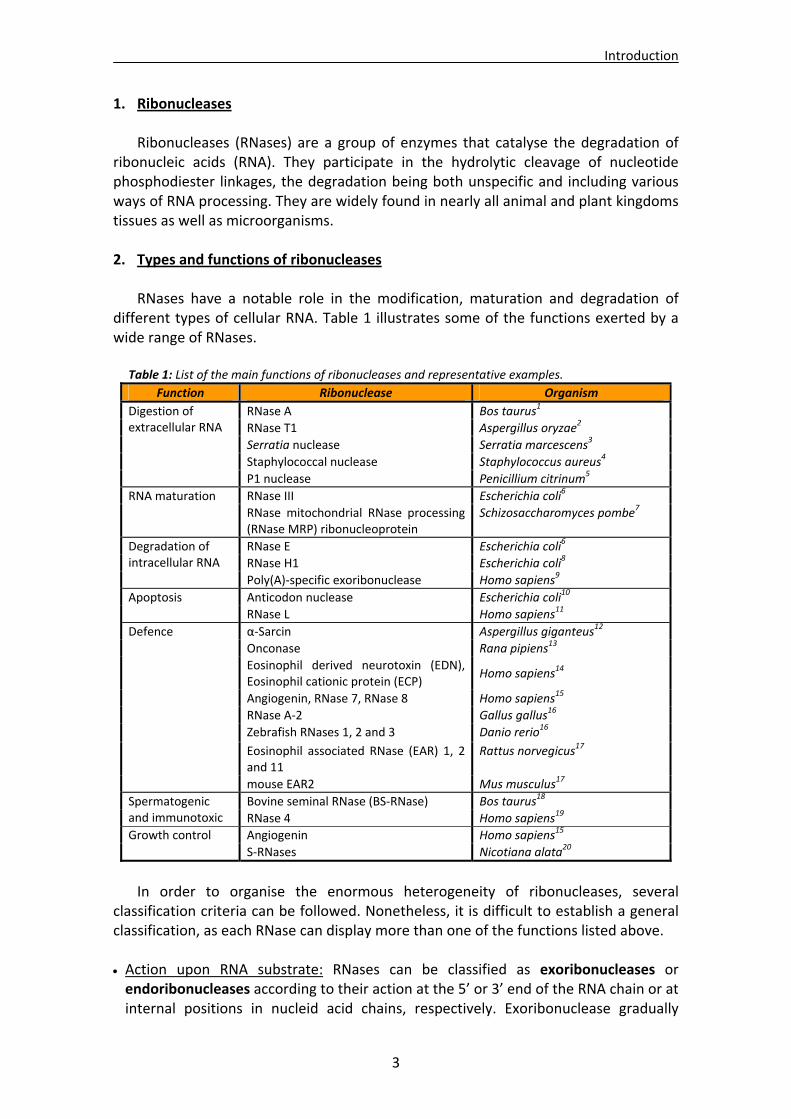
RNases have a notable role in the modification, maturation and degradation of different types of cellular RNA. Table 1 illustrates some of the functions exerted by a wide range of RNases.
Table 1: List of the main functions of ribonucleases and representative examples.
Function Ribonuclease Organism
RNase A Bos taurus1
RNase T1 Aspergillus oryzae2
Serratia nuclease Serratia marcescens3
Staphylococcal nuclease Staphylococcus aureus4
Digestion of extracellular RNA
P1 nuclease Penicillium citrinum5
RNase III Escherichia coli6 RNA maturation
RNase mitochondrial RNase processing (RNase MRP) ribonucleoprotein
Schizosaccharomyces pombe7
RNase E Escherichia coli6
RNase H1 Escherichia coli8
Degradation of intracellular RNA
Poly(A)‐specific exoribonuclease Homo sapiens9
Anticodon nuclease Escherichia coli10 Apoptosis
RNase L Homo sapiens11
α‐Sarcin Aspergillus giganteus12
Onconase Rana pipiens13
Eosinophil derived neurotoxin (EDN), Eosinophil cationic protein (ECP)
Homo sapiens14
Angiogenin, RNase 7, RNase 8 Homo sapiens15
RNase A‐2 Gallus gallus16
Zebrafish RNases 1, 2 and 3 Danio rerio16
Eosinophil associated RNase (EAR) 1, 2 and 11
Rattus norvegicus17
Defence
mouse EAR2 Mus musculus17
Bovine seminal RNase (BS‐RNase) Bos taurus18 Spermatogenic and immunotoxic RNase 4 Homo sapiens19
Angiogenin Homo sapiens15 Growth control
S‐RNases Nicotiana alata20
In order to organise the enormous heterogeneity of ribonucleases, several
classification criteria can be followed. Nonetheless, it is difficult to establish a general classification, as each RNase can display more than one of the functions listed above.
Action upon RNA substrate: RNases can be classified as exoribonucleases or endoribonucleases according to their action at the 5’ or 3’ end of the RNA chain or at internal positions in nucleid acid chains, respectively. Exoribonuclease gradually
Introduction
4
release mononucleotides as reaction products. Exoribonucleases can initiate their attack at either the 3‘ or 5’ terminus of an RNA chain. All the identified bacterial exoribonucleases hydrolyse RNA in the 3‘ to 5‘ direction, releasing 5’‐mononucleotides21. For endonucleases (RNase III, RNase A, RNase T1), the chain is cleaved inside the chain to yield oligonucleotides.
Location: Depending on where the RNA cleavage takes place, RNases can be extracellular or intracellular. Extracellular ribonucleases perform their activity outside the cells where they have been produced. Some reference examples of these secretion proteins are pancreatic or microbial RNases, which includes bacterial and fungal RNases22. In contrast, intracellular ribonucleases perform their role inside the cell and are normally involved in maturation, modification, processing and RNA degradation (mRNA, rRNA, tRNA). They feature a high structural diversity and are, unlike extracellular ribonucleases, highly specific.
Substrate specificity: Nonspecific RNases catalyse all kind of RNA molecules, like S. marcescens nuclease (see Table 1). Other examples show, however, base specificity such as pyrimidine‐specific RNase A. On the other hand, specific RNases recognise certain structure or sequence features and are usually involved in RNA maturation processes, like RNase III23.
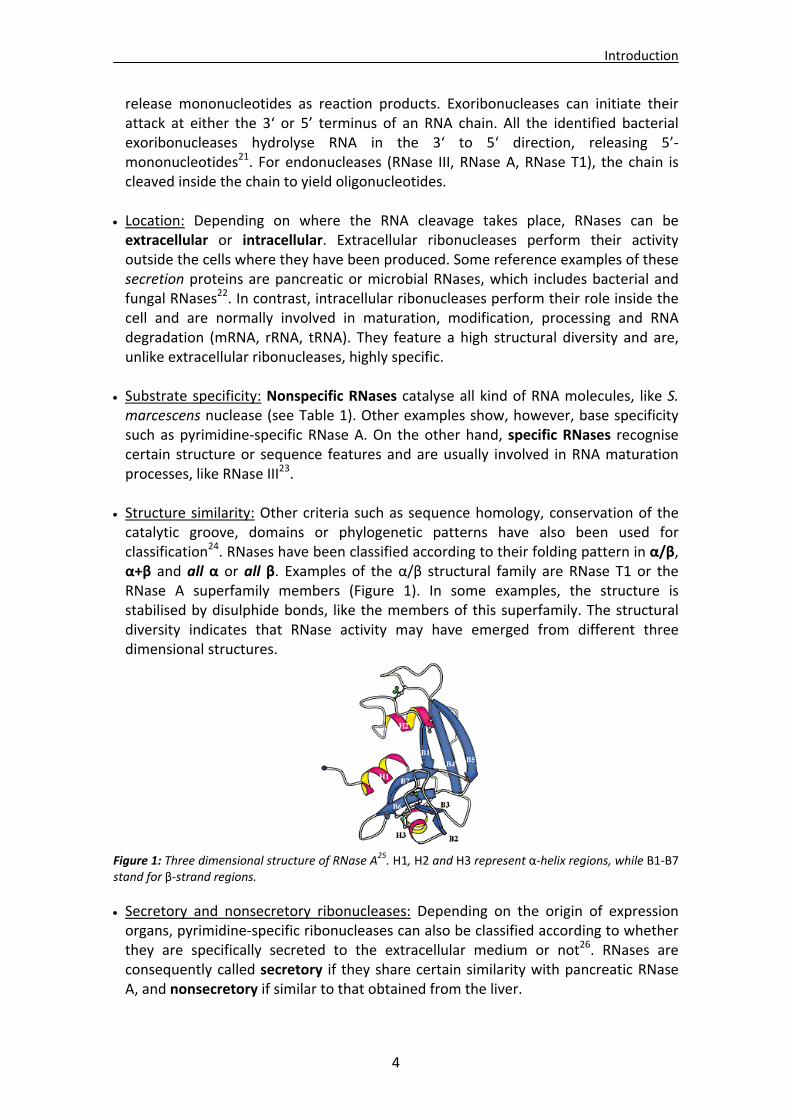
Structure similarity: Other criteria such as sequence homology, conservation of the catalytic groove, domains or phylogenetic patterns have also been used for classification24. RNases have been classified according to their folding pattern in α/β, α+β and all α or all β. Examples of the α/β structural family are RNase T1 or the RNase A superfamily members (Figure 1). In some examples, the structure is stabilised by disulphide bonds, like the members of this superfamily. The structural diversity indicates that RNase activity may have emerged from different three dimensional structures.
Figure 1: Three dimensional structure of RNase A25. H1, H2 and H3 represent α‐helix regions, while B1‐B7 stand for β‐strand regions.
Secretory and nonsecretory ribonucleases: Depending on the origin of expression organs, pyrimidine‐specific ribonucleases can also be classified according to whether they are specifically secreted to the extracellular medium or not26. RNases are consequently called secretory if they share certain similarity with pancreatic RNase A, and nonsecretory if similar to that obtained from the liver.
Introduction
5
Another nomenclature has also been suggested, i. e., pancreatic and nonpancreatic RNases27. Pancreatic RNases show a substrate preference of poly(C)>RNA>poly(U). Bovine pancreatic RNase A is the most studied example of this group (see Section 3.1). They achieve highest activity values at a pH value of 8 and are inhibited by Zn2+ and Cu2+. They cleave 2’‐3’ cyclic phosphate (C>p) and can also act on double‐stranded RNA according to the net charge and glycosylation grade of the protein. They are found in the pancreas, kidneys, the seminal vesicle and nonsecretory organs such as brain or heart and fluids like milk, semen, saliva, urine or serum. In contrast, nonpancreatic ribonucleases are intracellular enzymes that show a substrate preference for RNA>poly(U)>poly(C). Their highest activity is achieved at neutral pH values, they are not inhibited by divalent ions and degrade dinucleotides very slowly. Unlike pancreatic RNases, no significant hydrolysis on U>p, C>p or double‐stranded RNA has been observed for them. They have been identified in the liver, the kidney, the spleen, the stomach, the placenta, the lungs, leukocytes ands fluids like serum or urine.
3. Pyrimidine‐specific ribonuclease superfamily
The so‐called pyrimidine‐specific RNase superfamily consists of a group of secretory and nonsecretory ribonucleases that show a conserved overall structural homology28 and similar catalytic efficiency. All its members have been identified and isolated from vertebrates. The three dimensional structure is conformed by antiparallel β‐sheet chains flanked by α‐helices and stabilised by three to four disulphide bonds. Though initially suggested to display exclusively digestive properties, many members have evolved showing other important nondigestive functions29. Phylogeny studies suggest a common ancestor, from which all the actual ribonucleases would have evolved30. BS‐RNase A, onconase and cSBL are some examples of this family and its functional diversity.
3.1. The superfamily of ribonuclease A
Bovine pancreatic ribonuclease A (RNase A, EC 3.1.27.5) is a pyrimidine‐specific endonuclease that catalyses the breakdown of single‐stranded RNA by cleaving 3’,5’‐phosphodiester linkages. The letter A refers to the predominant non‐glycosylated form of the enzyme in the pancreas of Bos taurus1. It is probably the most representative group of all pyrimidine‐specific ribonuclease superfamilies. Enzyme reports date back to 1889, when Salkowsky observed ferments hydrolysing yeast RNA. In 1920, Jones described the existence of a thermostable enzyme in the pancreas acting on RNA, named ribonuclease some years later by Dubos and Thomson (1938). Thanks to its easy availability from the pancreas, easy purification and chemical properties such as stability and small molecular size, it is perhaps the best characterised of all known mammalian enzyme proteins. It has been the subject of many enzymology studies for decades1, 31 and represents nowadays an ideal model to understand the endoribonuclease catalytic mechanism, which was already proposed in 1961 even prior to the knowledge of the protein three dimensional structure32.
Introduction
6
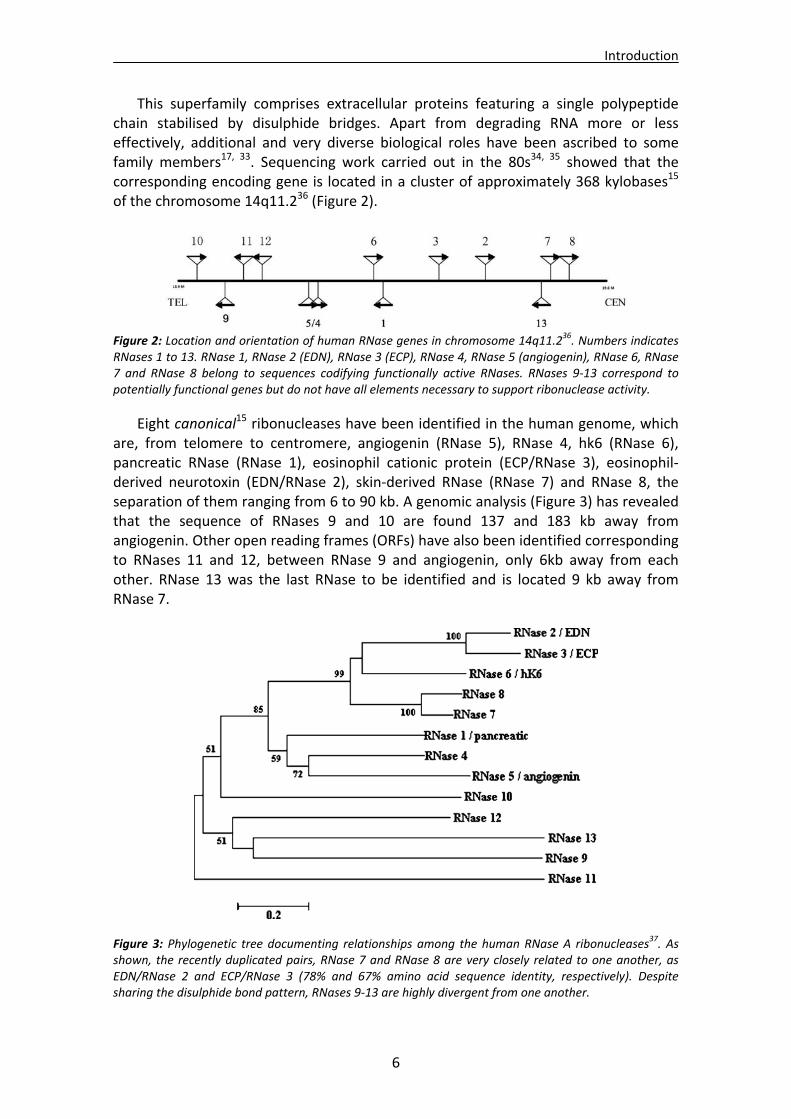
This superfamily comprises extracellular proteins featuring a single polypeptide chain stabilised by disulphide bridges. Apart from degrading RNA more or less effectively, additional and very diverse biological roles have been ascribed to some family members17, 33. Sequencing work carried out in the 80s34, 35 showed that the corresponding encoding gene is located in a cluster of approximately 368 kylobases15 of the chromosome 14q11.236 (Figure 2).
Figure 2: Location and orientation of human RNase genes in chromosome 14q11.236. Numbers indicates RNases 1 to 13. RNase 1, RNase 2 (EDN), RNase 3 (ECP), RNase 4, RNase 5 (angiogenin), RNase 6, RNase 7 and RNase 8 belong to sequences codifying functionally active RNases. RNases 9‐13 correspond to potentially functional genes but do not have all elements necessary to support ribonuclease activity.
Eight canonical15 ribonucleases have been identified in the human genome, which are, from telomere to centromere, angiogenin (RNase 5), RNase 4, hk6 (RNase 6), pancreatic RNase (RNase 1), eosinophil cationic protein (ECP/RNase 3), eosinophil‐derived neurotoxin (EDN/RNase 2), skin‐derived RNase (RNase 7) and RNase 8, the separation of them ranging from 6 to 90 kb. A genomic analysis (Figure 3) has revealed that the sequence of RNases 9 and 10 are found 137 and 183 kb away from angiogenin. Other open reading frames (ORFs) have also been identified corresponding to RNases 11 and 12, between RNase 9 and angiogenin, only 6kb away from each other. RNase 13 was the last RNase to be identified and is located 9 kb away from RNase 7.
Figure 3: Phylogenetic tree documenting relationships among the human RNase A ribonucleases37. As shown, the recently duplicated pairs, RNase 7 and RNase 8 are very closely related to one another, as EDN/RNase 2 and ECP/RNase 3 (78% and 67% amino acid sequence identity, respectively). Despite sharing the disulphide bond pattern, RNases 9‐13 are highly divergent from one another.
Introduction
7
3.1.1. Ribonucleases 1 to 8 Human canonical ribonucleases belonging to the RNase A superfamily codify for
polypeptides with a mass of 15 kDa approximately. All of them feature some common elements, which are: ‐ Existence of a signal peptide (20‐28 residues long), typical for secretory proteins38. ‐ A kidney‐shaped tertiary fold15. ‐ Presence of a motif CKXXNTF including a lysine which, along with two histidines, configures the catalytic triad. Catalytic histidine residues are also located in respectively conserved consensus patterns (FXXQH and PVHXD)15.
‐ Eight cysteines forming four disulphide bonds in folded, secreted structures. Exceptionally, angiogenin has only three disulphide bonds, lacking two cysteine residues. RNases 9‐13 keep this disulphide bond pattern but lack other specific elements required to support ribonuclease activity. Reports suggest that they might be involved in male reproductive functions15.
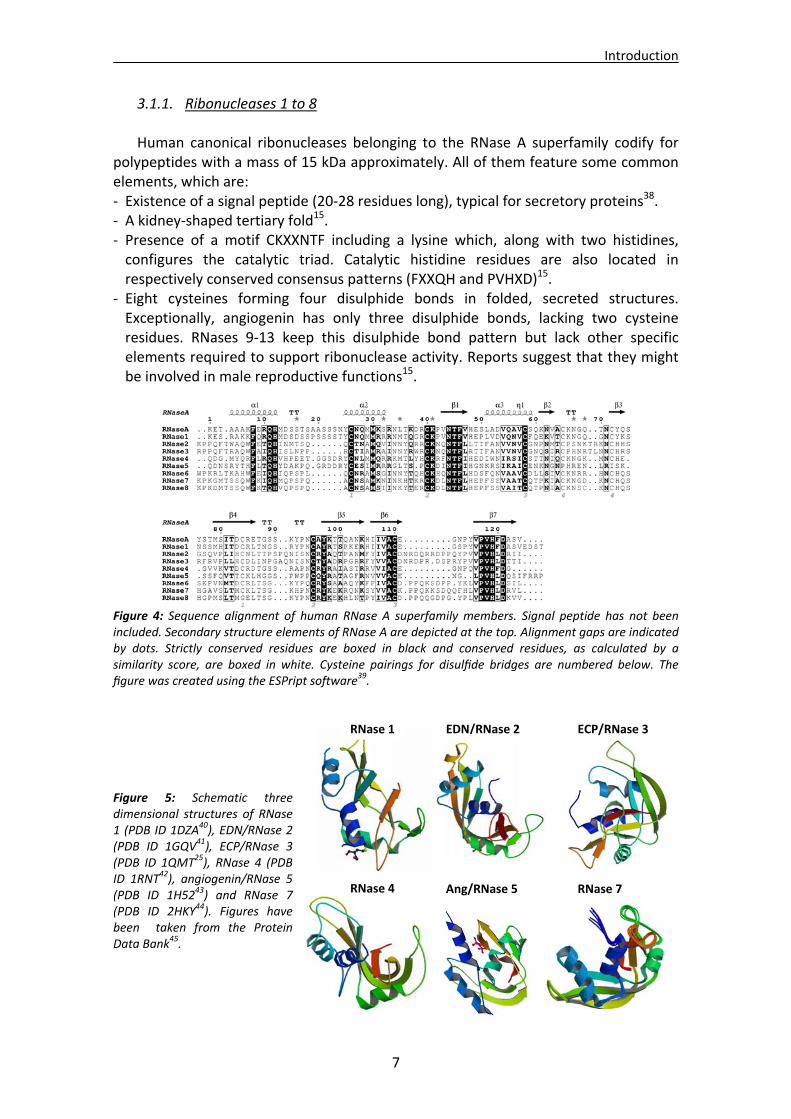
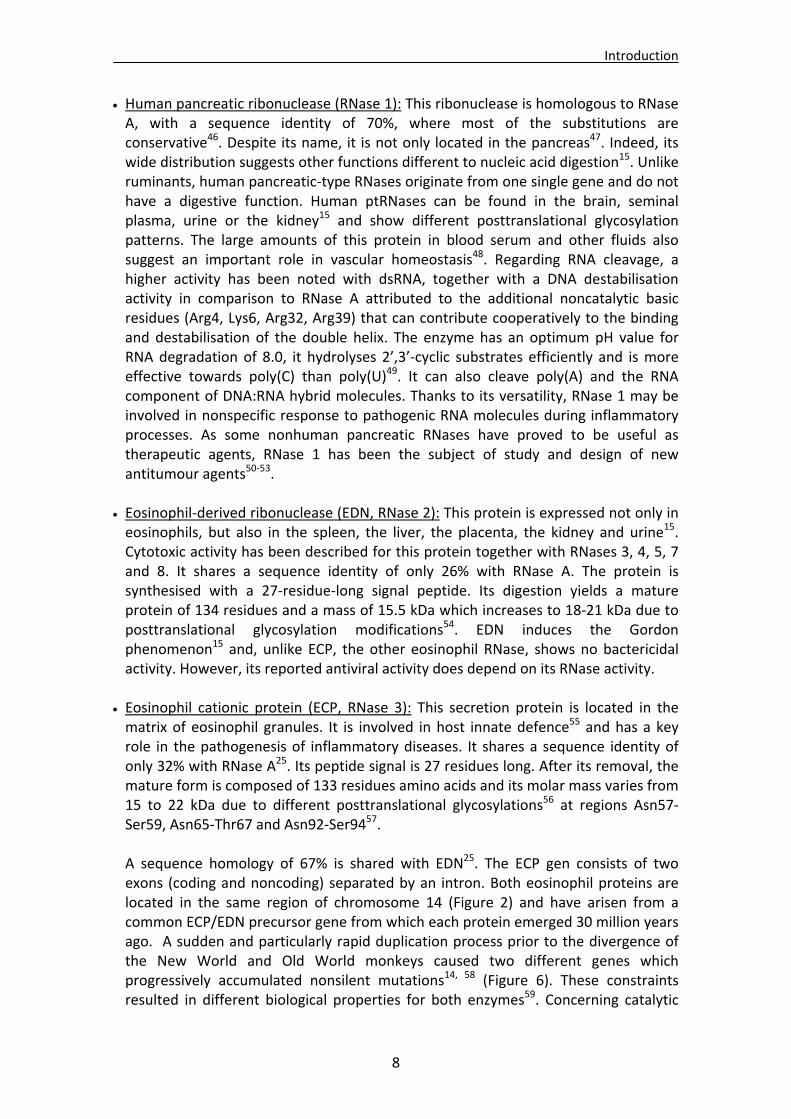
Figure 4: Sequence alignment of human RNase A superfamily members. Signal peptide has not been included. Secondary structure elements of RNase A are depicted at the top. Alignment gaps are indicated by dots. Strictly conserved residues are boxed in black and conserved residues, as calculated by a similarity score, are boxed in white. Cysteine pairings for disulfide bridges are numbered below. The figure was created using the ESPript software39.
Figure 5: Schematic three dimensional structures of RNase 1 (PDB ID 1DZA
40), EDN/RNase 2 (PDB ID 1GQV41), ECP/RNase 3 (PDB ID 1QMT25), RNase 4 (PDB ID 1RNT42), angiogenin/RNase 5 (PDB ID 1H5243) and RNase 7 (PDB ID 2HKY44). Figures have been taken from the Protein Data Bank45.
Ang/RNase 5 RNase 7 RNase 4
RNase 1 EDN/RNase 2 ECP/RNase 3
Introduction
8
Human pancreatic ribonuclease (RNase 1): This ribonuclease is homologous to RNase A, with a sequence identity of 70%, where most of the substitutions are conservative46. Despite its name, it is not only located in the pancreas47. Indeed, its wide distribution suggests other functions different to nucleic acid digestion15. Unlike ruminants, human pancreatic‐type RNases originate from one single gene and do not have a digestive function. Human ptRNases can be found in the brain, seminal plasma, urine or the kidney15 and show different posttranslational glycosylation patterns. The large amounts of this protein in blood serum and other fluids also suggest an important role in vascular homeostasis48. Regarding RNA cleavage, a higher activity has been noted with dsRNA, together with a DNA destabilisation activity in comparison to RNase A attributed to the additional noncatalytic basic residues (Arg4, Lys6, Arg32, Arg39) that can contribute cooperatively to the binding and destabilisation of the double helix. The enzyme has an optimum pH value for RNA degradation of 8.0, it hydrolyses 2’,3’‐cyclic substrates efficiently and is more effective towards poly(C) than poly(U)49. It can also cleave poly(A) and the RNA component of DNA:RNA hybrid molecules. Thanks to its versatility, RNase 1 may be involved in nonspecific response to pathogenic RNA molecules during inflammatory processes. As some nonhuman pancreatic RNases have proved to be useful as therapeutic agents, RNase 1 has been the subject of study and design of new antitumour agents50‐53.
Eosinophil‐derived ribonuclease (EDN, RNase 2): This protein is expressed not only in eosinophils, but also in the spleen, the liver, the placenta, the kidney and urine15. Cytotoxic activity has been described for this protein together with RNases 3, 4, 5, 7 and 8. It shares a sequence identity of only 26% with RNase A. The protein is synthesised with a 27‐residue‐long signal peptide. Its digestion yields a mature protein of 134 residues and a mass of 15.5 kDa which increases to 18‐21 kDa due to posttranslational glycosylation modifications54. EDN induces the Gordon phenomenon15 and, unlike ECP, the other eosinophil RNase, shows no bactericidal activity. However, its reported antiviral activity does depend on its RNase activity.
Eosinophil cationic protein (ECP, RNase 3): This secretion protein is located in the matrix of eosinophil granules. It is involved in host innate defence55 and has a key role in the pathogenesis of inflammatory diseases. It shares a sequence identity of only 32% with RNase A25. Its peptide signal is 27 residues long. After its removal, the mature form is composed of 133 residues amino acids and its molar mass varies from 15 to 22 kDa due to different posttranslational glycosylations56 at regions Asn57‐Ser59, Asn65‐Thr67 and Asn92‐Ser9457.
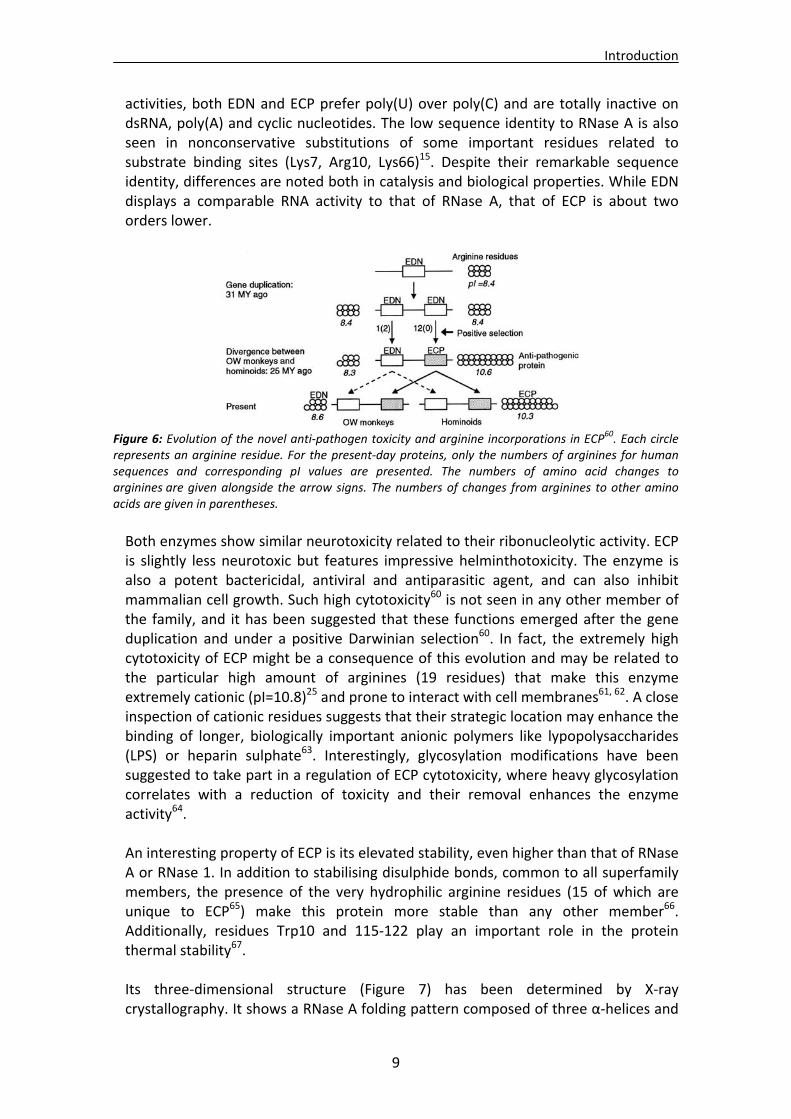
A sequence homology of 67% is shared with EDN25. The ECP gen consists of two exons (coding and noncoding) separated by an intron. Both eosinophil proteins are located in the same region of chromosome 14 (Figure 2) and have arisen from a common ECP/EDN precursor gene from which each protein emerged 30 million years ago. A sudden and particularly rapid duplication process prior to the divergence of the New World and Old World monkeys caused two different genes which progressively accumulated nonsilent mutations14, 58 (Figure 6). These constraints resulted in different biological properties for both enzymes59. Concerning catalytic
Introduction
9
activities, both EDN and ECP prefer poly(U) over poly(C) and are totally inactive on dsRNA, poly(A) and cyclic nucleotides. The low sequence identity to RNase A is also seen in nonconservative substitutions of some important residues related to substrate binding sites (Lys7, Arg10, Lys66)15. Despite their remarkable sequence identity, differences are noted both in catalysis and biological properties. While EDN displays a comparable RNA activity to that of RNase A, that of ECP is about two orders lower.
Figure 6: Evolution of the novel anti‐pathogen toxicity and arginine incorporations in ECP60. Each circle represents an arginine residue. For the present‐day proteins, only the numbers of arginines for human sequences and corresponding pI values are presented. The numbers of amino acid changes to arginines are given alongside the arrow signs. The numbers of changes from arginines to other amino acids are given in parentheses.
Both enzymes show similar neurotoxicity related to their ribonucleolytic activity. ECP is slightly less neurotoxic but features impressive helminthotoxicity. The enzyme is also a potent bactericidal, antiviral and antiparasitic agent, and can also inhibit mammalian cell growth. Such high cytotoxicity60 is not seen in any other member of the family, and it has been suggested that these functions emerged after the gene duplication and under a positive Darwinian selection60. In fact, the extremely high cytotoxicity of ECP might be a consequence of this evolution and may be related to the particular high amount of arginines (19 residues) that make this enzyme extremely cationic (pI=10.8)25 and prone to interact with cell membranes61, 62. A close inspection of cationic residues suggests that their strategic location may enhance the binding of longer, biologically important anionic polymers like lypopolysaccharides (LPS) or heparin sulphate63. Interestingly, glycosylation modifications have been suggested to take part in a regulation of ECP cytotoxicity, where heavy glycosylation correlates with a reduction of toxicity and their removal enhances the enzyme activity64. An interesting property of ECP is its elevated stability, even higher than that of RNase A or RNase 1. In addition to stabilising disulphide bonds, common to all superfamily members, the presence of the very hydrophilic arginine residues (15 of which are unique to ECP65) make this protein more stable than any other member66. Additionally, residues Trp10 and 115‐122 play an important role in the protein thermal stability67. Its three‐dimensional structure (Figure 7) has been determined by X‐ray crystallography. It shows a RNase A folding pattern composed of three α‐helices and
Introduction
10
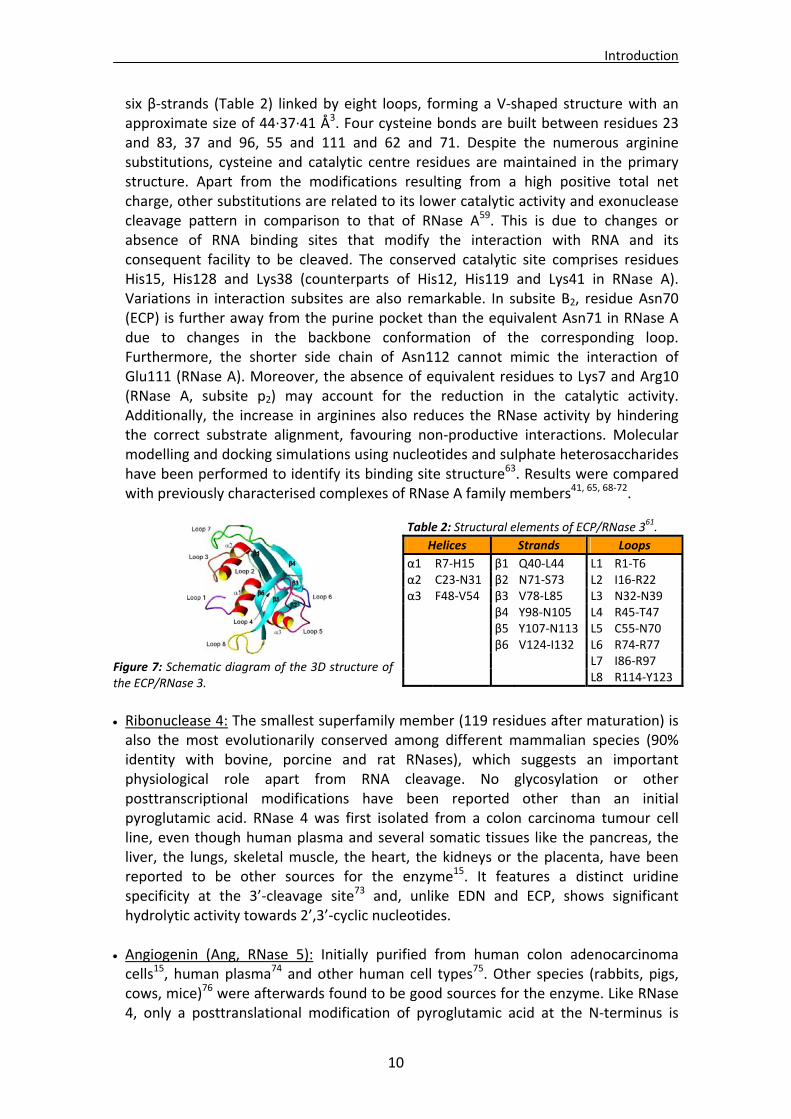
six β‐strands (Table 2) linked by eight loops, forming a V‐shaped structure with an approximate size of 44∙37∙41 Å3. Four cysteine bonds are built between residues 23 and 83, 37 and 96, 55 and 111 and 62 and 71. Despite the numerous arginine substitutions, cysteine and catalytic centre residues are maintained in the primary structure. Apart from the modifications resulting from a high positive total net charge, other substitutions are related to its lower catalytic activity and exonuclease cleavage pattern in comparison to that of RNase A59. This is due to changes or absence of RNA binding sites that modify the interaction with RNA and its consequent facility to be cleaved. The conserved catalytic site comprises residues His15, His128 and Lys38 (counterparts of His12, His119 and Lys41 in RNase A). Variations in interaction subsites are also remarkable. In subsite B2, residue Asn70 (ECP) is further away from the purine pocket than the equivalent Asn71 in RNase A due to changes in the backbone conformation of the corresponding loop. Furthermore, the shorter side chain of Asn112 cannot mimic the interaction of Glu111 (RNase A). Moreover, the absence of equivalent residues to Lys7 and Arg10 (RNase A, subsite p2) may account for the reduction in the catalytic activity. Additionally, the increase in arginines also reduces the RNase activity by hindering the correct substrate alignment, favouring non‐productive interactions. Molecular modelling and docking simulations using nucleotides and sulphate heterosaccharides have been performed to identify its binding site structure63. Results were compared with previously characterised complexes of RNase A family members41, 65, 68‐72.
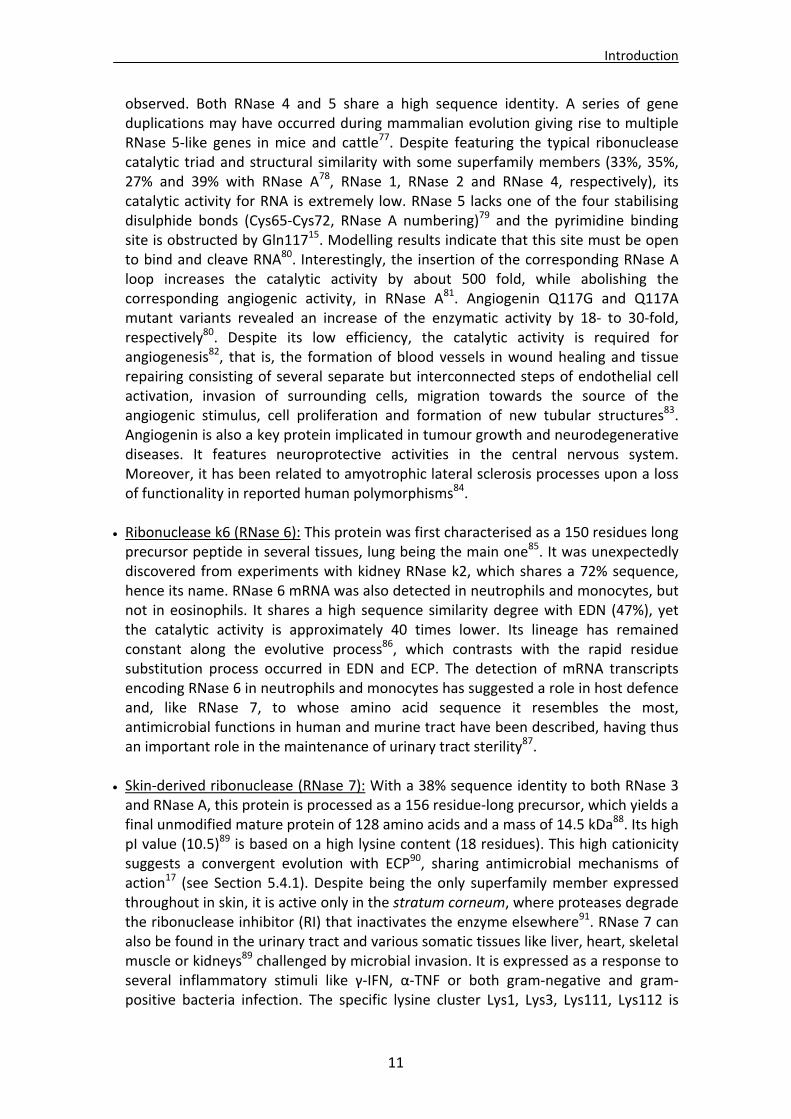
Figure 7: Schematic diagram of the 3D structure of the ECP/RNase 3.
Ribonuclease 4: The smallest superfamily member (119 residues after maturation) is also the most evolutionarily conserved among different mammalian species (90% identity with bovine, porcine and rat RNases), which suggests an important physiological role apart from RNA cleavage. No glycosylation or other posttranscriptional modifications have been reported other than an initial pyroglutamic acid. RNase 4 was first isolated from a colon carcinoma tumour cell line, even though human plasma and several somatic tissues like the pancreas, the liver, the lungs, skeletal muscle, the heart, the kidneys or the placenta, have been reported to be other sources for the enzyme15. It features a distinct uridine specificity at the 3’‐cleavage site73 and, unlike EDN and ECP, shows significant hydrolytic activity towards 2’,3’‐cyclic nucleotides.
Angiogenin (Ang, RNase 5): Initially purified from human colon adenocarcinoma cells15, human plasma74 and other human cell types75. Other species (rabbits, pigs, cows, mice)76 were afterwards found to be good sources for the enzyme. Like RNase 4, only a posttranslational modification of pyroglutamic acid at the N‐terminus is
Table 2: Structural elements of ECP/RNase 361.
Helices Strands Loops
α1 R7‐H15 β1 Q40‐L44 L1 R1‐T6 α2 C23‐N31 β2 N71‐S73 L2 I16‐R22 α3 F48‐V54 β3 V78‐L85 L3 N32‐N39 β4 Y98‐N105 L4 R45‐T47 β5 Y107‐N113 L5 C55‐N70 β6 V124‐I132 L6 R74‐R77 L7 I86‐R97 L8 R114‐Y123
Introduction
11
observed. Both RNase 4 and 5 share a high sequence identity. A series of gene duplications may have occurred during mammalian evolution giving rise to multiple RNase 5‐like genes in mice and cattle77. Despite featuring the typical ribonuclease catalytic triad and structural similarity with some superfamily members (33%, 35%, 27% and 39% with RNase A78, RNase 1, RNase 2 and RNase 4, respectively), its catalytic activity for RNA is extremely low. RNase 5 lacks one of the four stabilising disulphide bonds (Cys65‐Cys72, RNase A numbering)79 and the pyrimidine binding site is obstructed by Gln11715. Modelling results indicate that this site must be open to bind and cleave RNA80. Interestingly, the insertion of the corresponding RNase A loop increases the catalytic activity by about 500 fold, while abolishing the corresponding angiogenic activity, in RNase A81. Angiogenin Q117G and Q117A mutant variants revealed an increase of the enzymatic activity by 18‐ to 30‐fold, respectively80. Despite its low efficiency, the catalytic activity is required for angiogenesis82, that is, the formation of blood vessels in wound healing and tissue repairing consisting of several separate but interconnected steps of endothelial cell activation, invasion of surrounding cells, migration towards the source of the angiogenic stimulus, cell proliferation and formation of new tubular structures83. Angiogenin is also a key protein implicated in tumour growth and neurodegenerative diseases. It features neuroprotective activities in the central nervous system. Moreover, it has been related to amyotrophic lateral sclerosis processes upon a loss of functionality in reported human polymorphisms84.
Ribonuclease k6 (RNase 6): This protein was first characterised as a 150 residues long precursor peptide in several tissues, lung being the main one85. It was unexpectedly discovered from experiments with kidney RNase k2, which shares a 72% sequence, hence its name. RNase 6 mRNA was also detected in neutrophils and monocytes, but not in eosinophils. It shares a high sequence similarity degree with EDN (47%), yet the catalytic activity is approximately 40 times lower. Its lineage has remained constant along the evolutive process86, which contrasts with the rapid residue substitution process occurred in EDN and ECP. The detection of mRNA transcripts encoding RNase 6 in neutrophils and monocytes has suggested a role in host defence and, like RNase 7, to whose amino acid sequence it resembles the most, antimicrobial functions in human and murine tract have been described, having thus an important role in the maintenance of urinary tract sterility87.
Skin‐derived ribonuclease (RNase 7): With a 38% sequence identity to both RNase 3 and RNase A, this protein is processed as a 156 residue‐long precursor, which yields a final unmodified mature protein of 128 amino acids and a mass of 14.5 kDa88. Its high pI value (10.5)89 is based on a high lysine content (18 residues). This high cationicity suggests a convergent evolution with ECP90, sharing antimicrobial mechanisms of action17 (see Section 5.4.1). Despite being the only superfamily member expressed throughout in skin, it is active only in the stratum corneum, where proteases degrade the ribonuclease inhibitor (RI) that inactivates the enzyme elsewhere91. RNase 7 can also be found in the urinary tract and various somatic tissues like liver, heart, skeletal muscle or kidneys89 challenged by microbial invasion. It is expressed as a response to several inflammatory stimuli like γ‐IFN, α‐TNF or both gram‐negative and gram‐positive bacteria infection. The specific lysine cluster Lys1, Lys3, Lys111, Lys112 is
Introduction
12
crucial for cell membrane lysis44 based on electrostatic interactions, local destabilisation and pore formation. Studies on model membranes confirm the protein mechanism of action on lipid vesicles92. It is also one superfamily member with reported antifungal activity44.
Ribonuclease 8: It was first considered to be expressed uniquely in human placenta93, but recent studies also report the expression of the enzyme at lungs, spleen or testis tissues94. Phylogenetic analyses indicate that RNase 7 is its closest relative, sharing a sequence identity of 78% and a genomic distance of only 15 kbp. This suggests a relatively recent gene duplication process in primates. Its ribonucleolytic activity is among the lowest of the superfamily members and it exhibits broad‐spectrum microbicidal activity against potential pathogenic micro‐organisms95. Although no physiological functions has been identified this activity77, its killing activity was found to be specific for microorganisms and does not affect human cells. It may thus play a role in protecting the placenta from infection15 by killing any pathogens from the maternal circulation and thereby preserving a sterile environment for the foetus77.
4. Ribonuclease activity
4.1. Mechanism of catalysis in RNase A superfamily
There has been such an amount of work and investigation about this enzyme that it is nowadays one of the most important model systems in enzymology and protein chemistry. Recognition of landmark work on folding, stability and chemistry of RNase A in enzymology and molecular evolution culminated even with several Nobel Prize awards1. The enzymatic reaction mechanism was put forward in 1961 before its 3D structure was known and it represented the first one in which clear roles were assigned to functional groups within a protein31. RNase A catalyses the cleavage of the P‐O5’ bond of an RNA strand on the 3’‐side of a pyrimidine residue. This means that the base at the 3’‐side of the hydrolysed bond must be a pyrimidine (C>U), while the 5’ base can be either a pyrimidine or a purine, even though the latter is preferred.
Two renowned histidines residues are employed in this mechanism, namely His12
and His11996. Earlier works supported the role of both catalytic His residues, as deduced in the 60s by chemical modifications that resulted in the loss of most of the RNase activity97, 98. In addition, early X‐ray diffraction analyses indicated the presence of two histidine residues in catalysis98‐100. Later on, H12N and H119N variants of RNase A101, and also a variant of bovine seminal RNase A (BS‐RNase A/H119D)102, a covalent dimeric homologue of RNase A), revealed a loss of the catalytic and/or cytotoxic activities to tumour cells. Similar results were seen for EDN/H15A and EDN/H129A variants, where the His15Ala and His129Ala mutations eliminated the catalytic activity of the enzyme, as reported from yeast tRNA and poly(U) cleavage experiments103. Another work with RNase A/H119N104 indicated a significant decrease of the rate of transesterification reaction, yet with no significant effects on susbtrate affinity.
Introduction
13
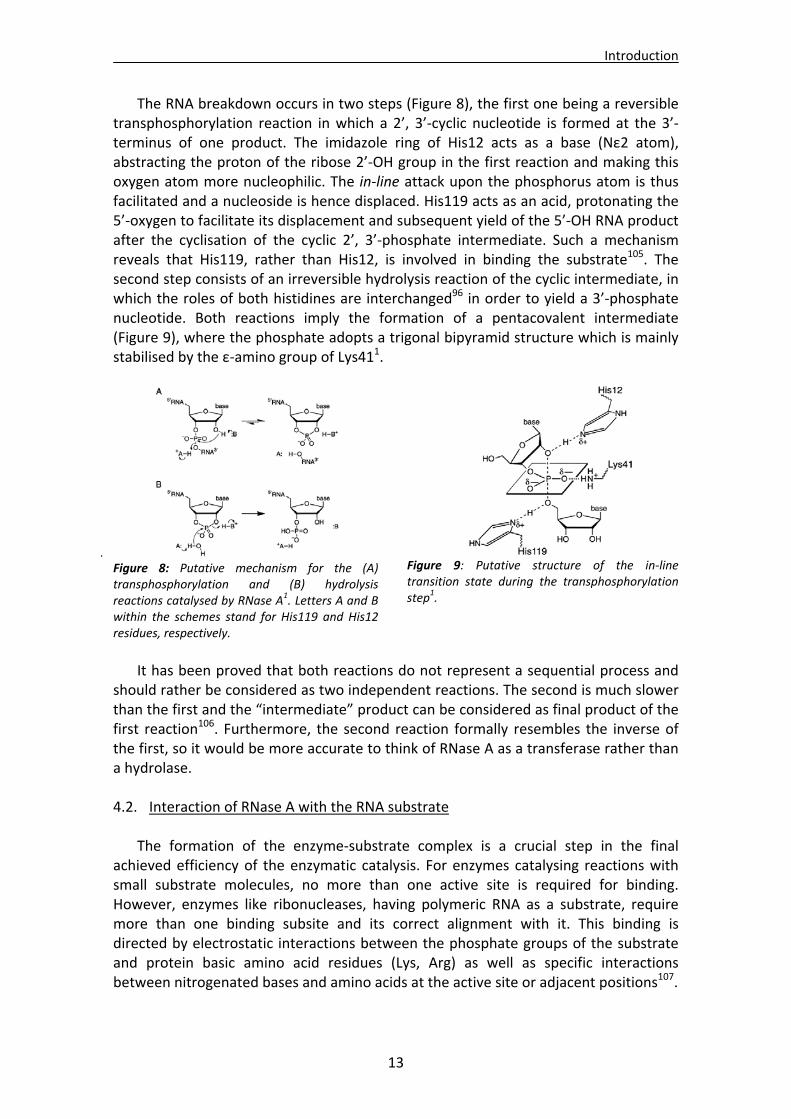
The RNA breakdown occurs in two steps (Figure 8), the first one being a reversible transphosphorylation reaction in which a 2’, 3’‐cyclic nucleotide is formed at the 3’‐terminus of one product. The imidazole ring of His12 acts as a base (Nε2 atom), abstracting the proton of the ribose 2’‐OH group in the first reaction and making this oxygen atom more nucleophilic. The in‐line attack upon the phosphorus atom is thus facilitated and a nucleoside is hence displaced. His119 acts as an acid, protonating the 5’‐oxygen to facilitate its displacement and subsequent yield of the 5’‐OH RNA product after the cyclisation of the cyclic 2’, 3’‐phosphate intermediate. Such a mechanism reveals that His119, rather than His12, is involved in binding the substrate105. The second step consists of an irreversible hydrolysis reaction of the cyclic intermediate, in which the roles of both histidines are interchanged96 in order to yield a 3’‐phosphate nucleotide. Both reactions imply the formation of a pentacovalent intermediate (Figure 9), where the phosphate adopts a trigonal bipyramid structure which is mainly stabilised by the ε‐amino group of Lys411.
Figure 8: Putative mechanism for the (A) transphosphorylation and (B) hydrolysis reactions catalysed by RNase A1. Letters A and B within the schemes stand for His119 and His12 residues, respectively.
Figure 9: Putative structure of the in‐line transition state during the transphosphorylation step1.
It has been proved that both reactions do not represent a sequential process and should rather be considered as two independent reactions. The second is much slower than the first and the “intermediate” product can be considered as final product of the first reaction106. Furthermore, the second reaction formally resembles the inverse of the first, so it would be more accurate to think of RNase A as a transferase rather than a hydrolase. 4.2. Interaction of RNase A with the RNA substrate The formation of the enzyme‐substrate complex is a crucial step in the final
achieved efficiency of the enzymatic catalysis. For enzymes catalysing reactions with small substrate molecules, no more than one active site is required for binding. However, enzymes like ribonucleases, having polymeric RNA as a substrate, require more than one binding subsite and its correct alignment with it. This binding is directed by electrostatic interactions between the phosphate groups of the substrate and protein basic amino acid residues (Lys, Arg) as well as specific interactions between nitrogenated bases and amino acids at the active site or adjacent positions107.
Introduction
14
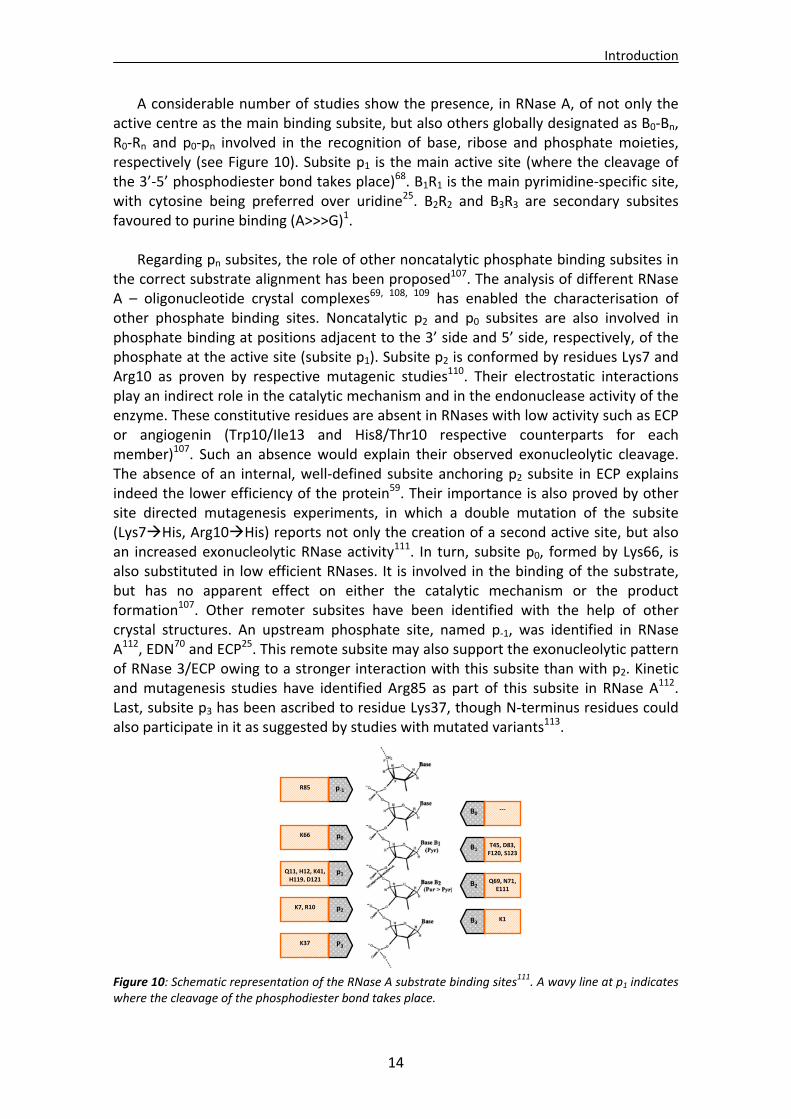
A considerable number of studies show the presence, in RNase A, of not only the active centre as the main binding subsite, but also others globally designated as B0‐Bn, R0‐Rn and p0‐pn involved in the recognition of base, ribose and phosphate moieties, respectively (see Figure 10). Subsite p1 is the main active site (where the cleavage of the 3’‐5’ phosphodiester bond takes place)68. B1R1 is the main pyrimidine‐specific site, with cytosine being preferred over uridine25. B2R2 and B3R3 are secondary subsites favoured to purine binding (A>>>G)1.
Regarding pn subsites, the role of other noncatalytic phosphate binding subsites in
the correct substrate alignment has been proposed107. The analysis of different RNase A – oligonucleotide crystal complexes69, 108, 109 has enabled the characterisation of other phosphate binding sites. Noncatalytic p2 and p0 subsites are also involved in phosphate binding at positions adjacent to the 3’ side and 5’ side, respectively, of the phosphate at the active site (subsite p1). Subsite p2 is conformed by residues Lys7 and Arg10 as proven by respective mutagenic studies110. Their electrostatic interactions play an indirect role in the catalytic mechanism and in the endonuclease activity of the enzyme. These constitutive residues are absent in RNases with low activity such as ECP or angiogenin (Trp10/Ile13 and His8/Thr10 respective counterparts for each member)107. Such an absence would explain their observed exonucleolytic cleavage. The absence of an internal, well‐defined subsite anchoring p2 subsite in ECP explains indeed the lower efficiency of the protein59. Their importance is also proved by other site directed mutagenesis experiments, in which a double mutation of the subsite (Lys7His, Arg10His) reports not only the creation of a second active site, but also an increased exonucleolytic RNase activity111. In turn, subsite p0, formed by Lys66, is also substituted in low efficient RNases. It is involved in the binding of the substrate, but has no apparent effect on either the catalytic mechanism or the product formation107. Other remoter subsites have been identified with the help of other crystal structures. An upstream phosphate site, named p‐1, was identified in RNase A112, EDN70 and ECP25. This remote subsite may also support the exonucleolytic pattern of RNase 3/ECP owing to a stronger interaction with this subsite than with p2. Kinetic and mutagenesis studies have identified Arg85 as part of this subsite in RNase A112. Last, subsite p3 has been ascribed to residue Lys37, though N‐terminus residues could also participate in it as suggested by studies with mutated variants113.
Figure 10: Schematic representation of the RNase A substrate binding sites
111. A wavy line at p1 indicates where the cleavage of the phosphodiester bond takes place.
B1 T45, D83, F120, S123
B2Q69, N71,
E111
B3K1
B0 ‐‐‐
p‐1R85
p0K66
p1Q11, H12, K41, H119, D121
p2K7, R10
P3K37
Introduction
15
4.3. Conformation flexibility in protein dynamics The role of sequence and structure in defining enzyme function is a broadly
accepted biological dogma. However, information about sequence and structure, which have typically considered proteins as merely static structures, is not enough to explain their function. Conformational flexibility is an essential component of the enzyme function indeed; NMR relaxation experiments recently reported the existence of functionally relevant, low populated conformational states with essential roles in ligand binding, active‐site reorganisation or product release during enzyme turnover. This suggests that flexible networks of concerted residue motion might be an integral part of the structure‐function relationship in many protein architectures. Conformational exchange may have arisen from confined and contiguous networks of couple motions to support a common function. Millisecond dynamics should also be considered to analyse their contribution in the final enzyme efficiency. Protein engineering has been applied to design RNase A and ECP chimeras to prove the influence of millisecond dynamics to modulate protein function114.
RNase A and ECP share invariant structural and catalytic elements which yet result
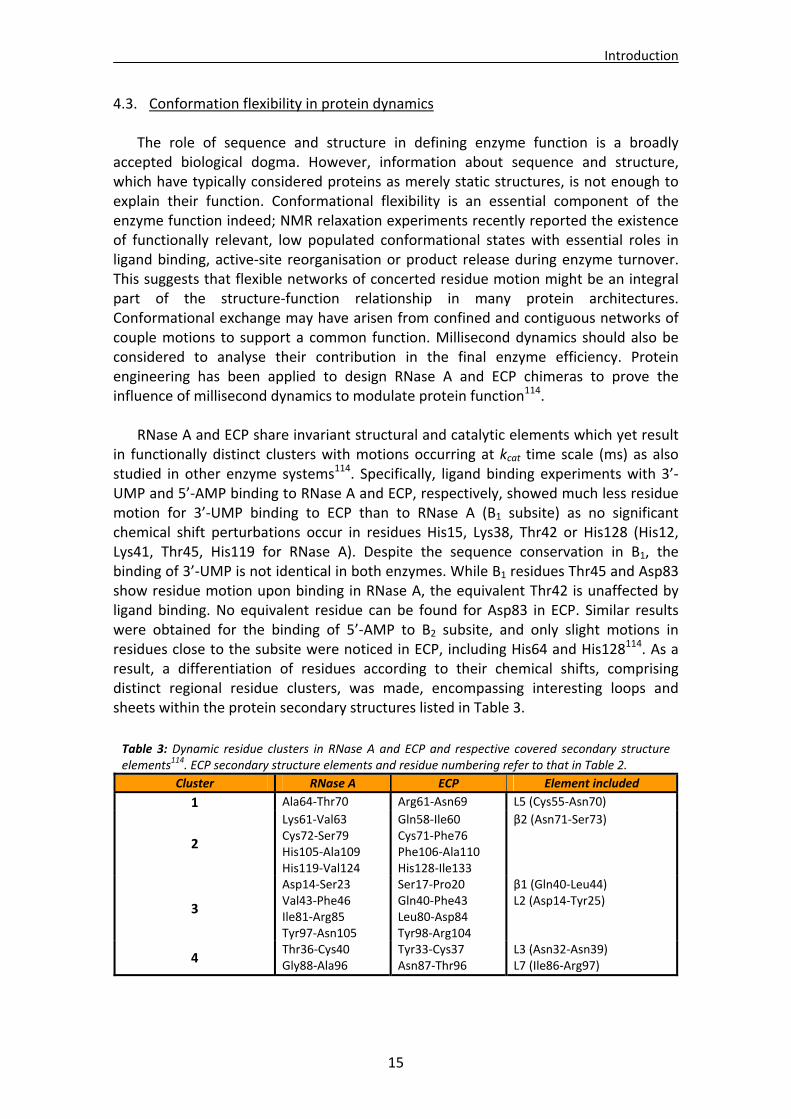
in functionally distinct clusters with motions occurring at kcat time scale (ms) as also studied in other enzyme systems114. Specifically, ligand binding experiments with 3’‐UMP and 5’‐AMP binding to RNase A and ECP, respectively, showed much less residue motion for 3’‐UMP binding to ECP than to RNase A (B1 subsite) as no significant chemical shift perturbations occur in residues His15, Lys38, Thr42 or His128 (His12, Lys41, Thr45, His119 for RNase A). Despite the sequence conservation in B1, the binding of 3’‐UMP is not identical in both enzymes. While B1 residues Thr45 and Asp83 show residue motion upon binding in RNase A, the equivalent Thr42 is unaffected by ligand binding. No equivalent residue can be found for Asp83 in ECP. Similar results were obtained for the binding of 5’‐AMP to B2 subsite, and only slight motions in residues close to the subsite were noticed in ECP, including His64 and His128114. As a result, a differentiation of residues according to their chemical shifts, comprising distinct regional residue clusters, was made, encompassing interesting loops and sheets within the protein secondary structures listed in Table 3.
Table 3: Dynamic residue clusters in RNase A and ECP and respective covered secondary structure elements114. ECP secondary structure elements and residue numbering refer to that in Table 2.
Cluster RNase A ECP Element included
1 Ala64‐Thr70 Arg61‐Asn69 L5 (Cys55‐Asn70)
2
Lys61‐Val63 Cys72‐Ser79 His105‐Ala109 His119‐Val124
Gln58‐Ile60 Cys71‐Phe76 Phe106‐Ala110 His128‐Ile133
β2 (Asn71‐Ser73)
3
Asp14‐Ser23 Val43‐Phe46 Ile81‐Arg85 Tyr97‐Asn105
Ser17‐Pro20 Gln40‐Phe43 Leu80‐Asp84 Tyr98‐Arg104
β1 (Gln40‐Leu44) L2 (Asp14‐Tyr25)
4 Thr36‐Cys40 Gly88‐Ala96
Tyr33‐Cys37 Asn87‐Thr96
L3 (Asn32‐Asn39) L7 (Ile86‐Arg97)
Introduction
16
Interestingly, RNase A cluster 3 residues (Thr45, Phe46, Thr82, Thr100, Gln101) show important ms conformational exchange and take part in the motion propagation to the active site during turnover, in which a 20 Å distant loop (residues Asp14‐Tyr25) is involved. Motions are propagated through a highly conserved pair of hydrogen‐bonded residues (His48‐Thr82) to active site residues Thr45 and Asp83. This concerted dynamic network is essential for optimal catalysis in RNase A as it provides important pyrimidine interactions upon RNA substrate binding and/or release. Its absence in ECP might also be related to its lower ribonucleolytic activity. No contiguous residue network would affect the binding to the enzyme. Regarding 5’‐AMP, only His64 (ECP), in cluster 1, is affected by the binding to the protein. The cluster loop acts as an arm that holds the purine ligand correctly. This loop is the only dynamic cluster that undergoes conformational exchange in both enzymes, albeit with distinct rates114. Conformational flexibility can thus be conserved among analogous protein folds with low sequence identity. Both enzymes display similar millisecond dynamic residue clusters near their active sites instead of randomly scattered throughout the protein structure, with relatively rigid and homogeneous backbone fluctuations of 10‐9‐10‐12 s. Though structurally conserved, these motions differ in the conformational exchange global rates mainly because of the absence of the functionally dynamic His48‐Thr82 pair in RNase A for ECP114.
4.4. Nucleotide binding architecture in secreted cytotoxic endoribonucleases
As phosphate, ribose and bases within nucleotides are recognised by a great
variety of proteins, a general modular architecture can be defined115 thanks to their interactions with RNases, RNA polymerases or transcription factors. Indeed, structural motifs for phosphate binding have been previously reported116 and nucleobase recognition patterns have been defined by complex screening117‐121. Prediction softwares122, 123 have been used as well, enabling some general rules concerning nucleid acid recognition. RNA and DNA binding proteins are found to apply equivalent strategies, suggesting a common evolution124. In addition, the increasing number of protein‐ligand complexes submitted to the Protein Data Bank and the availability of statistical and analysis tools to closely inspect the ligand environment provide the opportunity to review and rediscover the structural determinants for RNases substrate specificity.
Statistical analyses of nucleotide binding protein complexes were carried out
within the RNase A superfamily and microbial RNase members. Unlike p1 and B1 subsites, B2 subsite residues show a high variability degree, a fact that could explain the differences in catalytic efficiencies and substrate specificity15, 27, 63. Microbial RNases conform another reference superfamily which includes RNases from bacteria and fungi22, some members of which have been fully characterised, like RNase T1, binase or RNase Sa, and provide a wealth of information on the nucleotide binding mode patterns125. Structural analyses with members of this family have been referred to RNase T1, the most studied superfamily member2. It was first purified from an enzyme extract obtained from the sake brewing process. Its acid‐base mechanism relies on His92 and Glu58 as acid and base residues, respectively126. Residues Tyr38, His40 and Arg77 are suggested to stabilise the transition state2 as they anchor the
Introduction
17
substrate at p1. Furthermore, guanine specificity is shown in all superfamily members at B1 subsite
127.
5. Biological properties 5.1. Antimicrobial RNases
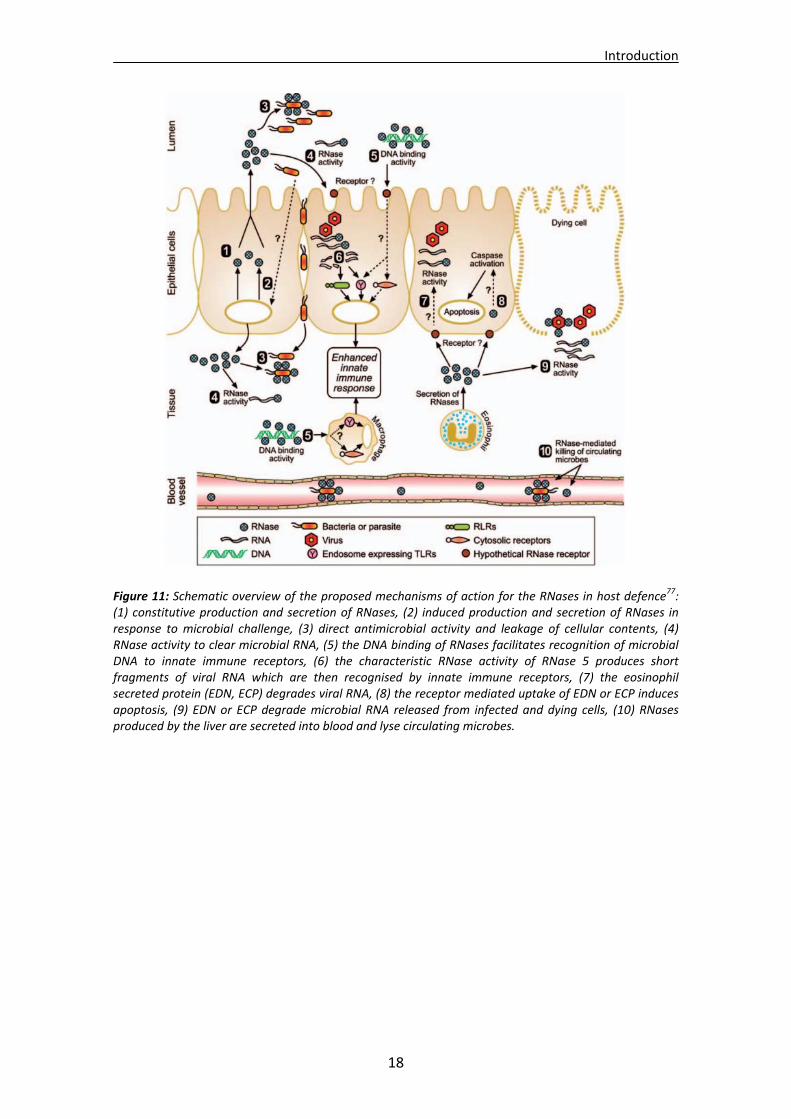
Eosinophil cationic protein (RNase 3) and the skin derived ribonuclease (RNase 7) are the main representatives of the cytotoxic antimicrobial members of the RNase A superfamily. Despite a sequence homology of only 38%, both share a common structural architecture and show a high cationicity for which arginine and lysine residues, respectively, are mainly responsible. Biological properties are indeed related to their high pI values, which contribute to their distinct bactericidal mechanisms of action128. Eosinophil cationic protein can be considered as both an enzyme (RNase activity) and an antimicrobial protein. Besides, its high cationicity might be one reason for its extremely high stability and consequent unalterability against chemical denaturing agents66. It can thus accumulate at high concentrations in host tissues and exert a wide number of antipathogen actions (see Section 5.3.1). RNase 7 was first identified and purified from human skin, a first line barrier for host defence. It is actually one of the major proteins secreted by keratinocytes and may indeed contribute to the host defence of cutaneous epithelia. Like ECP, it has been shown to possess broad spectrum cytotoxicity against a range of microbes77. A list of all RNases showing antimicrobial properties is included in Table 4.
5.1.1. Antimicrobial mechanism of action
The so‐called antimicrobial peptides (AMPs) are ancient weapons that participate
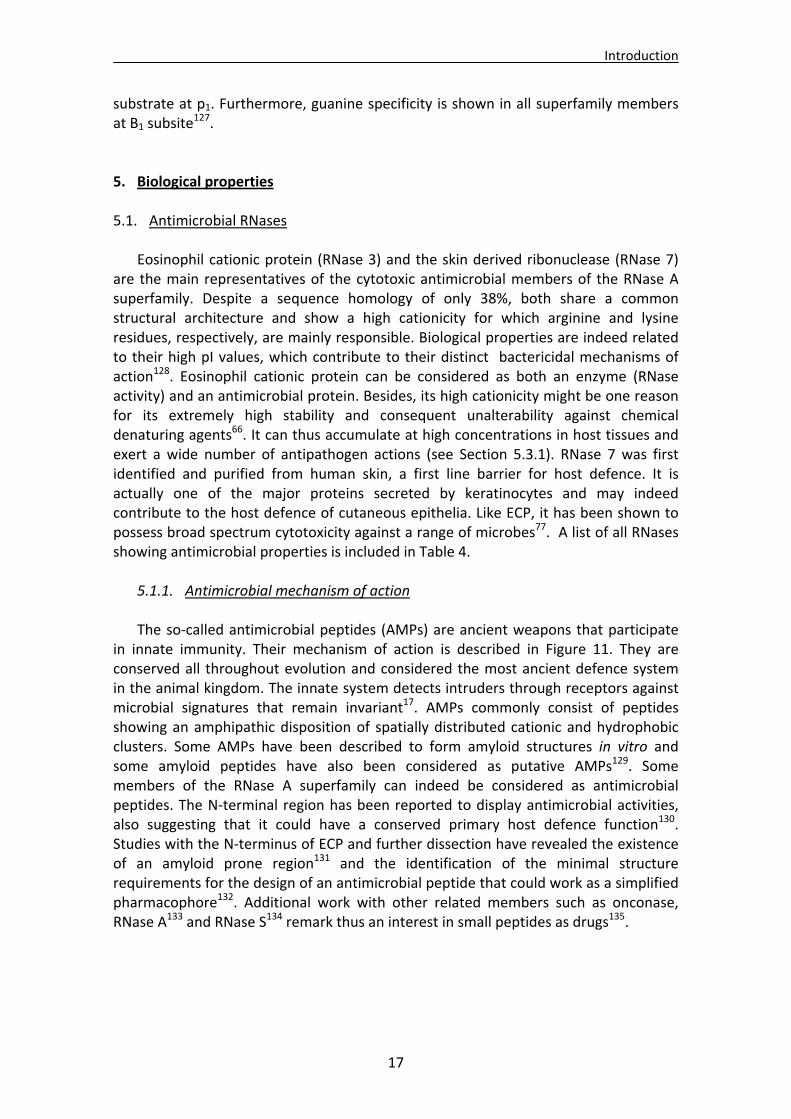
in innate immunity. Their mechanism of action is described in Figure 11. They are conserved all throughout evolution and considered the most ancient defence system in the animal kingdom. The innate system detects intruders through receptors against microbial signatures that remain invariant17. AMPs commonly consist of peptides showing an amphipathic disposition of spatially distributed cationic and hydrophobic clusters. Some AMPs have been described to form amyloid structures in vitro and some amyloid peptides have also been considered as putative AMPs129. Some members of the RNase A superfamily can indeed be considered as antimicrobial peptides. The N‐terminal region has been reported to display antimicrobial activities, also suggesting that it could have a conserved primary host defence function130. Studies with the N‐terminus of ECP and further dissection have revealed the existence of an amyloid prone region131 and the identification of the minimal structure requirements for the design of an antimicrobial peptide that could work as a simplified pharmacophore132. Additional work with other related members such as onconase, RNase A133 and RNase S134 remark thus an interest in small peptides as drugs135.
Introduction
18
Figure 11: Schematic overview of the proposed mechanisms of action for the RNases in host defence77: (1) constitutive production and secretion of RNases, (2) induced production and secretion of RNases in response to microbial challenge, (3) direct antimicrobial activity and leakage of cellular contents, (4) RNase activity to clear microbial RNA, (5) the DNA binding of RNases facilitates recognition of microbial DNA to innate immune receptors, (6) the characteristic RNase activity of RNase 5 produces short fragments of viral RNA which are then recognised by innate immune receptors, (7) the eosinophil secreted protein (EDN, ECP) degrades viral RNA, (8) the receptor mediated uptake of EDN or ECP induces apoptosis, (9) EDN or ECP degrade microbial RNA released from infected and dying cells, (10) RNases produced by the liver are secreted into blood and lyse circulating microbes.
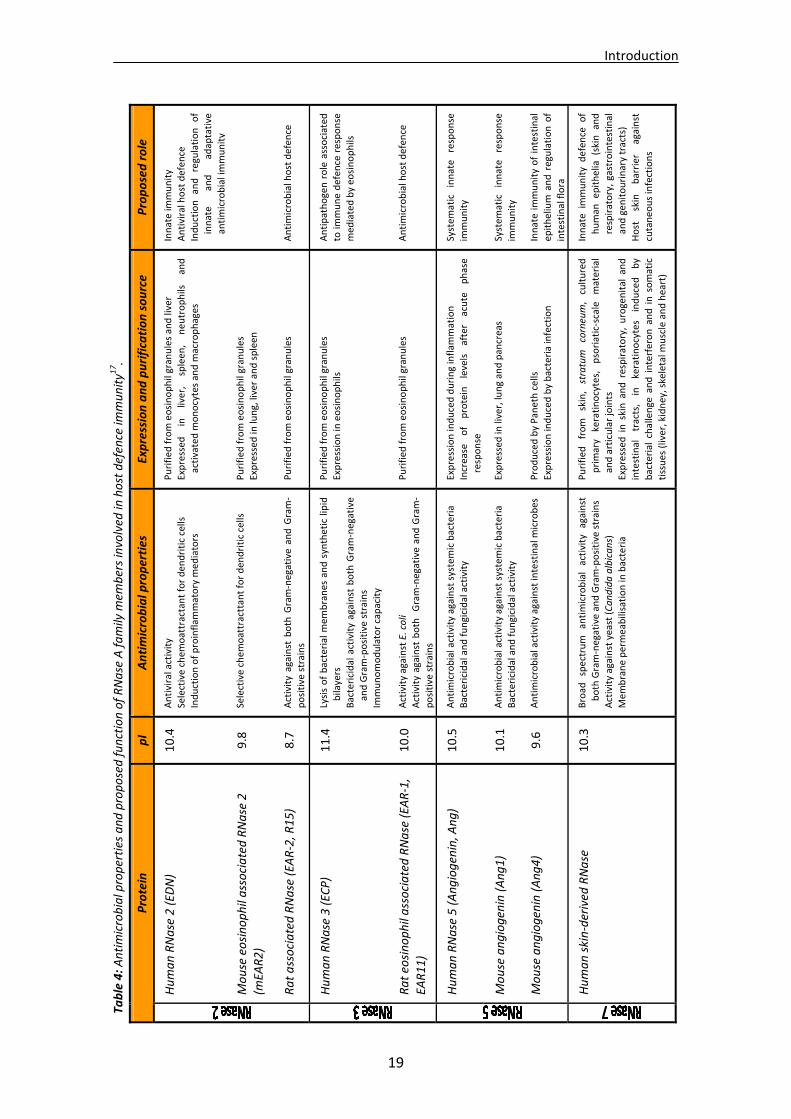
Introduction
19
Proposed role
Innate im
munity
Antiviral host defen
ce
Induction and regulation of
innate
and
adaptative
antimicrobial immunity
Antimicrobial host defen
ce
Antipathogen role associated
to immune defen
ce response
med
iated by eosinophils
Antimicrobial host defen
ce
System
atic innate response
immunity
System
atic innate response
immunity
Innate im
munity of intestinal
epithelium and regulation of
intestinal flora
Innate im
munity defen
ce of
human
ep
ithelia (skin and
respiratory, gastrointestinal
and gen
itourinary tracts)
Host skin barrier against
cutaneo
us infections
Expression and purification source
Purified
from eosinophil granules and liver
Expressed
in liver,
spleen
, neutrophils and
activated m
onocytes and m
acrophages
Purified
from eosinophil granules
Expressed
in lung, liver and spleen
Purified
from eosinophil granules
Purified
from eosinophil granules
Expression in
eosinophils
Purified
from eosinophil granules
Expression induced during inflam
mation
Increase of
protein levels after
acute phase
response
Expressed
in liver, lung and pancreas
Produced by Paneth cells
Expression induced by bacteria infection
Purified
from skin, stratum corneum, cultured
primary
keratinocytes, psoriatic‐scale material
and articular joints
Expressed
in skin and respiratory, urogenital and
intestinal tracts,
in keratinocytes
induced by
bacterial challenge and interferon and in somatic
tissues (liver, kidney, skeletal m
uscle and heart)
Antimicrobial properties
Antiviral activity
Selective chem
oattractant for den
dritic cells
Induction of proinflam
matory m
ediators
Selective chem
oattracttant for dendritic cells
Activity against both Gram‐negative and Gram‐
positive strains
Lysis of bacterial m
embranes and synthetic lipid
bilayers
Bactericidal activity against both Gram‐negative
and Gram‐positive strains
Immunomodulator capacity
Activity against E. coli
Activity against both Gram‐negative and Gram‐
positive strains
Antimicrobial activity against systemic bacteria
Bactericidal and fungicidal activity
Antimicrobial activity against systemic bacteria
Bactericidal and fungicidal activity
Antimicrobial activity against intestinal m
icrobes
Broad
spectrum antimicrobial activity against
both Gram‐negative and Gram‐positive strains
Activity against yeast (Candida albicans)
Mem
brane perm
eabilisation in
bacteria
pI
10.4
9.8
8.7
11.4
10.0
10.5
10.1
9.6
10.3
Human RNase 2 (ED
N)
Mouse eosinophil associated RNase 2
(mEA
R2)
Rat associated RNase (EA
R‐2, R15)
Human RNase 3 (ECP)
Rat eosinophil associated RNase (EA
R‐1,
EAR11)
Human RNase 5 (Angiogenin, A
ng)
Mouse angiogenin (Ang1)
Mouse angiogenin (Ang4)
Human skin‐derived
RNase
Table 4: A
ntimicrobial properties and proposed function of RNase A family m
embers involved
in host defence im
munity1
7.
Protein
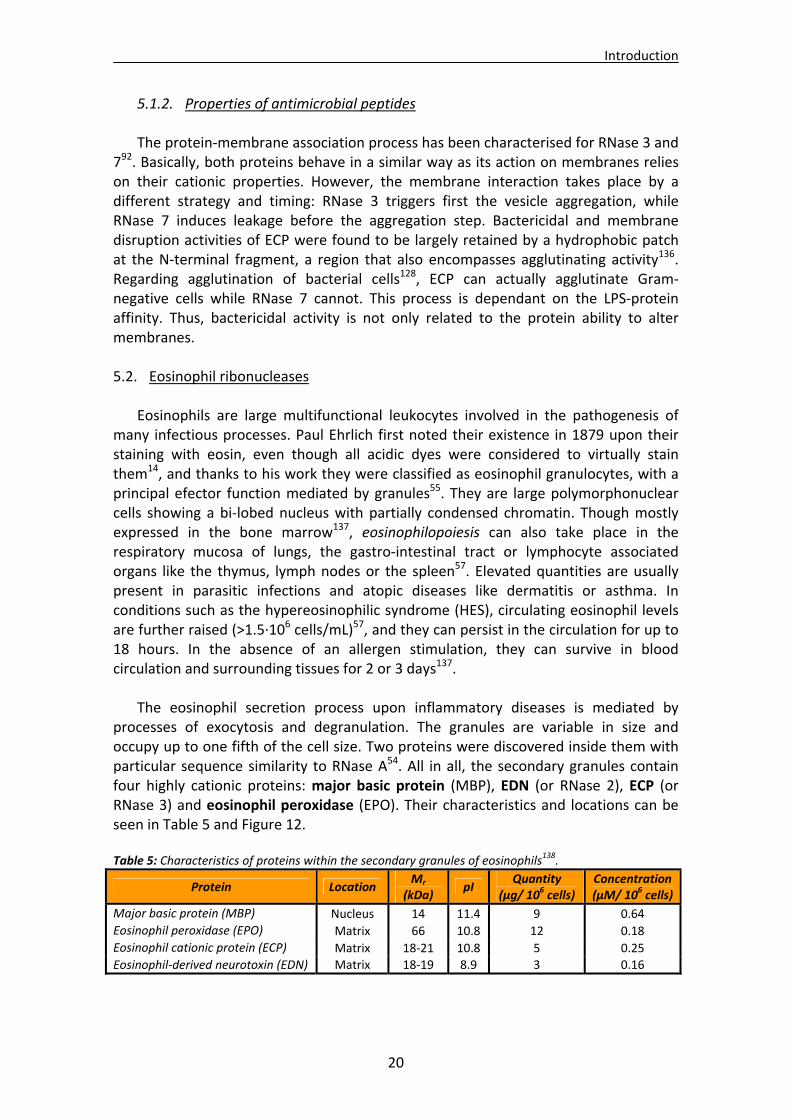
Introduction
20
5.1.2. Properties of antimicrobial peptides
The protein‐membrane association process has been characterised for RNase 3 and 792. Basically, both proteins behave in a similar way as its action on membranes relies on their cationic properties. However, the membrane interaction takes place by a different strategy and timing: RNase 3 triggers first the vesicle aggregation, while RNase 7 induces leakage before the aggregation step. Bactericidal and membrane disruption activities of ECP were found to be largely retained by a hydrophobic patch at the N‐terminal fragment, a region that also encompasses agglutinating activity136. Regarding agglutination of bacterial cells128, ECP can actually agglutinate Gram‐negative cells while RNase 7 cannot. This process is dependant on the LPS‐protein affinity. Thus, bactericidal activity is not only related to the protein ability to alter membranes. 5.2. Eosinophil ribonucleases
Eosinophils are large multifunctional leukocytes involved in the pathogenesis of many infectious processes. Paul Ehrlich first noted their existence in 1879 upon their staining with eosin, even though all acidic dyes were considered to virtually stain them14, and thanks to his work they were classified as eosinophil granulocytes, with a principal efector function mediated by granules55. They are large polymorphonuclear cells showing a bi‐lobed nucleus with partially condensed chromatin. Though mostly expressed in the bone marrow137, eosinophilopoiesis can also take place in the respiratory mucosa of lungs, the gastro‐intestinal tract or lymphocyte associated organs like the thymus, lymph nodes or the spleen57. Elevated quantities are usually present in parasitic infections and atopic diseases like dermatitis or asthma. In conditions such as the hypereosinophilic syndrome (HES), circulating eosinophil levels are further raised (>1.5∙106 cells/mL)57, and they can persist in the circulation for up to 18 hours. In the absence of an allergen stimulation, they can survive in blood circulation and surrounding tissues for 2 or 3 days137.
The eosinophil secretion process upon inflammatory diseases is mediated by
processes of exocytosis and degranulation. The granules are variable in size and occupy up to one fifth of the cell size. Two proteins were discovered inside them with particular sequence similarity to RNase A54. All in all, the secondary granules contain four highly cationic proteins: major basic protein (MBP), EDN (or RNase 2), ECP (or RNase 3) and eosinophil peroxidase (EPO). Their characteristics and locations can be seen in Table 5 and Figure 12.
Table 5: Characteristics of proteins within the secondary granules of eosinophils138.
Protein Location Mr
(kDa) pI
Quantity (μg/ 106 cells)
Concentration (μM/ 106 cells)
Major basic protein (MBP) Nucleus 14 11.4 9 0.64
Eosinophil peroxidase (EPO) Matrix 66 10.8 12 0.18
Eosinophil cationic protein (ECP) Matrix 18‐21 10.8 5 0.25
Eosinophil‐derived neurotoxin (EDN) Matrix 18‐19 8.9 3 0.16
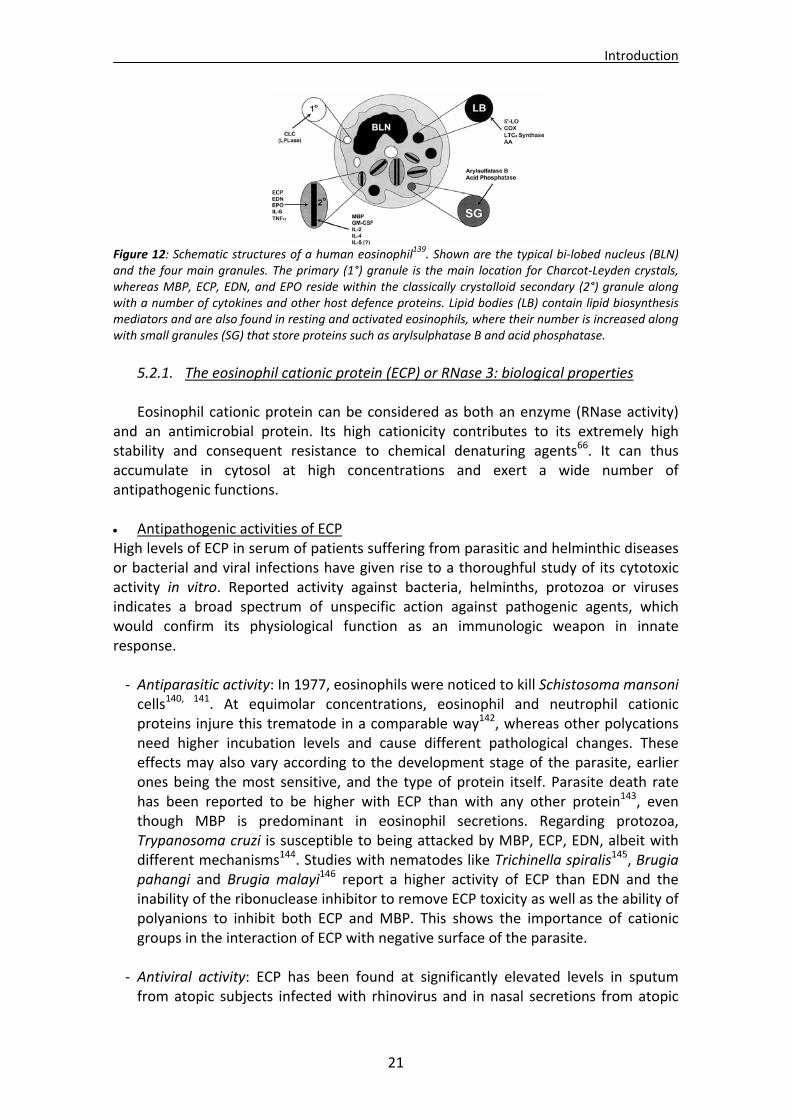
Introduction
21
Figure 12: Schematic structures of a human eosinophil139. Shown are the typical bi‐lobed nucleus (BLN) and the four main granules. The primary (1°) granule is the main location for Charcot‐Leyden crystals, whereas MBP, ECP, EDN, and EPO reside within the classically crystalloid secondary (2°) granule along with a number of cytokines and other host defence proteins. Lipid bodies (LB) contain lipid biosynthesis mediators and are also found in resting and activated eosinophils, where their number is increased along with small granules (SG) that store proteins such as arylsulphatase B and acid phosphatase.
5.2.1. The eosinophil cationic protein (ECP) or RNase 3: biological properties Eosinophil cationic protein can be considered as both an enzyme (RNase activity)
and an antimicrobial protein. Its high cationicity contributes to its extremely high stability and consequent resistance to chemical denaturing agents66. It can thus accumulate in cytosol at high concentrations and exert a wide number of antipathogenic functions.
Antipathogenic activities of ECP High levels of ECP in serum of patients suffering from parasitic and helminthic diseases or bacterial and viral infections have given rise to a thoroughful study of its cytotoxic activity in vitro. Reported activity against bacteria, helminths, protozoa or viruses indicates a broad spectrum of unspecific action against pathogenic agents, which would confirm its physiological function as an immunologic weapon in innate response. ‐ Antiparasitic activity: In 1977, eosinophils were noticed to kill Schistosoma mansoni cells140, 141. At equimolar concentrations, eosinophil and neutrophil cationic proteins injure this trematode in a comparable way142, whereas other polycations need higher incubation levels and cause different pathological changes. These effects may also vary according to the development stage of the parasite, earlier ones being the most sensitive, and the type of protein itself. Parasite death rate has been reported to be higher with ECP than with any other protein143, even though MBP is predominant in eosinophil secretions. Regarding protozoa, Trypanosoma cruzi is susceptible to being attacked by MBP, ECP, EDN, albeit with different mechanisms144. Studies with nematodes like Trichinella spiralis145, Brugia pahangi and Brugia malayi146 report a higher activity of ECP than EDN and the inability of the ribonuclease inhibitor to remove ECP toxicity as well as the ability of polyanions to inhibit both ECP and MBP. This shows the importance of cationic groups in the interaction of ECP with negative surface of the parasite.
‐ Antiviral activity: ECP has been found at significantly elevated levels in sputum from atopic subjects infected with rhinovirus and in nasal secretions from atopic
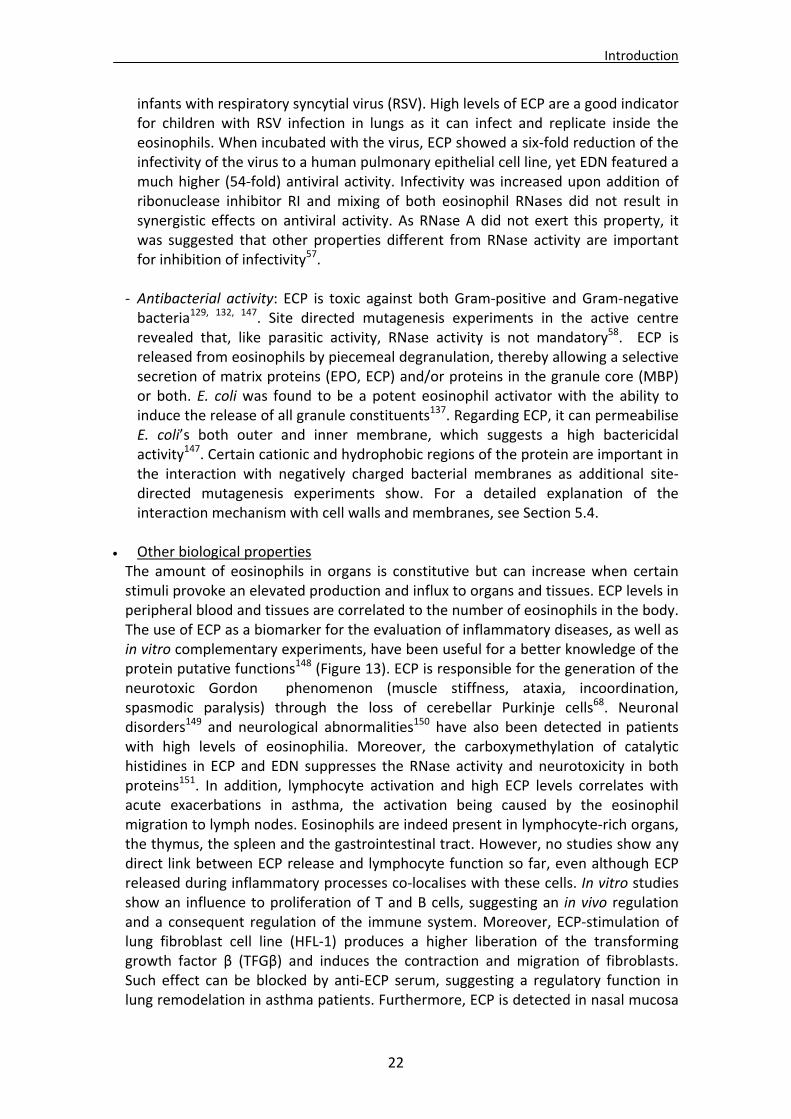
Introduction
22
infants with respiratory syncytial virus (RSV). High levels of ECP are a good indicator for children with RSV infection in lungs as it can infect and replicate inside the eosinophils. When incubated with the virus, ECP showed a six‐fold reduction of the infectivity of the virus to a human pulmonary epithelial cell line, yet EDN featured a much higher (54‐fold) antiviral activity. Infectivity was increased upon addition of ribonuclease inhibitor RI and mixing of both eosinophil RNases did not result in synergistic effects on antiviral activity. As RNase A did not exert this property, it was suggested that other properties different from RNase activity are important for inhibition of infectivity57.
‐ Antibacterial activity: ECP is toxic against both Gram‐positive and Gram‐negative bacteria129, 132, 147. Site directed mutagenesis experiments in the active centre revealed that, like parasitic activity, RNase activity is not mandatory58. ECP is released from eosinophils by piecemeal degranulation, thereby allowing a selective secretion of matrix proteins (EPO, ECP) and/or proteins in the granule core (MBP) or both. E. coli was found to be a potent eosinophil activator with the ability to induce the release of all granule constituents137. Regarding ECP, it can permeabilise E. coli’s both outer and inner membrane, which suggests a high bactericidal activity147. Certain cationic and hydrophobic regions of the protein are important in the interaction with negatively charged bacterial membranes as additional site‐directed mutagenesis experiments show. For a detailed explanation of the interaction mechanism with cell walls and membranes, see Section 5.4.
Other biological properties The amount of eosinophils in organs is constitutive but can increase when certain stimuli provoke an elevated production and influx to organs and tissues. ECP levels in peripheral blood and tissues are correlated to the number of eosinophils in the body. The use of ECP as a biomarker for the evaluation of inflammatory diseases, as well as in vitro complementary experiments, have been useful for a better knowledge of the protein putative functions148 (Figure 13). ECP is responsible for the generation of the neurotoxic Gordon phenomenon (muscle stiffness, ataxia, incoordination, spasmodic paralysis) through the loss of cerebellar Purkinje cells68. Neuronal disorders149 and neurological abnormalities150 have also been detected in patients with high levels of eosinophilia. Moreover, the carboxymethylation of catalytic histidines in ECP and EDN suppresses the RNase activity and neurotoxicity in both proteins151. In addition, lymphocyte activation and high ECP levels correlates with acute exacerbations in asthma, the activation being caused by the eosinophil migration to lymph nodes. Eosinophils are indeed present in lymphocyte‐rich organs, the thymus, the spleen and the gastrointestinal tract. However, no studies show any direct link between ECP release and lymphocyte function so far, even although ECP released during inflammatory processes co‐localises with these cells. In vitro studies show an influence to proliferation of T and B cells, suggesting an in vivo regulation and a consequent regulation of the immune system. Moreover, ECP‐stimulation of lung fibroblast cell line (HFL‐1) produces a higher liberation of the transforming growth factor β (TFGβ) and induces the contraction and migration of fibroblasts. Such effect can be blocked by anti‐ECP serum, suggesting a regulatory function in lung remodelation in asthma patients. Furthermore, ECP is detected in nasal mucosa
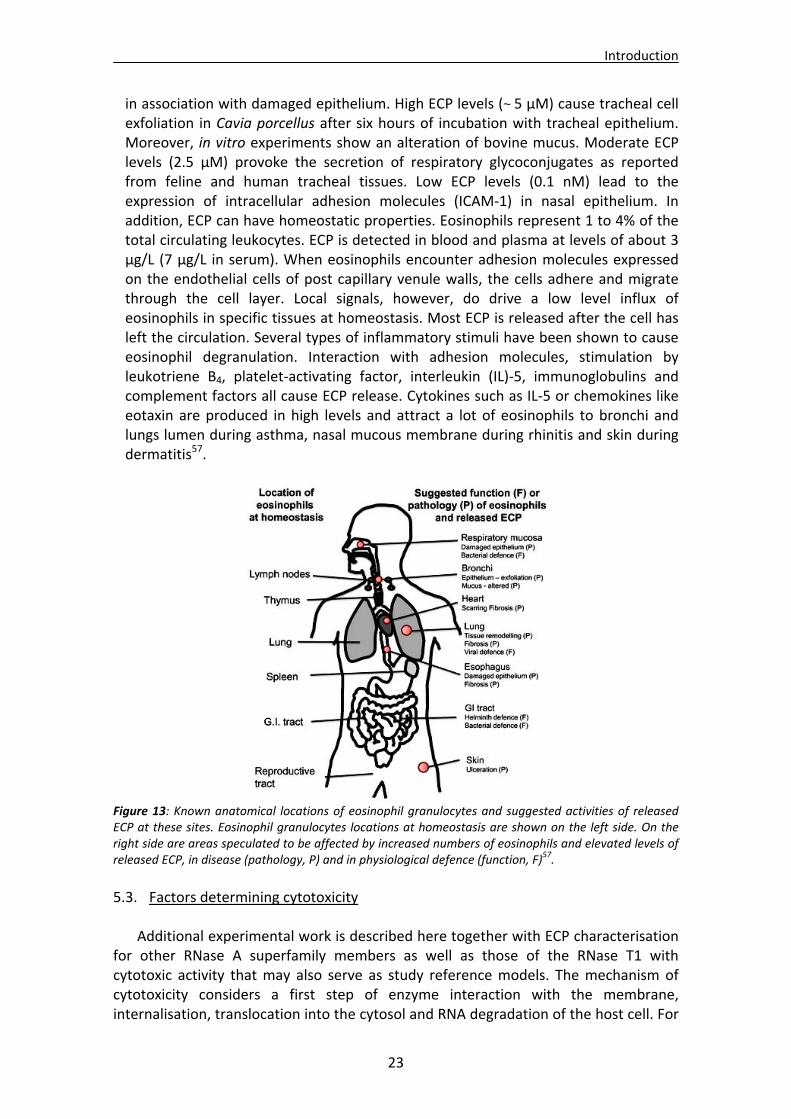
Introduction
23
in association with damaged epithelium. High ECP levels (~5 μM) cause tracheal cell exfoliation in Cavia porcellus after six hours of incubation with tracheal epithelium. Moreover, in vitro experiments show an alteration of bovine mucus. Moderate ECP levels (2.5 μM) provoke the secretion of respiratory glycoconjugates as reported from feline and human tracheal tissues. Low ECP levels (0.1 nM) lead to the expression of intracellular adhesion molecules (ICAM‐1) in nasal epithelium. In addition, ECP can have homeostatic properties. Eosinophils represent 1 to 4% of the total circulating leukocytes. ECP is detected in blood and plasma at levels of about 3 μg/L (7 μg/L in serum). When eosinophils encounter adhesion molecules expressed on the endothelial cells of post capillary venule walls, the cells adhere and migrate through the cell layer. Local signals, however, do drive a low level influx of eosinophils in specific tissues at homeostasis. Most ECP is released after the cell has left the circulation. Several types of inflammatory stimuli have been shown to cause eosinophil degranulation. Interaction with adhesion molecules, stimulation by leukotriene B4, platelet‐activating factor, interleukin (IL)‐5, immunoglobulins and complement factors all cause ECP release. Cytokines such as IL‐5 or chemokines like eotaxin are produced in high levels and attract a lot of eosinophils to bronchi and lungs lumen during asthma, nasal mucous membrane during rhinitis and skin during dermatitis57.
Figure 13: Known anatomical locations of eosinophil granulocytes and suggested activities of released ECP at these sites. Eosinophil granulocytes locations at homeostasis are shown on the left side. On the right side are areas speculated to be affected by increased numbers of eosinophils and elevated levels of released ECP, in disease (pathology, P) and in physiological defence (function, F)57.
5.3. Factors determining cytotoxicity
Additional experimental work is described here together with ECP characterisation
for other RNase A superfamily members as well as those of the RNase T1 with cytotoxic activity that may also serve as study reference models. The mechanism of cytotoxicity considers a first step of enzyme interaction with the membrane, internalisation, translocation into the cytosol and RNA degradation of the host cell. For
Introduction
24
this to happen RNases must be released from the endosomes or lysosomes and avoid protease activity. Their action can also be hindered by inhibitors. All these factors can contribute to the final cytotoxic activity of the protein.
5.3.1. Interaction with cell membranes Physicochemical properties of cell membranes are a key factor for a selective
cytotoxic activity. While prokaryotic cell membranes feature exposed negative charges, those in eukaryotic organisms are normally neutral, the majority of negative charges being located in the inner cell membrane monolayer152. Most cationic peptides interact with anionic membranes and tend to form amphipathic secondary structures17 that insert into the membrane and permeabilise the lipid bilayer. Hydrophobic interactions between nonpolar amino acids and membrane nucleus contribute to its destabilisation. Three different methods have been described for membrane destabilisation: barrel‐stave, carpet‐like and toroid pore.
Figure 14: Schematic presentation of the three major models explaining how cationic amphipathic AMPs insert into lipid bilayers or lead to membrane disruption153. Hydrophilic and lipophilic parts of the AMPs are indicated in light grey and black, respectively.
Regardless of the mechanism, the union to the cell surface can either occur by
means of an interaction with surface protein receptors or with sugars bonded to membrane lipids or proteins. The interaction is thus determined by specific membrane proteins or lipid rafts. Positively charged molecules interact with cell surface anionic glycolipids and glycoproteins more easily, which presumably leads to their internalisation. Actually, many tumour cells feature a more negative membrane charge than that in normal cell lines154. Basicity is, consequently, a very interesting feature in a molecule for the development of chemotherapeutical agents. A variety of examples can be found in the literature on RNases active in cellular membranes. α‐Sarcin interacts selectively with acidic phospholipids and induces the fusion and aggregation of lipidic membranes155. Lectins from Rana catesbeiana and R. japonica interact selectively with surface glycoproteins in tumour cells156. Distinct membrane union sites have also been described for onconase, an RNase purified from R. pipiens oocytes, and bovine seminal RNase157, albeit with no protein receptor. For the former, the interaction is mediated by electrostatic forces, which explains its preference for tumour cells. BS‐RNase attacks synthetic neutral or negatively charged membranes158. Chemical modification or RNase mutants have also proved to be a good method to increase cell internalisation and reduce the sensibility to the ribonuclease inhibitor159.
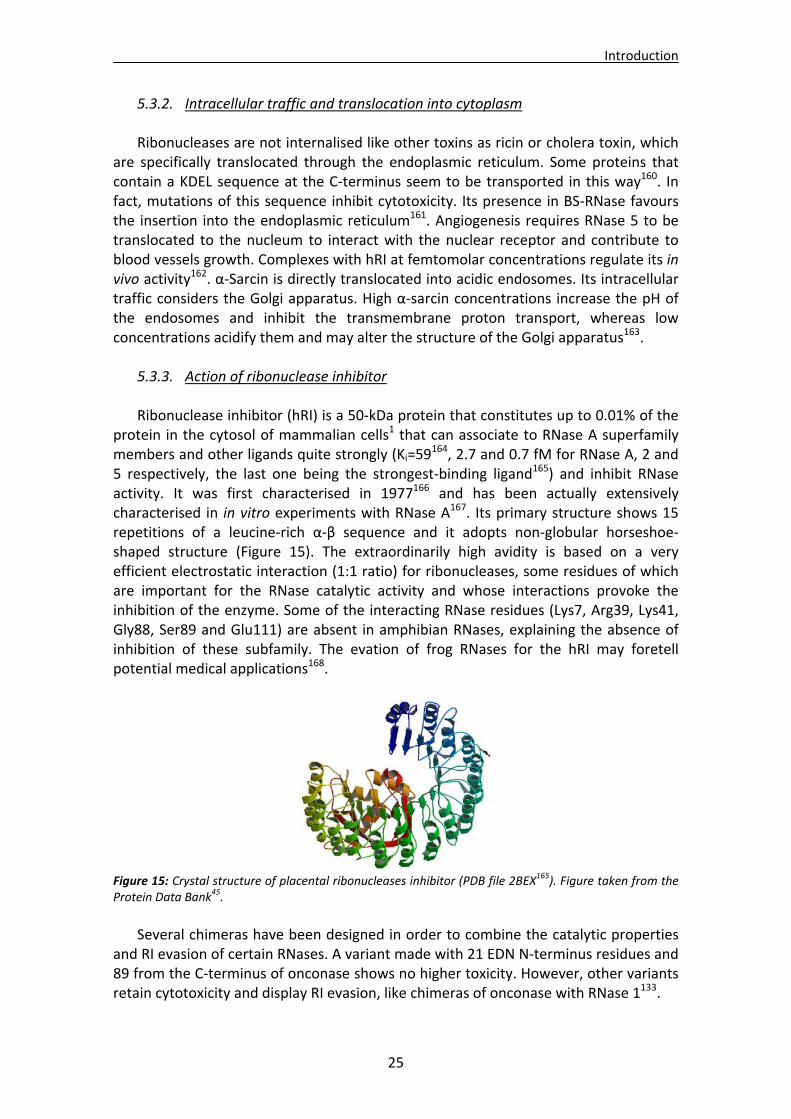
Introduction
25
5.3.2. Intracellular traffic and translocation into cytoplasm Ribonucleases are not internalised like other toxins as ricin or cholera toxin, which
are specifically translocated through the endoplasmic reticulum. Some proteins that contain a KDEL sequence at the C‐terminus seem to be transported in this way160. In fact, mutations of this sequence inhibit cytotoxicity. Its presence in BS‐RNase favours the insertion into the endoplasmic reticulum161. Angiogenesis requires RNase 5 to be translocated to the nucleum to interact with the nuclear receptor and contribute to blood vessels growth. Complexes with hRI at femtomolar concentrations regulate its in vivo activity162. α‐Sarcin is directly translocated into acidic endosomes. Its intracellular traffic considers the Golgi apparatus. High α‐sarcin concentrations increase the pH of the endosomes and inhibit the transmembrane proton transport, whereas low concentrations acidify them and may alter the structure of the Golgi apparatus163.
5.3.3. Action of ribonuclease inhibitor Ribonuclease inhibitor (hRI) is a 50‐kDa protein that constitutes up to 0.01% of the
protein in the cytosol of mammalian cells1 that can associate to RNase A superfamily members and other ligands quite strongly (Ki=59
164, 2.7 and 0.7 fM for RNase A, 2 and 5 respectively, the last one being the strongest‐binding ligand165) and inhibit RNase activity. It was first characterised in 1977166 and has been actually extensively characterised in in vitro experiments with RNase A167. Its primary structure shows 15 repetitions of a leucine‐rich α‐β sequence and it adopts non‐globular horseshoe‐shaped structure (Figure 15). The extraordinarily high avidity is based on a very efficient electrostatic interaction (1:1 ratio) for ribonucleases, some residues of which are important for the RNase catalytic activity and whose interactions provoke the inhibition of the enzyme. Some of the interacting RNase residues (Lys7, Arg39, Lys41, Gly88, Ser89 and Glu111) are absent in amphibian RNases, explaining the absence of inhibition of these subfamily. The evation of frog RNases for the hRI may foretell potential medical applications168.
Figure 15: Crystal structure of placental ribonucleases inhibitor (PDB file 2BEX165). Figure taken from the Protein Data Bank45.
Several chimeras have been designed in order to combine the catalytic properties
and RI evasion of certain RNases. A variant made with 21 EDN N‐terminus residues and 89 from the C‐terminus of onconase shows no higher toxicity. However, other variants retain cytotoxicity and display RI evasion, like chimeras of onconase with RNase 1133.
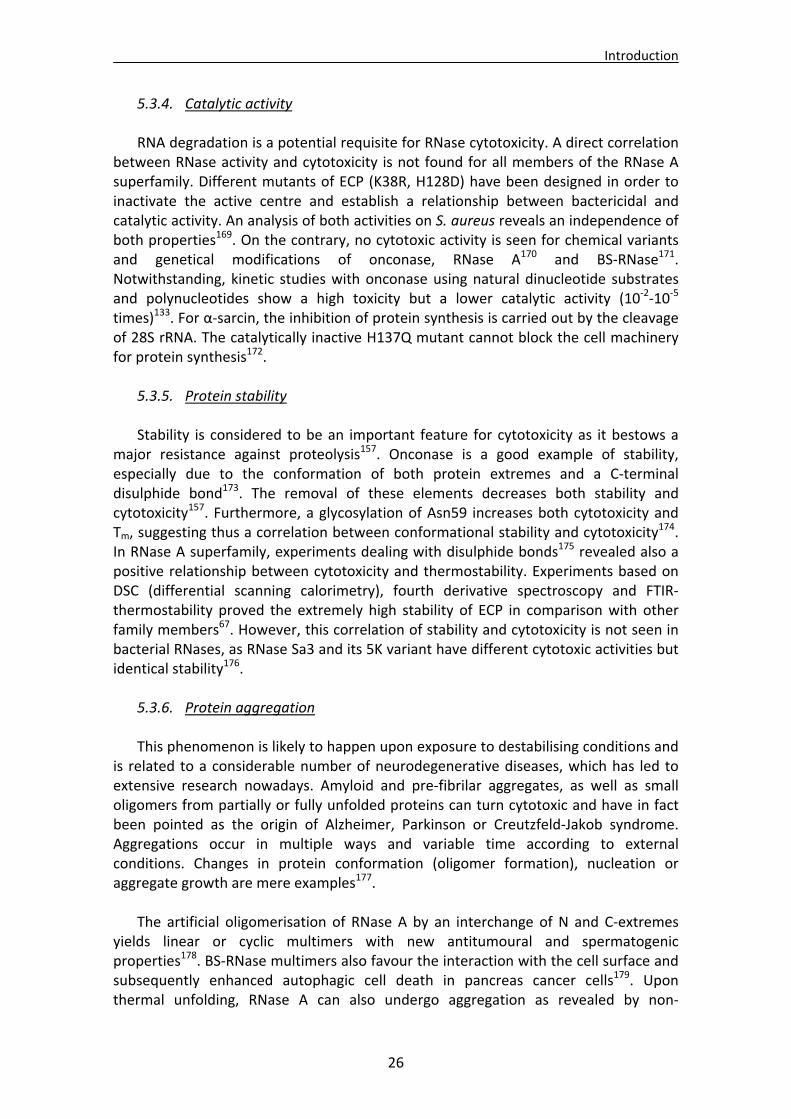
Introduction
26
5.3.4. Catalytic activity RNA degradation is a potential requisite for RNase cytotoxicity. A direct correlation
between RNase activity and cytotoxicity is not found for all members of the RNase A superfamily. Different mutants of ECP (K38R, H128D) have been designed in order to inactivate the active centre and establish a relationship between bactericidal and catalytic activity. An analysis of both activities on S. aureus reveals an independence of both properties169. On the contrary, no cytotoxic activity is seen for chemical variants and genetical modifications of onconase, RNase A170 and BS‐RNase171. Notwithstanding, kinetic studies with onconase using natural dinucleotide substrates and polynucleotides show a high toxicity but a lower catalytic activity (10‐2‐10‐5 times)133. For α‐sarcin, the inhibition of protein synthesis is carried out by the cleavage of 28S rRNA. The catalytically inactive H137Q mutant cannot block the cell machinery for protein synthesis172.
5.3.5. Protein stability Stability is considered to be an important feature for cytotoxicity as it bestows a
major resistance against proteolysis157. Onconase is a good example of stability, especially due to the conformation of both protein extremes and a C‐terminal disulphide bond173. The removal of these elements decreases both stability and cytotoxicity157. Furthermore, a glycosylation of Asn59 increases both cytotoxicity and Tm, suggesting thus a correlation between conformational stability and cytotoxicity174. In RNase A superfamily, experiments dealing with disulphide bonds175 revealed also a positive relationship between cytotoxicity and thermostability. Experiments based on DSC (differential scanning calorimetry), fourth derivative spectroscopy and FTIR‐thermostability proved the extremely high stability of ECP in comparison with other family members67. However, this correlation of stability and cytotoxicity is not seen in bacterial RNases, as RNase Sa3 and its 5K variant have different cytotoxic activities but identical stability176.
5.3.6. Protein aggregation This phenomenon is likely to happen upon exposure to destabilising conditions and
is related to a considerable number of neurodegenerative diseases, which has led to extensive research nowadays. Amyloid and pre‐fibrilar aggregates, as well as small oligomers from partially or fully unfolded proteins can turn cytotoxic and have in fact been pointed as the origin of Alzheimer, Parkinson or Creutzfeld‐Jakob syndrome. Aggregations occur in multiple ways and variable time according to external conditions. Changes in protein conformation (oligomer formation), nucleation or aggregate growth are mere examples177.
The artificial oligomerisation of RNase A by an interchange of N and C‐extremes
yields linear or cyclic multimers with new antitumoural and spermatogenic properties178. BS‐RNase multimers also favour the interaction with the cell surface and subsequently enhanced autophagic cell death in pancreas cancer cells179. Upon thermal unfolding, RNase A can also undergo aggregation as revealed by non‐
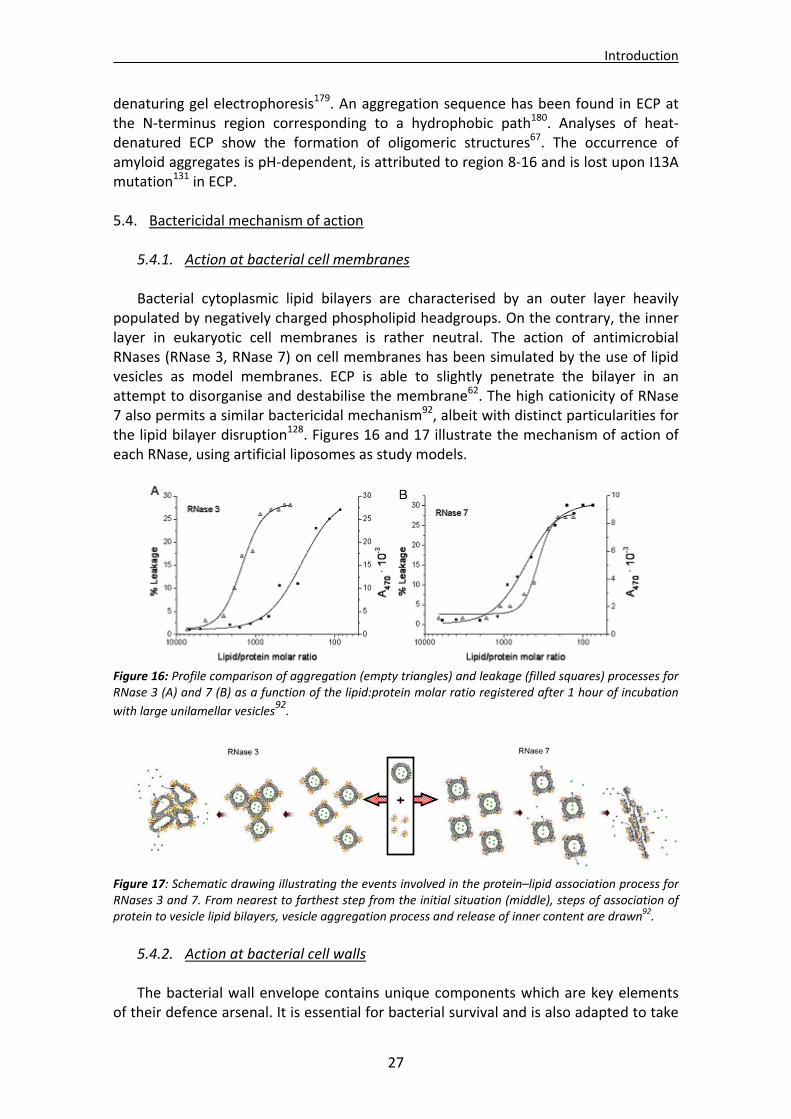
Introduction
27
denaturing gel electrophoresis179. An aggregation sequence has been found in ECP at the N‐terminus region corresponding to a hydrophobic path180. Analyses of heat‐denatured ECP show the formation of oligomeric structures67. The occurrence of amyloid aggregates is pH‐dependent, is attributed to region 8‐16 and is lost upon I13A mutation131 in ECP.
5.4. Bactericidal mechanism of action 5.4.1. Action at bacterial cell membranes Bacterial cytoplasmic lipid bilayers are characterised by an outer layer heavily
populated by negatively charged phospholipid headgroups. On the contrary, the inner layer in eukaryotic cell membranes is rather neutral. The action of antimicrobial RNases (RNase 3, RNase 7) on cell membranes has been simulated by the use of lipid vesicles as model membranes. ECP is able to slightly penetrate the bilayer in an attempt to disorganise and destabilise the membrane62. The high cationicity of RNase 7 also permits a similar bactericidal mechanism92, albeit with distinct particularities for the lipid bilayer disruption128. Figures 16 and 17 illustrate the mechanism of action of each RNase, using artificial liposomes as study models.
Figure 16: Profile comparison of aggregation (empty triangles) and leakage (filled squares) processes for RNase 3 (A) and 7 (B) as a function of the lipid:protein molar ratio registered after 1 hour of incubation
with large unilamellar vesicles92.
Figure 17: Schematic drawing illustrating the events involved in the protein–lipid association process for RNases 3 and 7. From nearest to farthest step from the initial situation (middle), steps of association of protein to vesicle lipid bilayers, vesicle aggregation process and release of inner content are drawn92.
5.4.2. Action at bacterial cell walls The bacterial wall envelope contains unique components which are key elements
of their defence arsenal. It is essential for bacterial survival and is also adapted to take
Introduction
28
up nutrients, exclude certain toxic compounds and may help in bacterial adherence to surfaces. Its native characteristic motifs are recognised by the host innate immune system. A striking similarity in eukaryotic defence systems suggests a common evolutionary origin. In any case, the different molecular structures are essential for the morphology and function of bacteria and are recognised by eukaryotic hosts17.
Wall structure of Gram‐negative species Gram‐negative bacteria envelopes are composed of a thin peptidoglycan layer, covered by the outer membrane and an outer lipopolysaccharide (LPS) layer (Figure 18). A periplasmic space is created between the peptidoglycan wall and the outer membrane. LPS are phosphorylated glycolipids which are unique to these bacteria and cover the outer membrane. This polar external protecting envelope excludes the passage of hydrophobic compounds to the bacteria cell. The outer membrane is a highly permeable lipid bilayer whose phospholipid composition (mostly phosphatidylethanolamine) differs highly from that of the cytoplasmic membrane. It also features proteins called porins which form pores that allow the passive traffic of small hydrophobic molecules17. A high affinity of ECP for LPS has been reported181.
Cationicity of antimicrobial peptides allows an electrostatic interaction with negatively charged membrane wall and a resulting killing activity. The detection of microbial motifs is a key event in bactericidal mechanism. For LPS in Gram‐negative bacteria, peptide‐LPS complexes can occur and be held together by Mg2+ and Ca2+ ions. LPS show more affinity for cationic peptides than for divalent ions. Their displacement on the surface causes a local disturbance, alters the normal barrier properties and facilitates the entrance of the peptides. Consequently, the higher the LPS binding capacity is, the more likely peptide aggregation and final bacteria killing are. Conversely, a tight packing of the acyl chain would offer more resistance to lysis, which is regarded as an important protection barrier17.
Wall structure of Gram‐positive species Much thicker Gram‐positive bacteria walls are made of a network of cross‐linked peptidoglycans (PGN), teichoic acids (TAs) and wall‐associated protein (Figure 19). PGN represent up to 90% of the cell wall and its layer is often referred as murein. PGN layers are built of a polymer strand of N‐acetylglucosamine (NAG) and N‐acetylmuramic acid (NAM), cross‐linked by short heterogeneous peptides to a variable extent according to cell phase and species. Together with TAs, PGN define the polyelectrolyte wall properties. TAs are long polyanionic structures made of polyglicerolphosphate and polyalcohols which can be either covalently linked to the peptidoglycans (wall teichoic acids or WTA, 40‐60 residues long) or inserted into the inner membrane with a glycolipid root (lipoteichoic acids or LTA, 5‐50 residues long). They are considered an additional barrier for antimicrobial proteins and peptides as they may modify the electromechanical properties of the murein wall17. In Gram‐positive bacteria the solid PGN protection barrier can show a considerable diversity in the peptide moiety. Absent in eukaryotic organisms, they are a unique component of bacterial wall and therefore an excellent target for the innate immune system. Binding to the PGN layer can be a direct mechanism for bactericidal or
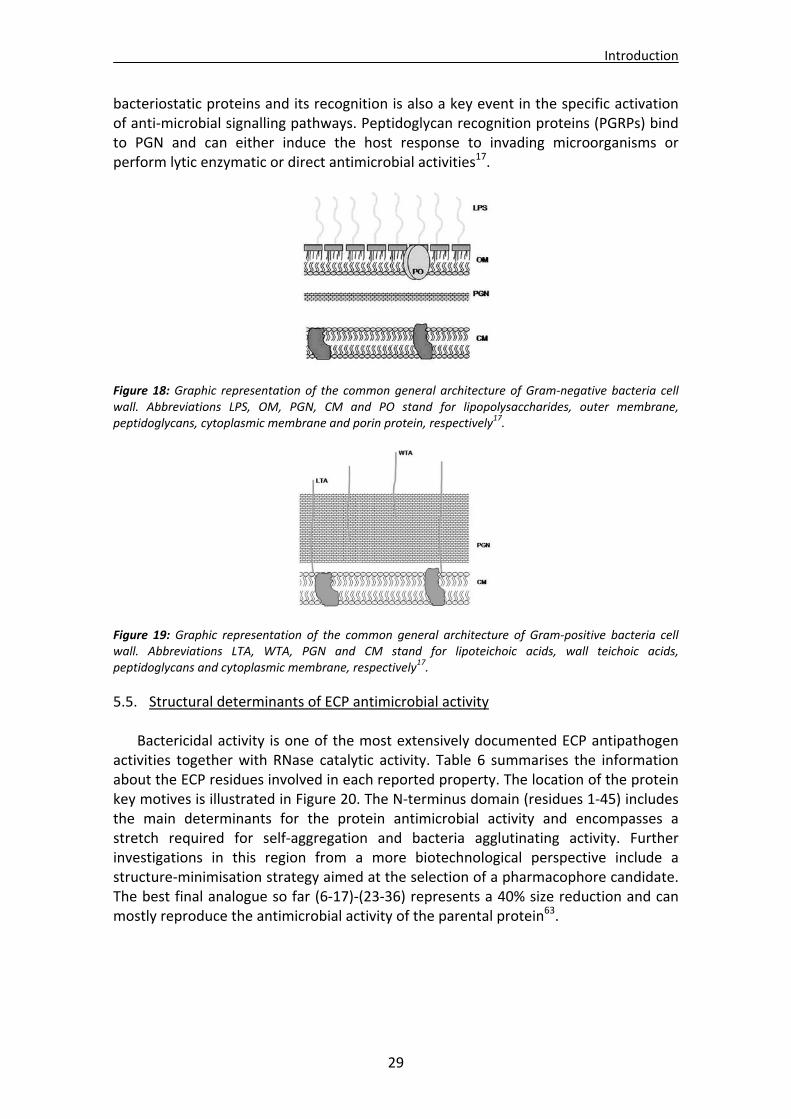
Introduction
29
bacteriostatic proteins and its recognition is also a key event in the specific activation of anti‐microbial signalling pathways. Peptidoglycan recognition proteins (PGRPs) bind to PGN and can either induce the host response to invading microorganisms or perform lytic enzymatic or direct antimicrobial activities17.
Figure 18: Graphic representation of the common general architecture of Gram‐negative bacteria cell wall. Abbreviations LPS, OM, PGN, CM and PO stand for lipopolysaccharides, outer membrane, peptidoglycans, cytoplasmic membrane and porin protein, respectively17.
Figure 19: Graphic representation of the common general architecture of Gram‐positive bacteria cell wall. Abbreviations LTA, WTA, PGN and CM stand for lipoteichoic acids, wall teichoic acids, peptidoglycans and cytoplasmic membrane, respectively17.
5.5. Structural determinants of ECP antimicrobial activity
Bactericidal activity is one of the most extensively documented ECP antipathogen activities together with RNase catalytic activity. Table 6 summarises the information about the ECP residues involved in each reported property. The location of the protein key motives is illustrated in Figure 20. The N‐terminus domain (residues 1‐45) includes the main determinants for the protein antimicrobial activity and encompasses a stretch required for self‐aggregation and bacteria agglutinating activity. Further investigations in this region from a more biotechnological perspective include a structure‐minimisation strategy aimed at the selection of a pharmacophore candidate. The best final analogue so far (6‐17)‐(23‐36) represents a 40% size reduction and can mostly reproduce the antimicrobial activity of the parental protein63.
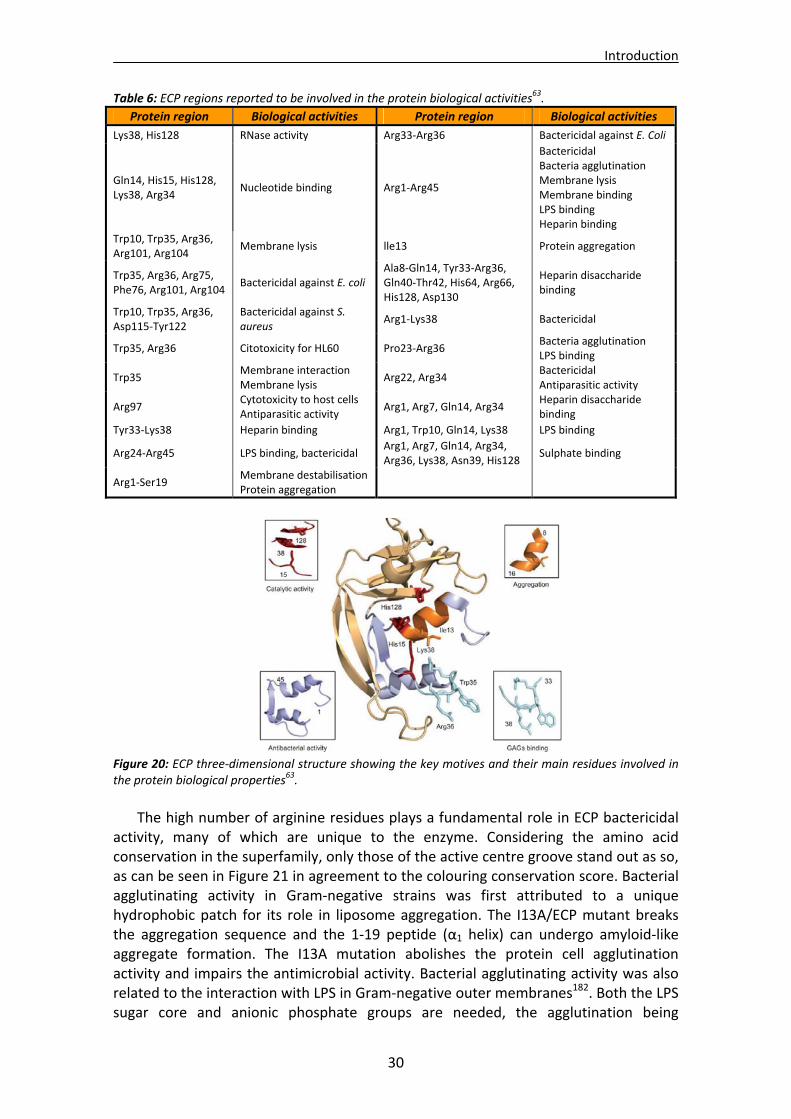
Introduction
30
Figure 20: ECP three‐dimensional structure showing the key motives and their main residues involved in the protein biological properties63.
The high number of arginine residues plays a fundamental role in ECP bactericidal
activity, many of which are unique to the enzyme. Considering the amino acid conservation in the superfamily, only those of the active centre groove stand out as so, as can be seen in Figure 21 in agreement to the colouring conservation score. Bacterial agglutinating activity in Gram‐negative strains was first attributed to a unique hydrophobic patch for its role in liposome aggregation. The I13A/ECP mutant breaks the aggregation sequence and the 1‐19 peptide (α1 helix) can undergo amyloid‐like aggregate formation. The I13A mutation abolishes the protein cell agglutination activity and impairs the antimicrobial activity. Bacterial agglutinating activity was also related to the interaction with LPS in Gram‐negative outer membranes182. Both the LPS sugar core and anionic phosphate groups are needed, the agglutination being
Table 6: ECP regions reported to be involved in the protein biological activities63.
Protein region Biological activities Protein region Biological activities
Lys38, His128 RNase activity Arg33‐Arg36 Bactericidal against E. Coli
Gln14, His15, His128, Lys38, Arg34
Nucleotide binding Arg1‐Arg45
Bactericidal Bacteria agglutination Membrane lysis Membrane binding LPS binding Heparin binding
Trp10, Trp35, Arg36, Arg101, Arg104
Membrane lysis lle13 Protein aggregation
Trp35, Arg36, Arg75, Phe76, Arg101, Arg104
Bactericidal against E. coli Ala8‐Gln14, Tyr33‐Arg36, Gln40‐Thr42, His64, Arg66, His128, Asp130
Heparin disaccharide binding
Trp10, Trp35, Arg36, Asp115‐Tyr122
Bactericidal against S. aureus
Arg1‐Lys38 Bactericidal
Trp35, Arg36 Citotoxicity for HL60 Pro23‐Arg36 Bacteria agglutination LPS binding
Trp35 Membrane interaction Membrane lysis
Arg22, Arg34 Bactericidal Antiparasitic activity
Arg97 Cytotoxicity to host cells Antiparasitic activity
Arg1, Arg7, Gln14, Arg34 Heparin disaccharide binding
Tyr33‐Lys38 Heparin binding Arg1, Trp10, Gln14, Lys38 LPS binding
Arg24‐Arg45 LPS binding, bactericidal Arg1, Arg7, Gln14, Arg34, Arg36, Lys38, Asn39, His128
Sulphate binding
Arg1‐Ser19 Membrane destabilisation Protein aggregation
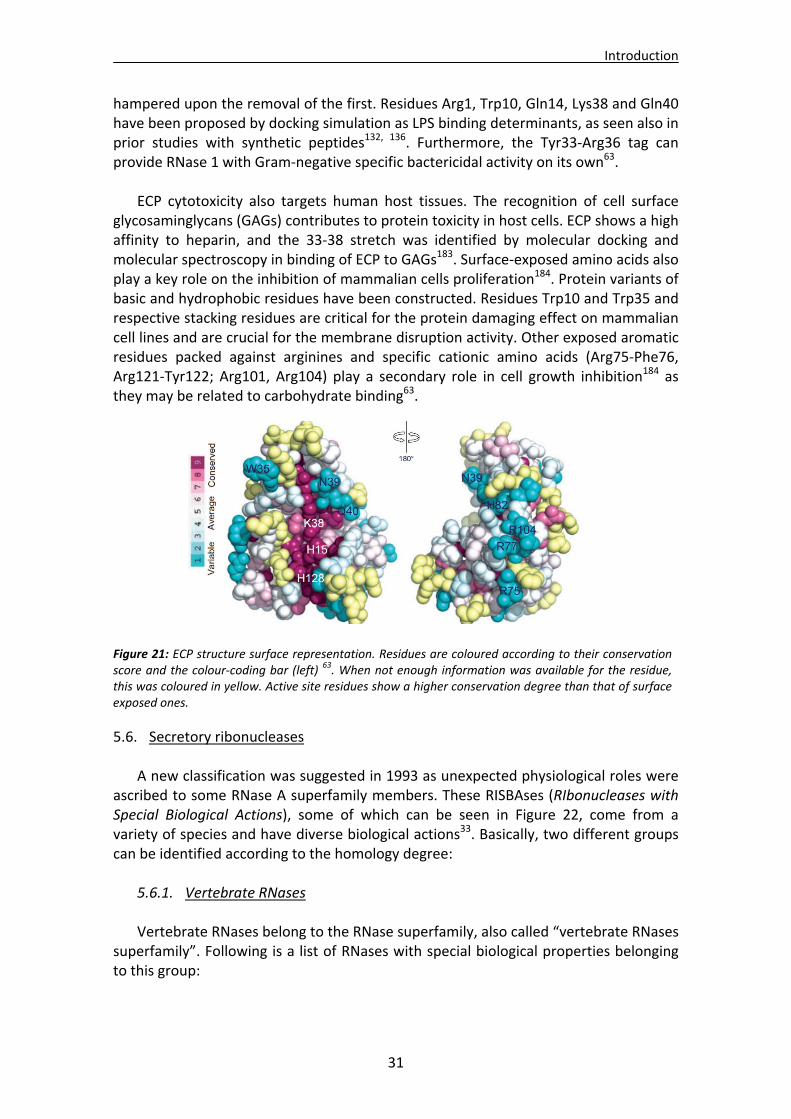
Introduction
31
hampered upon the removal of the first. Residues Arg1, Trp10, Gln14, Lys38 and Gln40 have been proposed by docking simulation as LPS binding determinants, as seen also in prior studies with synthetic peptides132, 136. Furthermore, the Tyr33‐Arg36 tag can provide RNase 1 with Gram‐negative specific bactericidal activity on its own63.
ECP cytotoxicity also targets human host tissues. The recognition of cell surface
glycosaminglycans (GAGs) contributes to protein toxicity in host cells. ECP shows a high affinity to heparin, and the 33‐38 stretch was identified by molecular docking and molecular spectroscopy in binding of ECP to GAGs183. Surface‐exposed amino acids also play a key role on the inhibition of mammalian cells proliferation184. Protein variants of basic and hydrophobic residues have been constructed. Residues Trp10 and Trp35 and respective stacking residues are critical for the protein damaging effect on mammalian cell lines and are crucial for the membrane disruption activity. Other exposed aromatic residues packed against arginines and specific cationic amino acids (Arg75‐Phe76, Arg121‐Tyr122; Arg101, Arg104) play a secondary role in cell growth inhibition184 as they may be related to carbohydrate binding63.
Figure 21: ECP structure surface representation. Residues are coloured according to their conservation score and the colour‐coding bar (left)
63. When not enough information was available for the residue, this was coloured in yellow. Active site residues show a higher conservation degree than that of surface exposed ones.
5.6. Secretory ribonucleases
A new classification was suggested in 1993 as unexpected physiological roles were ascribed to some RNase A superfamily members. These RISBAses (RIbonucleases with Special Biological Actions), some of which can be seen in Figure 22, come from a variety of species and have diverse biological actions33. Basically, two different groups can be identified according to the homology degree:
5.6.1. Vertebrate RNases
Vertebrate RNases belong to the RNase superfamily, also called “vertebrate RNases superfamily”. Following is a list of RNases with special biological properties belonging to this group:
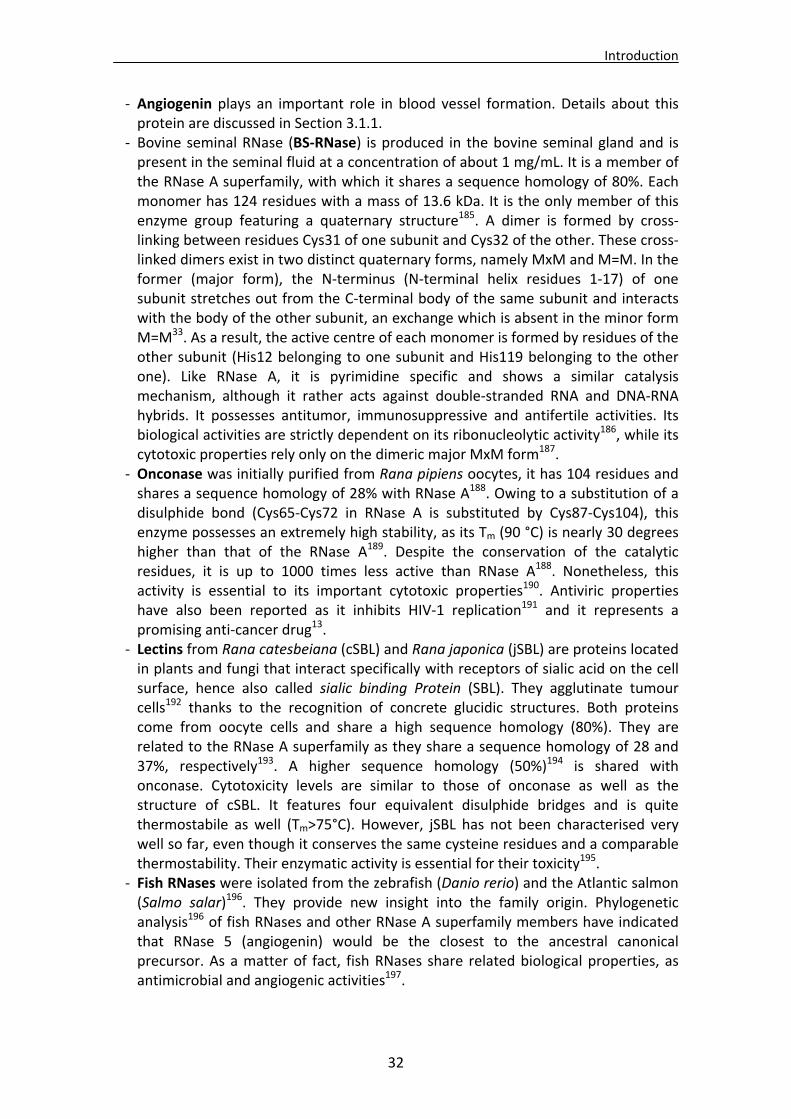
Introduction
32
‐ Angiogenin plays an important role in blood vessel formation. Details about this protein are discussed in Section 3.1.1.
‐ Bovine seminal RNase (BS‐RNase) is produced in the bovine seminal gland and is present in the seminal fluid at a concentration of about 1 mg/mL. It is a member of the RNase A superfamily, with which it shares a sequence homology of 80%. Each monomer has 124 residues with a mass of 13.6 kDa. It is the only member of this enzyme group featuring a quaternary structure185. A dimer is formed by cross‐linking between residues Cys31 of one subunit and Cys32 of the other. These cross‐linked dimers exist in two distinct quaternary forms, namely MxM and M=M. In the former (major form), the N‐terminus (N‐terminal helix residues 1‐17) of one subunit stretches out from the C‐terminal body of the same subunit and interacts with the body of the other subunit, an exchange which is absent in the minor form M=M33. As a result, the active centre of each monomer is formed by residues of the other subunit (His12 belonging to one subunit and His119 belonging to the other one). Like RNase A, it is pyrimidine specific and shows a similar catalysis mechanism, although it rather acts against double‐stranded RNA and DNA‐RNA hybrids. It possesses antitumor, immunosuppressive and antifertile activities. Its biological activities are strictly dependent on its ribonucleolytic activity186, while its cytotoxic properties rely only on the dimeric major MxM form187.
‐ Onconase was initially purified from Rana pipiens oocytes, it has 104 residues and shares a sequence homology of 28% with RNase A188. Owing to a substitution of a disulphide bond (Cys65‐Cys72 in RNase A is substituted by Cys87‐Cys104), this enzyme possesses an extremely high stability, as its Tm (90 °C) is nearly 30 degrees higher than that of the RNase A189. Despite the conservation of the catalytic residues, it is up to 1000 times less active than RNase A188. Nonetheless, this activity is essential to its important cytotoxic properties190. Antiviric properties have also been reported as it inhibits HIV‐1 replication191 and it represents a promising anti‐cancer drug13.
‐ Lectins from Rana catesbeiana (cSBL) and Rana japonica (jSBL) are proteins located in plants and fungi that interact specifically with receptors of sialic acid on the cell surface, hence also called sialic binding Protein (SBL). They agglutinate tumour cells192 thanks to the recognition of concrete glucidic structures. Both proteins come from oocyte cells and share a high sequence homology (80%). They are related to the RNase A superfamily as they share a sequence homology of 28 and 37%, respectively193. A higher sequence homology (50%)194 is shared with onconase. Cytotoxicity levels are similar to those of onconase as well as the structure of cSBL. It features four equivalent disulphide bridges and is quite thermostabile as well (Tm>75°C). However, jSBL has not been characterised very well so far, even though it conserves the same cysteine residues and a comparable thermostability. Their enzymatic activity is essential for their toxicity195.
‐ Fish RNases were isolated from the zebrafish (Danio rerio) and the Atlantic salmon (Salmo salar)196. They provide new insight into the family origin. Phylogenetic analysis196 of fish RNases and other RNase A superfamily members have indicated that RNase 5 (angiogenin) would be the closest to the ancestral canonical precursor. As a matter of fact, fish RNases share related biological properties, as antimicrobial and angiogenic activities197.
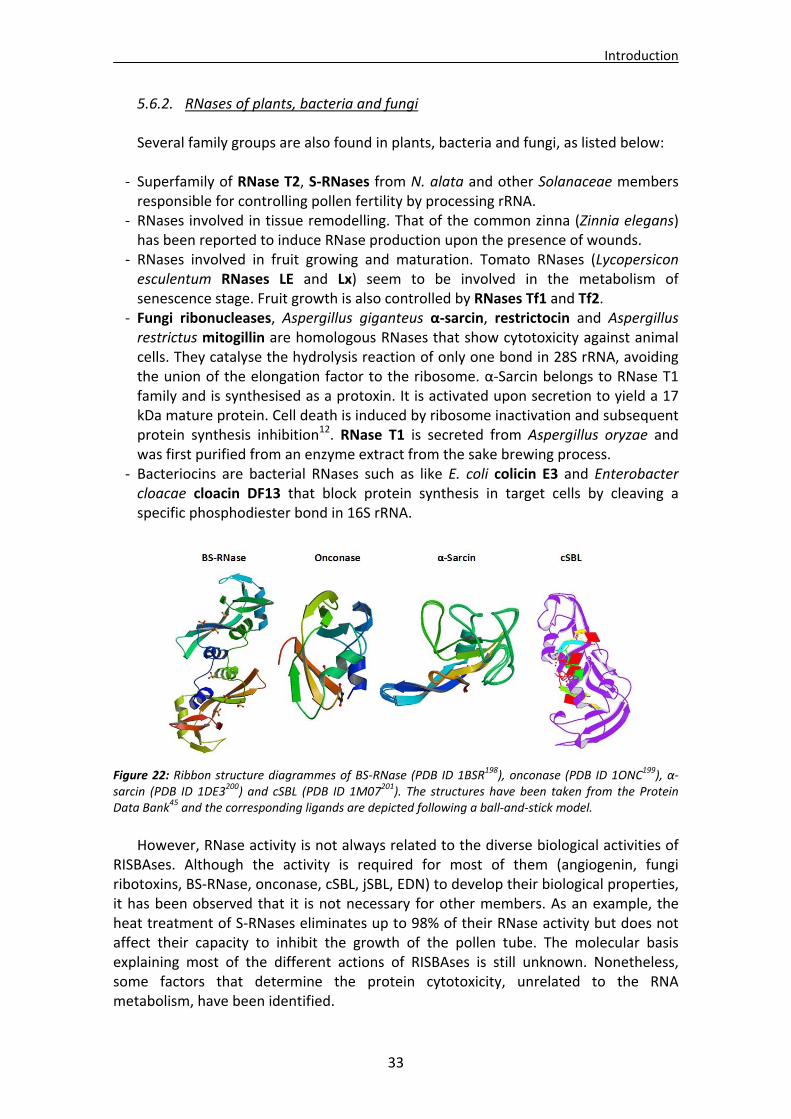
Introduction
33
5.6.2. RNases of plants, bacteria and fungi
Several family groups are also found in plants, bacteria and fungi, as listed below: ‐ Superfamily of RNase T2, S‐RNases from N. alata and other Solanaceae members responsible for controlling pollen fertility by processing rRNA.
‐ RNases involved in tissue remodelling. That of the common zinna (Zinnia elegans) has been reported to induce RNase production upon the presence of wounds.
‐ RNases involved in fruit growing and maturation. Tomato RNases (Lycopersicon esculentum RNases LE and Lx) seem to be involved in the metabolism of senescence stage. Fruit growth is also controlled by RNases Tf1 and Tf2.
‐ Fungi ribonucleases, Aspergillus giganteus α‐sarcin, restrictocin and Aspergillus restrictus mitogillin are homologous RNases that show cytotoxicity against animal cells. They catalyse the hydrolysis reaction of only one bond in 28S rRNA, avoiding the union of the elongation factor to the ribosome. α‐Sarcin belongs to RNase T1 family and is synthesised as a protoxin. It is activated upon secretion to yield a 17 kDa mature protein. Cell death is induced by ribosome inactivation and subsequent protein synthesis inhibition12. RNase T1 is secreted from Aspergillus oryzae and was first purified from an enzyme extract from the sake brewing process.
‐ Bacteriocins are bacterial RNases such as like E. coli colicin E3 and Enterobacter cloacae cloacin DF13 that block protein synthesis in target cells by cleaving a specific phosphodiester bond in 16S rRNA.
Figure 22: Ribbon structure diagrammes of BS‐RNase (PDB ID 1BSR198), onconase (PDB ID 1ONC199), α‐sarcin (PDB ID 1DE3200) and cSBL (PDB ID 1M07201). The structures have been taken from the Protein Data Bank45 and the corresponding ligands are depicted following a ball‐and‐stick model.
However, RNase activity is not always related to the diverse biological activities of
RISBAses. Although the activity is required for most of them (angiogenin, fungi ribotoxins, BS‐RNase, onconase, cSBL, jSBL, EDN) to develop their biological properties, it has been observed that it is not necessary for other members. As an example, the heat treatment of S‐RNases eliminates up to 98% of their RNase activity but does not affect their capacity to inhibit the growth of the pollen tube. The molecular basis explaining most of the different actions of RISBAses is still unknown. Nonetheless, some factors that determine the protein cytotoxicity, unrelated to the RNA metabolism, have been identified.

Aims of the thesis
35
AIMS OF THE THESIS
1. Screening and optimisation of crystallisation conditions suitable for the generation of crystals of RNase A, RNase 3/ECP, RNase 6 and RNase 7, as well as respective mutants, so as to carry out structural‐functional studies.
2. Evaluation of interaction with potential ligand molecules such as nucleotide
substrate analogues and bacteria cell wall derivatives by either cocrystallisation or soaking experiments.
3. In order to establish general patterns of substrate recognition by RNases, a statistical analysis has been carried out with nucleotide complexes and then compared to selected representative members of the RNase A family. A comparison with another secreted cytotoxic endoribonuclease superfamily, microbial T1 RNases, has allowed the identification of common features and peculiarities that rule their substrate recognition and specificity.
4. Three‐dimensional structural determination of a double mutant RNase A (RNase
A/H7H10), which creates a second catalytic site at the secondary phosphate binding site p2, with the objective to identify what changes may happen upon this double mutation in subsite p2 and vicinal main active site environment that can be related to its different catalytic efficiency in comparison to native RNase A.
5. Three‐dimensional structural determination of mutant and native RNase 3/ECP
crystal structures at high resolution with the aim to analyse the active centre and compare the two obtained crystal packing forms.
6. Three‐dimensional structural determination of an RNase 6 crystal structure, the
first one for the enzyme, with the aim to set a structural basis that is useful for further experiments with nucleotide ligands.
7. A comparison of sulphate recognition subsites in RNase A, RNase 3 and RNase 6
crystal complexes aimed at the identification of putative regions prone to host sulphated heterosaccharides or nucleotide substrate analogues.


CHAPTER 2 MATERIALS and METHODS

Materials and Methods
39
This chapter describes the various methodologies carried out during this work. A first section dealing with a statistical analysis of nucleotide‐protein interactions is included. First, common methods in Molecular Biology are explained, followed by protein chemistry, functional characterisation and X‐ray crystallography experiments. 1. Equipment and chemical products
Unless otherwise indicated, chemical products for general purpose have been purchased with an analytical grade from Sigma Chemical Co. (USA). Glass and plastic materials (Erlenmeyer flasks, tubes, tips) were sterilised in an autoclave (120 °C, 20 min, 1.5 atm) before its use. Working solutions were prepared with deionised water (Millipore Corporation, USA), filtered with 0.22 μm pore filters (Merck Millipore, Ireland) and autoclaved if necessary. Bacteria cell strains and plasmids are kept, respectively, at ‐80 °C and ‐20 °C. 2. Statistical analysis of nucleotide protein complex structures
Nucleotides binding motifs were studied by a statistical analysis of nucleic acid–protein complexes202, 203 available at the Protein Data Bank. By the analysis of the recognition of nucleic acids by database of proteins, the modular architecture for bases, ribose and phosphate elements for each nucleotide building block was identified.
Overall recognition patterns for nucleotide binding proteins were inferred by
applying the analysis tools supplied by the online server PDBe Motif at the PDBe Data Base204. Protein complexes with nucleotide‐type ligands were selected in order to define the main interacting amino acids and the molecule pair binding pattern for each amino acid. Only those ligands mimicking potential RNA substrates were selected to obtain an adequate reference for the RNase binding mode.
An evolutionary study of conserved residues within the RNase A superfamily was
also evaluated with the CONSURF server205 to correlate with the key ligand interacting residues. The first fifty sequences for each superfamily member found at the Uniprot Protein Database were taken for ClustalW multiple sequence alignment. The server applies a colouring scaling code, from low to high evolutionary conservation, based on the ClustalW alignment.
Relevant ligand interaction distances were checked. Hydrogen bonds and van der
Waals interactions were counted and the main representative residues were listed. A generous cut‐off distance was chosen to account for the intrinsic marginal error within solved structure complexes and inherent side chain mobility. The percentage value of each type of interaction was then taken into account and only those statistically significant nucleotide‐type ligands were selected. The tendency of each amino acid to interact with each nucleotide building block was likewise investigated.
Materials and Methods
40
The statistical analysis of the nucleotide binding protein complexes is then applied to characterise the endonuclease‐type RNase A superfamily. RNase complexes were taken from the Protein Data Bank45, and the conserved interacting residues were then compared with the most common nucleotide binding patterns defined for all the database proteins. The available protein complexes with representative substrate analogues were overlapped and manually studied and common features were then depicted for recognition of each building block using RNase A as a reference. Moreover, docking experiments were carried out for RNase members lacking structural information63. Other more distant family members were also analysed, like onconase (Rana pipiens RNase), BS‐RNase (bovine seminal RNase) and fish homologous RNases. Complementary, microbial RNases were analysed as well for common features and peculiarities in substrate recognition. The analysed nucleotide complexes were classified so as to contour the substrate binding site architecture and residue conservation for both RNase superfamilies. 3. Basic experimental methods 3.1. Extraction of plasmidic DNA
Whereas RNase A was directly purchased from Sigma Aldrich Chemical Co. (USA),
ECP/RNase 3, RNase 6 and RNase 7, their respective mutants and also those of RNase A, have been expressed in E. coli cells –BL21(DE3) strain–. The protein enconding genes were inserted in a PET11c DNA vector behind the T7 promoter. This plasmid has been extracted using a GFX Micro Plasmid Prep Kit (Amersham Biosciences, UK). This kit is designed for the rapid extraction and purification of plasmid DNA from low volume E. coli cultures. Yields are typically 3‐6 μg of DNA per mL of culture, depending on the type of plasmid and strain.
Luria‐Bertani (LB) cultures of E. coli BL21(DE3) were used for plasmid DNA
(miniprep) extractions. LB cultures are prepared at a concentration of 25 g/L in deionised water following the Miller formula (10 g tryptone, 5 g yeast extract, 10 g NaCl) and autoclaved in a flask. The solution is allowed to cool down and swirled to ensure mixing. Ampicillin was used at a concentration of 0.1 mg/mL as a bacterial resistance marker and inoculated in the culture before its overnight growth at 37 °C and 250 rpm. Only cells with the antibiotic‐resistance gen inserted in the plasmid could grow in this culture. After extraction, plasmidic DNA was quantified at 260 nm with a NanoDrop™ 2000 UV‐Vis Spectrophotometer (Thermo Scientific, USA) and stored at ‐20 °C. The quantifications revealed sample protein concentrations of 40‐50 ng/μL.
E. coli BL21 strains are the most used hosts for protein expression from pET
recombinants and have the advantage of lacking lon and ompT proteases. Its genotype is F‐ompT hsdSB(rB
‐mB‐) gal dcm met (DE3), where DE3 indicates that the host is a
lysogen of λDE3 and therefore carries a chromosomal copy of the T7 RNA polymerase gene. Regarding the plasmid, pET11c (Novagen, EMD Biosciences, USA) is currently one of the most powerful expression plasmids as it allows a high‐level expression206 without signal peptide. This expression is modulated by the lacUV5 promoter, which
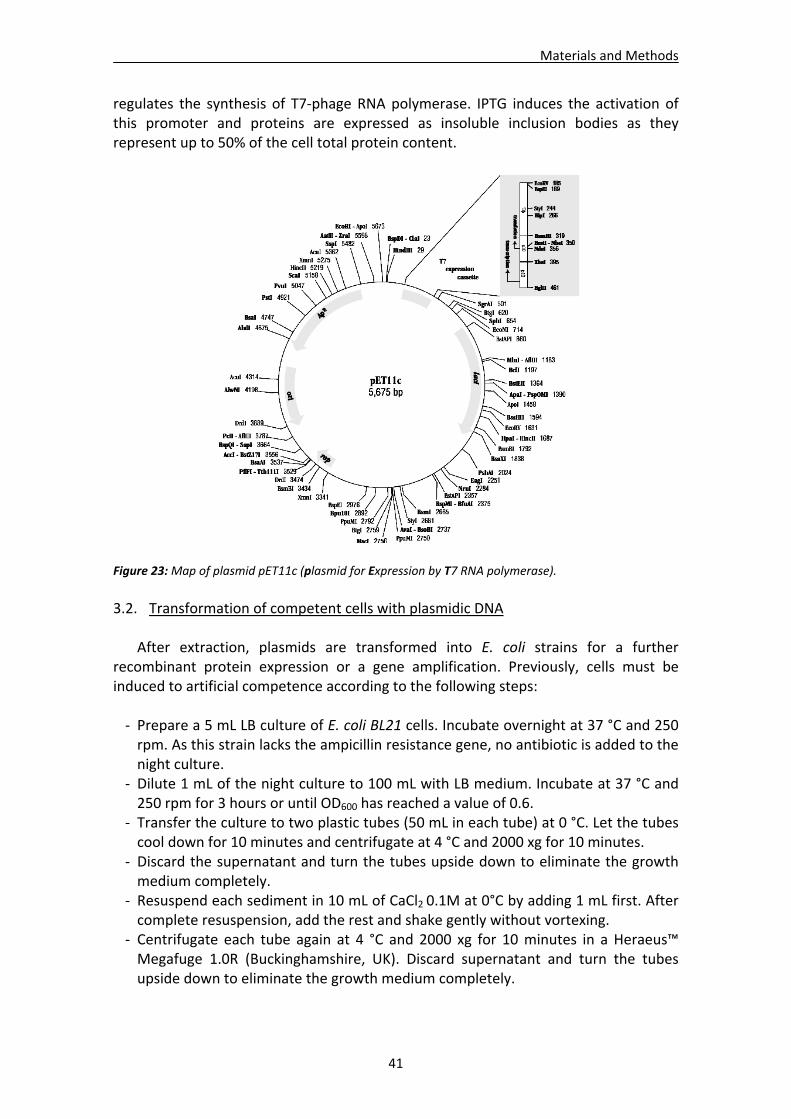
Materials and Methods
41
regulates the synthesis of T7‐phage RNA polymerase. IPTG induces the activation of this promoter and proteins are expressed as insoluble inclusion bodies as they represent up to 50% of the cell total protein content.
Figure 23: Map of plasmid pET11c (plasmid for Expression by T7 RNA polymerase).
3.2. Transformation of competent cells with plasmidic DNA
After extraction, plasmids are transformed into E. coli strains for a further
recombinant protein expression or a gene amplification. Previously, cells must be induced to artificial competence according to the following steps:
‐ Prepare a 5 mL LB culture of E. coli BL21 cells. Incubate overnight at 37 °C and 250 rpm. As this strain lacks the ampicillin resistance gene, no antibiotic is added to the night culture.
‐ Dilute 1 mL of the night culture to 100 mL with LB medium. Incubate at 37 °C and 250 rpm for 3 hours or until OD600 has reached a value of 0.6.
‐ Transfer the culture to two plastic tubes (50 mL in each tube) at 0 °C. Let the tubes cool down for 10 minutes and centrifugate at 4 °C and 2000 xg for 10 minutes.
‐ Discard the supernatant and turn the tubes upside down to eliminate the growth medium completely.
‐ Resuspend each sediment in 10 mL of CaCl2 0.1M at 0°C by adding 1 mL first. After complete resuspension, add the rest and shake gently without vortexing.
‐ Centrifugate each tube again at 4 °C and 2000 xg for 10 minutes in a Heraeus™ Megafuge 1.0R (Buckinghamshire, UK). Discard supernatant and turn the tubes upside down to eliminate the growth medium completely.
Materials and Methods
42
‐ Resuspend each sediment in 2 mL of CaCl2 0.1M at 0°C. Let the suspension at 0°C during 2‐4 hours for membranes to become permeable to plasmid DNA.
Transformation takes place now using the previously extracted plasmidic DNA.
‐ Add 5 μL of plasmidic DNA to a 200 μL aliquot of competent E. coli BL21 cells in a 1.5 mL tube (Eppendorf, DE). Mix gently and leave on ice for 30 minutes.
‐ Transfer the tube to a bath at 42 °C during 90 seconds. After that, put it back on ice for 1‐2 minutes.
‐ Add 800 μL of LB medium to the tube and incubate the culture at 37 °C and 200 rpm for 45 minutes. During growth, the antibiotic‐resistance marker within the plasmid is also expressed.
‐ Transfer 50 μL of the grown culture to LB‐Agar‐Amp plates (see preparation in table below). Smear in a zigzag pattern on the plate surface using a sterilised glass or plastic stick. The remaining culture can be likewise sown after centrifugation.
‐ Let the Petri dish absorb the culture for 15‐20 minutes, turn them upside down and incubate at 37 °C for 12‐20 hours.
‐ Cells that have uptaken the plasmidic DNA will have grown in the antibiotic containing Petri dish. Select one of the formed colonies for a final culture in 1 mL containing ampicillin at 0.1 mg/mL. Let the culture grow until OD600=0.6.
The culture can now be used for protein expression after adding IPTG to induce
expression (see Section 4.1) or storage as glycerol samples. For the latter, 100 μL of the culture are mixed with an identical volume of 30% glycerol and stored at ‐80 °C.
4. Methods in protein analysis 4.1. Recombinant protein expression and purification from inclusion bodies (IB)
Protein expression was carried out following a high‐performance, milligram‐scale
expression protocol207 in a prokaryotic system. The expression yields high quantities and the protein aggregates into inclusion bodies. Because RNase A and related family members are easy to solubilise and refold using appropriate buffers (see Table 8), inclusion body formation is not problematic. As a matter of fact, this process is beneficial as IB are easy to isolate and contain almost pure target protein. In addition, the unfolded RNase in IB lacks ribonucleolytic activity and thus cytotoxicity1. The procedures were performed with at least 2 L of total LB culture, even though buffer and solution volumes are always referred to 1 L.
Preparation of LB‐Agar+Amp plates 1. Prepare a 15 g/L agar solution in LB medium 2. Autoclave the solution and let it cool down to 60 °C approximately 3. Add the ampicillin at a final concentration of 0.1 mg/mL and pour 20 mL in each Petri dish. 4. Let Petri dishes cool down for 12 hours, turn them upside down to prevent from moisture and
store at 4 °C.

Materials and Methods
43
4.1.1. Expression procedure in E. coli ‐ Inoculate E. coli cells –BL21 (DE3) strain, transformed with pET11c plasmid including the corresponding RNase gene– into 20 mL of autoclaved LB culture containing 40 μL of Amp 100 mg/mL (final concentration 100 μg/mL). Incubate overnight at 37 °C and 250 rpm.
‐ Inoculate 10 mL of this culture into 900 mL of autoclaved TB medium. Add 100 mL of phosphate buffer and 4 mL of Amp 100 mg/mL (final concentration 400 μg/mL). Incubate at 37 °C and 250 rpm until OD600 = 0.6 (2‐3 hours).
‐ Induce the expression by adding 1 mL of 1M IPTG (final concentration 1 mM). Incubate for 3‐4 hours.
‐ Centrifugate the grown culture at 4 °C and 10000 rpm for 10 minutes using a JLA 16250 rotor in an Avanti™ J26‐XP centrifuge (Beckman‐Coulter, USA). Discard supernatant and either store the IB culture at ‐20 ºC or proceed immediately to the next step.
4.1.2. Protein solubilisation and refolding
‐ Resuspend the sediment in 15 mL of buffer 1 (see Table 8) carefully (avoid the formation of foam). Afterwards, a thermal shock treatment is carried out consisting of three cycles of liquid nitrogen freezing and 37 °C bath thawing, 10 minutes each one, and 10‐minute sonication for cell lysis in a Benson™ S450 device (Danbury, USA). A change in colour is noticed as the suspension progressively changes from milky white to slightly dark brown. Centrifugate at 4 °C and 14000 rpm for 10 minutes in the aforementioned centrifuge, discard supernatant and store at ‐20 °C or proceed immediately to the next step.
‐ Resuspend the new pellet in 10 mL of buffer 2 (see Table 8) and mix until complete solubilisation. Centrifugate at 4°C and 20000 xg for 30 minutes using a 25.50 rotor. Discard supernatant and store pellet at ‐20 °C.
‐ Resuspend the pellet in 15 mL of buffer 3 (see Table 8) successively in order to avoid foam formation. Add 0.3 g of reduced glutathione (GSH) and adjust pH by adding solid TRIS until it reaches a value of 8.5. The existence of guanidine (chaotropic agent) and GSH make inclusion bodies solubilise and protein denature completely208. Gently shake for two hours for a complete solubilisation and protein denaturalisation under a N2 atmosphere to avoid the air oxygen action. Finally, centrifuge at 4 °C and 16000 xg for 30 minutes using a 25.50 rotor. Save supernatant.
‐ Dilute the supernatant 100 times approximately in the refolding buffer (see composition in Table 8). The supernatant must be added dropwise and very slowly (5 mL every 15 minutes) and the buffer must be previously cooled down to 4 °C. A
Table 7: Preparation of TB and phosphate buffers for protein expression
TB broth Phosphate buffers
Tryptone 12 g KH2PO4 ( 0.17 M) 2.31 g
Yeast extract 24 g K2HPO4 ( 0.72 M) 12.45 g
Glycerol 100% 4 mL Deionised water up to 100 mL Deionised water up to 900 mL
TB medium is prepared in a flask which is finally autoclaved. Cool down before use.
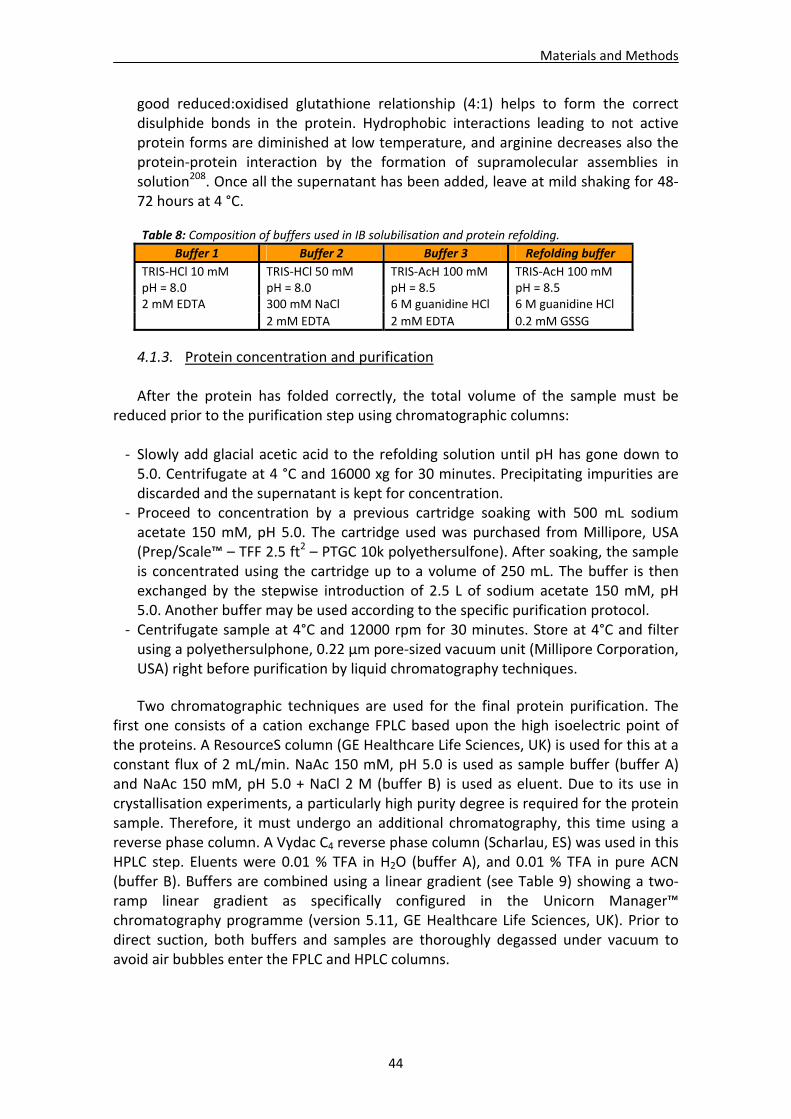
Materials and Methods
44
good reduced:oxidised glutathione relationship (4:1) helps to form the correct disulphide bonds in the protein. Hydrophobic interactions leading to not active protein forms are diminished at low temperature, and arginine decreases also the protein‐protein interaction by the formation of supramolecular assemblies in solution208. Once all the supernatant has been added, leave at mild shaking for 48‐72 hours at 4 °C.
4.1.3. Protein concentration and purification
After the protein has folded correctly, the total volume of the sample must be reduced prior to the purification step using chromatographic columns:
‐ Slowly add glacial acetic acid to the refolding solution until pH has gone down to 5.0. Centrifugate at 4 °C and 16000 xg for 30 minutes. Precipitating impurities are discarded and the supernatant is kept for concentration.
‐ Proceed to concentration by a previous cartridge soaking with 500 mL sodium acetate 150 mM, pH 5.0. The cartridge used was purchased from Millipore, USA (Prep/Scale™ – TFF 2.5 ft2 – PTGC 10k polyethersulfone). After soaking, the sample is concentrated using the cartridge up to a volume of 250 mL. The buffer is then exchanged by the stepwise introduction of 2.5 L of sodium acetate 150 mM, pH 5.0. Another buffer may be used according to the specific purification protocol.
‐ Centrifugate sample at 4°C and 12000 rpm for 30 minutes. Store at 4°C and filter using a polyethersulphone, 0.22 μm pore‐sized vacuum unit (Millipore Corporation, USA) right before purification by liquid chromatography techniques.
Two chromatographic techniques are used for the final protein purification. The first one consists of a cation exchange FPLC based upon the high isoelectric point of the proteins. A ResourceS column (GE Healthcare Life Sciences, UK) is used for this at a constant flux of 2 mL/min. NaAc 150 mM, pH 5.0 is used as sample buffer (buffer A) and NaAc 150 mM, pH 5.0 + NaCl 2 M (buffer B) is used as eluent. Due to its use in crystallisation experiments, a particularly high purity degree is required for the protein sample. Therefore, it must undergo an additional chromatography, this time using a reverse phase column. A Vydac C4 reverse phase column (Scharlau, ES) was used in this HPLC step. Eluents were 0.01 % TFA in H2O (buffer A), and 0.01 % TFA in pure ACN (buffer B). Buffers are combined using a linear gradient (see Table 9) showing a two‐ramp linear gradient as specifically configured in the Unicorn Manager™ chromatography programme (version 5.11, GE Healthcare Life Sciences, UK). Prior to direct suction, both buffers and samples are thoroughly degassed under vacuum to avoid air bubbles enter the FPLC and HPLC columns.
Table 8: Composition of buffers used in IB solubilisation and protein refolding.
Buffer 1 Buffer 2 Buffer 3 Refolding buffer
TRIS‐HCl 10 mM pH = 8.0
TRIS‐HCl 50 mM pH = 8.0
TRIS‐AcH 100 mM pH = 8.5
TRIS‐AcH 100 mM pH = 8.5
2 mM EDTA 300 mM NaCl 6 M guanidine HCl 6 M guanidine HCl
2 mM EDTA 2 mM EDTA 0.2 mM GSSG
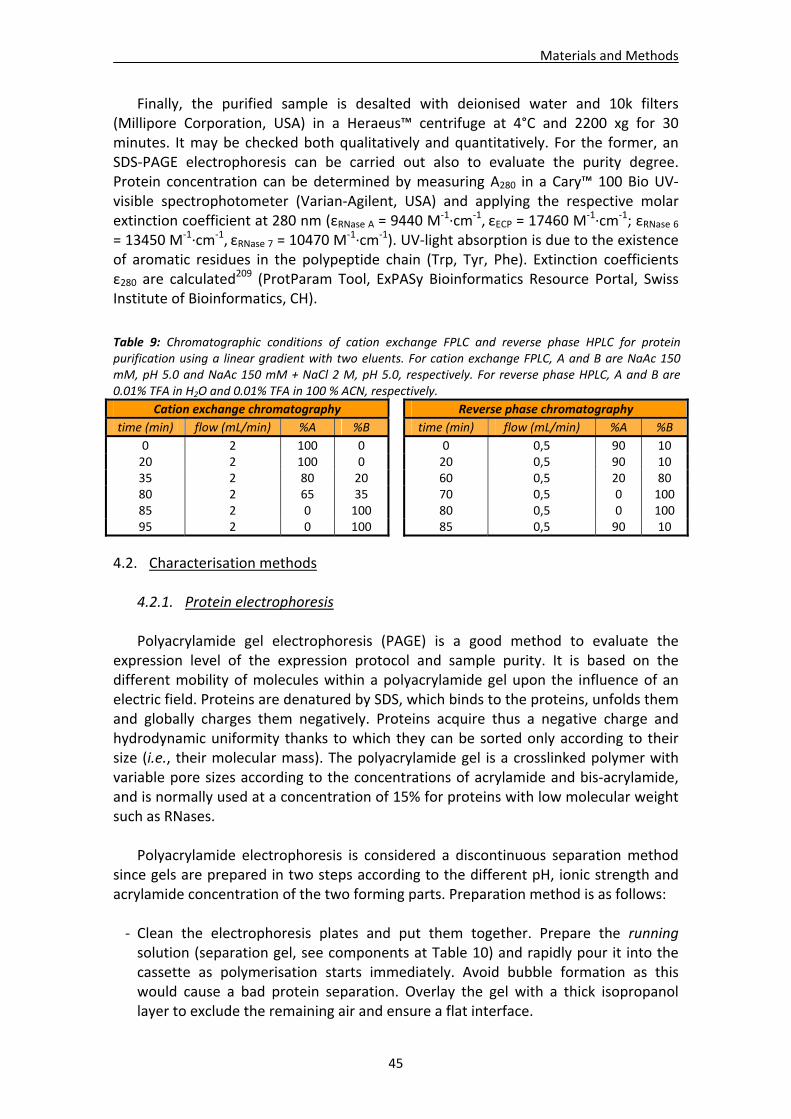
Materials and Methods
45
Finally, the purified sample is desalted with deionised water and 10k filters (Millipore Corporation, USA) in a Heraeus™ centrifuge at 4°C and 2200 xg for 30 minutes. It may be checked both qualitatively and quantitatively. For the former, an SDS‐PAGE electrophoresis can be carried out also to evaluate the purity degree. Protein concentration can be determined by measuring A280 in a Cary™ 100 Bio UV‐visible spectrophotometer (Varian‐Agilent, USA) and applying the respective molar extinction coefficient at 280 nm (εRNase A = 9440 M
‐1∙cm‐1, εECP = 17460 M‐1∙cm‐1; εRNase 6
= 13450 M‐1∙cm‐1, εRNase 7 = 10470 M‐1∙cm‐1). UV‐light absorption is due to the existence
of aromatic residues in the polypeptide chain (Trp, Tyr, Phe). Extinction coefficients ε280 are calculated
209 (ProtParam Tool, ExPASy Bioinformatics Resource Portal, Swiss Institute of Bioinformatics, CH).
4.2. Characterisation methods 4.2.1. Protein electrophoresis
Polyacrylamide gel electrophoresis (PAGE) is a good method to evaluate the
expression level of the expression protocol and sample purity. It is based on the different mobility of molecules within a polyacrylamide gel upon the influence of an electric field. Proteins are denatured by SDS, which binds to the proteins, unfolds them and globally charges them negatively. Proteins acquire thus a negative charge and hydrodynamic uniformity thanks to which they can be sorted only according to their size (i.e., their molecular mass). The polyacrylamide gel is a crosslinked polymer with variable pore sizes according to the concentrations of acrylamide and bis‐acrylamide, and is normally used at a concentration of 15% for proteins with low molecular weight such as RNases.
Polyacrylamide electrophoresis is considered a discontinuous separation method since gels are prepared in two steps according to the different pH, ionic strength and acrylamide concentration of the two forming parts. Preparation method is as follows: ‐ Clean the electrophoresis plates and put them together. Prepare the running solution (separation gel, see components at Table 10) and rapidly pour it into the cassette as polymerisation starts immediately. Avoid bubble formation as this would cause a bad protein separation. Overlay the gel with a thick isopropanol layer to exclude the remaining air and ensure a flat interface.
Table 9: Chromatographic conditions of cation exchange FPLC and reverse phase HPLC for protein purification using a linear gradient with two eluents. For cation exchange FPLC, A and B are NaAc 150 mM, pH 5.0 and NaAc 150 mM + NaCl 2 M, pH 5.0, respectively. For reverse phase HPLC, A and B are 0.01% TFA in H2O and 0.01% TFA in 100 % ACN, respectively.
Cation exchange chromatography Reverse phase chromatography
time (min) flow (mL/min) %A %B time (min) flow (mL/min) %A %B
0 2 100 0 0 0,5 90 10 20 2 100 0 20 0,5 90 10 35 2 80 20 60 0,5 20 80 80 2 65 35 70 0,5 0 100 85 2 0 100 80 0,5 0 100 95 2 0 100 85 0,5 90 10
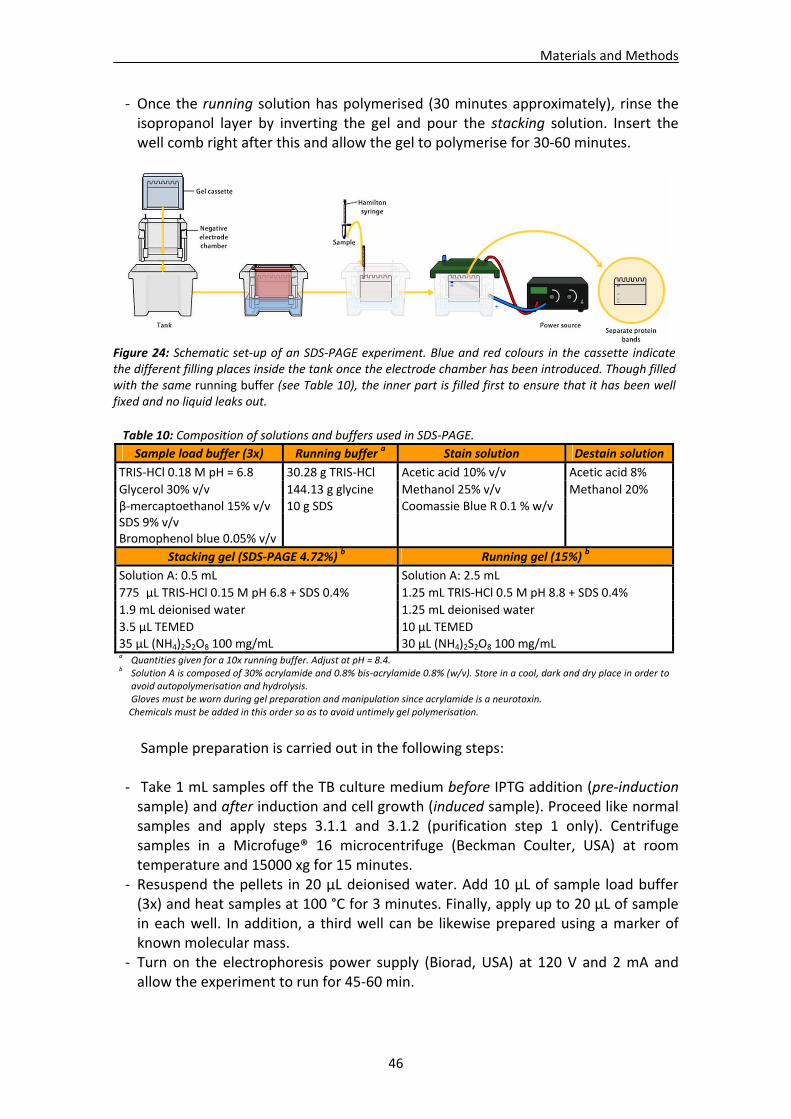
Materials and Methods
46
‐ Once the running solution has polymerised (30 minutes approximately), rinse the isopropanol layer by inverting the gel and pour the stacking solution. Insert the well comb right after this and allow the gel to polymerise for 30‐60 minutes.
Figure 24: Schematic set‐up of an SDS‐PAGE experiment. Blue and red colours in the cassette indicate the different filling places inside the tank once the electrode chamber has been introduced. Though filled with the same running buffer (see Table 10), the inner part is filled first to ensure that it has been well fixed and no liquid leaks out.
Sample preparation is carried out in the following steps:
‐ Take 1 mL samples off the TB culture medium before IPTG addition (pre‐induction sample) and after induction and cell growth (induced sample). Proceed like normal samples and apply steps 3.1.1 and 3.1.2 (purification step 1 only). Centrifuge samples in a Microfuge® 16 microcentrifuge (Beckman Coulter, USA) at room temperature and 15000 xg for 15 minutes.
‐ Resuspend the pellets in 20 μL deionised water. Add 10 μL of sample load buffer (3x) and heat samples at 100 °C for 3 minutes. Finally, apply up to 20 μL of sample in each well. In addition, a third well can be likewise prepared using a marker of known molecular mass.
‐ Turn on the electrophoresis power supply (Biorad, USA) at 120 V and 2 mA and allow the experiment to run for 45‐60 min.
Table 10: Composition of solutions and buffers used in SDS‐PAGE.
Sample load buffer (3x) Running buffer a Stain solution Destain solution
TRIS‐HCl 0.18 M pH = 6.8 30.28 g TRIS‐HCl Acetic acid 10% v/v Acetic acid 8%
Glycerol 30% v/v 144.13 g glycine Methanol 25% v/v Methanol 20%
β‐mercaptoethanol 15% v/v 10 g SDS Coomassie Blue R 0.1 % w/v SDS 9% v/v Bromophenol blue 0.05% v/v
Stacking gel (SDS‐PAGE 4.72%) b Running gel (15%) b
Solution A: 0.5 mL Solution A: 2.5 mL
775 μL TRIS‐HCl 0.15 M pH 6.8 + SDS 0.4% 1.25 mL TRIS‐HCl 0.5 M pH 8.8 + SDS 0.4%
1.9 mL deionised water 1.25 mL deionised water
3.5 μL TEMED 10 μL TEMED
35 μL (NH4)2S2O8 100 mg/mL 30 μL (NH4)2S2O8 100 mg/mL a Quantities given for a 10x running buffer. Adjust at pH = 8.4.
b Solution A is composed of 30% acrylamide and 0.8% bis‐acrylamide 0.8% (w/v). Store in a cool, dark and dry place in order to avoid autopolymerisation and hydrolysis. Gloves must be worn during gel preparation and manipulation since acrylamide is a neurotoxin.
Chemicals must be added in this order so as to avoid untimely gel polymerisation.
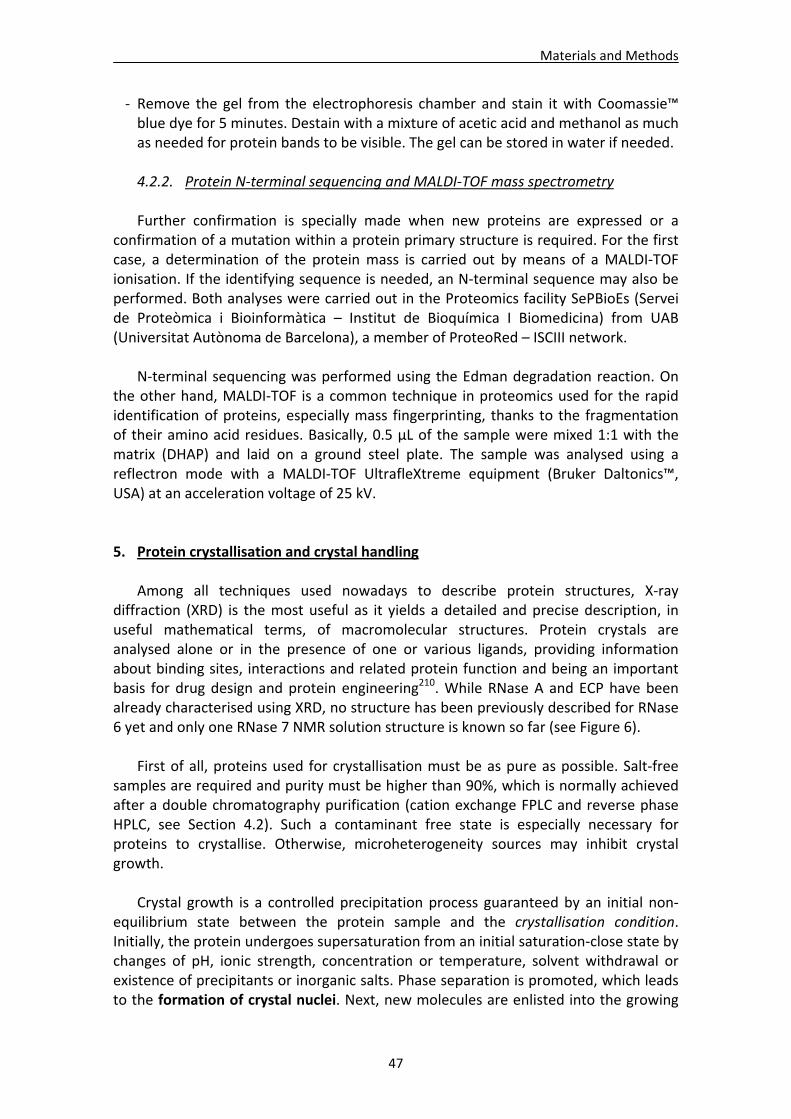
Materials and Methods
47
‐ Remove the gel from the electrophoresis chamber and stain it with Coomassie™ blue dye for 5 minutes. Destain with a mixture of acetic acid and methanol as much as needed for protein bands to be visible. The gel can be stored in water if needed.
4.2.2. Protein N‐terminal sequencing and MALDI‐TOF mass spectrometry
Further confirmation is specially made when new proteins are expressed or a
confirmation of a mutation within a protein primary structure is required. For the first case, a determination of the protein mass is carried out by means of a MALDI‐TOF ionisation. If the identifying sequence is needed, an N‐terminal sequence may also be performed. Both analyses were carried out in the Proteomics facility SePBioEs (Servei de Proteòmica i Bioinformàtica – Institut de Bioquímica I Biomedicina) from UAB (Universitat Autònoma de Barcelona), a member of ProteoRed – ISCIII network.
N‐terminal sequencing was performed using the Edman degradation reaction. On
the other hand, MALDI‐TOF is a common technique in proteomics used for the rapid identification of proteins, especially mass fingerprinting, thanks to the fragmentation of their amino acid residues. Basically, 0.5 μL of the sample were mixed 1:1 with the matrix (DHAP) and laid on a ground steel plate. The sample was analysed using a reflectron mode with a MALDI‐TOF UltrafleXtreme equipment (Bruker Daltonics™, USA) at an acceleration voltage of 25 kV.
5. Protein crystallisation and crystal handling
Among all techniques used nowadays to describe protein structures, X‐ray diffraction (XRD) is the most useful as it yields a detailed and precise description, in useful mathematical terms, of macromolecular structures. Protein crystals are analysed alone or in the presence of one or various ligands, providing information about binding sites, interactions and related protein function and being an important basis for drug design and protein engineering210. While RNase A and ECP have been already characterised using XRD, no structure has been previously described for RNase 6 yet and only one RNase 7 NMR solution structure is known so far (see Figure 6).
First of all, proteins used for crystallisation must be as pure as possible. Salt‐free
samples are required and purity must be higher than 90%, which is normally achieved after a double chromatography purification (cation exchange FPLC and reverse phase HPLC, see Section 4.2). Such a contaminant free state is especially necessary for proteins to crystallise. Otherwise, microheterogeneity sources may inhibit crystal growth.
Crystal growth is a controlled precipitation process guaranteed by an initial non‐
equilibrium state between the protein sample and the crystallisation condition. Initially, the protein undergoes supersaturation from an initial saturation‐close state by changes of pH, ionic strength, concentration or temperature, solvent withdrawal or existence of precipitants or inorganic salts. Phase separation is promoted, which leads to the formation of crystal nuclei. Next, new molecules are enlisted into the growing
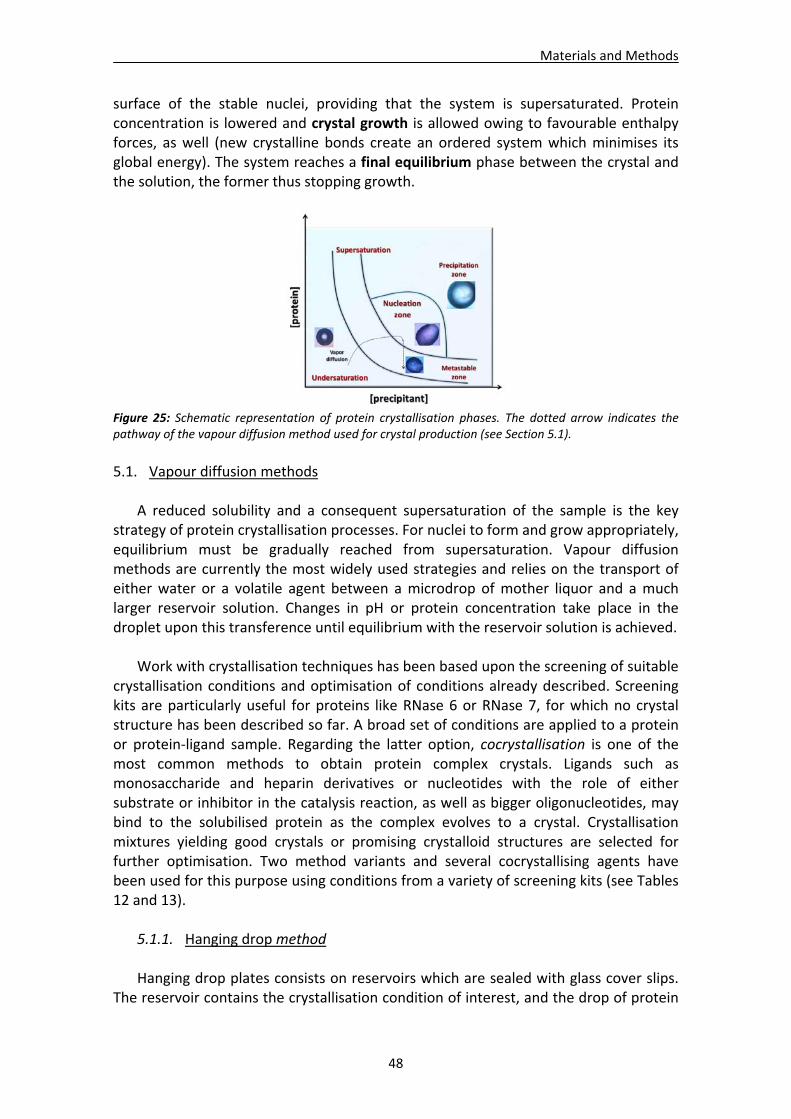
Materials and Methods
48
surface of the stable nuclei, providing that the system is supersaturated. Protein concentration is lowered and crystal growth is allowed owing to favourable enthalpy forces, as well (new crystalline bonds create an ordered system which minimises its global energy). The system reaches a final equilibrium phase between the crystal and the solution, the former thus stopping growth.
Figure 25: Schematic representation of protein crystallisation phases. The dotted arrow indicates the pathway of the vapour diffusion method used for crystal production (see Section 5.1).
5.1. Vapour diffusion methods
A reduced solubility and a consequent supersaturation of the sample is the key strategy of protein crystallisation processes. For nuclei to form and grow appropriately, equilibrium must be gradually reached from supersaturation. Vapour diffusion methods are currently the most widely used strategies and relies on the transport of either water or a volatile agent between a microdrop of mother liquor and a much larger reservoir solution. Changes in pH or protein concentration take place in the droplet upon this transference until equilibrium with the reservoir solution is achieved.
Work with crystallisation techniques has been based upon the screening of suitable
crystallisation conditions and optimisation of conditions already described. Screening kits are particularly useful for proteins like RNase 6 or RNase 7, for which no crystal structure has been described so far. A broad set of conditions are applied to a protein or protein‐ligand sample. Regarding the latter option, cocrystallisation is one of the most common methods to obtain protein complex crystals. Ligands such as monosaccharide and heparin derivatives or nucleotides with the role of either substrate or inhibitor in the catalysis reaction, as well as bigger oligonucleotides, may bind to the solubilised protein as the complex evolves to a crystal. Crystallisation mixtures yielding good crystals or promising crystalloid structures are selected for further optimisation. Two method variants and several cocrystallising agents have been used for this purpose using conditions from a variety of screening kits (see Tables 12 and 13).
5.1.1. Hanging drop method Hanging drop plates consists on reservoirs which are sealed with glass cover slips.
The reservoir contains the crystallisation condition of interest, and the drop of protein
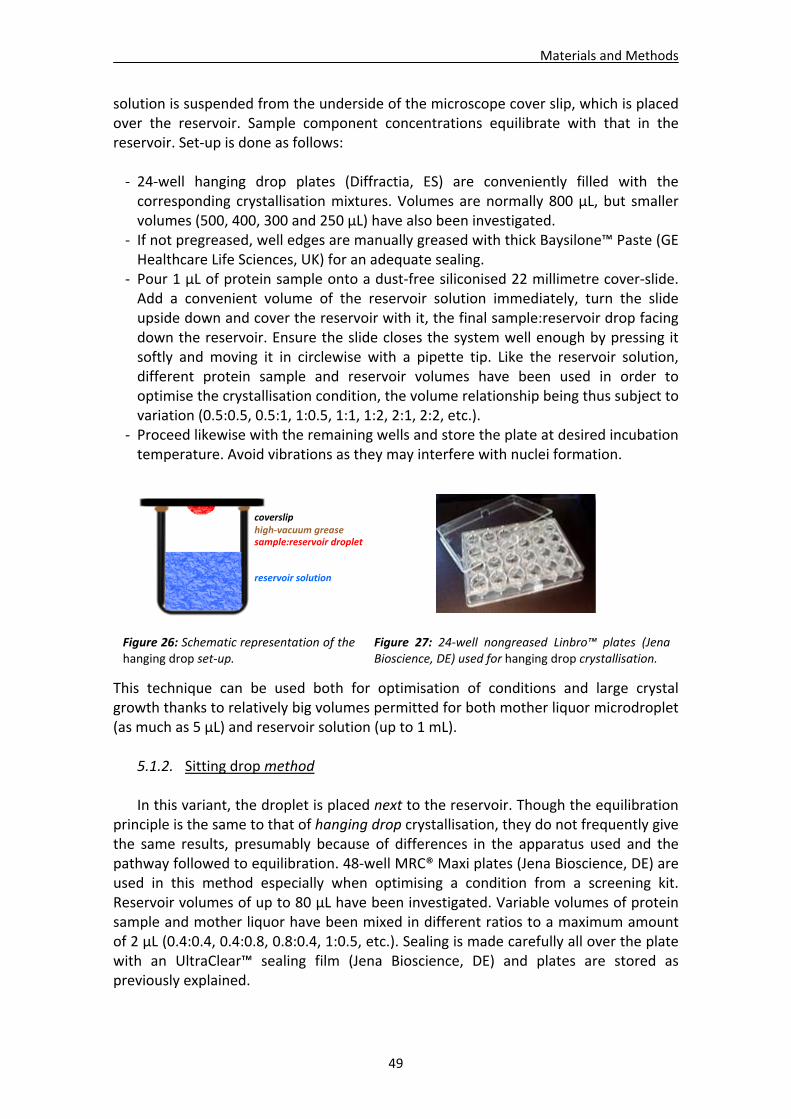
Materials and Methods
49
solution is suspended from the underside of the microscope cover slip, which is placed over the reservoir. Sample component concentrations equilibrate with that in the reservoir. Set‐up is done as follows:
‐ 24‐well hanging drop plates (Diffractia, ES) are conveniently filled with the corresponding crystallisation mixtures. Volumes are normally 800 μL, but smaller volumes (500, 400, 300 and 250 μL) have also been investigated.
‐ If not pregreased, well edges are manually greased with thick Baysilone™ Paste (GE Healthcare Life Sciences, UK) for an adequate sealing.
‐ Pour 1 μL of protein sample onto a dust‐free siliconised 22 millimetre cover‐slide. Add a convenient volume of the reservoir solution immediately, turn the slide upside down and cover the reservoir with it, the final sample:reservoir drop facing down the reservoir. Ensure the slide closes the system well enough by pressing it softly and moving it in circlewise with a pipette tip. Like the reservoir solution, different protein sample and reservoir volumes have been used in order to optimise the crystallisation condition, the volume relationship being thus subject to variation (0.5:0.5, 0.5:1, 1:0.5, 1:1, 1:2, 2:1, 2:2, etc.).
‐ Proceed likewise with the remaining wells and store the plate at desired incubation temperature. Avoid vibrations as they may interfere with nuclei formation.
This technique can be used both for optimisation of conditions and large crystal growth thanks to relatively big volumes permitted for both mother liquor microdroplet (as much as 5 μL) and reservoir solution (up to 1 mL).
5.1.2. Sitting drop method
In this variant, the droplet is placed next to the reservoir. Though the equilibration principle is the same to that of hanging drop crystallisation, they do not frequently give the same results, presumably because of differences in the apparatus used and the pathway followed to equilibration. 48‐well MRC® Maxi plates (Jena Bioscience, DE) are used in this method especially when optimising a condition from a screening kit. Reservoir volumes of up to 80 μL have been investigated. Variable volumes of protein sample and mother liquor have been mixed in different ratios to a maximum amount of 2 μL (0.4:0.4, 0.4:0.8, 0.8:0.4, 1:0.5, etc.). Sealing is made carefully all over the plate with an UltraClear™ sealing film (Jena Bioscience, DE) and plates are stored as previously explained.
coverslip high‐vacuum greasesample:reservoir droplet
reservoir solution
Figure 26: Schematic representation of the hanging drop set‐up.
Figure 27: 24‐well nongreased Linbro™ plates (Jena Bioscience, DE) used for hanging drop crystallisation.
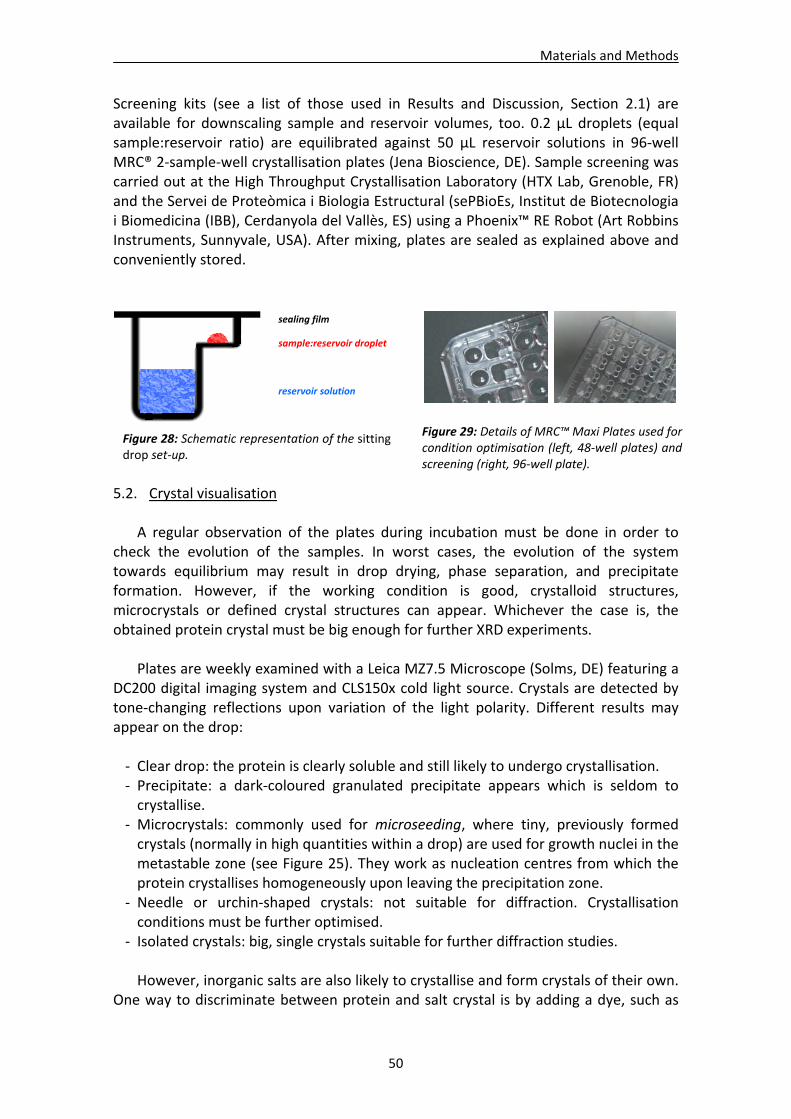
Materials and Methods
50
Screening kits (see a list of those used in Results and Discussion, Section 2.1) are available for downscaling sample and reservoir volumes, too. 0.2 μL droplets (equal sample:reservoir ratio) are equilibrated against 50 μL reservoir solutions in 96‐well MRC® 2‐sample‐well crystallisation plates (Jena Bioscience, DE). Sample screening was carried out at the High Throughput Crystallisation Laboratory (HTX Lab, Grenoble, FR) and the Servei de Proteòmica i Biologia Estructural (sePBioEs, Institut de Biotecnologia i Biomedicina (IBB), Cerdanyola del Vallès, ES) using a Phoenix™ RE Robot (Art Robbins Instruments, Sunnyvale, USA). After mixing, plates are sealed as explained above and conveniently stored.
5.2. Crystal visualisation
A regular observation of the plates during incubation must be done in order to check the evolution of the samples. In worst cases, the evolution of the system towards equilibrium may result in drop drying, phase separation, and precipitate formation. However, if the working condition is good, crystalloid structures, microcrystals or defined crystal structures can appear. Whichever the case is, the obtained protein crystal must be big enough for further XRD experiments.
Plates are weekly examined with a Leica MZ7.5 Microscope (Solms, DE) featuring a
DC200 digital imaging system and CLS150x cold light source. Crystals are detected by tone‐changing reflections upon variation of the light polarity. Different results may appear on the drop:
‐ Clear drop: the protein is clearly soluble and still likely to undergo crystallisation. ‐ Precipitate: a dark‐coloured granulated precipitate appears which is seldom to crystallise.
‐ Microcrystals: commonly used for microseeding, where tiny, previously formed crystals (normally in high quantities within a drop) are used for growth nuclei in the metastable zone (see Figure 25). They work as nucleation centres from which the protein crystallises homogeneously upon leaving the precipitation zone.
‐ Needle or urchin‐shaped crystals: not suitable for diffraction. Crystallisation conditions must be further optimised.
‐ Isolated crystals: big, single crystals suitable for further diffraction studies. However, inorganic salts are also likely to crystallise and form crystals of their own.
One way to discriminate between protein and salt crystal is by adding a dye, such as
sealing film
sample:reservoir droplet
reservoir solution
Figure 28: Schematic representation of the sitting drop set‐up.
Figure 29: Details of MRC™ Maxi Plates used for condition optimisation (left, 48‐well plates) and screening (right, 96‐well plate).
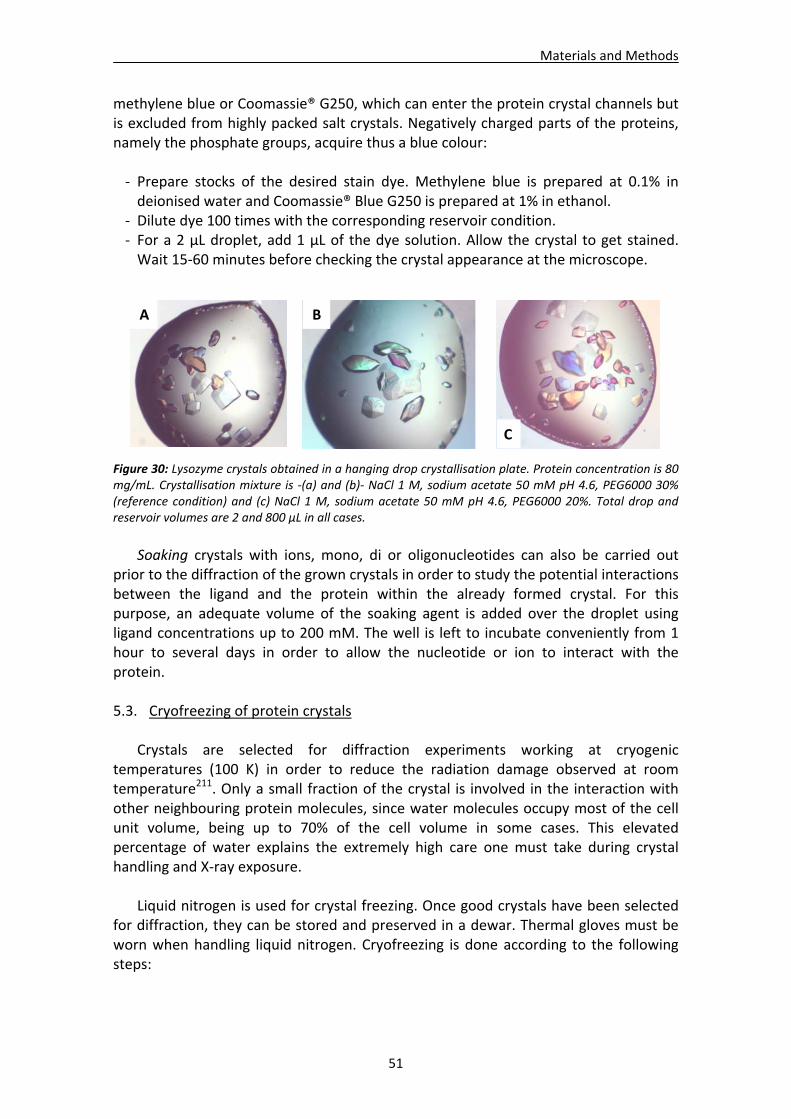
Materials and Methods
51
methylene blue or Coomassie® G250, which can enter the protein crystal channels but is excluded from highly packed salt crystals. Negatively charged parts of the proteins, namely the phosphate groups, acquire thus a blue colour:
‐ Prepare stocks of the desired stain dye. Methylene blue is prepared at 0.1% in deionised water and Coomassie® Blue G250 is prepared at 1% in ethanol.
‐ Dilute dye 100 times with the corresponding reservoir condition. ‐ For a 2 μL droplet, add 1 μL of the dye solution. Allow the crystal to get stained. Wait 15‐60 minutes before checking the crystal appearance at the microscope.
Figure 30: Lysozyme crystals obtained in a hanging drop crystallisation plate. Protein concentration is 80 mg/mL. Crystallisation mixture is ‐(a) and (b)‐ NaCl 1 M, sodium acetate 50 mM pH 4.6, PEG6000 30% (reference condition) and (c) NaCl 1 M, sodium acetate 50 mM pH 4.6, PEG6000 20%. Total drop and reservoir volumes are 2 and 800 μL in all cases.
Soaking crystals with ions, mono, di or oligonucleotides can also be carried out
prior to the diffraction of the grown crystals in order to study the potential interactions between the ligand and the protein within the already formed crystal. For this purpose, an adequate volume of the soaking agent is added over the droplet using ligand concentrations up to 200 mM. The well is left to incubate conveniently from 1 hour to several days in order to allow the nucleotide or ion to interact with the protein. 5.3. Cryofreezing of protein crystals
Crystals are selected for diffraction experiments working at cryogenic
temperatures (100 K) in order to reduce the radiation damage observed at room temperature211. Only a small fraction of the crystal is involved in the interaction with other neighbouring protein molecules, since water molecules occupy most of the cell unit volume, being up to 70% of the cell volume in some cases. This elevated percentage of water explains the extremely high care one must take during crystal handling and X‐ray exposure.
Liquid nitrogen is used for crystal freezing. Once good crystals have been selected
for diffraction, they can be stored and preserved in a dewar. Thermal gloves must be worn when handling liquid nitrogen. Cryofreezing is done according to the following steps:
A B
C
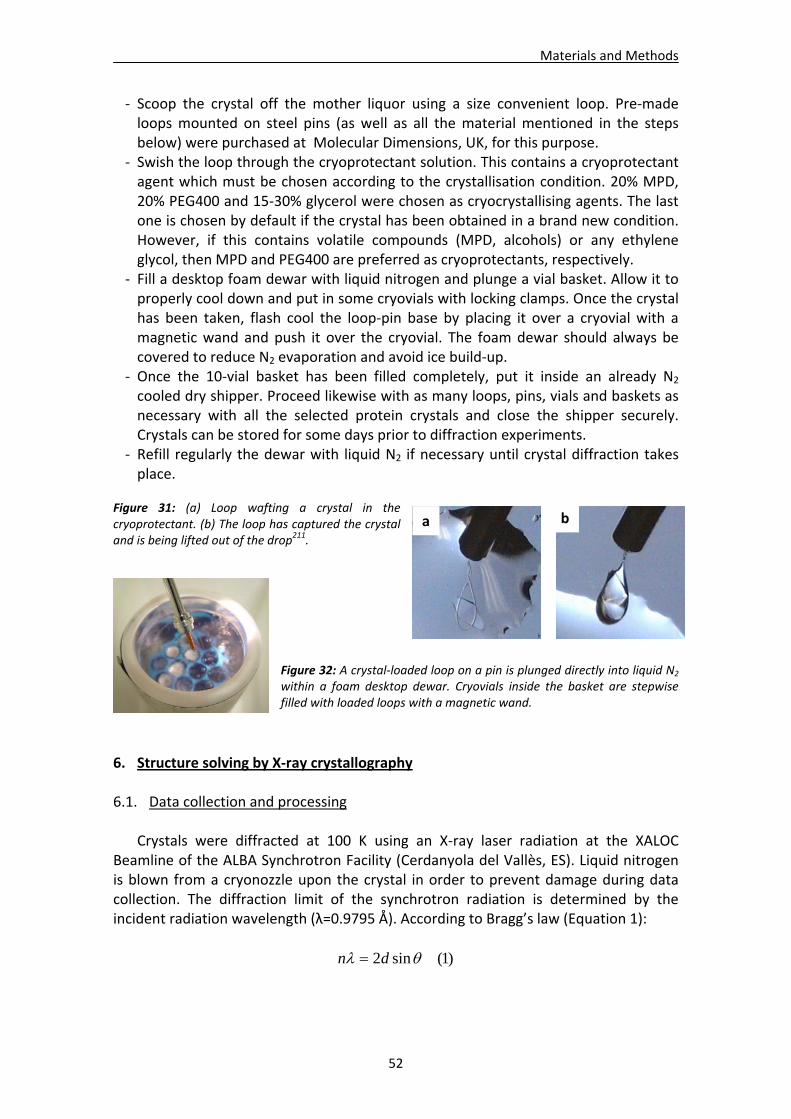
Materials and Methods
52
‐ Scoop the crystal off the mother liquor using a size convenient loop. Pre‐made loops mounted on steel pins (as well as all the material mentioned in the steps below) were purchased at Molecular Dimensions, UK, for this purpose.
‐ Swish the loop through the cryoprotectant solution. This contains a cryoprotectant agent which must be chosen according to the crystallisation condition. 20% MPD, 20% PEG400 and 15‐30% glycerol were chosen as cryocrystallising agents. The last one is chosen by default if the crystal has been obtained in a brand new condition. However, if this contains volatile compounds (MPD, alcohols) or any ethylene glycol, then MPD and PEG400 are preferred as cryoprotectants, respectively.
‐ Fill a desktop foam dewar with liquid nitrogen and plunge a vial basket. Allow it to properly cool down and put in some cryovials with locking clamps. Once the crystal has been taken, flash cool the loop‐pin base by placing it over a cryovial with a magnetic wand and push it over the cryovial. The foam dewar should always be covered to reduce N2 evaporation and avoid ice build‐up.
‐ Once the 10‐vial basket has been filled completely, put it inside an already N2 cooled dry shipper. Proceed likewise with as many loops, pins, vials and baskets as necessary with all the selected protein crystals and close the shipper securely. Crystals can be stored for some days prior to diffraction experiments.
‐ Refill regularly the dewar with liquid N2 if necessary until crystal diffraction takes place.
Figure 31: (a) Loop wafting a crystal in the cryoprotectant. (b) The loop has captured the crystal and is being lifted out of the drop211.
Figure 32: A crystal‐loaded loop on a pin is plunged directly into liquid N2 within a foam desktop dewar. Cryovials inside the basket are stepwise filled with loaded loops with a magnetic wand.
6. Structure solving by X‐ray crystallography 6.1. Data collection and processing
Crystals were diffracted at 100 K using an X‐ray laser radiation at the XALOC
Beamline of the ALBA Synchrotron Facility (Cerdanyola del Vallès, ES). Liquid nitrogen is blown from a cryonozzle upon the crystal in order to prevent damage during data collection. The diffraction limit of the synchrotron radiation is determined by the incident radiation wavelength (λ=0.9795 Å). According to Bragg’s law (Equation 1):
)1(sin2 dn
a b
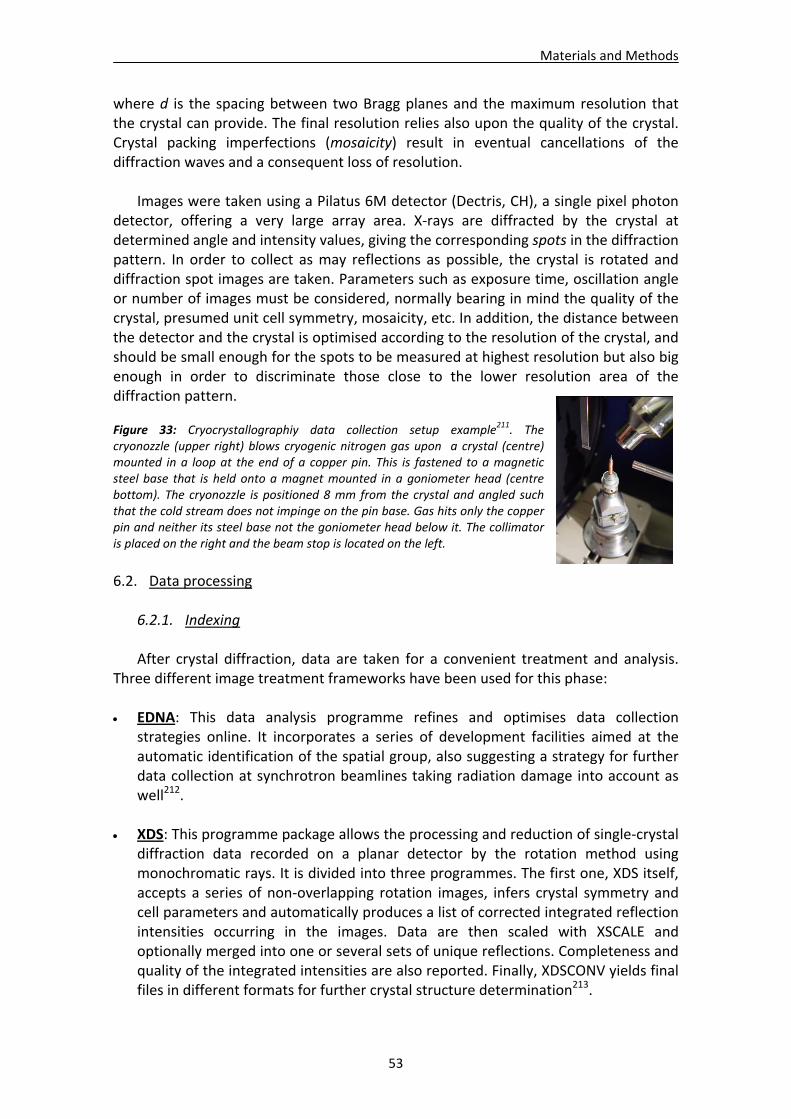
Materials and Methods
53
where d is the spacing between two Bragg planes and the maximum resolution that the crystal can provide. The final resolution relies also upon the quality of the crystal. Crystal packing imperfections (mosaicity) result in eventual cancellations of the diffraction waves and a consequent loss of resolution.
Images were taken using a Pilatus 6M detector (Dectris, CH), a single pixel photon
detector, offering a very large array area. X‐rays are diffracted by the crystal at determined angle and intensity values, giving the corresponding spots in the diffraction pattern. In order to collect as may reflections as possible, the crystal is rotated and diffraction spot images are taken. Parameters such as exposure time, oscillation angle or number of images must be considered, normally bearing in mind the quality of the crystal, presumed unit cell symmetry, mosaicity, etc. In addition, the distance between the detector and the crystal is optimised according to the resolution of the crystal, and should be small enough for the spots to be measured at highest resolution but also big enough in order to discriminate those close to the lower resolution area of the diffraction pattern. Figure 33: Cryocrystallographiy data collection setup example211. The cryonozzle (upper right) blows cryogenic nitrogen gas upon a crystal (centre) mounted in a loop at the end of a copper pin. This is fastened to a magnetic steel base that is held onto a magnet mounted in a goniometer head (centre bottom). The cryonozzle is positioned 8 mm from the crystal and angled such that the cold stream does not impinge on the pin base. Gas hits only the copper pin and neither its steel base not the goniometer head below it. The collimator is placed on the right and the beam stop is located on the left.
6.2. Data processing
6.2.1. Indexing After crystal diffraction, data are taken for a convenient treatment and analysis.
Three different image treatment frameworks have been used for this phase:
EDNA: This data analysis programme refines and optimises data collection strategies online. It incorporates a series of development facilities aimed at the automatic identification of the spatial group, also suggesting a strategy for further data collection at synchrotron beamlines taking radiation damage into account as well212.
XDS: This programme package allows the processing and reduction of single‐crystal
diffraction data recorded on a planar detector by the rotation method using monochromatic rays. It is divided into three programmes. The first one, XDS itself, accepts a series of non‐overlapping rotation images, infers crystal symmetry and cell parameters and automatically produces a list of corrected integrated reflection intensities occurring in the images. Data are then scaled with XSCALE and optionally merged into one or several sets of unique reflections. Completeness and quality of the integrated intensities are also reported. Finally, XDSCONV yields final files in different formats for further crystal structure determination213.
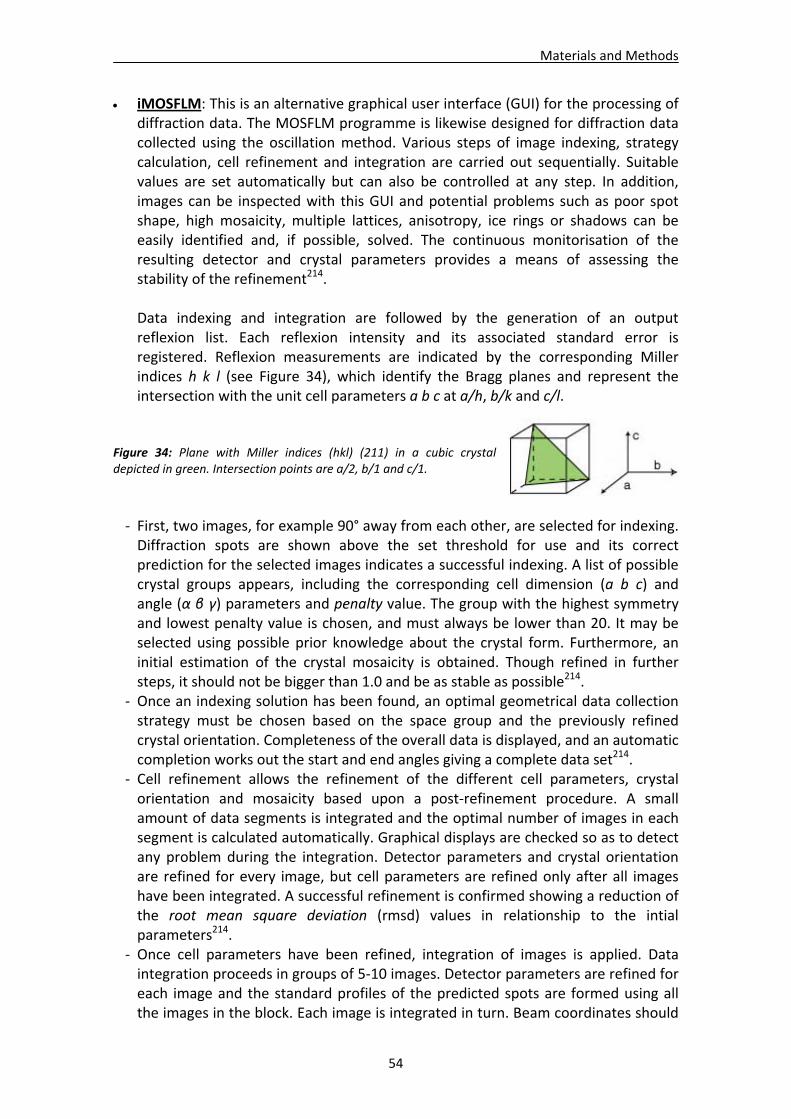
Materials and Methods
54
iMOSFLM: This is an alternative graphical user interface (GUI) for the processing of diffraction data. The MOSFLM programme is likewise designed for diffraction data collected using the oscillation method. Various steps of image indexing, strategy calculation, cell refinement and integration are carried out sequentially. Suitable values are set automatically but can also be controlled at any step. In addition, images can be inspected with this GUI and potential problems such as poor spot shape, high mosaicity, multiple lattices, anisotropy, ice rings or shadows can be easily identified and, if possible, solved. The continuous monitorisation of the resulting detector and crystal parameters provides a means of assessing the stability of the refinement214.
Data indexing and integration are followed by the generation of an output reflexion list. Each reflexion intensity and its associated standard error is registered. Reflexion measurements are indicated by the corresponding Miller indices h k l (see Figure 34), which identify the Bragg planes and represent the intersection with the unit cell parameters a b c at a/h, b/k and c/l.
Figure 34: Plane with Miller indices (hkl) (211) in a cubic crystal depicted in green. Intersection points are a/2, b/1 and c/1.
‐ First, two images, for example 90° away from each other, are selected for indexing.
Diffraction spots are shown above the set threshold for use and its correct prediction for the selected images indicates a successful indexing. A list of possible crystal groups appears, including the corresponding cell dimension (a b c) and angle (α β γ) parameters and penalty value. The group with the highest symmetry and lowest penalty value is chosen, and must always be lower than 20. It may be selected using possible prior knowledge about the crystal form. Furthermore, an initial estimation of the crystal mosaicity is obtained. Though refined in further steps, it should not be bigger than 1.0 and be as stable as possible214.
‐ Once an indexing solution has been found, an optimal geometrical data collection strategy must be chosen based on the space group and the previously refined crystal orientation. Completeness of the overall data is displayed, and an automatic completion works out the start and end angles giving a complete data set214.
‐ Cell refinement allows the refinement of the different cell parameters, crystal orientation and mosaicity based upon a post‐refinement procedure. A small amount of data segments is integrated and the optimal number of images in each segment is calculated automatically. Graphical displays are checked so as to detect any problem during the integration. Detector parameters and crystal orientation are refined for every image, but cell parameters are refined only after all images have been integrated. A successful refinement is confirmed showing a reduction of the root mean square deviation (rmsd) values in relationship to the intial parameters214.
‐ Once cell parameters have been refined, integration of images is applied. Data integration proceeds in groups of 5‐10 images. Detector parameters are refined for each image and the standard profiles of the predicted spots are formed using all the images in the block. Each image is integrated in turn. Beam coordinates should
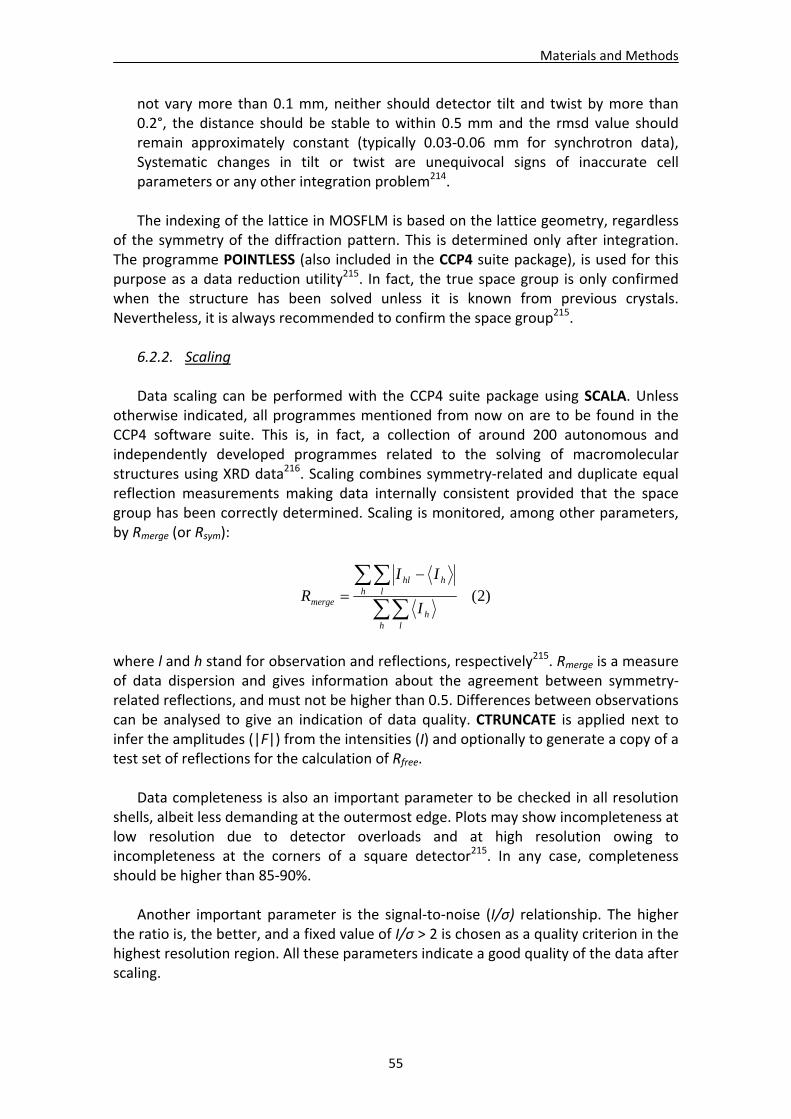
Materials and Methods
55
not vary more than 0.1 mm, neither should detector tilt and twist by more than 0.2°, the distance should be stable to within 0.5 mm and the rmsd value should remain approximately constant (typically 0.03‐0.06 mm for synchrotron data), Systematic changes in tilt or twist are unequivocal signs of inaccurate cell parameters or any other integration problem214.
The indexing of the lattice in MOSFLM is based on the lattice geometry, regardless
of the symmetry of the diffraction pattern. This is determined only after integration. The programme POINTLESS (also included in the CCP4 suite package), is used for this purpose as a data reduction utility215. In fact, the true space group is only confirmed when the structure has been solved unless it is known from previous crystals. Nevertheless, it is always recommended to confirm the space group215.
6.2.2. Scaling Data scaling can be performed with the CCP4 suite package using SCALA. Unless
otherwise indicated, all programmes mentioned from now on are to be found in the CCP4 software suite. This is, in fact, a collection of around 200 autonomous and independently developed programmes related to the solving of macromolecular structures using XRD data216. Scaling combines symmetry‐related and duplicate equal reflection measurements making data internally consistent provided that the space group has been correctly determined. Scaling is monitored, among other parameters, by Rmerge (or Rsym):
)2(
h lh
h lhhl
merge I
IIR
where l and h stand for observation and reflections, respectively215. Rmerge is a measure of data dispersion and gives information about the agreement between symmetry‐related reflections, and must not be higher than 0.5. Differences between observations can be analysed to give an indication of data quality. CTRUNCATE is applied next to infer the amplitudes (|F|) from the intensities (I) and optionally to generate a copy of a test set of reflections for the calculation of Rfree.
Data completeness is also an important parameter to be checked in all resolution shells, albeit less demanding at the outermost edge. Plots may show incompleteness at low resolution due to detector overloads and at high resolution owing to incompleteness at the corners of a square detector215. In any case, completeness should be higher than 85‐90%.
Another important parameter is the signal‐to‐noise (I/σ) relationship. The higher
the ratio is, the better, and a fixed value of I/σ > 2 is chosen as a quality criterion in the highest resolution region. All these parameters indicate a good quality of the data after scaling.
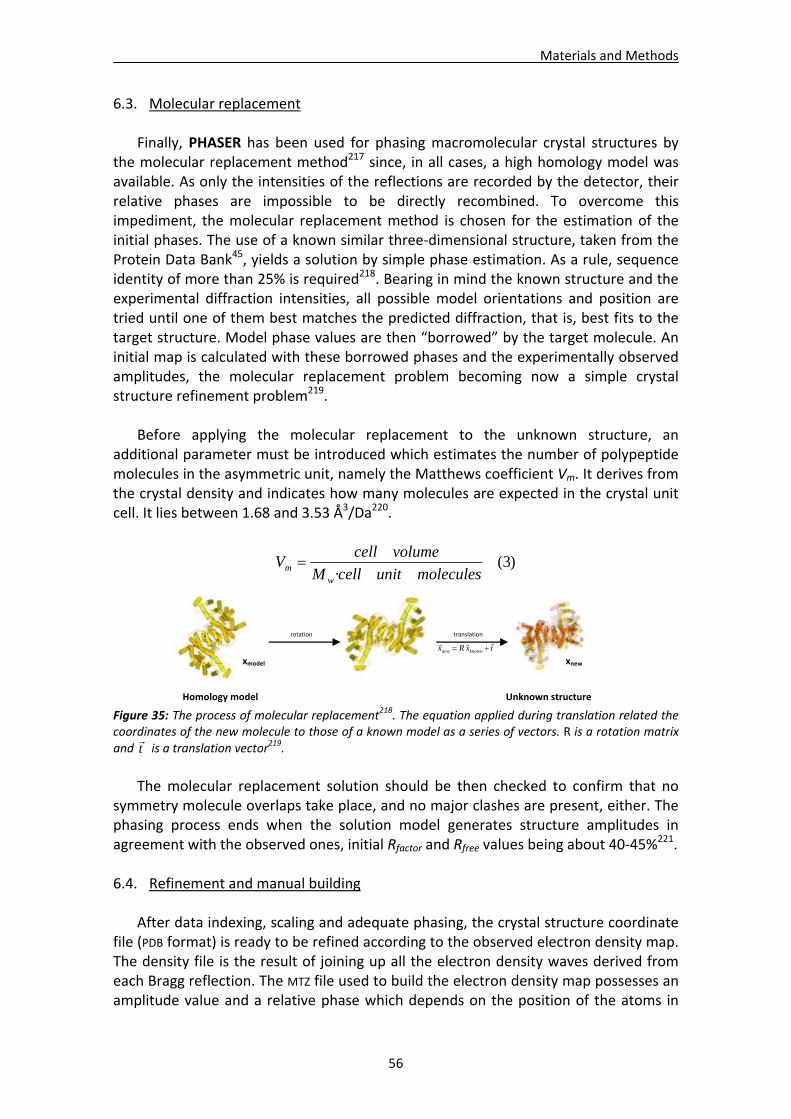
Materials and Methods
56
6.3. Molecular replacement Finally, PHASER has been used for phasing macromolecular crystal structures by the molecular replacement method217 since, in all cases, a high homology model was available. As only the intensities of the reflections are recorded by the detector, their relative phases are impossible to be directly recombined. To overcome this impediment, the molecular replacement method is chosen for the estimation of the initial phases. The use of a known similar three‐dimensional structure, taken from the Protein Data Bank45, yields a solution by simple phase estimation. As a rule, sequence identity of more than 25% is required218. Bearing in mind the known structure and the experimental diffraction intensities, all possible model orientations and position are tried until one of them best matches the predicted diffraction, that is, best fits to the target structure. Model phase values are then “borrowed” by the target molecule. An initial map is calculated with these borrowed phases and the experimentally observed amplitudes, the molecular replacement problem becoming now a simple crystal structure refinement problem219. Before applying the molecular replacement to the unknown structure, an additional parameter must be introduced which estimates the number of polypeptide molecules in the asymmetric unit, namely the Matthews coefficient Vm. It derives from the crystal density and indicates how many molecules are expected in the crystal unit cell. It lies between 1.68 and 3.53 Å3/Da220.
)3(· moleculesunitcellM
volumecellV
wm
Figure 35: The process of molecular replacement218. The equation applied during translation related the coordinates of the new molecule to those of a known model as a series of vectors. R is a rotation matrix and t
is a translation vector219.
The molecular replacement solution should be then checked to confirm that no symmetry molecule overlaps take place, and no major clashes are present, either. The phasing process ends when the solution model generates structure amplitudes in agreement with the observed ones, initial Rfactor and Rfree values being about 40‐45%
221. 6.4. Refinement and manual building
After data indexing, scaling and adequate phasing, the crystal structure coordinate file (PDB format) is ready to be refined according to the observed electron density map. The density file is the result of joining up all the electron density waves derived from each Bragg reflection. The MTZ file used to build the electron density map possesses an amplitude value and a relative phase which depends on the position of the atoms in
Homology model
xmodel
Unknown structure
xnew
rotation
txRx knownnew
translation
Materials and Methods
57
the crystal. Their periodicity is defined by the Miller indices and their position can be calculated by a Fourier transformation, obtaining the electron density function as described by a vector x
:
)4())((2cos)(1
)( hlxkyhxhFV
xh
where ρ( x
) is the electron density, xyz are the point coordinates within the cell unit
abc, V is the volume of the cell unit, Σ is the sum of all reflexions in an electron density point, |F(hkl)| is the amplitude of the structural factors, α is the phase angle and (hx+ky+lz‐α(h
))is the relative phase angle of each reflection.
The electron density map is used as guidance during manual building. The
coordinate file is modified by map‐fitting procedures using the COOT package222. The programme assists in the structure building by showing side chain rotamer probabilities and allowing free torsion angle rotation. Molecular graphics model building also provides the possibility to regularise, that is, idealise, the model coordinates according to known ideal values. This regularisation is taken together with the experimental map in order to create a target function for the structure to be refined. Once the protein chain is correctly built, ligands and water molecules may also be added. The latter are incorporated at |2Fo‐Fc| and |Fo‐Fc| electron density peaks higher than 1.5σ and 3σ, respectively, and at hydrogen bond forming distances (2.4 – 3.4 Å) from appropriate atoms. These two density maps are created using the differences between the observed (Fo) and calculated (Fc) structural factors. |2Fo‐Fc| is used to identify those density regions which resemble the model the most, while |Fo‐Fc| shows regions not explained by the model like ligands, solvent molecules or amino acid side chain alternative conformations.
Specifically related to high resolution structure building, the thermal motion factor,
B factor or atomic displacement parameter (ADP) is an extra parameter that indirectly indicates the atomic motion, that is, the level of internal (static) disorder within the crystal unit cell and intrinsic molecule mobility (internal dynamic disorder). The value of the isotropic B factor is given by the radius value of the of the electron distribution sphere around each atom. The anisotropic B factor can be applied at atomic resolution levels, namely higher than 1.2 Å thanks to the higher amount of reflexions. As a matter of fact, the experimental density may so reflect the real electron distribution better and the Rfree value is subsequently improved (see Section 6.2.4). This value is based on the parameterisation of three components (Equation 5):
)5(localgroupcrystaltotal UUUU
where Utotal is the total atomic ADP. Ucrystal is a symmetric Uij 3x3 matrix describing the global crystal displacement and some additional anisotropic effects, common for all atoms and thus able to be directly treated when performing anisotropic scaling. Ugroup is responsible for concerted motions of multiple groups at different levels (whole molecule + chain + residue). Ulocal deals with local atomic vibration and is based, for anisotropic refinement, of six parameters per atom (Figure 36).
Materials and Methods
58
Figure 36: Atom descriptors in a PDB coordinate file. Red, blue and green integers indicate, respectively, the position (x y z) of each atom, their occupancies and local mobility (thermal motion factors). Specifically, the bottom line lists the six additional atom ADPs derived from the Uij anistropic refinement matrix.
6.5. Structure validation
Following, alternate cycles of manual building and modelling with COOT and
energy minimisation, individual temperature factor refinement, simulated annealing and structure refining using and Refmac5223 (included in the CCP4 package216) and PHENIX224 were carried out. Refined models were checked and modified if necessary, and a new cycle was applied. Specifically for this programme, each time the PDB model has been uploaded, an incorporated structure‐validation programme (MolProbity) optimises atoms and respective hydrogen positions. The interactions with the first shell of bound water molecules are also considered225.
PHENIX: This package includes its own Refine programme which combines a large,
highly efficient repertoire of programming tools. It allows multi‐step complex refinement protocols in which most of the available refinement strategies can be combined with each other and applied to any selected model part224. Figure 37 illustrates a general scheme for each refinement step.
Figure 37: General flowchart of structure refinement as implemented in phenix.refine226. The main refinement body, namely macrocycle, is shown with the arrow and repeated several times.
‐ The refinement strategy is selected prior to the repeatable refinement macrocycle, the main body of model refinement. The block consists of several steps aimed at the optimisation of specific model parameters. As the refinement target function has many local energy minima and an applied gradient‐driven minimisation reaches only the nearest minimum, rotamer optimisation or simulated annealing algorithms may be necessary to approach the deepest minimum as closely as possible226. TLS refinement is also an option for structures obtained at low to
Bulk solvent anisotropic scaling twin fraction
Ordered solvent addition and removal
Target weight calculation
Coordinate refinementRigid body / individual minimisation / annealing
Atomic displacement parameter refinementRigid body (TLS) group / individual
(isotropic and anisotropic)
Occupancy refinement (group / individual)
Refinement strategy selection
Input data and model processing
macrocycle
Output (model / maps / statistics)
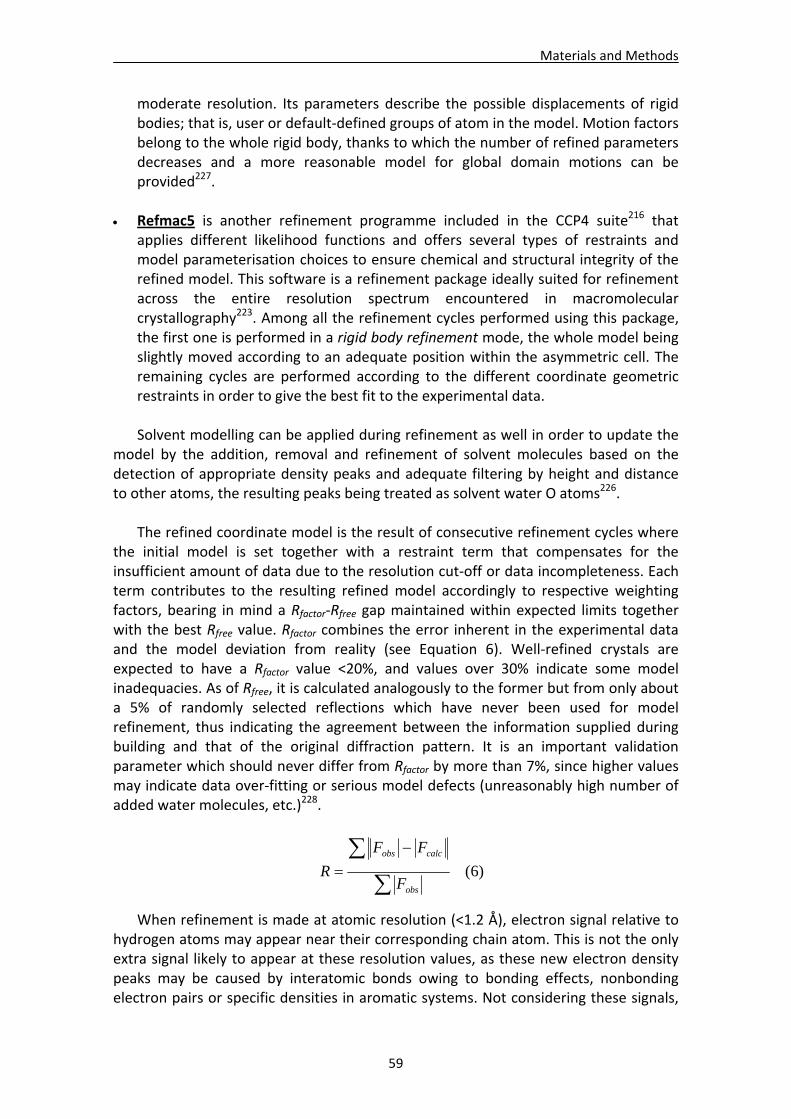
Materials and Methods
59
moderate resolution. Its parameters describe the possible displacements of rigid bodies; that is, user or default‐defined groups of atom in the model. Motion factors belong to the whole rigid body, thanks to which the number of refined parameters decreases and a more reasonable model for global domain motions can be provided227.
Refmac5 is another refinement programme included in the CCP4 suite216 that
applies different likelihood functions and offers several types of restraints and model parameterisation choices to ensure chemical and structural integrity of the refined model. This software is a refinement package ideally suited for refinement across the entire resolution spectrum encountered in macromolecular crystallography223. Among all the refinement cycles performed using this package, the first one is performed in a rigid body refinement mode, the whole model being slightly moved according to an adequate position within the asymmetric cell. The remaining cycles are performed according to the different coordinate geometric restraints in order to give the best fit to the experimental data.
Solvent modelling can be applied during refinement as well in order to update the
model by the addition, removal and refinement of solvent molecules based on the detection of appropriate density peaks and adequate filtering by height and distance to other atoms, the resulting peaks being treated as solvent water O atoms226.
The refined coordinate model is the result of consecutive refinement cycles where
the initial model is set together with a restraint term that compensates for the insufficient amount of data due to the resolution cut‐off or data incompleteness. Each term contributes to the resulting refined model accordingly to respective weighting factors, bearing in mind a Rfactor‐Rfree gap maintained within expected limits together with the best Rfree value. Rfactor combines the error inherent in the experimental data and the model deviation from reality (see Equation 6). Well‐refined crystals are expected to have a Rfactor value <20%, and values over 30% indicate some model inadequacies. As of Rfree, it is calculated analogously to the former but from only about a 5% of randomly selected reflections which have never been used for model refinement, thus indicating the agreement between the information supplied during building and that of the original diffraction pattern. It is an important validation parameter which should never differ from Rfactor by more than 7%, since higher values may indicate data over‐fitting or serious model defects (unreasonably high number of added water molecules, etc.)228.
)6(
obs
calcobs
F
FF
R
When refinement is made at atomic resolution (<1.2 Å), electron signal relative to hydrogen atoms may appear near their corresponding chain atom. This is not the only extra signal likely to appear at these resolution values, as these new electron density peaks may be caused by interatomic bonds owing to bonding effects, nonbonding electron pairs or specific densities in aromatic systems. Not considering these signals,
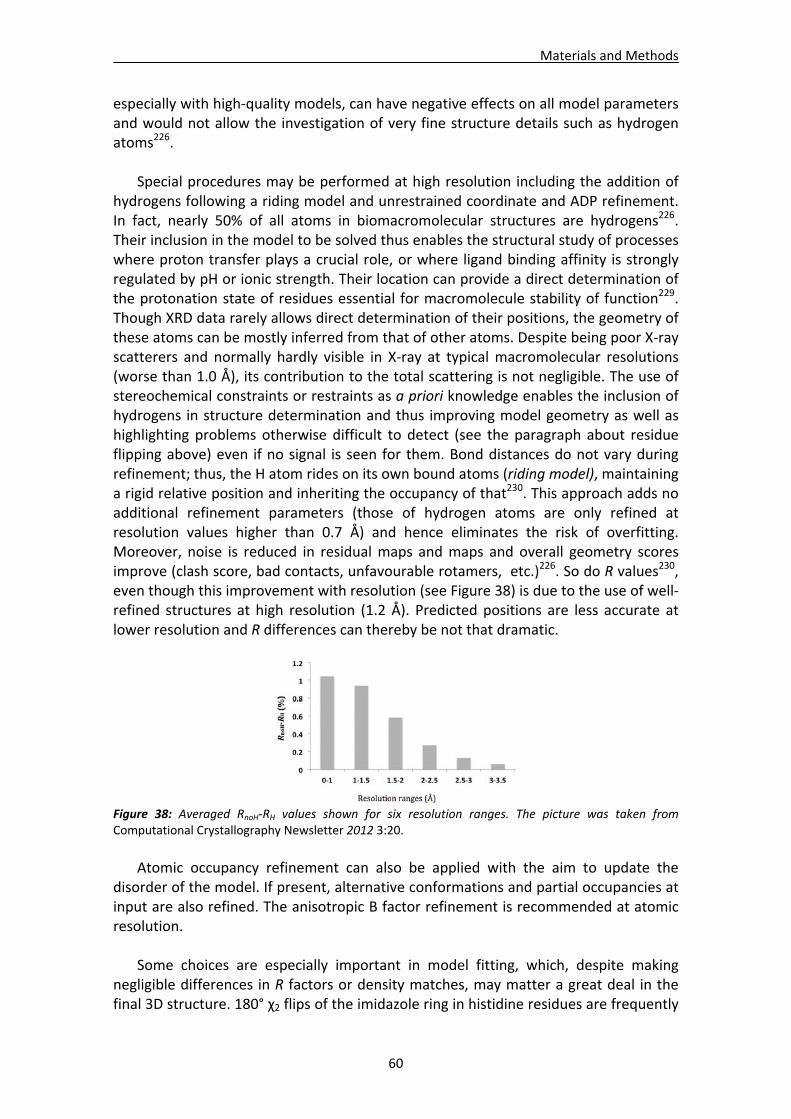
Materials and Methods
60
especially with high‐quality models, can have negative effects on all model parameters and would not allow the investigation of very fine structure details such as hydrogen atoms226.
Special procedures may be performed at high resolution including the addition of
hydrogens following a riding model and unrestrained coordinate and ADP refinement. In fact, nearly 50% of all atoms in biomacromolecular structures are hydrogens226. Their inclusion in the model to be solved thus enables the structural study of processes where proton transfer plays a crucial role, or where ligand binding affinity is strongly regulated by pH or ionic strength. Their location can provide a direct determination of the protonation state of residues essential for macromolecule stability of function229. Though XRD data rarely allows direct determination of their positions, the geometry of these atoms can be mostly inferred from that of other atoms. Despite being poor X‐ray scatterers and normally hardly visible in X‐ray at typical macromolecular resolutions (worse than 1.0 Å), its contribution to the total scattering is not negligible. The use of stereochemical constraints or restraints as a priori knowledge enables the inclusion of hydrogens in structure determination and thus improving model geometry as well as highlighting problems otherwise difficult to detect (see the paragraph about residue flipping above) even if no signal is seen for them. Bond distances do not vary during refinement; thus, the H atom rides on its own bound atoms (riding model), maintaining a rigid relative position and inheriting the occupancy of that230. This approach adds no additional refinement parameters (those of hydrogen atoms are only refined at resolution values higher than 0.7 Å) and hence eliminates the risk of overfitting. Moreover, noise is reduced in residual maps and maps and overall geometry scores improve (clash score, bad contacts, unfavourable rotamers, etc.)226. So do R values230, even though this improvement with resolution (see Figure 38) is due to the use of well‐refined structures at high resolution (1.2 Å). Predicted positions are less accurate at lower resolution and R differences can thereby be not that dramatic.
Figure 38: Averaged RnoH‐RH values shown for six resolution ranges. The picture was taken from Computational Crystallography Newsletter 2012 3:20.
Atomic occupancy refinement can also be applied with the aim to update the
disorder of the model. If present, alternative conformations and partial occupancies at input are also refined. The anisotropic B factor refinement is recommended at atomic resolution.
Some choices are especially important in model fitting, which, despite making
negligible differences in R factors or density matches, may matter a great deal in the final 3D structure. 180° χ2 flips of the imidazole ring in histidine residues are frequently
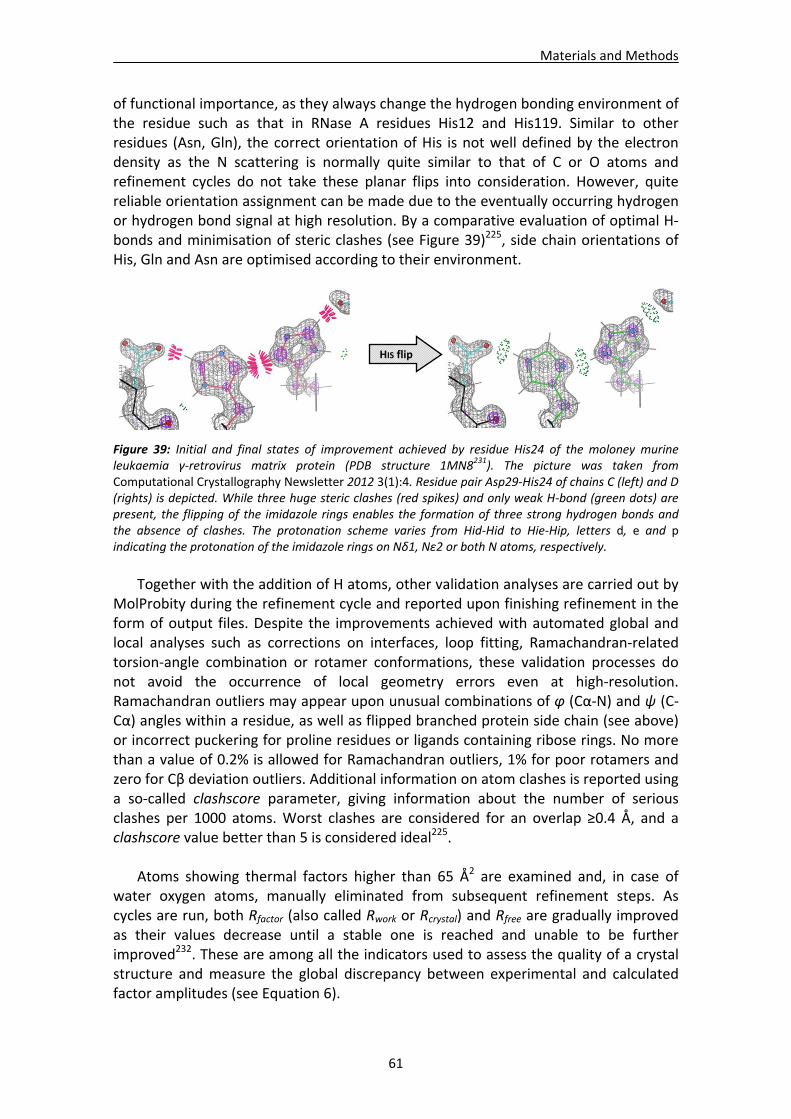
Materials and Methods
61
of functional importance, as they always change the hydrogen bonding environment of the residue such as that in RNase A residues His12 and His119. Similar to other residues (Asn, Gln), the correct orientation of His is not well defined by the electron density as the N scattering is normally quite similar to that of C or O atoms and refinement cycles do not take these planar flips into consideration. However, quite reliable orientation assignment can be made due to the eventually occurring hydrogen or hydrogen bond signal at high resolution. By a comparative evaluation of optimal H‐bonds and minimisation of steric clashes (see Figure 39)225, side chain orientations of His, Gln and Asn are optimised according to their environment.
Figure 39: Initial and final states of improvement achieved by residue His24 of the moloney murine leukaemia γ‐retrovirus matrix protein (PDB structure 1MN8231). The picture was taken from Computational Crystallography Newsletter 2012 3(1):4. Residue pair Asp29‐His24 of chains C (left) and D (rights) is depicted. While three huge steric clashes (red spikes) and only weak H‐bond (green dots) are present, the flipping of the imidazole rings enables the formation of three strong hydrogen bonds and the absence of clashes. The protonation scheme varies from Hid‐Hid to Hie‐Hip, letters d, e and p indicating the protonation of the imidazole rings on Nδ1, Nε2 or both N atoms, respectively.
Together with the addition of H atoms, other validation analyses are carried out by
MolProbity during the refinement cycle and reported upon finishing refinement in the form of output files. Despite the improvements achieved with automated global and local analyses such as corrections on interfaces, loop fitting, Ramachandran‐related torsion‐angle combination or rotamer conformations, these validation processes do not avoid the occurrence of local geometry errors even at high‐resolution. Ramachandran outliers may appear upon unusual combinations of φ (Cα‐N) and ψ (C‐Cα) angles within a residue, as well as flipped branched protein side chain (see above) or incorrect puckering for proline residues or ligands containing ribose rings. No more than a value of 0.2% is allowed for Ramachandran outliers, 1% for poor rotamers and zero for Cβ deviation outliers. Additional information on atom clashes is reported using a so‐called clashscore parameter, giving information about the number of serious clashes per 1000 atoms. Worst clashes are considered for an overlap ≥0.4 Å, and a clashscore value better than 5 is considered ideal225.
Atoms showing thermal factors higher than 65 Å2 are examined and, in case of water oxygen atoms, manually eliminated from subsequent refinement steps. As cycles are run, both Rfactor (also called Rwork or Rcrystal) and Rfree are gradually improved as their values decrease until a stable one is reached and unable to be further improved232. These are among all the indicators used to assess the quality of a crystal structure and measure the global discrepancy between experimental and calculated factor amplitudes (see Equation 6).
HIS flip
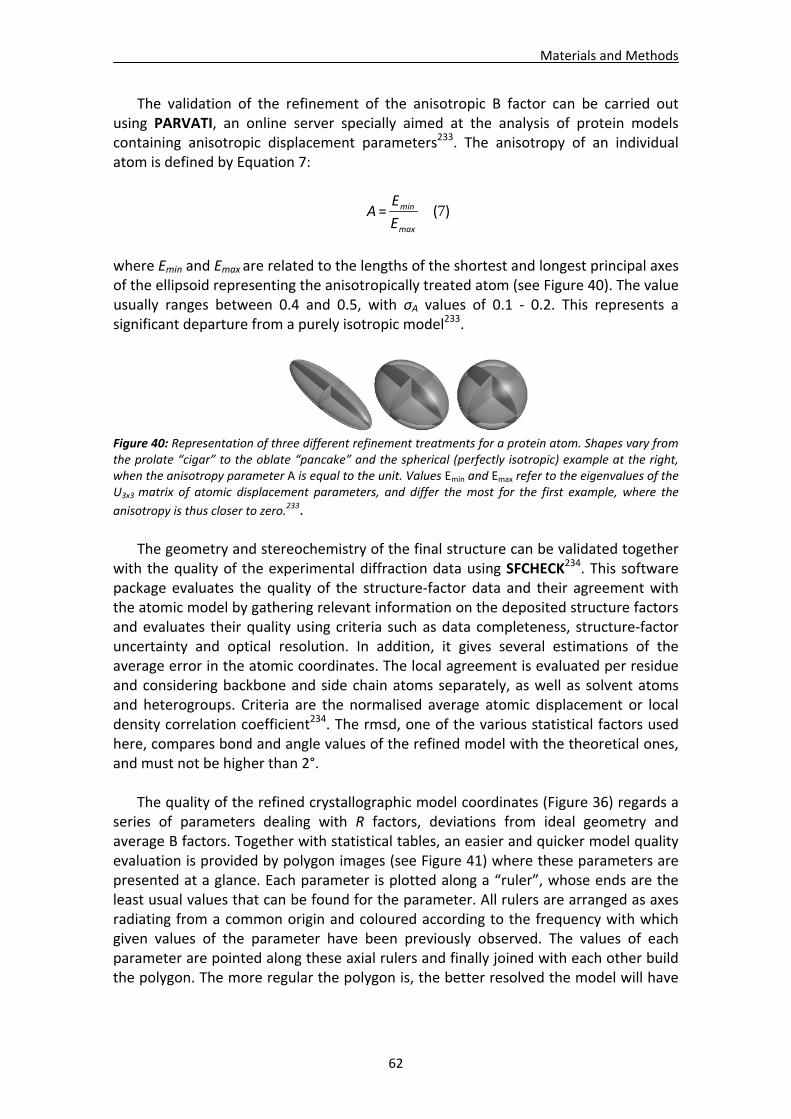
Materials and Methods
62
The validation of the refinement of the anisotropic B factor can be carried out using PARVATI, an online server specially aimed at the analysis of protein models containing anisotropic displacement parameters233. The anisotropy of an individual atom is defined by Equation 7:
)(= 7max
min
E
EA
where Emin and Emax are related to the lengths of the shortest and longest principal axes of the ellipsoid representing the anisotropically treated atom (see Figure 40). The value usually ranges between 0.4 and 0.5, with σA values of 0.1 ‐ 0.2. This represents a significant departure from a purely isotropic model233.
Figure 40: Representation of three different refinement treatments for a protein atom. Shapes vary from the prolate “cigar” to the oblate “pancake” and the spherical (perfectly isotropic) example at the right, when the anisotropy parameter A is equal to the unit. Values Emin and Emax refer to the eigenvalues of the U3x3 matrix of atomic displacement parameters, and differ the most for the first example, where the
anisotropy is thus closer to zero.233.
The geometry and stereochemistry of the final structure can be validated together with the quality of the experimental diffraction data using SFCHECK234. This software package evaluates the quality of the structure‐factor data and their agreement with the atomic model by gathering relevant information on the deposited structure factors and evaluates their quality using criteria such as data completeness, structure‐factor uncertainty and optical resolution. In addition, it gives several estimations of the average error in the atomic coordinates. The local agreement is evaluated per residue and considering backbone and side chain atoms separately, as well as solvent atoms and heterogroups. Criteria are the normalised average atomic displacement or local density correlation coefficient234. The rmsd, one of the various statistical factors used here, compares bond and angle values of the refined model with the theoretical ones, and must not be higher than 2°.
The quality of the refined crystallographic model coordinates (Figure 36) regards a
series of parameters dealing with R factors, deviations from ideal geometry and average B factors. Together with statistical tables, an easier and quicker model quality evaluation is provided by polygon images (see Figure 41) where these parameters are presented at a glance. Each parameter is plotted along a “ruler”, whose ends are the least usual values that can be found for the parameter. All rulers are arranged as axes radiating from a common origin and coloured according to the frequency with which given values of the parameter have been previously observed. The values of each parameter are pointed along these axial rulers and finally joined with each other build the polygon. The more regular the polygon is, the better resolved the model will have
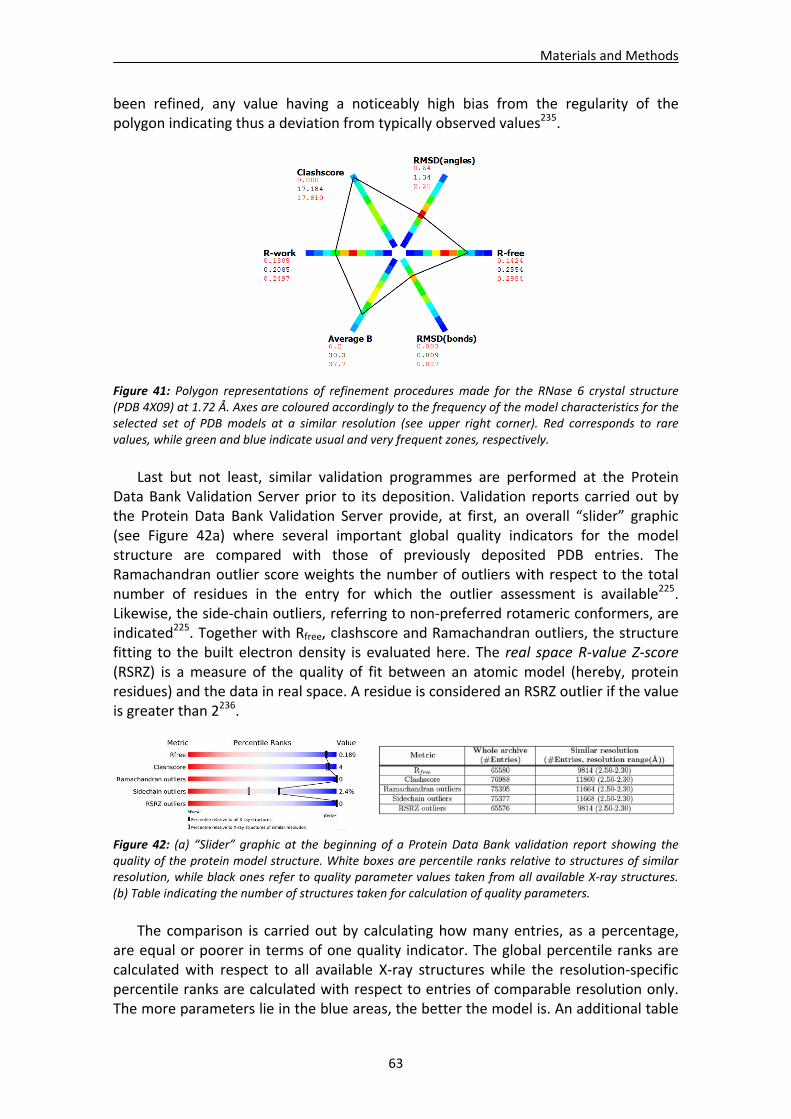
Materials and Methods
63
been refined, any value having a noticeably high bias from the regularity of the polygon indicating thus a deviation from typically observed values235.
Figure 41: Polygon representations of refinement procedures made for the RNase 6 crystal structure (PDB 4X09) at 1.72 Å. Axes are coloured accordingly to the frequency of the model characteristics for the selected set of PDB models at a similar resolution (see upper right corner). Red corresponds to rare values, while green and blue indicate usual and very frequent zones, respectively.
Last but not least, similar validation programmes are performed at the Protein
Data Bank Validation Server prior to its deposition. Validation reports carried out by the Protein Data Bank Validation Server provide, at first, an overall “slider” graphic (see Figure 42a) where several important global quality indicators for the model structure are compared with those of previously deposited PDB entries. The Ramachandran outlier score weights the number of outliers with respect to the total number of residues in the entry for which the outlier assessment is available225. Likewise, the side‐chain outliers, referring to non‐preferred rotameric conformers, are indicated225. Together with Rfree, clashscore and Ramachandran outliers, the structure fitting to the built electron density is evaluated here. The real space R‐value Z‐score (RSRZ) is a measure of the quality of fit between an atomic model (hereby, protein residues) and the data in real space. A residue is considered an RSRZ outlier if the value is greater than 2236.
Figure 42: (a) “Slider” graphic at the beginning of a Protein Data Bank validation report showing the quality of the protein model structure. White boxes are percentile ranks relative to structures of similar resolution, while black ones refer to quality parameter values taken from all available X‐ray structures. (b) Table indicating the number of structures taken for calculation of quality parameters.
The comparison is carried out by calculating how many entries, as a percentage,
are equal or poorer in terms of one quality indicator. The global percentile ranks are calculated with respect to all available X‐ray structures while the resolution‐specific percentile ranks are calculated with respect to entries of comparable resolution only. The more parameters lie in the blue areas, the better the model is. An additional table
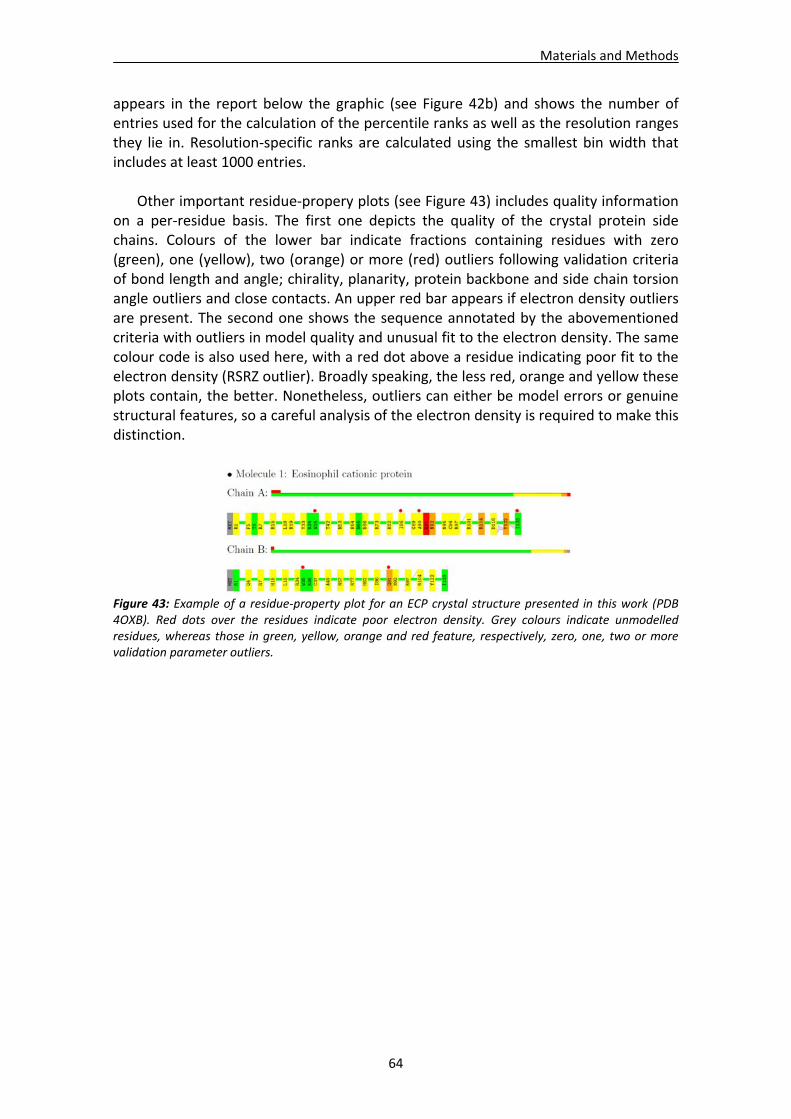
Materials and Methods
64
appears in the report below the graphic (see Figure 42b) and shows the number of entries used for the calculation of the percentile ranks as well as the resolution ranges they lie in. Resolution‐specific ranks are calculated using the smallest bin width that includes at least 1000 entries. Other important residue‐propery plots (see Figure 43) includes quality information on a per‐residue basis. The first one depicts the quality of the crystal protein side chains. Colours of the lower bar indicate fractions containing residues with zero (green), one (yellow), two (orange) or more (red) outliers following validation criteria of bond length and angle; chirality, planarity, protein backbone and side chain torsion angle outliers and close contacts. An upper red bar appears if electron density outliers are present. The second one shows the sequence annotated by the abovementioned criteria with outliers in model quality and unusual fit to the electron density. The same colour code is also used here, with a red dot above a residue indicating poor fit to the electron density (RSRZ outlier). Broadly speaking, the less red, orange and yellow these plots contain, the better. Nonetheless, outliers can either be model errors or genuine structural features, so a careful analysis of the electron density is required to make this distinction.
Figure 43: Example of a residue‐property plot for an ECP crystal structure presented in this work (PDB 4OXB). Red dots over the residues indicate poor electron density. Grey colours indicate unmodelled residues, whereas those in green, yellow, orange and red feature, respectively, zero, one, two or more validation parameter outliers.

CHAPTER 3 RESULTS and DISCUSSION

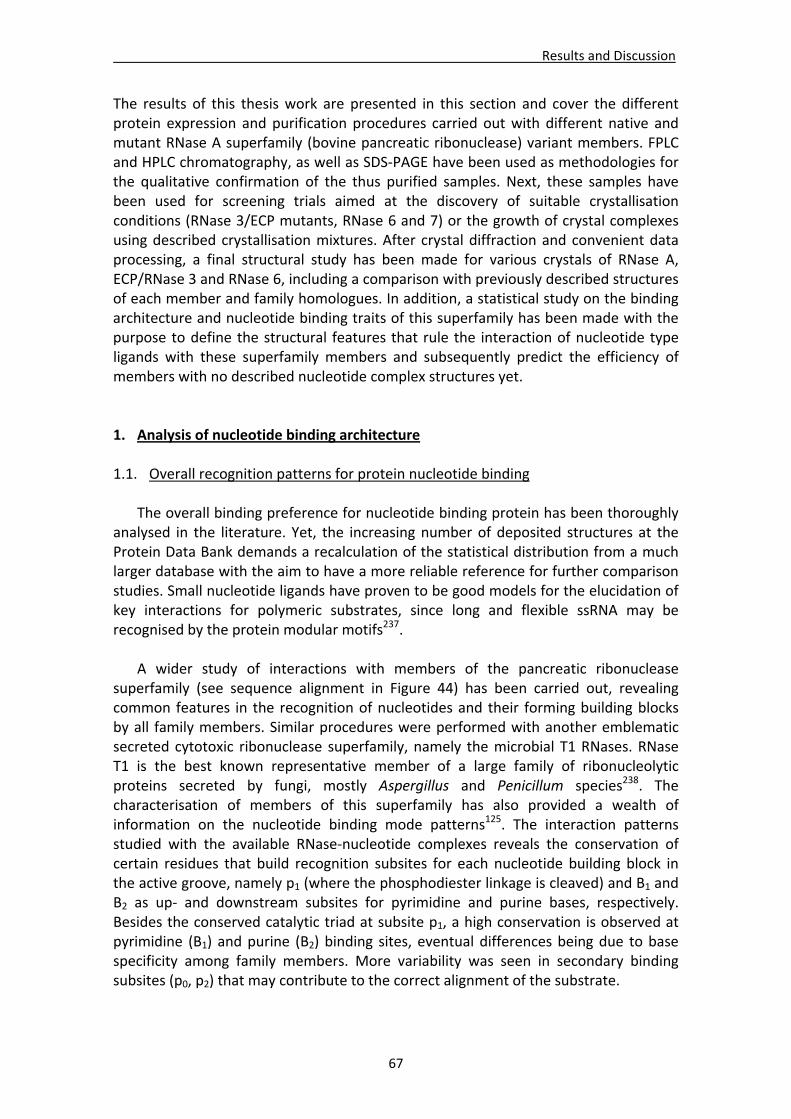
Results and Discussion
67
The results of this thesis work are presented in this section and cover the different protein expression and purification procedures carried out with different native and mutant RNase A superfamily (bovine pancreatic ribonuclease) variant members. FPLC and HPLC chromatography, as well as SDS‐PAGE have been used as methodologies for the qualitative confirmation of the thus purified samples. Next, these samples have been used for screening trials aimed at the discovery of suitable crystallisation conditions (RNase 3/ECP mutants, RNase 6 and 7) or the growth of crystal complexes using described crystallisation mixtures. After crystal diffraction and convenient data processing, a final structural study has been made for various crystals of RNase A, ECP/RNase 3 and RNase 6, including a comparison with previously described structures of each member and family homologues. In addition, a statistical study on the binding architecture and nucleotide binding traits of this superfamily has been made with the purpose to define the structural features that rule the interaction of nucleotide type ligands with these superfamily members and subsequently predict the efficiency of members with no described nucleotide complex structures yet. 1. Analysis of nucleotide binding architecture 1.1. Overall recognition patterns for protein nucleotide binding
The overall binding preference for nucleotide binding protein has been thoroughly analysed in the literature. Yet, the increasing number of deposited structures at the Protein Data Bank demands a recalculation of the statistical distribution from a much larger database with the aim to have a more reliable reference for further comparison studies. Small nucleotide ligands have proven to be good models for the elucidation of key interactions for polymeric substrates, since long and flexible ssRNA may be recognised by the protein modular motifs237.
A wider study of interactions with members of the pancreatic ribonuclease
superfamily (see sequence alignment in Figure 44) has been carried out, revealing common features in the recognition of nucleotides and their forming building blocks by all family members. Similar procedures were performed with another emblematic secreted cytotoxic ribonuclease superfamily, namely the microbial T1 RNases. RNase T1 is the best known representative member of a large family of ribonucleolytic proteins secreted by fungi, mostly Aspergillus and Penicillum species238. The characterisation of members of this superfamily has also provided a wealth of information on the nucleotide binding mode patterns125. The interaction patterns studied with the available RNase‐nucleotide complexes reveals the conservation of certain residues that build recognition subsites for each nucleotide building block in the active groove, namely p1 (where the phosphodiester linkage is cleaved) and B1 and B2 as up‐ and downstream subsites for pyrimidine and purine bases, respectively. Besides the conserved catalytic triad at subsite p1, a high conservation is observed at pyrimidine (B1) and purine (B2) binding sites, eventual differences being due to base specificity among family members. More variability was seen in secondary binding subsites (p0, p2) that may contribute to the correct alignment of the substrate.
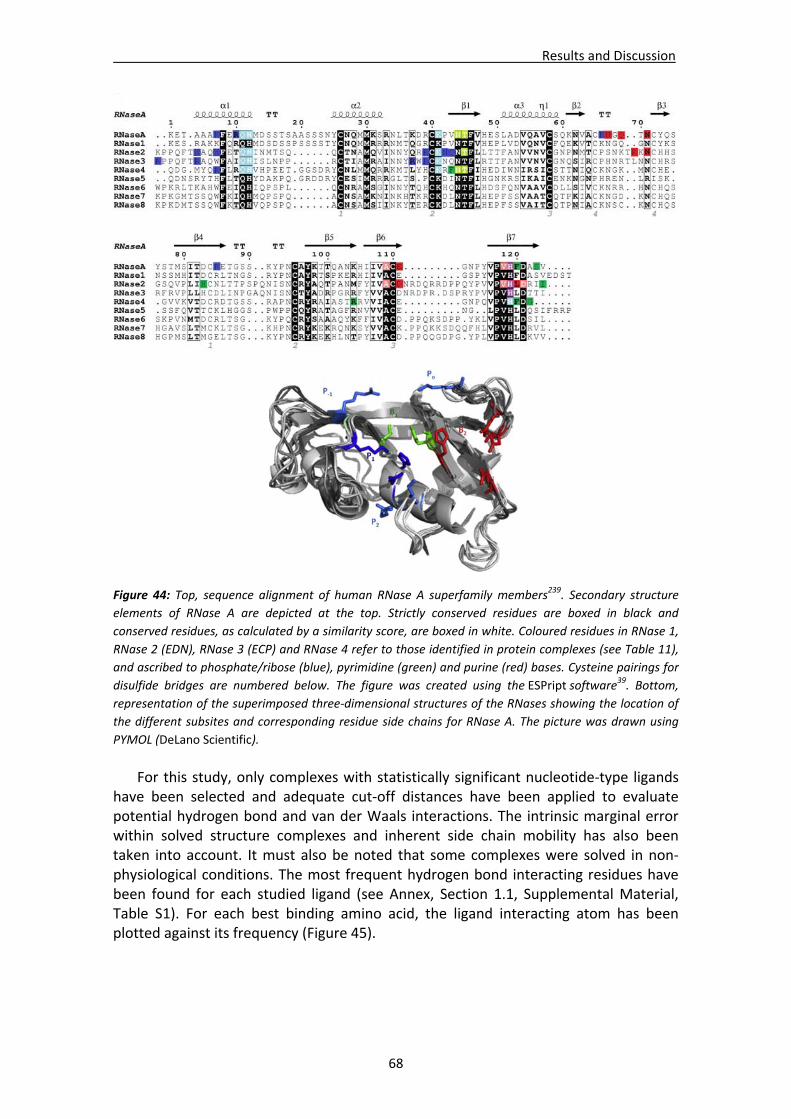
Results and Discussion
68
Figure 44: Top, sequence alignment of human RNase A superfamily members239. Secondary structure
elements of RNase A are depicted at the top. Strictly conserved residues are boxed in black and
conserved residues, as calculated by a similarity score, are boxed in white. Coloured residues in RNase 1,
RNase 2 (EDN), RNase 3 (ECP) and RNase 4 refer to those identified in protein complexes (see Table 11),
and ascribed to phosphate/ribose (blue), pyrimidine (green) and purine (red) bases. Cysteine pairings for
disulfide bridges are numbered below. The figure was created using the ESPript software39. Bottom,
representation of the superimposed three‐dimensional structures of the RNases showing the location of
the different subsites and corresponding residue side chains for RNase A. The picture was drawn using
PYMOL (DeLano Scientific). For this study, only complexes with statistically significant nucleotide‐type ligands
have been selected and adequate cut‐off distances have been applied to evaluate potential hydrogen bond and van der Waals interactions. The intrinsic marginal error within solved structure complexes and inherent side chain mobility has also been taken into account. It must also be noted that some complexes were solved in non‐physiological conditions. The most frequent hydrogen bond interacting residues have been found for each studied ligand (see Annex, Section 1.1, Supplemental Material, Table S1). For each best binding amino acid, the ligand interacting atom has been plotted against its frequency (Figure 45).
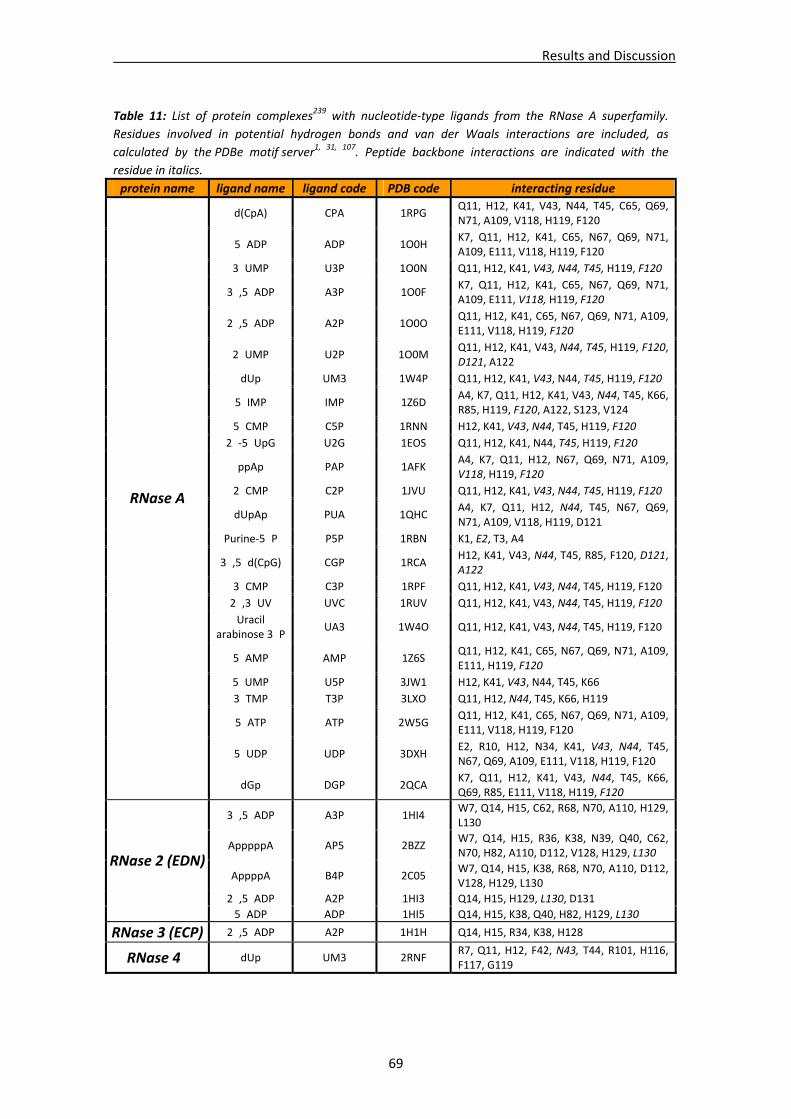
Results and Discussion
69
Table 11: List of protein complexes239 with nucleotide‐type ligands from the RNase A superfamily.
Residues involved in potential hydrogen bonds and van der Waals interactions are included, as
calculated by the PDBe motif server1, 31, 107. Peptide backbone interactions are indicated with the
residue in italics.
protein name ligand name ligand code PDB code interacting residue
d(CpA) CPA 1RPG Q11, H12, K41, V43, N44, T45, C65, Q69, N71, A109, V118, H119, F120
5�ADP ADP 1O0H K7, Q11, H12, K41, C65, N67, Q69, N71, A109, E111, V118, H119, F120
3�UMP U3P 1O0N Q11, H12, K41, V43, N44, T45, H119, F120
3�,5�ADP A3P 1O0F K7, Q11, H12, K41, C65, N67, Q69, N71, A109, E111, V118, H119, F120
2�,5�ADP A2P 1O0O Q11, H12, K41, C65, N67, Q69, N71, A109, E111, V118, H119, F120
2�UMP U2P 1O0M Q11, H12, K41, V43, N44, T45, H119, F120, D121, A122
dUp UM3 1W4P Q11, H12, K41, V43, N44, T45, H119, F120
5�IMP IMP 1Z6D A4, K7, Q11, H12, K41, V43, N44, T45, K66, R85, H119, F120, A122, S123, V124
5�CMP C5P 1RNN H12, K41, V43, N44, T45, H119, F120
2�‐5�UpG U2G 1EOS Q11, H12, K41, N44, T45, H119, F120
ppAp PAP 1AFK A4, K7, Q11, H12, N67, Q69, N71, A109, V118, H119, F120
2�CMP C2P 1JVU Q11, H12, K41, V43, N44, T45, H119, F120
dUpAp PUA 1QHC A4, K7, Q11, H12, N44, T45, N67, Q69, N71, A109, V118, H119, D121
Purine‐5�P P5P 1RBN K1, E2, T3, A4
3�,5�d(CpG) CGP 1RCA H12, K41, V43, N44, T45, R85, F120, D121, A122
3�CMP C3P 1RPF Q11, H12, K41, V43, N44, T45, H119, F120
2�,3�UV UVC 1RUV Q11, H12, K41, V43, N44, T45, H119, F120
Uracil arabinose 3�P
UA3 1W4O Q11, H12, K41, V43, N44, T45, H119, F120
5�AMP AMP 1Z6S Q11, H12, K41, C65, N67, Q69, N71, A109, E111, H119, F120
5�UMP U5P 3JW1 H12, K41, V43, N44, T45, K66
3�TMP T3P 3LXO Q11, H12, N44, T45, K66, H119
5�ATP ATP 2W5G Q11, H12, K41, C65, N67, Q69, N71, A109, E111, V118, H119, F120
5�UDP UDP 3DXH E2, R10, H12, N34, K41, V43, N44, T45, N67, Q69, A109, E111, V118, H119, F120
RNase A
dGp DGP 2QCA K7, Q11, H12, K41, V43, N44, T45, K66, Q69, R85, E111, V118, H119, F120
3�,5�ADP A3P 1HI4 W7, Q14, H15, C62, R68, N70, A110, H129, L130
ApppppA AP5 2BZZ W7, Q14, H15, R36, K38, N39, Q40, C62, N70, H82, A110, D112, V128, H129, L130
AppppA B4P 2C05 W7, Q14, H15, K38, R68, N70, A110, D112, V128, H129, L130
2�,5�ADP A2P 1HI3 Q14, H15, H129, L130, D131
RNase 2 (EDN)
5�ADP ADP 1HI5 Q14, H15, K38, Q40, H82, H129, L130
RNase 3 (ECP) 2�,5�ADP A2P 1H1H Q14, H15, R34, K38, H128
RNase 4 dUp UM3 2RNF R7, Q11, H12, F42, N43, T44, R101, H116, F117, G119
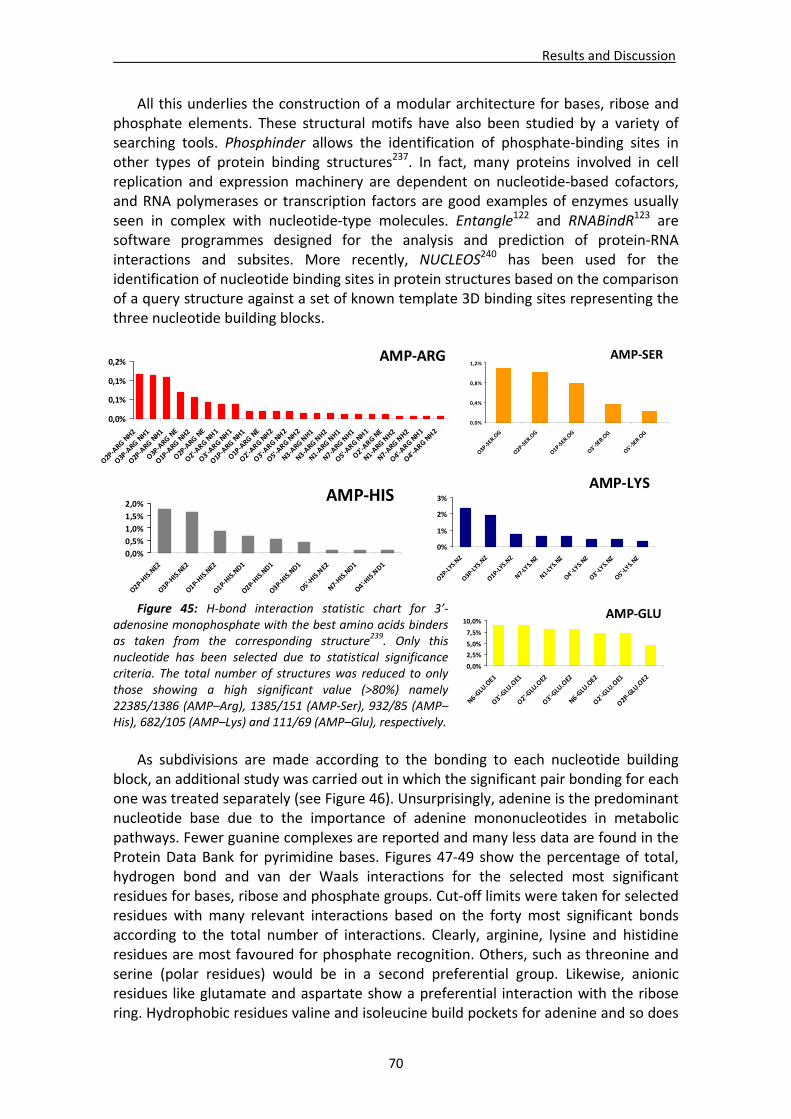
Results and Discussion
70
All this underlies the construction of a modular architecture for bases, ribose and phosphate elements. These structural motifs have also been studied by a variety of searching tools. Phosphinder allows the identification of phosphate‐binding sites in other types of protein binding structures237. In fact, many proteins involved in cell replication and expression machinery are dependent on nucleotide‐based cofactors, and RNA polymerases or transcription factors are good examples of enzymes usually seen in complex with nucleotide‐type molecules. Entangle122 and RNABindR123 are software programmes designed for the analysis and prediction of protein‐RNA interactions and subsites. More recently, NUCLEOS240 has been used for the identification of nucleotide binding sites in protein structures based on the comparison of a query structure against a set of known template 3D binding sites representing the three nucleotide building blocks.
Figure 45: H‐bond interaction statistic chart for 3’‐
adenosine monophosphate with the best amino acids binders as taken from the corresponding structure239. Only this nucleotide has been selected due to statistical significance criteria. The total number of structures was reduced to only those showing a high significant value (>80%) namely 22385/1386 (AMP–Arg), 1385/151 (AMP‐Ser), 932/85 (AMP–His), 682/105 (AMP–Lys) and 111/69 (AMP–Glu), respectively.
As subdivisions are made according to the bonding to each nucleotide building
block, an additional study was carried out in which the significant pair bonding for each one was treated separately (see Figure 46). Unsurprisingly, adenine is the predominant nucleotide base due to the importance of adenine mononucleotides in metabolic pathways. Fewer guanine complexes are reported and many less data are found in the Protein Data Bank for pyrimidine bases. Figures 47‐49 show the percentage of total, hydrogen bond and van der Waals interactions for the selected most significant residues for bases, ribose and phosphate groups. Cut‐off limits were taken for selected residues with many relevant interactions based on the forty most significant bonds according to the total number of interactions. Clearly, arginine, lysine and histidine residues are most favoured for phosphate recognition. Others, such as threonine and serine (polar residues) would be in a second preferential group. Likewise, anionic residues like glutamate and aspartate show a preferential interaction with the ribose ring. Hydrophobic residues valine and isoleucine build pockets for adenine and so does
AMP‐GLU
0,0%
2,5%
5,0%
7,5%
10,0%
N6‐GLU.OE1
O3'‐GLU.OE1
O2'‐GLU.OE2
O3'‐GLU.OE2
N6‐GLU.OE2
O2'‐GLU.OE1
O2P‐GLU.OE2
AMP‐SER
0,0%
0,4%
0,8%
1,2%
O3P‐SER.OG
O2P‐SER.OG
O1P‐SER.OG
O3'‐SER.OG
O5'‐SER.OG
AMP‐HIS
0,0%
0,5%
1,0%
1,5%
2,0%
O2P‐HIS.NE2
O3P‐HIS.NE2
O1P‐HIS.NE2
O1P‐HIS.ND1
O2P‐HIS.ND1
O3P‐HIS.ND1
O5'‐HIS.NE2
N7‐HIS.ND1
O4'‐HIS.ND1
AMP‐ARG
0,0%
0,1%
0,1%
0,2%
O2P‐ARG NH2
O3P‐ARG NH1
O2P‐ARG NH1
O3P‐ARG NE
O1P‐ARG NH2
O2P‐ARG NE
O2'‐ARG NH1
O3'‐ARG NH1
O1P‐ARG NH1
O1P‐ARG NE
O2'‐ARG NH2
O3'‐ARG NH2
O5'‐ARG NH2
N3‐ARG NH1
N3‐ARG NH2
N1‐ARG NH1
N7‐ARG NH1
O5'‐ARG NH1
O2'‐ARG NE
N1‐ARG NH2
N7‐ARG NH2
O4'‐ARG NH1
O4'‐ARG NH2
AMP‐LYS
0%
1%
2%
3%
O2P‐LYS.NZ
O3P‐LYS.NZ
O1P‐LYS.NZ
N7‐LYS.NZ
N1‐LYS.NZ
O4'‐LYS.NZ
O3'‐LYS.NZ
O5'‐LYS.NZ
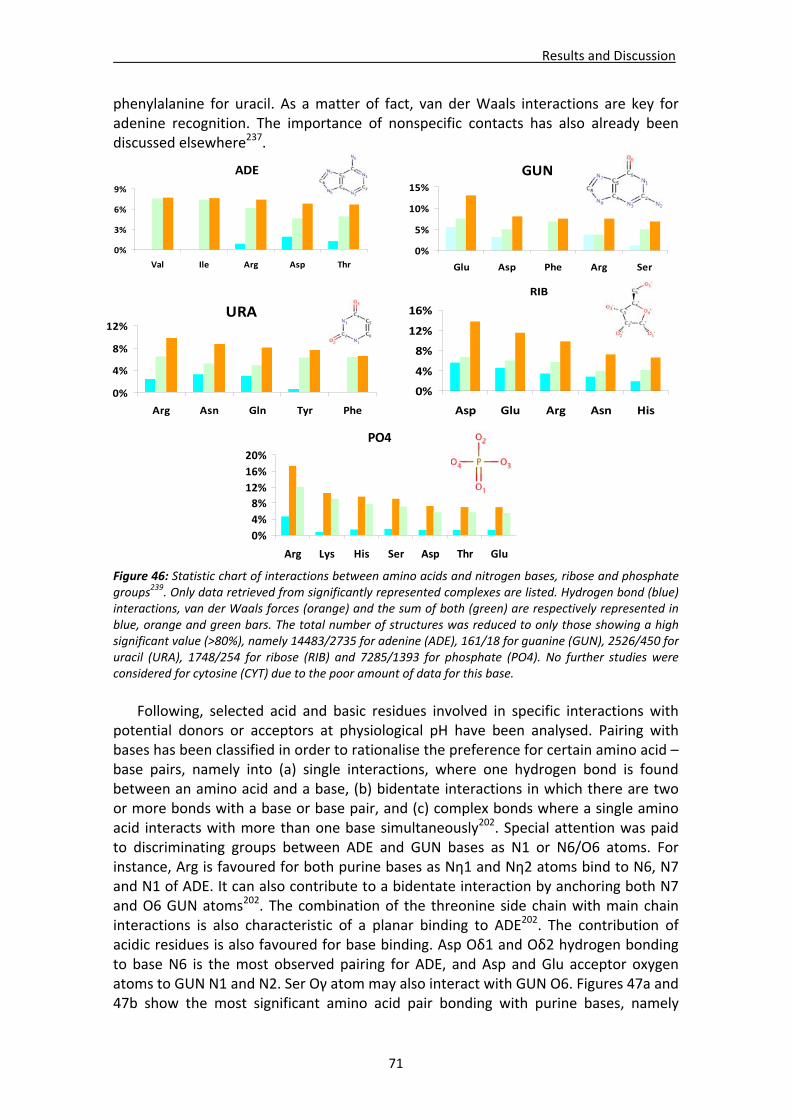
Results and Discussion
71
phenylalanine for uracil. As a matter of fact, van der Waals interactions are key for adenine recognition. The importance of nonspecific contacts has also already been discussed elsewhere237.
Figure 46: Statistic chart of interactions between amino acids and nitrogen bases, ribose and phosphate groups239. Only data retrieved from significantly represented complexes are listed. Hydrogen bond (blue) interactions, van der Waals forces (orange) and the sum of both (green) are respectively represented in blue, orange and green bars. The total number of structures was reduced to only those showing a high significant value (>80%), namely 14483/2735 for adenine (ADE), 161/18 for guanine (GUN), 2526/450 for uracil (URA), 1748/254 for ribose (RIB) and 7285/1393 for phosphate (PO4). No further studies were considered for cytosine (CYT) due to the poor amount of data for this base.
Following, selected acid and basic residues involved in specific interactions with
potential donors or acceptors at physiological pH have been analysed. Pairing with bases has been classified in order to rationalise the preference for certain amino acid – base pairs, namely into (a) single interactions, where one hydrogen bond is found between an amino acid and a base, (b) bidentate interactions in which there are two or more bonds with a base or base pair, and (c) complex bonds where a single amino acid interacts with more than one base simultaneously202. Special attention was paid to discriminating groups between ADE and GUN bases as N1 or N6/O6 atoms. For instance, Arg is favoured for both purine bases as Nη1 and Nη2 atoms bind to N6, N7 and N1 of ADE. It can also contribute to a bidentate interaction by anchoring both N7 and O6 GUN atoms202. The combination of the threonine side chain with main chain interactions is also characteristic of a planar binding to ADE202. The contribution of acidic residues is also favoured for base binding. Asp Oδ1 and Oδ2 hydrogen bonding to base N6 is the most observed pairing for ADE, and Asp and Glu acceptor oxygen atoms to GUN N1 and N2. Ser Oγ atom may also interact with GUN O6. Figures 47a and 47b show the most significant amino acid pair bonding with purine bases, namely
PO4
0%
4%
8%
12%
16%
20%
Arg Lys His Ser Asp Thr Glu
RIB
0%
4%
8%
12%
16%
Asp Glu Arg Asn His
URA
0%
4%
8%
12%
Arg Asn Gln Tyr Phe
GUN
0%
5%
10%
15%
Glu Asp Phe Arg Ser
ADE
0%
3%
6%
9%
Val Ile Arg Asp Thr
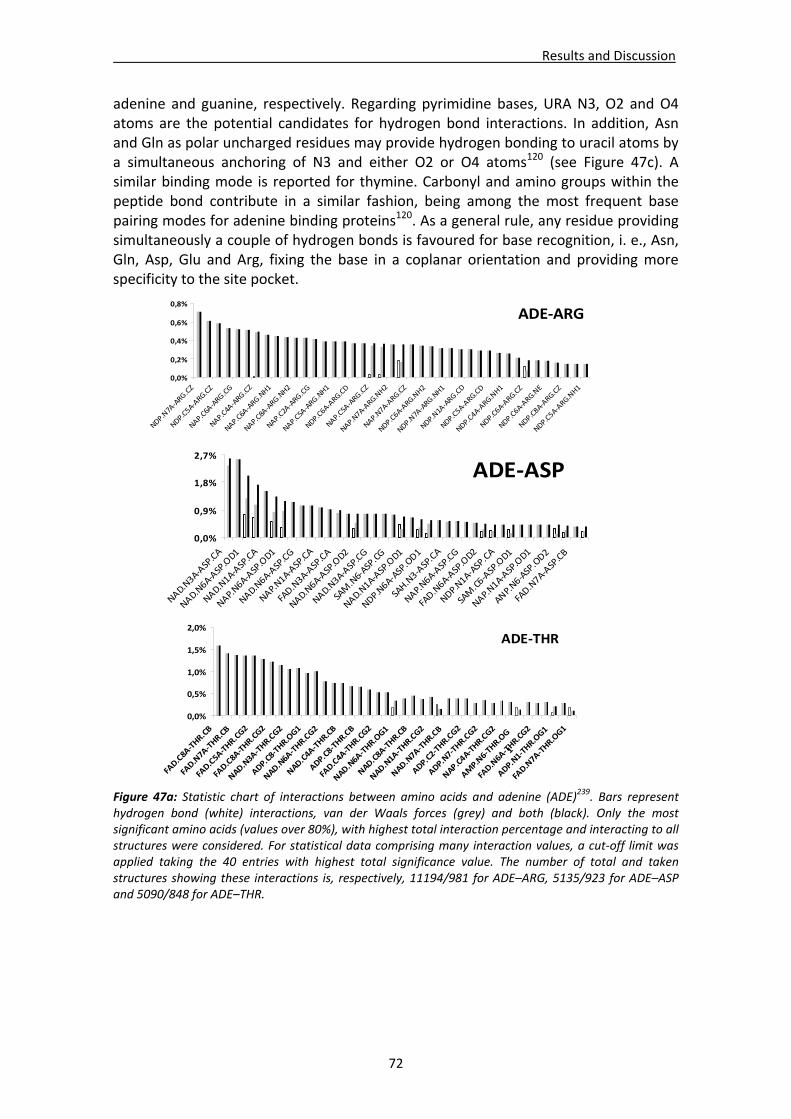
Results and Discussion
72
adenine and guanine, respectively. Regarding pyrimidine bases, URA N3, O2 and O4 atoms are the potential candidates for hydrogen bond interactions. In addition, Asn and Gln as polar uncharged residues may provide hydrogen bonding to uracil atoms by a simultaneous anchoring of N3 and either O2 or O4 atoms120 (see Figure 47c). A similar binding mode is reported for thymine. Carbonyl and amino groups within the peptide bond contribute in a similar fashion, being among the most frequent base pairing modes for adenine binding proteins120. As a general rule, any residue providing simultaneously a couple of hydrogen bonds is favoured for base recognition, i. e., Asn, Gln, Asp, Glu and Arg, fixing the base in a coplanar orientation and providing more specificity to the site pocket.
Figure 47a: Statistic chart of interactions between amino acids and adenine (ADE)239. Bars represent hydrogen bond (white) interactions, van der Waals forces (grey) and both (black). Only the most significant amino acids (values over 80%), with highest total interaction percentage and interacting to all structures were considered. For statistical data comprising many interaction values, a cut‐off limit was applied taking the 40 entries with highest total significance value. The number of total and taken structures showing these interactions is, respectively, 11194/981 for ADE–ARG, 5135/923 for ADE–ASP and 5090/848 for ADE–THR.
ADE‐THR
0,0%
0,5%
1,0%
1,5%
2,0%
FAD.C8A‐THR.CB
FAD.N7A‐THR.CB
FAD.C5A‐THR.CG2
FAD.C8A‐THR.CG2
NAD.N3A‐THR.CG2
ADP.C8‐THR.OG1
NAD.N6A‐THR.CG2
NAD.C4A‐THR.CB
ADP.C8‐THR.CB
FAD.C4A‐THR.CG2
NAD.N6A‐THR.OG1
NAD.C8A‐THR.CB
NAD.N1A‐THR.CG2
NAD.N7A‐THR.CB
ADP.C2‐THR.CG2
ADP.N7‐THR.CG2
NAP.C4A‐THR.CG2
AMP.N6‐THR.OG1
FAD.N6A‐THR.CG2
ADP.N1‐THR.OG1
FAD.N7A‐THR.OG1
ADE‐ASP
0,0%
0,9%
1,8%
2,7%
NAD.N3A‐ASP.CA
NAD.N6A‐ASP.OD1
NAD.N1A‐ASP.CA
NAP.N6A‐ASP.OD1
NAD.N6A‐ASP.CG
NAP.N1A‐ASP.CA
FAD.N3A‐ASP.CA
NAD.N6A‐ASP.OD2
NAD.N3A‐ASP.CG
SAM.N6‐ASP.CG
NAD.N1A‐ASP.OD1
NDP.N6A‐ASP.OD1
SAH.N3‐ASP.CA
NAP.N6A‐ASP.CG
FAD.N6A‐ASP.OD2
NDP.N1A‐ASP.CA
SAM.C6‐ASP.OD1
NAP.N1A‐ASP.OD1
ANP.N6‐ASP.OD2
FAD.N7A‐ASP.CB
ADE‐ARG
0,0%
0,2%
0,4%
0,6%
0,8%
NDP.N7A‐ARG.CZ
NDP.C5A‐ARG.CZ
NAP.C6A‐ARG.CG
NAP.C4A‐ARG.CZ
NAP.C6A‐ARG.NH1
NAP.C8A‐ARG.NH2
NAP.C2A‐ARG.CG
NAP.C5A‐ARG.NH1
NDP.C6A‐ARG.CD
NAP.C5A‐ARG.CZ
NAP.N7A‐ARG.NH2
NAP.N7A‐ARG.CZ
NDP.C6A‐ARG.NH2
NDP.N7A‐ARG.NH1
NDP.N1A‐ARG.CD
NDP.C5A‐ARG.CD
NDP.C4A‐ARG.NH1
NDP.C6A‐ARG.CZ
NDP.C6A‐ARG.NE
NDP.C8A‐ARG.CZ
NDP.C5A‐ARG.NH1
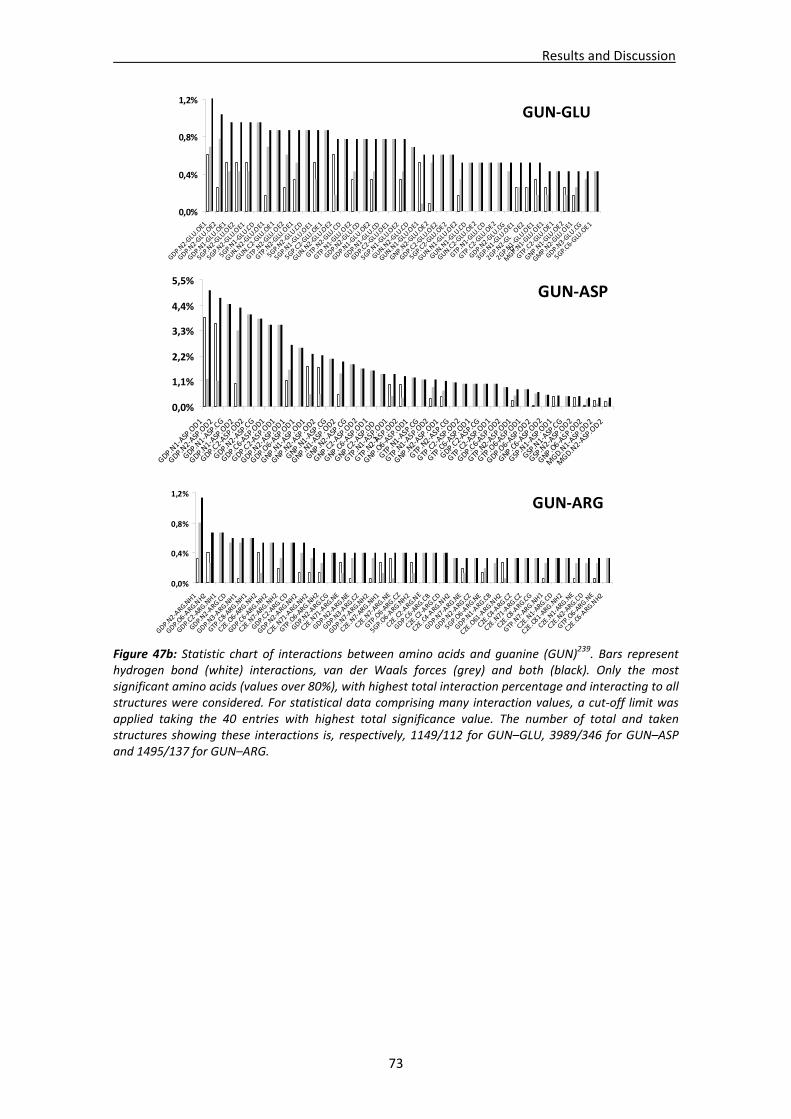
Results and Discussion
73
Figure 47b: Statistic chart of interactions between amino acids and guanine (GUN)239. Bars represent hydrogen bond (white) interactions, van der Waals forces (grey) and both (black). Only the most significant amino acids (values over 80%), with highest total interaction percentage and interacting to all structures were considered. For statistical data comprising many interaction values, a cut‐off limit was applied taking the 40 entries with highest total significance value. The number of total and taken structures showing these interactions is, respectively, 1149/112 for GUN–GLU, 3989/346 for GUN–ASP and 1495/137 for GUN–ARG.
GUN‐ARG
0,0%
0,4%
0,8%
1,2%
GDP.N2‐ARG.NH1
GDP.O6‐ARG.NH2
GDP.C2‐ARG.NH1
GDP.N2‐ARG.CD
GDP.N3‐ARG.NH1
GTP.C8‐ARG.NH1
C2E.O6‐ARG.NH2
GDP.C6‐ARG.NH2
C2E.N7‐ARG.NH2
GDP.C2‐ARG.CD
GDP.N2‐ARG.NH2
C2E.N71‐ARG.NH2
GTP.O6‐ARG.NH2
GDP.N2‐ARG.CG
C2E.N71‐ARG.NE
GDP.N2‐ARG.NE
GDP.N3‐ARG.CZ
GDP.N7‐ARG.NH2
C2E.N7‐ARG.NH1
C2E.N7‐ARG.NE
GTP.O6‐ARG.CZ
5GP.O6‐ARG.NH2
C2E.C2‐ARG.NE
GDP.C6‐ARG.CB
C2E.C2‐ARG.CD
C2E.C4‐ARG.NH2
GDP.N7‐ARG.NE
GDP.N2‐ARG.CZ
5GP.O6‐ARG.NE
GDP.N1‐ARG.CB
C2E.O61‐ARG.NH2
C2E.C4‐ARG.CZ
C2E.N71‐ARG.CZ
C2E.C8‐ARG.CG
GTP.N7‐ARG.NH1
C2E.N1‐ARG.CD
C2E.C81‐ARG.NH2
C2E.N1‐ARG.NE
C2E.N2‐ARG.CD
GTP.O6‐ARG.NE
C2E.C6‐ARG.NH2
GUN‐ASP
0,0%
1,1%
2,2%
3,3%
4,4%
5,5%
GDP.N1‐ASP.OD1
GDP.N2‐ASP.OD2
GDP.N1‐ASP.CG
GDP.N1‐ASP.OD2
GDP.C2‐ASP.OD2
GDP.N2‐ASP.CG
GDP.C6‐ASP.OD1
GDP.C2‐ASP.OD1
GDP.N2‐ASP.OD1
GDP.O6‐ASP.OD1
GNP.N1‐ASP.OD1
GNP.N2‐ASP.OD2
GNP.N1‐ASP.CG
GNP.N1‐ASP.OD2
GNP.N2‐ASP.CG
GNP.C2‐ASP.OD2
GNP.C6‐ASP.OD1
GNP.C2‐ASP.OD1
GTP.N1‐ASP.OD1
GTP.N2‐ASP.OD2
GNP.O6‐ASP.OD1
GTP.N1‐ASP.CG
GTP.N1‐ASP.OD2
GNP.N2‐ASP.OD1
GTP.N2‐ASP.CG
GTP.C2‐ASP.OD2
GTP.C6‐ASP.OD1
GDP.C2‐ASP.CG
GTP.C2‐ASP.OD1
GDP.C6‐ASP.OD2
GTP.N2‐ASP.OD1
GTP.O6‐ASP.OD1
GDP.O6‐ASP.OD2
GNP.C6‐ASP.OD2
GSP.N1‐ASP.OD1
GSP.N1‐ASP.CG
GSP.N2‐ASP.OD2
GNP.O6‐ASP.OD2
MGD.N1‐ASP.OD2
MGD.N2‐ASP.OD2
GUN‐GLU
0,0%
0,4%
0,8%
1,2%
GDP.N2‐GLU.OE1
GDP.N2‐GLU.OE2
GDP.N1‐GLU.OE1
5GP.N2‐GLU.OE2
5GP.N2‐GLU.OE1
5GP.N1‐GLU.CD
GUN.N2‐GLU.OE1
GUN.C2‐GLU.OE1
GTP.N2‐GLU.OE2
GTP.N2‐GLU.OE1
5GP.N2‐GLU.CD
5GP.N1‐GLU.OE1
5GP.C2‐GLU.OE1
GUN.N2‐GLU.OE2
GTP.N2‐GLU.CD
GTP.N1‐GLU.OE2
GDP.N2‐GLU.CD
GDP.N1‐GLU.OE2
GDP.N1‐GLU.CD
GDP.C2‐GLU.OE1
5GP.N1‐GLU.OE2
GUN.N2‐GLU.CD
GUN.N1‐GLU.OE1
GNP.N2‐GLU.OE2
GDP.C2‐GLU.OE2
5GP.C2‐GLU.OE2
GUN.N1‐GLU.OE2
GUN.N1‐GLU.CD
GUN.C2‐GLU.OE2
GTP.N1‐GLU.CD
GTP.C2‐GLU.OE2
GDP.N2‐GLU.CG
3GP.N1‐GLU.OE1
2GP.N2‐GLU.OE2
2GP.N1‐GLU.OE1
MGP.N1‐GLU.OE1
GTP.C2‐GLU.OE1
GNP.N1‐GLU.OE2
GMP.N2‐GLU.OE1
GDP.N3‐GLU.CG
5GP.C6‐GLU.OE1
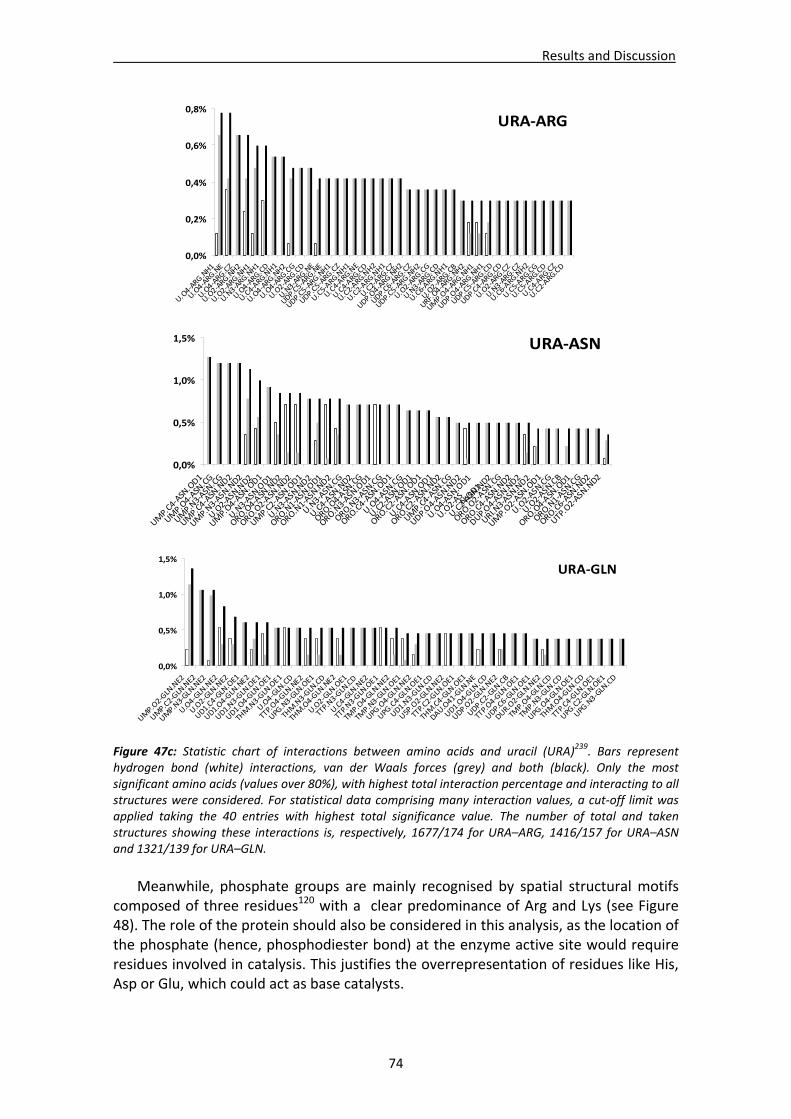
Results and Discussion
74
Figure 47c: Statistic chart of interactions between amino acids and uracil (URA)239. Bars represent hydrogen bond (white) interactions, van der Waals forces (grey) and both (black). Only the most significant amino acids (values over 80%), with highest total interaction percentage and interacting to all structures were considered. For statistical data comprising many interaction values, a cut‐off limit was applied taking the 40 entries with highest total significance value. The number of total and taken structures showing these interactions is, respectively, 1677/174 for URA–ARG, 1416/157 for URA–ASN and 1321/139 for URA–GLN.
Meanwhile, phosphate groups are mainly recognised by spatial structural motifs
composed of three residues120 with a clear predominance of Arg and Lys (see Figure 48). The role of the protein should also be considered in this analysis, as the location of the phosphate (hence, phosphodiester bond) at the enzyme active site would require residues involved in catalysis. This justifies the overrepresentation of residues like His, Asp or Glu, which could act as base catalysts.
URA‐GLN
0,0%
0,5%
1,0%
1,5%
UMP.O2‐GLN.NE2
UMP.C2‐GLN.NE2
UMP.N3‐GLN.NE2
U.O4‐GLN.NE2
U.O2‐GLN.NE2
UD1.C4‐GLN.OE1
UD1.O4‐GLN.NE2
UD1.N3‐GLN.OE1
UD1.O4‐GLN.OE1
THM.N3‐GLN.OE1
U.O4‐GLN.CD
TTP.O4‐GLN.NE2
UPG.N3‐GLN.OE1
THM.N3‐GLN.CD
THM.O4‐GLN.NE2
U.O2‐GLN.OE1
TTP.N3‐GLN.CD
U.C4‐GLN.NE2
TTP.N3‐GLN.OE1
TMP.O4‐GLN.NE2
TMP.N3‐GLN.OE1
UPG.O4‐GLN.NE2
UPG.C4‐GLN.OE1
UD1.N3‐GLN.CD
U5P.O2‐GLN.NE2
TTP.C2‐GLN.OE1
THM.C4‐GLN.OE1
DAU.O41‐GLN.NE
UD1.O4‐GLN.CD
UDP.O2‐GLN.NE2
UDP.C2‐GLN.CB
TTP.O4‐GLN.OE1
UDP.C6‐GLN.OE1
DUR.O2‐GLN.NE2
TMP.O4‐GLN.CD
TMP.N3‐GLN.CD
UPG.O4‐GLN.OE1
THM.O4‐GLN.CD
TTP.C4‐GLN.OE1
UPG.C2‐GLN.OE1
UPG.N3‐GLN.CD
URA‐ASN
0,0%
0,5%
1,0%
1,5%
UMP.C4‐ASN.OD1
UMP.O4‐ASN.CG
UMP.N3‐ASN.CG
UMP.C4‐ASN.ND2
UMP.N3‐ASN.ND2
U.O2‐ASN.ND2
UMP.O4‐ASN.OD1
U.N3‐ASN.OD1
ORO.O4‐ASN.ND2
ORO.O2‐ASN.ND2
UMP.C2‐ASN.OD1
U.N3‐ASN.ND2
ORO.N1‐ASN.OD1
ORO.N1‐ASN.ND2
U.N3‐ASN.CG
U.C4‐ASN.ND2
ORO.O4‐ASN.CG
ORO.N3‐ASN.OD1
ORO.N3‐ASN.CG
ORO.C4‐ASN.OD1
U.O4‐ASN.CG
U.C2‐ASN.OD1
ORO.C2‐ASN.OD1
U.C4‐ASN.OD1
ORO.C2‐ASN.ND2
UMP.C4‐ASN.CG
UDP.O4‐ASN.ND2
U.O4‐ASN.OD1
U.O2‐ASN.OD1
U.C2‐ASN.ND2
ORO.O2‐ASN.CG
ORO.C4‐ASN.ND2
DUP.O4‐ASN.ND2
URI.N3‐ASN.ND2
UMP.O2‐ASN.OD1
U.O2‐ASN.CG
U.O2‐ASN.CB
ORO.O4‐ASN.OD1
ORO.N1‐ASN.CG
ORO.C6‐ASN.ND2
UTP.O2‐ASN.ND2
URA‐ARG
0,0%
0,2%
0,4%
0,6%
0,8%
U.O4‐ARG.NH1
U.O4‐ARG.NE
U.O4‐ARG.CZ
U.O2‐ARG.NH2
U.O2‐ARG.NH1
U.N3‐ARG.NH1
U.O4‐ARG.CD
U.C4‐ARG.NH1
U.O4‐ARG.NH2
U.O4‐ARG.CG
U.O2‐ARG.CD
U.N3‐ARG.NE
UDP.C5‐ARG.NE
UDP.C5‐ARG.NH1
UDP.C5‐ARG.CZ
U.C5‐ARG.NH1
U.C4‐ARG.NE
U.C4‐ARG.CD
U.C2‐ARG.NH2
U.C2‐ARG.NH1
U.C2‐ARG.CZ
UDP.O4‐ARG.NH2
UDP.C6‐ARG.CZ
UDP.C5‐ARG.NH2
U.O2‐ARG.CG
U.N3‐ARG.CD
U.C6‐ARG.NH1
U.O2‐ARG.CB
URF.O4‐ARG.NH2
UMP.O4‐ARG.NH1
UDP.O4‐ARG.NH1
UDP.C5‐ARG.CD
UDP.C4‐ARG.CD
U.O2‐ARG.CZ
U.N3‐ARG.CZ
U.C6‐ARG.NH2
U.C5‐ARG.CG
U.C5‐ARG.CD
U.C4‐ARG.CZ
U.C2‐ARG.CD
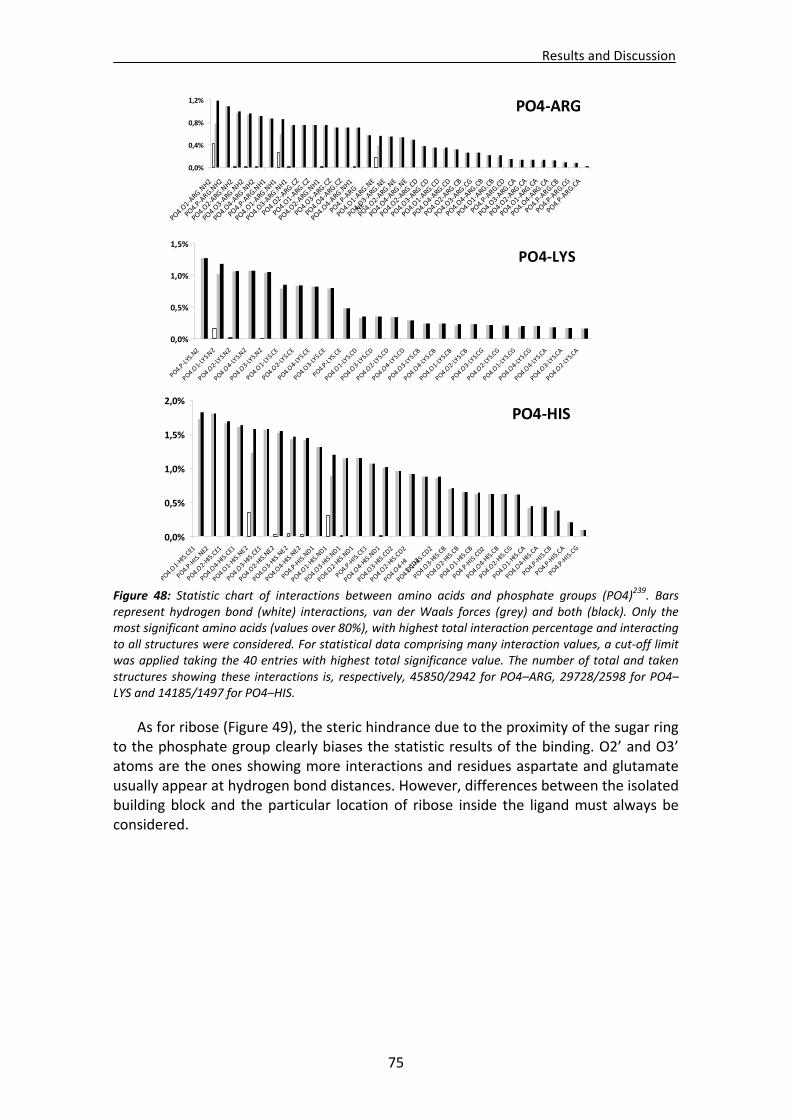
Results and Discussion
75
Figure 48: Statistic chart of interactions between amino acids and phosphate groups (PO4)239. Bars represent hydrogen bond (white) interactions, van der Waals forces (grey) and both (black). Only the most significant amino acids (values over 80%), with highest total interaction percentage and interacting to all structures were considered. For statistical data comprising many interaction values, a cut‐off limit was applied taking the 40 entries with highest total significance value. The number of total and taken structures showing these interactions is, respectively, 45850/2942 for PO4–ARG, 29728/2598 for PO4–LYS and 14185/1497 for PO4–HIS.
As for ribose (Figure 49), the steric hindrance due to the proximity of the sugar ring to the phosphate group clearly biases the statistic results of the binding. O2’ and O3’ atoms are the ones showing more interactions and residues aspartate and glutamate usually appear at hydrogen bond distances. However, differences between the isolated building block and the particular location of ribose inside the ligand must always be considered.
PO4‐HIS
0,0%
0,5%
1,0%
1,5%
2,0%
PO4.O1‐HIS.CE1
PO4.P‐HIS.NE2
PO4.O2‐HIS.CE1
PO4.O4‐HIS.CE1
PO4.O1‐HIS.NE2
PO4.O3‐HIS.CE1
PO4.O2‐HIS.NE2
PO4.O3‐HIS.NE2
PO4.O4‐HIS.NE2
PO4.P‐HIS.ND1
PO4.O1‐HIS.ND1
PO4.O3‐HIS.ND1
PO4.O2‐HIS.ND1
PO4.P‐HIS.CE1
PO4.O4‐HIS.ND1
PO4.O3‐HIS.CD2
PO4.O2‐HIS.CD2
PO4.O4‐HIS.CD2
PO4.O1‐HIS.CD2
PO4.O3‐HIS.CB
PO4.O2‐HIS.CB
PO4.O1‐HIS.CB
PO4.P‐HIS.CD2
PO4.O4‐HIS.CB
PO4.O2‐HIS.CG
PO4.O1‐HIS.CA
PO4.O4‐HIS.CA
PO4.P‐HIS.CB
PO4.P‐HIS.CA
PO4.P‐HIS.CG
PO4‐LYS
0,0%
0,5%
1,0%
1,5%
PO4.P‐LYS.NZ
PO4.O1‐LYS.NZ
PO4.O2‐LYS.NZ
PO4.O4‐LYS.NZ
PO4.O3‐LYS.NZ
PO4.O1‐LYS.CE
PO4.O2‐LYS.CE
PO4.O4‐LYS.CE
PO4.O3‐LYS.CE
PO4.P‐LYS.CE
PO4.O1‐LYS.CD
PO4.O3‐LYS.CD
PO4.O2‐LYS.CD
PO4.O4‐LYS.CD
PO4.O3‐LYS.CB
PO4.O4‐LYS.CB
PO4.O1‐LYS.CB
PO4.O2‐LYS.CB
PO4.O3‐LYS.CG
PO4.O2‐LYS.CG
PO4.O1‐LYS.CG
PO4.O4‐LYS.CG
PO4.O4‐LYS.CA
PO4.O3‐LYS.CA
PO4.O2‐LYS.CA
PO4‐ARG
0,0%
0,4%
0,8%
1,2%
PO4.O1‐ARG.NH2
PO4.P‐ARG.NH2
PO4.O2‐ARG.NH2
PO4.O3‐ARG.NH2
PO4.O4‐ARG.NH2
PO4.P‐ARG.NH1
PO4.O1‐ARG.NH1
PO4.O3‐ARG.NH1
PO4.O2‐ARG.CZ
PO4.O1‐ARG.CZ
PO4.O2‐ARG.NH1
PO4.O3‐ARG.CZ
PO4.O4‐ARG.CZ
PO4.O4‐ARG.NH1
PO4.P‐ARG.NE
PO4.O1‐ARG.NE
PO4.O3‐ARG.NE
PO4.O2‐ARG.NE
PO4.O4‐ARG.NE
PO4.O2‐ARG.CD
PO4.O3‐ARG.CD
PO4.O1‐ARG.CD
PO4.O4‐ARG.CD
PO4.O2‐ARG.CB
PO4.O3‐ARG.CG
PO4.O4‐ARG.CB
PO4.O1‐ARG.CB
PO4.P‐ARG.CD
PO4.O3‐ARG.CA
PO4.O2‐ARG.CA
PO4.O1‐ARG.CA
PO4.O4‐ARG.CA
PO4.P‐ARG.CB
PO4.P‐ARG.CG
PO4.P‐ARG.CA
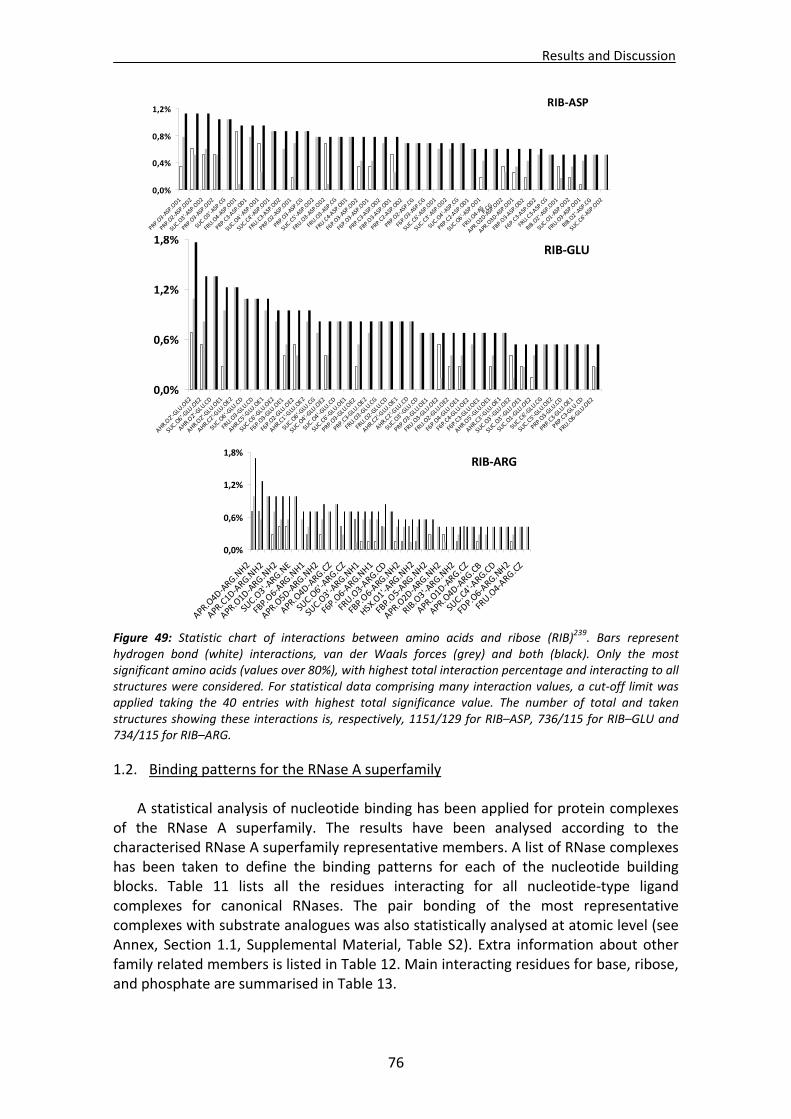
Results and Discussion
76
Figure 49: Statistic chart of interactions between amino acids and ribose (RIB)239. Bars represent hydrogen bond (white) interactions, van der Waals forces (grey) and both (black). Only the most significant amino acids (values over 80%), with highest total interaction percentage and interacting to all structures were considered. For statistical data comprising many interaction values, a cut‐off limit was applied taking the 40 entries with highest total significance value. The number of total and taken structures showing these interactions is, respectively, 1151/129 for RIB–ASP, 736/115 for RIB–GLU and 734/115 for RIB–ARG.
1.2. Binding patterns for the RNase A superfamily
A statistical analysis of nucleotide binding has been applied for protein complexes of the RNase A superfamily. The results have been analysed according to the characterised RNase A superfamily representative members. A list of RNase complexes has been taken to define the binding patterns for each of the nucleotide building blocks. Table 11 lists all the residues interacting for all nucleotide‐type ligand complexes for canonical RNases. The pair bonding of the most representative complexes with substrate analogues was also statistically analysed at atomic level (see Annex, Section 1.1, Supplemental Material, Table S2). Extra information about other family related members is listed in Table 12. Main interacting residues for base, ribose, and phosphate are summarised in Table 13.
RIB‐ARG
0,0%
0,6%
1,2%
1,8%
APR.O4D‐ARG.NH2
APR.C1D‐ARG.NH2
APR.O1D‐ARG.NH2
SUC.O3'‐ARG.NE
FBP.O6‐ARG.NH1
APR.O5D‐ARG.NH2
APR.O4D‐ARG.CZ
SUC.O6'‐ARG.CZ
SUC.O3'‐ARG.NH1
F6P.O6‐ARG.NH1
FRU.O3‐ARG.CD
FBP.O6‐ARG.NH2
HSX.O1'‐ARG.NH2
FBP.O5‐ARG.NH2
APR.O2D‐ARG.NH2
RIB.O3'‐ARG.NH2
APR.O1D‐ARG.CZ
APR.O4D‐ARG.CB
SUC.C4'‐ARG.CD
FDP.O6‐ARG.NH2
FRU.O4‐ARG.CZ
RIB‐GLU
0,0%
0,6%
1,2%
1,8%
AHR.O2'‐GLU.OE2
SUC.O6'‐GLU.OE2
AHR.O2'‐GLU.CD
AHR.O2'‐GLU.OE1
AHR.C2'‐GLU.OE2
SUC.O6'‐GLU.CD
FRU.O3‐GLU.CD
AHR.C5'‐GLU.OE1
SUC.C6'‐GLU.OE2
F6P.O3‐GLU.OE1
F6P.O2‐GLU.OE2
AHR.C1'‐GLU.OE2
SUC.O6'‐GLU.CG
SUC.O4'‐GLU.OE2
SUC.O4'‐GLU.CD
SUC.C6'‐GLU.OE1
PRP.O3‐GLU.OE2
PRP.C3‐GLU.OE2
FRU.O3‐GLU.CG
FRU.O2‐GLU.CD
AHR.C2'‐GLU.OE1
AHR.C2'‐GLU.CD
SUC.O3'‐GLU.CD
PRP.O3‐GLU.OE1
FRU.O3‐GLU.OE2
FRU.O2‐GLU.OE2
F6P.O4‐GLU.OE1
F6P.C4‐GLU.OE2
F6P.C3‐GLU.OE1
AHR.O5'‐GLU.OE1
AHR.C3'‐GLU.OE1
SUC.O3'‐GLU.OE2
SUC.O3'‐GLU.OE1
SUC.O1‐GLU.OE2
SUC.C6'‐GLU.CG
SUC.C5'‐GLU.OE2
PRP.O3‐GLU.CD
PRP.C3‐GLU.OE1
PRP.C3‐GLU.CD
FRU.O6‐GLU.OE2
RIB‐ASP
0,0%
0,4%
0,8%
1,2%
PRP.O3‐ASP.OD1
PRP.O2‐ASP.OD2
SUC.O3'‐ASP.OD2
PRP.O3‐ASP.OD2
SUC.O3'‐ASP.CG
FRU.O4‐ASP.OD1
PRP.C3‐ASP.OD1
SUC.O4'‐ASP.OD1
SUC.C4'‐ASP.OD1
FRU.C3‐ASP.OD2
PRP.O2‐ASP.OD1
PRP.O3‐ASP.CG
SUC.C5'‐ASP.OD2
FRU.O3‐ASP.OD2
FRU.O3‐ASP.CG
FRU.C4‐ASP.OD1
F6P.O3‐ASP.OD2
F6P.O3‐ASP.OD1
PRP.C3‐ASP.OD2
FBP.O3‐ASP.OD1
PRP.C2‐ASP.OD2
PRP.O2‐ASP.CG
F6P.O3‐ASP.CG
SUC.C6'‐ASP.OD1
SUC.C3'‐ASP.OD2
SUC.O4'‐ASP.CG
PRP.C2‐ASP.OD1
SUC.O6'‐ASP.OD1
FRU.O4‐ASP.CG
APR.O2D‐ASP.OD2
APR.O3D‐ASP.OD1
FBP.O3‐ASP.OD2
F6P.C3‐ASP.OD2
FRU.C3‐ASP.CG
RIB.O2'‐ASP.OD1
SUC.O1‐ASP.OD2
FRU.O3‐ASP.OD1
RIB.O2'‐ASP.CG
SUC.C6'‐ASP.OD2
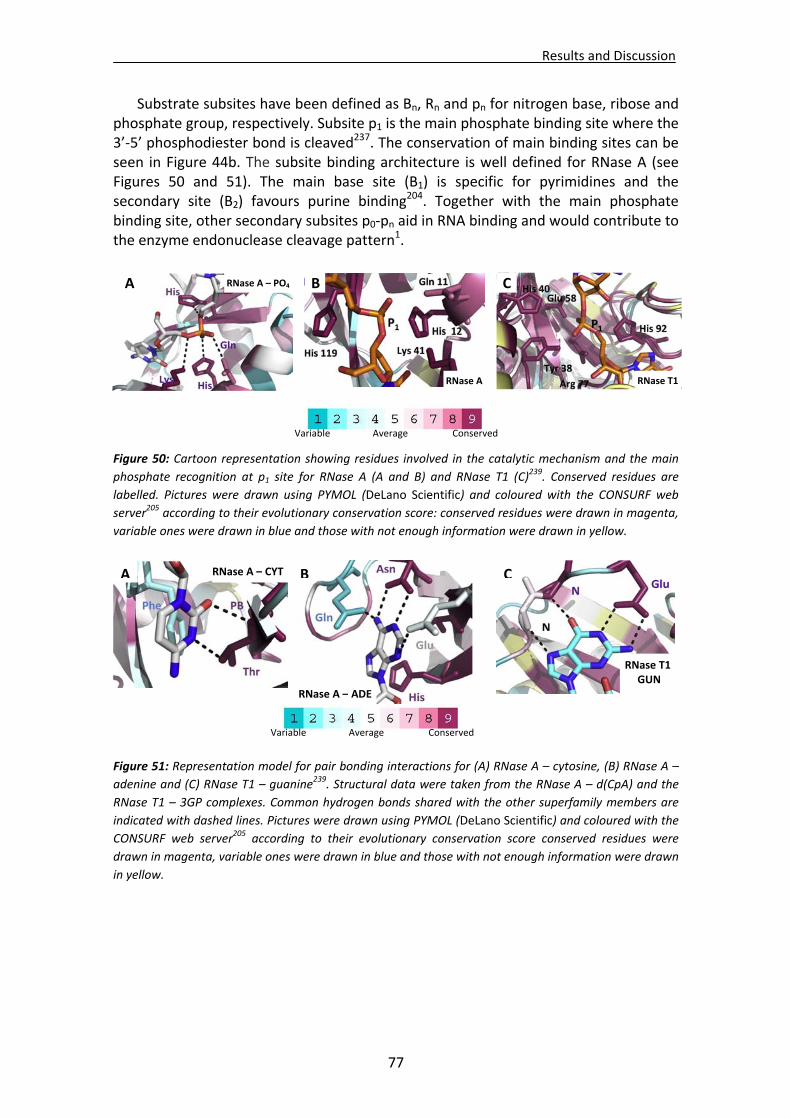
Results and Discussion
77
Substrate subsites have been defined as Bn, Rn and pn for nitrogen base, ribose and phosphate group, respectively. Subsite p1 is the main phosphate binding site where the 3’‐5’ phosphodiester bond is cleaved237. The conservation of main binding sites can be seen in Figure 44b. The subsite binding architecture is well defined for RNase A (see Figures 50 and 51). The main base site (B1) is specific for pyrimidines and the secondary site (B2) favours purine binding
204. Together with the main phosphate binding site, other secondary subsites p0‐pn aid in RNA binding and would contribute to the enzyme endonuclease cleavage pattern1.
Figure 50: Cartoon representation showing residues involved in the catalytic mechanism and the main
phosphate recognition at p1 site for RNase A (A and B) and RNase T1 (C)239. Conserved residues are
labelled. Pictures were drawn using PYMOL (DeLano Scientific) and coloured with the CONSURF web
server205 according to their evolutionary conservation score: conserved residues were drawn in magenta,
variable ones were drawn in blue and those with not enough information were drawn in yellow.
Figure 51: Representation model for pair bonding interactions for (A) RNase A – cytosine, (B) RNase A –
adenine and (C) RNase T1 – guanine239. Structural data were taken from the RNase A – d(CpA) and the
RNase T1 – 3GP complexes. Common hydrogen bonds shared with the other superfamily members are
indicated with dashed lines. Pictures were drawn using PYMOL (DeLano Scientific) and coloured with the
CONSURF web server205 according to their evolutionary conservation score conserved residues were
drawn in magenta, variable ones were drawn in blue and those with not enough information were drawn
in yellow.
A RNase A – PO4 B
RNase A
C
RNase T1
Variable Average Conserved
A RNase A – CYT B
RNase A – ADE
RNase T1 GUN
C
Variable Average Conserved
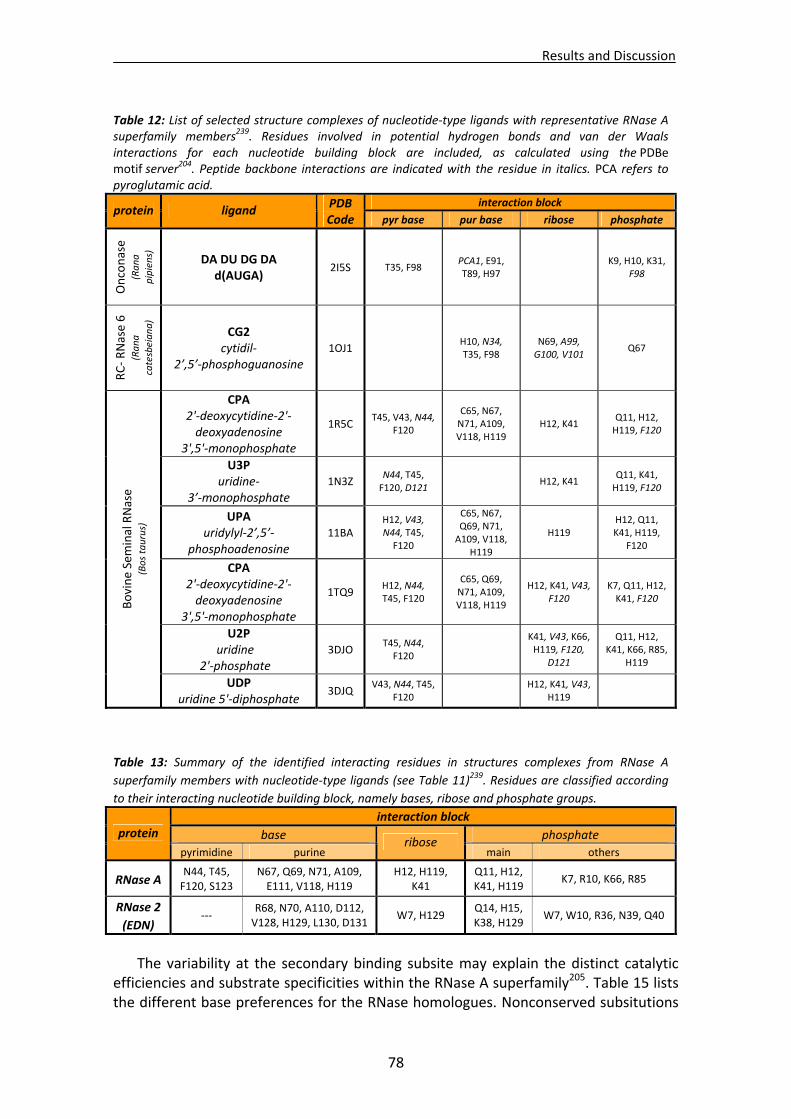
Results and Discussion
78
The variability at the secondary binding subsite may explain the distinct catalytic efficiencies and substrate specificities within the RNase A superfamily205. Table 15 lists the different base preferences for the RNase homologues. Nonconserved subsitutions
Table 12: List of selected structure complexes of nucleotide‐type ligands with representative RNase A superfamily members239. Residues involved in potential hydrogen bonds and van der Waals interactions for each nucleotide building block are included, as calculated using the PDBe motif server204. Peptide backbone interactions are indicated with the residue in italics. PCA refers to pyroglutamic acid.
interaction block protein ligand
PDB Code pyr base pur base ribose phosphate
Onconase
(Rana
pipiens)
DA DU DG DA d(AUGA)
2I5S T35, F98 PCA1, E91, T89, H97
K9, H10, K31,
F98
RC‐ RNase 6
(Rana
catesbeiana)
CG2 cytidil‐
2’,5’‐phosphoguanosine 1OJ1
H10, N34, T35, F98
N69, A99, G100, V101
Q67
CPA 2'‐deoxycytidine‐2'‐deoxyadenosine
3',5'‐monophosphate
1R5C T45, V43, N44,
F120
C65, N67, N71, A109, V118, H119
H12, K41 Q11, H12, H119, F120
U3P uridine‐
3’‐monophosphate 1N3Z
N44, T45, F120, D121
H12, K41 Q11, K41, H119, F120
UPA uridylyl‐2’,5’‐
phosphoadenosine 11BA
H12, V43, N44, T45, F120
C65, N67, Q69, N71, A109, V118,
H119
H119 H12, Q11, K41, H119,
F120
CPA 2'‐deoxycytidine‐2'‐deoxyadenosine
3',5'‐monophosphate
1TQ9 H12, N44, T45, F120
C65, Q69, N71, A109, V118, H119
H12, K41, V43, F120
K7, Q11, H12, K41, F120
U2P uridine
2'‐phosphate 3DJO
T45, N44, F120
K41, V43, K66, H119, F120,
D121
Q11, H12, K41, K66, R85,
H119
Bovine Seminal RNase
(Bos taurus)
UDP uridine 5'‐diphosphate
3DJQ V43, N44, T45,
F120
H12, K41, V43, H119
Table 13: Summary of the identified interacting residues in structures complexes from RNase A
superfamily members with nucleotide‐type ligands (see Table 11)239. Residues are classified according
to their interacting nucleotide building block, namely bases, ribose and phosphate groups.
interaction block
base phosphate protein
pyrimidine purine ribose
main others
RNase A N44, T45, F120, S123
N67, Q69, N71, A109, E111, V118, H119
H12, H119, K41
Q11, H12, K41, H119
K7, R10, K66, R85
RNase 2
(EDN) ‐‐‐
R68, N70, A110, D112, V128, H129, L130, D131
W7, H129 Q14, H15, K38, H129
W7, W10, R36, N39, Q40
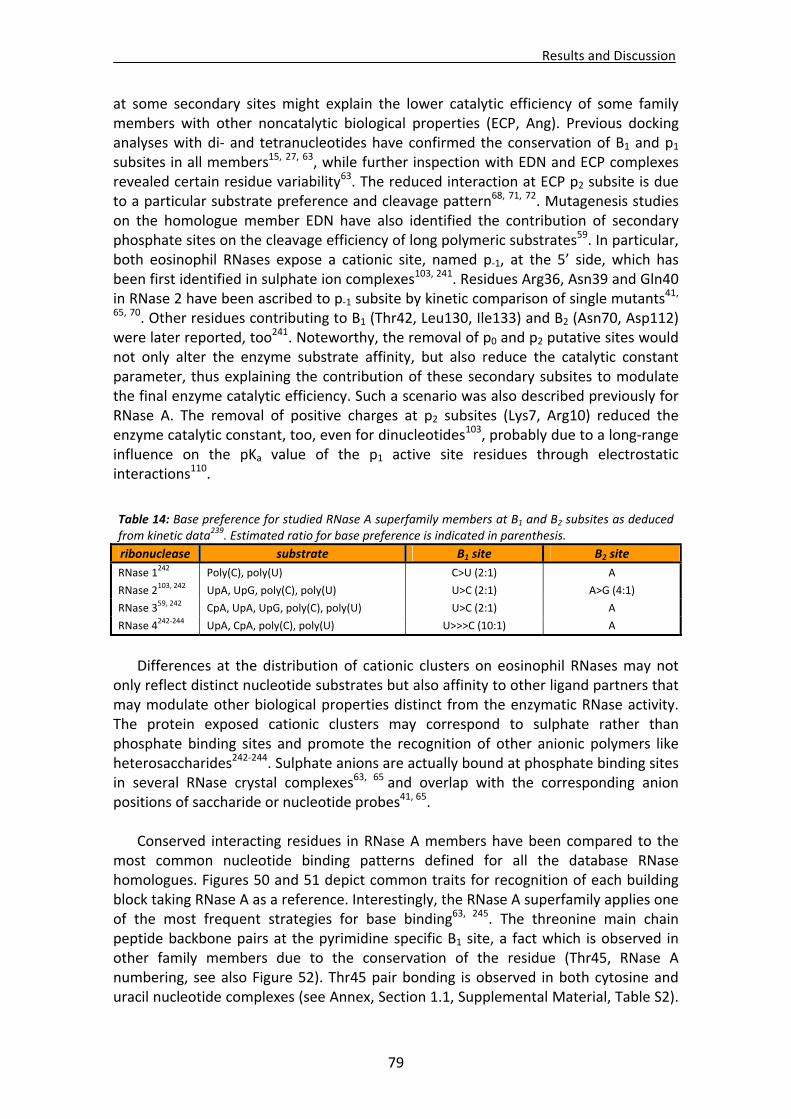
Results and Discussion
79
at some secondary sites might explain the lower catalytic efficiency of some family members with other noncatalytic biological properties (ECP, Ang). Previous docking analyses with di‐ and tetranucleotides have confirmed the conservation of B1 and p1 subsites in all members15, 27, 63, while further inspection with EDN and ECP complexes revealed certain residue variability63. The reduced interaction at ECP p2 subsite is due to a particular substrate preference and cleavage pattern68, 71, 72. Mutagenesis studies on the homologue member EDN have also identified the contribution of secondary phosphate sites on the cleavage efficiency of long polymeric substrates59. In particular, both eosinophil RNases expose a cationic site, named p‐1, at the 5’ side, which has been first identified in sulphate ion complexes103, 241. Residues Arg36, Asn39 and Gln40 in RNase 2 have been ascribed to p‐1 subsite by kinetic comparison of single mutants41, 65, 70. Other residues contributing to B1 (Thr42, Leu130, Ile133) and B2 (Asn70, Asp112) were later reported, too241. Noteworthy, the removal of p0 and p2 putative sites would not only alter the enzyme substrate affinity, but also reduce the catalytic constant parameter, thus explaining the contribution of these secondary subsites to modulate the final enzyme catalytic efficiency. Such a scenario was also described previously for RNase A. The removal of positive charges at p2 subsites (Lys7, Arg10) reduced the enzyme catalytic constant, too, even for dinucleotides103, probably due to a long‐range influence on the pKa value of the p1 active site residues through electrostatic interactions110.
Differences at the distribution of cationic clusters on eosinophil RNases may not
only reflect distinct nucleotide substrates but also affinity to other ligand partners that may modulate other biological properties distinct from the enzymatic RNase activity. The protein exposed cationic clusters may correspond to sulphate rather than phosphate binding sites and promote the recognition of other anionic polymers like heterosaccharides242‐244. Sulphate anions are actually bound at phosphate binding sites in several RNase crystal complexes63, 65 and overlap with the corresponding anion positions of saccharide or nucleotide probes41, 65.
Conserved interacting residues in RNase A members have been compared to the most common nucleotide binding patterns defined for all the database RNase homologues. Figures 50 and 51 depict common traits for recognition of each building block taking RNase A as a reference. Interestingly, the RNase A superfamily applies one of the most frequent strategies for base binding63, 245. The threonine main chain peptide backbone pairs at the pyrimidine specific B1 site, a fact which is observed in other family members due to the conservation of the residue (Thr45, RNase A numbering, see also Figure 52). Thr45 pair bonding is observed in both cytosine and uracil nucleotide complexes (see Annex, Section 1.1, Supplemental Material, Table S2).
Table 14: Base preference for studied RNase A superfamily members at B1 and B2 subsites as deduced from kinetic data239. Estimated ratio for base preference is indicated in parenthesis.
ribonuclease substrate B1 site B2 site
RNase 1242 Poly(C), poly(U) C>U (2:1) A
RNase 2103, 242 UpA, UpG, poly(C), poly(U) U>C (2:1) A>G (4:1)
RNase 359, 242 CpA, UpA, UpG, poly(C), poly(U) U>C (2:1) A
RNase 4242‐244 UpA, CpA, poly(C), poly(U) U>>>C (10:1) A
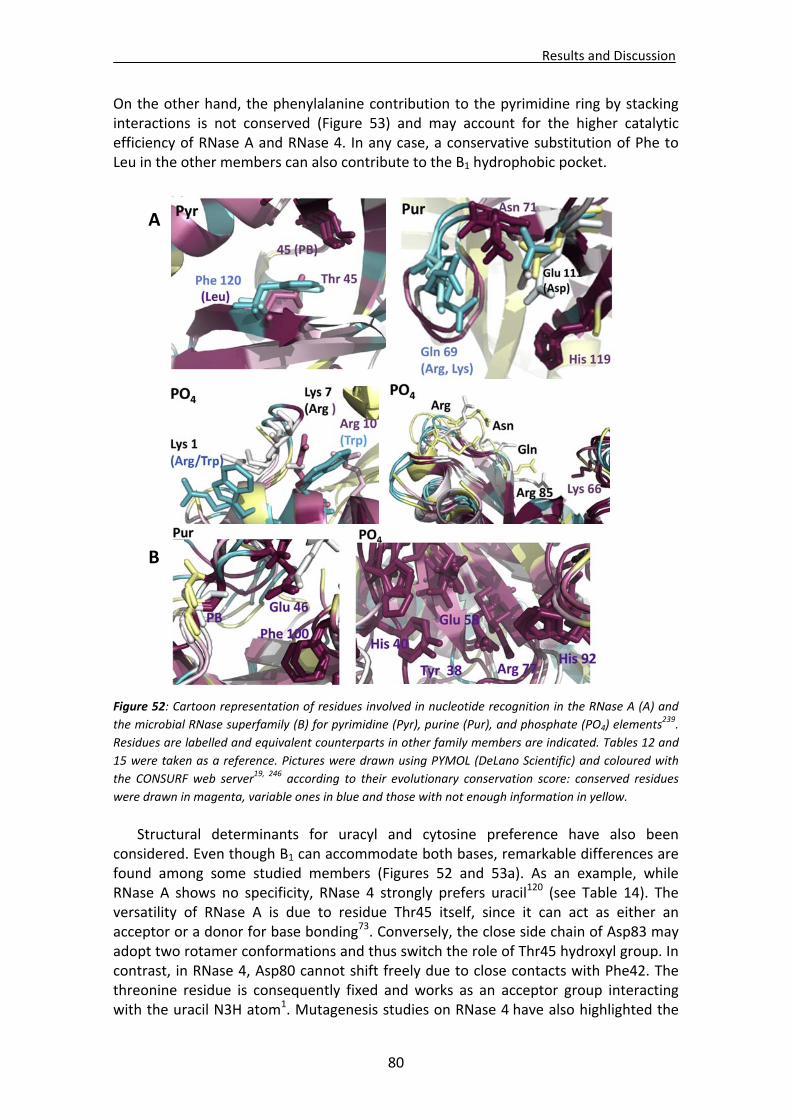
Results and Discussion
80
On the other hand, the phenylalanine contribution to the pyrimidine ring by stacking interactions is not conserved (Figure 53) and may account for the higher catalytic efficiency of RNase A and RNase 4. In any case, a conservative substitution of Phe to Leu in the other members can also contribute to the B1 hydrophobic pocket.
Figure 52: Cartoon representation of residues involved in nucleotide recognition in the RNase A (A) and
the microbial RNase superfamily (B) for pyrimidine (Pyr), purine (Pur), and phosphate (PO4) elements239.
Residues are labelled and equivalent counterparts in other family members are indicated. Tables 12 and
15 were taken as a reference. Pictures were drawn using PYMOL (DeLano Scientific) and coloured with
the CONSURF web server19, 246 according to their evolutionary conservation score: conserved residues
were drawn in magenta, variable ones in blue and those with not enough information in yellow.
Structural determinants for uracyl and cytosine preference have also been
considered. Even though B1 can accommodate both bases, remarkable differences are found among some studied members (Figures 52 and 53a). As an example, while RNase A shows no specificity, RNase 4 strongly prefers uracil120 (see Table 14). The versatility of RNase A is due to residue Thr45 itself, since it can act as either an acceptor or a donor for base bonding73. Conversely, the close side chain of Asp83 may adopt two rotamer conformations and thus switch the role of Thr45 hydroxyl group. In contrast, in RNase 4, Asp80 cannot shift freely due to close contacts with Phe42. The threonine residue is consequently fixed and works as an acceptor group interacting with the uracil N3H atom1. Mutagenesis studies on RNase 4 have also highlighted the
B
A
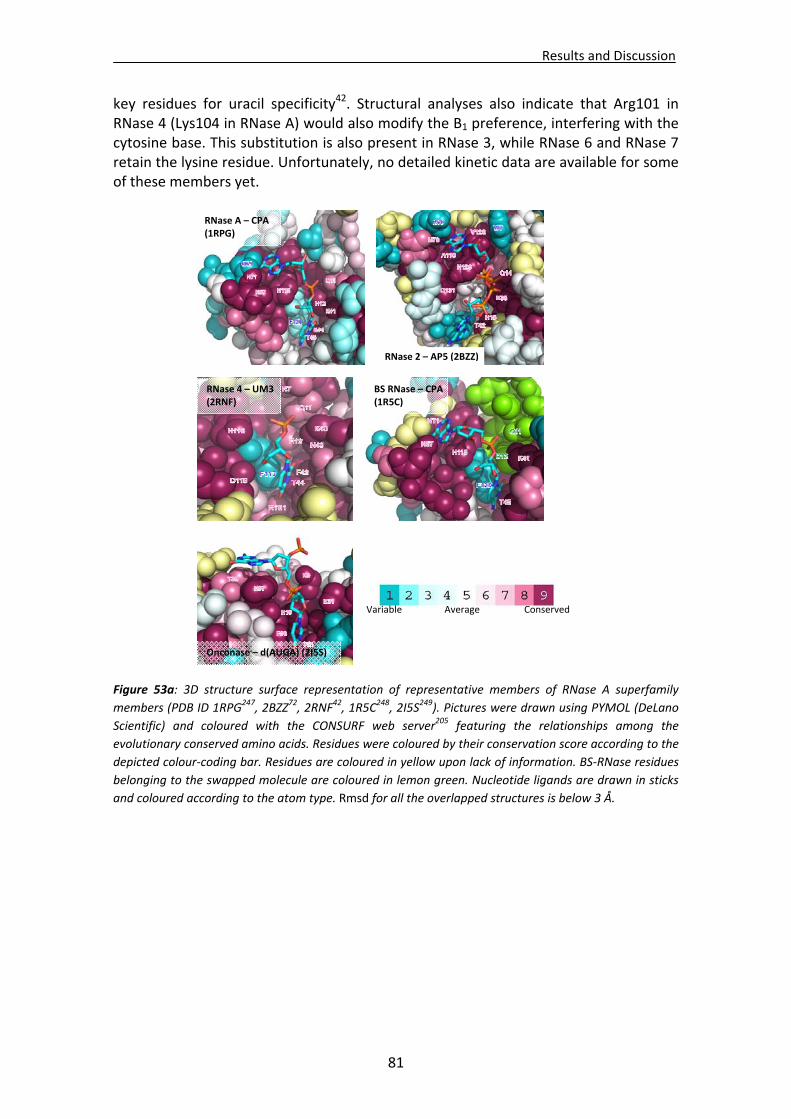
Results and Discussion
81
key residues for uracil specificity42. Structural analyses also indicate that Arg101 in RNase 4 (Lys104 in RNase A) would also modify the B1 preference, interfering with the cytosine base. This substitution is also present in RNase 3, while RNase 6 and RNase 7 retain the lysine residue. Unfortunately, no detailed kinetic data are available for some of these members yet.
Figure 53a: 3D structure surface representation of representative members of RNase A superfamily
members (PDB ID 1RPG247, 2BZZ72, 2RNF42, 1R5C248, 2I5S249). Pictures were drawn using PYMOL (DeLano
Scientific) and coloured with the CONSURF web server205 featuring the relationships among the
evolutionary conserved amino acids. Residues were coloured by their conservation score according to the
depicted colour‐coding bar. Residues are coloured in yellow upon lack of information. BS‐RNase residues
belonging to the swapped molecule are coloured in lemon green. Nucleotide ligands are drawn in sticks
and coloured according to the atom type. Rmsd for all the overlapped structures is below 3 Å.
RNase 4 – UM3 (2RNF)
RNase A – CPA (1RPG)
RNase 2 – AP5 (2BZZ)
BS RNase – CPA(1R5C)
Variable Average Conserved
Onconase – d(AUGA) (2I5S)
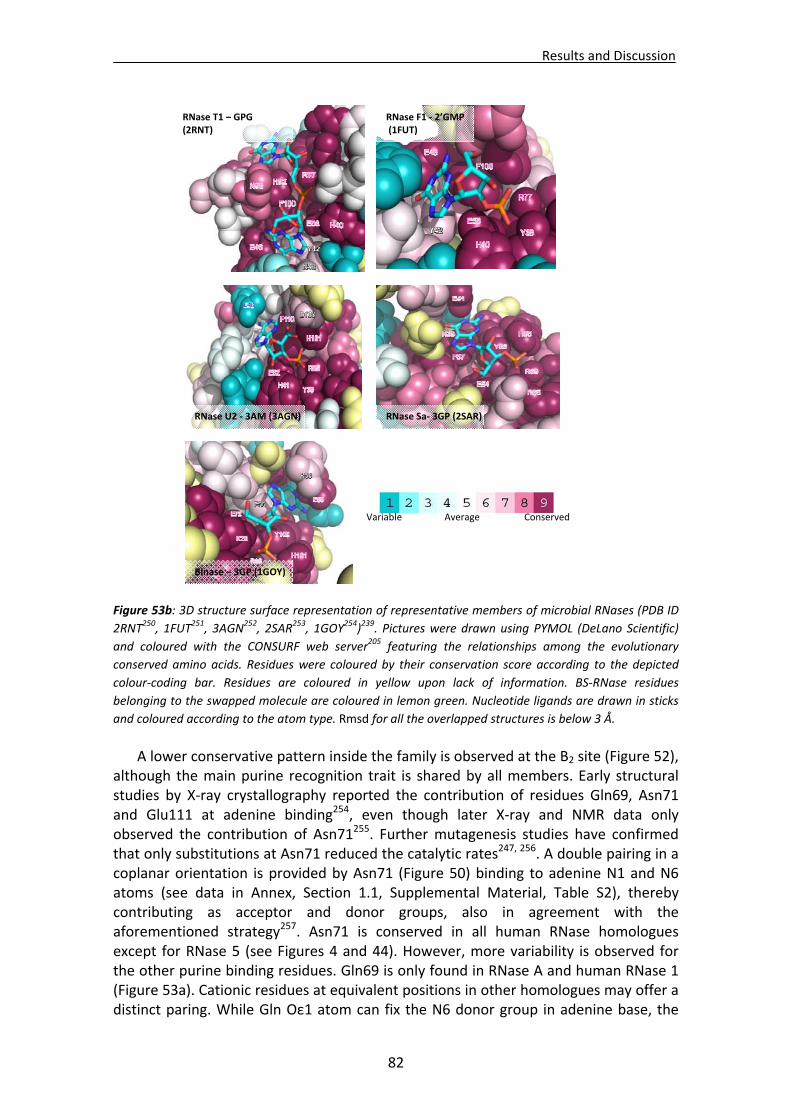
Results and Discussion
82
Figure 53b: 3D structure surface representation of representative members of microbial RNases (PDB ID
2RNT250, 1FUT251, 3AGN252, 2SAR253, 1GOY254)239. Pictures were drawn using PYMOL (DeLano Scientific)
and coloured with the CONSURF web server205 featuring the relationships among the evolutionary
conserved amino acids. Residues were coloured by their conservation score according to the depicted
colour‐coding bar. Residues are coloured in yellow upon lack of information. BS‐RNase residues
belonging to the swapped molecule are coloured in lemon green. Nucleotide ligands are drawn in sticks
and coloured according to the atom type. Rmsd for all the overlapped structures is below 3 Å.
A lower conservative pattern inside the family is observed at the B2 site (Figure 52),
although the main purine recognition trait is shared by all members. Early structural studies by X‐ray crystallography reported the contribution of residues Gln69, Asn71 and Glu111 at adenine binding254, even though later X‐ray and NMR data only observed the contribution of Asn71255. Further mutagenesis studies have confirmed that only substitutions at Asn71 reduced the catalytic rates247, 256. A double pairing in a coplanar orientation is provided by Asn71 (Figure 50) binding to adenine N1 and N6 atoms (see data in Annex, Section 1.1, Supplemental Material, Table S2), thereby contributing as acceptor and donor groups, also in agreement with the aforementioned strategy257. Asn71 is conserved in all human RNase homologues except for RNase 5 (see Figures 4 and 44). However, more variability is observed for the other purine binding residues. Gln69 is only found in RNase A and human RNase 1 (Figure 53a). Cationic residues at equivalent positions in other homologues may offer a distinct paring. While Gln Oε1 atom can fix the N6 donor group in adenine base, the
Variable Average Conserved
RNase T1 – GPG (2RNT)
RNase F1 ‐ 2’GMP (1FUT)
RNase U2 ‐ 3AM (3AGN) RNase Sa‐ 3GP (2SAR)
Binase – 3GP (1GOY)
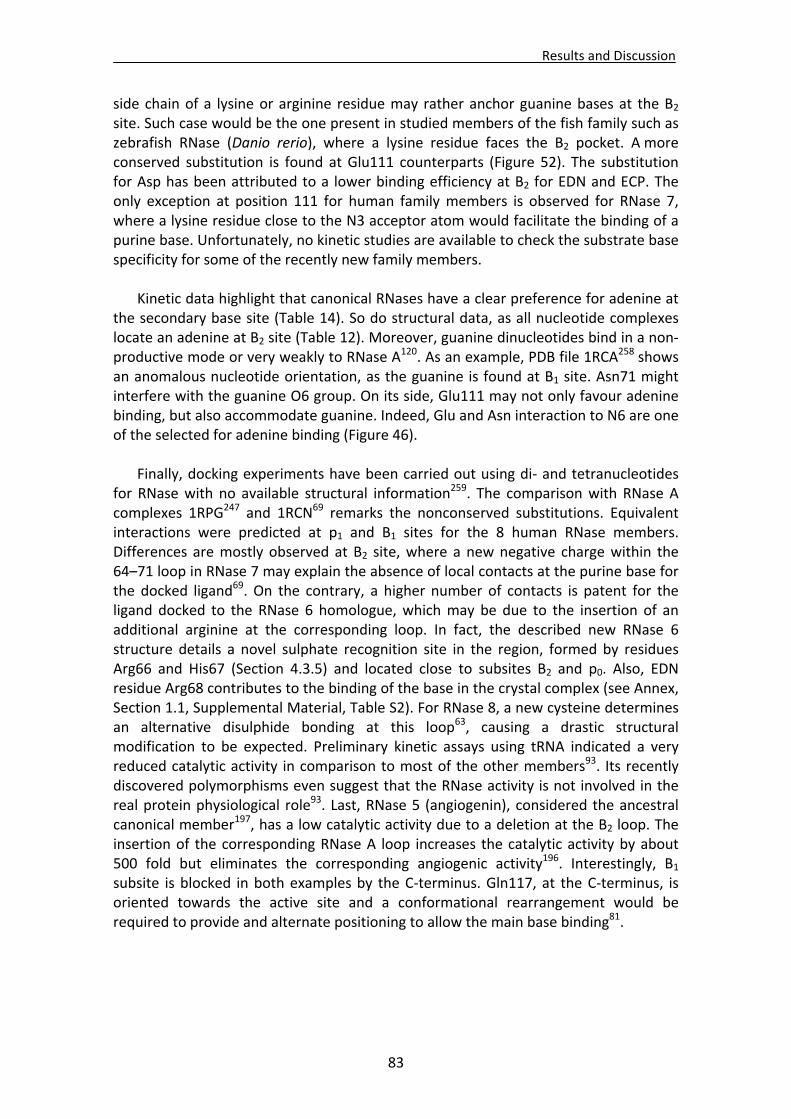
Results and Discussion
83
side chain of a lysine or arginine residue may rather anchor guanine bases at the B2 site. Such case would be the one present in studied members of the fish family such as zebrafish RNase (Danio rerio), where a lysine residue faces the B2 pocket. A more conserved substitution is found at Glu111 counterparts (Figure 52). The substitution for Asp has been attributed to a lower binding efficiency at B2 for EDN and ECP. The only exception at position 111 for human family members is observed for RNase 7, where a lysine residue close to the N3 acceptor atom would facilitate the binding of a purine base. Unfortunately, no kinetic studies are available to check the substrate base specificity for some of the recently new family members.
Kinetic data highlight that canonical RNases have a clear preference for adenine at
the secondary base site (Table 14). So do structural data, as all nucleotide complexes locate an adenine at B2 site (Table 12). Moreover, guanine dinucleotides bind in a non‐productive mode or very weakly to RNase A120. As an example, PDB file 1RCA258 shows an anomalous nucleotide orientation, as the guanine is found at B1 site. Asn71 might interfere with the guanine O6 group. On its side, Glu111 may not only favour adenine binding, but also accommodate guanine. Indeed, Glu and Asn interaction to N6 are one of the selected for adenine binding (Figure 46).
Finally, docking experiments have been carried out using di‐ and tetranucleotides
for RNase with no available structural information259. The comparison with RNase A complexes 1RPG247 and 1RCN69 remarks the nonconserved substitutions. Equivalent interactions were predicted at p1 and B1 sites for the 8 human RNase members. Differences are mostly observed at B2 site, where a new negative charge within the 64–71 loop in RNase 7 may explain the absence of local contacts at the purine base for the docked ligand69. On the contrary, a higher number of contacts is patent for the ligand docked to the RNase 6 homologue, which may be due to the insertion of an additional arginine at the corresponding loop. In fact, the described new RNase 6 structure details a novel sulphate recognition site in the region, formed by residues Arg66 and His67 (Section 4.3.5) and located close to subsites B2 and p0. Also, EDN residue Arg68 contributes to the binding of the base in the crystal complex (see Annex, Section 1.1, Supplemental Material, Table S2). For RNase 8, a new cysteine determines an alternative disulphide bonding at this loop63, causing a drastic structural modification to be expected. Preliminary kinetic assays using tRNA indicated a very reduced catalytic activity in comparison to most of the other members93. Its recently discovered polymorphisms even suggest that the RNase activity is not involved in the real protein physiological role93. Last, RNase 5 (angiogenin), considered the ancestral canonical member197, has a low catalytic activity due to a deletion at the B2 loop. The insertion of the corresponding RNase A loop increases the catalytic activity by about 500 fold but eliminates the corresponding angiogenic activity196. Interestingly, B1 subsite is blocked in both examples by the C‐terminus. Gln117, at the C‐terminus, is oriented towards the active site and a conformational rearrangement would be required to provide and alternate positioning to allow the main base binding81.
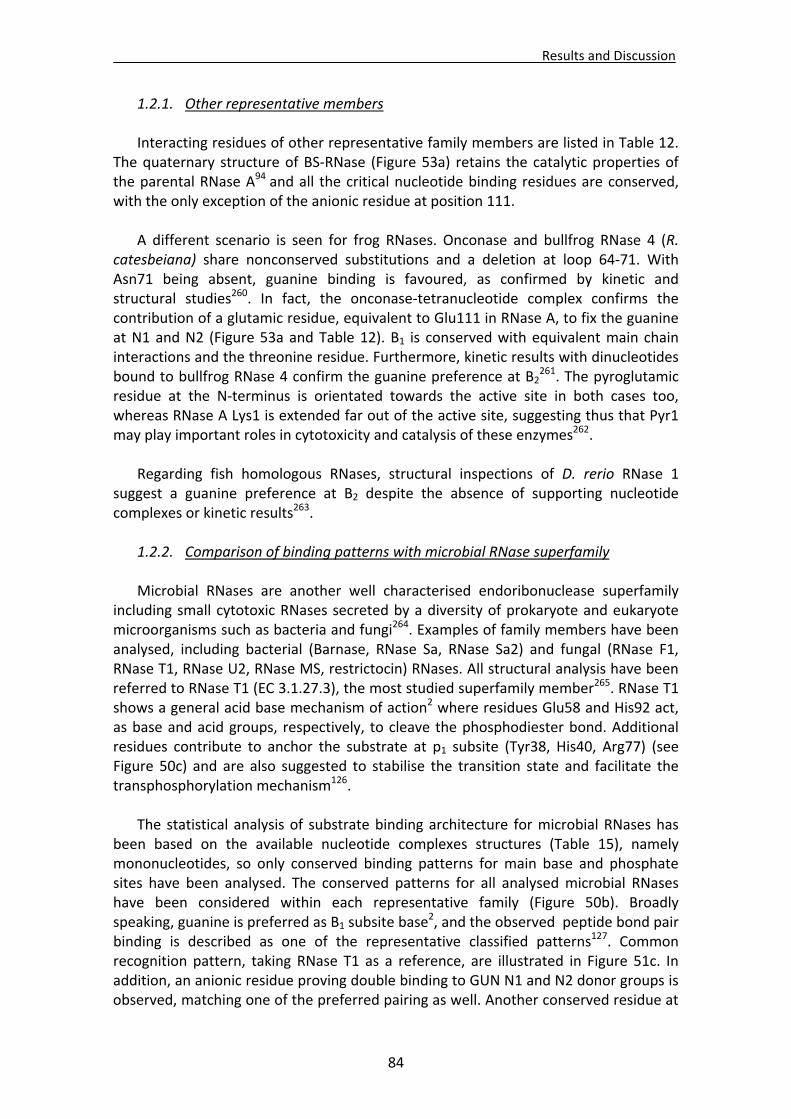
Results and Discussion
84
1.2.1. Other representative members
Interacting residues of other representative family members are listed in Table 12. The quaternary structure of BS‐RNase (Figure 53a) retains the catalytic properties of the parental RNase A94 and all the critical nucleotide binding residues are conserved, with the only exception of the anionic residue at position 111.
A different scenario is seen for frog RNases. Onconase and bullfrog RNase 4 (R.
catesbeiana) share nonconserved substitutions and a deletion at loop 64‐71. With Asn71 being absent, guanine binding is favoured, as confirmed by kinetic and structural studies260. In fact, the onconase‐tetranucleotide complex confirms the contribution of a glutamic residue, equivalent to Glu111 in RNase A, to fix the guanine at N1 and N2 (Figure 53a and Table 12). B1 is conserved with equivalent main chain interactions and the threonine residue. Furthermore, kinetic results with dinucleotides bound to bullfrog RNase 4 confirm the guanine preference at B2
261. The pyroglutamic residue at the N‐terminus is orientated towards the active site in both cases too, whereas RNase A Lys1 is extended far out of the active site, suggesting thus that Pyr1 may play important roles in cytotoxicity and catalysis of these enzymes262.
Regarding fish homologous RNases, structural inspections of D. rerio RNase 1
suggest a guanine preference at B2 despite the absence of supporting nucleotide complexes or kinetic results263.
1.2.2. Comparison of binding patterns with microbial RNase superfamily
Microbial RNases are another well characterised endoribonuclease superfamily
including small cytotoxic RNases secreted by a diversity of prokaryote and eukaryote microorganisms such as bacteria and fungi264. Examples of family members have been analysed, including bacterial (Barnase, RNase Sa, RNase Sa2) and fungal (RNase F1, RNase T1, RNase U2, RNase MS, restrictocin) RNases. All structural analysis have been referred to RNase T1 (EC 3.1.27.3), the most studied superfamily member265. RNase T1 shows a general acid base mechanism of action2 where residues Glu58 and His92 act, as base and acid groups, respectively, to cleave the phosphodiester bond. Additional residues contribute to anchor the substrate at p1 subsite (Tyr38, His40, Arg77) (see Figure 50c) and are also suggested to stabilise the transition state and facilitate the transphosphorylation mechanism126.
The statistical analysis of substrate binding architecture for microbial RNases has
been based on the available nucleotide complexes structures (Table 15), namely mononucleotides, so only conserved binding patterns for main base and phosphate sites have been analysed. The conserved patterns for all analysed microbial RNases have been considered within each representative family (Figure 50b). Broadly speaking, guanine is preferred as B1 subsite base
2, and the observed peptide bond pair binding is described as one of the representative classified patterns127. Common recognition pattern, taking RNase T1 as a reference, are illustrated in Figure 51c. In addition, an anionic residue proving double binding to GUN N1 and N2 donor groups is observed, matching one of the preferred pairing as well. Another conserved residue at
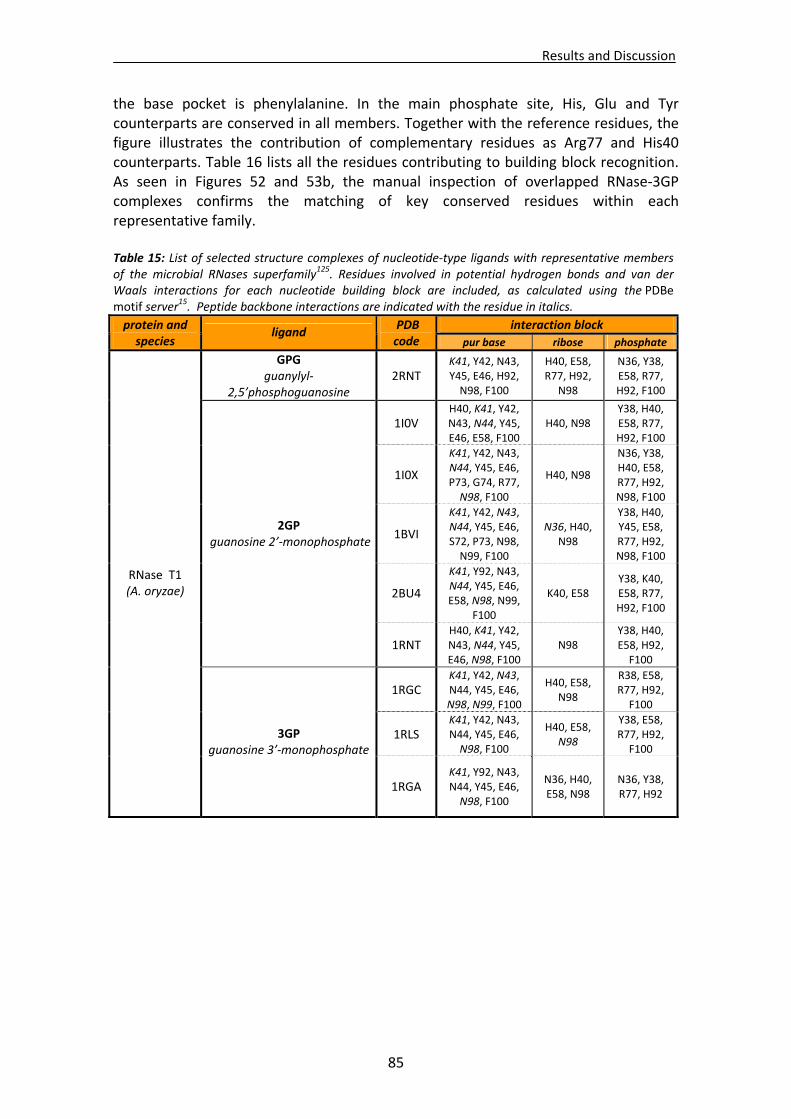
Results and Discussion
85
the base pocket is phenylalanine. In the main phosphate site, His, Glu and Tyr counterparts are conserved in all members. Together with the reference residues, the figure illustrates the contribution of complementary residues as Arg77 and His40 counterparts. Table 16 lists all the residues contributing to building block recognition. As seen in Figures 52 and 53b, the manual inspection of overlapped RNase‐3GP complexes confirms the matching of key conserved residues within each representative family.
Table 15: List of selected structure complexes of nucleotide‐type ligands with representative members of the microbial RNases superfamily125. Residues involved in potential hydrogen bonds and van der Waals interactions for each nucleotide building block are included, as calculated using the PDBe motif server15. Peptide backbone interactions are indicated with the residue in italics.
interaction block protein and species
ligand PDB code pur base ribose phosphate
GPG guanylyl‐
2,5’phosphoguanosine 2RNT
K41, Y42, N43, Y45, E46, H92, N98, F100
H40, E58, R77, H92,
N98
N36, Y38, E58, R77, H92, F100
1I0V H40, K41, Y42, N43, N44, Y45, E46, E58, F100
H40, N98 Y38, H40, E58, R77, H92, F100
1I0X
K41, Y42, N43, N44, Y45, E46, P73, G74, R77, N98, F100
H40, N98
N36, Y38, H40, E58, R77, H92, N98, F100
1BVI
K41, Y42, N43, N44, Y45, E46, S72, P73, N98, N99, F100
N36, H40, N98
Y38, H40, Y45, E58, R77, H92, N98, F100
2BU4
K41, Y92, N43, N44, Y45, E46, E58, N98, N99,
F100
K40, E58 Y38, K40, E58, R77, H92, F100
2GP guanosine 2’‐monophosphate
1RNT H40, K41, Y42, N43, N44, Y45, E46, N98, F100
N98 Y38, H40, E58, H92, F100
1RGC K41, Y42, N43, N44, Y45, E46, N98, N99, F100
H40, E58, N98
R38, E58, R77, H92, F100
1RLS K41, Y42, N43, N44, Y45, E46, N98, F100
H40, E58, N98
Y38, E58, R77, H92, F100
RNase T1 (A. oryzae)
3GP guanosine 3’‐monophosphate
1RGA K41, Y92, N43, N44, Y45, E46, N98, F100
N36, H40, E58, N98
N36, Y38, R77, H92
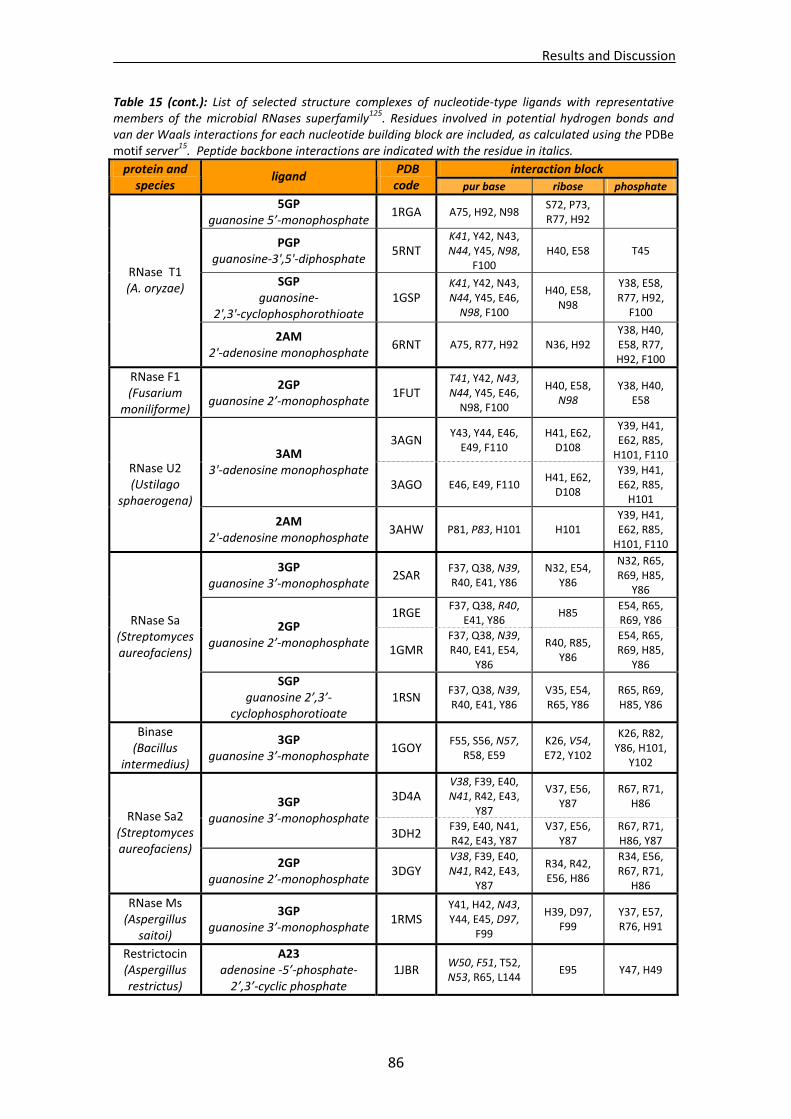
Results and Discussion
86
Table 15 (cont.): List of selected structure complexes of nucleotide‐type ligands with representative members of the microbial RNases superfamily125. Residues involved in potential hydrogen bonds and van der Waals interactions for each nucleotide building block are included, as calculated using the PDBe motif server15. Peptide backbone interactions are indicated with the residue in italics.
interaction block protein and species
ligand PDB code pur base ribose phosphate
5GP guanosine 5’‐monophosphate
1RGA A75, H92, N98 S72, P73, R77, H92
PGP guanosine‐3',5'‐diphosphate
5RNT K41, Y42, N43, N44, Y45, N98,
F100 H40, E58 T45
SGP guanosine‐
2',3'‐cyclophosphorothioate 1GSP
K41, Y42, N43, N44, Y45, E46, N98, F100
H40, E58, N98
Y38, E58, R77, H92, F100
RNase T1 (A. oryzae)
2AM 2'‐adenosine monophosphate
6RNT A75, R77, H92 N36, H92 Y38, H40, E58, R77, H92, F100
RNase F1 (Fusarium
moniliforme)
2GP guanosine 2’‐monophosphate
1FUT T41, Y42, N43, N44, Y45, E46, N98, F100
H40, E58, N98
Y38, H40, E58
3AGN Y43, Y44, E46, E49, F110
H41, E62, D108
Y39, H41, E62, R85, H101, F110 3AM
3'‐adenosine monophosphate 3AGO E46, E49, F110
H41, E62, D108
Y39, H41, E62, R85, H101
RNase U2 (Ustilago
sphaerogena)
2AM 2'‐adenosine monophosphate
3AHW P81, P83, H101 H101 Y39, H41, E62, R85, H101, F110
3GP guanosine 3’‐monophosphate
2SAR F37, Q38, N39, R40, E41, Y86
N32, E54, Y86
N32, R65, R69, H85,
Y86
1RGE F37, Q38, R40,
E41, Y86 H85
E54, R65, R69, Y86
2GP guanosine 2’‐monophosphate
1GMR F37, Q38, N39, R40, E41, E54,
Y86
R40, R85, Y86
E54, R65, R69, H85,
Y86
RNase Sa (Streptomyces aureofaciens)
SGP guanosine 2’,3’‐
cyclophosphorotioate 1RSN
F37, Q38, N39, R40, E41, Y86
V35, E54, R65, Y86
R65, R69, H85, Y86
Binase (Bacillus
intermedius)
3GP guanosine 3’‐monophosphate
1GOY F55, S56, N57,
R58, E59 K26, V54, E72, Y102
K26, R82, Y86, H101,
Y102
3D4A V38, F39, E40, N41, R42, E43,
Y87
V37, E56, Y87
R67, R71, H86 3GP
guanosine 3’‐monophosphate3DH2
F39, E40, N41, R42, E43, Y87
V37, E56, Y87
R67, R71, H86, Y87
RNase Sa2 (Streptomyces aureofaciens)
2GP guanosine 2’‐monophosphate
3DGY V38, F39, E40, N41, R42, E43,
Y87
R34, R42, E56, H86
R34, E56, R67, R71,
H86
RNase Ms (Aspergillus
saitoi)
3GP guanosine 3’‐monophosphate
1RMS Y41, H42, N43, Y44, E45, D97,
F99
H39, D97, F99
Y37, E57, R76, H91
Restrictocin (Aspergillus restrictus)
A23 adenosine ‐5’‐phosphate‐ 2’,3’‐cyclic phosphate
1JBR W50, F51, T52, N53, R65, L144
E95 Y47, H49
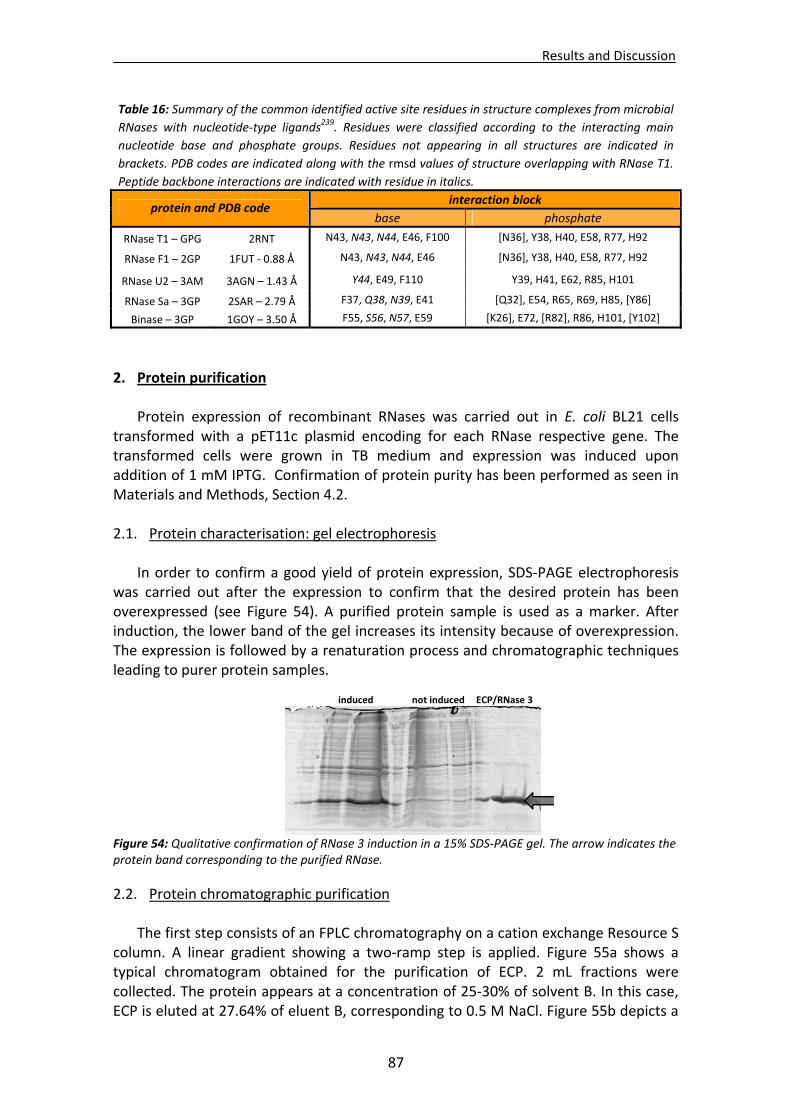
Results and Discussion
87
2. Protein purification
Protein expression of recombinant RNases was carried out in E. coli BL21 cells
transformed with a pET11c plasmid encoding for each RNase respective gene. The transformed cells were grown in TB medium and expression was induced upon addition of 1 mM IPTG. Confirmation of protein purity has been performed as seen in Materials and Methods, Section 4.2. 2.1. Protein characterisation: gel electrophoresis
In order to confirm a good yield of protein expression, SDS‐PAGE electrophoresis
was carried out after the expression to confirm that the desired protein has been overexpressed (see Figure 54). A purified protein sample is used as a marker. After induction, the lower band of the gel increases its intensity because of overexpression. The expression is followed by a renaturation process and chromatographic techniques leading to purer protein samples.
Figure 54: Qualitative confirmation of RNase 3 induction in a 15% SDS‐PAGE gel. The arrow indicates the protein band corresponding to the purified RNase.
2.2. Protein chromatographic purification
The first step consists of an FPLC chromatography on a cation exchange Resource S column. A linear gradient showing a two‐ramp step is applied. Figure 55a shows a typical chromatogram obtained for the purification of ECP. 2 mL fractions were collected. The protein appears at a concentration of 25‐30% of solvent B. In this case, ECP is eluted at 27.64% of eluent B, corresponding to 0.5 M NaCl. Figure 55b depicts a
Table 16: Summary of the common identified active site residues in structure complexes from microbial
RNases with nucleotide‐type ligands239. Residues were classified according to the interacting main
nucleotide base and phosphate groups. Residues not appearing in all structures are indicated in
brackets. PDB codes are indicated along with the rmsd values of structure overlapping with RNase T1.
Peptide backbone interactions are indicated with residue in italics.
interaction block protein and PDB code
base phosphate
RNase T1 – GPG 2RNT N43, N43, N44, E46, F100 [N36], Y38, H40, E58, R77, H92
RNase F1 – 2GP 1FUT ‐ 0.88 Å N43, N43, N44, E46 [N36], Y38, H40, E58, R77, H92
RNase U2 – 3AM 3AGN – 1.43 Å Y44, E49, F110 Y39, H41, E62, R85, H101
RNase Sa – 3GP 2SAR – 2.79 Å F37, Q38, N39, E41 [Q32], E54, R65, R69, H85, [Y86]
Binase – 3GP 1GOY – 3.50 Å F55, S56, N57, E59 [K26], E72, [R82], R86, H101, [Y102]
induced not induced ECP/RNase 3
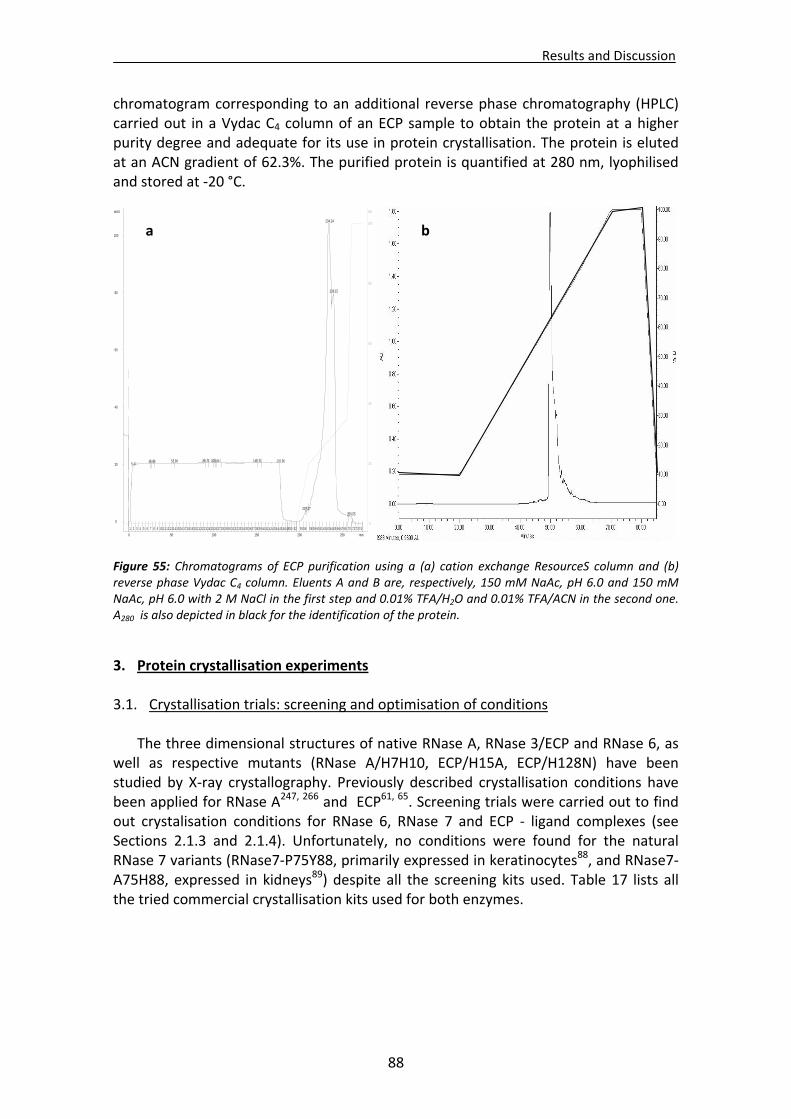
Results and Discussion
88
chromatogram corresponding to an additional reverse phase chromatography (HPLC) carried out in a Vydac C4 column of an ECP sample to obtain the protein at a higher purity degree and adequate for its use in protein crystallisation. The protein is eluted at an ACN gradient of 62.3%. The purified protein is quantified at 280 nm, lyophilised and stored at ‐20 °C. Figure 55: Chromatograms of ECP purification using a (a) cation exchange ResourceS column and (b) reverse phase Vydac C4 column. Eluents A and B are, respectively, 150 mM NaAc, pH 6.0 and 150 mM NaAc, pH 6.0 with 2 M NaCl in the first step and 0.01% TFA/H2O and 0.01% TFA/ACN in the second one. A280 is also depicted in black for the identification of the protein.
3. Protein crystallisation experiments 3.1. Crystallisation trials: screening and optimisation of conditions
The three dimensional structures of native RNase A, RNase 3/ECP and RNase 6, as well as respective mutants (RNase A/H7H10, ECP/H15A, ECP/H128N) have been studied by X‐ray crystallography. Previously described crystallisation conditions have been applied for RNase A247, 266 and ECP61, 65. Screening trials were carried out to find out crystalisation conditions for RNase 6, RNase 7 and ECP ‐ ligand complexes (see Sections 2.1.3 and 2.1.4). Unfortunately, no conditions were found for the natural RNase 7 variants (RNase7‐P75Y88, primarily expressed in keratinocytes88, and RNase7‐A75H88, expressed in kidneys89) despite all the screening kits used. Table 17 lists all the tried commercial crystallisation kits used for both enzymes.
0
20
40
60
80
100
mAU
0
20
40
60
80
100
%B
0 50 100 150 200 250 min
1 2 3 4 5 6 7 8 9 10 11 12 131415 16 17 18 19 20 21 22 23 242526 27 28 29 30 31 32 33 34 353637 38 39 40 41 42 43 44 45 46 4850 52 55 56 58 59 60 61 62 636465 666768 70 72 7374
5.47 26.69 52.96 89.73 100.64 149.71 176.96
207.17
234.24
239.15
259.55
a b
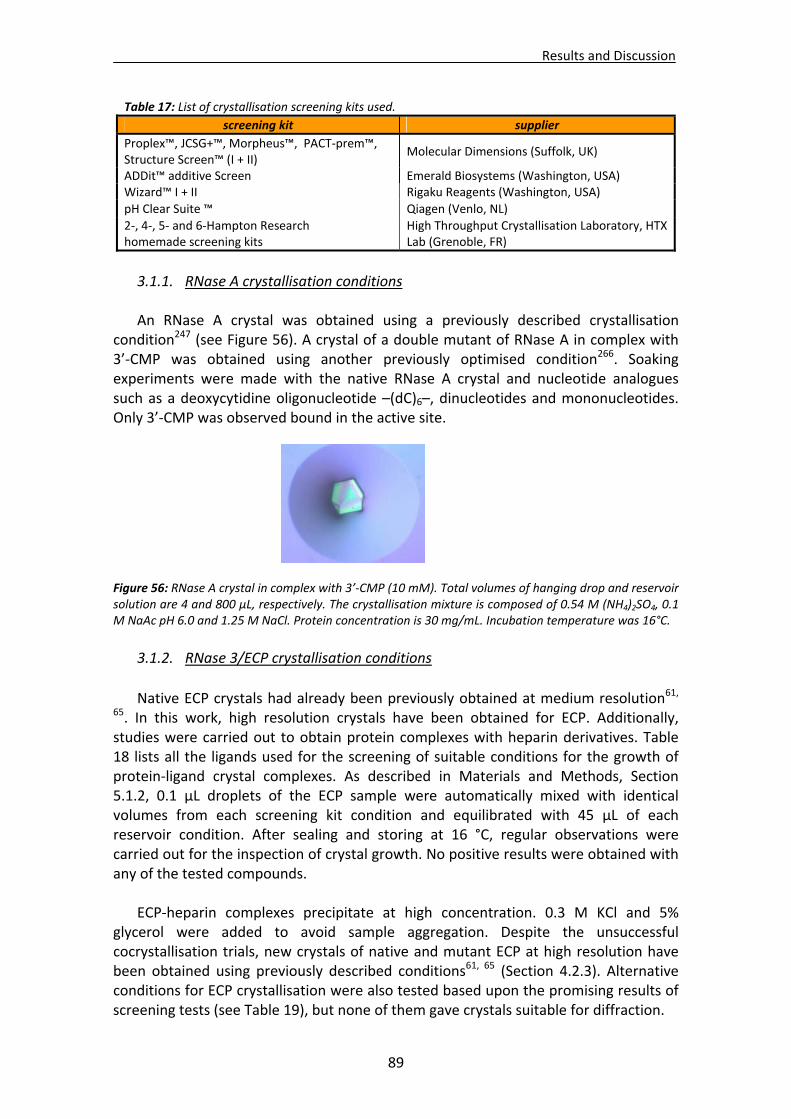
Results and Discussion
89
3.1.1. RNase A crystallisation conditions
An RNase A crystal was obtained using a previously described crystallisation condition247 (see Figure 56). A crystal of a double mutant of RNase A in complex with 3’‐CMP was obtained using another previously optimised condition266. Soaking experiments were made with the native RNase A crystal and nucleotide analogues such as a deoxycytidine oligonucleotide –(dC)6–, dinucleotides and mononucleotides. Only 3’‐CMP was observed bound in the active site.
Figure 56: RNase A crystal in complex with 3’‐CMP (10 mM). Total volumes of hanging drop and reservoir solution are 4 and 800 μL, respectively. The crystallisation mixture is composed of 0.54 M (NH4)2SO4, 0.1 M NaAc pH 6.0 and 1.25 M NaCl. Protein concentration is 30 mg/mL. Incubation temperature was 16°C.
3.1.2. RNase 3/ECP crystallisation conditions
Native ECP crystals had already been previously obtained at medium resolution61,
65. In this work, high resolution crystals have been obtained for ECP. Additionally, studies were carried out to obtain protein complexes with heparin derivatives. Table 18 lists all the ligands used for the screening of suitable conditions for the growth of protein‐ligand crystal complexes. As described in Materials and Methods, Section 5.1.2, 0.1 μL droplets of the ECP sample were automatically mixed with identical volumes from each screening kit condition and equilibrated with 45 μL of each reservoir condition. After sealing and storing at 16 °C, regular observations were carried out for the inspection of crystal growth. No positive results were obtained with any of the tested compounds.
ECP‐heparin complexes precipitate at high concentration. 0.3 M KCl and 5% glycerol were added to avoid sample aggregation. Despite the unsuccessful cocrystallisation trials, new crystals of native and mutant ECP at high resolution have been obtained using previously described conditions61, 65 (Section 4.2.3). Alternative conditions for ECP crystallisation were also tested based upon the promising results of screening tests (see Table 19), but none of them gave crystals suitable for diffraction.
Table 17: List of crystallisation screening kits used.
screening kit supplier
Proplex™, JCSG+™, Morpheus™, PACT‐prem™, Structure Screen™ (I + II)
Molecular Dimensions (Suffolk, UK)
ADDit™ additive Screen Emerald Biosystems (Washington, USA) Wizard™ I + II Rigaku Reagents (Washington, USA)
pH Clear Suite ™ Qiagen (Venlo, NL)
2‐, 4‐, 5‐ and 6‐Hampton Research homemade screening kits
High Throughput Crystallisation Laboratory, HTX Lab (Grenoble, FR)
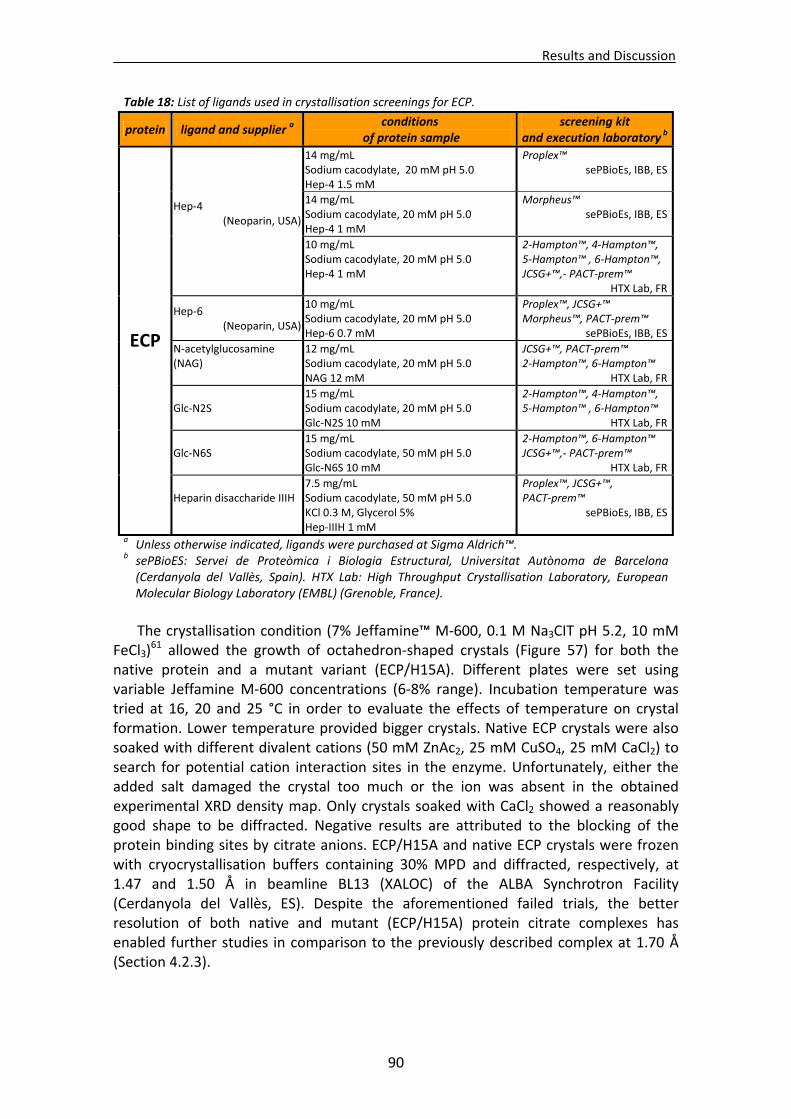
Results and Discussion
90
The crystallisation condition (7% Jeffamine™ M‐600, 0.1 M Na3CIT pH 5.2, 10 mM
FeCl3)61 allowed the growth of octahedron‐shaped crystals (Figure 57) for both the
native protein and a mutant variant (ECP/H15A). Different plates were set using variable Jeffamine M‐600 concentrations (6‐8% range). Incubation temperature was tried at 16, 20 and 25 °C in order to evaluate the effects of temperature on crystal formation. Lower temperature provided bigger crystals. Native ECP crystals were also soaked with different divalent cations (50 mM ZnAc2, 25 mM CuSO4, 25 mM CaCl2) to search for potential cation interaction sites in the enzyme. Unfortunately, either the added salt damaged the crystal too much or the ion was absent in the obtained experimental XRD density map. Only crystals soaked with CaCl2 showed a reasonably good shape to be diffracted. Negative results are attributed to the blocking of the protein binding sites by citrate anions. ECP/H15A and native ECP crystals were frozen with cryocrystallisation buffers containing 30% MPD and diffracted, respectively, at 1.47 and 1.50 Å in beamline BL13 (XALOC) of the ALBA Synchrotron Facility (Cerdanyola del Vallès, ES). Despite the aforementioned failed trials, the better resolution of both native and mutant (ECP/H15A) protein citrate complexes has enabled further studies in comparison to the previously described complex at 1.70 Å (Section 4.2.3).
Table 18: List of ligands used in crystallisation screenings for ECP.
protein ligand and supplier a conditions
of protein sample screening kit
and execution laboratory b
14 mg/mL Sodium cacodylate, 20 mM pH 5.0 Hep‐4 1.5 mM
Proplex™ sePBioEs, IBB, ES
14 mg/mL Sodium cacodylate, 20 mM pH 5.0 Hep‐4 1 mM
Morpheus™ sePBioEs, IBB, ES
Hep‐4 (Neoparin, USA)
10 mg/mL Sodium cacodylate, 20 mM pH 5.0 Hep‐4 1 mM
2‐Hampton™, 4‐Hampton™, 5‐Hampton™ , 6‐Hampton™, JCSG+™,‐ PACT‐prem™
HTX Lab, FR
Hep‐6 (Neoparin, USA)
10 mg/mL Sodium cacodylate, 20 mM pH 5.0 Hep‐6 0.7 mM
Proplex™, JCSG+™ Morpheus™, PACT‐prem™
sePBioEs, IBB, ES
N‐acetylglucosamine (NAG)
12 mg/mL Sodium cacodylate, 20 mM pH 5.0 NAG 12 mM
JCSG+™, PACT‐prem™ 2‐Hampton™, 6‐Hampton™
HTX Lab, FR
Glc‐N2S 15 mg/mL Sodium cacodylate, 20 mM pH 5.0 Glc‐N2S 10 mM
2‐Hampton™, 4‐Hampton™, 5‐Hampton™ , 6‐Hampton™
HTX Lab, FR
Glc‐N6S 15 mg/mL Sodium cacodylate, 50 mM pH 5.0 Glc‐N6S 10 mM
2‐Hampton™, 6‐Hampton™ JCSG+™,‐ PACT‐prem™
HTX Lab, FR
ECP
Heparin disaccharide IIIH
7.5 mg/mL Sodium cacodylate, 50 mM pH 5.0 KCl 0.3 M, Glycerol 5% Hep‐IIIH 1 mM
Proplex™, JCSG+™, PACT‐prem™
sePBioEs, IBB, ES
a Unless otherwise indicated, ligands were purchased at Sigma Aldrich™. b sePBioES: Servei de Proteòmica i Biologia Estructural, Universitat Autònoma de Barcelona (Cerdanyola del Vallès, Spain). HTX Lab: High Throughput Crystallisation Laboratory, European Molecular Biology Laboratory (EMBL) (Grenoble, France).
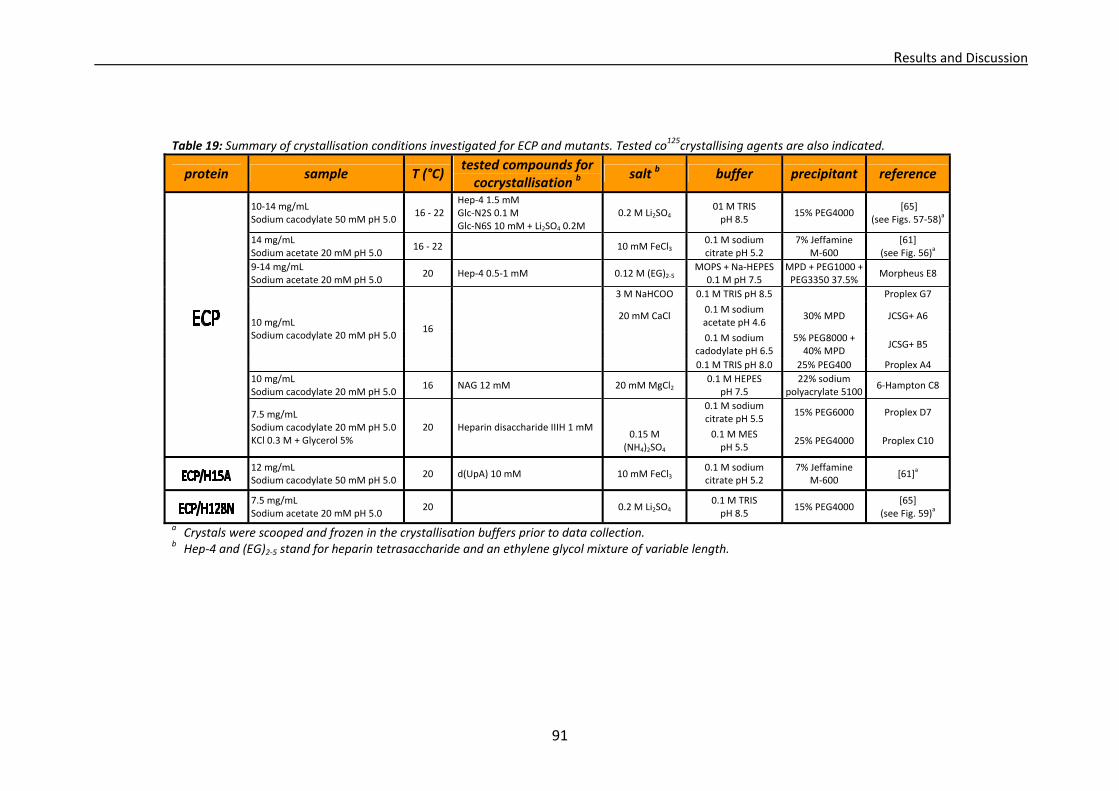
Results and Discussion
91
Table 19: Summary of crystallisation conditions investigated for ECP and mutants. Tested co125crystallising agents are also indicated.
protein sample T (°C)tested compounds for cocrystallisation b
salt b buffer precipitant reference
10‐14 mg/mL Sodium cacodylate 50 mM pH 5.0
16 ‐ 22 Hep‐4 1.5 mM Glc‐N2S 0.1 M Glc‐N6S 10 mM + Li2SO4 0.2M
0.2 M Li2SO4 01 M TRIS pH 8.5
15% PEG4000 [65]
(see Figs. 57‐58)a
14 mg/mL Sodium acetate 20 mM pH 5.0
16 ‐ 22 10 mM FeCl3 0.1 M sodium citrate pH 5.2
7% Jeffamine M‐600
[61] (see Fig. 56)
a
9‐14 mg/mL Sodium acetate 20 mM pH 5.0
20 Hep‐4 0.5‐1 mM 0.12 M (EG)2‐5 MOPS + Na‐HEPES
0.1 M pH 7.5 MPD + PEG1000 +PEG3350 37.5%
Morpheus E8
3 M NaHCOO 0.1 M TRIS pH 8.5 Proplex G7
20 mM CaCl 0.1 M sodium acetate pH 4.6
30% MPD JCSG+ A6
0.1 M sodium
cadodylate pH 6.5 5% PEG8000 + 40% MPD
JCSG+ B5
10 mg/mL Sodium cacodylate 20 mM pH 5.0
16
0.1 M TRIS pH 8.0 25% PEG400 Proplex A4
10 mg/mL Sodium cacodylate 20 mM pH 5.0
16 NAG 12 mM 20 mM MgCl2 0.1 M HEPES
pH 7.5 22% sodium
polyacrylate 51006‐Hampton C8
0.1 M sodium citrate pH 5.5
15% PEG6000 Proplex D7
.
7.5 mg/mL Sodium cacodylate 20 mM pH 5.0 KCl 0.3 M + Glycerol 5%
20 Heparin disaccharide IIIH 1 mM 0.15 M
(NH4)2SO4 0.1 M MES pH 5.5
25% PEG4000 Proplex C10
12 mg/mL Sodium cacodylate 50 mM pH 5.0
20 d(UpA) 10 mM 10 mM FeCl3 0.1 M sodium citrate pH 5.2
7% Jeffamine M‐600
[61]a
7.5 mg/mL Sodium acetate 20 mM pH 5.0
20 0.2 M Li2SO4 0.1 M TRIS pH 8.5
15% PEG4000 [65]
(see Fig. 59)a
a Crystals were scooped and frozen in the crystallisation buffers prior to data collection. b Hep‐4 and (EG)2‐5 stand for heparin tetrasaccharide and an ethylene glycol mixture of variable length.
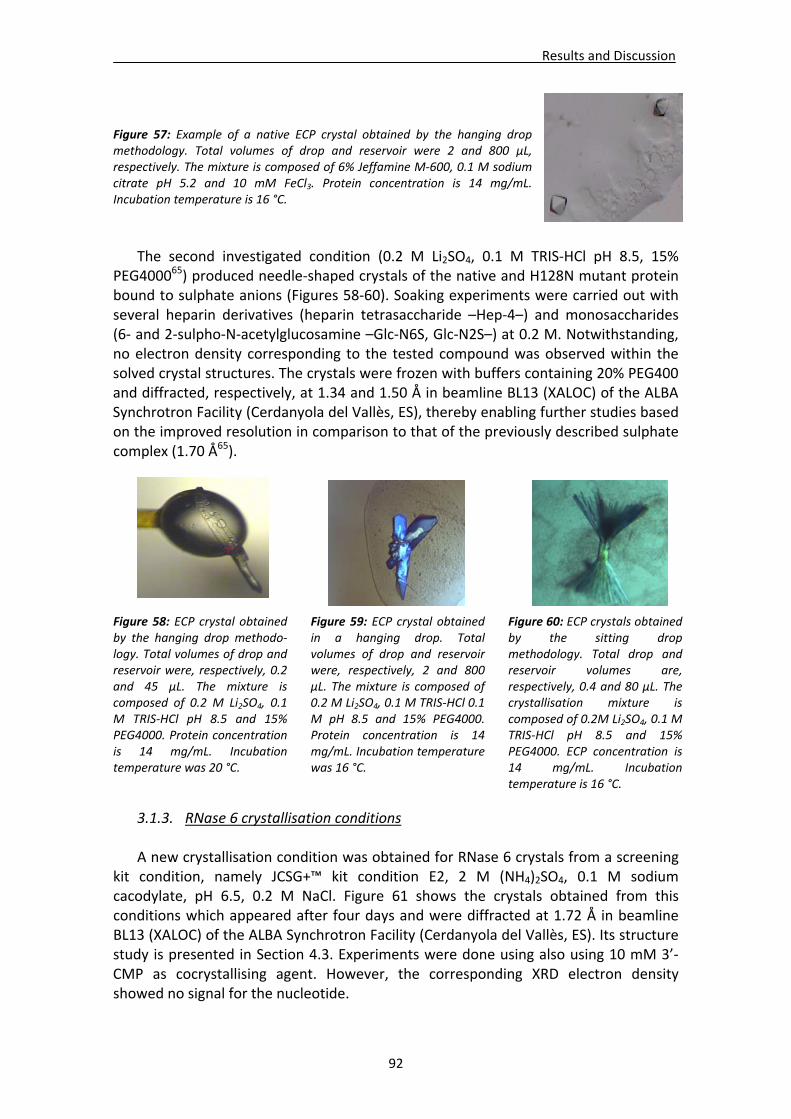
Results and Discussion
92
Figure 57: Example of a native ECP crystal obtained by the hanging drop methodology. Total volumes of drop and reservoir were 2 and 800 μL, respectively. The mixture is composed of 6% Jeffamine M‐600, 0.1 M sodium citrate pH 5.2 and 10 mM FeCl3. Protein concentration is 14 mg/mL. Incubation temperature is 16 °C.
The second investigated condition (0.2 M Li2SO4, 0.1 M TRIS‐HCl pH 8.5, 15%
PEG400065) produced needle‐shaped crystals of the native and H128N mutant protein bound to sulphate anions (Figures 58‐60). Soaking experiments were carried out with several heparin derivatives (heparin tetrasaccharide –Hep‐4–) and monosaccharides (6‐ and 2‐sulpho‐N‐acetylglucosamine –Glc‐N6S, Glc‐N2S–) at 0.2 M. Notwithstanding, no electron density corresponding to the tested compound was observed within the solved crystal structures. The crystals were frozen with buffers containing 20% PEG400 and diffracted, respectively, at 1.34 and 1.50 Å in beamline BL13 (XALOC) of the ALBA Synchrotron Facility (Cerdanyola del Vallès, ES), thereby enabling further studies based on the improved resolution in comparison to that of the previously described sulphate complex (1.70 Å65).
Figure 58: ECP crystal obtained by the hanging drop methodo‐logy. Total volumes of drop and reservoir were, respectively, 0.2 and 45 μL. The mixture is composed of 0.2 M Li2SO4, 0.1 M TRIS‐HCl pH 8.5 and 15% PEG4000. Protein concentration is 14 mg/mL. Incubation temperature was 20 °C.
Figure 59: ECP crystal obtained in a hanging drop. Total volumes of drop and reservoir were, respectively, 2 and 800 μL. The mixture is composed of 0.2 M Li2SO4, 0.1 M TRIS‐HCl 0.1 M pH 8.5 and 15% PEG4000. Protein concentration is 14 mg/mL. Incubation temperature was 16 °C.
Figure 60: ECP crystals obtained by the sitting drop methodology. Total drop and reservoir volumes are, respectively, 0.4 and 80 μL. The crystallisation mixture is composed of 0.2M Li2SO4, 0.1 M TRIS‐HCl pH 8.5 and 15% PEG4000. ECP concentration is 14 mg/mL. Incubation temperature is 16 °C.
3.1.3. RNase 6 crystallisation conditions
A new crystallisation condition was obtained for RNase 6 crystals from a screening kit condition, namely JCSG+™ kit condition E2, 2 M (NH4)2SO4, 0.1 M sodium cacodylate, pH 6.5, 0.2 M NaCl. Figure 61 shows the crystals obtained from this conditions which appeared after four days and were diffracted at 1.72 Å in beamline BL13 (XALOC) of the ALBA Synchrotron Facility (Cerdanyola del Vallès, ES). Its structure study is presented in Section 4.3. Experiments were done using also using 10 mM 3’‐CMP as cocrystallising agent. However, the corresponding XRD electron density showed no signal for the nucleotide.
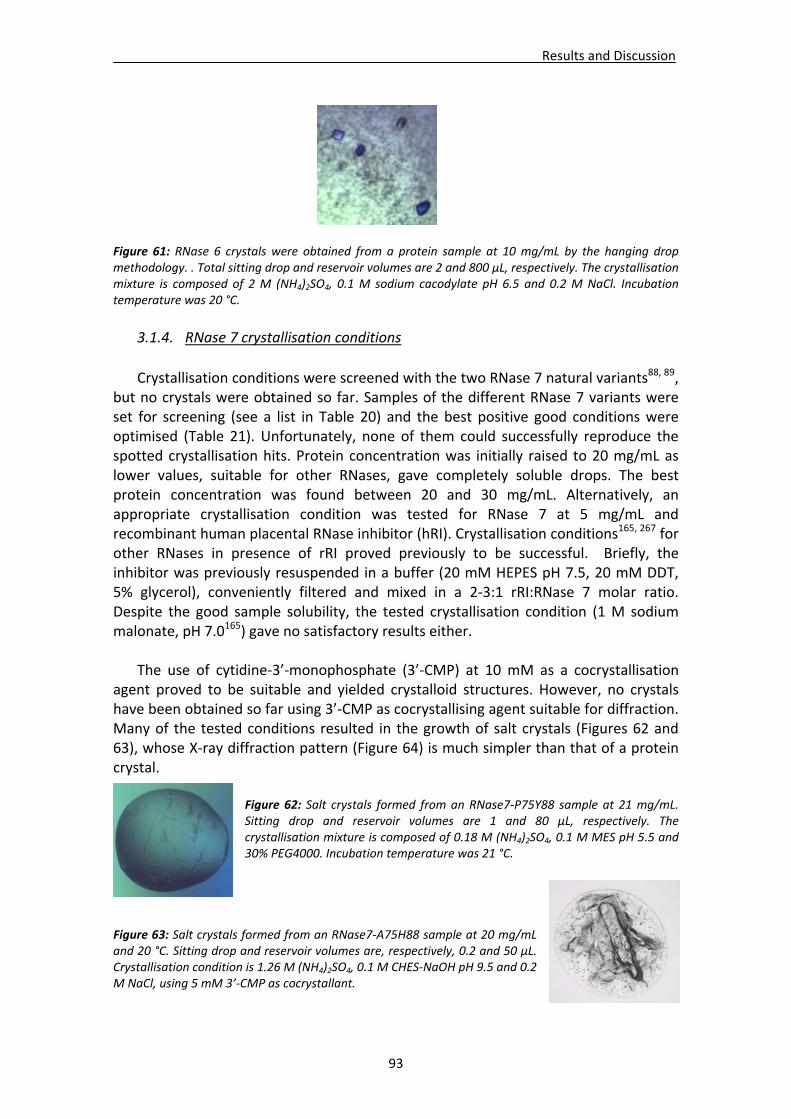
Results and Discussion
93
Figure 61: RNase 6 crystals were obtained from a protein sample at 10 mg/mL by the hanging drop methodology. . Total sitting drop and reservoir volumes are 2 and 800 μL, respectively. The crystallisation mixture is composed of 2 M (NH4)2SO4, 0.1 M sodium cacodylate pH 6.5 and 0.2 M NaCl. Incubation temperature was 20 °C.
3.1.4. RNase 7 crystallisation conditions
Crystallisation conditions were screened with the two RNase 7 natural variants88, 89, but no crystals were obtained so far. Samples of the different RNase 7 variants were set for screening (see a list in Table 20) and the best positive good conditions were optimised (Table 21). Unfortunately, none of them could successfully reproduce the spotted crystallisation hits. Protein concentration was initially raised to 20 mg/mL as lower values, suitable for other RNases, gave completely soluble drops. The best protein concentration was found between 20 and 30 mg/mL. Alternatively, an appropriate crystallisation condition was tested for RNase 7 at 5 mg/mL and recombinant human placental RNase inhibitor (hRI). Crystallisation conditions165, 267 for other RNases in presence of rRI proved previously to be successful. Briefly, the inhibitor was previously resuspended in a buffer (20 mM HEPES pH 7.5, 20 mM DDT, 5% glycerol), conveniently filtered and mixed in a 2‐3:1 rRI:RNase 7 molar ratio. Despite the good sample solubility, the tested crystallisation condition (1 M sodium malonate, pH 7.0165) gave no satisfactory results either. The use of cytidine‐3’‐monophosphate (3’‐CMP) at 10 mM as a cocrystallisation agent proved to be suitable and yielded crystalloid structures. However, no crystals have been obtained so far using 3’‐CMP as cocrystallising agent suitable for diffraction. Many of the tested conditions resulted in the growth of salt crystals (Figures 62 and 63), whose X‐ray diffraction pattern (Figure 64) is much simpler than that of a protein crystal.
Figure 62: Salt crystals formed from an RNase7‐P75Y88 sample at 21 mg/mL. Sitting drop and reservoir volumes are 1 and 80 μL, respectively. The crystallisation mixture is composed of 0.18 M (NH4)2SO4, 0.1 M MES pH 5.5 and 30% PEG4000. Incubation temperature was 21 °C.
Figure 63: Salt crystals formed from an RNase7‐A75H88 sample at 20 mg/mL and 20 °C. Sitting drop and reservoir volumes are, respectively, 0.2 and 50 μL. Crystallisation condition is 1.26 M (NH4)2SO4, 0.1 M CHES‐NaOH pH 9.5 and 0.2 M NaCl, using 5 mM 3’‐CMP as cocrystallant.
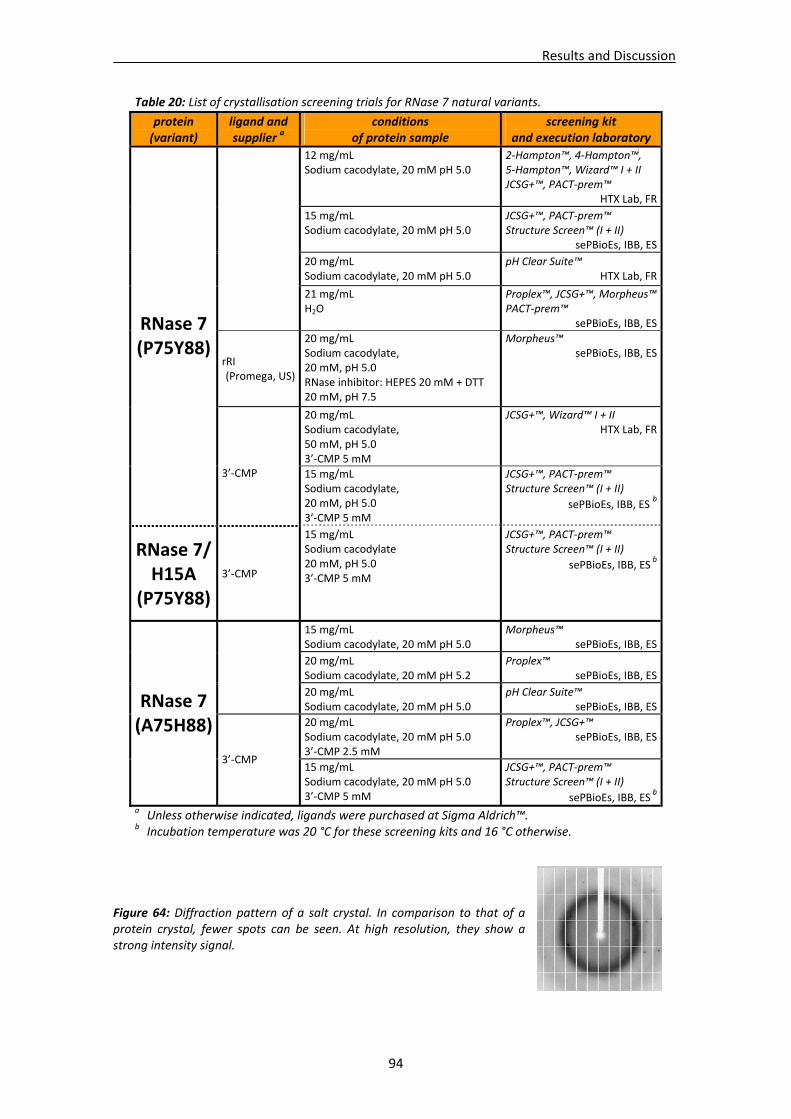
Results and Discussion
94
Figure 64: Diffraction pattern of a salt crystal. In comparison to that of a protein crystal, fewer spots can be seen. At high resolution, they show a strong intensity signal.
Table 20: List of crystallisation screening trials for RNase 7 natural variants.
protein (variant)
ligand and supplier a
conditions of protein sample
screening kit and execution laboratory
12 mg/mL Sodium cacodylate, 20 mM pH 5.0
2‐Hampton™, 4‐Hampton™, 5‐Hampton™, Wizard™ I + II JCSG+™, PACT‐prem™
HTX Lab, FR
15 mg/mL Sodium cacodylate, 20 mM pH 5.0
JCSG+™, PACT‐prem™ Structure Screen™ (I + II)
sePBioEs, IBB, ES
20 mg/mL Sodium cacodylate, 20 mM pH 5.0
pH Clear Suite™ HTX Lab, FR
21 mg/mL H2O
Proplex™, JCSG+™, Morpheus™PACT‐prem™
sePBioEs, IBB, ES
rRI (Promega, US)
20 mg/mL Sodium cacodylate, 20 mM, pH 5.0 RNase inhibitor: HEPES 20 mM + DTT 20 mM, pH 7.5
Morpheus™ sePBioEs, IBB, ES
20 mg/mL Sodium cacodylate, 50 mM, pH 5.0 3’‐CMP 5 mM
JCSG+™, Wizard™ I + II HTX Lab, FR
RNase 7 (P75Y88)
3’‐CMP 15 mg/mL Sodium cacodylate, 20 mM, pH 5.0 3’‐CMP 5 mM
JCSG+™, PACT‐prem™ Structure Screen™ (I + II)
sePBioEs, IBB, ES b
RNase 7/ H15A
(P75Y88)
3’‐CMP
15 mg/mL Sodium cacodylate 20 mM, pH 5.0 3’‐CMP 5 mM
JCSG+™, PACT‐prem™ Structure Screen™ (I + II)
sePBioEs, IBB, ES b
15 mg/mL Sodium cacodylate, 20 mM pH 5.0
Morpheus™ sePBioEs, IBB, ES
20 mg/mL Sodium cacodylate, 20 mM pH 5.2
Proplex™ sePBioEs, IBB, ES
20 mg/mL Sodium cacodylate, 20 mM pH 5.0
pH Clear Suite™ sePBioEs, IBB, ES
20 mg/mL Sodium cacodylate, 20 mM pH 5.0 3’‐CMP 2.5 mM
Proplex™, JCSG+™ sePBioEs, IBB, ES
RNase 7 (A75H88)
3’‐CMP 15 mg/mL Sodium cacodylate, 20 mM pH 5.0 3’‐CMP 5 mM
JCSG+™, PACT‐prem™ Structure Screen™ (I + II)
sePBioEs, IBB, ES b
a Unless otherwise indicated, ligands were purchased at Sigma Aldrich™. b Incubation temperature was 20 °C for these screening kits and 16 °C otherwise.
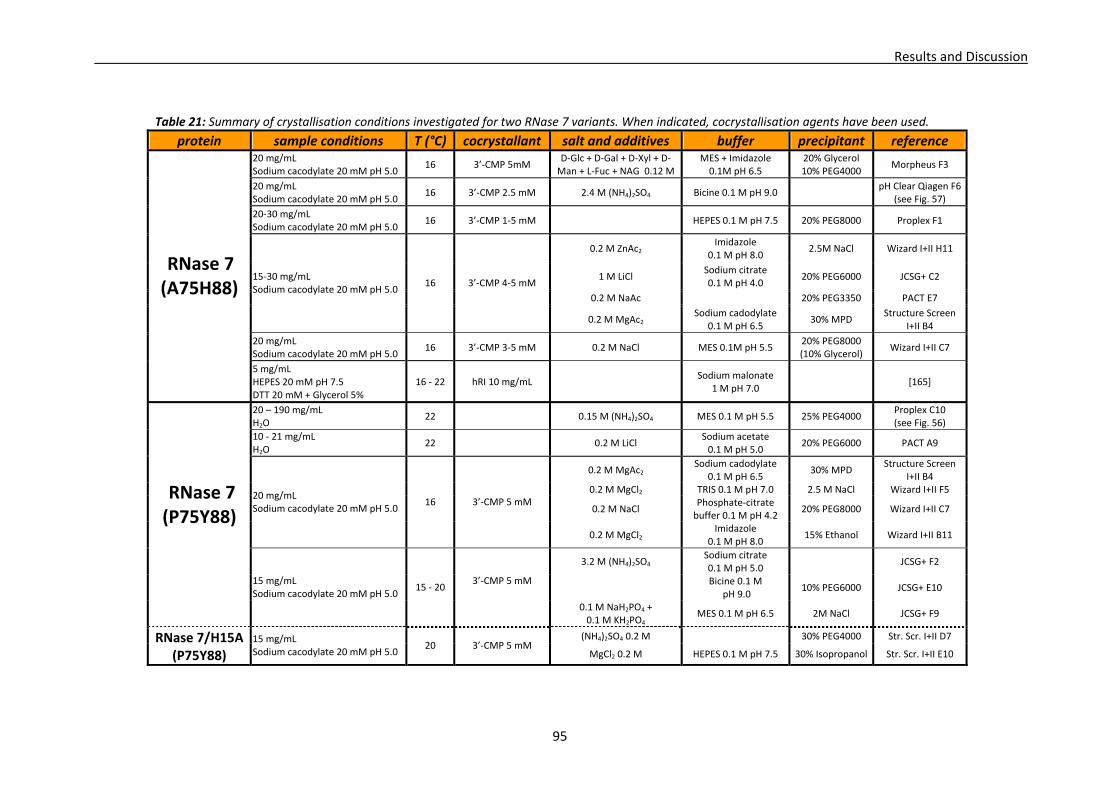
Results and Discussion
95
Table 21: Summary of crystallisation conditions investigated for two RNase 7 variants. When indicated, cocrystallisation agents have been used.
protein sample conditions T (°C) cocrystallant salt and additives buffer precipitant reference 20 mg/mL Sodium cacodylate 20 mM pH 5.0
16 3’‐CMP 5mM D‐Glc + D‐Gal + D‐Xyl + D‐Man + L‐Fuc + NAG 0.12 M
MES + Imidazole 0.1M pH 6.5
20% Glycerol 10% PEG4000
Morpheus F3
20 mg/mL Sodium cacodylate 20 mM pH 5.0
16 3’‐CMP 2.5 mM 2.4 M (NH4)2SO4 Bicine 0.1 M pH 9.0 pH Clear Qiagen F6(see Fig. 57)
20‐30 mg/mL Sodium cacodylate 20 mM pH 5.0
16 3’‐CMP 1‐5 mM HEPES 0.1 M pH 7.5 20% PEG8000 Proplex F1
0.2 M ZnAc2 Imidazole
0.1 M pH 8.0 2.5M NaCl Wizard I+II H11
1 M LiCl Sodium citrate 0.1 M pH 4.0
20% PEG6000 JCSG+ C2
0.2 M NaAc 20% PEG3350 PACT E7
15‐30 mg/mL Sodium cacodylate 20 mM pH 5.0
16 3’‐CMP 4‐5 mM
0.2 M MgAc2 Sodium cadodylate
0.1 M pH 6.5 30% MPD
Structure Screen I+II B4
20 mg/mL Sodium cacodylate 20 mM pH 5.0
16 3’‐CMP 3‐5 mM 0.2 M NaCl MES 0.1M pH 5.5 20% PEG8000 (10% Glycerol)
Wizard I+II C7
.RNase 7 (A75H88)
5 mg/mL HEPES 20 mM pH 7.5 DTT 20 mM + Glycerol 5%
16 ‐ 22 hRI 10 mg/mL Sodium malonate
1 M pH 7.0 [165]
20 – 190 mg/mL H2O
22 0.15 M (NH4)2SO4 MES 0.1 M pH 5.5 25% PEG4000 Proplex C10 (see Fig. 56)
10 ‐ 21 mg/mL H2O
22 0.2 M LiCl Sodium acetate 0.1 M pH 5.0
20% PEG6000 PACT A9
0.2 M MgAc2 Sodium cadodylate
0.1 M pH 6.5 30% MPD
Structure Screen I+II B4
0.2 M MgCl2 TRIS 0.1 M pH 7.0 2.5 M NaCl Wizard I+II F5
0.2 M NaCl Phosphate‐citrate buffer 0.1 M pH 4.2
20% PEG8000 Wizard I+II C7
20 mg/mL Sodium cacodylate 20 mM pH 5.0
16 3’‐CMP 5 mM
0.2 M MgCl2 Imidazole
0.1 M pH 8.0 15% Ethanol Wizard I+II B11
3.2 M (NH4)2SO4 Sodium citrate 0.1 M pH 5.0
JCSG+ F2
Bicine 0.1 M
pH 9.0 10% PEG6000 JCSG+ E10
..RNase 7 (P75Y88)
15 mg/mL Sodium cacodylate 20 mM pH 5.0
15 ‐ 20 3’‐CMP 5 mM
0.1 M NaH2PO4 + 0.1 M KH2PO4
MES 0.1 M pH 6.5 2M NaCl JCSG+ F9
(NH4)2SO4 0.2 M 30% PEG4000 Str. Scr. I+II D7 RNase 7/H15A (P75Y88)
15 mg/mL Sodium cacodylate 20 mM pH 5.0
20 3’‐CMP 5 mM MgCl2 0.2 M HEPES 0.1 M pH 7.5 30% Isopropanol Str. Scr. I+II E10
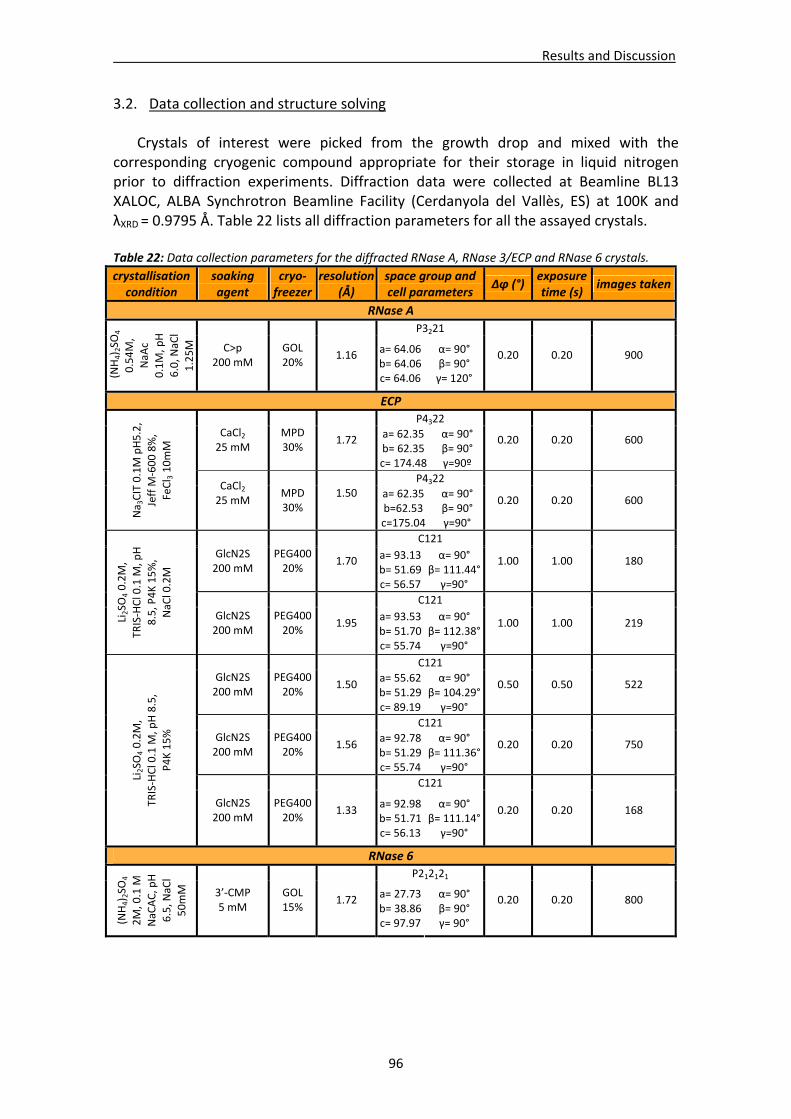
Results and Discussion
96
3.2. Data collection and structure solving
Crystals of interest were picked from the growth drop and mixed with the corresponding cryogenic compound appropriate for their storage in liquid nitrogen prior to diffraction experiments. Diffraction data were collected at Beamline BL13 XALOC, ALBA Synchrotron Beamline Facility (Cerdanyola del Vallès, ES) at 100K and λXRD = 0.9795 Å. Table 22 lists all diffraction parameters for all the assayed crystals.
Table 22: Data collection parameters for the diffracted RNase A, RNase 3/ECP and RNase 6 crystals.
crystallisation condition
soaking agent
cryo‐freezer
resolution (Å)
space group andcell parameters
Δφ (°) exposure time (s)
images taken
RNase A
P3221
(NH4) 2SO
4
0.54M,
NaA
c
0.1M, pH
6.0, N
aCl
1.25M
C>p 200 mM
GOL 20%
1.16 a= 64.06b= 64.06c= 64.06
α= 90° β= 90° γ= 120°
0.20 0.20 900
ECP
P4322 CaCl2 25 mM
MPD 30%
1.72 a= 62.35b= 62.35c= 174.48
α= 90° β= 90° γ=90º
0.20 0.20 600
P4322
Na 3CIT 0.1M pH5.2,
Jeff M
‐600 8%,
FeCl 3 10mM
CaCl2 25 mM
MPD 30%
1.50
a= 62.35b=62.53c=175.04
α= 90° β= 90° γ=90°
0.20 0.20 600
C121
GlcN2S 200 mM
PEG400 20%
1.70 a= 93.13b= 51.69c= 56.57
α= 90° β= 111.44°
γ=90°
1.00 1.00 180
C121
Li2SO
4 0.2M,
TRIS‐HCl 0.1 M
, pH
8.5, P4K 15%,
NaCl 0.2M
GlcN2S 200 mM
PEG400 20%
1.95 a= 93.53b= 51.70c= 55.74
α= 90° β= 112.38°
γ=90°
1.00 1.00 219
C121 GlcN2S 200 mM
PEG400 20%
1.50 a= 55.62b= 51.29c= 89.19
α= 90° β= 104.29°
γ=90°
0.50 0.50 522
C121 GlcN2S 200 mM
PEG400 20%
1.56 a= 92.78b= 51.29c= 55.74
α= 90° β= 111.36°
γ=90°
0.20 0.20 750
C121
Li2SO
4 0.2M,
TRIS‐HCl 0.1 M
, pH 8.5,
P4K 15%
GlcN2S 200 mM
PEG400 20%
1.33 a= 92.98b= 51.71c= 56.13
α= 90° β= 111.14°
γ=90°
0.20 0.20 168
RNase 6 P212121
(NH4) 2SO
4 2M, 0.1 M
NaCAC, pH
6.5, N
aCl
50mM
3’‐CMP 5 mM
GOL 15%
1.72 a= 27.73b= 38.86c= 97.97
α= 90° β= 90° γ= 90°
0.20 0.20 800
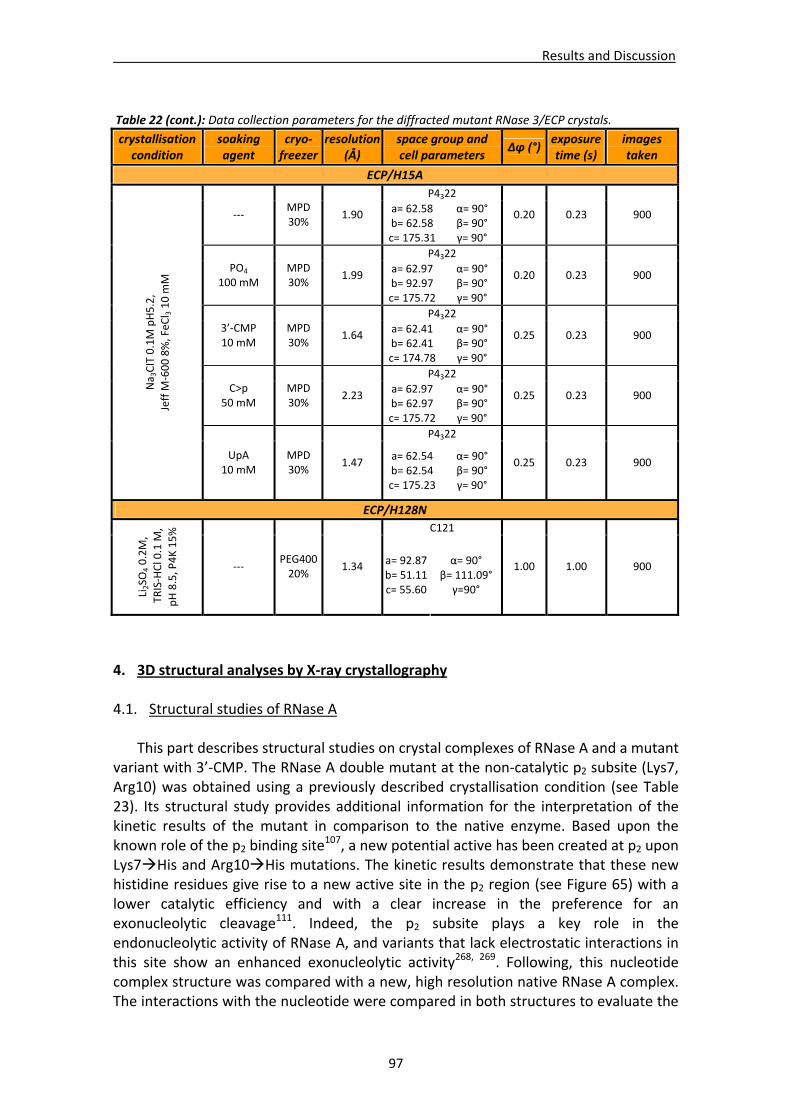
Results and Discussion
97
4. 3D structural analyses by X‐ray crystallography 4.1. Structural studies of RNase A
This part describes structural studies on crystal complexes of RNase A and a mutant variant with 3’‐CMP. The RNase A double mutant at the non‐catalytic p2 subsite (Lys7, Arg10) was obtained using a previously described crystallisation condition (see Table 23). Its structural study provides additional information for the interpretation of the kinetic results of the mutant in comparison to the native enzyme. Based upon the known role of the p2 binding site
107, a new potential active has been created at p2 upon Lys7His and Arg10His mutations. The kinetic results demonstrate that these new histidine residues give rise to a new active site in the p2 region (see Figure 65) with a lower catalytic efficiency and with a clear increase in the preference for an exonucleolytic cleavage111. Indeed, the p2 subsite plays a key role in the endonucleolytic activity of RNase A, and variants that lack electrostatic interactions in this site show an enhanced exonucleolytic activity268, 269. Following, this nucleotide complex structure was compared with a new, high resolution native RNase A complex. The interactions with the nucleotide were compared in both structures to evaluate the
Table 22 (cont.): Data collection parameters for the diffracted mutant RNase 3/ECP crystals.
crystallisation condition
soaking agent
cryo‐freezer
resolution (Å)
space group and cell parameters
Δφ (°)exposure time (s)
images taken
ECP/H15A
P4322
‐‐‐ MPD 30%
1.90 a= 62.58 b= 62.58 c= 175.31
α= 90° β= 90° γ= 90°
0.20 0.23 900
P4322 PO4
100 mM MPD 30%
1.99 a= 62.97 b= 92.97 c= 175.72
α= 90° β= 90° γ= 90°
0.20 0.23 900
P4322 3’‐CMP 10 mM
MPD 30%
1.64 a= 62.41 b= 62.41 c= 174.78
α= 90° β= 90° γ= 90°
0.25 0.23 900
P4322 C>p
50 mM MPD 30%
2.23 a= 62.97 b= 62.97 c= 175.72
α= 90° β= 90° γ= 90°
0.25 0.23 900
P4322
Na 3CIT 0.1M pH5.2,
Jeff M
‐600 8%, FeC
l 3 10 m
M
UpA 10 mM
MPD 30%
1.47 a= 62.54 b= 62.54 c= 175.23
α= 90° β= 90° γ= 90°
0.25 0.23 900
ECP/H128N C121
Li2SO
4 0.2M,
TRIS‐HCl 0.1 M
, pH 8.5, P4K 15%
‐‐‐ PEG400 20%
1.34 a= 92.87b= 51.11c= 55.60
α= 90° β= 111.09°
γ=90°
1.00 1.00 900
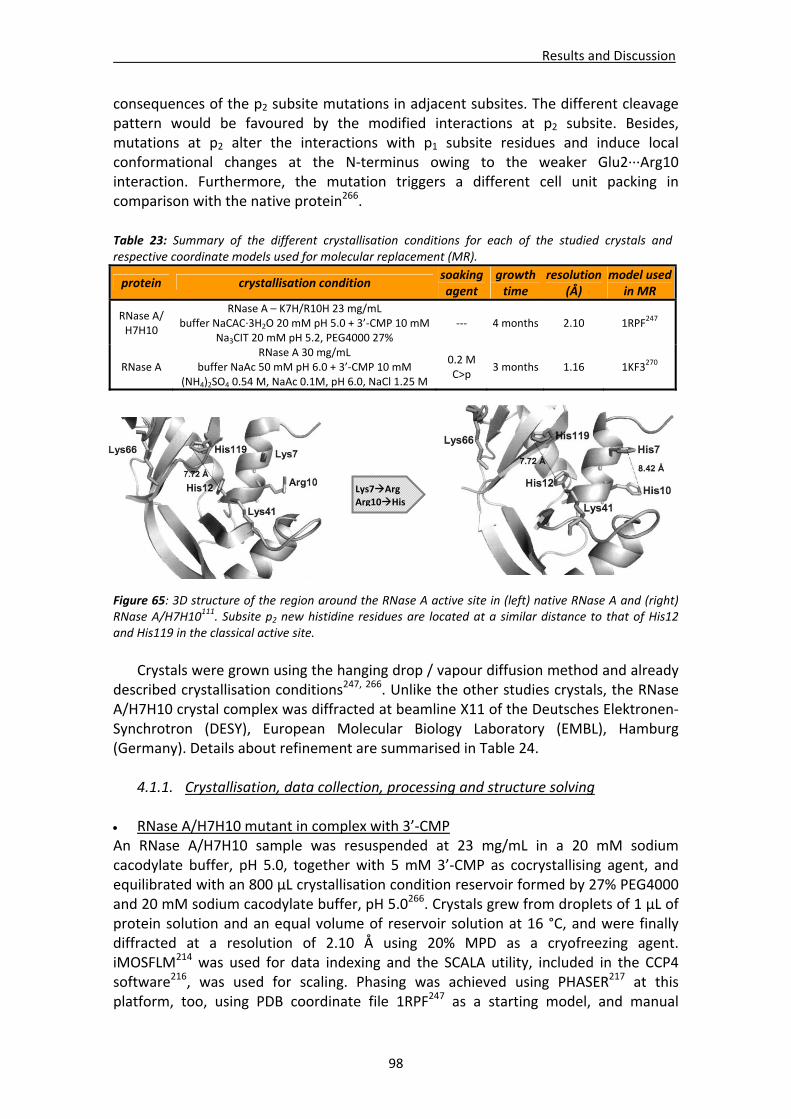
Results and Discussion
98
consequences of the p2 subsite mutations in adjacent subsites. The different cleavage pattern would be favoured by the modified interactions at p2 subsite. Besides, mutations at p2 alter the interactions with p1 subsite residues and induce local conformational changes at the N‐terminus owing to the weaker Glu2∙∙∙Arg10 interaction. Furthermore, the mutation triggers a different cell unit packing in comparison with the native protein266.
Figure 65: 3D structure of the region around the RNase A active site in (left) native RNase A and (right) RNase A/H7H10
111. Subsite p2 new histidine residues are located at a similar distance to that of His12 and His119 in the classical active site.
Crystals were grown using the hanging drop / vapour diffusion method and already
described crystallisation conditions247, 266. Unlike the other studies crystals, the RNase A/H7H10 crystal complex was diffracted at beamline X11 of the Deutsches Elektronen‐Synchrotron (DESY), European Molecular Biology Laboratory (EMBL), Hamburg (Germany). Details about refinement are summarised in Table 24.
4.1.1. Crystallisation, data collection, processing and structure solving
RNase A/H7H10 mutant in complex with 3’‐CMP An RNase A/H7H10 sample was resuspended at 23 mg/mL in a 20 mM sodium cacodylate buffer, pH 5.0, together with 5 mM 3’‐CMP as cocrystallising agent, and equilibrated with an 800 μL crystallisation condition reservoir formed by 27% PEG4000 and 20 mM sodium cacodylate buffer, pH 5.0266. Crystals grew from droplets of 1 μL of protein solution and an equal volume of reservoir solution at 16 °C, and were finally diffracted at a resolution of 2.10 Å using 20% MPD as a cryofreezing agent. iMOSFLM214 was used for data indexing and the SCALA utility, included in the CCP4 software216, was used for scaling. Phasing was achieved using PHASER217 at this platform, too, using PDB coordinate file 1RPF247 as a starting model, and manual
Table 23: Summary of the different crystallisation conditions for each of the studied crystals and respective coordinate models used for molecular replacement (MR).
protein crystallisation condition soaking agent
growth time
resolution (Å)
model used in MR
RNase A/ H7H10
RNase A – K7H/R10H 23 mg/mL buffer NaCAC∙3H2O 20 mM pH 5.0 + 3’‐CMP 10 mM
Na3CIT 20 mM pH 5.2, PEG4000 27% ‐‐‐ 4 months 2.10 1RPF
247
RNase A RNase A 30 mg/mL
buffer NaAc 50 mM pH 6.0 + 3’‐CMP 10 mM (NH4)2SO4 0.54 M, NaAc 0.1M, pH 6.0, NaCl 1.25 M
0.2 M C>p
3 months 1.16 1KF3270
Lys7ArgArg10His
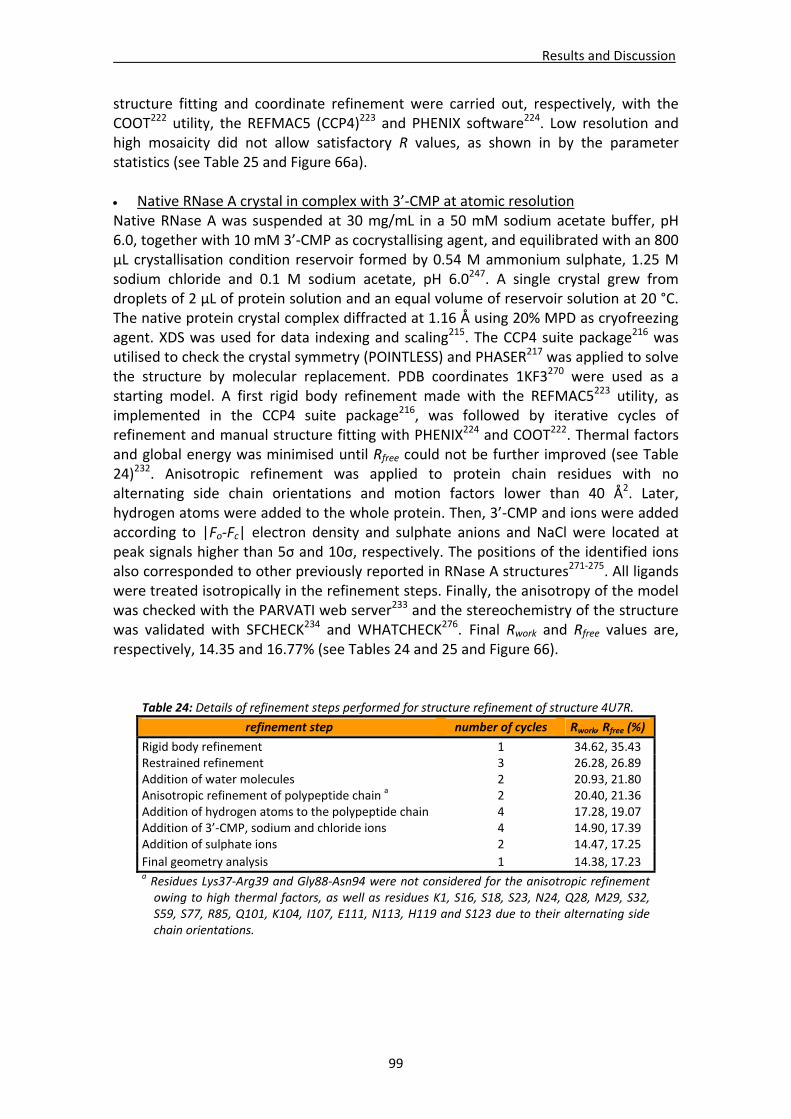
Results and Discussion
99
structure fitting and coordinate refinement were carried out, respectively, with the COOT222 utility, the REFMAC5 (CCP4)223 and PHENIX software224. Low resolution and high mosaicity did not allow satisfactory R values, as shown in by the parameter statistics (see Table 25 and Figure 66a). Native RNase A crystal in complex with 3’‐CMP at atomic resolution Native RNase A was suspended at 30 mg/mL in a 50 mM sodium acetate buffer, pH 6.0, together with 10 mM 3’‐CMP as cocrystallising agent, and equilibrated with an 800 μL crystallisation condition reservoir formed by 0.54 M ammonium sulphate, 1.25 M sodium chloride and 0.1 M sodium acetate, pH 6.0247. A single crystal grew from droplets of 2 μL of protein solution and an equal volume of reservoir solution at 20 °C. The native protein crystal complex diffracted at 1.16 Å using 20% MPD as cryofreezing agent. XDS was used for data indexing and scaling215. The CCP4 suite package216 was utilised to check the crystal symmetry (POINTLESS) and PHASER217 was applied to solve the structure by molecular replacement. PDB coordinates 1KF3270 were used as a starting model. A first rigid body refinement made with the REFMAC5223 utility, as implemented in the CCP4 suite package216, was followed by iterative cycles of refinement and manual structure fitting with PHENIX224 and COOT222. Thermal factors and global energy was minimised until Rfree could not be further improved (see Table 24)232. Anisotropic refinement was applied to protein chain residues with no alternating side chain orientations and motion factors lower than 40 Å2. Later, hydrogen atoms were added to the whole protein. Then, 3’‐CMP and ions were added according to |Fo‐Fc| electron density and sulphate anions and NaCl were located at peak signals higher than 5σ and 10σ, respectively. The positions of the identified ions also corresponded to other previously reported in RNase A structures271‐275. All ligands were treated isotropically in the refinement steps. Finally, the anisotropy of the model was checked with the PARVATI web server233 and the stereochemistry of the structure was validated with SFCHECK234 and WHATCHECK276. Final Rwork and Rfree values are, respectively, 14.35 and 16.77% (see Tables 24 and 25 and Figure 66).
Table 24: Details of refinement steps performed for structure refinement of structure 4U7R. refinement step number of cycles Rwork, Rfree (%)
Rigid body refinement 1 34.62, 35.43 Restrained refinement 3 26.28, 26.89 Addition of water molecules 2 20.93, 21.80 Anisotropic refinement of polypeptide chain a 2 20.40, 21.36 Addition of hydrogen atoms to the polypeptide chain 4 17.28, 19.07 Addition of 3’‐CMP, sodium and chloride ions 4 14.90, 17.39 Addition of sulphate ions 2 14.47, 17.25
Final geometry analysis 1 14.38, 17.23 a Residues Lys37‐Arg39 and Gly88‐Asn94 were not considered for the anisotropic refinement owing to high thermal factors, as well as residues K1, S16, S18, S23, N24, Q28, M29, S32, S59, S77, R85, Q101, K104, I107, E111, N113, H119 and S123 due to their alternating side chain orientations.
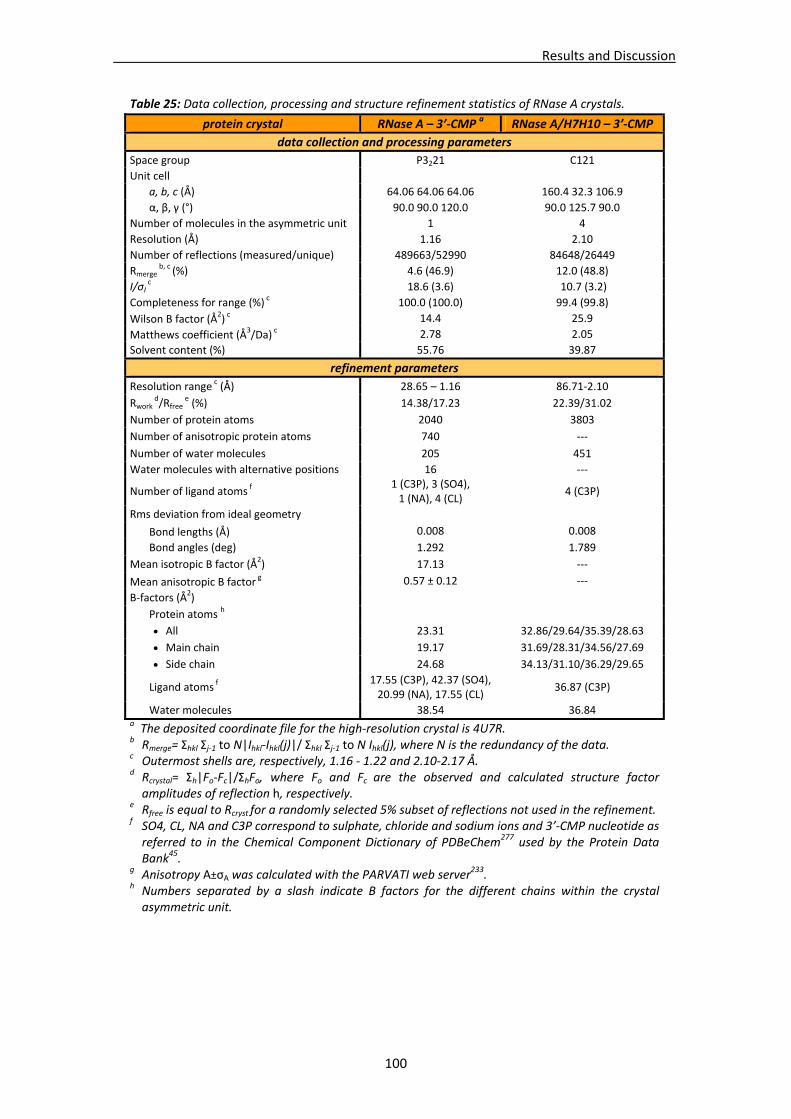
Results and Discussion
100
Table 25: Data collection, processing and structure refinement statistics of RNase A crystals.
protein crystal RNase A – 3’‐CMP a RNase A/H7H10 – 3’‐CMP
data collection and processing parameters
Space group P3221 C121
Unit cell
a, b, c (Å) 64.06 64.06 64.06 160.4 32.3 106.9
α, β, γ (°) 90.0 90.0 120.0 90.0 125.7 90.0
Number of molecules in the asymmetric unit 1 4
Resolution (Å) 1.16 2.10
Number of reflections (measured/unique) 489663/52990 84648/26449
Rmerge b, c (%) 4.6 (46.9) 12.0 (48.8)
I/σΙ c 18.6 (3.6) 10.7 (3.2)
Completeness for range (%) c 100.0 (100.0) 99.4 (99.8)
Wilson B factor (Å2) c 14.4 25.9
Matthews coefficient (Å3/Da) c 2.78 2.05
Solvent content (%) 55.76 39.87
refinement parameters
Resolution range c (Å) 28.65 – 1.16 86.71‐2.10
Rwork d/Rfree
e (%) 14.38/17.23 22.39/31.02
Number of protein atoms 2040 3803
Number of anisotropic protein atoms 740 ‐‐‐
Number of water molecules 205 451
Water molecules with alternative positions 16 ‐‐‐
Number of ligand atoms f 1 (C3P), 3 (SO4), 1 (NA), 4 (CL)
4 (C3P)
Rms deviation from ideal geometry
Bond lengths (Å) 0.008 0.008
Bond angles (deg) 1.292 1.789
Mean isotropic B factor (Å2) 17.13 ‐‐‐
Mean anisotropic B factor g 0.57 ± 0.12 ‐‐‐
B‐factors (Å2)
Protein atoms h
All 23.31 32.86/29.64/35.39/28.63
Main chain 19.17 31.69/28.31/34.56/27.69
Side chain 24.68 34.13/31.10/36.29/29.65
Ligand atoms f 17.55 (C3P), 42.37 (SO4), 20.99 (NA), 17.55 (CL)
36.87 (C3P)
Water molecules 38.54 36.84 a The deposited coordinate file for the high‐resolution crystal is 4U7R. b Rmerge= Σhkl Σj‐1 to N|Ihkl‐Ihkl(j)|/ Σhkl Σj‐1 to N Ihkl(j), where N is the redundancy of the data. c Outermost shells are, respectively, 1.16 ‐ 1.22 and 2.10‐2.17 Å. d Rcrystal= Σh|Fo‐Fc|/ΣhFo, where Fo and Fc are the observed and calculated structure factor amplitudes of reflection h, respectively.
e Rfree is equal to Rcryst for a randomly selected 5% subset of reflections not used in the refinement. f SO4, CL, NA and C3P correspond to sulphate, chloride and sodium ions and 3’‐CMP nucleotide as referred to in the Chemical Component Dictionary of PDBeChem277 used by the Protein Data Bank45.
g Anisotropy A±σA was calculated with the PARVATI web server233.
h Numbers separated by a slash indicate B factors for the different chains within the crystal asymmetric unit.
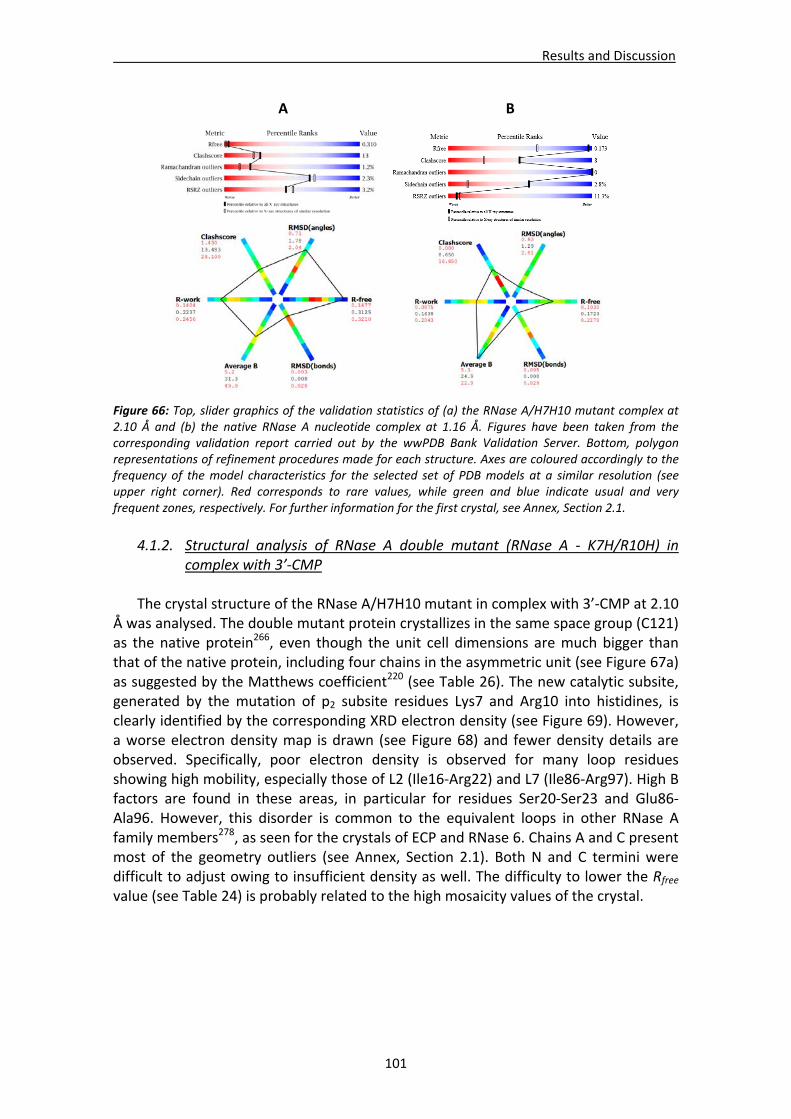
Results and Discussion
101
Figure 66: Top, slider graphics of the validation statistics of (a) the RNase A/H7H10 mutant complex at 2.10 Å and (b) the native RNase A nucleotide complex at 1.16 Å. Figures have been taken from the corresponding validation report carried out by the wwPDB Bank Validation Server. Bottom, polygon representations of refinement procedures made for each structure. Axes are coloured accordingly to the frequency of the model characteristics for the selected set of PDB models at a similar resolution (see upper right corner). Red corresponds to rare values, while green and blue indicate usual and very frequent zones, respectively. For further information for the first crystal, see Annex, Section 2.1.
4.1.2. Structural analysis of RNase A double mutant (RNase A ‐ K7H/R10H) in
complex with 3’‐CMP
The crystal structure of the RNase A/H7H10 mutant in complex with 3’‐CMP at 2.10 Å was analysed. The double mutant protein crystallizes in the same space group (C121) as the native protein266, even though the unit cell dimensions are much bigger than that of the native protein, including four chains in the asymmetric unit (see Figure 67a) as suggested by the Matthews coefficient220 (see Table 26). The new catalytic subsite, generated by the mutation of p2 subsite residues Lys7 and Arg10 into histidines, is clearly identified by the corresponding XRD electron density (see Figure 69). However, a worse electron density map is drawn (see Figure 68) and fewer density details are observed. Specifically, poor electron density is observed for many loop residues showing high mobility, especially those of L2 (Ile16‐Arg22) and L7 (Ile86‐Arg97). High B factors are found in these areas, in particular for residues Ser20‐Ser23 and Glu86‐Ala96. However, this disorder is common to the equivalent loops in other RNase A family members278, as seen for the crystals of ECP and RNase 6. Chains A and C present most of the geometry outliers (see Annex, Section 2.1). Both N and C termini were difficult to adjust owing to insufficient density as well. The difficulty to lower the Rfree value (see Table 24) is probably related to the high mosaicity values of the crystal.
A B
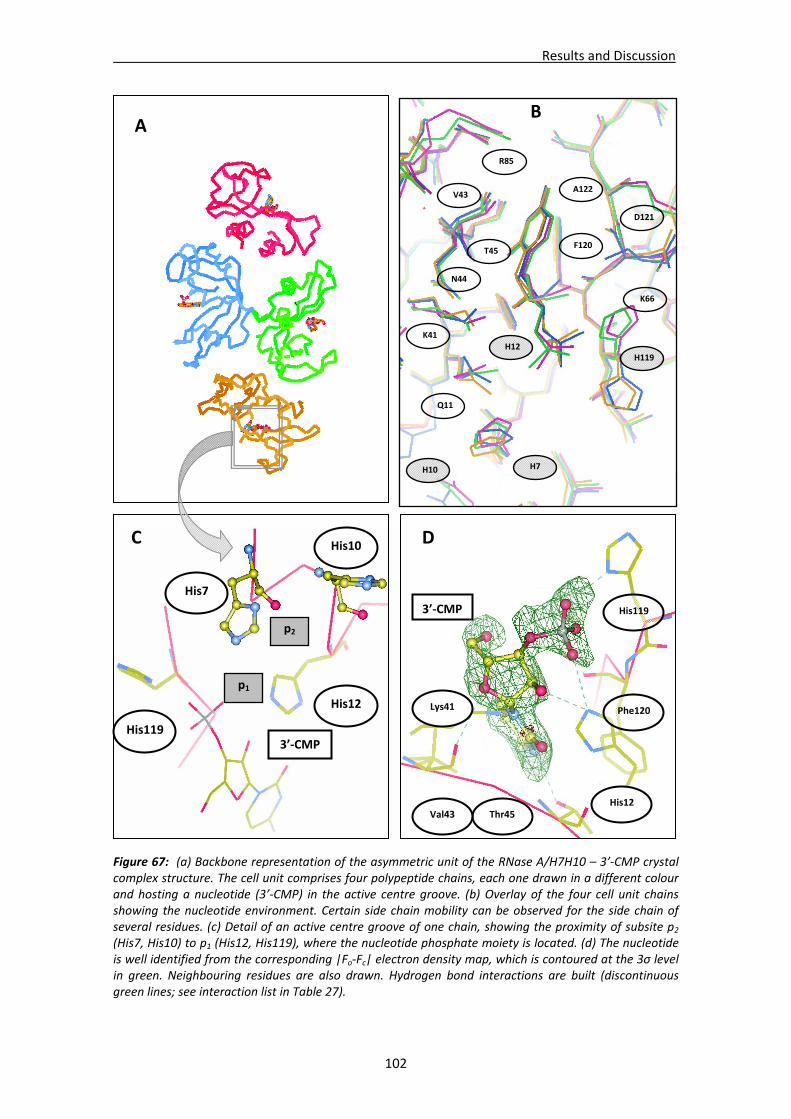
Results and Discussion
102
Figure 67: (a) Backbone representation of the asymmetric unit of the RNase A/H7H10 – 3’‐CMP crystal complex structure. The cell unit comprises four polypeptide chains, each one drawn in a different colour and hosting a nucleotide (3’‐CMP) in the active centre groove. (b) Overlay of the four cell unit chains showing the nucleotide environment. Certain side chain mobility can be observed for the side chain of several residues. (c) Detail of an active centre groove of one chain, showing the proximity of subsite p2 (His7, His10) to p1 (His12, His119), where the nucleotide phosphate moiety is located. (d) The nucleotide is well identified from the corresponding |Fo‐Fc| electron density map, which is contoured at the 3σ level in green. Neighbouring residues are also drawn. Hydrogen bond interactions are built (discontinuous green lines; see interaction list in Table 27).
K66
F120
H119
H10
Q11
K41
N44
T45
A122
D121
R85
V43
B
H7
H12
His7
His10
His119
His12
3’‐CMP
p2
p1
C
His119 3’‐CMP
Phe120
Thr45
Lys41
Val43His12
D
A
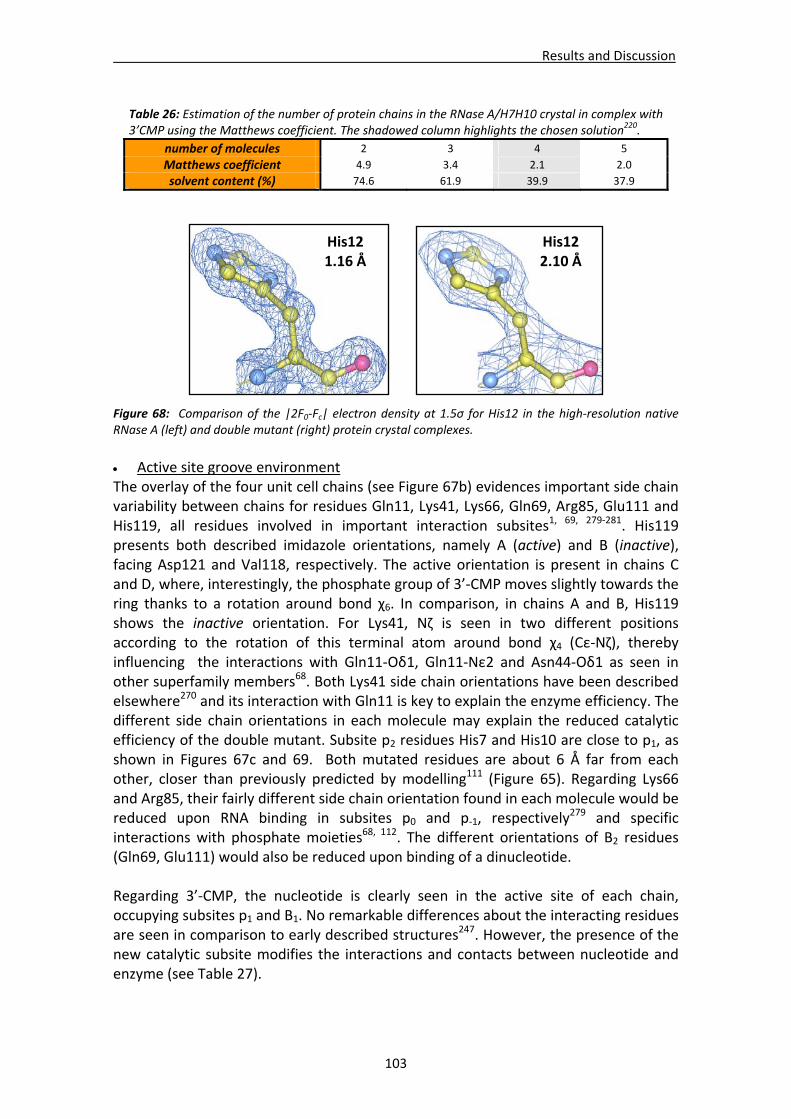
Results and Discussion
103
Figure 68: Comparison of the |2F0‐Fc| electron density at 1.5σ for His12 in the high‐resolution native RNase A (left) and double mutant (right) protein crystal complexes.
Active site groove environment The overlay of the four unit cell chains (see Figure 67b) evidences important side chain variability between chains for residues Gln11, Lys41, Lys66, Gln69, Arg85, Glu111 and His119, all residues involved in important interaction subsites1, 69, 279‐281. His119 presents both described imidazole orientations, namely A (active) and B (inactive), facing Asp121 and Val118, respectively. The active orientation is present in chains C and D, where, interestingly, the phosphate group of 3’‐CMP moves slightly towards the ring thanks to a rotation around bond χ6. In comparison, in chains A and B, His119 shows the inactive orientation. For Lys41, Nζ is seen in two different positions according to the rotation of this terminal atom around bond χ4 (Cε‐Nζ), thereby influencing the interactions with Gln11‐Oδ1, Gln11‐Nε2 and Asn44‐Oδ1 as seen in other superfamily members68. Both Lys41 side chain orientations have been described elsewhere270 and its interaction with Gln11 is key to explain the enzyme efficiency. The different side chain orientations in each molecule may explain the reduced catalytic efficiency of the double mutant. Subsite p2 residues His7 and His10 are close to p1, as shown in Figures 67c and 69. Both mutated residues are about 6 Å far from each other, closer than previously predicted by modelling111 (Figure 65). Regarding Lys66 and Arg85, their fairly different side chain orientation found in each molecule would be reduced upon RNA binding in subsites p0 and p‐1, respectively
279 and specific interactions with phosphate moieties68, 112. The different orientations of B2 residues (Gln69, Glu111) would also be reduced upon binding of a dinucleotide. Regarding 3’‐CMP, the nucleotide is clearly seen in the active site of each chain, occupying subsites p1 and B1. No remarkable differences about the interacting residues are seen in comparison to early described structures247. However, the presence of the new catalytic subsite modifies the interactions and contacts between nucleotide and enzyme (see Table 27).
Table 26: Estimation of the number of protein chains in the RNase A/H7H10 crystal in complex with 3’CMP using the Matthews coefficient. The shadowed column highlights the chosen solution220.
number of molecules 2 3 4 5
Matthews coefficient 4.9 3.4 2.1 2.0
solvent content (%) 74.6 61.9 39.9 37.9
His12 1.16 Å
His12 2.10 Å
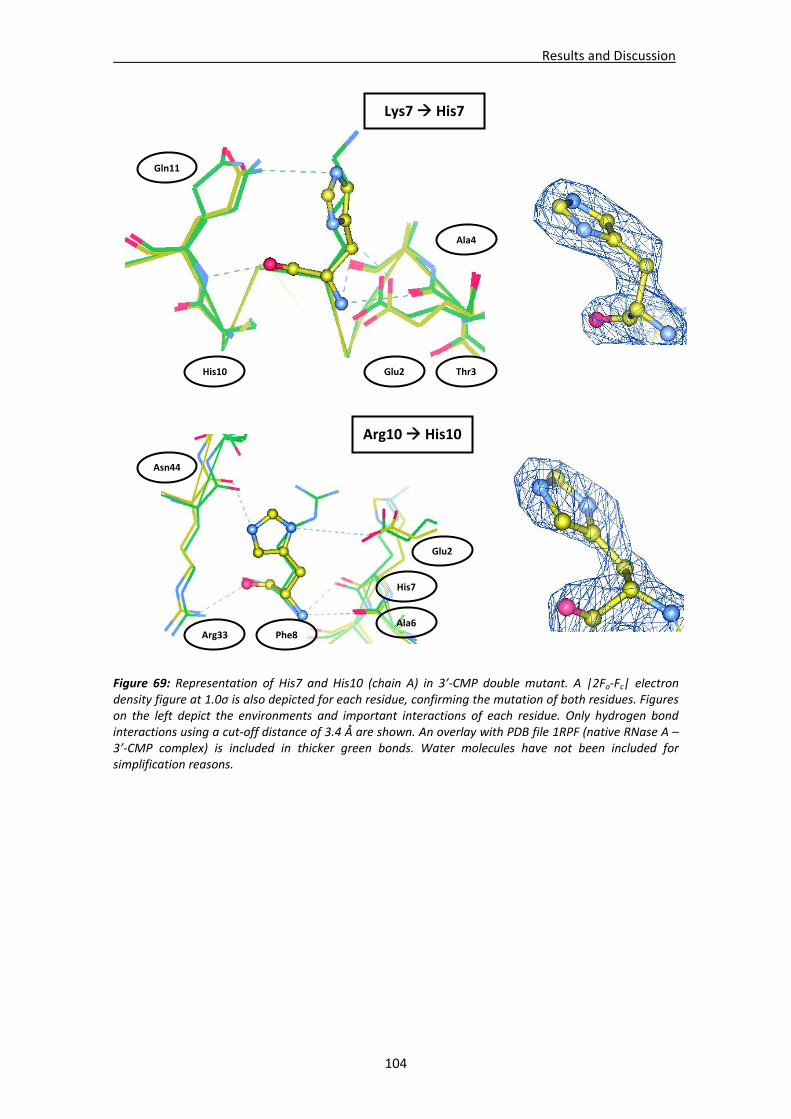
Results and Discussion
104
Figure 69: Representation of His7 and His10 (chain A) in 3’‐CMP double mutant. A |2Fo‐Fc| electron density figure at 1.0σ is also depicted for each residue, confirming the mutation of both residues. Figures on the left depict the environments and important interactions of each residue. Only hydrogen bond interactions using a cut‐off distance of 3.4 Å are shown. An overlay with PDB file 1RPF (native RNase A – 3’‐CMP complex) is included in thicker green bonds. Water molecules have not been included for simplification reasons.
Gln11
Glu2 Thr3
Ala4
His10
Lys7 His7
Glu2
Ala6
His7
Phe8 Arg33
Asn44
Arg10 His10
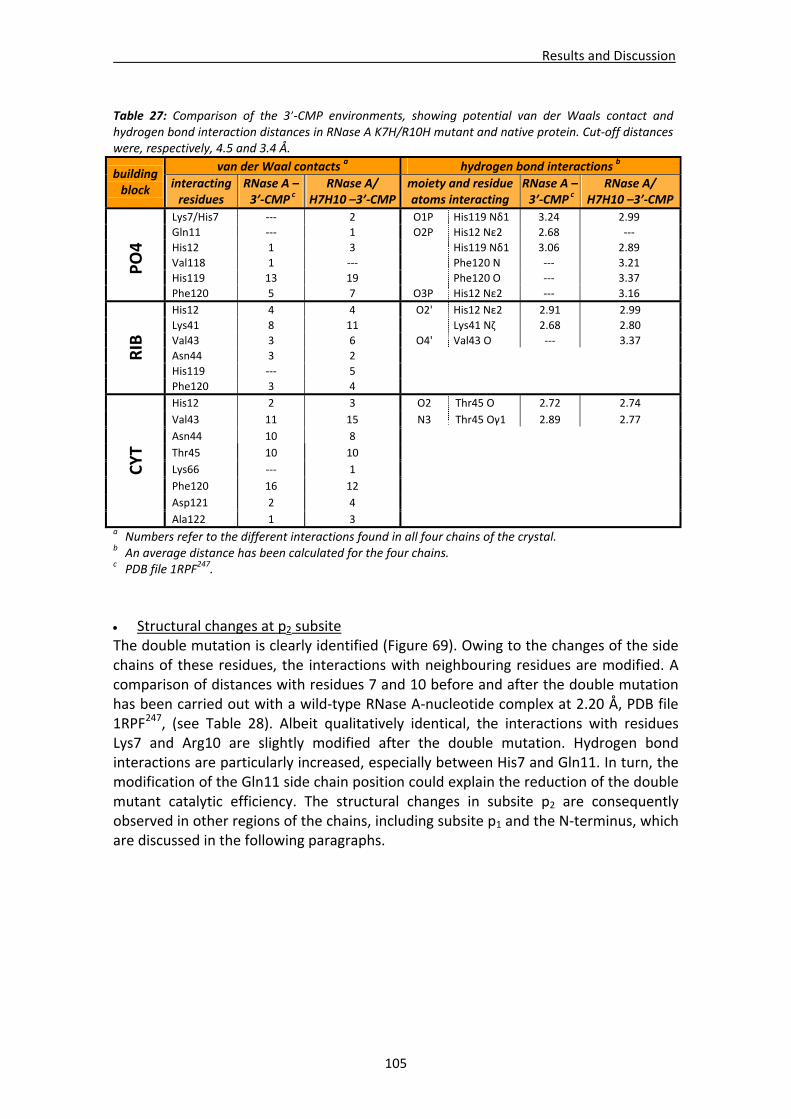
Results and Discussion
105
Structural changes at p2 subsite The double mutation is clearly identified (Figure 69). Owing to the changes of the side chains of these residues, the interactions with neighbouring residues are modified. A comparison of distances with residues 7 and 10 before and after the double mutation has been carried out with a wild‐type RNase A‐nucleotide complex at 2.20 Å, PDB file 1RPF247, (see Table 28). Albeit qualitatively identical, the interactions with residues Lys7 and Arg10 are slightly modified after the double mutation. Hydrogen bond interactions are particularly increased, especially between His7 and Gln11. In turn, the modification of the Gln11 side chain position could explain the reduction of the double mutant catalytic efficiency. The structural changes in subsite p2 are consequently observed in other regions of the chains, including subsite p1 and the N‐terminus, which are discussed in the following paragraphs.
Table 27: Comparison of the 3’‐CMP environments, showing potential van der Waals contact and hydrogen bond interaction distances in RNase A K7H/R10H mutant and native protein. Cut‐off distances were, respectively, 4.5 and 3.4 Å.
van der Waal contacts a hydrogen bond interactions b building block
interacting residues
RNase A – 3’‐CMP c
RNase A/H7H10 –3’‐CMP
moiety and residue atoms interacting
RNase A – 3’‐CMP c
RNase A/H7H10 –3’‐CMP
Lys7/His7 ‐‐‐ 2 O1P His119 Νδ1 3.24 2.99
Gln11 ‐‐‐ 1 O2P His12 Νε2 2.68 ‐‐‐
His12 1 3 His119 Νδ1 3.06 2.89
Val118 1 ‐‐‐ Phe120 Ν ‐‐‐ 3.21
His119 13 19 Phe120 Ο ‐‐‐ 3.37
PO4
Phe120 5 7 O3P His12 Νε2 ‐‐‐ 3.16
His12 4 4 O2' His12 Νε2 2.91 2.99
Lys41 8 11 Lys41 Νζ 2.68 2.80
Val43 3 6 O4' Val43 O ‐‐‐ 3.37
Asn44 3 2
His119 ‐‐‐ 5
RIB
Phe120 3 4
His12 2 3 O2 Thr45 O 2.72 2.74
Val43 11 15 N3 Τhr45 Oγ1 2.89 2.77
Asn44 10 8
Thr45 10 10
Lys66 ‐‐‐ 1
Phe120 16 12
Asp121 2 4
CYT
Ala122 1 3
a Numbers refer to the different interactions found in all four chains of the crystal. b An average distance has been calculated for the four chains. c PDB file 1RPF247.
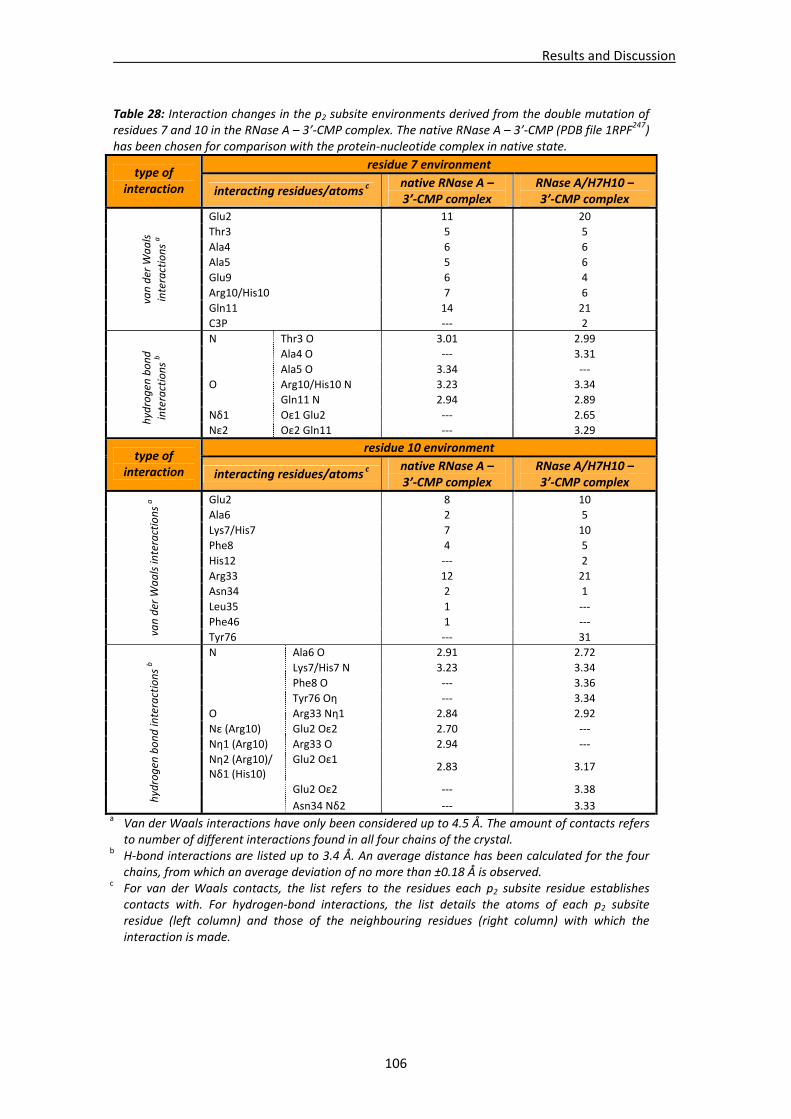
Results and Discussion
106
Table 28: Interaction changes in the p2 subsite environments derived from the double mutation of residues 7 and 10 in the RNase A – 3’‐CMP complex. The native RNase A – 3’‐CMP (PDB file 1RPF247) has been chosen for comparison with the protein‐nucleotide complex in native state.
residue 7 environment type of
interaction interacting residues/atoms c native RNase A –3’‐CMP complex
RNase A/H7H10 – 3’‐CMP complex
Glu2 11 20
Thr3 5 5
Ala4 6 6
Ala5 5 6
Glu9 6 4
Arg10/His10 7 6
Gln11 14 21
van der W
aals
interactions a
C3P ‐‐‐ 2
N Thr3 O 3.01 2.99
Ala4 O ‐‐‐ 3.31
Ala5 O 3.34 ‐‐‐
O Arg10/His10 N 3.23 3.34
Gln11 N 2.94 2.89
Nδ1 Οε1 Glu2 ‐‐‐ 2.65 hydrogen
bond
interactions b
Nε2 Οε2 Gln11 ‐‐‐ 3.29
residue 10 environment type of
interaction interacting residues/atoms c native RNase A –3’‐CMP complex
RNase A/H7H10 – 3’‐CMP complex
Glu2 8 10
Ala6 2 5
Lys7/His7 7 10
Phe8 4 5
His12 ‐‐‐ 2
Arg33 12 21
Asn34 2 1
Leu35 1 ‐‐‐
Phe46 1 ‐‐‐
van der W
aals interactions a
Tyr76 ‐‐‐ 31
N Ala6 Ο 2.91 2.72
Lys7/His7 Ν 3.23 3.34
Phe8 Ο ‐‐‐ 3.36
Tyr76 Οη ‐‐‐ 3.34
O Arg33 Νη1 2.84 2.92
Nε (Arg10) Glu2 Οε2 2.70 ‐‐‐
Nη1 (Arg10) Arg33 Ο 2.94 ‐‐‐
Νη2 (Arg10)/ Nδ1 (His10)
Glu2 Οε1 2.83 3.17
Glu2 Οε2 ‐‐‐ 3.38
hydrogen
bond interactions b
Asn34 Νδ2 ‐‐‐ 3.33 a Van der Waals interactions have only been considered up to 4.5 Å. The amount of contacts refers
to number of different interactions found in all four chains of the crystal. b H‐bond interactions are listed up to 3.4 Å. An average distance has been calculated for the four
chains, from which an average deviation of no more than ±0.18 Å is observed. c For van der Waals contacts, the list refers to the residues each p2 subsite residue establishes
contacts with. For hydrogen‐bond interactions, the list details the atoms of each p2 subsite residue (left column) and those of the neighbouring residues (right column) with which the interaction is made.
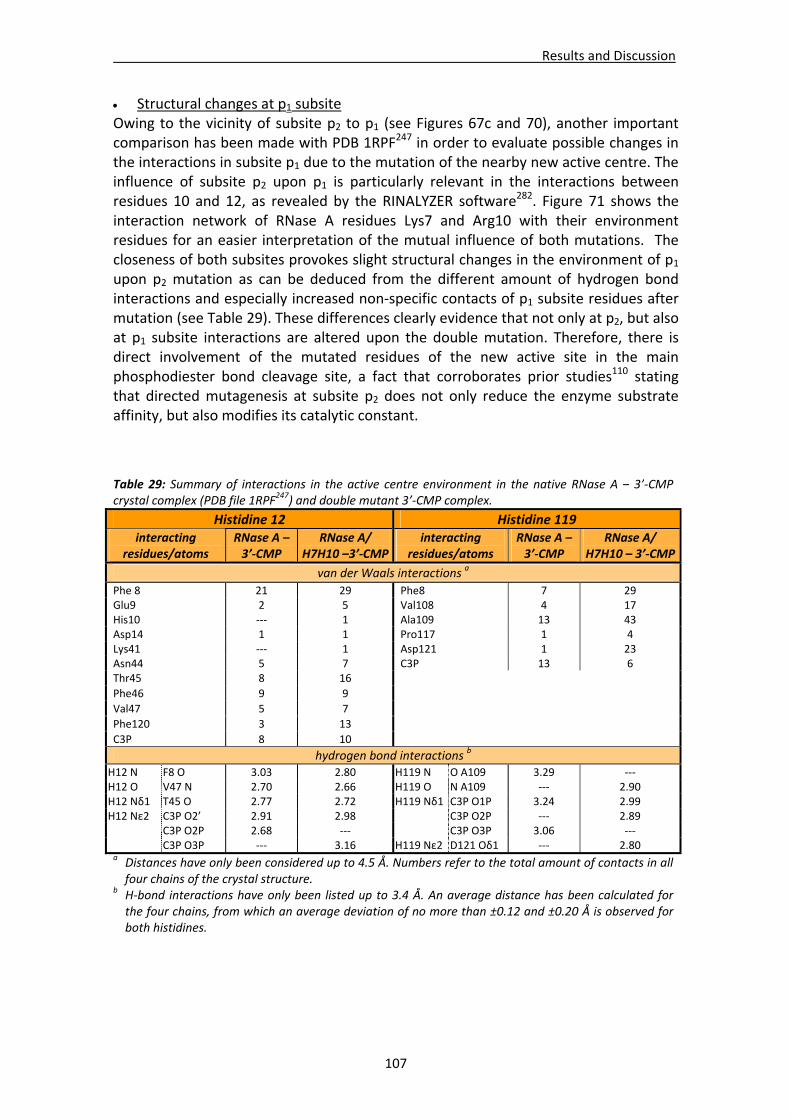
Results and Discussion
107
Structural changes at p1 subsite Owing to the vicinity of subsite p2 to p1 (see Figures 67c and 70), another important comparison has been made with PDB 1RPF247 in order to evaluate possible changes in the interactions in subsite p1 due to the mutation of the nearby new active centre. The influence of subsite p2 upon p1 is particularly relevant in the interactions between residues 10 and 12, as revealed by the RINALYZER software282. Figure 71 shows the interaction network of RNase A residues Lys7 and Arg10 with their environment residues for an easier interpretation of the mutual influence of both mutations. The closeness of both subsites provokes slight structural changes in the environment of p1 upon p2 mutation as can be deduced from the different amount of hydrogen bond interactions and especially increased non‐specific contacts of p1 subsite residues after mutation (see Table 29). These differences clearly evidence that not only at p2, but also at p1 subsite interactions are altered upon the double mutation. Therefore, there is direct involvement of the mutated residues of the new active site in the main phosphodiester bond cleavage site, a fact that corroborates prior studies110 stating that directed mutagenesis at subsite p2 does not only reduce the enzyme substrate affinity, but also modifies its catalytic constant.
Table 29: Summary of interactions in the active centre environment in the native RNase A – 3’‐CMP crystal complex (PDB file 1RPF247) and double mutant 3’‐CMP complex.
Histidine 12 Histidine 119 interacting
residues/atoms RNase A – 3’‐CMP
RNase A/ H7H10 –3’‐CMP
interacting residues/atoms
RNase A – 3’‐CMP
RNase A/ H7H10 – 3’‐CMP
van der Waals interactions a
Phe 8 21 29 Phe8 7 29 Glu9 2 5 Val108 4 17 His10 ‐‐‐ 1 Ala109 13 43 Asp14 1 1 Pro117 1 4 Lys41 ‐‐‐ 1 Asp121 1 23 Asn44 5 7 C3P 13 6 Thr45 8 16
Phe46 9 9
Val47 5 7
Phe120 3 13
C3P 8 10
hydrogen bond interactions b H12 N F8 O 3.03 2.80 H119 N O A109 3.29 ‐‐‐ H12 O V47 N 2.70 2.66 H119 O N A109 ‐‐‐ 2.90 H12 Nδ1 T45 O 2.77 2.72 H119 Nδ1 C3P O1P 3.24 2.99 H12 Nε2 C3P O2’ 2.91 2.98 C3P O2P ‐‐‐ 2.89 C3P O2P 2.68 ‐‐‐ C3P O3P 3.06 ‐‐‐
C3P O3P ‐‐‐ 3.16 H119 Nε2 D121 Oδ1 ‐‐‐ 2.80 a Distances have only been considered up to 4.5 Å. Numbers refer to the total amount of contacts in all four chains of the crystal structure.
b H‐bond interactions have only been listed up to 3.4 Å. An average distance has been calculated for the four chains, from which an average deviation of no more than ±0.12 and ±0.20 Å is observed for both histidines.
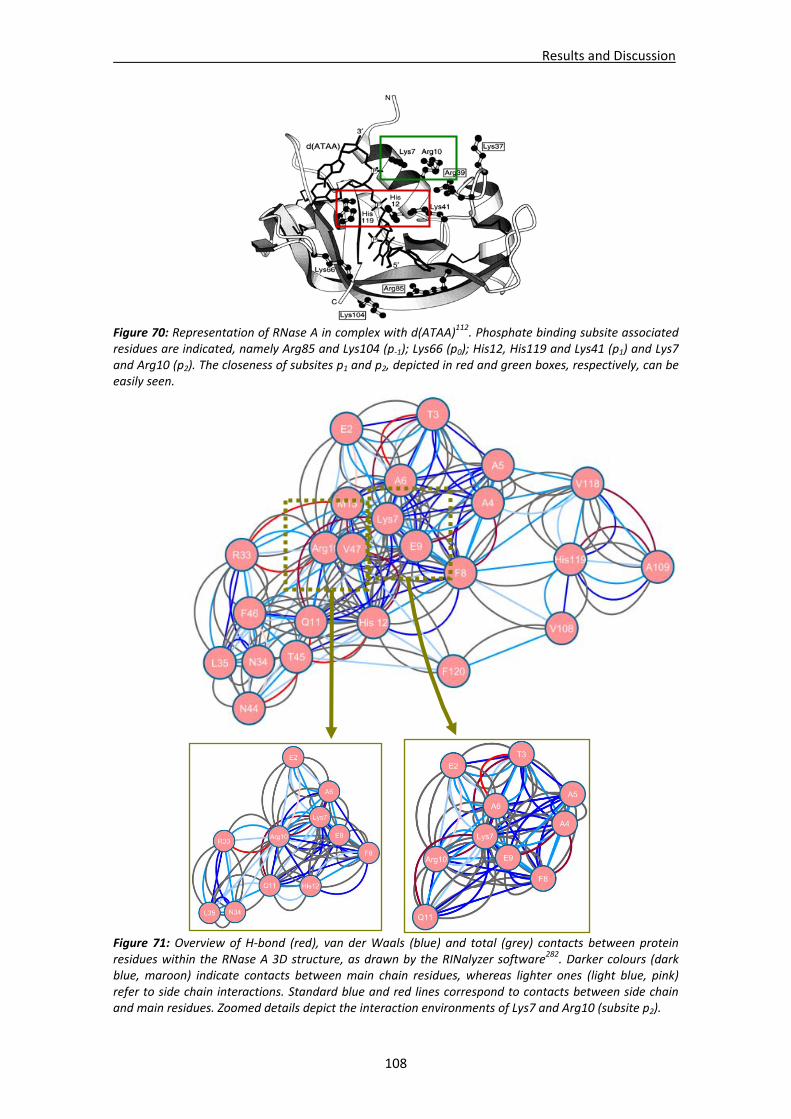
Results and Discussion
108
Figure 70: Representation of RNase A in complex with d(ATAA)112. Phosphate binding subsite associated residues are indicated, namely Arg85 and Lys104 (p‐1); Lys66 (p0); His12, His119 and Lys41 (p1) and Lys7 and Arg10 (p2). The closeness of subsites p1 and p2, depicted in red and green boxes, respectively, can be easily seen.
Figure 71: Overview of H‐bond (red), van der Waals (blue) and total (grey) contacts between protein residues within the RNase A 3D structure, as drawn by the RINalyzer software282. Darker colours (dark blue, maroon) indicate contacts between main chain residues, whereas lighter ones (light blue, pink) refer to side chain interactions. Standard blue and red lines correspond to contacts between side chain and main residues. Zoomed details depict the interaction environments of Lys7 and Arg10 (subsite p2).
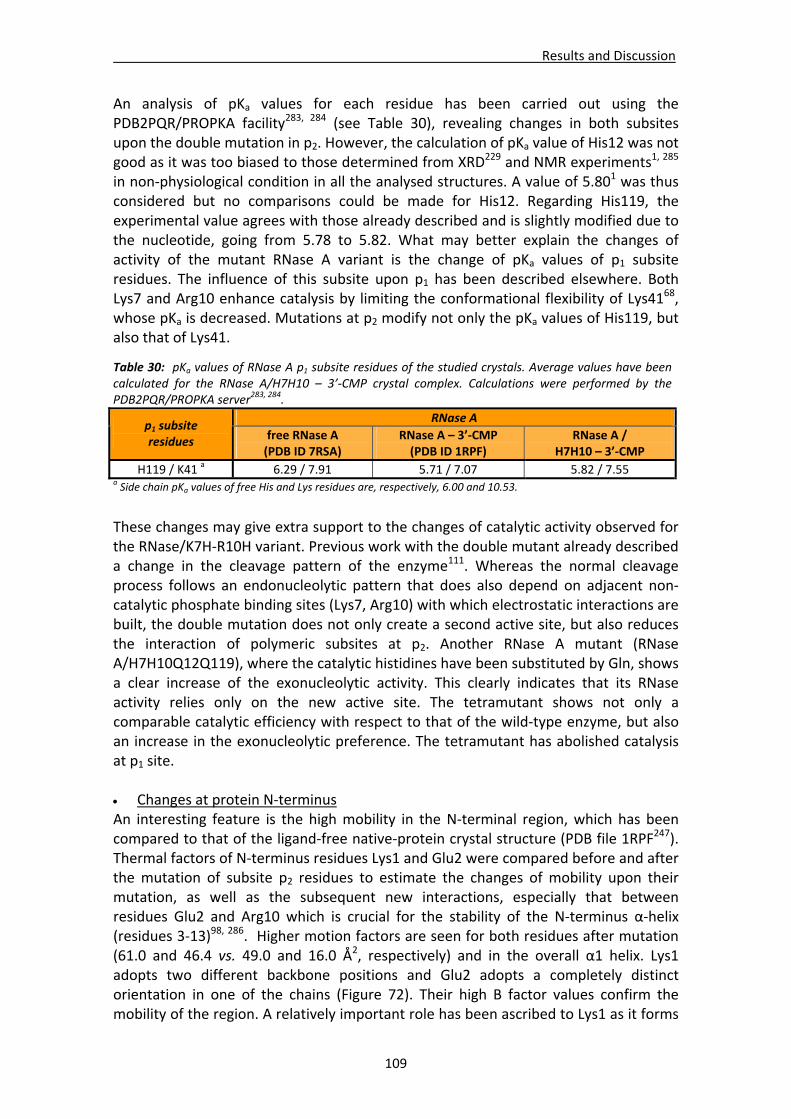
Results and Discussion
109
An analysis of pKa values for each residue has been carried out using the PDB2PQR/PROPKA facility283, 284 (see Table 30), revealing changes in both subsites upon the double mutation in p2. However, the calculation of pKa value of His12 was not good as it was too biased to those determined from XRD229 and NMR experiments1, 285 in non‐physiological condition in all the analysed structures. A value of 5.801 was thus considered but no comparisons could be made for His12. Regarding His119, the experimental value agrees with those already described and is slightly modified due to the nucleotide, going from 5.78 to 5.82. What may better explain the changes of activity of the mutant RNase A variant is the change of pKa values of p1 subsite residues. The influence of this subsite upon p1 has been described elsewhere. Both Lys7 and Arg10 enhance catalysis by limiting the conformational flexibility of Lys4168, whose pKa is decreased. Mutations at p2 modify not only the pKa values of His119, but also that of Lys41.
These changes may give extra support to the changes of catalytic activity observed for the RNase/K7H‐R10H variant. Previous work with the double mutant already described a change in the cleavage pattern of the enzyme111. Whereas the normal cleavage process follows an endonucleolytic pattern that does also depend on adjacent non‐catalytic phosphate binding sites (Lys7, Arg10) with which electrostatic interactions are built, the double mutation does not only create a second active site, but also reduces the interaction of polymeric subsites at p2. Another RNase A mutant (RNase A/H7H10Q12Q119), where the catalytic histidines have been substituted by Gln, shows a clear increase of the exonucleolytic activity. This clearly indicates that its RNase activity relies only on the new active site. The tetramutant shows not only a comparable catalytic efficiency with respect to that of the wild‐type enzyme, but also an increase in the exonucleolytic preference. The tetramutant has abolished catalysis at p1 site.
Changes at protein N‐terminus An interesting feature is the high mobility in the N‐terminal region, which has been compared to that of the ligand‐free native‐protein crystal structure (PDB file 1RPF247). Thermal factors of N‐terminus residues Lys1 and Glu2 were compared before and after the mutation of subsite p2 residues to estimate the changes of mobility upon their mutation, as well as the subsequent new interactions, especially that between residues Glu2 and Arg10 which is crucial for the stability of the N‐terminus α‐helix (residues 3‐13)98, 286. Higher motion factors are seen for both residues after mutation (61.0 and 46.4 vs. 49.0 and 16.0 Å2, respectively) and in the overall α1 helix. Lys1 adopts two different backbone positions and Glu2 adopts a completely distinct orientation in one of the chains (Figure 72). Their high B factor values confirm the mobility of the region. A relatively important role has been ascribed to Lys1 as it forms
Table 30: pKa values of RNase A p1 subsite residues of the studied crystals. Average values have been calculated for the RNase A/H7H10 – 3’‐CMP crystal complex. Calculations were performed by the PDB2PQR/PROPKA server283, 284.
RNase A p1 subsite residues free RNase A
(PDB ID 7RSA) RNase A – 3’‐CMP (PDB ID 1RPF)
RNase A / H7H10 – 3’‐CMP
H119 / K41 a 6.29 / 7.91 5.71 / 7.07 5.82 / 7.55 a Side chain pKa values of free His and Lys residues are, respectively, 6.00 and 10.53.
Results and Discussion
110
a suited pocket for nucleotides, especially purines, and would be part of the B3 subsite280 for longer substrates. The absence of a polymeric ligand may explain the high mobility of Lys1. The Glu2∙∙∙Arg10 salt bridge is hindered by the Arg10His mutation since Glu2 acquires a more variable conformation, even pointing away from residue 10 in one of the chains. Interestingly, alternative side chain orientations for Lys1 and Glu2 are not observed in the native protein crystal (PDB 1AFK266).
Figure 72: Overlay of the four chains of the mutant RNase A crystal in complex with 3’‐CMP at the N‐terminus region. Backbone chain has been represented in thin lines. Atoms of residues Glu2 and His10 have been represented with balls so their vicinity can be seen more clearly and Lys1 is depicted in thicker lines at the left part of the picture. Side chain orientation freedom is clearly seen for this residue. Chains A to D are coloured in magenta, blue, orange and green, respectively.
4.1.3. Structural analysis of the wild‐type RNase A – 3’‐CMP complex at atomic resolution
To further analyse the mutant interactions with the 3’‐CMP nucleotide at the active
centre, the data have also been compared with a new, high‐resolution native RNase A crystal in complex with 3’‐CMP. The RNase A – 3’‐CMP crystal diffracted at 1.16 Å and includes, together with the nucleotide, several sulphate anions which give additional information about later described protein interaction regions. The asymmetric unit is formed by one chain only, as suggested by the corresponding Matthews coefficient220, and the unit cell belongs to the symmetry space group P3221 (trigonal system). A high mobility was only observed at loops L3 and L7 (see Table 31), where some side chain residues could not be modelled due to the lack of electron density. Details about the active site, revealed thanks to the high data resolution, are explained below.
Table 31: Structure elements in secondary structures of RNase A.
loop RNase A residues
helix RNase A residues
strand RNase A residues
L1 K1 – T3 α1 A4 – H12 β1 V43 – V47 L2 M13 – N24 α2 Y25 – S32 β2 K61 – V63 L3 R33 – P42 α3 L51 – Q60 β3 C72 – Q74 L4 H48 – S50 β4 M79 – E86 L5 A64 – N71 β5 Y97 – K104 L6 S75 – T78 β6 I106 – E111 L7 T87 – A96 β7 V116 – S123 L8 G112 – Y115
Lys1
Glu2
His10
Results and Discussion
111
Active site environment The protein active centre hosts the 3’‐CMP nucleotide, as can be seen in an overall depiction in Figure 73. The nucleotide was easily adjusted with the help of the |Fo‐Fc| electron density map (Figure 75). A distinct signal hole is observed in the middle of the ribose moiety, indicating a fairly good electron density map quality. Conversely, hardly any signal was seen for some cytidine atoms and certain mobility is suggested for the phosphate moiety. Interactions with neighbouring residues (listed in Table 32) comprise those ascribed to subsites B1 and p1, respectively, as previously reported in a lower‐resolution RNase A‐nucleotide complex (PDB file 1RPF247, 2.20 Å). The 3’‐CMP molecule is bound in a C2’‐exo anti conformation, one of the most energetically favourable conformations for nucleotides. The observed |Fo‐Fc| electron density around the phosphate moiety indicates certain mobility for the O1P atom. As for the pyrimidine base, the cytidine ring is located in subsite B1 in interaction with Asn44 and Thr45. Regarding p1 residues, His119 adopts both trans (active, A) and gauche (inactive, B) alternative side chain conformations which respectively establishes H‐bond interactions with Asp121 and nonspecific contacts with Val118. The existence of both orientations has been known for a long time287. In this case, the inactive (B) orientation is predominant, with an A:B ratio of 40:60. The presence of each form has been described to be subject to pH229, crystallisation conditions or type of nucleotide247. Specifically, the occupation of subsite B2 by a purine base would make the imidazole ring unambiguously adopt the active orientation247 due to steric clashes happening otherwise. Additional H‐bond and stacking interactions with Asp121 and the purine base ring, respectively, would maintain this structural scenario. 3’‐CMP, which lacks the purine base at subsite B2 contributes to the rotation freedom of the His119 imidazole ring. Despite this, the predominant inactive orientation is supported by the type of nucleotide, which can be treated as a hydrolysis reaction product. In this step, His119 has been actually suggested to adopt this position preferentially105, 288. Notwithstanding, the |Fo‐Fc| electron density map before hydrogen placement suggests a protonation scenario as discussed in the following sections. A general overview of the protonation of His12 and His119 protonation during each catalysis step is presented in Figure 74. As a matter of fact, the His119 active orientation is required for transphosphorylation288 and in a protonated state, as it favours the interaction with neighbouring Asp121. This residue is seen in two different side chain orientations. A χ1 angle rotation towards His119 of 60 degrees reveals a new, minor orientation (A:B ratio 86:14) which does not affect other vicinal residues. Nucleotide hydrogen bond interactions are observed with Gln11, His12 and Lys41, too. The last one adopts two different side chain orientations upon Nζ atom rotation. However, that building important interactions with Gln11 and Asn44 is fairly predominant (ratio 82:12), as these interactions are key in the stabilisation of the enzyme‐substrate complex during the cleavage reaction229.
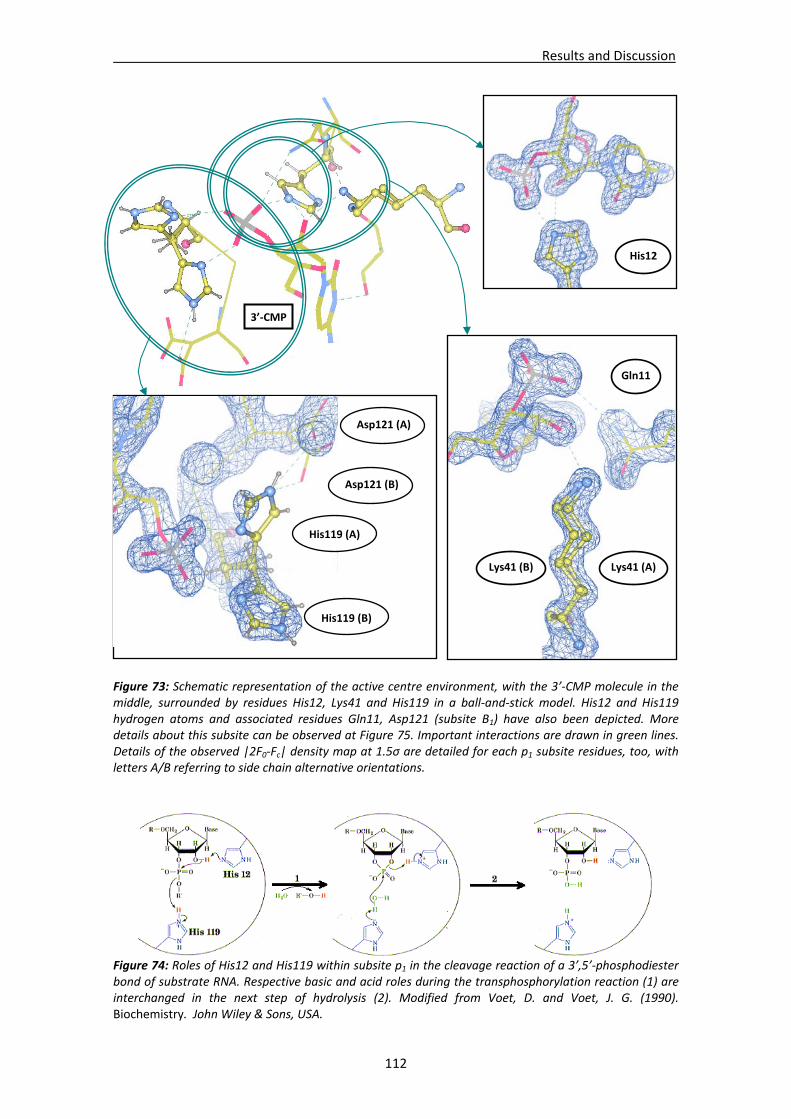
Results and Discussion
112
Figure 73: Schematic representation of the active centre environment, with the 3’‐CMP molecule in the middle, surrounded by residues His12, Lys41 and His119 in a ball‐and‐stick model. His12 and His119 hydrogen atoms and associated residues Gln11, Asp121 (subsite B1) have also been depicted. More details about this subsite can be observed at Figure 75. Important interactions are drawn in green lines. Details of the observed |2F0‐Fc| density map at 1.5σ are detailed for each p1 subsite residues, too, with letters A/B referring to side chain alternative orientations.
Figure 74: Roles of His12 and His119 within subsite p1 in the cleavage reaction of a 3’,5’‐phosphodiester bond of substrate RNA. Respective basic and acid roles during the transphosphorylation reaction (1) are interchanged in the next step of hydrolysis (2). Modified from Voet, D. and Voet, J. G. (1990). Biochemistry. John Wiley & Sons, USA.
3’‐CMP
His12
His119 (B)
His119 (A)
Asp121 (B)
Asp121 (A)
Lys41 (B) Lys41 (A)
Gln11
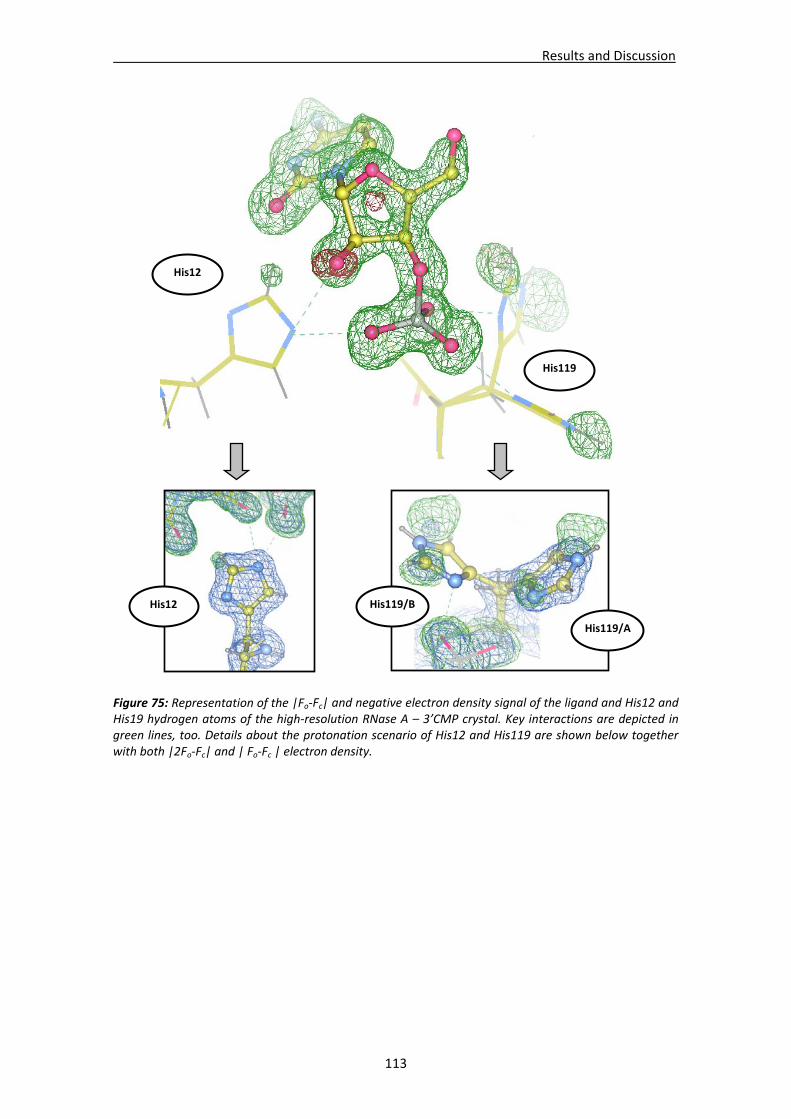
Results and Discussion
113
Figure 75: Representation of the |Fo‐Fc| and negative electron density signal of the ligand and His12 and His19 hydrogen atoms of the high‐resolution RNase A – 3’CMP crystal. Key interactions are depicted in green lines, too. Details about the protonation scenario of His12 and His119 are shown below together with both |2Fo‐Fc| and | Fo‐Fc | electron density.
His12 His119/B
His119/A
His12
His119
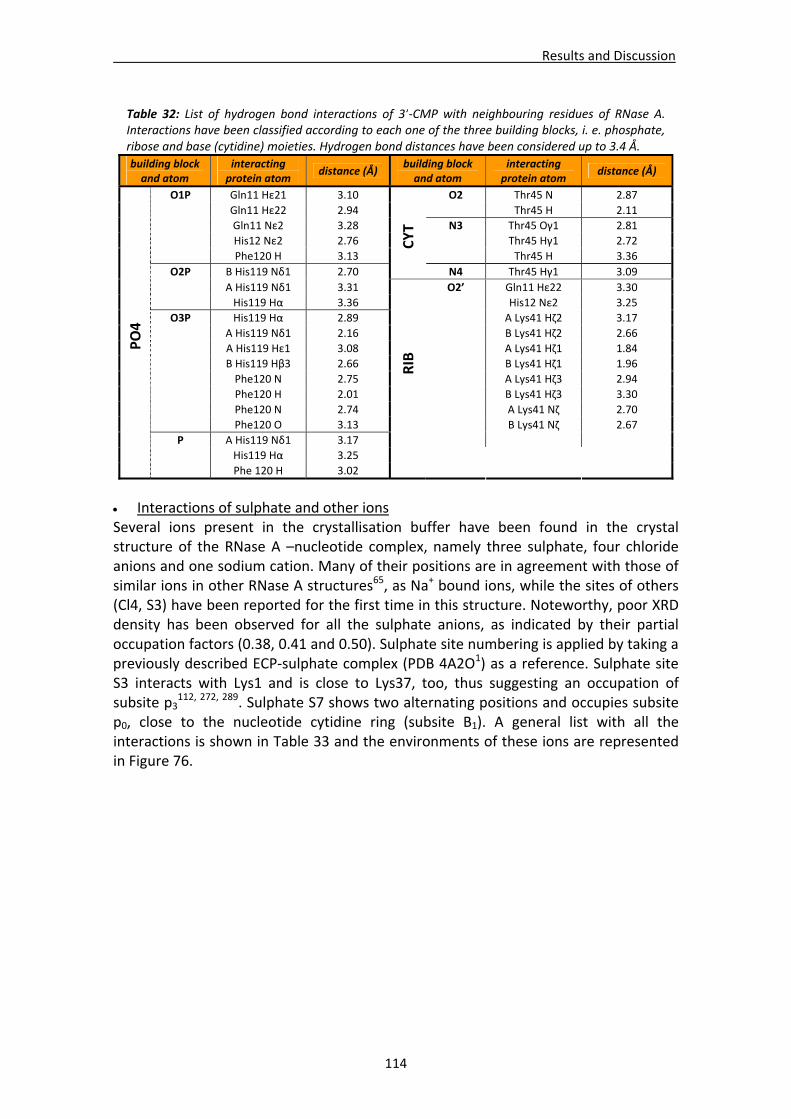
Results and Discussion
114
Interactions of sulphate and other ions Several ions present in the crystallisation buffer have been found in the crystal structure of the RNase A –nucleotide complex, namely three sulphate, four chloride anions and one sodium cation. Many of their positions are in agreement with those of similar ions in other RNase A structures65, as Na+ bound ions, while the sites of others (Cl4, S3) have been reported for the first time in this structure. Noteworthy, poor XRD density has been observed for all the sulphate anions, as indicated by their partial occupation factors (0.38, 0.41 and 0.50). Sulphate site numbering is applied by taking a previously described ECP‐sulphate complex (PDB 4A2O1) as a reference. Sulphate site S3 interacts with Lys1 and is close to Lys37, too, thus suggesting an occupation of subsite p3
112, 272, 289. Sulphate S7 shows two alternating positions and occupies subsite p0, close to the nucleotide cytidine ring (subsite B1). A general list with all the interactions is shown in Table 33 and the environments of these ions are represented in Figure 76.
Table 32: List of hydrogen bond interactions of 3’‐CMP with neighbouring residues of RNase A. Interactions have been classified according to each one of the three building blocks, i. e. phosphate, ribose and base (cytidine) moieties. Hydrogen bond distances have been considered up to 3.4 Å.
building block and atom
interacting protein atom
distance (Å) building block and atom
interacting protein atom
distance (Å)
O1P Gln11 Hε21 3.10 O2 Thr45 N 2.87
Gln11 Hε22 2.94 Thr45 H 2.11
Gln11 Nε2 3.28 N3 Thr45 Oγ1 2.81
His12 Nε2 2.76 Thr45 Hγ1 2.72
Phe120 H 3.13 Thr45 H 3.36
O2P B His119 Nδ1 2.70
CYT
N4 Thr45 Hγ1 3.09
A His119 Nδ1 3.31 O2’ Gln11 Hε22 3.30
His119 Hα 3.36 His12 Nε2 3.25
O3P His119 Hα 2.89 A Lys41 Hζ2 3.17
A His119 Nδ1 2.16 B Lys41 Hζ2 2.66
A His119 Hε1 3.08 A Lys41 Hζ1 1.84
B His119 Hβ3 2.66 B Lys41 Hζ1 1.96
Phe120 N 2.75 A Lys41 Hζ3 2.94
Phe120 H 2.01 B Lys41 Hζ3 3.30
Phe120 N 2.74 A Lys41 Nζ 2.70
Phe120 O 3.13 B Lys41 Nζ 2.67
P A His119 Nδ1 3.17
RIB
His119 Hα 3.25
PO4
Phe 120 H 3.02
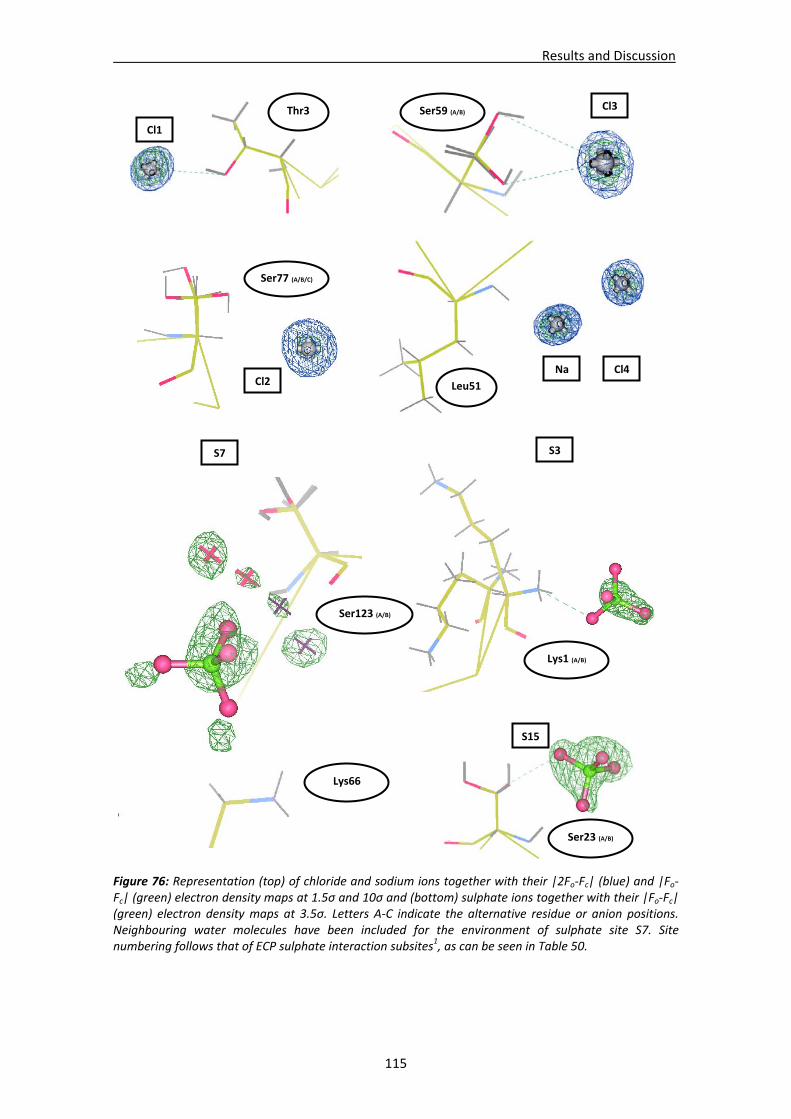
Results and Discussion
115
Figure 76: Representation (top) of chloride and sodium ions together with their |2Fo‐Fc| (blue) and |Fo‐Fc| (green) electron density maps at 1.5σ and 10σ and (bottom) sulphate ions together with their |Fo‐Fc| (green) electron density maps at 3.5σ. Letters A‐C indicate the alternative residue or anion positions. Neighbouring water molecules have been included for the environment of sulphate site S7. Site numbering follows that of ECP sulphate interaction subsites1, as can be seen in Table 50.
Ser59 (A/B) Cl3 Thr3
Cl1
Ser77 (A/B/C)
Cl2 Leu51
Na Cl4
S15
Ser23 (A/B)
S3
Lys1 (A/B)
S7
Lys66
Ser123 (A/B)
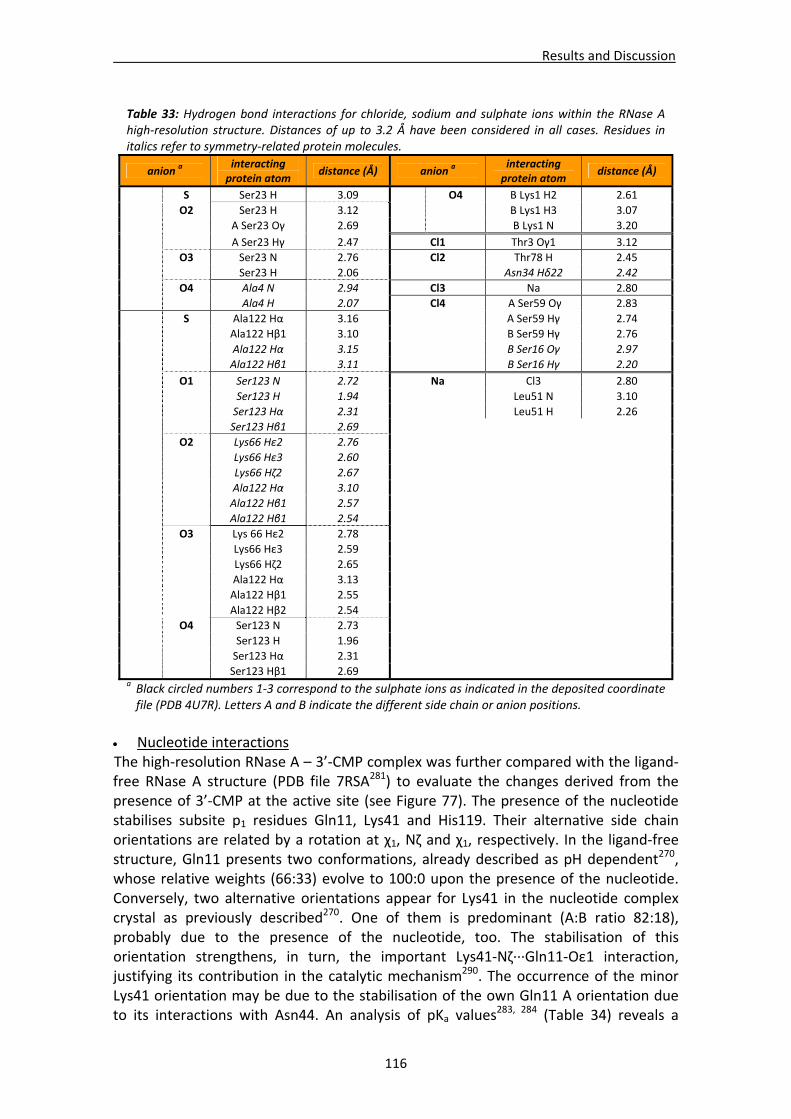
Results and Discussion
116
Nucleotide interactions The high‐resolution RNase A – 3’‐CMP complex was further compared with the ligand‐free RNase A structure (PDB file 7RSA281) to evaluate the changes derived from the presence of 3’‐CMP at the active site (see Figure 77). The presence of the nucleotide stabilises subsite p1 residues Gln11, Lys41 and His119. Their alternative side chain orientations are related by a rotation at χ1, Nζ and χ1, respectively. In the ligand‐free structure, Gln11 presents two conformations, already described as pH dependent270, whose relative weights (66:33) evolve to 100:0 upon the presence of the nucleotide. Conversely, two alternative orientations appear for Lys41 in the nucleotide complex crystal as previously described270. One of them is predominant (A:B ratio 82:18), probably due to the presence of the nucleotide, too. The stabilisation of this orientation strengthens, in turn, the important Lys41‐Nζ∙∙∙Gln11‐Oε1 interaction, justifying its contribution in the catalytic mechanism290. The occurrence of the minor Lys41 orientation may be due to the stabilisation of the own Gln11 A orientation due to its interactions with Asn44. An analysis of pKa values
283, 284 (Table 34) reveals a
Table 33: Hydrogen bond interactions for chloride, sodium and sulphate ions within the RNase A high‐resolution structure. Distances of up to 3.2 Å have been considered in all cases. Residues in italics refer to symmetry‐related protein molecules.
anion a interacting protein atom
distance (Å) anion a interacting protein atom
distance (Å)
S Ser23 H 3.09 O4 B Lys1 H2 2.61
O2 Ser23 H 3.12 B Lys1 H3 3.07
A Ser23 Oγ 2.69
�
B Lys1 N 3.20
A Ser23 Hγ 2.47 Cl1 Thr3 Oγ1 3.12
O3 Ser23 N 2.76 Cl2 Thr78 H 2.45
Ser23 H 2.06 Asn34 Hδ22 2.42
O4 Ala4 N 2.94 Cl3 Na 2.80
�
Ala4 H 2.07 Cl4 A Ser59 Oγ 2.83
S Ala122 Hα 3.16 A Ser59 Hγ 2.74
Ala122 Hβ1 3.10 B Ser59 Hγ 2.76
Ala122 Hα 3.15 B Ser16 Oγ 2.97
Ala122 Hβ1 3.11 B Ser16 Hγ 2.20
O1 Ser123 N 2.72 Na Cl3 2.80
Ser123 H 1.94 Leu51 N 3.10
Ser123 Hα 2.31 Leu51 H 2.26
Ser123 Hβ1 2.69
O2 Lys66 Hε2 2.76
Lys66 Hε3 2.60
Lys66 Hζ2 2.67
Ala122 Hα 3.10
Ala122 Hβ1 2.57
Ala122 Hβ1 2.54
O3 Lys 66 Hε2 2.78
Lys66 Hε3 2.59
Lys66 Hζ2 2.65
Ala122 Hα 3.13
Ala122 Hβ1 2.55
Ala122 Hβ2 2.54
O4 Ser123 N 2.73
Ser123 H 1.96
Ser123 Hα 2.31
�
Ser123 Hβ1 2.69 a Black circled numbers 1‐3 correspond to the sulphate ions as indicated in the deposited coordinate file (PDB 4U7R). Letters A and B indicate the different side chain or anion positions.
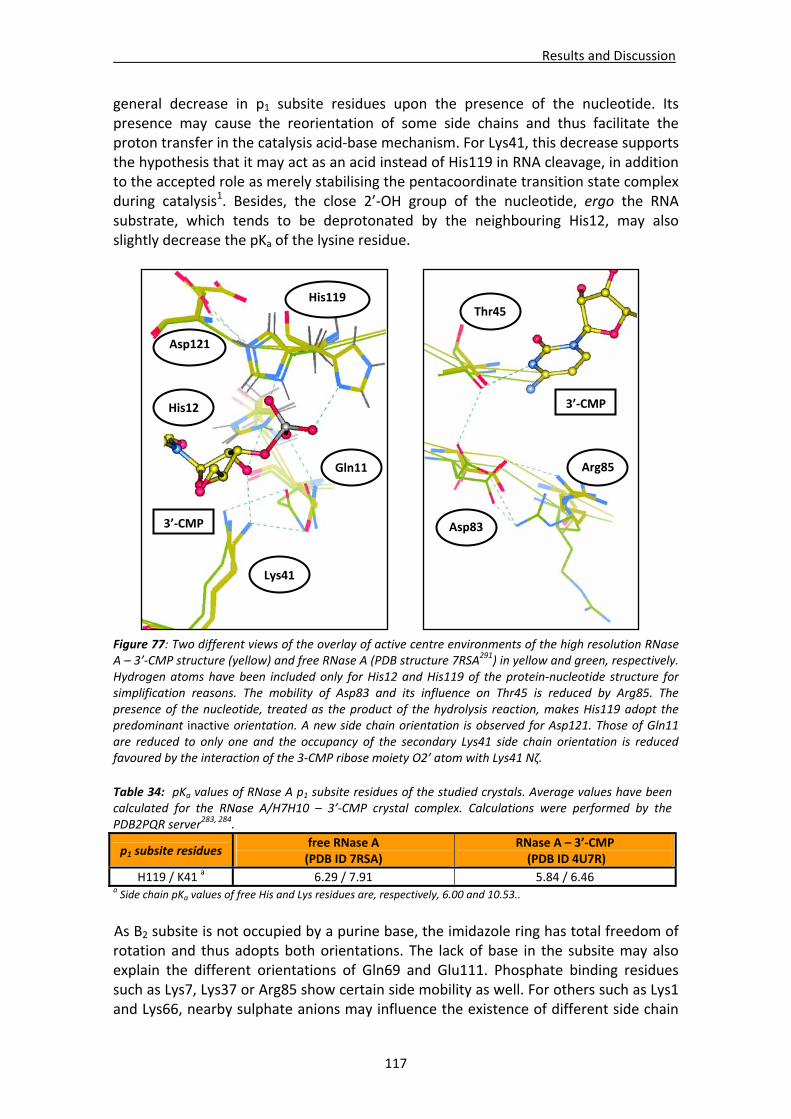
Results and Discussion
117
general decrease in p1 subsite residues upon the presence of the nucleotide. Its presence may cause the reorientation of some side chains and thus facilitate the proton transfer in the catalysis acid‐base mechanism. For Lys41, this decrease supports the hypothesis that it may act as an acid instead of His119 in RNA cleavage, in addition to the accepted role as merely stabilising the pentacoordinate transition state complex during catalysis1. Besides, the close 2’‐OH group of the nucleotide, ergo the RNA substrate, which tends to be deprotonated by the neighbouring His12, may also slightly decrease the pKa of the lysine residue. Figure 77: Two different views of the overlay of active centre environments of the high resolution RNase A – 3’‐CMP structure (yellow) and free RNase A (PDB structure 7RSA291) in yellow and green, respectively. Hydrogen atoms have been included only for His12 and His119 of the protein‐nucleotide structure for simplification reasons. The mobility of Asp83 and its influence on Thr45 is reduced by Arg85. The presence of the nucleotide, treated as the product of the hydrolysis reaction, makes His119 adopt the predominant inactive orientation. A new side chain orientation is observed for Asp121. Those of Gln11 are reduced to only one and the occupancy of the secondary Lys41 side chain orientation is reduced favoured by the interaction of the 3‐CMP ribose moiety O2’ atom with Lys41 Nζ.
As B2 subsite is not occupied by a purine base, the imidazole ring has total freedom of rotation and thus adopts both orientations. The lack of base in the subsite may also explain the different orientations of Gln69 and Glu111. Phosphate binding residues such as Lys7, Lys37 or Arg85 show certain side mobility as well. For others such as Lys1 and Lys66, nearby sulphate anions may influence the existence of different side chain
Table 34: pKa values of RNase A p1 subsite residues of the studied crystals. Average values have been calculated for the RNase A/H7H10 – 3’‐CMP crystal complex. Calculations were performed by the PDB2PQR server283, 284.
p1 subsite residues free RNase A (PDB ID 7RSA)
RNase A – 3’‐CMP (PDB ID 4U7R)
H119 / K41 a 6.29 / 7.91 5.84 / 6.46 a Side chain pKa values of free His and Lys residues are, respectively, 6.00 and 10.53..
3’‐CMP
Arg85
Asp83
Thr45
Lys41
Gln11
His119
His12
Asp121
3’‐CMP
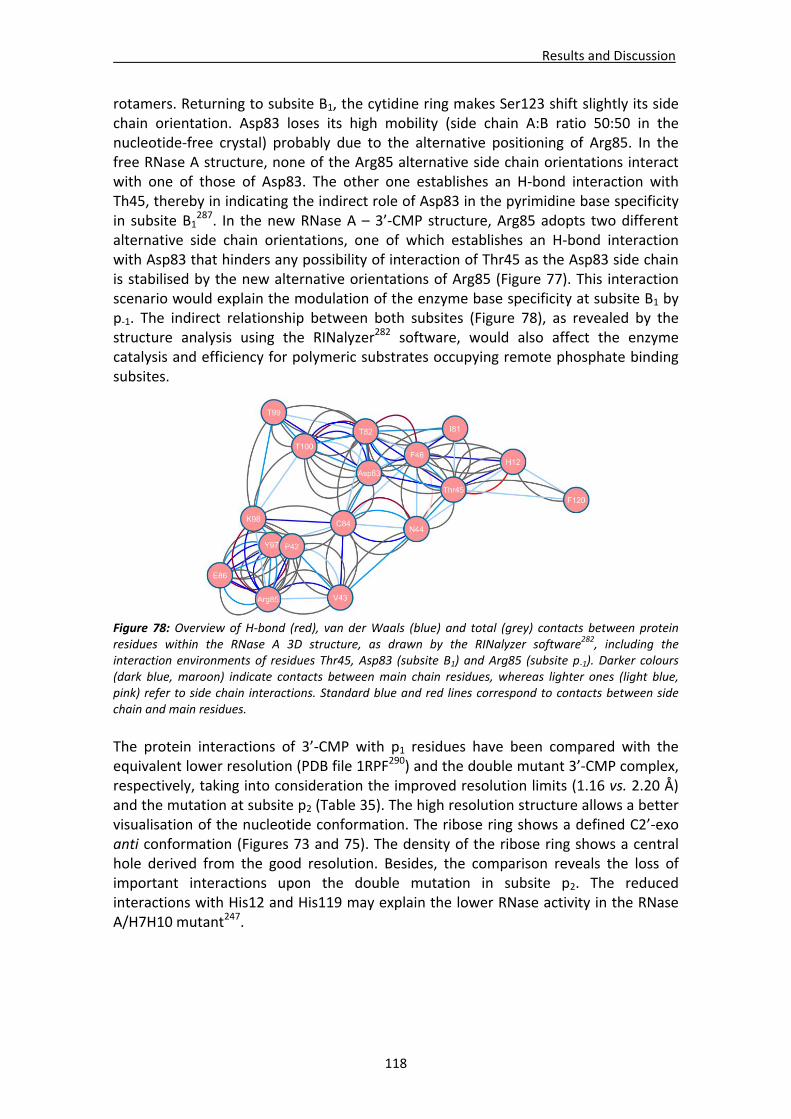
Results and Discussion
118
rotamers. Returning to subsite B1, the cytidine ring makes Ser123 shift slightly its side chain orientation. Asp83 loses its high mobility (side chain A:B ratio 50:50 in the nucleotide‐free crystal) probably due to the alternative positioning of Arg85. In the free RNase A structure, none of the Arg85 alternative side chain orientations interact with one of those of Asp83. The other one establishes an H‐bond interaction with Th45, thereby in indicating the indirect role of Asp83 in the pyrimidine base specificity in subsite B1
287. In the new RNase A – 3’‐CMP structure, Arg85 adopts two different alternative side chain orientations, one of which establishes an H‐bond interaction with Asp83 that hinders any possibility of interaction of Thr45 as the Asp83 side chain is stabilised by the new alternative orientations of Arg85 (Figure 77). This interaction scenario would explain the modulation of the enzyme base specificity at subsite B1 by p‐1. The indirect relationship between both subsites (Figure 78), as revealed by the structure analysis using the RINalyzer282 software, would also affect the enzyme catalysis and efficiency for polymeric substrates occupying remote phosphate binding subsites. Figure 78: Overview of H‐bond (red), van der Waals (blue) and total (grey) contacts between protein residues within the RNase A 3D structure, as drawn by the RINalyzer software282, including the interaction environments of residues Thr45, Asp83 (subsite B1) and Arg85 (subsite p‐1). Darker colours (dark blue, maroon) indicate contacts between main chain residues, whereas lighter ones (light blue, pink) refer to side chain interactions. Standard blue and red lines correspond to contacts between side chain and main residues.
The protein interactions of 3’‐CMP with p1 residues have been compared with the equivalent lower resolution (PDB file 1RPF290) and the double mutant 3’‐CMP complex, respectively, taking into consideration the improved resolution limits (1.16 vs. 2.20 Å) and the mutation at subsite p2 (Table 35). The high resolution structure allows a better visualisation of the nucleotide conformation. The ribose ring shows a defined C2’‐exo anti conformation (Figures 73 and 75). The density of the ribose ring shows a central hole derived from the good resolution. Besides, the comparison reveals the loss of important interactions upon the double mutation in subsite p2. The reduced interactions with His12 and His119 may explain the lower RNase activity in the RNase A/H7H10 mutant247.
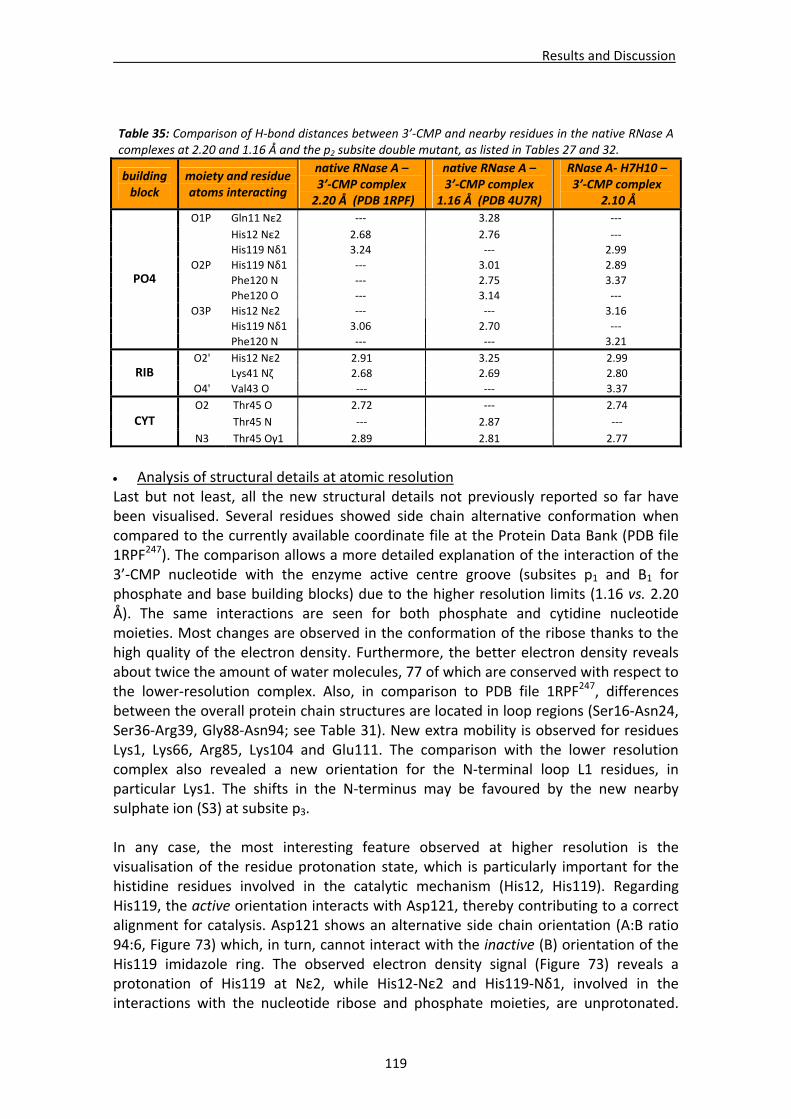
Results and Discussion
119
Analysis of structural details at atomic resolution Last but not least, all the new structural details not previously reported so far have been visualised. Several residues showed side chain alternative conformation when compared to the currently available coordinate file at the Protein Data Bank (PDB file 1RPF247). The comparison allows a more detailed explanation of the interaction of the 3’‐CMP nucleotide with the enzyme active centre groove (subsites p1 and B1 for phosphate and base building blocks) due to the higher resolution limits (1.16 vs. 2.20 Å). The same interactions are seen for both phosphate and cytidine nucleotide moieties. Most changes are observed in the conformation of the ribose thanks to the high quality of the electron density. Furthermore, the better electron density reveals about twice the amount of water molecules, 77 of which are conserved with respect to the lower‐resolution complex. Also, in comparison to PDB file 1RPF247, differences between the overall protein chain structures are located in loop regions (Ser16‐Asn24, Ser36‐Arg39, Gly88‐Asn94; see Table 31). New extra mobility is observed for residues Lys1, Lys66, Arg85, Lys104 and Glu111. The comparison with the lower resolution complex also revealed a new orientation for the N‐terminal loop L1 residues, in particular Lys1. The shifts in the N‐terminus may be favoured by the new nearby sulphate ion (S3) at subsite p3. In any case, the most interesting feature observed at higher resolution is the visualisation of the residue protonation state, which is particularly important for the histidine residues involved in the catalytic mechanism (His12, His119). Regarding His119, the active orientation interacts with Asp121, thereby contributing to a correct alignment for catalysis. Asp121 shows an alternative side chain orientation (A:B ratio 94:6, Figure 73) which, in turn, cannot interact with the inactive (B) orientation of the His119 imidazole ring. The observed electron density signal (Figure 73) reveals a protonation of His119 at Nε2, while His12‐Nε2 and His119‐Nδ1, involved in the interactions with the nucleotide ribose and phosphate moieties, are unprotonated.
Table 35: Comparison of H‐bond distances between 3’‐CMP and nearby residues in the native RNase A complexes at 2.20 and 1.16 Å and the p2 subsite double mutant, as listed in Tables 27 and 32.
building block
moiety and residue atoms interacting
native RNase A – 3’‐CMP complex
2.20 Å (PDB 1RPF)
native RNase A – 3’‐CMP complex
1.16 Å (PDB 4U7R)
RNase A‐ H7H10 – 3’‐CMP complex
2.10 Å
O1P Gln11 Nε2 ‐‐‐ 3.28 ‐‐‐
His12 Νε2 2.68 2.76 ‐‐‐
His119 Νδ1 3.24 ‐‐‐ 2.99
O2P His119 Νδ1 ‐‐‐ 3.01 2.89
Phe120 N ‐‐‐ 2.75 3.37
Phe120 Ο ‐‐‐ 3.14 ‐‐‐
O3P His12 Νε2 ‐‐‐ ‐‐‐ 3.16
His119 Νδ1 3.06 2.70 ‐‐‐
PO4
Phe120 Ν ‐‐‐ ‐‐‐ 3.21
O2' His12 Νε2 2.91 3.25 2.99
Lys41 Νζ 2.68 2.69 2.80 RIB O4' Val43 O ‐‐‐ ‐‐‐ 3.37
O2 Thr45 O 2.72 ‐‐‐ 2.74
Thr45 N ‐‐‐ 2.87 ‐‐‐ CYT
N3 Τhr45 Oγ1 2.89 2.81 2.77
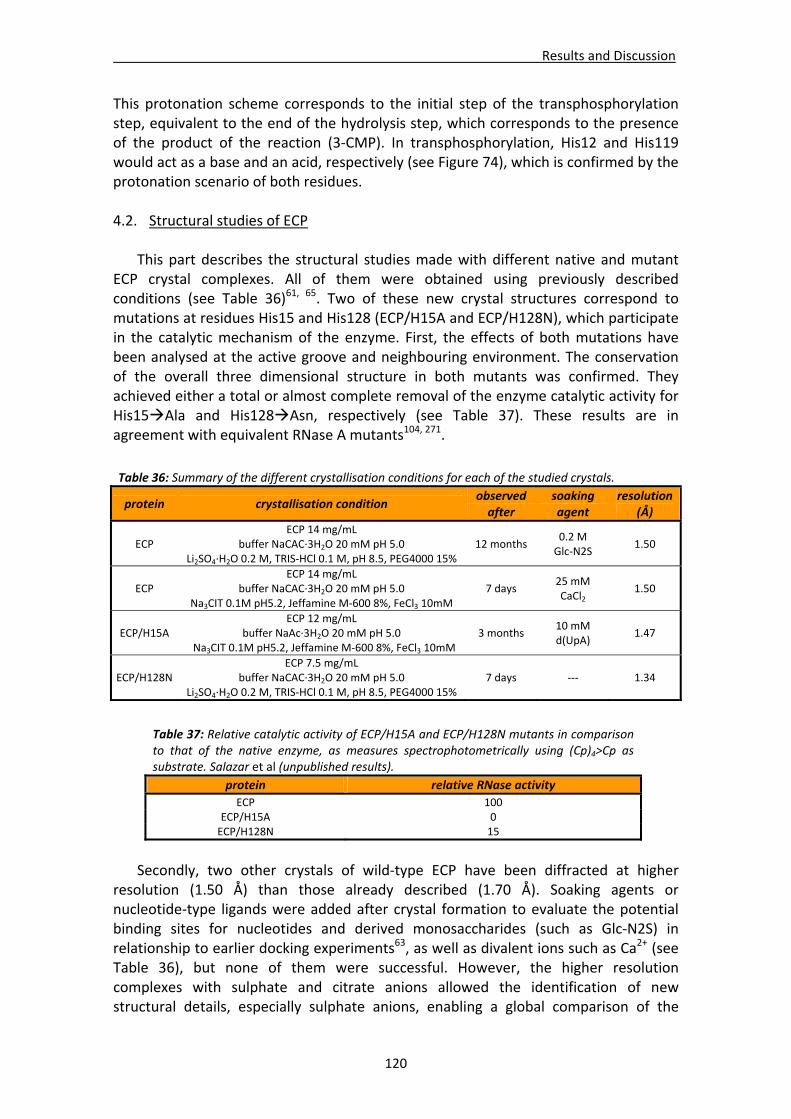
Results and Discussion
120
This protonation scheme corresponds to the initial step of the transphosphorylation step, equivalent to the end of the hydrolysis step, which corresponds to the presence of the product of the reaction (3‐CMP). In transphosphorylation, His12 and His119 would act as a base and an acid, respectively (see Figure 74), which is confirmed by the protonation scenario of both residues. 4.2. Structural studies of ECP
This part describes the structural studies made with different native and mutant ECP crystal complexes. All of them were obtained using previously described conditions (see Table 36)61, 65. Two of these new crystal structures correspond to mutations at residues His15 and His128 (ECP/H15A and ECP/H128N), which participate in the catalytic mechanism of the enzyme. First, the effects of both mutations have been analysed at the active groove and neighbouring environment. The conservation of the overall three dimensional structure in both mutants was confirmed. They achieved either a total or almost complete removal of the enzyme catalytic activity for His15Ala and His128Asn, respectively (see Table 37). These results are in agreement with equivalent RNase A mutants104, 271.
Secondly, two other crystals of wild‐type ECP have been diffracted at higher
resolution (1.50 Å) than those already described (1.70 Å). Soaking agents or nucleotide‐type ligands were added after crystal formation to evaluate the potential binding sites for nucleotides and derived monosaccharides (such as Glc‐N2S) in relationship to earlier docking experiments63, as well as divalent ions such as Ca2+ (see Table 36), but none of them were successful. However, the higher resolution complexes with sulphate and citrate anions allowed the identification of new structural details, especially sulphate anions, enabling a global comparison of the
Table 36: Summary of the different crystallisation conditions for each of the studied crystals.
protein crystallisation condition observed after
soaking agent
resolution (Å)
ECP ECP 14 mg/mL
buffer NaCAC∙3H2O 20 mM pH 5.0 Li2SO4∙H2O 0.2 M, TRIS‐HCl 0.1 M, pH 8.5, PEG4000 15%
12 months 0.2 M Glc‐N2S
1.50
ECP ECP 14 mg/mL
buffer NaCAC∙3H2O 20 mM pH 5.0 Na3CIT 0.1M pH5.2, Jeffamine M‐600 8%, FeCl3 10mM
7 days 25 mM CaCl2
1.50
ECP/H15A ECP 12 mg/mL
buffer NaAc∙3H2O 20 mM pH 5.0 Na3CIT 0.1M pH5.2, Jeffamine M‐600 8%, FeCl3 10mM
3 months 10 mM d(UpA)
1.47
ECP/H128N ECP 7.5 mg/mL
buffer NaCAC∙3H2O 20 mM pH 5.0 Li2SO4∙H2O 0.2 M, TRIS‐HCl 0.1 M, pH 8.5, PEG4000 15%
7 days ‐‐‐ 1.34
Table 37: Relative catalytic activity of ECP/H15A and ECP/H128N mutants in comparison to that of the native enzyme, as measures spectrophotometrically using (Cp)4>Cp as substrate. Salazar et al (unpublished results).
protein relative RNase activity
ECP 100 ECP/H15A 0 ECP/H128N 15
Results and Discussion
121
different phosphate recognition subsites found for ECP, in relationship with those of the RNase A (high‐resolution wild‐type RNase A, see Section 4.1.3) and the recently solved RNase 6 (Section 4.3.5) sulphate complexes. Such a comparison may be useful in the elucidation and prediction of regions prone to host larger polyanionic biomolecules like nucleotides or heparin derivatives.
4.2.1. Crystallisation, data collection, processing and structure solving
Crystallisation conditions Different crystals of ECP were obtained using previously described crystallisation conditions. Samples of native ECP and ECP/H15A were suspended at 14 and 12 mg/mL in a 20 mM sodium cacodylate buffer, pH 5.0 and equilibrated (1:1 μL) against a crystallisation mixture of 8% Jeffamine M‐600, 10 mM iron (III) chloride and 0.1 M sodium citrate buffer, pH 5.261. Isolated diamond shaped crystals appeared after 7 days to 3 months at 16 °C, respectively. Prior to diffraction, 20‐30% MPD was used as cryofreezing agent. Another wt‐ECP sample and the ECP/H128N mutant were resuspended in the same sodium cacodylate buffer (14 and 7.5 mg/mL, respectively) and equilibrated against a mixture of 0.2 M lithium sulphate, 15% PEG4000 and 0.1 M TRIS‐HCl buffer, pH 8.565. Needle shaped crystals grew after 7 days to 12 months of incubation at 16 °C, respectively. For diffraction, 20% PEG400 was used as cryofreezing agent. Crystallisation conditions are listed in Table 37. Data processing and structure solving All ECP crystals were diffracted and analysed using the same strategy and software packages used for the high‐resolution native RNase A complex: EDNA212, XDS213 and CCP4216 (PHASER217 and REFMAC5223) were respectively applied for the elucidation of cell unit parameters, indexing, scaling, molecular replacement and structure refinement. PDB files 4A2Y65 and 4A2O65 were taken as models for the ECP citrate and sulphate complexes and both His15Ala and His128Asn mutants. Manual building was performed using COOT software222. Citrate and sulphate ions were incorporated where necessary in each structure according to the |Fo‐Fc| difference map. Water molecules were added at |Fo‐Fc| electron density map peaks at a hydrogen bond distance to protein atoms. Those with thermal factors higher than 60 Å2 were later eliminated. Data collection, processing and refinement parameters are listed in Table 38. The quality of the final 3D structure models was evaluated before submission to the Protein Data Bank (see Figure 79).
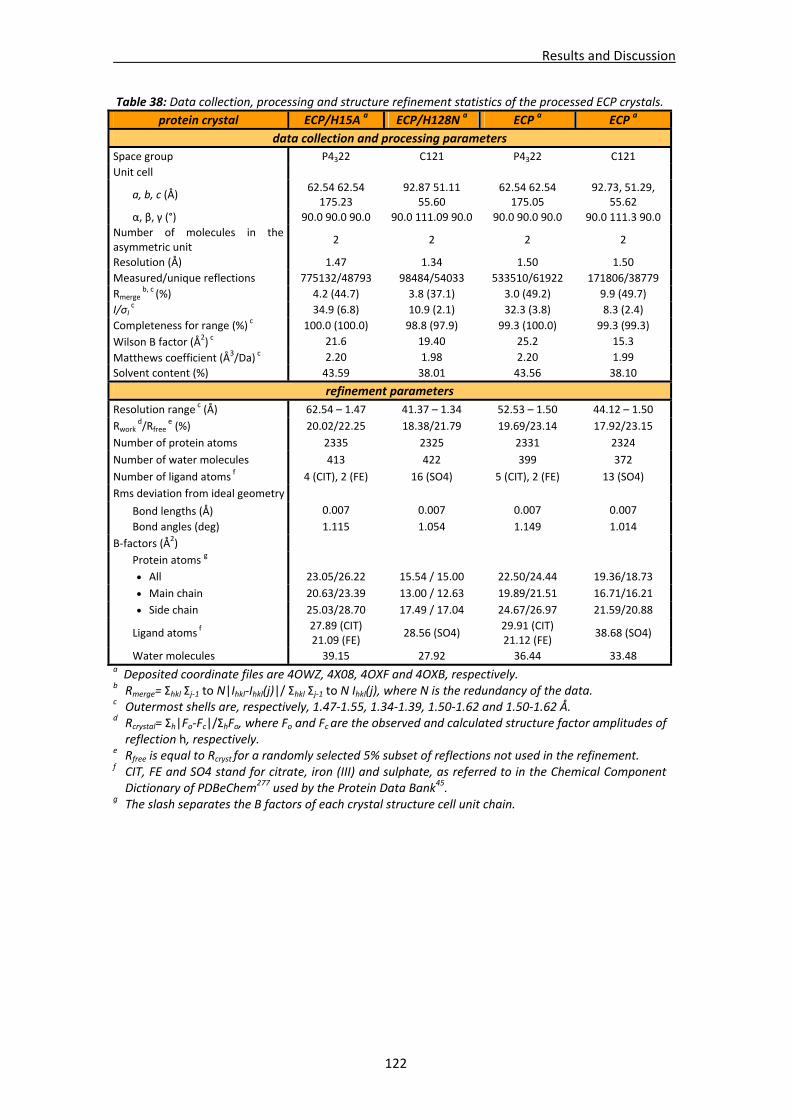
Results and Discussion
122
Table 38: Data collection, processing and structure refinement statistics of the processed ECP crystals.
protein crystal ECP/H15A a ECP/H128N a ECP a ECP a
data collection and processing parameters
Space group P4322 C121 P4322 C121
Unit cell
a, b, c (Å) 62.54 62.54 175.23
92.87 51.11 55.60
62.54 62.54 175.05
92.73, 51.29, 55.62
α, β, γ (°) 90.0 90.0 90.0 90.0 111.09 90.0 90.0 90.0 90.0 90.0 111.3 90.0
Number of molecules in the asymmetric unit
2 2 2 2
Resolution (Å) 1.47 1.34 1.50 1.50
Measured/unique reflections 775132/48793 98484/54033 533510/61922 171806/38779
Rmerge b, c (%) 4.2 (44.7) 3.8 (37.1) 3.0 (49.2) 9.9 (49.7)
I/σΙ c 34.9 (6.8) 10.9 (2.1) 32.3 (3.8) 8.3 (2.4)
Completeness for range (%) c 100.0 (100.0) 98.8 (97.9) 99.3 (100.0) 99.3 (99.3)
Wilson B factor (Å2) c 21.6 19.40 25.2 15.3
Matthews coefficient (Å3/Da) c 2.20 1.98 2.20 1.99
Solvent content (%) 43.59 38.01 43.56 38.10
refinement parameters
Resolution range c (Å) 62.54 – 1.47 41.37 – 1.34 52.53 – 1.50 44.12 – 1.50
Rwork d/Rfree
e (%) 20.02/22.25 18.38/21.79 19.69/23.14 17.92/23.15
Number of protein atoms 2335 2325 2331 2324
Number of water molecules 413 422 399 372
Number of ligand atoms f 4 (CIT), 2 (FE) 16 (SO4) 5 (CIT), 2 (FE) 13 (SO4)
Rms deviation from ideal geometry
Bond lengths (Å) 0.007 0.007 0.007 0.007
Bond angles (deg) 1.115 1.054 1.149 1.014
B‐factors (Å2)
Protein atoms g
All 23.05/26.22 15.54 / 15.00 22.50/24.44 19.36/18.73
Main chain 20.63/23.39 13.00 / 12.63 19.89/21.51 16.71/16.21
Side chain 25.03/28.70 17.49 / 17.04 24.67/26.97 21.59/20.88
Ligand atoms f 27.89 (CIT) 21.09 (FE)
28.56 (SO4) 29.91 (CIT) 21.12 (FE)
38.68 (SO4)
Water molecules 39.15 27.92 36.44 33.48 a Deposited coordinate files are 4OWZ, 4X08, 4OXF and 4OXB, respectively. b Rmerge= Σhkl Σj‐1 to N|Ihkl‐Ihkl(j)|/ Σhkl Σj‐1 to N Ihkl(j), where N is the redundancy of the data. c Outermost shells are, respectively, 1.47‐1.55, 1.34‐1.39, 1.50‐1.62 and 1.50‐1.62 Å. d Rcrystal= Σh|Fo‐Fc|/ΣhFo, where Fo and Fc are the observed and calculated structure factor amplitudes of reflection h, respectively.
e Rfree is equal to Rcryst for a randomly selected 5% subset of reflections not used in the refinement. f CIT, FE and SO4 stand for citrate, iron (III) and sulphate, as referred to in the Chemical Component Dictionary of PDBeChem277 used by the Protein Data Bank45.
g The slash separates the B factors of each crystal structure cell unit chain.
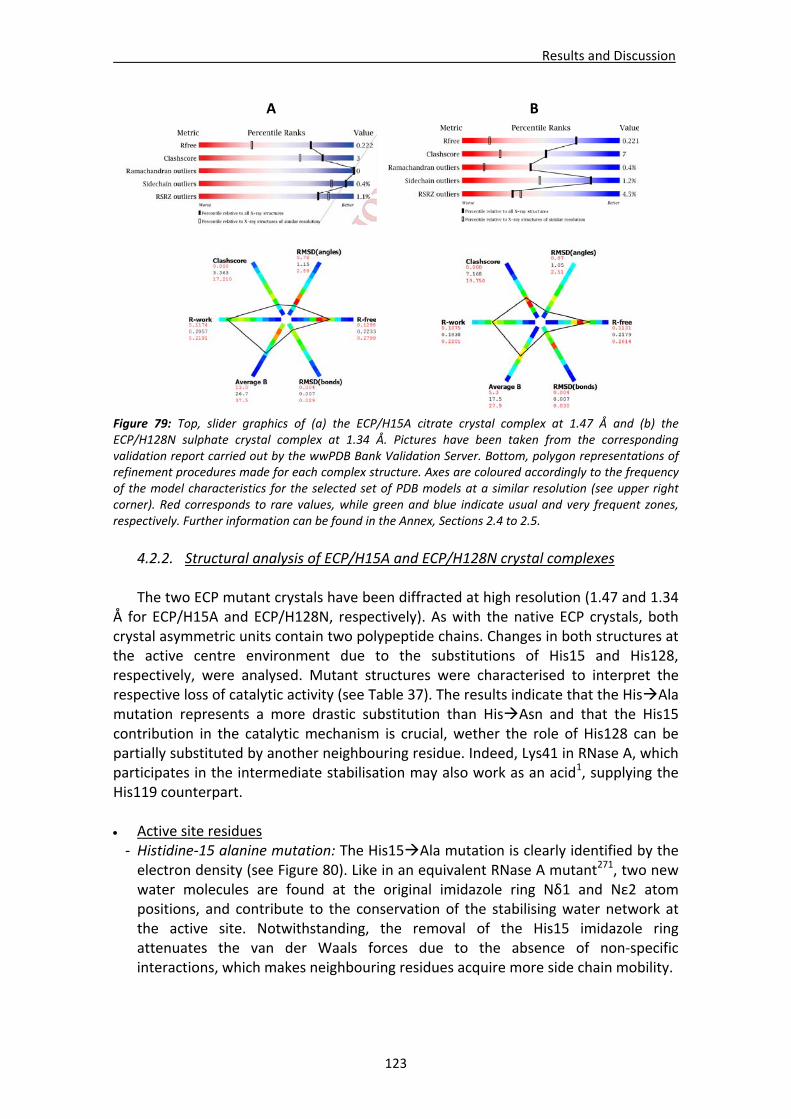
Results and Discussion
123
Figure 79: Top, slider graphics of (a) the ECP/H15A citrate crystal complex at 1.47 Å and (b) the ECP/H128N sulphate crystal complex at 1.34 Å. Pictures have been taken from the corresponding validation report carried out by the wwPDB Bank Validation Server. Bottom, polygon representations of refinement procedures made for each complex structure. Axes are coloured accordingly to the frequency of the model characteristics for the selected set of PDB models at a similar resolution (see upper right corner). Red corresponds to rare values, while green and blue indicate usual and very frequent zones, respectively. Further information can be found in the Annex, Sections 2.4 to 2.5.
4.2.2. Structural analysis of ECP/H15A and ECP/H128N crystal complexes The two ECP mutant crystals have been diffracted at high resolution (1.47 and 1.34
Å for ECP/H15A and ECP/H128N, respectively). As with the native ECP crystals, both crystal asymmetric units contain two polypeptide chains. Changes in both structures at the active centre environment due to the substitutions of His15 and His128, respectively, were analysed. Mutant structures were characterised to interpret the respective loss of catalytic activity (see Table 37). The results indicate that the HisAla mutation represents a more drastic substitution than HisAsn and that the His15 contribution in the catalytic mechanism is crucial, wether the role of His128 can be partially substituted by another neighbouring residue. Indeed, Lys41 in RNase A, which participates in the intermediate stabilisation may also work as an acid1, supplying the His119 counterpart. Active site residues ‐ Histidine‐15 alanine mutation: The His15Ala mutation is clearly identified by the electron density (see Figure 80). Like in an equivalent RNase A mutant271, two new water molecules are found at the original imidazole ring Nδ1 and Νε2 atom positions, and contribute to the conservation of the stabilising water network at the active site. Notwithstanding, the removal of the His15 imidazole ring attenuates the van der Waals forces due to the absence of non‐specific interactions, which makes neighbouring residues acquire more side chain mobility.
A B
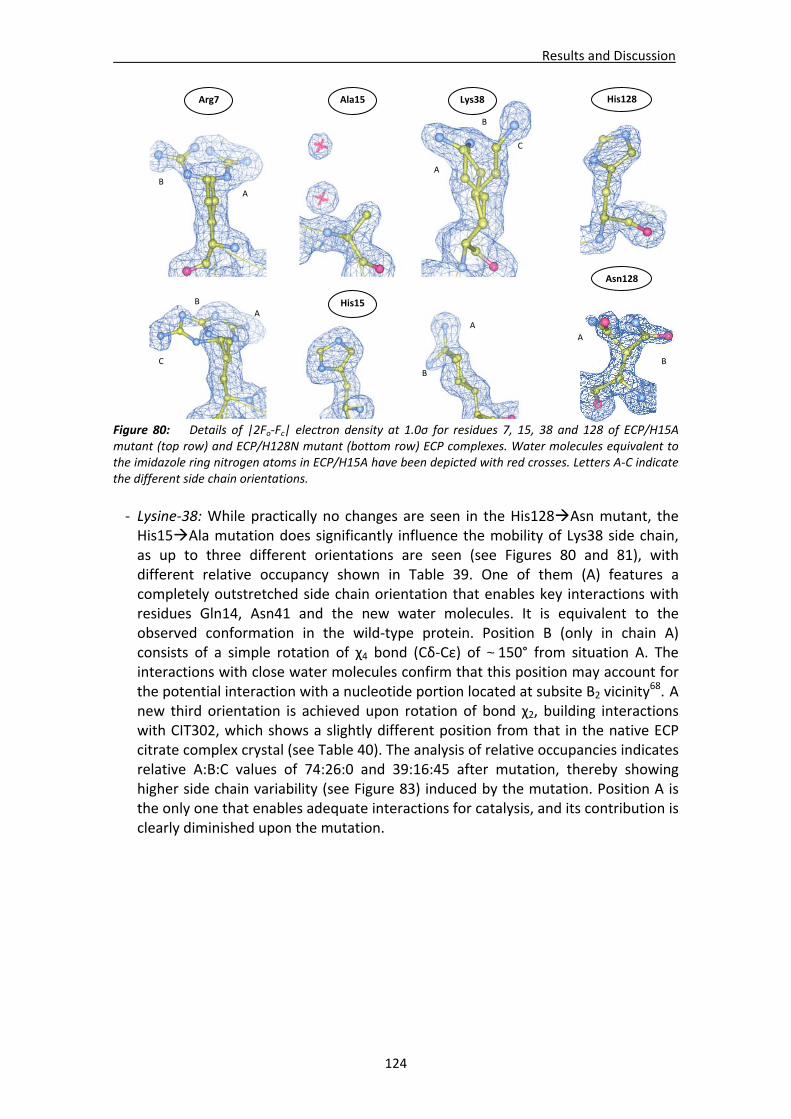
Results and Discussion
124
Figure 80: Details of |2Fo‐Fc| electron density at 1.0σ for residues 7, 15, 38 and 128 of ECP/H15A mutant (top row) and ECP/H128N mutant (bottom row) ECP complexes. Water molecules equivalent to the imidazole ring nitrogen atoms in ECP/H15A have been depicted with red crosses. Letters A‐C indicate the different side chain orientations.
‐ Lysine‐38: While practically no changes are seen in the His128Asn mutant, the His15Ala mutation does significantly influence the mobility of Lys38 side chain, as up to three different orientations are seen (see Figures 80 and 81), with different relative occupancy shown in Table 39. One of them (A) features a completely outstretched side chain orientation that enables key interactions with residues Gln14, Asn41 and the new water molecules. It is equivalent to the observed conformation in the wild‐type protein. Position B (only in chain A) consists of a simple rotation of χ4 bond (Cδ‐Cε) of ~150° from situation A. The interactions with close water molecules confirm that this position may account for the potential interaction with a nucleotide portion located at subsite B2 vicinity
68. A new third orientation is achieved upon rotation of bond χ2, building interactions with CIT302, which shows a slightly different position from that in the native ECP citrate complex crystal (see Table 40). The analysis of relative occupancies indicates relative A:B:C values of 74:26:0 and 39:16:45 after mutation, thereby showing higher side chain variability (see Figure 83) induced by the mutation. Position A is the only one that enables adequate interactions for catalysis, and its contribution is clearly diminished upon the mutation.
A
B
Arg7
C
B
A
Ala15
His15
Lys38
A
B
C
A
B
A
B
His128
Asn128
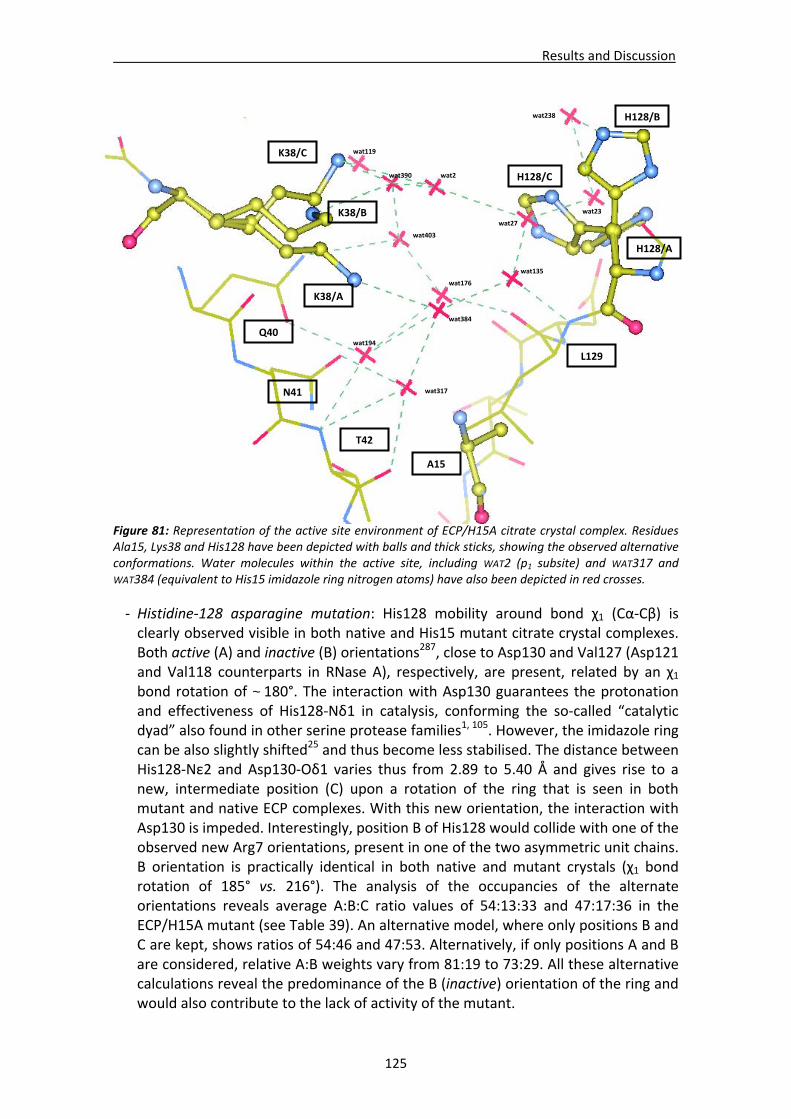
Results and Discussion
125
Figure 81: Representation of the active site environment of ECP/H15A citrate crystal complex. Residues Ala15, Lys38 and His128 have been depicted with balls and thick sticks, showing the observed alternative conformations. Water molecules within the active site, including WAT2 (p1 subsite) and WAT317 and WAT384 (equivalent to His15 imidazole ring nitrogen atoms) have also been depicted in red crosses.
‐ Histidine‐128 asparagine mutation: His128 mobility around bond χ1 (Cα‐Cβ) is clearly observed visible in both native and His15 mutant citrate crystal complexes. Both active (A) and inactive (B) orientations287, close to Asp130 and Val127 (Asp121 and Val118 counterparts in RNase A), respectively, are present, related by an χ1 bond rotation of ~180°. The interaction with Asp130 guarantees the protonation and effectiveness of His128‐Nδ1 in catalysis, conforming the so‐called “catalytic dyad” also found in other serine protease families1, 105. However, the imidazole ring can be also slightly shifted25 and thus become less stabilised. The distance between His128‐Nε2 and Asp130‐Oδ1 varies thus from 2.89 to 5.40 Å and gives rise to a new, intermediate position (C) upon a rotation of the ring that is seen in both mutant and native ECP complexes. With this new orientation, the interaction with Asp130 is impeded. Interestingly, position B of His128 would collide with one of the observed new Arg7 orientations, present in one of the two asymmetric unit chains. B orientation is practically identical in both native and mutant crystals (χ1 bond rotation of 185° vs. 216°). The analysis of the occupancies of the alternate orientations reveals average A:B:C ratio values of 54:13:33 and 47:17:36 in the ECP/H15A mutant (see Table 39). An alternative model, where only positions B and C are kept, shows ratios of 54:46 and 47:53. Alternatively, if only positions A and B are considered, relative A:B weights vary from 81:19 to 73:29. All these alternative calculations reveal the predominance of the B (inactive) orientation of the ring and would also contribute to the lack of activity of the mutant.
H128/A
H128/B
K38/A
K38/B
K38/C
A15
wat317
wat384
wat2 H128/C
wat176
wat194
wat403
Q40
T42
N41
wat390
wat119
wat135
wat27
wat23
wat238
L129
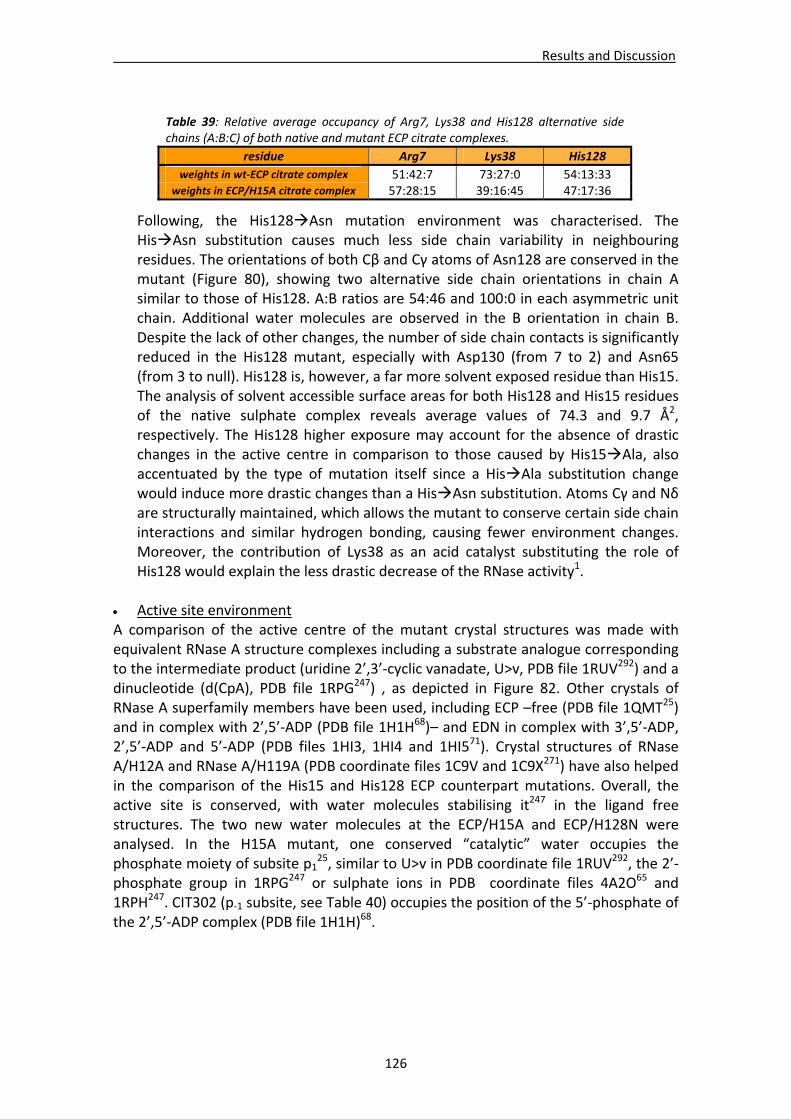
Results and Discussion
126
Following, the His128Asn mutation environment was characterised. The HisAsn substitution causes much less side chain variability in neighbouring residues. The orientations of both Cβ and Cγ atoms of Asn128 are conserved in the mutant (Figure 80), showing two alternative side chain orientations in chain A similar to those of His128. A:B ratios are 54:46 and 100:0 in each asymmetric unit chain. Additional water molecules are observed in the B orientation in chain B. Despite the lack of other changes, the number of side chain contacts is significantly reduced in the His128 mutant, especially with Asp130 (from 7 to 2) and Asn65 (from 3 to null). His128 is, however, a far more solvent exposed residue than His15. The analysis of solvent accessible surface areas for both His128 and His15 residues of the native sulphate complex reveals average values of 74.3 and 9.7 Å2, respectively. The His128 higher exposure may account for the absence of drastic changes in the active centre in comparison to those caused by His15Ala, also accentuated by the type of mutation itself since a HisAla substitution change would induce more drastic changes than a HisAsn substitution. Atoms Cγ and Nδ are structurally maintained, which allows the mutant to conserve certain side chain interactions and similar hydrogen bonding, causing fewer environment changes. Moreover, the contribution of Lys38 as an acid catalyst substituting the role of His128 would explain the less drastic decrease of the RNase activity1.
Active site environment A comparison of the active centre of the mutant crystal structures was made with equivalent RNase A structure complexes including a substrate analogue corresponding to the intermediate product (uridine 2’,3’‐cyclic vanadate, U>v, PDB file 1RUV292) and a dinucleotide (d(CpA), PDB file 1RPG247) , as depicted in Figure 82. Other crystals of RNase A superfamily members have been used, including ECP –free (PDB file 1QMT25) and in complex with 2’,5’‐ADP (PDB file 1H1H68)– and EDN in complex with 3’,5’‐ADP, 2’,5’‐ADP and 5’‐ADP (PDB files 1HI3, 1HI4 and 1HI571). Crystal structures of RNase A/H12A and RNase A/H119A (PDB coordinate files 1C9V and 1C9X271) have also helped in the comparison of the His15 and His128 ECP counterpart mutations. Overall, the active site is conserved, with water molecules stabilising it247 in the ligand free structures. The two new water molecules at the ECP/H15A and ECP/H128N were analysed. In the H15A mutant, one conserved “catalytic” water occupies the phosphate moiety of subsite p1
25, similar to U>v in PDB coordinate file 1RUV292, the 2’‐phosphate group in 1RPG247 or sulphate ions in PDB coordinate files 4A2O65 and 1RPH247. CIT302 (p‐1 subsite, see Table 40) occupies the position of the 5’‐phosphate of the 2’,5’‐ADP complex (PDB file 1H1H)68.
Table 39: Relative average occupancy of Arg7, Lys38 and His128 alternative side chains (A:B:C) of both native and mutant ECP citrate complexes.
residue Arg7 Lys38 His128
weights in wt‐ECP citrate complex 51:42:7 73:27:0 54:13:33 weights in ECP/H15A citrate complex 57:28:15 39:16:45 47:17:36
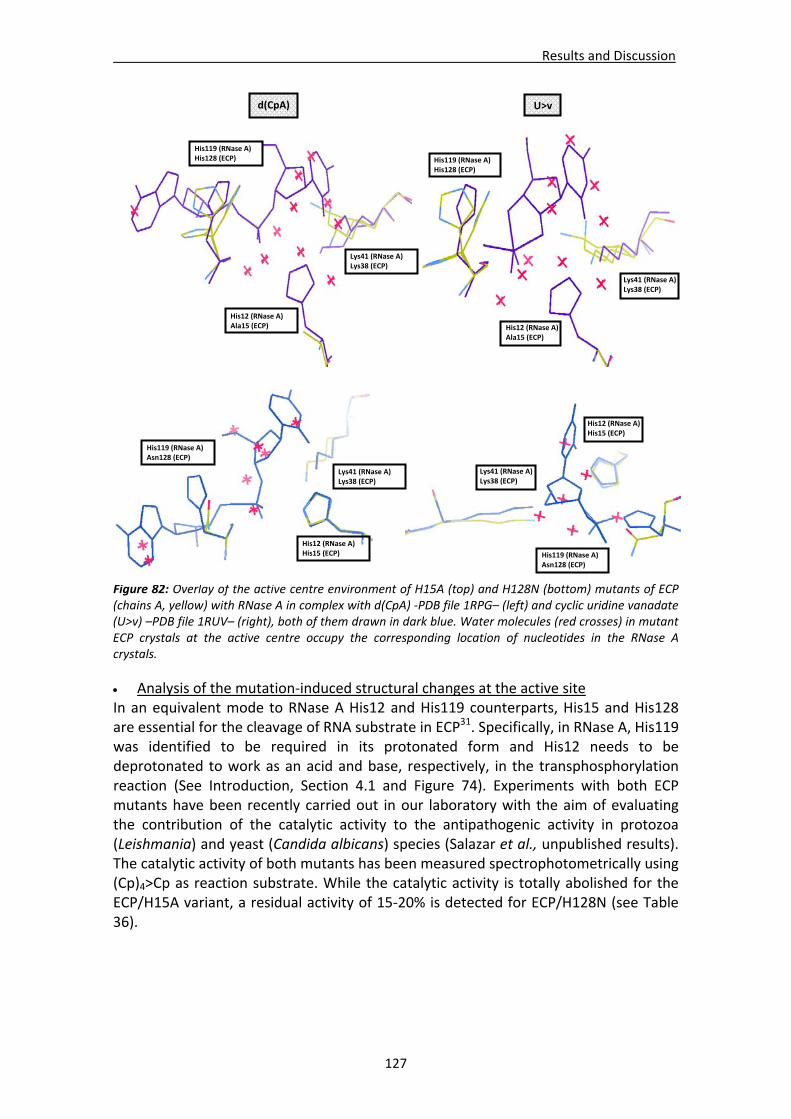
Results and Discussion
127
Figure 82: Overlay of the active centre environment of H15A (top) and H128N (bottom) mutants of ECP (chains A, yellow) with RNase A in complex with d(CpA) ‐PDB file 1RPG– (left) and cyclic uridine vanadate (U>v) –PDB file 1RUV– (right), both of them drawn in dark blue. Water molecules (red crosses) in mutant ECP crystals at the active centre occupy the corresponding location of nucleotides in the RNase A crystals.
Analysis of the mutation‐induced structural changes at the active site In an equivalent mode to RNase A His12 and His119 counterparts, His15 and His128 are essential for the cleavage of RNA substrate in ECP31. Specifically, in RNase A, His119 was identified to be required in its protonated form and His12 needs to be deprotonated to work as an acid and base, respectively, in the transphosphorylation reaction (See Introduction, Section 4.1 and Figure 74). Experiments with both ECP mutants have been recently carried out in our laboratory with the aim of evaluating the contribution of the catalytic activity to the antipathogenic activity in protozoa (Leishmania) and yeast (Candida albicans) species (Salazar et al., unpublished results). The catalytic activity of both mutants has been measured spectrophotometrically using (Cp)4>Cp as reaction substrate. While the catalytic activity is totally abolished for the ECP/H15A variant, a residual activity of 15‐20% is detected for ECP/H128N (see Table 36).
U>v
His119 (RNase A) Asn128 (ECP)
Lys41 (RNase A) Lys38 (ECP)
His12 (RNase A) His15 (ECP)
His12 (RNase A)Ala15 (ECP)
His119 (RNase A) His128 (ECP)
Lys41 (RNase A) Lys38 (ECP)
d(CpA)
His12 (RNase A) Ala15 (ECP)
Lys41 (RNase A) Lys38 (ECP)
His119 (RNase A) His128 (ECP)
His12 (RNase A) His15 (ECP)
Lys41 (RNase A) Lys38 (ECP)
His119 (RNase A) Asn128 (ECP)
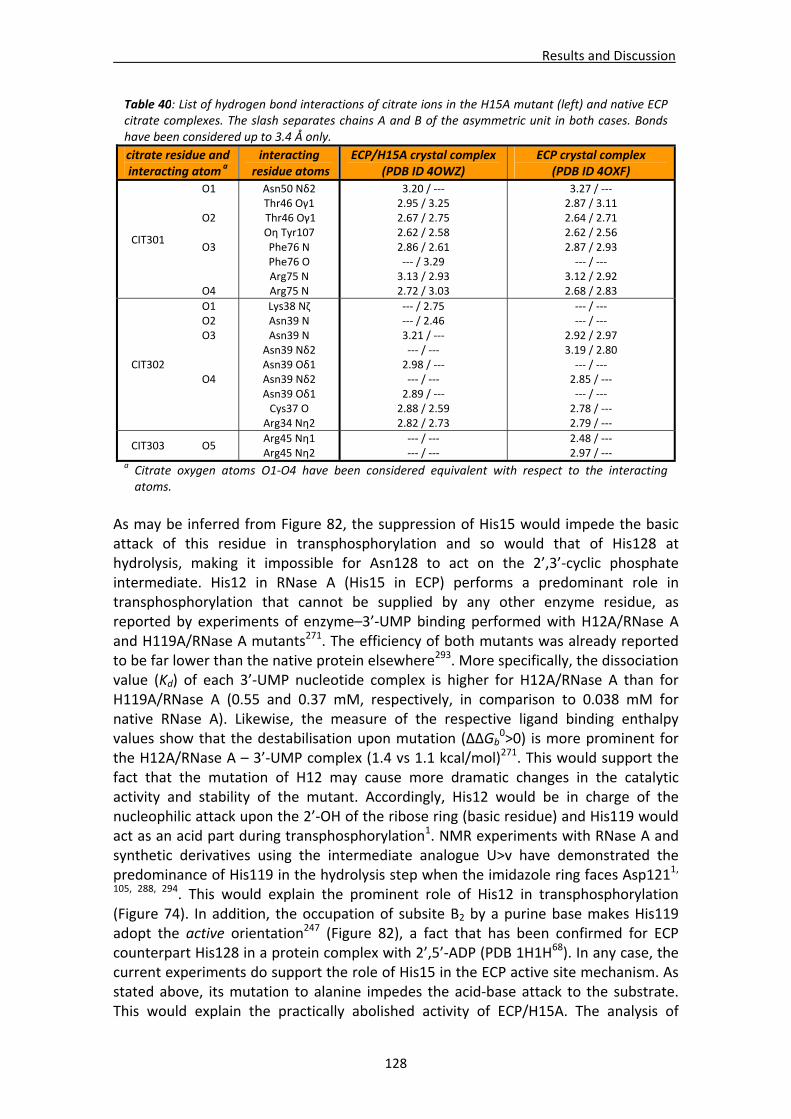
Results and Discussion
128
As may be inferred from Figure 82, the suppression of His15 would impede the basic attack of this residue in transphosphorylation and so would that of His128 at hydrolysis, making it impossible for Asn128 to act on the 2’,3’‐cyclic phosphate intermediate. His12 in RNase A (His15 in ECP) performs a predominant role in transphosphorylation that cannot be supplied by any other enzyme residue, as reported by experiments of enzyme–3’‐UMP binding performed with H12A/RNase A and H119A/RNase A mutants271. The efficiency of both mutants was already reported to be far lower than the native protein elsewhere293. More specifically, the dissociation value (Kd) of each 3’‐UMP nucleotide complex is higher for H12A/RNase A than for H119A/RNase A (0.55 and 0.37 mM, respectively, in comparison to 0.038 mM for native RNase A). Likewise, the measure of the respective ligand binding enthalpy values show that the destabilisation upon mutation (ΔΔGb
0>0) is more prominent for the H12A/RNase A – 3’‐UMP complex (1.4 vs 1.1 kcal/mol)271. This would support the fact that the mutation of H12 may cause more dramatic changes in the catalytic activity and stability of the mutant. Accordingly, His12 would be in charge of the nucleophilic attack upon the 2’‐OH of the ribose ring (basic residue) and His119 would act as an acid part during transphosphorylation1. NMR experiments with RNase A and synthetic derivatives using the intermediate analogue U>v have demonstrated the predominance of His119 in the hydrolysis step when the imidazole ring faces Asp1211, 105, 288, 294. This would explain the prominent role of His12 in transphosphorylation (Figure 74). In addition, the occupation of subsite B2 by a purine base makes His119 adopt the active orientation247 (Figure 82), a fact that has been confirmed for ECP counterpart His128 in a protein complex with 2’,5’‐ADP (PDB 1H1H68). In any case, the current experiments do support the role of His15 in the ECP active site mechanism. As stated above, its mutation to alanine impedes the acid‐base attack to the substrate. This would explain the practically abolished activity of ECP/H15A. The analysis of
Table 40: List of hydrogen bond interactions of citrate ions in the H15A mutant (left) and native ECP citrate complexes. The slash separates chains A and B of the asymmetric unit in both cases. Bonds have been considered up to 3.4 Å only.
citrate residue and interacting atom a
interacting residue atoms
ECP/H15A crystal complex (PDB ID 4OWZ)
ECP crystal complex (PDB ID 4OXF)
CIT301
O1
O2
O3
O4
Asn50 Nδ2 Thr46 Oγ1 Thr46 Oγ1 Oη Tyr107 Phe76 N Phe76 O Arg75 N Arg75 N
3.20 / ‐‐‐ 2.95 / 3.25 2.67 / 2.75 2.62 / 2.58 2.86 / 2.61 ‐‐‐ / 3.29 3.13 / 2.93 2.72 / 3.03
3.27 / ‐‐‐ 2.87 / 3.11 2.64 / 2.71 2.62 / 2.56 2.87 / 2.93 ‐‐‐ / ‐‐‐
3.12 / 2.92 2.68 / 2.83
CIT302
O1 O2 O3
O4
Lys38 Nζ Asn39 N Asn39 N
Asn39 Nδ2 Asn39 Oδ1 Asn39 Nδ2 Asn39 Oδ1 Cys37 O
Arg34 Nη2
‐‐‐ / 2.75 ‐‐‐ / 2.46 3.21 / ‐‐‐ ‐‐‐ / ‐‐‐ 2.98 / ‐‐‐ ‐‐‐ / ‐‐‐ 2.89 / ‐‐‐ 2.88 / 2.59 2.82 / 2.73
‐‐‐ / ‐‐‐ ‐‐‐ / ‐‐‐
2.92 / 2.97 3.19 / 2.80 ‐‐‐ / ‐‐‐ 2.85 / ‐‐‐ ‐‐‐ / ‐‐‐ 2.78 / ‐‐‐ 2.79 / ‐‐‐
CIT303 O5 Arg45 Nη1 Arg45 Nη2
‐‐‐ / ‐‐‐ ‐‐‐ / ‐‐‐
2.48 / ‐‐‐ 2.97 / ‐‐‐
a Citrate oxygen atoms O1‐O4 have been considered equivalent with respect to the interacting atoms.
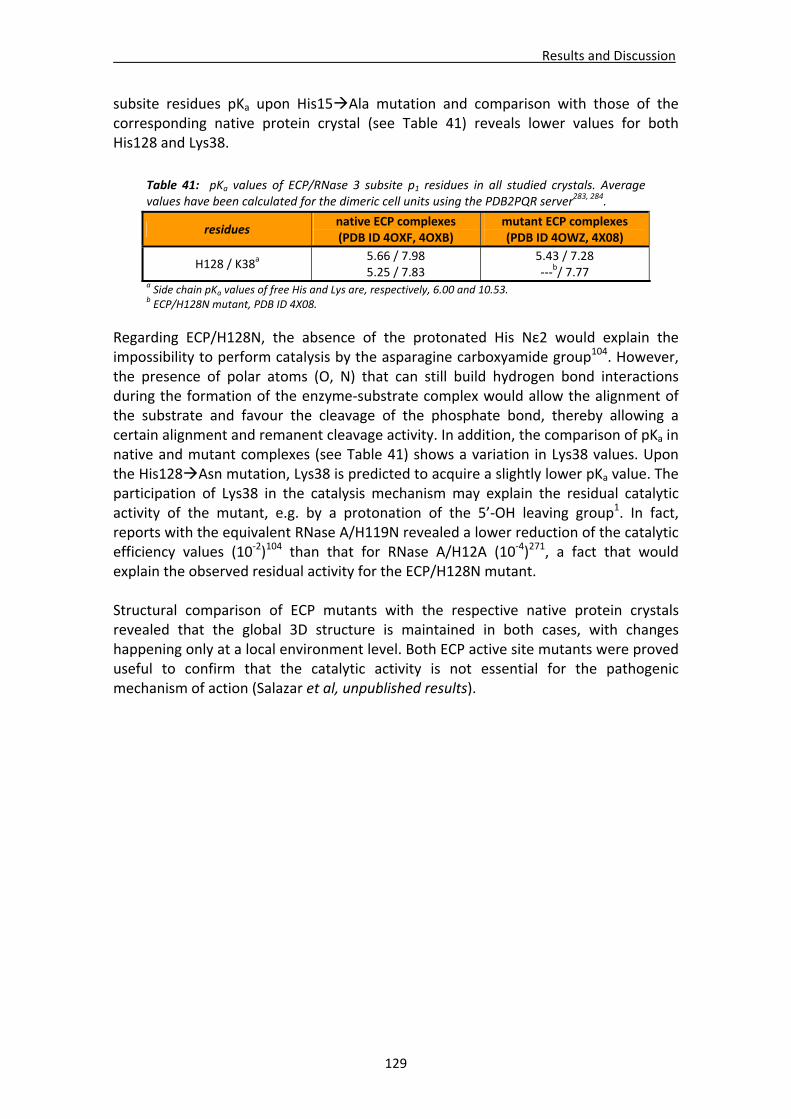
Results and Discussion
129
subsite residues pKa upon His15Ala mutation and comparison with those of the corresponding native protein crystal (see Table 41) reveals lower values for both His128 and Lys38. Regarding ECP/H128N, the absence of the protonated His Nε2 would explain the impossibility to perform catalysis by the asparagine carboxyamide group104. However, the presence of polar atoms (O, N) that can still build hydrogen bond interactions during the formation of the enzyme‐substrate complex would allow the alignment of the substrate and favour the cleavage of the phosphate bond, thereby allowing a certain alignment and remanent cleavage activity. In addition, the comparison of pKa in native and mutant complexes (see Table 41) shows a variation in Lys38 values. Upon the His128Asn mutation, Lys38 is predicted to acquire a slightly lower pKa value. The participation of Lys38 in the catalysis mechanism may explain the residual catalytic activity of the mutant, e.g. by a protonation of the 5’‐OH leaving group1. In fact, reports with the equivalent RNase A/H119N revealed a lower reduction of the catalytic efficiency values (10‐2)104 than that for RNase A/H12A (10‐4)271, a fact that would explain the observed residual activity for the ECP/H128N mutant. Structural comparison of ECP mutants with the respective native protein crystals revealed that the global 3D structure is maintained in both cases, with changes happening only at a local environment level. Both ECP active site mutants were proved useful to confirm that the catalytic activity is not essential for the pathogenic mechanism of action (Salazar et al, unpublished results).
Table 41: pKa values of ECP/RNase 3 subsite p1 residues in all studied crystals. Average values have been calculated for the dimeric cell units using the PDB2PQR server283, 284.
residues native ECP complexes (PDB ID 4OXF, 4OXB)
mutant ECP complexes (PDB ID 4OWZ, 4X08)
H128 / K38a 5.66 / 7.98 5.25 / 7.83
5.43 / 7.28 ‐‐‐b/ 7.77
a Side chain pKa values of free His and Lys are, respectively, 6.00 and 10.53. b ECP/H128N mutant, PDB ID 4X08.
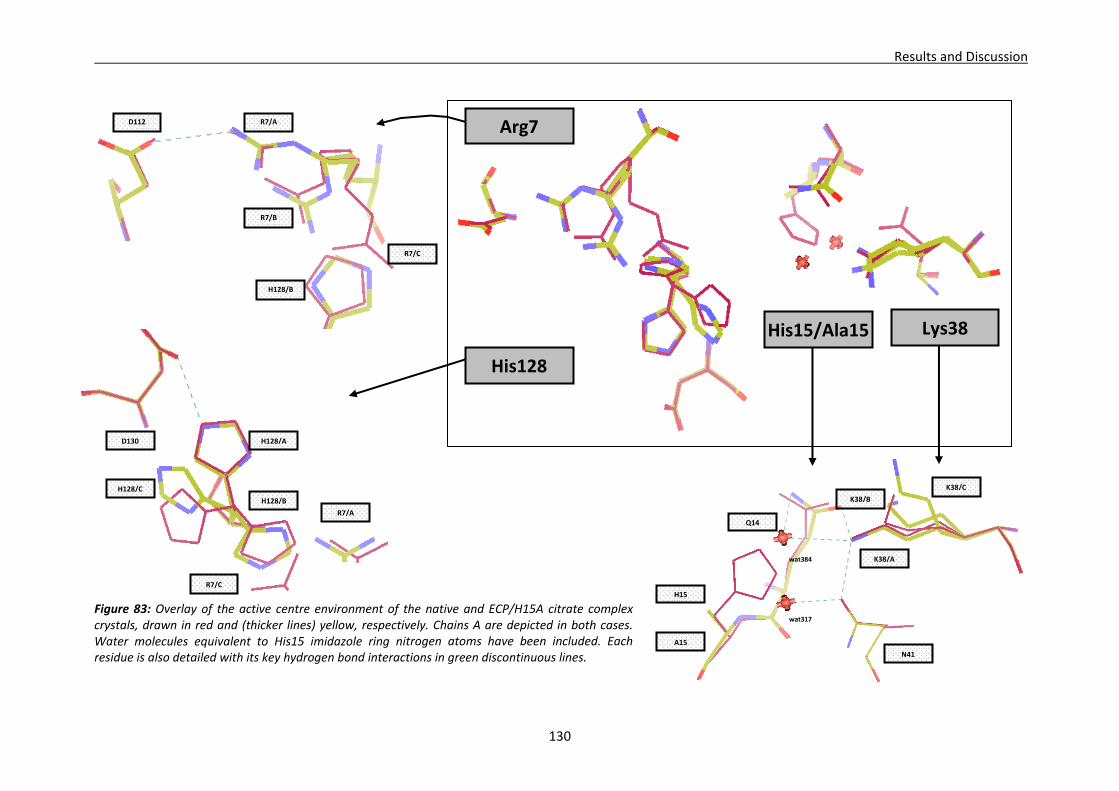
Results and Discussion
130
Figure 83: Overlay of the active centre environment of the native and ECP/H15A citrate complex crystals, drawn in red and (thicker lines) yellow, respectively. Chains A are depicted in both cases. Water molecules equivalent to His15 imidazole ring nitrogen atoms have been included. Each residue is also detailed with its key hydrogen bond interactions in green discontinuous lines.
wat317
wat384
K38/C
K38/B
K38/A
N41
A15
Q14
H15
D130 H128/A
H128/B
H128/C
R7/C
R7/A
His128
His15/Ala15 Lys38
Arg7D112 R7/A
R7/B
R7/C
H128/B
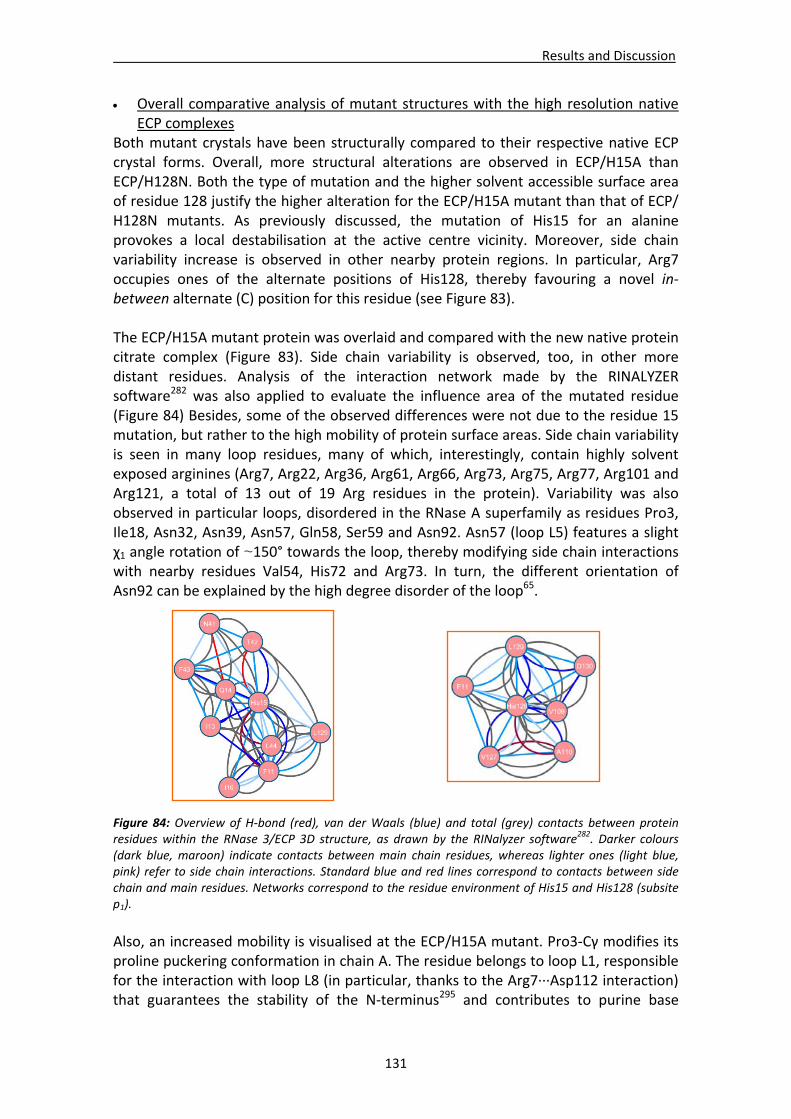
Results and Discussion
131
Overall comparative analysis of mutant structures with the high resolution native ECP complexes
Both mutant crystals have been structurally compared to their respective native ECP crystal forms. Overall, more structural alterations are observed in ECP/H15A than ECP/H128N. Both the type of mutation and the higher solvent accessible surface area of residue 128 justify the higher alteration for the ECP/H15A mutant than that of ECP/ H128N mutants. As previously discussed, the mutation of His15 for an alanine provokes a local destabilisation at the active centre vicinity. Moreover, side chain variability increase is observed in other nearby protein regions. In particular, Arg7 occupies ones of the alternate positions of His128, thereby favouring a novel in‐between alternate (C) position for this residue (see Figure 83). The ECP/H15A mutant protein was overlaid and compared with the new native protein citrate complex (Figure 83). Side chain variability is observed, too, in other more distant residues. Analysis of the interaction network made by the RINALYZER software282 was also applied to evaluate the influence area of the mutated residue (Figure 84) Besides, some of the observed differences were not due to the residue 15 mutation, but rather to the high mobility of protein surface areas. Side chain variability is seen in many loop residues, many of which, interestingly, contain highly solvent exposed arginines (Arg7, Arg22, Arg36, Arg61, Arg66, Arg73, Arg75, Arg77, Arg101 and Arg121, a total of 13 out of 19 Arg residues in the protein). Variability was also observed in particular loops, disordered in the RNase A superfamily as residues Pro3, Ile18, Asn32, Asn39, Asn57, Gln58, Ser59 and Asn92. Asn57 (loop L5) features a slight χ1 angle rotation of ~150° towards the loop, thereby modifying side chain interactions with nearby residues Val54, His72 and Arg73. In turn, the different orientation of Asn92 can be explained by the high degree disorder of the loop65. Figure 84: Overview of H‐bond (red), van der Waals (blue) and total (grey) contacts between protein residues within the RNase 3/ECP 3D structure, as drawn by the RINalyzer software282. Darker colours (dark blue, maroon) indicate contacts between main chain residues, whereas lighter ones (light blue, pink) refer to side chain interactions. Standard blue and red lines correspond to contacts between side chain and main residues. Networks correspond to the residue environment of His15 and His128 (subsite p1).
Also, an increased mobility is visualised at the ECP/H15A mutant. Pro3‐Cγ modifies its proline puckering conformation in chain A. The residue belongs to loop L1, responsible for the interaction with loop L8 (in particular, thanks to the Arg7∙∙∙Asp112 interaction) that guarantees the stability of the N‐terminus295 and contributes to purine base
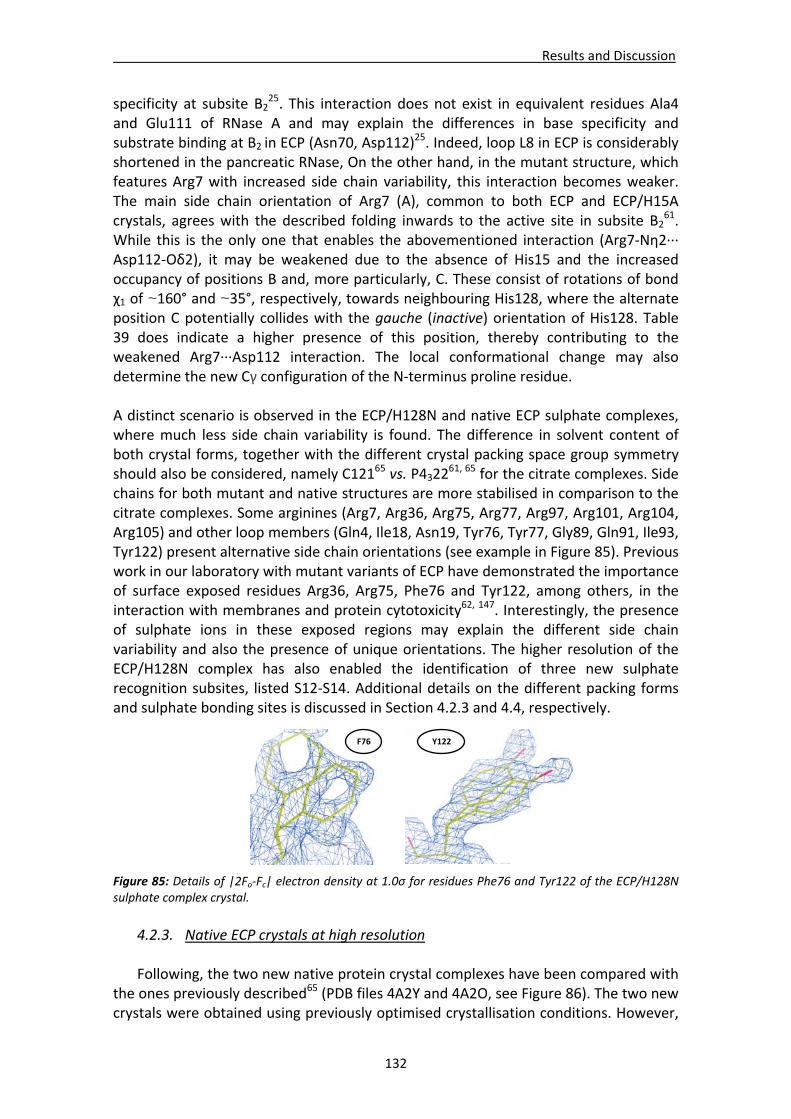
Results and Discussion
132
specificity at subsite B225. This interaction does not exist in equivalent residues Ala4
and Glu111 of RNase A and may explain the differences in base specificity and substrate binding at B2 in ECP (Asn70, Asp112)
25. Indeed, loop L8 in ECP is considerably shortened in the pancreatic RNase, On the other hand, in the mutant structure, which features Arg7 with increased side chain variability, this interaction becomes weaker. The main side chain orientation of Arg7 (A), common to both ECP and ECP/H15A crystals, agrees with the described folding inwards to the active site in subsite B2
61. While this is the only one that enables the abovementioned interaction (Arg7‐Nη2∙∙∙ Asp112‐Oδ2), it may be weakened due to the absence of His15 and the increased occupancy of positions B and, more particularly, C. These consist of rotations of bond χ1 of ~160° and ~35°, respectively, towards neighbouring His128, where the alternate position C potentially collides with the gauche (inactive) orientation of His128. Table 39 does indicate a higher presence of this position, thereby contributing to the weakened Arg7∙∙∙Asp112 interaction. The local conformational change may also determine the new Cγ configuration of the N‐terminus proline residue. A distinct scenario is observed in the ECP/H128N and native ECP sulphate complexes, where much less side chain variability is found. The difference in solvent content of both crystal forms, together with the different crystal packing space group symmetry should also be considered, namely C12165 vs. P4322
61, 65 for the citrate complexes. Side chains for both mutant and native structures are more stabilised in comparison to the citrate complexes. Some arginines (Arg7, Arg36, Arg75, Arg77, Arg97, Arg101, Arg104, Arg105) and other loop members (Gln4, Ile18, Asn19, Tyr76, Tyr77, Gly89, Gln91, Ile93, Tyr122) present alternative side chain orientations (see example in Figure 85). Previous work in our laboratory with mutant variants of ECP have demonstrated the importance of surface exposed residues Arg36, Arg75, Phe76 and Tyr122, among others, in the interaction with membranes and protein cytotoxicity62, 147. Interestingly, the presence of sulphate ions in these exposed regions may explain the different side chain variability and also the presence of unique orientations. The higher resolution of the ECP/H128N complex has also enabled the identification of three new sulphate recognition subsites, listed S12‐S14. Additional details on the different packing forms and sulphate bonding sites is discussed in Section 4.2.3 and 4.4, respectively. Figure 85: Details of |2Fo‐Fc| electron density at 1.0σ for residues Phe76 and Tyr122 of the ECP/H128N sulphate complex crystal.
4.2.3. Native ECP crystals at high resolution Following, the two new native protein crystal complexes have been compared with
the ones previously described65 (PDB files 4A2Y and 4A2O, see Figure 86). The two new crystals were obtained using previously optimised crystallisation conditions. However,
F76 Y122
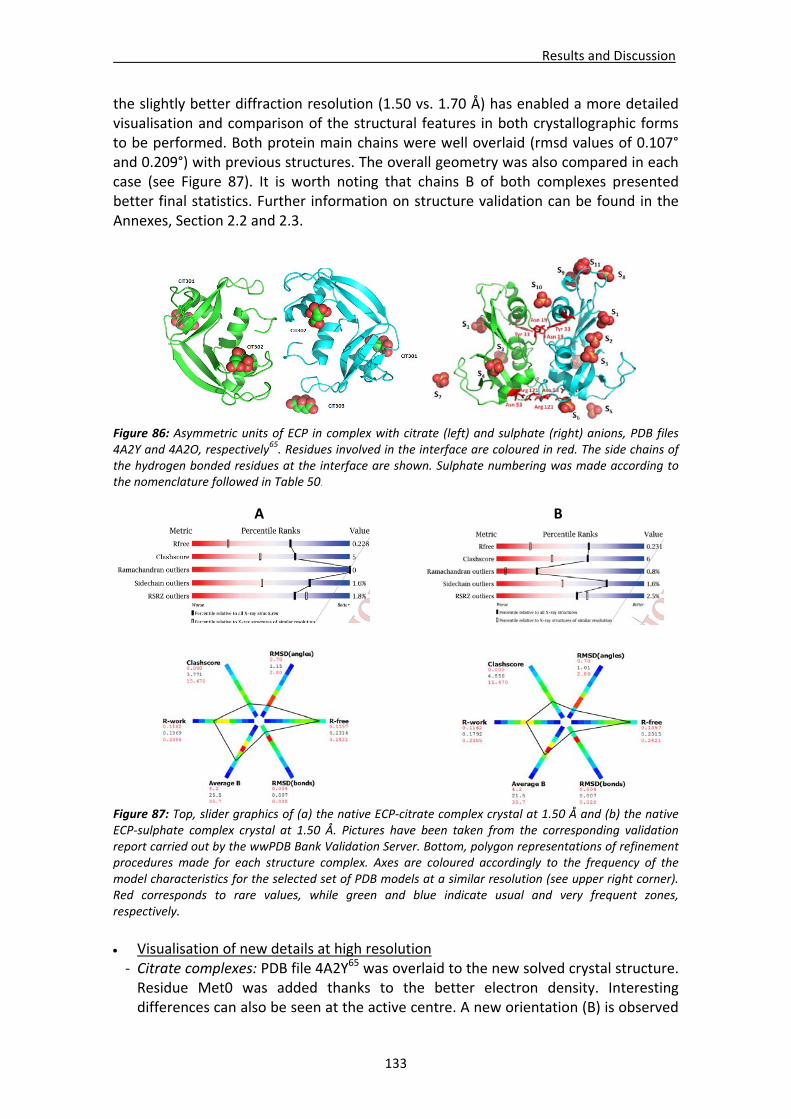
Results and Discussion
133
the slightly better diffraction resolution (1.50 vs. 1.70 Å) has enabled a more detailed visualisation and comparison of the structural features in both crystallographic forms to be performed. Both protein main chains were well overlaid (rmsd values of 0.107° and 0.209°) with previous structures. The overall geometry was also compared in each case (see Figure 87). It is worth noting that chains B of both complexes presented better final statistics. Further information on structure validation can be found in the Annexes, Section 2.2 and 2.3.
Figure 86: Asymmetric units of ECP in complex with citrate (left) and sulphate (right) anions, PDB files 4A2Y and 4A2O, respectively65. Residues involved in the interface are coloured in red. The side chains of the hydrogen bonded residues at the interface are shown. Sulphate numbering was made according to the nomenclature followed in Table 50.
Figure 87: Top, slider graphics of (a) the native ECP‐citrate complex crystal at 1.50 Å and (b) the native ECP‐sulphate complex crystal at 1.50 Å. Pictures have been taken from the corresponding validation report carried out by the wwPDB Bank Validation Server. Bottom, polygon representations of refinement procedures made for each structure complex. Axes are coloured accordingly to the frequency of the model characteristics for the selected set of PDB models at a similar resolution (see upper right corner). Red corresponds to rare values, while green and blue indicate usual and very frequent zones, respectively.
Visualisation of new details at high resolution ‐ Citrate complexes: PDB file 4A2Y65 was overlaid to the new solved crystal structure. Residue Met0 was added thanks to the better electron density. Interesting differences can also be seen at the active centre. A new orientation (B) is observed
A B
Results and Discussion
134
for the Lys38‐Nζ atom. An alternative one is also observed for Arg7 in the higher resolution complex. Differences are also found for many other exposed arginine residues (Arg1, Arg22, Arg36, Arg61, Arg73, Arg75, Arg97, Arg101, Arg104, Arg105, Arg121). Some of them were not observed in the previous structure due to the very high thermal motion factors but are now visualised. Other loop residues (Ile18, Ile25, Asn39, Gln58, Val78, Asn91, Ile91, Asn95) show new alternative side chain orientations. The disulphide bond Cys37‐Cys96 shows two alternative positions and Pro116‐Cγ (loop L8) conformation is identified as exo. Other residues (Asn59, Asn95, Tyr122) show slight side chain different orientations. Regarding ligands, CIT302 occupies a slightly shifted position and the Fe3+ atom, chelated by the anion, is visible in both chains. This citrate‐iron complex is located at the surface of the protein. Another citrate ion (CIT303), is observed in one chain, too, near Arg45 and a symmetry‐related Arg114 residue. Examples of observed alternate side chains can be seen in Figure 88.
‐ Sulphate complexes: An equivalent overlay was made with the new higher resolution wt‐ECP sulphate complex and the previously deposited structure (4A2O65). The new structure shows a more defined electron density at residues Gly89‐Asn92 (loop L7). This is a particularly flexible loop65, showing still poor electron density in the current structure, with the highest motion factors (see Figure 89) throughout both chains. Again, many residues show alternative side chain orientations, mostly arginines (see Table 42) and other loop residues (see examples in Figure 88). In chain A, Pro3 (loop L1) is observed in its exo conformation. Similar to the citrate complex, Trp35 and Tyr122 show slightly different orientations and are involved in the interface contacts between the two molecules of the asymmetric unit. Indeed, the two exposed residues were found key for the protein insertion into lipid bilayers62. The disulphide bridge Cys37‐Cys96 features a similar variability to that in the citrate complex. As before, equivalent conserved water molecules appear in substitution of some of the alternative side chain conformations. Regarding sulphate ion locations, site S2 is no longer occupied by a sulphate anion in either crystal structure, but by a “catalytic” conserved water25. Sulphate S5 is displaced closer (5.8 Å) to Arg75 building new interactions with Asn57 and Gln58.
Table 42: Summary of amino acid residues whose side chain shows mobility in both native ECP crystal complex structures.
variability grade residues
Minor side chain mobility R1, P3, Q14, L18, N19, I25, R28, K38, N39, N53, Q58, N69, R75, V78, P79, I86, R97, P102, R117, P120
High mobility and alternative side chain conformations
Q4, R7, R22, W35, R36, R61, H64, R66, R73, R77, H82, R101, R104, R121, H128
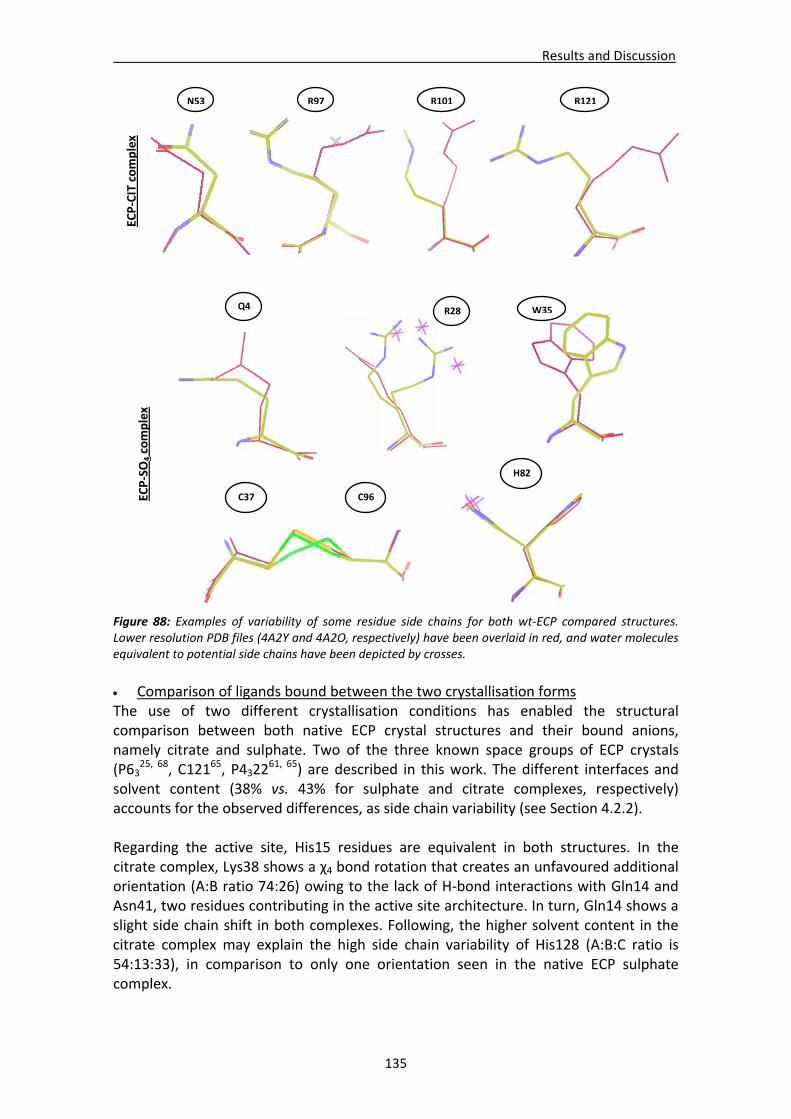
Results and Discussion
135
Figure 88: Examples of variability of some residue side chains for both wt‐ECP compared structures. Lower resolution PDB files (4A2Y and 4A2O, respectively) have been overlaid in red, and water molecules equivalent to potential side chains have been depicted by crosses.
Comparison of ligands bound between the two crystallisation forms The use of two different crystallisation conditions has enabled the structural comparison between both native ECP crystal structures and their bound anions, namely citrate and sulphate. Two of the three known space groups of ECP crystals (P63
25, 68, C12165, P432261, 65) are described in this work. The different interfaces and
solvent content (38% vs. 43% for sulphate and citrate complexes, respectively) accounts for the observed differences, as side chain variability (see Section 4.2.2). Regarding the active site, His15 residues are equivalent in both structures. In the citrate complex, Lys38 shows a χ4 bond rotation that creates an unfavoured additional orientation (A:B ratio 74:26) owing to the lack of H‐bond interactions with Gln14 and Asn41, two residues contributing in the active site architecture. In turn, Gln14 shows a slight side chain shift in both complexes. Following, the higher solvent content in the citrate complex may explain the high side chain variability of His128 (A:B:C ratio is 54:13:33), in comparison to only one orientation seen in the native ECP sulphate complex.
ECP‐CIT complex
R101 R121R97N53
ECP‐SO
4 complex
H82
Q4 R28 W35
C96C37
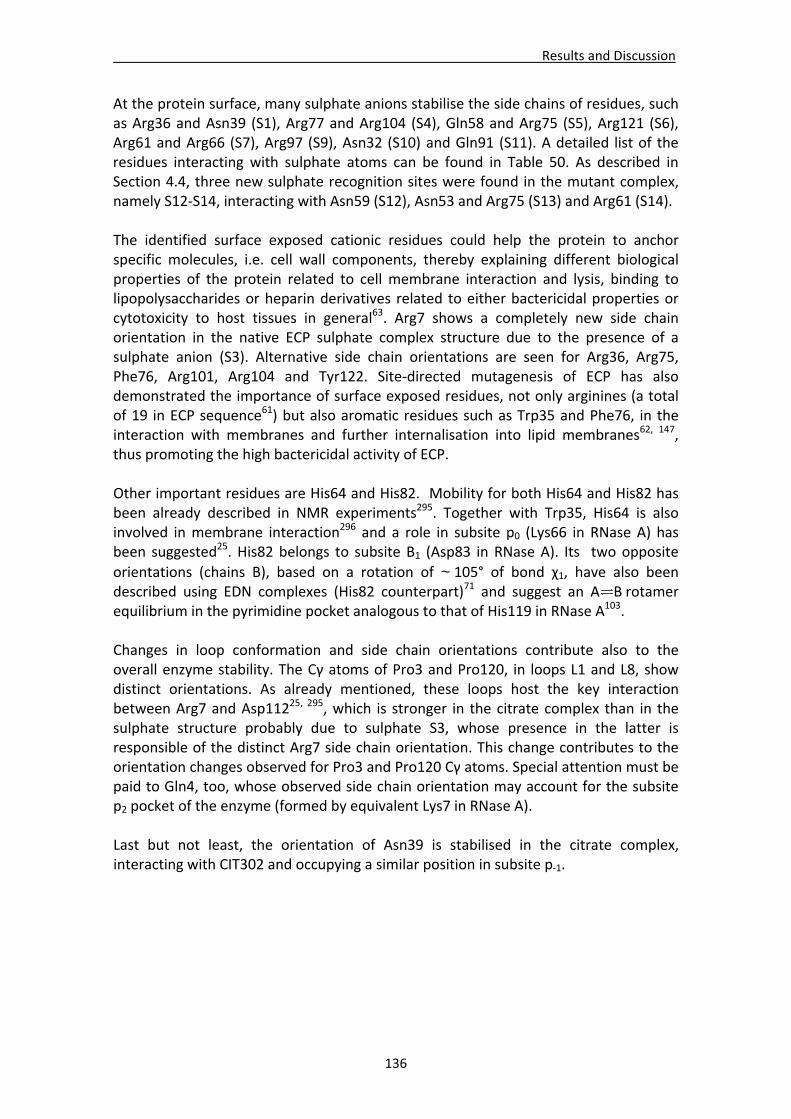
Results and Discussion
136
At the protein surface, many sulphate anions stabilise the side chains of residues, such as Arg36 and Asn39 (S1), Arg77 and Arg104 (S4), Gln58 and Arg75 (S5), Arg121 (S6), Arg61 and Arg66 (S7), Arg97 (S9), Asn32 (S10) and Gln91 (S11). A detailed list of the residues interacting with sulphate atoms can be found in Table 50. As described in Section 4.4, three new sulphate recognition sites were found in the mutant complex, namely S12‐S14, interacting with Asn59 (S12), Asn53 and Arg75 (S13) and Arg61 (S14). The identified surface exposed cationic residues could help the protein to anchor specific molecules, i.e. cell wall components, thereby explaining different biological properties of the protein related to cell membrane interaction and lysis, binding to lipopolysaccharides or heparin derivatives related to either bactericidal properties or cytotoxicity to host tissues in general63. Arg7 shows a completely new side chain orientation in the native ECP sulphate complex structure due to the presence of a sulphate anion (S3). Alternative side chain orientations are seen for Arg36, Arg75, Phe76, Arg101, Arg104 and Tyr122. Site‐directed mutagenesis of ECP has also demonstrated the importance of surface exposed residues, not only arginines (a total of 19 in ECP sequence61) but also aromatic residues such as Trp35 and Phe76, in the interaction with membranes and further internalisation into lipid membranes62, 147, thus promoting the high bactericidal activity of ECP. Other important residues are His64 and His82. Mobility for both His64 and His82 has been already described in NMR experiments295. Together with Trp35, His64 is also involved in membrane interaction296 and a role in subsite p0 (Lys66 in RNase A) has been suggested25. His82 belongs to subsite B1 (Asp83 in RNase A). Its two opposite
orientations (chains B), based on a rotation of ~105° of bond χ1, have also been described using EDN complexes (His82 counterpart)71 and suggest an A B rotamer equilibrium in the pyrimidine pocket analogous to that of His119 in RNase A103. Changes in loop conformation and side chain orientations contribute also to the overall enzyme stability. The Cγ atoms of Pro3 and Pro120, in loops L1 and L8, show distinct orientations. As already mentioned, these loops host the key interaction between Arg7 and Asp11225, 295, which is stronger in the citrate complex than in the sulphate structure probably due to sulphate S3, whose presence in the latter is responsible of the distinct Arg7 side chain orientation. This change contributes to the orientation changes observed for Pro3 and Pro120 Cγ atoms. Special attention must be paid to Gln4, too, whose observed side chain orientation may account for the subsite p2 pocket of the enzyme (formed by equivalent Lys7 in RNase A). Last but not least, the orientation of Asn39 is stabilised in the citrate complex, interacting with CIT302 and occupying a similar position in subsite p‐1.
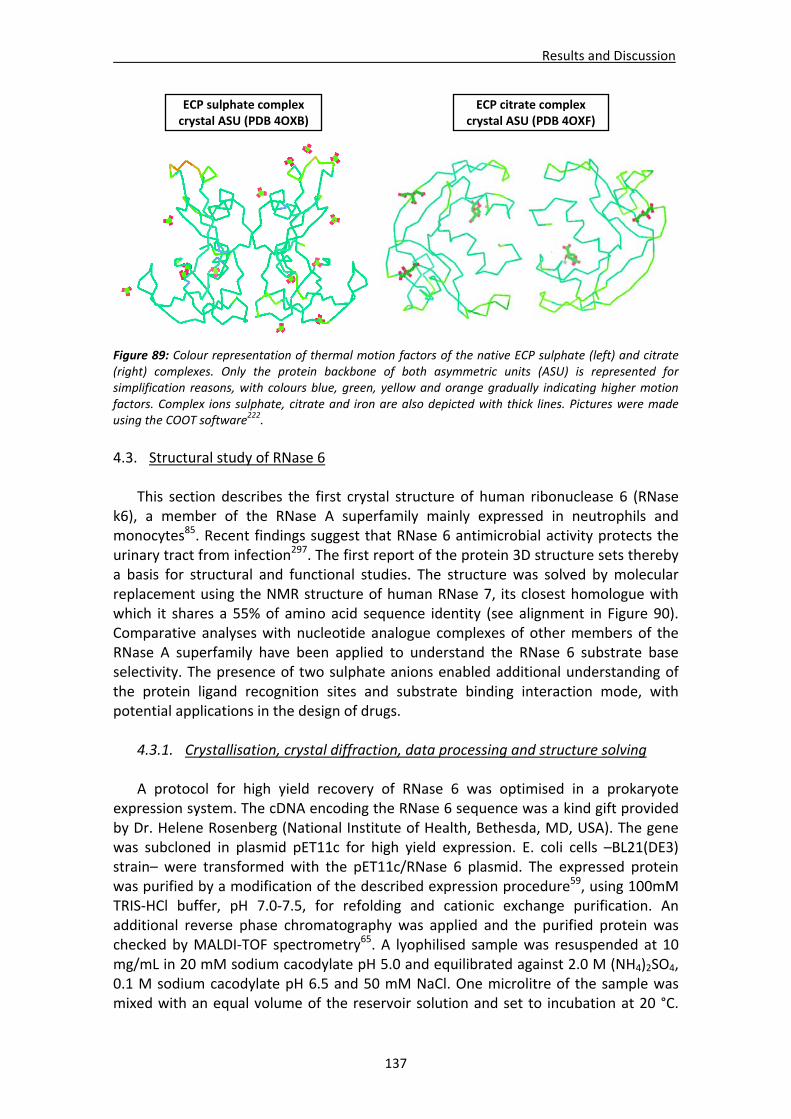
Results and Discussion
137
Figure 89: Colour representation of thermal motion factors of the native ECP sulphate (left) and citrate (right) complexes. Only the protein backbone of both asymmetric units (ASU) is represented for simplification reasons, with colours blue, green, yellow and orange gradually indicating higher motion factors. Complex ions sulphate, citrate and iron are also depicted with thick lines. Pictures were made using the COOT software
222.
4.3. Structural study of RNase 6
This section describes the first crystal structure of human ribonuclease 6 (RNase k6), a member of the RNase A superfamily mainly expressed in neutrophils and monocytes85. Recent findings suggest that RNase 6 antimicrobial activity protects the urinary tract from infection297. The first report of the protein 3D structure sets thereby a basis for structural and functional studies. The structure was solved by molecular replacement using the NMR structure of human RNase 7, its closest homologue with which it shares a 55% of amino acid sequence identity (see alignment in Figure 90). Comparative analyses with nucleotide analogue complexes of other members of the RNase A superfamily have been applied to understand the RNase 6 substrate base selectivity. The presence of two sulphate anions enabled additional understanding of the protein ligand recognition sites and substrate binding interaction mode, with potential applications in the design of drugs.
4.3.1. Crystallisation, crystal diffraction, data processing and structure solving A protocol for high yield recovery of RNase 6 was optimised in a prokaryote
expression system. The cDNA encoding the RNase 6 sequence was a kind gift provided by Dr. Helene Rosenberg (National Institute of Health, Bethesda, MD, USA). The gene was subcloned in plasmid pET11c for high yield expression. E. coli cells –BL21(DE3) strain– were transformed with the pET11c/RNase 6 plasmid. The expressed protein was purified by a modification of the described expression procedure59, using 100mM TRIS‐HCl buffer, pH 7.0‐7.5, for refolding and cationic exchange purification. An additional reverse phase chromatography was applied and the purified protein was checked by MALDI‐TOF spectrometry65. A lyophilised sample was resuspended at 10 mg/mL in 20 mM sodium cacodylate pH 5.0 and equilibrated against 2.0 M (NH4)2SO4, 0.1 M sodium cacodylate pH 6.5 and 50 mM NaCl. One microlitre of the sample was mixed with an equal volume of the reservoir solution and set to incubation at 20 °C.
ECP sulphate complex crystal ASU (PDB 4OXB)
ECP citrate complex crystal ASU (PDB 4OXF)
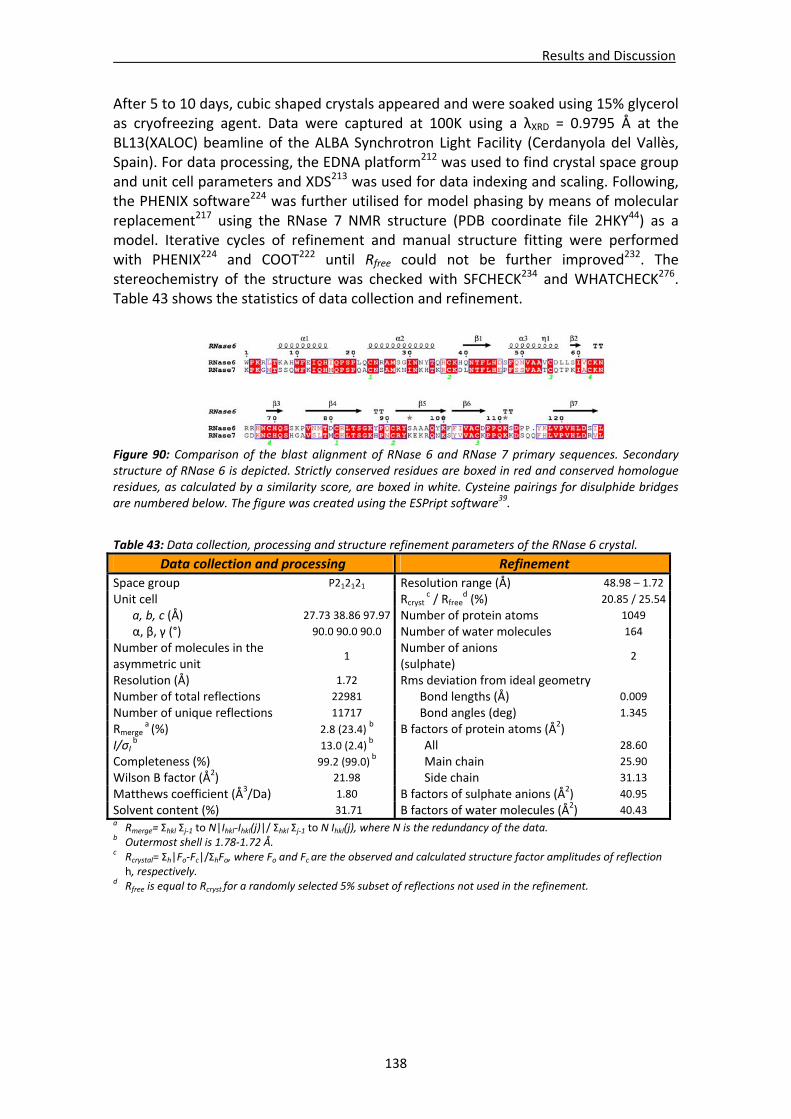
Results and Discussion
138
After 5 to 10 days, cubic shaped crystals appeared and were soaked using 15% glycerol as cryofreezing agent. Data were captured at 100K using a λXRD = 0.9795 Å at the BL13(XALOC) beamline of the ALBA Synchrotron Light Facility (Cerdanyola del Vallès, Spain). For data processing, the EDNA platform212 was used to find crystal space group and unit cell parameters and XDS213 was used for data indexing and scaling. Following, the PHENIX software224 was further utilised for model phasing by means of molecular replacement217 using the RNase 7 NMR structure (PDB coordinate file 2HKY44) as a model. Iterative cycles of refinement and manual structure fitting were performed with PHENIX224 and COOT222 until Rfree could not be further improved232. The stereochemistry of the structure was checked with SFCHECK234 and WHATCHECK276. Table 43 shows the statistics of data collection and refinement.
Figure 90: Comparison of the blast alignment of RNase 6 and RNase 7 primary sequences. Secondary structure of RNase 6 is depicted. Strictly conserved residues are boxed in red and conserved homologue residues, as calculated by a similarity score, are boxed in white. Cysteine pairings for disulphide bridges are numbered below. The figure was created using the ESPript software39.
Table 43: Data collection, processing and structure refinement parameters of the RNase 6 crystal.
Data collection and processing Refinement
Space group P212121 Resolution range (Å) 48.98 – 1.72
Unit cell Rcryst c / Rfree
d (%) 20.85 / 25.54
a, b, c (Å) 27.73 38.86 97.97 Number of protein atoms 1049
α, β, γ (°) 90.0 90.0 90.0 Number of water molecules 164
Number of molecules in the asymmetric unit
1 Number of anions (sulphate)
2
Resolution (Å) 1.72 Rms deviation from ideal geometry Number of total reflections 22981 Bond lengths (Å) 0.009
Number of unique reflections 11717 Bond angles (deg) 1.345
Rmerge a (%) 2.8 (23.4)
b B factors of protein atoms (Å2)
I/σΙ b 13.0 (2.4)
b All 28.60
Completeness (%) 99.2 (99.0) b Main chain 25.90
Wilson B factor (Å2) 21.98 Side chain 31.13
Matthews coefficient (Å3/Da) 1.80 B factors of sulphate anions (Å2) 40.95
Solvent content (%) 31.71 B factors of water molecules (Å2) 40.43 a Rmerge= Σhkl Σj‐1 to N|Ihkl‐Ihkl(j)|/ Σhkl Σj‐1 to N Ihkl(j), where N is the redundancy of the data. b Outermost shell is 1.78‐1.72 Å. c Rcrystal= Σh|Fo‐Fc|/ΣhFo, where Fo and Fc are the observed and calculated structure factor amplitudes of reflection h, respectively.
d Rfree is equal to Rcryst for a randomly selected 5% subset of reflections not used in the refinement.
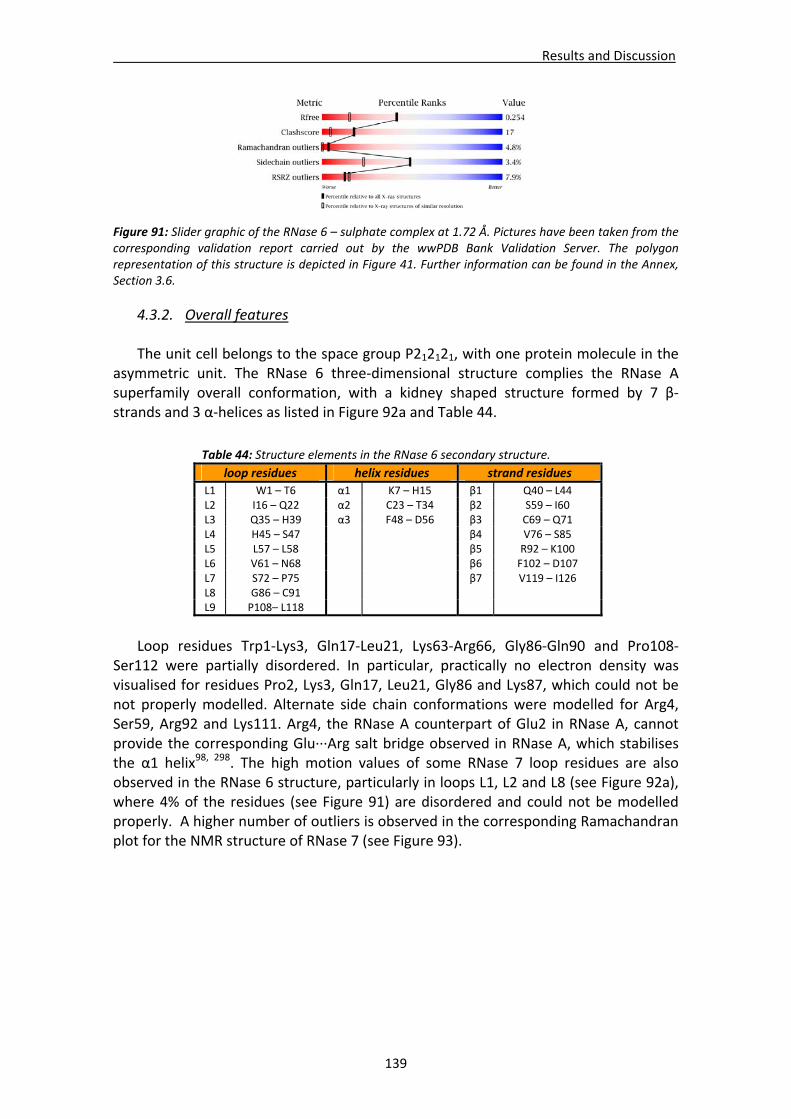
Results and Discussion
139
Figure 91: Slider graphic of the RNase 6 – sulphate complex at 1.72 Å. Pictures have been taken from the corresponding validation report carried out by the wwPDB Bank Validation Server. The polygon representation of this structure is depicted in Figure 41. Further information can be found in the Annex, Section 3.6.
4.3.2. Overall features The unit cell belongs to the space group P212121, with one protein molecule in the
asymmetric unit. The RNase 6 three‐dimensional structure complies the RNase A superfamily overall conformation, with a kidney shaped structure formed by 7 β‐strands and 3 α‐helices as listed in Figure 92a and Table 44.
Loop residues Trp1‐Lys3, Gln17‐Leu21, Lys63‐Arg66, Gly86‐Gln90 and Pro108‐
Ser112 were partially disordered. In particular, practically no electron density was visualised for residues Pro2, Lys3, Gln17, Leu21, Gly86 and Lys87, which could not be not properly modelled. Alternate side chain conformations were modelled for Arg4, Ser59, Arg92 and Lys111. Arg4, the RNase A counterpart of Glu2 in RNase A, cannot provide the corresponding Glu∙∙∙Arg salt bridge observed in RNase A, which stabilises the α1 helix98, 298. The high motion values of some RNase 7 loop residues are also observed in the RNase 6 structure, particularly in loops L1, L2 and L8 (see Figure 92a), where 4% of the residues (see Figure 91) are disordered and could not be modelled properly. A higher number of outliers is observed in the corresponding Ramachandran plot for the NMR structure of RNase 7 (see Figure 93).
Table 44: Structure elements in the RNase 6 secondary structure.
loop residues helix residues strand residues
L1 W1 – T6 α1 K7 – H15 β1 Q40 – L44 L2 I16 – Q22 α2 C23 – T34 β2 S59 – I60 L3 Q35 – H39 α3 F48 – D56 β3 C69 – Q71 L4 H45 – S47 β4 V76 – S85 L5 L57 – L58 β5 R92 – K100 L6 V61 – N68 β6 F102 – D107 L7 S72 – P75 β7 V119 – I126 L8 G86 – C91 L9 P108– L118
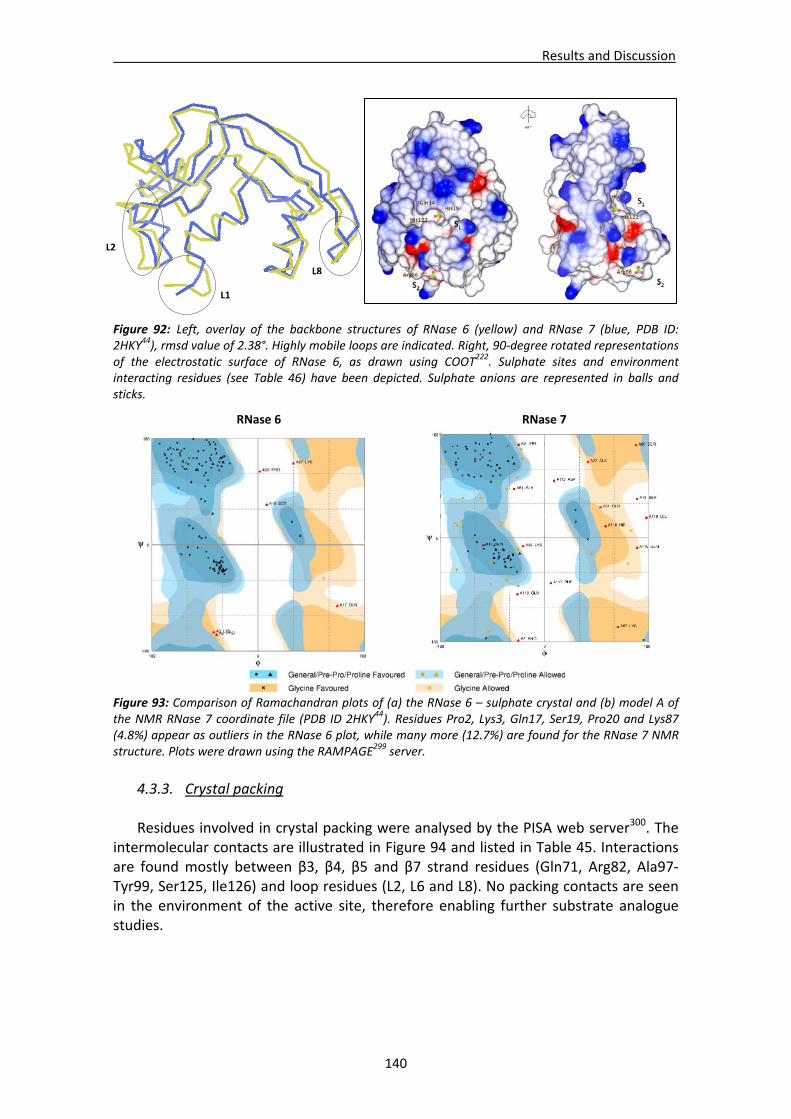
Results and Discussion
140
Figure 92: Left, overlay of the backbone structures of RNase 6 (yellow) and RNase 7 (blue, PDB ID: 2HKY44), rmsd value of 2.38°. Highly mobile loops are indicated. Right, 90‐degree rotated representations of the electrostatic surface of RNase 6, as drawn using COOT222. Sulphate sites and environment interacting residues (see Table 46) have been depicted. Sulphate anions are represented in balls and sticks.
Figure 93: Comparison of Ramachandran plots of (a) the RNase 6 – sulphate crystal and (b) model A of the NMR RNase 7 coordinate file (PDB ID 2HKY44). Residues Pro2, Lys3, Gln17, Ser19, Pro20 and Lys87 (4.8%) appear as outliers in the RNase 6 plot, while many more (12.7%) are found for the RNase 7 NMR structure. Plots were drawn using the RAMPAGE299 server.
4.3.3. Crystal packing Residues involved in crystal packing were analysed by the PISA web server300. The
intermolecular contacts are illustrated in Figure 94 and listed in Table 45. Interactions are found mostly between β3, β4, β5 and β7 strand residues (Gln71, Arg82, Ala97‐Tyr99, Ser125, Ile126) and loop residues (L2, L6 and L8). No packing contacts are seen in the environment of the active site, therefore enabling further substrate analogue studies.
L8
L2
L1
RNase 6 RNase 7
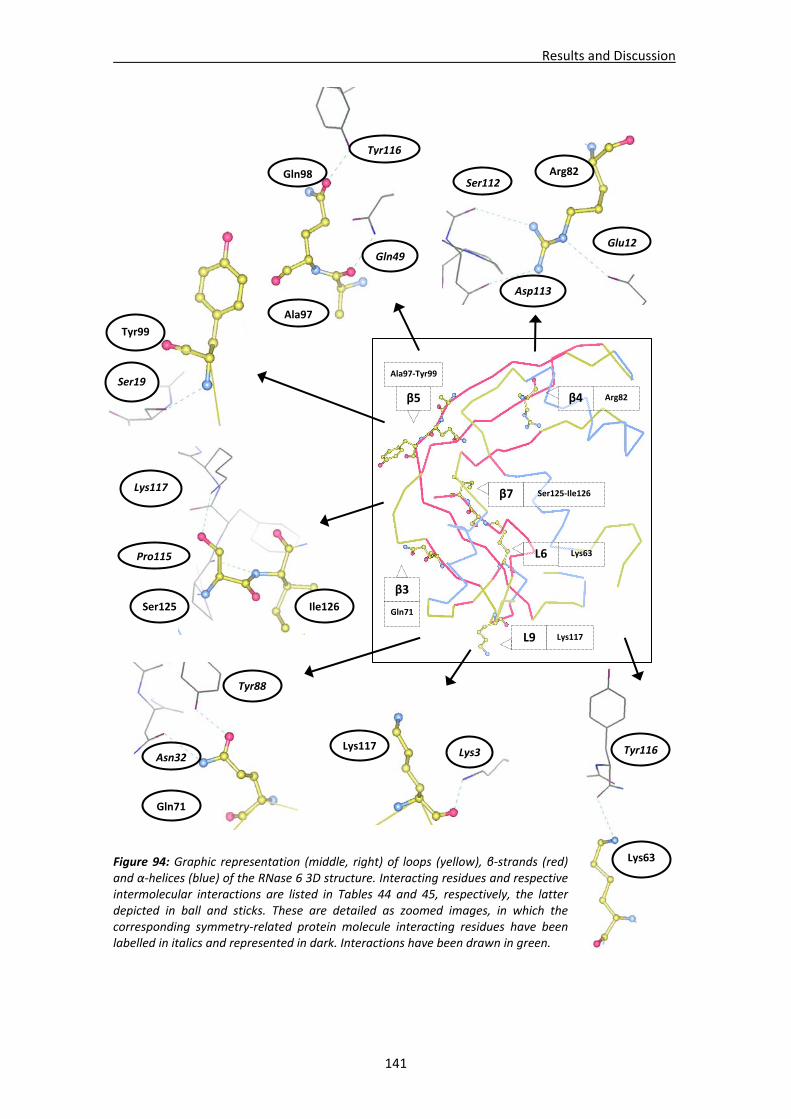
Results and Discussion
141
β5
Ala97‐Tyr99
β4 Arg82
β3
Gln71
β7 Ser125‐Ile126
L9 Lys117
L6 Lys63
Tyr116
Lys63
Gln71
Asn32
Tyr88
Ser19
Tyr99
Arg82
Glu12
Ser112
Asp113
Lys117Lys3
Ile126Ser125
Lys117
Pro115
Gln49
Ala97
Gln98
Tyr116
Figure 94: Graphic representation (middle, right) of loops (yellow), β‐strands (red) and α‐helices (blue) of the RNase 6 3D structure. Interacting residues and respective intermolecular interactions are listed in Tables 44 and 45, respectively, the latter depicted in ball and sticks. These are detailed as zoomed images, in which the corresponding symmetry‐related protein molecule interacting residues have been labelled in italics and represented in dark. Interactions have been drawn in green.
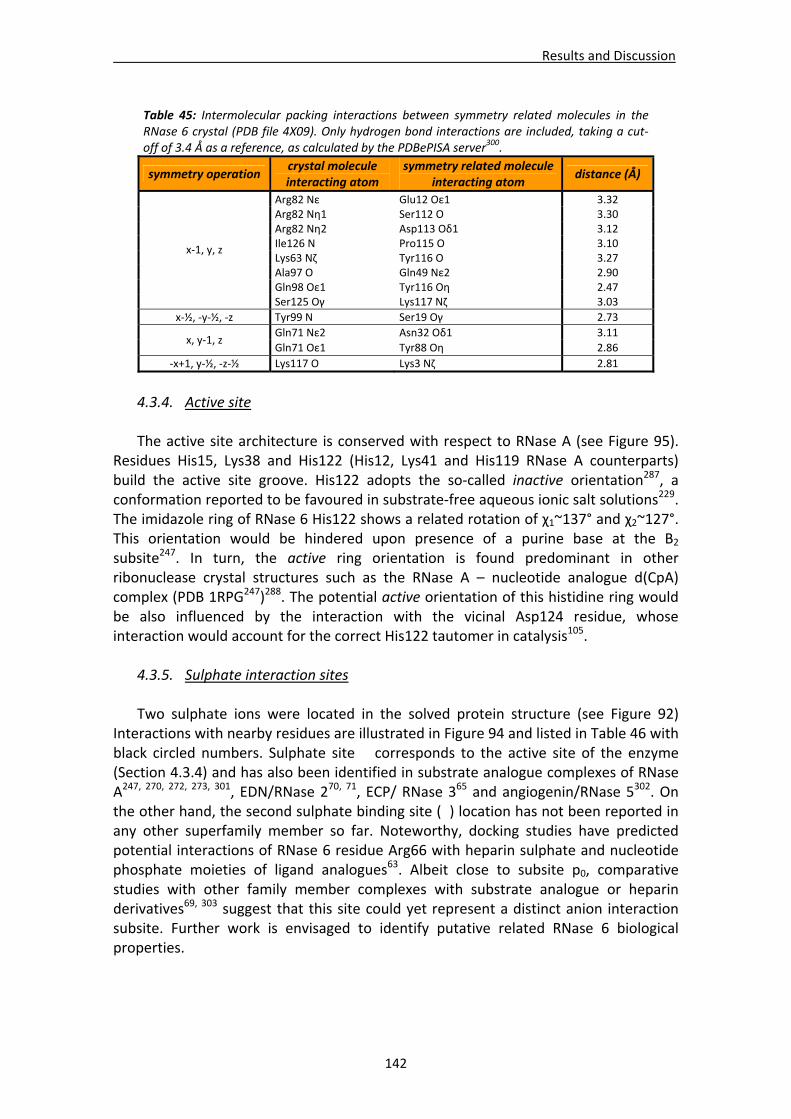
Results and Discussion
142
4.3.4. Active site
The active site architecture is conserved with respect to RNase A (see Figure 95).
Residues His15, Lys38 and His122 (His12, Lys41 and His119 RNase A counterparts) build the active site groove. His122 adopts the so‐called inactive orientation287, a conformation reported to be favoured in substrate‐free aqueous ionic salt solutions229. The imidazole ring of RNase 6 His122 shows a related rotation of χ1~137° and χ2~127°. This orientation would be hindered upon presence of a purine base at the B2 subsite247. In turn, the active ring orientation is found predominant in other ribonuclease crystal structures such as the RNase A – nucleotide analogue d(CpA) complex (PDB 1RPG247)288. The potential active orientation of this histidine ring would be also influenced by the interaction with the vicinal Asp124 residue, whose interaction would account for the correct His122 tautomer in catalysis105.
4.3.5. Sulphate interaction sites
Two sulphate ions were located in the solved protein structure (see Figure 92)
Interactions with nearby residues are illustrated in Figure 94 and listed in Table 46 with black circled numbers. Sulphate site � corresponds to the active site of the enzyme (Section 4.3.4) and has also been identified in substrate analogue complexes of RNase A247, 270, 272, 273, 301, EDN/RNase 270, 71, ECP/ RNase 365 and angiogenin/RNase 5302. On the other hand, the second sulphate binding site (�) location has not been reported in any other superfamily member so far. Noteworthy, docking studies have predicted potential interactions of RNase 6 residue Arg66 with heparin sulphate and nucleotide phosphate moieties of ligand analogues63. Albeit close to subsite p0, comparative studies with other family member complexes with substrate analogue or heparin derivatives69, 303 suggest that this site could yet represent a distinct anion interaction subsite. Further work is envisaged to identify putative related RNase 6 biological properties.
Table 45: Intermolecular packing interactions between symmetry related molecules in the RNase 6 crystal (PDB file 4X09). Only hydrogen bond interactions are included, taking a cut‐off of 3.4 Å as a reference, as calculated by the PDBePISA server300.
symmetry operation crystal molecule interacting atom
symmetry related molecule interacting atom
distance (Å)
Arg82 Nε Glu12 Oε1 3.32 Arg82 Nη1 Ser112 O 3.30 Arg82 Nη2 Asp113 Oδ1 3.12 Ile126 N Pro115 O 3.10 Lys63 Nζ Tyr116 O 3.27 Ala97 O Gln49 Nε2 2.90 Gln98 Oε1 Tyr116 Oη 2.47
x‐1, y, z
Ser125 Oγ Lys117 Nζ 3.03
x‐½, ‐y‐½, ‐z Tyr99 N Ser19 Oγ 2.73
Gln71 Nε2 Asn32 Oδ1 3.11 x, y‐1, z
Gln71 Oε1 Tyr88 Oη 2.86
‐x+1, y‐½, ‐z‐½ Lys117 O Lys3 Nζ 2.81
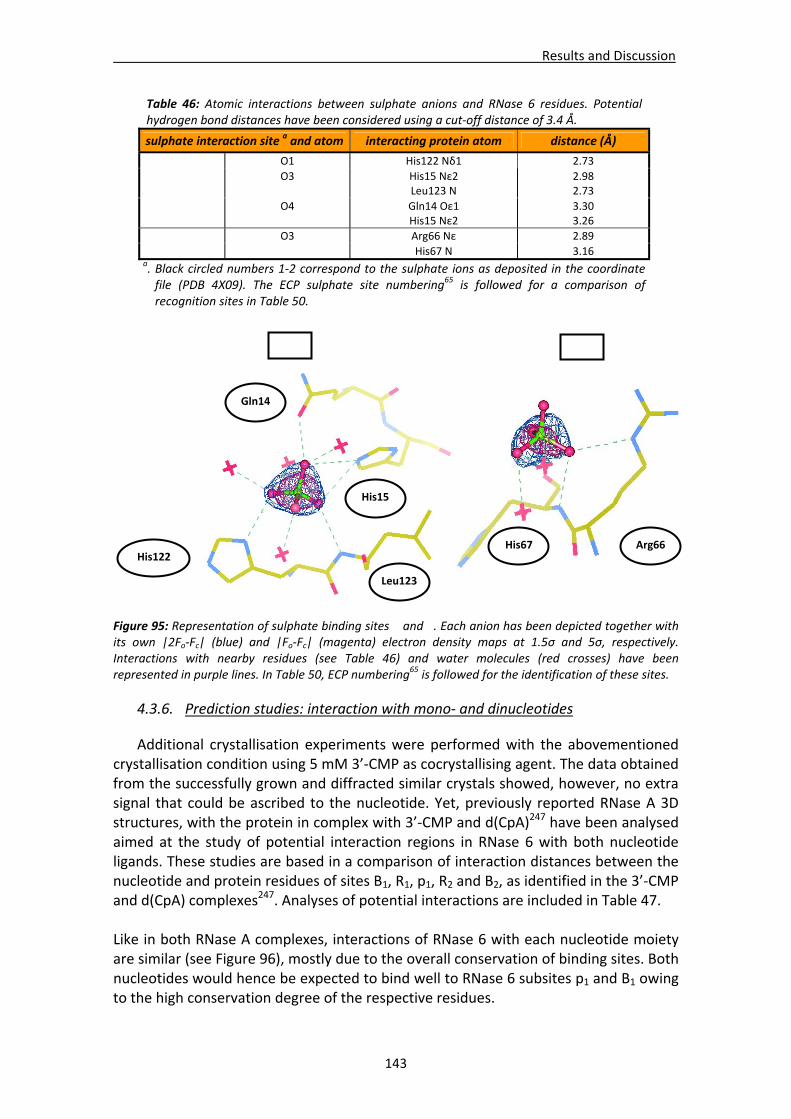
Results and Discussion
143
Figure 95: Representation of sulphate binding sites � and �. Each anion has been depicted together with its own |2Fo‐Fc| (blue) and |Fo‐Fc| (magenta) electron density maps at 1.5σ and 5σ, respectively. Interactions with nearby residues (see Table 46) and water molecules (red crosses) have been represented in purple lines. In Table 50, ECP numbering65 is followed for the identification of these sites.
4.3.6. Prediction studies: interaction with mono‐ and dinucleotides
Additional crystallisation experiments were performed with the abovementioned crystallisation condition using 5 mM 3’‐CMP as cocrystallising agent. The data obtained from the successfully grown and diffracted similar crystals showed, however, no extra signal that could be ascribed to the nucleotide. Yet, previously reported RNase A 3D structures, with the protein in complex with 3’‐CMP and d(CpA)247 have been analysed aimed at the study of potential interaction regions in RNase 6 with both nucleotide ligands. These studies are based in a comparison of interaction distances between the nucleotide and protein residues of sites B1, R1, p1, R2 and B2, as identified in the 3’‐CMP and d(CpA) complexes247. Analyses of potential interactions are included in Table 47.
Like in both RNase A complexes, interactions of RNase 6 with each nucleotide moiety are similar (see Figure 96), mostly due to the overall conservation of binding sites. Both nucleotides would hence be expected to bind well to RNase 6 subsites p1 and B1 owing to the high conservation degree of the respective residues.
Table 46: Atomic interactions between sulphate anions and RNase 6 residues. Potential hydrogen bond distances have been considered using a cut‐off distance of 3.4 Å.
sulphate interaction site a and atom interacting protein atom distance (Å)
O1 His122 Nδ1 2.73
O3
His15 Nε2 Leu123 N
2.98 2.73 �
O4
Gln14 Oε1 His15 Nε2
3.30 3.26
O3 Arg66 Nε 2.89 �
His67 N 3.16 a. Black circled numbers 1‐2 correspond to the sulphate ions as deposited in the coordinate file (PDB 4X09). The ECP sulphate site numbering65 is followed for a comparison of recognition sites in Table 50.
His122
His15
Gln14
Leu123
�
Arg66His67
�
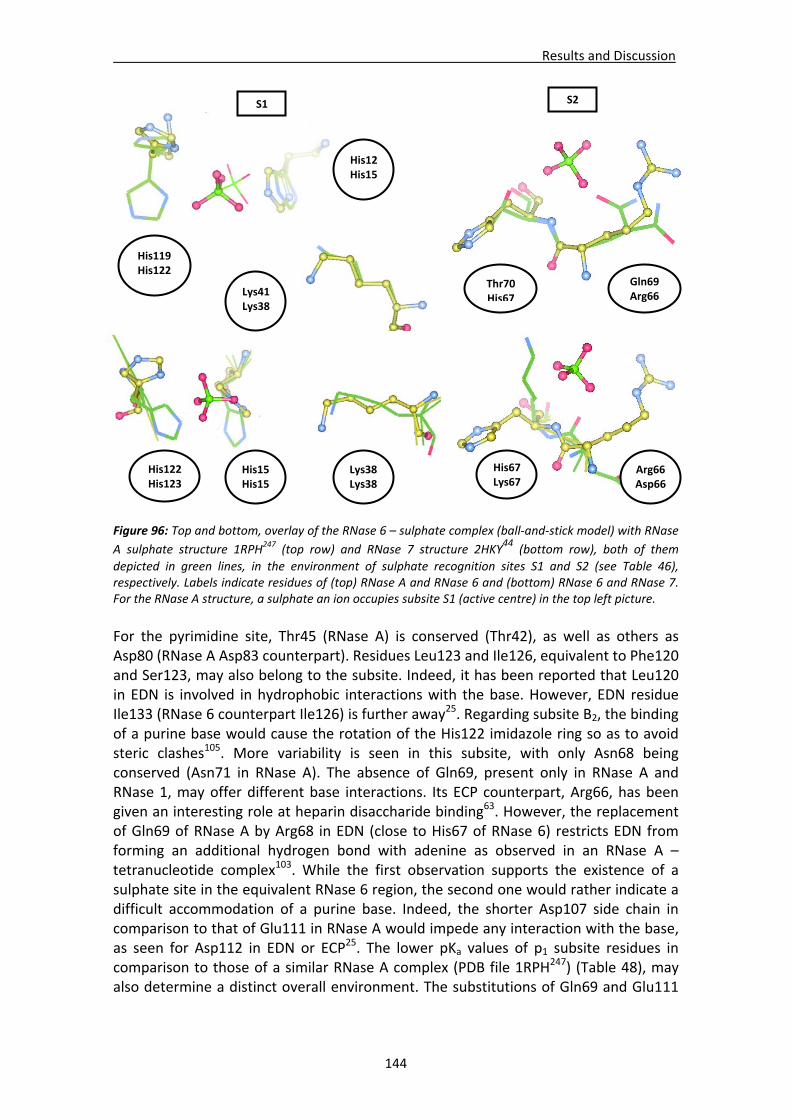
Results and Discussion
144
Figure 96: Top and bottom, overlay of the RNase 6 – sulphate complex (ball‐and‐stick model) with RNase
A sulphate structure 1RPH247 (top row) and RNase 7 structure 2HKY44 (bottom row), both of them
depicted in green lines, in the environment of sulphate recognition sites S1 and S2 (see Table 46), respectively. Labels indicate residues of (top) RNase A and RNase 6 and (bottom) RNase 6 and RNase 7. For the RNase A structure, a sulphate an ion occupies subsite S1 (active centre) in the top left picture.
For the pyrimidine site, Thr45 (RNase A) is conserved (Thr42), as well as others as Asp80 (RNase A Asp83 counterpart). Residues Leu123 and Ile126, equivalent to Phe120 and Ser123, may also belong to the subsite. Indeed, it has been reported that Leu120 in EDN is involved in hydrophobic interactions with the base. However, EDN residue Ile133 (RNase 6 counterpart Ile126) is further away25. Regarding subsite B2, the binding of a purine base would cause the rotation of the His122 imidazole ring so as to avoid steric clashes105. More variability is seen in this subsite, with only Asn68 being conserved (Asn71 in RNase A). The absence of Gln69, present only in RNase A and RNase 1, may offer different base interactions. Its ECP counterpart, Arg66, has been given an interesting role at heparin disaccharide binding63. However, the replacement of Gln69 of RNase A by Arg68 in EDN (close to His67 of RNase 6) restricts EDN from forming an additional hydrogen bond with adenine as observed in an RNase A – tetranucleotide complex103. While the first observation supports the existence of a sulphate site in the equivalent RNase 6 region, the second one would rather indicate a difficult accommodation of a purine base. Indeed, the shorter Asp107 side chain in comparison to that of Glu111 in RNase A would impede any interaction with the base, as seen for Asp112 in EDN or ECP25. The lower pKa values of p1 subsite residues in comparison to those of a similar RNase A complex (PDB file 1RPH247) (Table 48), may also determine a distinct overall environment. The substitutions of Gln69 and Glu111
His119 His122
Gln69 Arg66
Thr70 His67
His122 His123
His15 His15
Lys38 Lys38
Arg66Asp66
His67 Lys67
S1
His12His15
Lys41 Lys38
S2
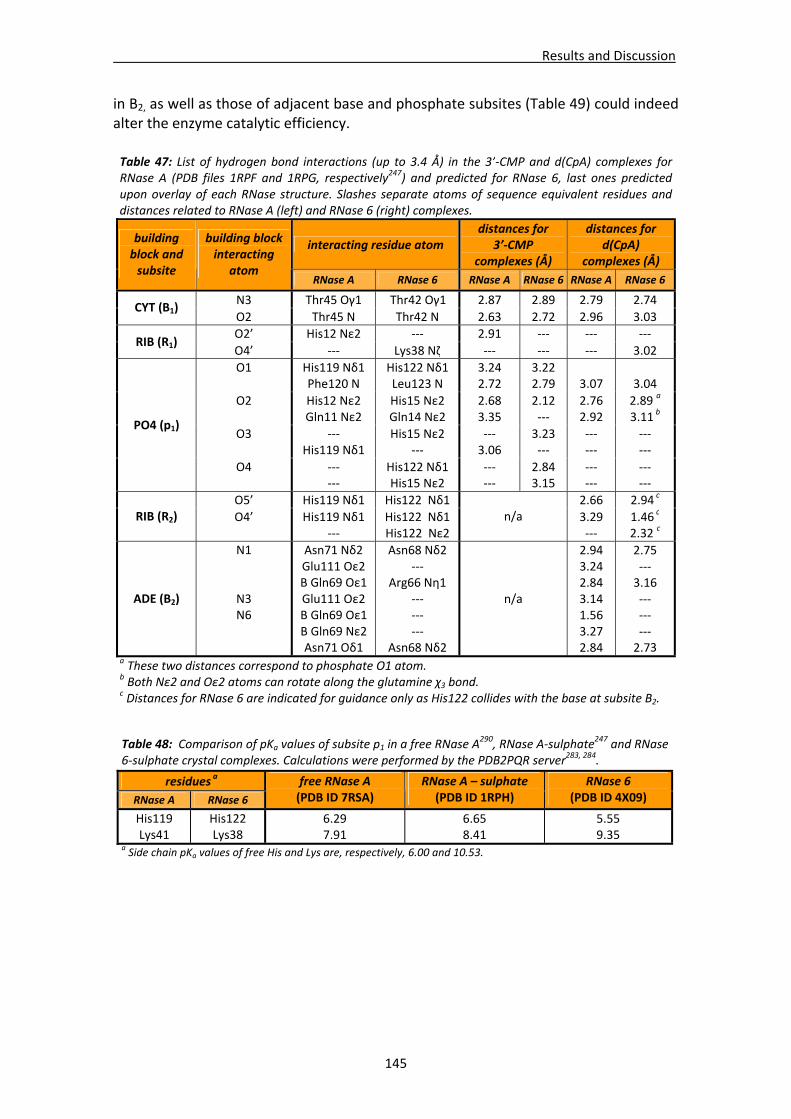
Results and Discussion
145
in B2, as well as those of adjacent base and phosphate subsites (Table 49) could indeed alter the enzyme catalytic efficiency.
Table 47: List of hydrogen bond interactions (up to 3.4 Å) in the 3’‐CMP and d(CpA) complexes for RNase A (PDB files 1RPF and 1RPG, respectively247) and predicted for RNase 6, last ones predicted upon overlay of each RNase structure. Slashes separate atoms of sequence equivalent residues and distances related to RNase A (left) and RNase 6 (right) complexes.
interacting residue atom distances for
3’‐CMP complexes (Å)
distances for d(CpA)
complexes (Å)
building block and subsite
building block interacting
atom RNase A RNase 6 RNase A RNase 6 RNase A RNase 6
N3 Thr45 Oγ1 Thr42 Oγ1 2.87 2.89 2.79 2.74 CYT (B1)
O2 Thr45 N Thr42 N 2.63 2.72 2.96 3.03
O2’ His12 Nε2 ‐‐‐ 2.91 ‐‐‐ ‐‐‐ ‐‐‐ RIB (R1)
O4’ ‐‐‐ Lys38 Nζ ‐‐‐ ‐‐‐ ‐‐‐ 3.02
O1 His119 Nδ1 Phe120 N
His122 Nδ1 Leu123 N
3.24 2.72
3.22 2.79
3.07
3.04
O2 His12 Nε2 Gln11 Nε2
His15 Nε2 Gln14 Nε2
2.68 3.35
2.12 ‐‐‐
2.76 2.92
2.89 a
3.11 b
O3
‐‐‐ His119 Nδ1
His15 Nε2 ‐‐‐
‐‐‐ 3.06
3.23 ‐‐‐
‐‐‐ ‐‐‐
‐‐‐ ‐‐‐
PO4 (p1)
O4 ‐‐‐ ‐‐‐
His122 Nδ1 His15 Nε2
‐‐‐‐‐‐
2.843.15
‐‐‐ ‐‐‐
‐‐‐ ‐‐‐
O5’ His119 Nδ1 His122 Nδ1 2.66 2.94 c RIB (R2) O4’ His119 Nδ1
‐‐‐ His122 Nδ1 His122 Nε2
n/a 3.29
‐‐‐ 1.46 c
2.32 c
ADE (B2)
N1
N3 N6
Asn71 Nδ2 Glu111 Oε2 B Gln69 Oε1 Glu111 Oε2 B Gln69 Oε1 B Gln69 Nε2 Asn71 Oδ1
Asn68 Nδ2 ‐‐‐
Arg66 Nη1 ‐‐‐ ‐‐‐ ‐‐‐
Asn68 Nδ2
n/a
2.94 3.24 2.84 3.14 1.56 3.27 2.84
2.75 ‐‐‐ 3.16 ‐‐‐ ‐‐‐ ‐‐‐ 2.73
a These two distances correspond to phosphate O1 atom. b Both Nε2 and Oε2 atoms can rotate along the glutamine χ3 bond. c Distances for RNase 6 are indicated for guidance only as His122 collides with the base at subsite B2.
Table 48: Comparison of pKa values of subsite p1 in a free RNase A290, RNase A‐sulphate247 and RNase
6‐sulphate crystal complexes. Calculations were performed by the PDB2PQR server283, 284.
residues a
RNase A RNase 6
free RNase A (PDB ID 7RSA)
RNase A – sulphate (PDB ID 1RPH)
RNase 6 (PDB ID 4X09)
His119 Lys41
His122 Lys38
6.29 7.91
6.65 8.41
5.55 9.35
a Side chain pKa values of free His and Lys are, respectively, 6.00 and 10.53.
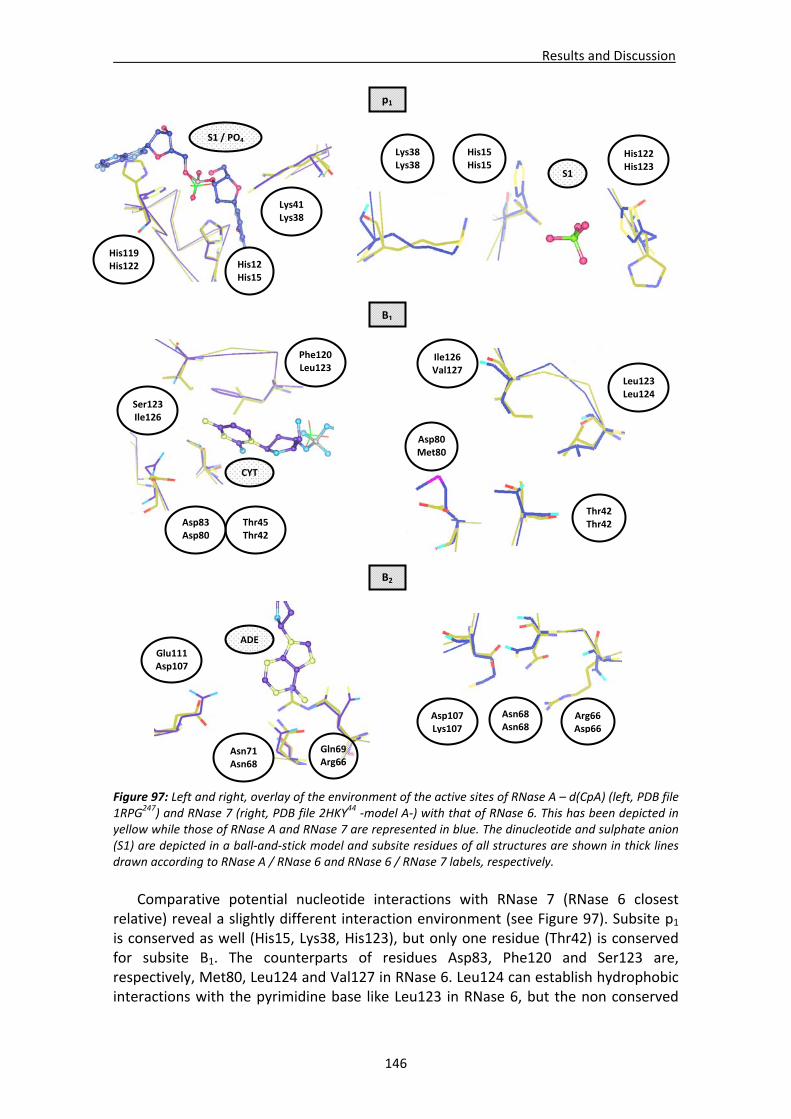
Results and Discussion
146
Figure 97: Left and right, overlay of the environment of the active sites of RNase A – d(CpA) (left, PDB file 1RPG247) and RNase 7 (right, PDB file 2HKY44 ‐model A‐) with that of RNase 6. This has been depicted in yellow while those of RNase A and RNase 7 are represented in blue. The dinucleotide and sulphate anion (S1) are depicted in a ball‐and‐stick model and subsite residues of all structures are shown in thick lines drawn according to RNase A / RNase 6 and RNase 6 / RNase 7 labels, respectively.
Comparative potential nucleotide interactions with RNase 7 (RNase 6 closest
relative) reveal a slightly different interaction environment (see Figure 97). Subsite p1 is conserved as well (His15, Lys38, His123), but only one residue (Thr42) is conserved for subsite B1. The counterparts of residues Asp83, Phe120 and Ser123 are, respectively, Met80, Leu124 and Val127 in RNase 6. Leu124 can establish hydrophobic interactions with the pyrimidine base like Leu123 in RNase 6, but the non conserved
p1
His119 His122 His12
His15
Lys41 Lys38
S1 / PO4
S1
His122 His123
His15His15
Lys38Lys38
Phe120Leu123
CYT
Ser123 Ile126
Thr45 Thr42
Asp83 Asp80
B1
Leu123Leu124
Thr42 Thr42
Asp80Met80
Ile126Val127
B2
ADE
Glu111 Asp107
Asn71 Asn68
Gln69Arg66
Asn68Asn68
Arg66 Asp66
Asp107Lys107
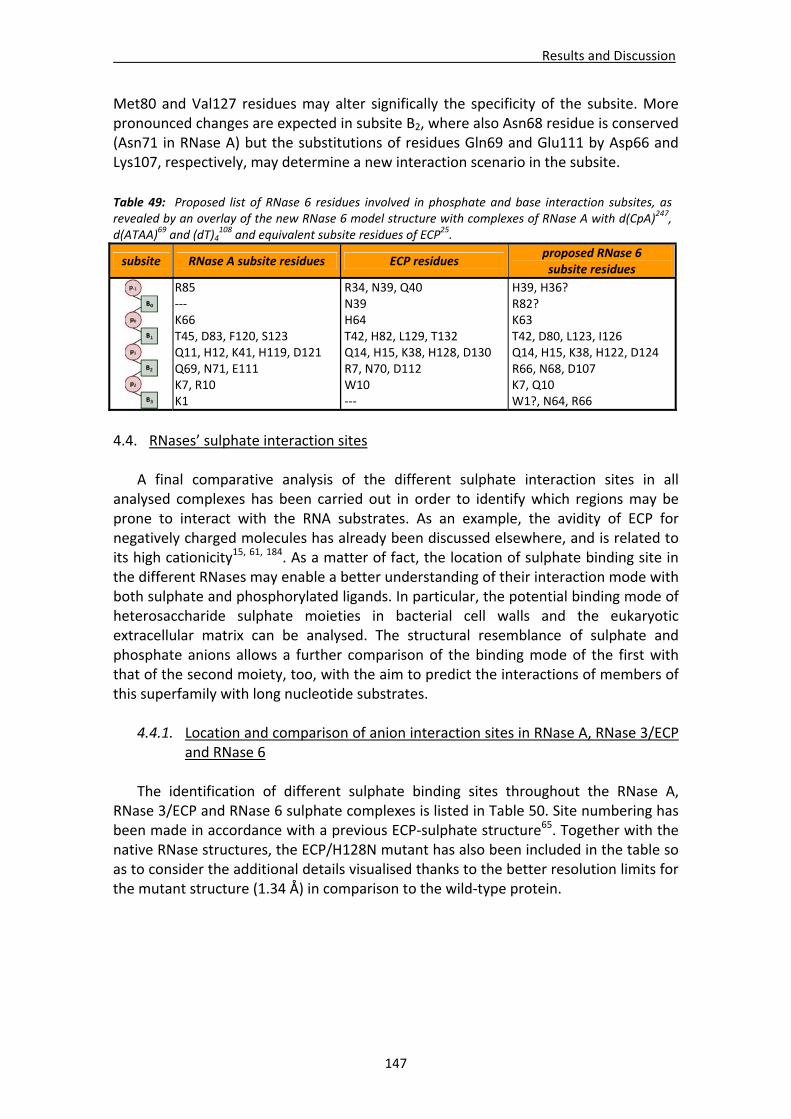
Results and Discussion
147
Met80 and Val127 residues may alter significally the specificity of the subsite. More pronounced changes are expected in subsite B2, where also Asn68 residue is conserved (Asn71 in RNase A) but the substitutions of residues Gln69 and Glu111 by Asp66 and Lys107, respectively, may determine a new interaction scenario in the subsite.
4.4. RNases’ sulphate interaction sites
A final comparative analysis of the different sulphate interaction sites in all analysed complexes has been carried out in order to identify which regions may be prone to interact with the RNA substrates. As an example, the avidity of ECP for negatively charged molecules has already been discussed elsewhere, and is related to its high cationicity15, 61, 184. As a matter of fact, the location of sulphate binding site in the different RNases may enable a better understanding of their interaction mode with both sulphate and phosphorylated ligands. In particular, the potential binding mode of heterosaccharide sulphate moieties in bacterial cell walls and the eukaryotic extracellular matrix can be analysed. The structural resemblance of sulphate and phosphate anions allows a further comparison of the binding mode of the first with that of the second moiety, too, with the aim to predict the interactions of members of this superfamily with long nucleotide substrates.
4.4.1. Location and comparison of anion interaction sites in RNase A, RNase 3/ECP and RNase 6
The identification of different sulphate binding sites throughout the RNase A,
RNase 3/ECP and RNase 6 sulphate complexes is listed in Table 50. Site numbering has been made in accordance with a previous ECP‐sulphate structure65. Together with the native RNase structures, the ECP/H128N mutant has also been included in the table so as to consider the additional details visualised thanks to the better resolution limits for the mutant structure (1.34 Å) in comparison to the wild‐type protein.
Table 49: Proposed list of RNase 6 residues involved in phosphate and base interaction subsites, as revealed by an overlay of the new RNase 6 model structure with complexes of RNase A with d(CpA)247, d(ATAA)69 and (dT)4
108 and equivalent subsite residues of ECP25.
subsite RNase A subsite residues ECP residues proposed RNase 6 subsite residues
R85 ‐‐‐ K66 T45, D83, F120, S123 Q11, H12, K41, H119, D121 Q69, N71, E111 K7, R10 K1
R34, N39, Q40 N39 H64 T42, H82, L129, T132 Q14, H15, K38, H128, D130 R7, N70, D112 W10 ‐‐‐
H39, H36? R82? K63 T42, D80, L123, I126 Q14, H15, K38, H122, D124 R66, N68, D107 K7, Q10 W1?, N64, R66
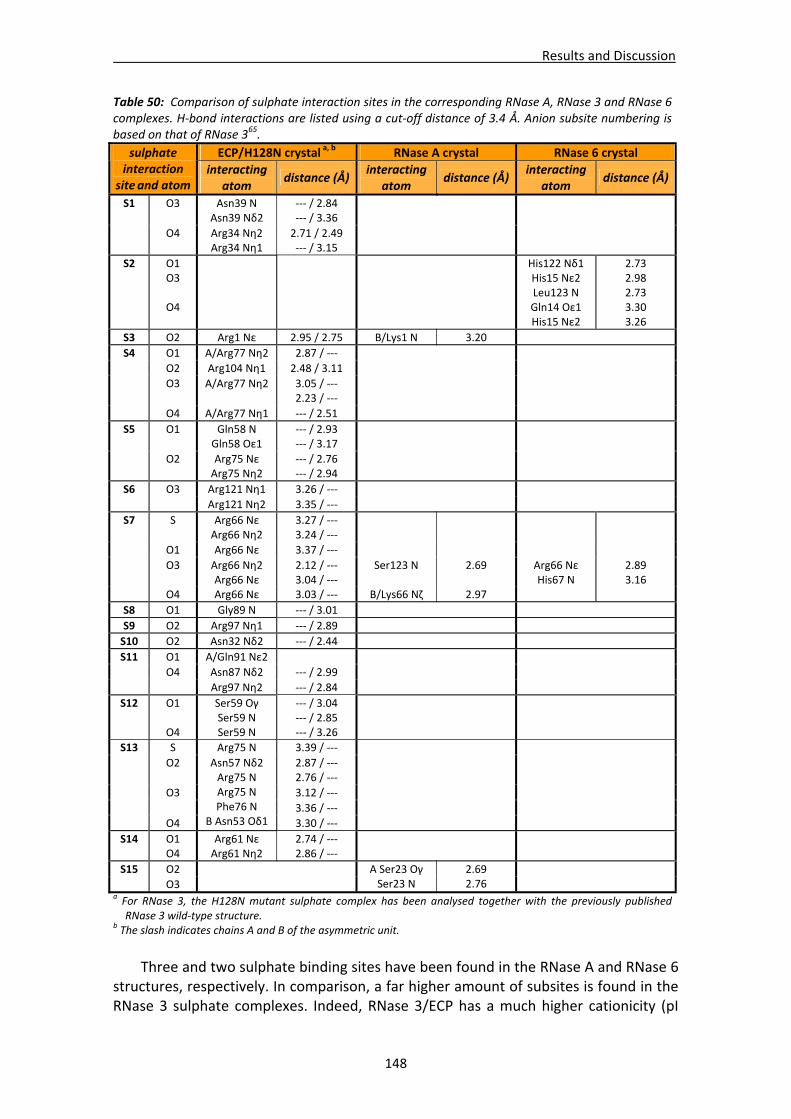
Results and Discussion
148
Three and two sulphate binding sites have been found in the RNase A and RNase 6
structures, respectively. In comparison, a far higher amount of subsites is found in the RNase 3 sulphate complexes. Indeed, RNase 3/ECP has a much higher cationicity (pI
Table 50: Comparison of sulphate interaction sites in the corresponding RNase A, RNase 3 and RNase 6 complexes. H‐bond interactions are listed using a cut‐off distance of 3.4 Å. Anion subsite numbering is based on that of RNase 365.
ECP/H128N crystal a, b RNase A crystal RNase 6 crystal sulphate interaction
site and atom interacting
atom distance (Å)
interacting atom
distance (Å)interacting
atom distance (Å)
S1 O3 Asn39 N Asn39 Nδ2
‐‐‐ / 2.84 ‐‐‐ / 3.36
O4 Arg34 Nη2 Arg34 Nη1
2.71 / 2.49 ‐‐‐ / 3.15
S2 O1 O3
O4
His122 Nδ1 His15 Nε2 Leu123 N Gln14 Oε1 His15 Nε2
2.73 2.98 2.73 3.30 3.26
S3 O2 Arg1 Nε 2.95 / 2.75 B/Lys1 N 3.20
S4 O1 A/Arg77 Nη2 2.87 / ‐‐‐
O2 Arg104 Nη1 2.48 / 3.11
O3
A/Arg77 Nη2
3.05 / ‐‐‐ 2.23 / ‐‐‐
O4 A/Arg77 Nη1 ‐‐‐ / 2.51
S5 O1 Gln58 N Gln58 Oε1
‐‐‐ / 2.93 ‐‐‐ / 3.17
O2 Arg75 Nε Arg75 Nη2
‐‐‐ / 2.76 ‐‐‐ / 2.94
S6 O3 Arg121 Nη1 3.26 / ‐‐‐
Arg121 Nη2 3.35 / ‐‐‐
S
Arg66 Nε Arg66 Nη2
3.27 / ‐‐‐ 3.24 / ‐‐‐
O1 Arg66 Nε 3.37 / ‐‐‐
S7
O3
Arg66 Nη2 Arg66 Nε
2.12 / ‐‐‐ 3.04 / ‐‐‐
Ser123 N
2.69
Arg66 Nε His67 N
2.89 3.16
O4 Arg66 Nε 3.03 / ‐‐‐ B/Lys66 Nζ 2.97
S8 O1 Gly89 N ‐‐‐ / 3.01
S9 O2 Arg97 Nη1 ‐‐‐ / 2.89
S10 O2 Asn32 Nδ2 ‐‐‐ / 2.44
S11 O1 A/Gln91 Nε2
O4 Asn87 Nδ2 ‐‐‐ / 2.99
Arg97 Nη2 ‐‐‐ / 2.84
S12 O1
O4
Ser59 Oγ Ser59 N Ser59 N
‐‐‐ / 3.04 ‐‐‐ / 2.85 ‐‐‐ / 3.26
S Arg75 N 3.39 / ‐‐‐
O2 2.87 / ‐‐‐ 2.76 / ‐‐‐
O3 3.12 / ‐‐‐
3.36 / ‐‐‐
S13
O4
Asn57 Nδ2 Arg75 N Arg75 N Phe76 N
B Asn53 Oδ1 3.30 / ‐‐‐
S14 O1 O4
Arg61 Nε Arg61 Nη2
2.74 / ‐‐‐ 2.86 / ‐‐‐
S15 O2
O3
A Ser23 Oγ Ser23 N
2.69 2.76
a For RNase 3, the H128N mutant sulphate complex has been analysed together with the previously published RNase 3 wild‐type structure.
b The slash indicates chains A and B of the asymmetric unit.
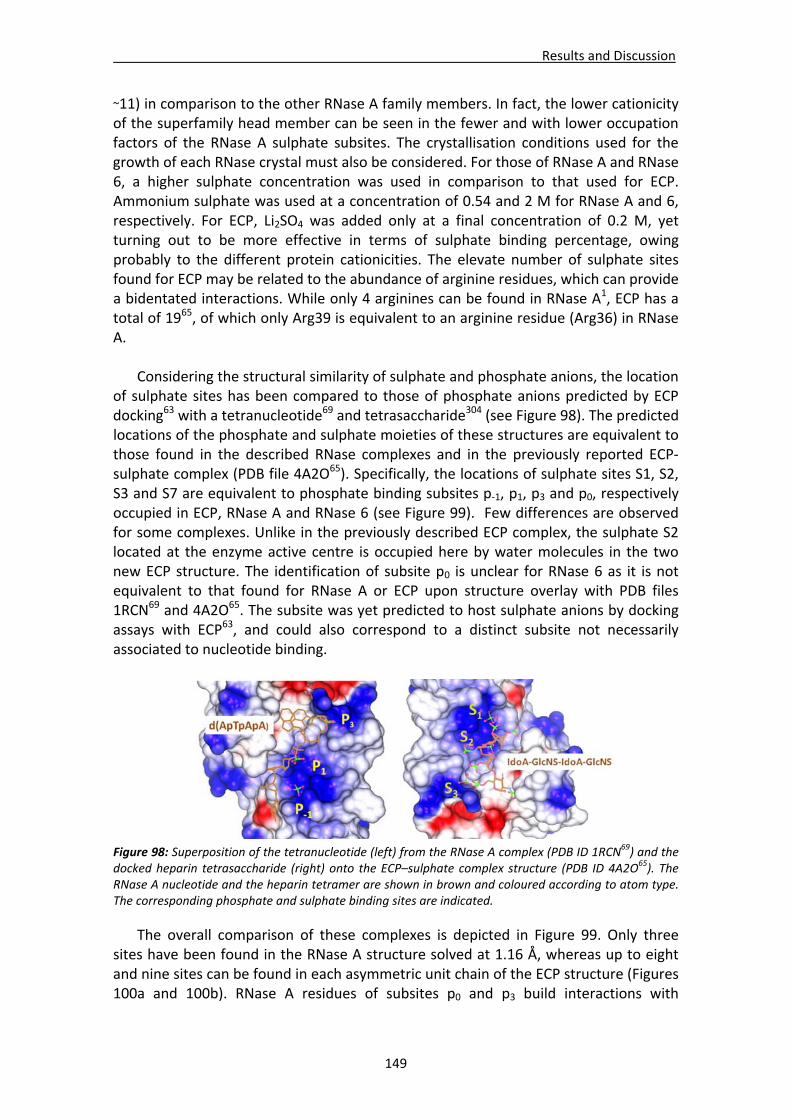
Results and Discussion
149
~11) in comparison to the other RNase A family members. In fact, the lower cationicity of the superfamily head member can be seen in the fewer and with lower occupation factors of the RNase A sulphate subsites. The crystallisation conditions used for the growth of each RNase crystal must also be considered. For those of RNase A and RNase 6, a higher sulphate concentration was used in comparison to that used for ECP. Ammonium sulphate was used at a concentration of 0.54 and 2 M for RNase A and 6, respectively. For ECP, Li2SO4 was added only at a final concentration of 0.2 M, yet turning out to be more effective in terms of sulphate binding percentage, owing probably to the different protein cationicities. The elevate number of sulphate sites found for ECP may be related to the abundance of arginine residues, which can provide a bidentated interactions. While only 4 arginines can be found in RNase A1, ECP has a total of 1965, of which only Arg39 is equivalent to an arginine residue (Arg36) in RNase A.
Considering the structural similarity of sulphate and phosphate anions, the location
of sulphate sites has been compared to those of phosphate anions predicted by ECP docking63 with a tetranucleotide69 and tetrasaccharide304 (see Figure 98). The predicted locations of the phosphate and sulphate moieties of these structures are equivalent to those found in the described RNase complexes and in the previously reported ECP‐sulphate complex (PDB file 4A2O65). Specifically, the locations of sulphate sites S1, S2, S3 and S7 are equivalent to phosphate binding subsites p‐1, p1, p3 and p0, respectively occupied in ECP, RNase A and RNase 6 (see Figure 99). Few differences are observed for some complexes. Unlike in the previously described ECP complex, the sulphate S2 located at the enzyme active centre is occupied here by water molecules in the two new ECP structure. The identification of subsite p0 is unclear for RNase 6 as it is not equivalent to that found for RNase A or ECP upon structure overlay with PDB files 1RCN69 and 4A2O65. The subsite was yet predicted to host sulphate anions by docking assays with ECP63, and could also correspond to a distinct subsite not necessarily associated to nucleotide binding.
Figure 98: Superposition of the tetranucleotide (left) from the RNase A complex (PDB ID 1RCN69) and the docked heparin tetrasaccharide (right) onto the ECP–sulphate complex structure (PDB ID 4A2O65). The RNase A nucleotide and the heparin tetramer are shown in brown and coloured according to atom type. The corresponding phosphate and sulphate binding sites are indicated.
The overall comparison of these complexes is depicted in Figure 99. Only three sites have been found in the RNase A structure solved at 1.16 Å, whereas up to eight and nine sites can be found in each asymmetric unit chain of the ECP structure (Figures 100a and 100b). RNase A residues of subsites p0 and p3 build interactions with
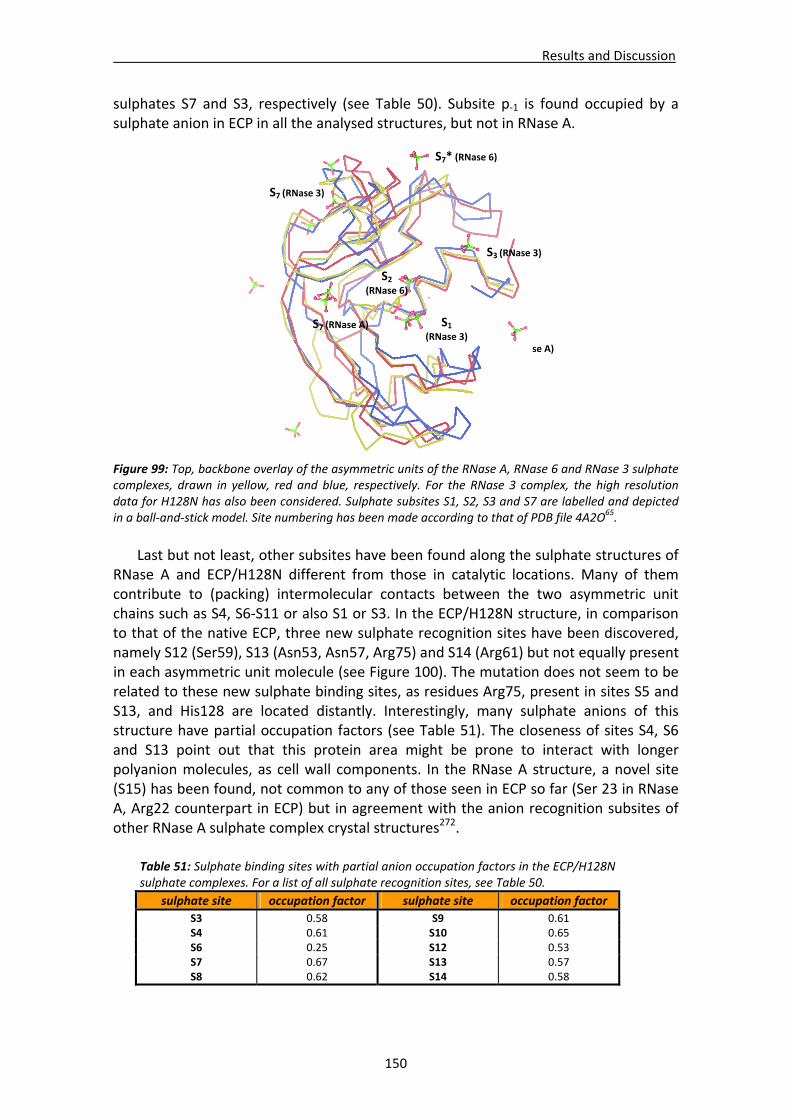
Results and Discussion
150
sulphates S7 and S3, respectively (see Table 50). Subsite p‐1 is found occupied by a sulphate anion in ECP in all the analysed structures, but not in RNase A.
Figure 99: Top, backbone overlay of the asymmetric units of the RNase A, RNase 6 and RNase 3 sulphate complexes, drawn in yellow, red and blue, respectively. For the RNase 3 complex, the high resolution data for H128N has also been considered. Sulphate subsites S1, S2, S3 and S7 are labelled and depicted in a ball‐and‐stick model. Site numbering has been made according to that of PDB file 4A2O65.
Last but not least, other subsites have been found along the sulphate structures of
RNase A and ECP/H128N different from those in catalytic locations. Many of them contribute to (packing) intermolecular contacts between the two asymmetric unit chains such as S4, S6‐S11 or also S1 or S3. In the ECP/H128N structure, in comparison to that of the native ECP, three new sulphate recognition sites have been discovered, namely S12 (Ser59), S13 (Asn53, Asn57, Arg75) and S14 (Arg61) but not equally present in each asymmetric unit molecule (see Figure 100). The mutation does not seem to be related to these new sulphate binding sites, as residues Arg75, present in sites S5 and S13, and His128 are located distantly. Interestingly, many sulphate anions of this structure have partial occupation factors (see Table 51). The closeness of sites S4, S6 and S13 point out that this protein area might be prone to interact with longer polyanion molecules, as cell wall components. In the RNase A structure, a novel site (S15) has been found, not common to any of those seen in ECP so far (Ser 23 in RNase A, Arg22 counterpart in ECP) but in agreement with the anion recognition subsites of other RNase A sulphate complex crystal structures272.
Table 51: Sulphate binding sites with partial anion occupation factors in the ECP/H128N sulphate complexes. For a list of all sulphate recognition sites, see Table 50.
sulphate site occupation factor sulphate site occupation factor
S3 0.58 S9 0.61 S4 0.61 S10 0.65 S6 0.25 S12 0.53 S7 0.67 S13 0.57 S8 0.62 S14 0.58
S3 (RNase A)
S7 (RNase 3)
S7* (RNase 6)
S1 (RNase 3)
S2 (RNase 6)
S3 (RNase 3)
S7 (RNase A)
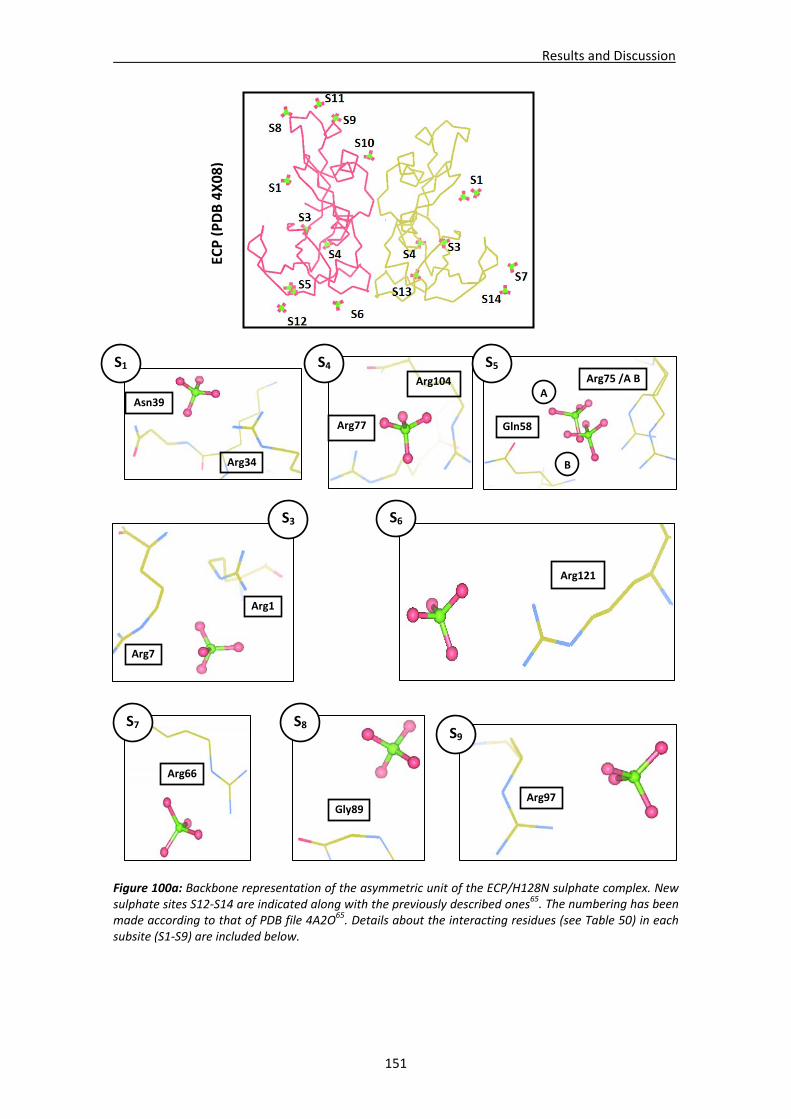
Results and Discussion
151
Figure 100a: Backbone representation of the asymmetric unit of the ECP/H128N sulphate complex. New sulphate sites S12‐S14 are indicated along with the previously described ones
65. The numbering has been made according to that of PDB file 4A2O65. Details about the interacting residues (see Table 50) in each subsite (S1‐S9) are included below.
ECP (PDB 4X08)
Arg34
Asn39
S1
Arg77
Arg104
S4 S5Arg75 /A B
Gln58
A
B
Arg66
S7
Gly89
S8
Arg97
S9
Arg7
Arg1
S3
Arg121
S6
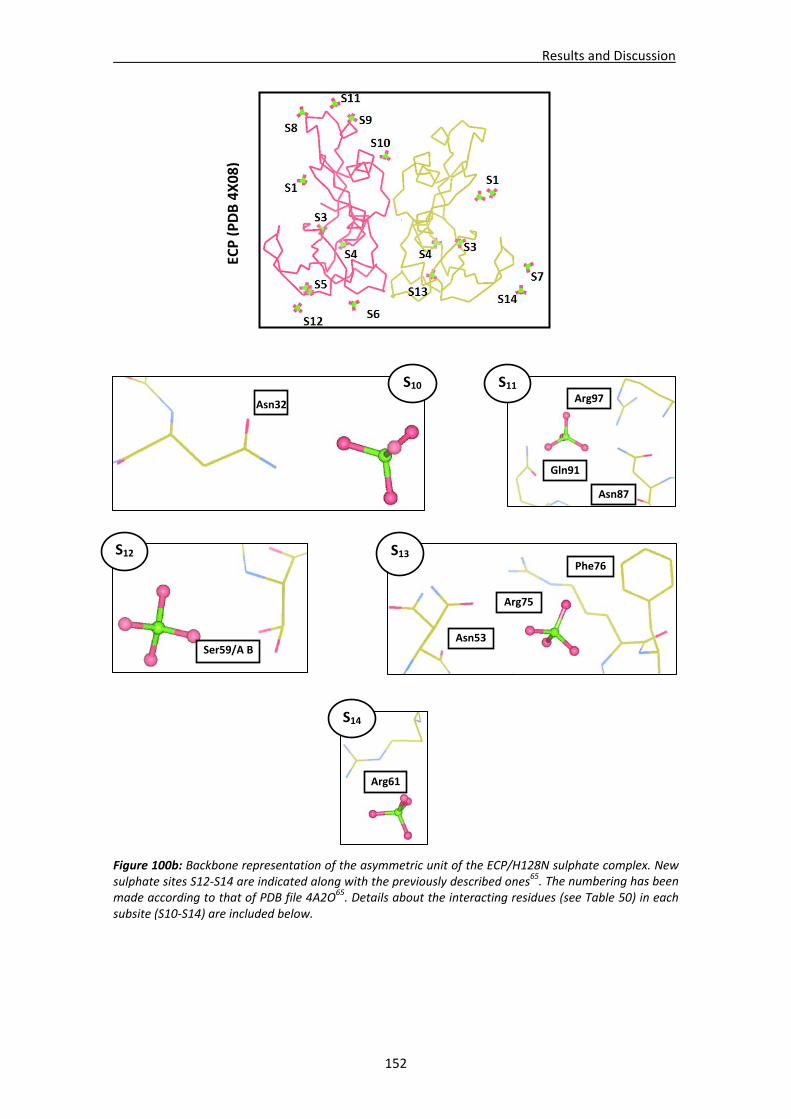
Results and Discussion
152
Figure 100b: Backbone representation of the asymmetric unit of the ECP/H128N sulphate complex. New sulphate sites S12‐S14 are indicated along with the previously described ones
65. The numbering has been made according to that of PDB file 4A2O65. Details about the interacting residues (see Table 50) in each subsite (S10‐S14) are included below.
S13
Asn53
Phe76
Arg75
Asn32
S10 S11Arg97
Asn87
Gln91
S12
Ser59/A B
S14
Arg61
ECP (PDB 4X08)
General discussion
153
GENERAL DISCUSSION
The first part of the work describes a statistical study carried out with various protein – nucleotide complexes with the aim to establish an overall RNase nucleotide binding architecture. Residue preferences and interactions at atomic detail were analysed. Cationic residues Arg, Lys and His are preferred for phosphate recognition, followed by Ser and Thr. Ribose moieties interact rather with anionic residues Glu and Asp. Finally, as a general rule, residues simultaneously providing a pair of hydrogen bonds (Asn, Gln, Asp, Glu, Arg) are favoured for base recognition. In purine bases, the bonding differences rely on the discrimination between N1 or N6/O6 atoms. Thus, while Arg and Asp are common binders to both bases, pairing with Thr is observed only for adenine as that with Glu or Ser is for guanine. For pyrimidines, N3, O2 and O4 are the atoms mostly observed in amino acid pair bonding. This statistical analysis was then applied to characterise the RNase A superfamily. A shared nucleotide binding pattern strategy has been found for all RNase complexes. Subsites p1 and B1, specific to pyrimidine bases, are well conserved in all members, formed by residues His12, Lys41 and His119 (p1) and Thr45, Asp83, Phe120 and Ser123 (B1) in RNase A. The observed variability of interacting residues at the purine binding site (B2), i.e. Gln69, Asn71 and Glu111, and secondary phosphate secondary subsites may explain the different efficiencies and substrate specificities of each superfamily member. Low order frog and fish RNase homologues show significant differences at the secondary base site, shifting specificity from adenine to guanine. Substrate recognition features of microbial RNase T1 family members were analysed and compared with those of the RNase A superfamily. Guanine is preferred at site B1. The observed peptide bond pair binding by anionic residues to the base corresponds to one of the representative classified patterns too. Phosphate moieties are recognised by His, Glu and Tyr counterparts in all analysed microbial RNases. All in all, this overall screening provides useful information for the design of selective RNA binders targeting cellular nucleotide polymers with potential therapy applications. Following, a thorough analysis of several RNase A superfamily protein crystal complexes has been carried out based on the nucleotide binding subsites and other sites potentially involved in the recognition of other polyanionic molecules such as sulphated heterosaccharides. Specifically, the structures of RNase A, ECP/RNase 3 and RNase 6 have been studied by X‐ray crystallography using crystals of both native and variants with substitutions at residues involved in the two main phosphate binding sites (Lys7, Arg10 in RNase A; His15 and His128 in ECP). First, an RNase A double mutant at residues Lys7 and Arg10 (subsite p2) was engineered to create a new active site by the inclusion of two histidine residues. The new active site modified the enzyme substrate specificity, shifting the cleavage mechanism from endo‐ to exonuclease activity. The mutations at p2 site also modified the pKa values and interaction mode of residues of the vicinal p1 subsite residues, explaining thus the reported variations of substrate affinity and catalytic efficiency even for dinucleotides and cyclic mononucleotides. Other changes were seen in the
General discussion
154
double mutant with respect to the N‐terminus conformation and cell unit packing. The comparison of the RNase A/H7H10–3’‐CMP crystal complex with that of the wild type protein corroborates how the interactions at the main active site are influenced upon the creation of this second active site. Also, the structure of native RNase A in complex with 3’‐CMP at atomic resolution has also enabled a detailed analysis of the interaction mode of this nucleotide in subsites p1 and B1. These allowed the viewing of the enzyme at the end of the hydrolysis step, virtually equivalent to the beginning of the transphosphorylation step. Last but not least, the hydrogen atoms visualised in the high‐resolution nucleotide complex of native RNase A difference map provided the identification of important key details at the active site. The protonation state of both catalytic His residues was seen together with the His119 and Lys41 orientation required for the anchoring of the substrate intermediate. Another project was focused on RNase 3/ECP structural studies. Native ECP crystals in complex with different anions have enabled a structural study of the protein binding sites. Additionally, the active centre of the enzyme was evaluated by following the changes happening upon point mutations of histidine residues His15 and His128. The structural analyses explained the different values of residual catalytic activity reported in previous experiments (Salazar et al. unpublished results), the His15Ala mutation being more severe than His128Asn. The remaining residual activity of the second mutant (ECP/H128N) may be explained by the maintained H‐bond active site network and the contribution of the protonated Lys41 residue itself which can play a role as an acid catalyst. More importantly, crystal structure analyses confirmed that these mutations do not alter the global structure of the enzyme, ensuring both mutants, particularly H15A, to be good models for the realisation of functional and biological studies of catalytically inactive variants. The H15A mutant was assayed to evaluate the contribution of the enzymatic activity in the other described biological properties such as the antimicrobial activity. The study of the new native ECP complexes at high resolution has also allowed the identification of residues subject to marked side chain variability such as loop residues and solvent‐exposed arginines. Two distinct crystal forms were compared, analysing the packing interfaces and anion binding mode. The arginine high side chain variability was interpreted according to the cell unit solvent content, crystal packing form and the presence of anions that interact with the exposed side chains and stabilise their orientations. Finally, the first RNase 6 crystal structure was obtained, setting thus the basis for structural functional studies. Two sulphate ions have been found in the asymmetric unit, one of them in subsite p1 (in agreement with other superfamily member crystals) and another one in a novel site, close to subsite p0, but not seen in any other family member so far, yet predicted by previous docking experiments. The different pKa values of active site residues, as well as the predicted nucleotide binding mode, may explain the different enzyme efficiency observed towards dinucleotide substrates. The presence of sulphate anions in various crystals of the three studied RNases has enabled a final comparative study of the different anion binding sites. Common and
General discussion
155
distinct specific sites were analysed. The overrepresentation of interacting sulphate anions throughout the ECP crystal structure, in comparison to that of RNase A, correlates to its higher cationicity, potentially related to its high binding affinity to cell surface molecules, which mediates the protein cytotoxicity. Many of these sites were found equivalent to phosphate interaction sites, such as p‐1 (ECP), p0 (common to the three structures) and p3 (ECP, RNase A).