Embed Size (px)
Citation preview
Structural Health Condition Monitoring of Carbon-Fibre Based Composite Materials Using Acoustic
Emission Techniques
by
Weili Ning
A thesis submitted to the University of Birmingham for the degree of
M.Sc. by Research
School of Metallurgy and Materials
College of Engineering and Physical Sciences
University of Birmingham
January 2015

University of Birmingham Research Archive
e-theses repository This unpublished thesis/dissertation is copyright of the author and/or third parties. The intellectual property rights of the author or third parties in respect of this work are as defined by The Copyright Designs and Patents Act 1988 or as modified by any successor legislation. Any use made of information contained in this thesis/dissertation must be in accordance with that legislation and must be properly acknowledged. Further distribution or reproduction in any format is prohibited without the permission of the copyright holder.
Synopsis
Carbon Fibre Reinforced Plastics (CFRP) materials have been extensively used in the
manufacturing of light-weight structural components which are required to exhibit high
strength and rigidity. CFRP materials have found widespread application in the transport
industry, particularly in the aerospace, boat and automotive sectors where low weight of the
structure needs to be combined with excellent mechanical properties and impact resistance.
CFRP materials have also been extensively used in the sports industry for the manufacturing of
skis, bobsleds, fishing rods, and other components. The mechanical properties of CFRP
materials are highly anisotropic. Therefore, the laminate properties can be tailored by
orientating the plies in specific directions. Although CFRP materials exhibit high
strength-to-weight ratios, it is not easy to define their fatigue endurance limit. Accidental
impacts apart from cyclic stresses and environmental degradation can also contribute to the
deterioration of the mechanical properties of CFRP materials. Thus, during continuous cyclic
loading conditions over a prolonged time period, failure from fatigue cannot be entirely ruled
out.
The damage mechanisms affecting CFRP materials leading to structural failure are complex
including impact damage, delamination, matrix cracking, fibre fracture, etc. It is common
practice to over-engineer critical structural components made from CFRP materials in order to
increase the safety margin and redundancy of the design. Manufacturing defects such as fibre
waviness, voids, etc. combined with accidental impacts while in-service can have a detrimental
effect on the mechanical properties and fatigue lifetime of CFRP structural components. The
presence of manufacturing defects can cause early initiation and evolution of damage which
can eventually lead to unexpected catastrophic failure of the structural component concerned.
To avoid the occurrence of catastrophic failure due to manufacturing defects, impacts or fatigue
damage, critical structural CFRP components are regularly inspected using various
non-destructive testing methods including visual inspection, laser shearography, conventional
Ultrasonic Testing (UT), thermography, Eddy Current (EC) testing and less often digital
radiography. The Acoustic Emission (AE) technique is a structural health condition monitoring
method which can be used for continuous monitoring of in-service CFRC structural
components and help increase confidence regarding the remaining in-service lifetime if a
fatigue limit cannot be defined easily.
The general aim of this study is to evaluate the efficiency of the AE technique in monitoring the
structural health of CFRP. To reliably establish the link between the AE responses with the
evolution of structural damage tests were carried out initially on carbon fibre bundles alone
before progressing with tests on plain carbon weave fabric composite specimens fabricated in
the laboratory. In certain composite specimens artificial defects such as through-hole defect,
deep scratch and notches were intentionally induced to study the effect of these defects on the
mechanical properties and AE responses arising during testing. Tensile tests were carried out
on carbon fibre bundle and composite specimens. Composite specimens were also tested in
three-point bending. AE sensors were used to monitor the structural health condition of all
specimens. Due to the complexity of the AE signals recorded from composite specimens, the
AE results from the bundle specimens were initially evaluated, compared and then linked to the
AE responses resulting from the composite specimen tests. The AE responses collected from
tests of defect-free composite specimens were compared to those containing various types of
artificially induced defects. From the results acquired it was established that the AE technique
can monitor effectively the evolution of damage as load increases. Key parameter indicators
based on the energy, counts and duration of the AE signals were determined to be more
important than the amplitude of the hits recorded. From the results at hand it can be concluded

that the AE technique can be a valuable tool in the evaluation of in-service critical structural
CFRP components operating under cycling loading conditions.

Acknowledgements
This piece of thesis takes me a lot of effort to prepare and complete, which totally exceed my
expectation. As the final version of this thesis makes it appearance, I would like to
acknowledge the people who have contributed during this period.
First of all, I would like to express my greatest gratitude to my supervisor, Dr. Mayorkinos
Papaelias, for the great patience he spent in correcting my thesis. I cannot image how I can
complete my work without his persistent encouragement, invaluable suggestions and
guidance. His open-mindedness, generosity and considerateness have given me the greatest
strength in the journey of academic researches.
Secondly, I would like to express my appreciation to Prof. Gerard Fernando, for his precious
suggestions in making artificial-defects and the supports in my experiments.
Thirdly, I am thankful for Mr. Samuel Ojo, Mr. Nikolaos Angelopoulos and Mr. Surya
Pandita for their associations in the preparation of bundle and composite specimens and their
guidance in mechanical tests.
Finally, I also owe my sincere gratitude to my family, thanks for their financial support,
encouragement and understanding.

Table of Contents
CHAPTER 1 .............................................................................................................................. 1
1.1 Introduction .............................................................................................................. 2
1.2 Non-destructive testing of Fibre Reinforced Plastic components ............................ 9
1.3 Project Aims and Objectives ................................................................................... 12
CHAPTER 2 ............................................................................................................................ 15
2.1 Introduction ............................................................................................................ 16
2.2 Thermosetting and thermoplastic resins .................................................................. 18
2.3 Fibres ....................................................................................................................... 22
2.4 Carbon FRP Composites ......................................................................................... 24
2.5 Fibre-matrix interface .............................................................................................. 28
2.6 Manufacturing processes of fibre-reinforced composites ....................................... 29
2.7 Carbon fabric reinforced composites ...................................................................... 31
CHAPTER 3 ............................................................................................................................ 34
3.1 Introduction ............................................................................................................ 35
3.2 Manufacturing defects ............................................................................................ 36
3.3 Handling and installation defects ........................................................................... 38
3.4 In-service defects .................................................................................................... 41
3.5 Main Types of Damage Mechanisms in Composite materials ............................... 43
CHAPTER 4 ............................................................................................................................ 51
4.1 Introduction ............................................................................................................ 52
4.2 Visual inspection .................................................................................................... 54
4.3 Dye Penetrant Inspection ........................................................................................ 55
4.4 Ultrasonic Testing .................................................................................................... 57
4.5 Eddy current testing ................................................................................................ 60
4.6 Active thermography ............................................................................................... 61
4.7 Shearography ........................................................................................................... 63
4.8 Radiography ............................................................................................................ 63
4.9 Impact-echo testing ................................................................................................. 64
4.10 Vibration analysis .................................................................................................. 65
CHAPTER 5 ............................................................................................................................ 67
5.1 Introduction ............................................................................................................ 68
5.2 Strain gauges ........................................................................................................... 69
5.3 Vibration analysis .................................................................................................... 71
5.4 Fibre Bragg Grating Sensors ................................................................................... 73
5.5 Acoustic emission ................................................................................................... 75
5.6 Fundamentals of acoustic emission ......................................................................... 76
5.7 Acoustic Emission Testing ...................................................................................... 79
5.8 Acoustic Emission signals ....................................................................................... 80
5.9 Acoustic Emission sensors ...................................................................................... 82
5.10 Acoustic emission sources in composite materials ............................................... 85
CHAPTER 6 ............................................................................................................................ 89
6.1 Introduction ............................................................................................................ 90
6.2 Carbon fibre bundle samples ................................................................................... 90
6.3 Preparation of composite samples ........................................................................... 92
6.4 Tensile testing with AE............................................................................................ 98
6.5 Three-point bending and AE test ........................................................................... 102
CHAPTER 7 .......................................................................................................................... 104
7.1 Introduction .......................................................................................................... 105
7.2 Carbon fibre bundle samples ................................................................................. 105
7.3 AE noise signal filtering of carbon fibre bundles ................................................. 106
7.4 Tensile testing of small carbon bundle samples .................................................... 111
7.5. Tensile testing of as-received and twisted carbon bundle samples with 12000
filaments ......................................................................................................................... 114
7.6 Tensile test of as-received bundle sample under different testing speed rate........ 119
7.7 Tensile test with AE monitoring of twisted carbon bundle samples with different
gauge lengths ................................................................................................................. 120
7.8 The locations of fibre failure in as-received and twisted bundle samples............. 124
CHAPTER 8 .......................................................................................................................... 127
8.1 Introduction ........................................................................................................... 128
8.2 Evaluation of the tensile strength of CFRC samples with and without artificial
defects ............................................................................................................................ 128
8.3 Flexural testing of CFRC samples with and without artificial defects ................. 131
8.4 Analysis of AE test results of defect-free samples and samples with artificial defects
during tensile and bending tests ..................................................................................... 133
8.5 AE results from tensile testing .............................................................................. 133
8.6 Three-point bending testing .................................................................................. 137
8.7 Analysis of tensile and three-point bending AE results ........................................ 142
8.8 Tensile test of defect free composite samples under different testing speed rates 161
CHAPTER 9 .......................................................................................................................... 167
9.1 Conclusions .......................................................................................................... 168
9.2 Future work ........................................................................................................... 169
CHAPTER 10 ........................................................................................................................ 171
List of Figures
Figure 1.1: Diagram of Young’s Modulus range for different types of fibres, natural and
synthetic [6]. .............................................................................................................................. 3
Figure 1.2: Increase in the use of composite materials in Airbus aircraft from 1970s until
2014. The graph is courtesy of Airbus SAS. .............................................................................. 4
Figure 1.3: Schematic showing the key structural components manufactured from composite
materials in a) Boeing B787 (schematic is courtesy of The Boeing Company) and b) A350
XWB (schematic is courtesy of Airbus SAS). ........................................................................... 5
Figure 1.4: The 42.5-metre trimaran motor yacht Adastra made almost entirely of FRP
materials. The photograph is courtesy of McConaghy Boats. ................................................... 6
Figure 1.5: a) Formula One car (photograph is courtesy of Mercedes Benz) and b) limited
edition car (photograph is courtesy of Automobili Lamborghini S.p.A.). The bodies of these
cars are entirely made of CFRP. ................................................................................................. 7
Figure 1.6: a) Carbon fibre laying up for manufacturing of spar (photograph is courtesy of
Gary Kanaby, Wind Energy Services), b) carbon and glass fibre tape winding of spar for a
Gamesa wind turbine blade (photograph is courtesy of Gamesa). ............................................ 8
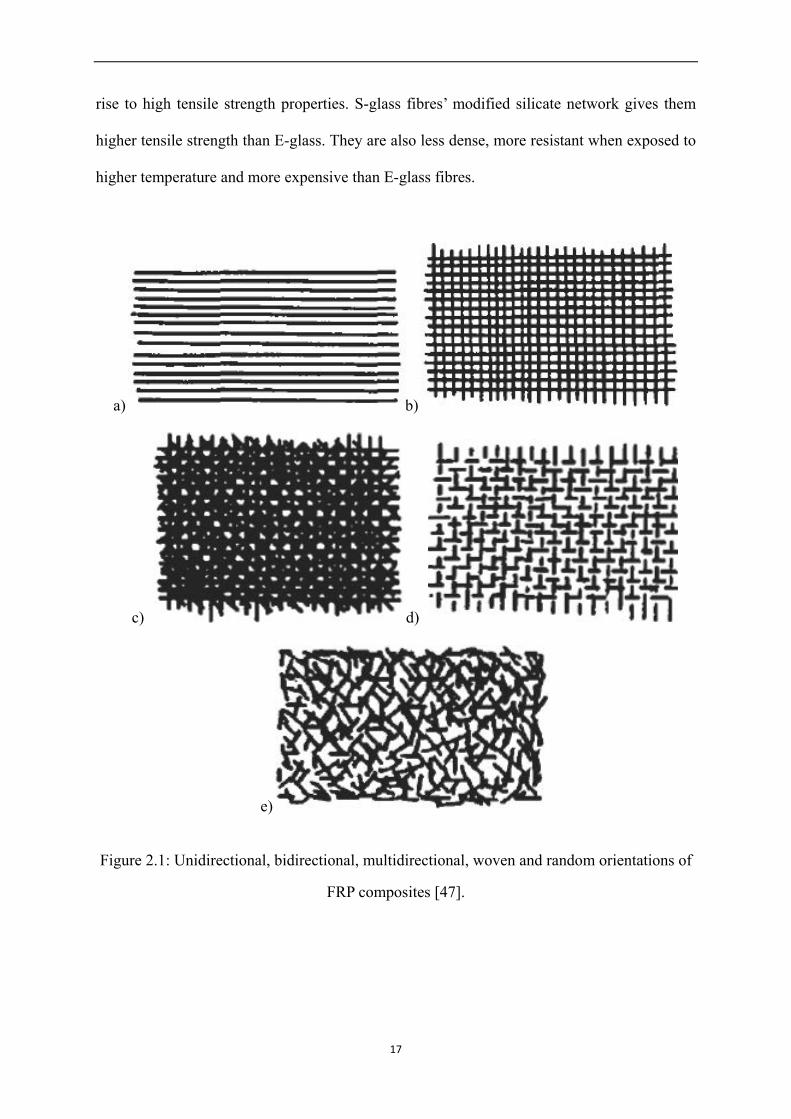
Figure 2.1: Unidirectional, bidirectional, multidirectional, woven and random orientations of
FRP composites [47]. ............................................................................................................... 17
Figure 2.2: Price range of different fibre types [48]. E-Glass, S-Glass, Aramid and Carbon
fibres are the most commonly used types. ............................................................................... 18
Figure 2.3: Recycling process for thermoset composites [50]. ............................................. 20
Figure 2.4: Skeletal structures of a) thermoset and b) thermoplastic resins used in FRP
composites [55]. ....................................................................................................................... 22
Figure 2.5: The hexagonal structure of graphite showing the types of bonding in various
planes [10]. ............................................................................................................................... 25
Figure 2.6: Diagram of filament winding process ................................................................. 30
Figure 2.7: Diagram of pultrusion process. ........................................................................... 31
Figure 2.8. Structure of plain weave fabric (schematic by Summerscales, University of
Plymouth 2013). ....................................................................................................................... 32
Figure 3.1: Voids in a glass fibre composite material [77]. ................................................... 37
Figure 3.2: Glass fibre composite with presence of voids and fibre-matrix debonding due to
shrinkage [77]. ......................................................................................................................... 38
Figure 3.3: a) Delamination and b) splintering damage caused after drilling in composite
panels. The photographs are courtesy of the Composite machining Blog – Sandivk AB and the
Sandvik Group [78].................................................................................................................. 39
Figure 3.4: a) Fallen wind turbine blade to its side after traffic accident caused overturning of
the track transporting it (the photograph is courtesy of Mr. Tony Patrick) and b) transport of
wind turbine blades overland can subject composite wind turbine blades to excessive bending
that can cause accumulation of damage and initiation of defects (the photograph is courtesy of
Faymonville). ........................................................................................................................... 40
Figure 3.5: Impact damage resulting in failure of the nose of an aircraft (photograph is
courtesy of the Centre for Nondestructive evaluation of the Iowa State University) [79]. ..... 41
Figure 3.6: Schematic showing the effects of impact damage around the impact location and
the surrounding zone. Matrix cracks due to bending and shear forces experience can initiate
during the impact event and subsequently propagate due to cyclic loading possibly resulting
into final failure if the damage is not repaired or the component is not replaced in time [80].
.................................................................................................................................................. 42
Figure 3.7: Failure of a CFRP component used in bicycles following fatigue testing (the
photograph is courtesy of Mr Markus Schatz) [81]. ................................................................ 43
Figure 3.8: Schematic description of crack propagation in a fibre reinforced composite..... 49
Figure 4.1: Photograph of digital USB optical microscope (the photograph is courtesy of Mr.
Rico Shen). ............................................................................................................................... 55
Figure 4.2: Schematics showing the basic principles of DPI. The schematics are courtesy of
the American Society for Non-Destructive Testing [119]. ....................................................... 56
Figure 4.3: Typical immersion tank with automatic manipulator for moving the UT
transducer. The photograph is courtesy of GE. ........................................................................ 59
Figure 4.4: Various defects detectable in CFRC components using ECT [120]. .................. 61
Figure 4.5: Schematic showing the principles of thermographic inspection of FRP materials
[121]. ........................................................................................................................................ 62
Figure 4.6: Digital radiograph showing extensive damage in a CFRC bicycle component due
to fatigue. The radiograh is courtesy of Mr. M. Schatz [81]. ................................................... 64
Figure 5.1: Schematic showing a typical strain gauge and its principles of operation. ........ 70
Figure 5.2: Strain gauge attached on the surface of composite-steel joint in order to measure
strain during bending loading. The photograph is courtesy of Mr. Nikolaos Angelopoulos. .. 71
Figure 5.3: Industrial piezoelectric accelerometer used for vibration analysis measurements
of an in-service wind turbine tower. The photograph is courtesy of Dr Frederik Vermeulen. 72
Figure 5.4: Schematic showing the basic principles and design of an FBG sensor [Source:
Wikipedia, 2014]. ..................................................................................................................... 74
Figure 5.5: Photograph showing an optical fibre embedded in a thermo-hardened composite
material. The micrograph is courtesy of FOS & S B.V.B.A., Belgium. .................................. 75
Figure 5.6: Schematic of basic lamb wave types a) flexural mode and b) extensional mode
[156]. ........................................................................................................................................ 78
Figure 5.7: Simplified schematic showing the principles of a modern industrial AE system
[157]. ........................................................................................................................................ 80
Figure 5.8: Main features of a typical transient AE signal [159]. ......................................... 81

Figue 5.9: A typical transient signal (left) and a continuous signal (right) [161]. ................ 82
Figure 5.10: The structure of a) wide bandwidth and b) resonance piezoelectric sensors ... 83
Figure 5.11: Schematic representation of pencil lead break method ..................................... 84
Figure 6.1: Carbon fibre bundles being end-tabbed using aluminium sheets on either side
glued together using Scotch-weld. ........................................................................................... 92
Figure 6.2: The preparation of vacuum bagging system. ...................................................... 94
Figure 6.3: Resin infusion process in progress ..................................................................... 94
Figure 6.4: Photographs of defect-free composite samples for a) tensile test and b) three-point
bending. .................................................................................................................................... 96
Figure 6.5: Composite sample with hole-shape defect for tensile test. ................................. 96
Figure 6.6: Composite samples with a) saw kerf defect b) notch defect and c) .................... 97
Figure 6.7: The set-up of tensile test for carbon bundle specimens (as-received). ............. 100
Figure 6.8: The set-up of tensile test for carbon composite specimens. ............................. 102
Figure 6.9: The set-up of three-point bending for carbon composite specimens. ............... 103
Figure 7.1: Typical waveform generated during fibre failure. ............................................ 106
Figure 7.2: Amplitude scatter distribution and parametric extension of a classic As-received
sample a) before filtering; b)after 15 (10μvolt-sec/count) energy filtering; c) after 15
(10μvolt-sec/count) energy and 1 count filtering. .................................................................. 108
Figure 7.3. Typical waveform of fibre fracture-related AE signal with echoes also captured.
................................................................................................................................................ 110
Figure 7.4: Load development and amplitude scatter distribution for a small bundle sample
during tensile test. .................................................................................................................. 112
Figure 7.5: The evolution of applied load and cumulative AE hits with parametric extension.
................................................................................................................................................ 113
Figure 7.6: The average maximum loads for as-received bundle and twisted bundle samples.
................................................................................................................................................ 115
Figure 7.7: The average maximum extension for as-received bundle and twisted bundle
samples. .................................................................................................................................. 115
Figure 7.8: A typical load and extension graph for as-received and twisted bundle samples.
................................................................................................................................................ 116
Figure 7.9: Load-extension with cumulative hits for as-received and twisted bundles. ..... 117
Figure 7.10: The evolution of amplitude scatter distribution and cumulative hits along with
extension for twisted bundle. ................................................................................................. 118
Figure 7.11: The evolution of amplitude scatter distribution and cumulative hits along with
extension for as-received bundle. .......................................................................................... 118
Figure 7.12: Average number of AE hits recorded under different cross-head speed. ........ 120
Figure 7.13a: The average maximum loads of sample 100TW and sample 200TW. ......... 121
Figure 7.13b: The average maximum extension of sample 100TW and sample 200TW. .. 121
Figure 7.13c: The average total AE hits of sample 100TW and sample 200TW. .............. 122
Figure 7.13d: The AE cumulative hits with load-extension for typical sample 100TW and
200TW. ................................................................................................................................... 123
Figure 7.13e: The amplitude scatter distribution with load-extension for a) sample 100TW and
b) sample 200TW. .................................................................................................................. 124
Figure 7.14: The distribution density of fibre breakage along the bundle length with increased
extension for, a) sample 200As-recvd, b) sample 200Tw. Red colour area represents the highest
densities of breakages. ........................................................................................................... 125
Figure 8.1: The average maximum applied load of sample GT and sample DT during tensile
testing. .................................................................................................................................... 129

Figure 8.2: The average maximum extension of sample GT and sample DT during tensile test.
................................................................................................................................................ 129
Figure 8.3: A classic extension-load graph for sample GT and sample DT. ....................... 129
Figure 8.4. The top-view of a) sample GT and b) sample DT after tensile failure. ............ 130
Figure 8.5: The average maximum applied load sustained by samples with and without
artificial defects during 3-point bending test. ........................................................................ 132
Figure 8.6: The average maximum deflection of sample GF and sample DF-hole, sample
DF-3hole, sample DF-n and sample DF-s. ............................................................................ 133
Figure 8.7: Load-extension with cumulative hits for sample GT and sample DT. ............. 134
Figure 8.8: The AE cumulative energy and load-extension for sample GT and sample DT.
................................................................................................................................................ 135
Figure 8.9: Microscopical observation of fracture profile for a) sample GT and b) sample DT.
................................................................................................................................................ 137
Figure 8.10: The AE cumulative hits and load-deflection for a) sample GF; b)sample
DF-2hole and 3hole; c) sample DF-n and d) sample DF-s. ................................................... 139
Figure 8.11: The AE cumulative energy and load-deflection for a) sample GF; b)sample
DF-2hole and 3hole; c) sample DF-n and d) sample DF-s. ................................................... 142
Figure 8.12: The evolution of cumulative signal counts with extension for sample GT and
sample DT. ............................................................................................................................. 143
Figure 8.13: The development of cumulative counts with deflection for defect-free sample
and defect-contained samples during bending test. ............................................................... 144
Figure 8.14: The amplitude scatter distribution with load-extension for a) sample GT and b)
sample DT .............................................................................................................................. 147
Figure 8.15: The amplitude scatter distribution with load-deflection for a)sample GF
b)sample DF-2hole c)sample DF-3hole d)sample DF-n and e)sample DF-s ........................ 150

Figure 8.16: The average amplitude distribution percentage of sample GT and sample DT.
................................................................................................................................................ 151
Figure 8.17: The comparison of average amplitude distribution percentage between sample
GF and a) sample DF-2hole, b) sample DF-3hole, c) sample DF-s, d) sample DF-n. .......... 153
Figure 8.18: Side view (×16amplification) and Back view (tensile side) (×6.4 amplification)
after bending test of a) sample GF; b) sample DF-2hole; c) sample DF-3hole; d) sample DF-n
and e) sample DF-s. ............................................................................................................... 160
Figure 8.19: The average maximum loads of sample GT tested with 0.5 mm/min and 1.0
mm/min strain rates................................................................................................................ 162
Figure 8.20: The average maximum extensions of sample GT tested with 0.5 mm/min and 1.0
mm/min strain rates................................................................................................................ 162
Figure 8.21: The load-extension for sample GT tested with 0.5 mm/min and 1.0 mm/min
strain rates. ............................................................................................................................. 163
Figure 8.22: The average cumulative AE hits for sample GT tested with 0.5mm/min and
1.0mm/min strain rates........................................................................................................... 165
Figure 8.23: The evolution of cumulative AE hits with testing time for sample GT tested with
0.5mm/min and 1.0mm/min strain rates. ............................................................................... 165
Figure 8.24: The AE cumulative energy for sample GT tested with a) 0.5mm/min and b)
1.0mm/min strain rates........................................................................................................... 166
List of Table
Table 2.1: Key mechanical properties of carbon fibre in comparison to other synthetic and
natural fibre types. ................................................................................................................... 26
Table 2.2:Common resin types for CFRP composites. ......................................................... 28
Table 3.1:Effects of some manufacturing-induced defects on mechanical properties of
composite [104] ....................................................................................................................... 47
Table 6.1: Types of carbon fibre specimens used for tensile testing and evaluation of the AE
technique. ................................................................................................................................. 91
Table 6.2: Parameters of carbon fibre T700SC. .................................................................... 91
Table 6.3: Dimension and configurations of all fabric composite samples. .......................... 98
Table 6.4: AE channel Parameters for bundle sample testing. .............................................. 99
Table 6.5: AE channel parameter for composite sample testing. ........................................ 101
Table 7.1: Actual number of filaments in a bundle, number of raw AE hits, number of AE hits
relative to fibre failure after data filtering and difference percentage between the fibre
failure-related AE signals and the actual number of filaments for each as-received fibre bundle.
................................................................................................................................................ 111
Table 8.1: The degradation extent of the maximum load and deflection for the samples with
artificial defects. ..................................................................................................................... 132

CHAPTER 1
Introduction
1

1.1 Introduction
In recent years there has been a continuously increasing demand for high-strength, low-weight
and corrosion resistant materials in several industrial sectors including, transport, defence,
renewable energy, oil and gas and sports [1-6]. This has led to a growing use of fibre-reinforced
plastic (FRP) materials for manufacturing several types of critical structural components such
as aircraft vertical stabilisers, wind turbine blade spars, aerofoils, catamaran hydrofoils, skis,
satellite parts, yacht masts and others [1-6].
FRP materials offer significant advantages over steels, aluminium alloys, and other
conventional metallic alloys since they combine high tensile strength, impact resistance, high
toughness, vibration resistance, erosion and wear resistance, low sensitivity to moisture and
excellent corrosion resistance, good fatigue resistance to cyclic loads, and low linear
coefficient of thermal expansion with very low density [7-10]. Hence, FRP materials offer an
excellent strength to weight ratio enabling the manufacturing of strong albeit light-weight
structures [10]. High strength to weight ratios are highly desirable in several industrial
applications, particularly transport, defence and sports, where structural strength and corrosion
resistance are priorities but weight is also required to be kept to a minimum.
There are several types of FRP materials available in the market based on fine glass, carbon,
aramide and basalt fibres with diameters normally between 7-13 µm which are impregnated in
a polymer matrix [10]. However, natural fibres have been used since the antiquity and there is
currently renewed interest in their use for manufacturing industrial components in recent years,
e.g. wind turbine blades [6, 11-12]. Natural fibres have lower cost, are environmentally
friendlier, pose less health risks, are renewable, have lower density and offer competitive level
of strength and stiffness to those of glass fibres [6, 11-12]. The schematic in figure 1.1 shows
2
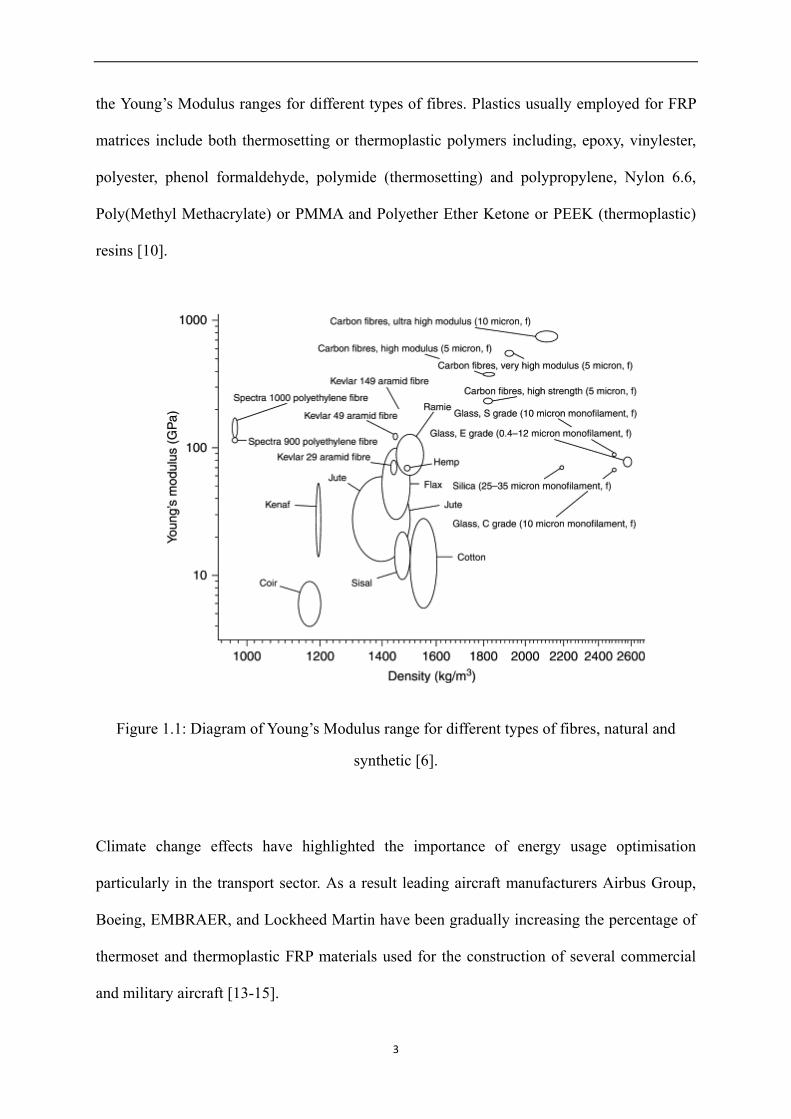
the Young’s Modulus ranges for different types of fibres. Plastics usually employed for FRP
matrices include both thermosetting or thermoplastic polymers including, epoxy, vinylester,
polyester, phenol formaldehyde, polymide (thermosetting) and polypropylene, Nylon 6.6,
Poly(Methyl Methacrylate) or PMMA and Polyether Ether Ketone or PEEK (thermoplastic)
resins [10].
Figure 1.1: Diagram of Young’s Modulus range for different types of fibres, natural and
synthetic [6].
Climate change effects have highlighted the importance of energy usage optimisation
particularly in the transport sector. As a result leading aircraft manufacturers Airbus Group,
Boeing, EMBRAER, and Lockheed Martin have been gradually increasing the percentage of
thermoset and thermoplastic FRP materials used for the construction of several commercial
and military aircraft [13-15].
3
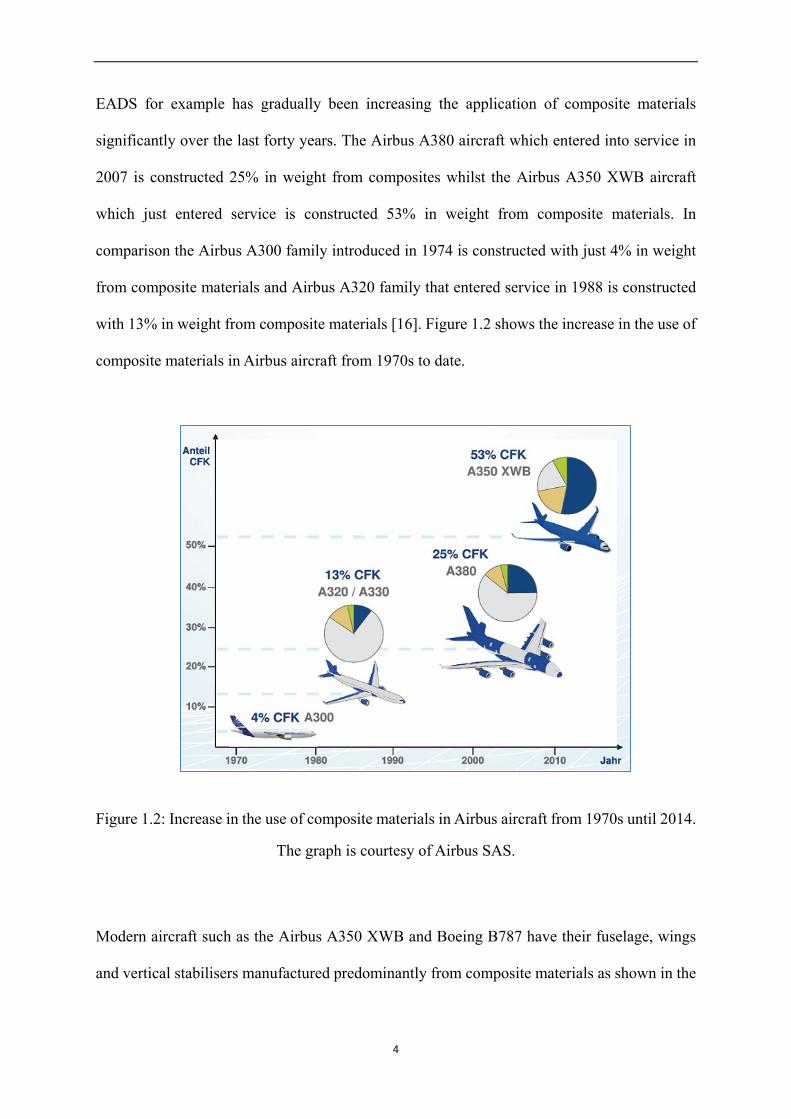
EADS for example has gradually been increasing the application of composite materials
significantly over the last forty years. The Airbus A380 aircraft which entered into service in
2007 is constructed 25% in weight from composites whilst the Airbus A350 XWB aircraft
which just entered service is constructed 53% in weight from composite materials. In
comparison the Airbus A300 family introduced in 1974 is constructed with just 4% in weight
from composite materials and Airbus A320 family that entered service in 1988 is constructed
with 13% in weight from composite materials [16]. Figure 1.2 shows the increase in the use of
composite materials in Airbus aircraft from 1970s to date.
Figure 1.2: Increase in the use of composite materials in Airbus aircraft from 1970s until 2014.
The graph is courtesy of Airbus SAS.
Modern aircraft such as the Airbus A350 XWB and Boeing B787 have their fuselage, wings
and vertical stabilisers manufactured predominantly from composite materials as shown in the
4
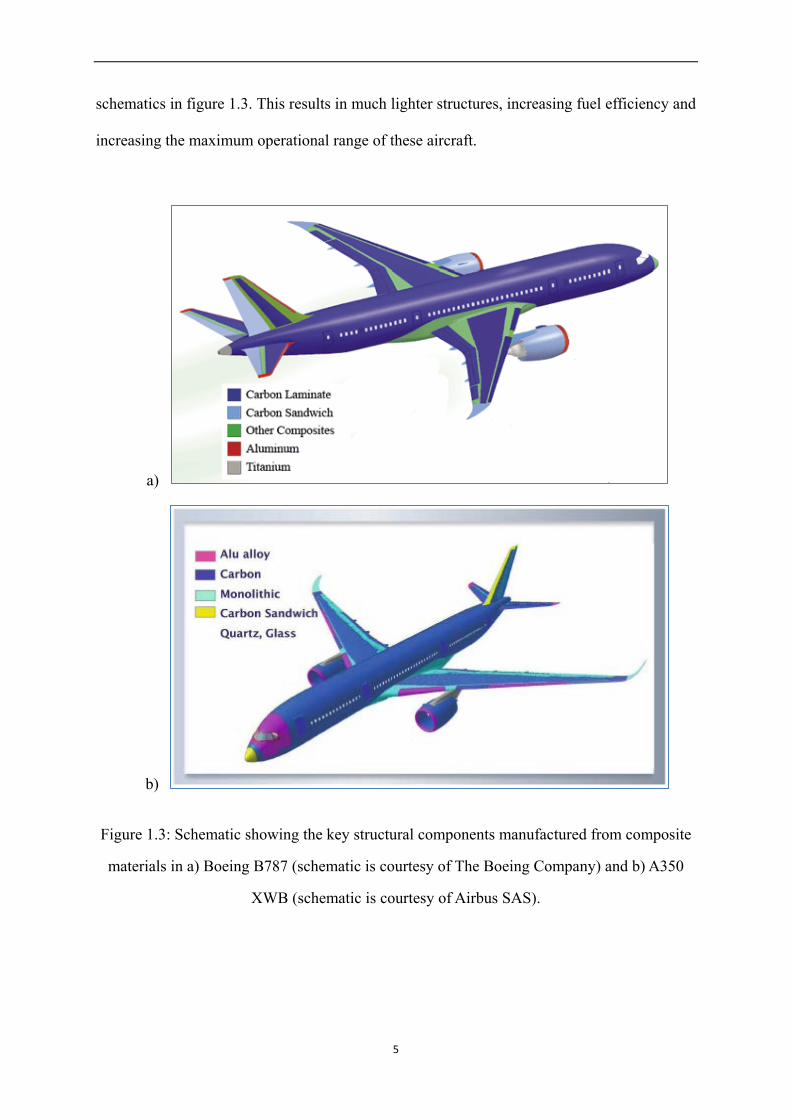
schematics in figure 1.3. This results in much lighter structures, increasing fuel efficiency and
increasing the maximum operational range of these aircraft.
a)
b)
Figure 1.3: Schematic showing the key structural components manufactured from composite
materials in a) Boeing B787 (schematic is courtesy of The Boeing Company) and b) A350
XWB (schematic is courtesy of Airbus SAS).
5
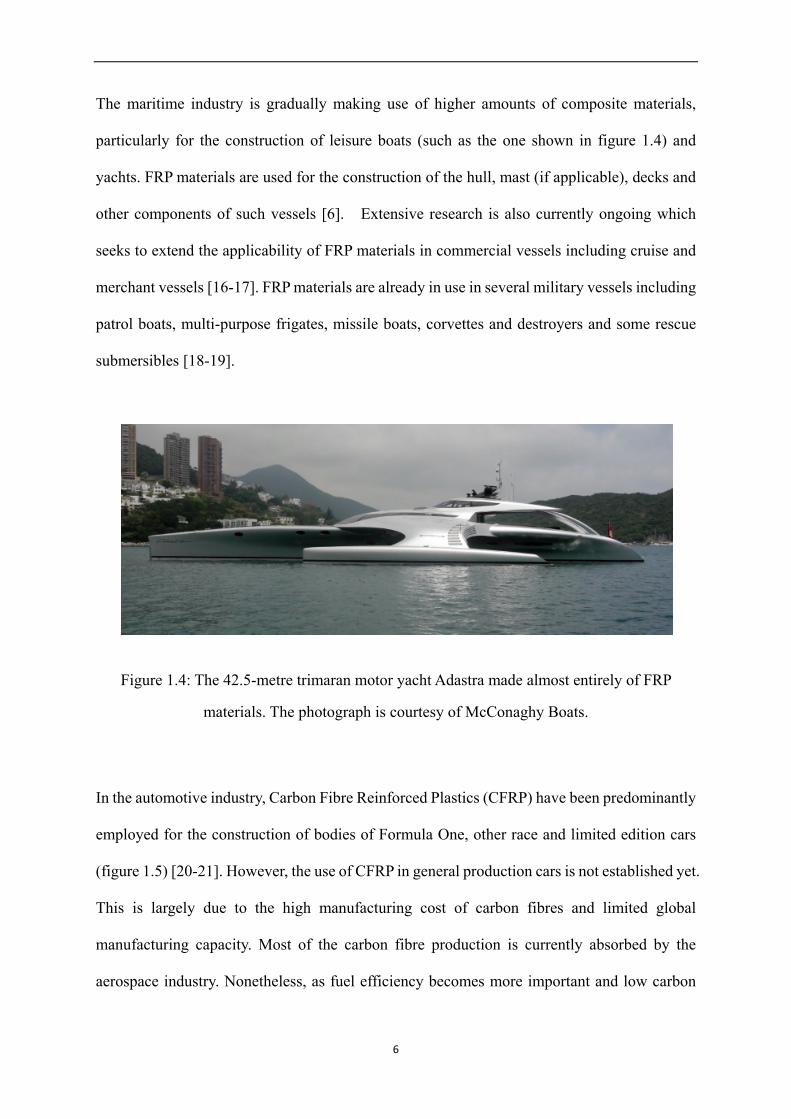
The maritime industry is gradually making use of higher amounts of composite materials,
particularly for the construction of leisure boats (such as the one shown in figure 1.4) and
yachts. FRP materials are used for the construction of the hull, mast (if applicable), decks and
other components of such vessels [6]. Extensive research is also currently ongoing which
seeks to extend the applicability of FRP materials in commercial vessels including cruise and
merchant vessels [16-17]. FRP materials are already in use in several military vessels including
patrol boats, multi-purpose frigates, missile boats, corvettes and destroyers and some rescue
submersibles [18-19].
Figure 1.4: The 42.5-metre trimaran motor yacht Adastra made almost entirely of FRP
materials. The photograph is courtesy of McConaghy Boats.
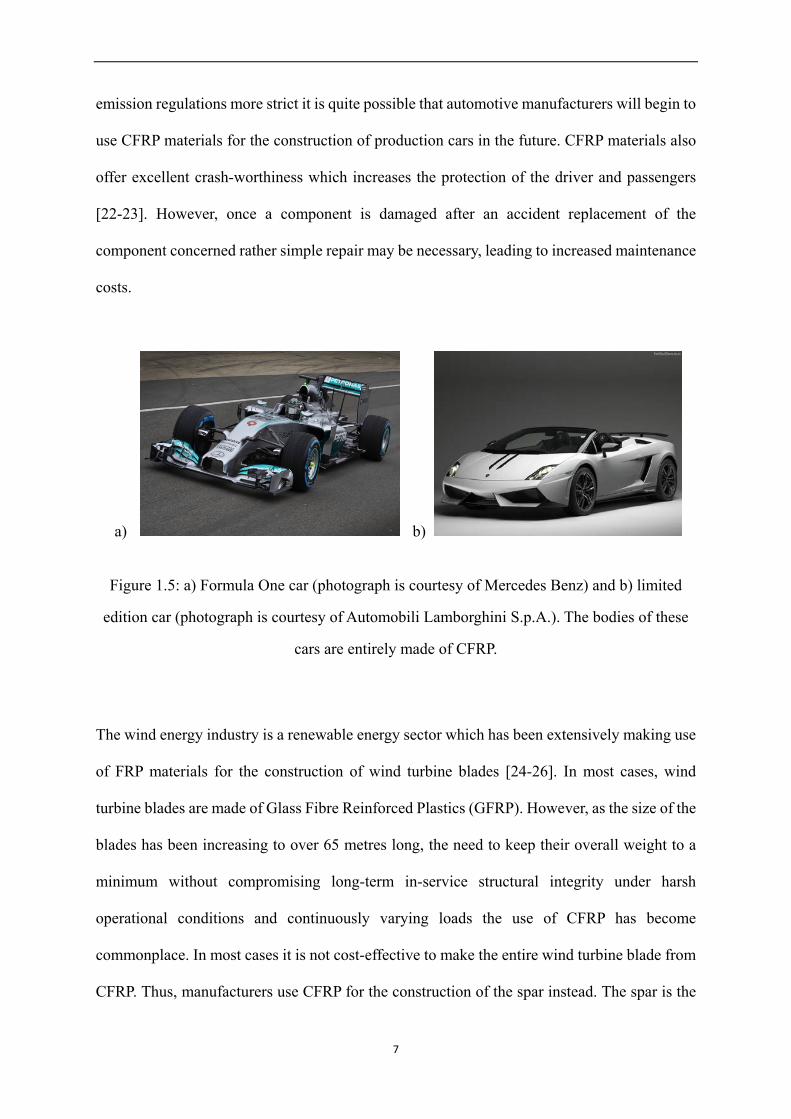
In the automotive industry, Carbon Fibre Reinforced Plastics (CFRP) have been predominantly
employed for the construction of bodies of Formula One, other race and limited edition cars
(figure 1.5) [20-21]. However, the use of CFRP in general production cars is not established yet.
This is largely due to the high manufacturing cost of carbon fibres and limited global
manufacturing capacity. Most of the carbon fibre production is currently absorbed by the
aerospace industry. Nonetheless, as fuel efficiency becomes more important and low carbon
6
emission regulations more strict it is quite possible that automotive manufacturers will begin to
use CFRP materials for the construction of production cars in the future. CFRP materials also
offer excellent crash-worthiness which increases the protection of the driver and passengers
[22-23]. However, once a component is damaged after an accident replacement of the
component concerned rather simple repair may be necessary, leading to increased maintenance
costs.
a) b)
Figure 1.5: a) Formula One car (photograph is courtesy of Mercedes Benz) and b) limited
edition car (photograph is courtesy of Automobili Lamborghini S.p.A.). The bodies of these
cars are entirely made of CFRP.
The wind energy industry is a renewable energy sector which has been extensively making use
of FRP materials for the construction of wind turbine blades [24-26]. In most cases, wind
turbine blades are made of Glass Fibre Reinforced Plastics (GFRP). However, as the size of the
blades has been increasing to over 65 metres long, the need to keep their overall weight to a
minimum without compromising long-term in-service structural integrity under harsh
operational conditions and continuously varying loads the use of CFRP has become
commonplace. In most cases it is not cost-effective to make the entire wind turbine blade from
CFRP. Thus, manufacturers use CFRP for the construction of the spar instead. The spar is the
7
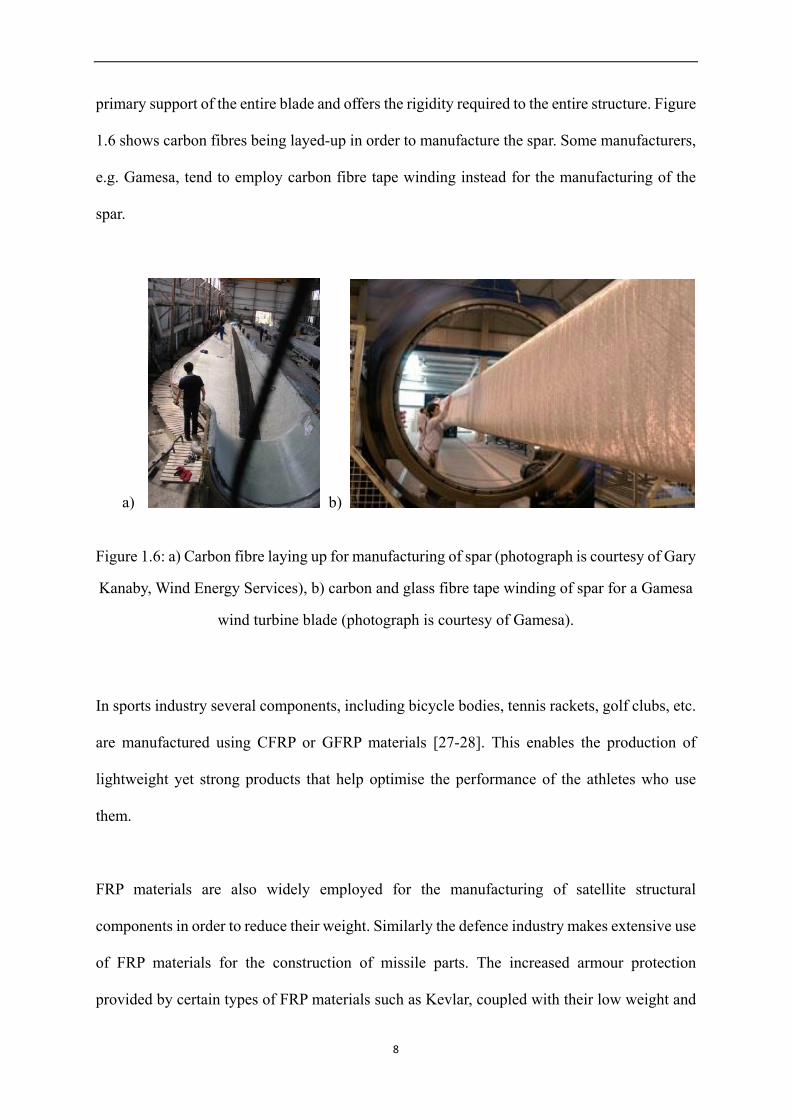
primary support of the entire blade and offers the rigidity required to the entire structure. Figure
1.6 shows carbon fibres being layed-up in order to manufacture the spar. Some manufacturers,
e.g. Gamesa, tend to employ carbon fibre tape winding instead for the manufacturing of the
spar.
a) b)
Figure 1.6: a) Carbon fibre laying up for manufacturing of spar (photograph is courtesy of Gary
Kanaby, Wind Energy Services), b) carbon and glass fibre tape winding of spar for a Gamesa
wind turbine blade (photograph is courtesy of Gamesa).
In sports industry several components, including bicycle bodies, tennis rackets, golf clubs, etc.
are manufactured using CFRP or GFRP materials [27-28]. This enables the production of
lightweight yet strong products that help optimise the performance of the athletes who use
them.
FRP materials are also widely employed for the manufacturing of satellite structural
components in order to reduce their weight. Similarly the defence industry makes extensive use
of FRP materials for the construction of missile parts. The increased armour protection
provided by certain types of FRP materials such as Kevlar, coupled with their low weight and
8
high tensile strength enables their use in the bodies of military aircraft such as the Tornado,
Eurofighter, etc., and helicopters.
It is undeniable that FRP materials are very important for modern society. The aerospace sector
is already making widespread use of CFRP. As the cost of production of CFRP materials
gradually becomes more affordable, and fuel efficiency and environmental impact become
more important it is expected that other industries such as the automotive will employ CFRP
and GFRP materials more in the future.
1.2 Non-destructive testing of Fibre Reinforced Plastic components
Non-destructive testing (NDT) of FRP components is a complex issue which is currently the
subject of extensive research. Since FRPs consist of two completely different types of materials;
the fibre and plastic matrix the inspection of structural components manufactured from such
materials is not straightforward. Moreover, it is possible that manufacturing or in-service
developed defects may be present either in the matrix or the fibre or at their interface increasing
the complexity of the inspection process.
FRP materials as discussed later in this thesis can suffer from various defects either due to
manufacturing issues (e.g. waviness, voids, etc.) or in-service loads, impacts and
environmental degradation (e.g. delamination, debonding, etc.). In order to detect such defects
during manufacturing or inspection campaigns in the case of in-service components various
NDT techniques are currently employed by the industry including automated visual inspection
(AVI), Liquid Penetrant Inspection (LPI), Ultrasonic Testing (conventional and advanced using
ultrasonic phased arrays), impact-echo, Eddy Current Testing (ECT), active (pulsed)
9
thermography, shearography and radiography (conventional, digital or back-scattered). ECT is
only applicable on CFRP maerials due to the relatively low conductivity that exhibited by
carbon fibres enabling the generation of interrogating eddy currents at relatively high
operational frequencies [31].
Unfortunately, the complexity of the microstructure of FRP materials coupled with their high
anisotropic mechanical properties makes detection of defects a very challenging task [31-34].
There are still significant uncertainties regarding the long-term suitability of existing NDT
techniques for the inspection of critical aircraft components and other complex composite
structures. It is also unknown whether existing inspection standards are entirely appropriate or
whether significant revisions will be required in the near future [35].
Therefore, the application of Structural Health Monitoring (SHM) techniques can offer
significant advantages to the operators of critical assets manufactured partially or entirely of
FRP materials compared to existing state-of-the-art inspection techniques [36-41]. SHM can
drastically reduce inspection times and costs, overall required downtimes and maintenance
expenditure.
SHM can be carried out in-situ using a variety of techniques including vibration measurements,
strain measurements using strain gauges of Fibre Bragg Gratings (FBGs) and Acoustic
Emission (AE) [36-44]. SHM sensors can be installed in the load bearing parts of a structure
continuously evaluating the material for damage initiation and subsequent propagation. The
information gained by SHM systems can be fed to inspection and maintenance engineers.
Hence, once damage initiation and/or propagation are detected by SHM sensors, the relevant
information regarding the location and potentially nature of the structural defect can be fed to
the inspection and maintenance engineers, who can then focus their efforts directly to the
10
location of interest rather than having to inspect the entire structure. Moreover, by gaining
information regarding the potential location of the defect more suitable sensors may be
possible to be employed increasing the Probability of Detection (PoD) of the defect and its
quantification.
The precise definition of fatigue lifetime for CFRP materials is very challenging since
accidental impacts together with environmental effects can contribute to the deterioration of
the mechanical properties of in-service components made from such materials. Moreover, the
presence of manufacturing defects can be a significant contributing factor in the overall
reduction of the fatigue lifetime of a particular CFRP component. This is due to the fact that
structural damage can initiate and rapidly evolve from manufacturing defect locations resulting
eventually in final failure of the component. Another significant factor adding to the
uncertainty in precisely estimating the fatigue lifetime of CFRP components are the complex
damage mechanisms affecting the structural integrity of CFRP materials.
It is thus common practice to over-engineer critical structural components made from CFRP
materials in order to increase the safety margin and redundancy of the design. Given the
uncertainty arising from the quality of NDT results with state-of-the-art equipment combined
with manufacturing and in-service defects that may be present in CFRP components, SHM
offers distinct advantages over conventional techniques. The research effort within this project
has focused in the evaluation of the suitability of AE in effectively monitoring the structural
health of CFRP components.
The AE technique is an in-situ SHM technique which can be used for continuous monitoring of
in-service CFRP structural components. The AE method relies on detection of mechanical
11
stresses (external forces or internal pressures) being emitted while damage evolves in a
component [45]. This method can be used in various materials such as metal, ceramic, and
composite materials. The application of quantifying AE in CFRP materials is more complex
than other materials due to the high anisotropy in the mechanical properties and complex
damage mechanisms involved during structural loading and degradation. Therefore, although
AE holds promise in monitoring CFRP materials effectively, the quantification of damage
evolution is far more difficult and requires detailed research study.
1.3 Project Aims and Objectives
The increasing use of CFRP materials arises from the growing need to reduce structural weight,
increase strength and corrosion resistance of aerospace, automotive, maritime and wind energy
applications in order to improve energy efficiency and minimise the carbon dioxide (CO2)
emissions footprint of the transport and energy sectors. To detect and quantify any defects that
may have initiated and evolved in-service, inspection is carried out by expert personnel using
various NDT methods during planned maintenance.
Although the inspection results can provide useful information regarding the structural
condition of CFRP components, conventional NDT methods have several limitations in
assessing the severity of certain defects due to the complex micro-structural nature of CFRP
materials.
AE is a promising non-destructive testing technique which can be applied for the short or
long-term SHM of large components such as wind turbine blades and aircraft fuselage using a
small number of sensors. The accurate analysis of the data generated by AE sensors can
12
potentially be used to develop a predictive maintenance strategy by estimating the damage
sustained by a component under evaluation in a particular location as well as globally.
In this project, the AE technique has been employed as a means of detecting and continuously
monitoring damage initiation and evolution in CFRC materials. Due to the complexity of the
damage mechanisms affecting CFRC structures tests have been carried out initially on carbon
fibre bundles followed by tests on composite samples. The effect of artificially induced defects
on composite samples has been studied and assessed using the AE technique. The efficiency of
the AE technique in monitoring and evaluating the deterioration of the structural integrity of
CFRP components has been a key consideration of this study.
Tensile tests focused on the assessment of carbon fibre bundles in order to analyse the
effectiveness of the AE technique in detecting the fracture of filaments without the presence of
matrix material which complicates measurements due to the simultaneous presence of various
AE sources. The significance of the tests on fibre bundles enabled the identification of the
waveform type arising during filament failure including other characteristics of the AE event
such as its duration, amplitude and energy released.
Flexural and tensile tests were subsequently carried out on CFRP samples manufactured using
carbon fibre weaved fabric impregnated in epoxy resin. Tests were carried out on defective-free
samples as well as samples containing artificially induced defects of various types and severity.
AE measurements were carried out during flexural and tensile tests of the CFRP samples to
evaluate the capability of the technique in qualitatively and quantitatively assessing the
damage evolution with increasing load.
13

The experimental methodology and results produced are discussed in detail in the following
chapters of this thesis. As it will be shown, AE is indeed a powerful tool which is highly
suitable in detecting and assessing damage in CFRP materials. However, the effective
application of the AE technique in the field will require further research to prove its suitability
in quantifying damage apart from detecting when variable loads are present. The effect of
variability in loading conditions can complicate even further the structural health evaluation of
CFRP components as well as other materials used in manufacturing of load bearing
components.
14
CHAPTER 2
Fibre Reinforced Plastic Materials and Manufacturing
Process
15
2.1 Introduction
Composite materials can be divided into three main types: particle-reinforced, e.g. carbide
particle reinforced titanium, fibre-reinforced, e.g. carbon fibre in epoxy resin and structural
composites, e.g. sandwich and laminated composites [46]. In particle-reinforced composites,
the dispersed phase can be spheres, plates, ellipsoids, irregular, hollow or solid. Ceramic fibres,
whiskers, and particles are more likely to be used as dispersed phases in metal and ceramic
matrices [10].
FRP materials are advanced structural materials which are used extensively for the
construction of various light-weight, high performance, load bearing components for aircraft,
wind turbine blades, etc. The microstructure of FRP materials consists of two key elements; the
fibre and the matrix. The fibres are impregnated within the continuous polymer matrix phase.
Depending on the orientation and arrangement of the fibres (unidirectional, bidirectional,
multidirectional, woven, random or chopped) within the matrix the final structure may exhibit
significant anisotropy in the mechanical properties [10, 46]. The drawings in figure 2.1 show
the different orientations of fibres. The fibres used to reinforce the matrix are normally E-glass,
S-Glass, Carbon or Aramid although other types of synthetic and natural fibres can be
employed as mentioned in the previous chapter.
Generally, glass fibres are cheaper than carbon and aramid fibres. The graph in figure 2.2
provides a cost comparison between the various types of fibres. Therefore, they are the most
common type of fibre used in FRP composites. Approximately, 90% of all glass fibre-based
FRP use E-glass fibres and the rest S-glass. E-glass fibres are made of alumina-borosilicate
glass with less than 1% w/w alkali oxides and have low electrical conductivity. S-glass fibres
are boron-free made of alumina-silicate glass without CaO but with high MgO content giving
16
rise to high tensile strength properties. S-glass fibres’ modified silicate network gives them
higher tensile strength than E-glass. They are also less dense, more resistant when exposed to
higher temperature and more expensive than E-glass fibres.
a) b)
c) d)
e)
Figure 2.1: Unidirectional, bidirectional, multidirectional, woven and random orientations of
FRP composites [47].
17
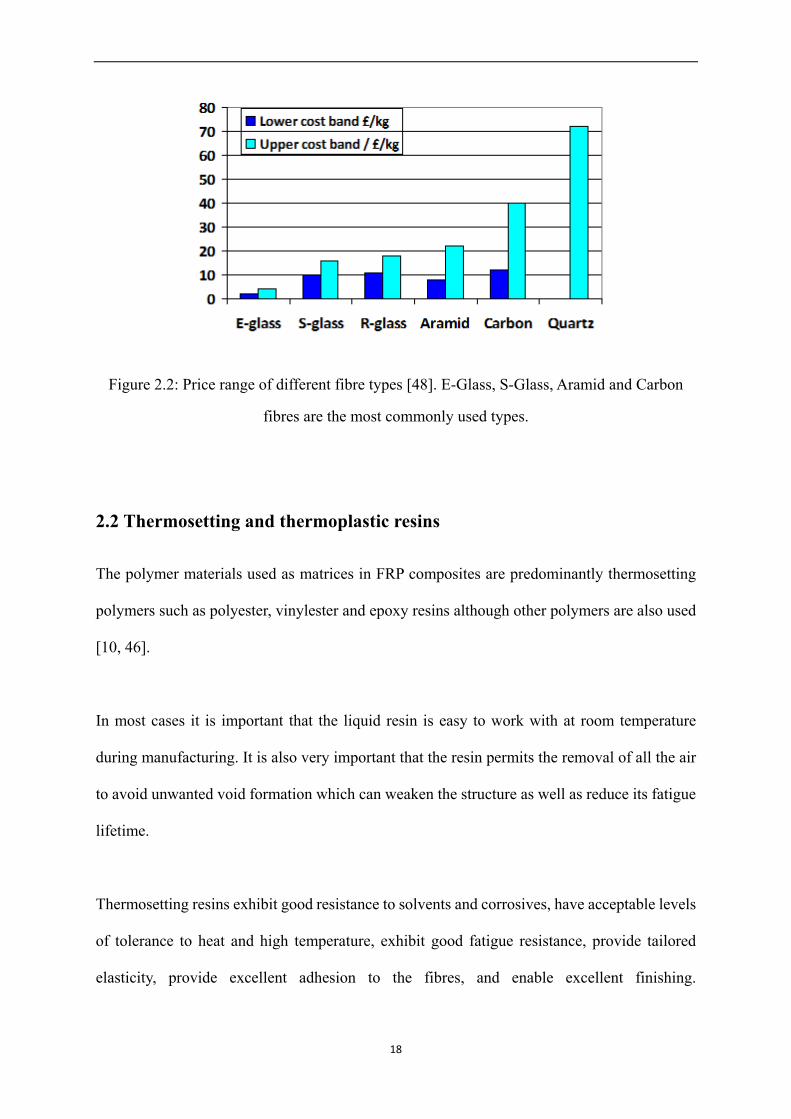
Figure 2.2: Price range of different fibre types [48]. E-Glass, S-Glass, Aramid and Carbon
fibres are the most commonly used types.
2.2 Thermosetting and thermoplastic resins
The polymer materials used as matrices in FRP composites are predominantly thermosetting
polymers such as polyester, vinylester and epoxy resins although other polymers are also used
[10, 46].
In most cases it is important that the liquid resin is easy to work with at room temperature
during manufacturing. It is also very important that the resin permits the removal of all the air
to avoid unwanted void formation which can weaken the structure as well as reduce its fatigue
lifetime.
Thermosetting resins exhibit good resistance to solvents and corrosives, have acceptable levels
of tolerance to heat and high temperature, exhibit good fatigue resistance, provide tailored
elasticity, provide excellent adhesion to the fibres, and enable excellent finishing.
18
Unfortunately, the most important disadvantage of thermosetting resins is that after they have
been catalysed, the process cannot be reversed and the thermosetting polymer cannot be
reformed.
As a result once a thermoset FRP has formed, it cannot be remould nor reshaped and hence
recycling is not possible. Nonetheless, certain research groups have been investigating the
retrieval of the reinforcing fibres at least through removal of the resin through thermal or
mechanical processes [49]. Mechanical recycling processes are based on the fragmentation of
the original FRP composite into smaller particles in the form of powders or fibrous products
which can then be used as potential reinforcement [50]. Thermal processes on the other hand
aim to recover the fibres themselves only by burning away the thermosetting polymer resin.
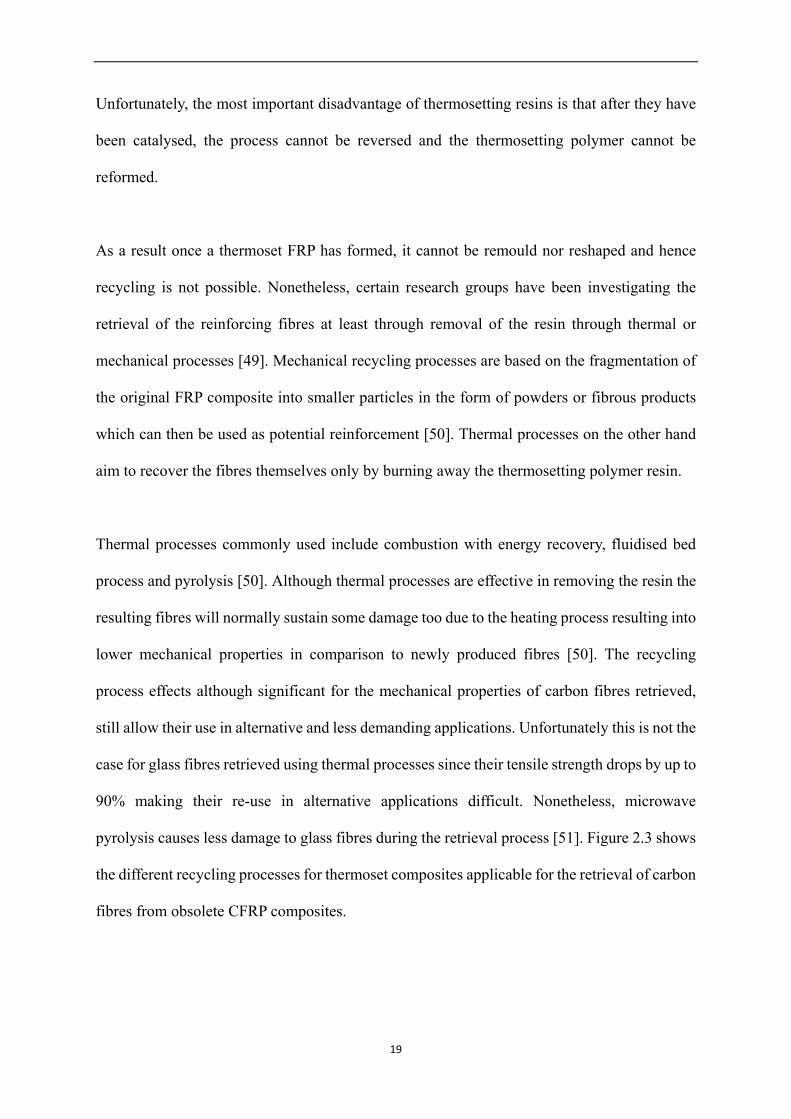
Thermal processes commonly used include combustion with energy recovery, fluidised bed
process and pyrolysis [50]. Although thermal processes are effective in removing the resin the
resulting fibres will normally sustain some damage too due to the heating process resulting into
lower mechanical properties in comparison to newly produced fibres [50]. The recycling
process effects although significant for the mechanical properties of carbon fibres retrieved,
still allow their use in alternative and less demanding applications. Unfortunately this is not the
case for glass fibres retrieved using thermal processes since their tensile strength drops by up to
90% making their re-use in alternative applications difficult. Nonetheless, microwave
pyrolysis causes less damage to glass fibres during the retrieval process [51]. Figure 2.3 shows
the different recycling processes for thermoset composites applicable for the retrieval of carbon
fibres from obsolete CFRP composites.
19
Chemical recycling of thermoset composites has been a subject of extensive research in recent
years to minimise damage on retrieved fibres. Although chemical recycling processes hold
promise they have so far been restricted to laboratory research studies and commercialisation is
yet to be achieved [52].
Figure 2.3: Recycling process for thermoset composites [50].
Thermoplastic resins are extensively used in unreinforced components. However, in recent
years the market of FRP composites employing thermoplastic resins has been undergoing rapid
growth with the automotive and aerospace industries leading the way [53]. FRP thermoplastic
composite make use of discontinuous glass or carbon fibres as reinforcement due to the high
viscosity of the resins which makes the impregnation of continuous fibres difficult. The
strength achieved by discontinuous fibres used to reinforce the matrix is not as high as for FRP
composites reinforced with continuous fibre. The use of FRP thermoplastic components is
preferred when a reduction in weight is highly desirable but no critical loads need to be
sustained. Therefore, their application is suitable for the manufacturing of non-critical
structural components. However, more recently, certain thermoplastic resins, such as PEEK,
reinforced with continuous fibres have been used for manufacturing load bearing structural
components [54].
20
Thermoplastic FRPs offer certain advantages over thermoset FRPs. First of all they are easier
to recycle and allow post-forming operations to be carried out. They also have better damage
tolerance although not as high resistance to solvent as thermoset resins [55]. They also have
better impact resistance which in some cases can be 10 times as high as that of comparable
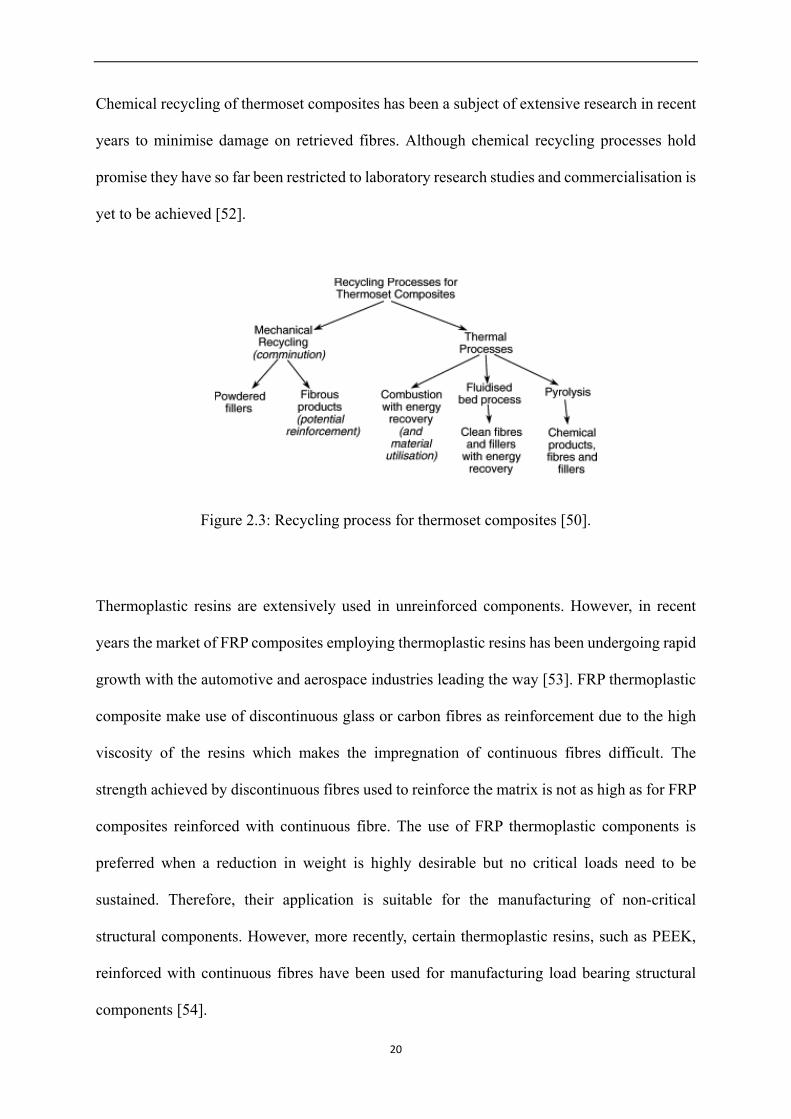
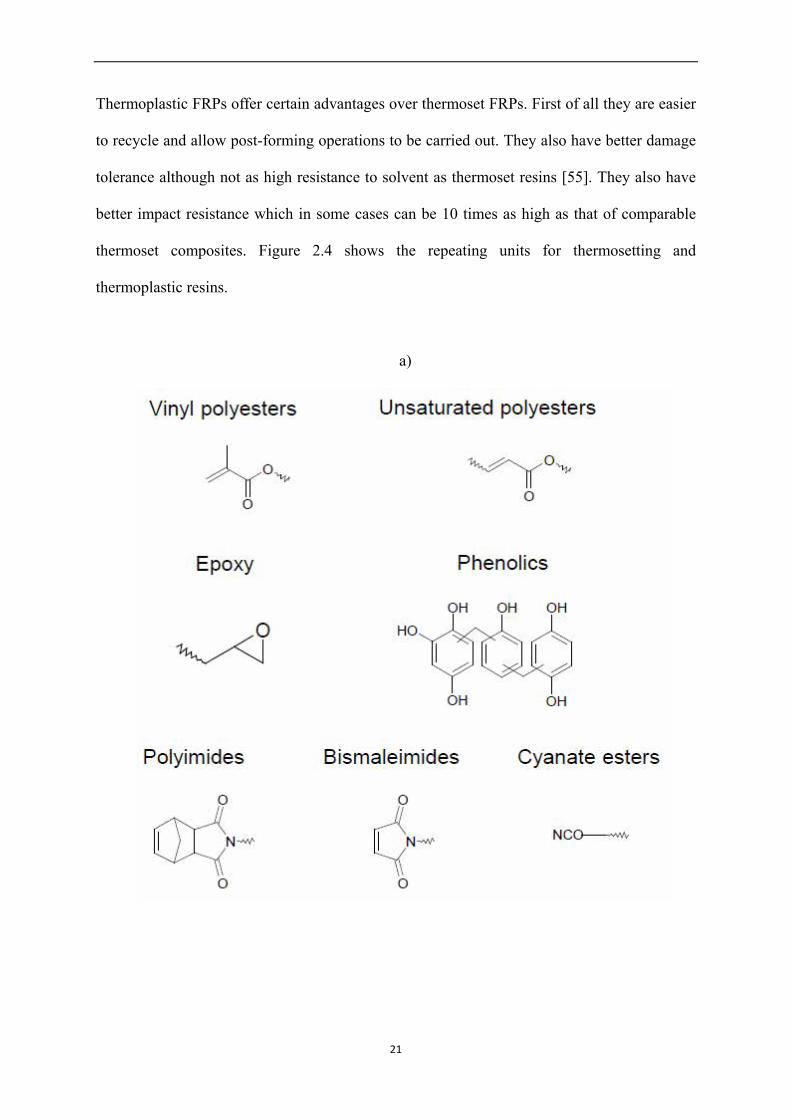
thermoset composites. Figure 2.4 shows the repeating units for thermosetting and
thermoplastic resins.
a)
21
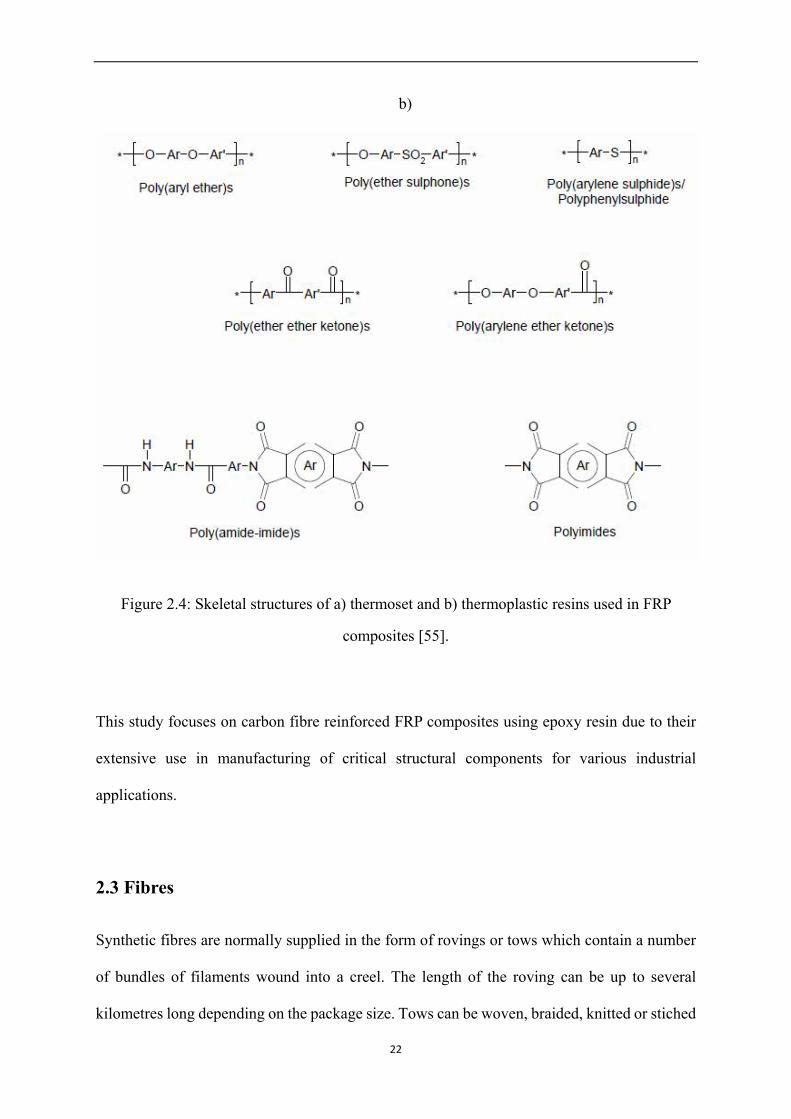
b)
Figure 2.4: Skeletal structures of a) thermoset and b) thermoplastic resins used in FRP
composites [55].
This study focuses on carbon fibre reinforced FRP composites using epoxy resin due to their
extensive use in manufacturing of critical structural components for various industrial
applications.
2.3 Fibres
Synthetic fibres are normally supplied in the form of rovings or tows which contain a number
of bundles of filaments wound into a creel. The length of the roving can be up to several
kilometres long depending on the package size. Tows can be woven, braided, knitted or stiched
22
into a range of fabrics including plain weave, twills and various satin weave types. The tow size
can be selected depending on the weight or areal density of fabric that is needed. Fabrics can be
woven using a combination of fibres, such as carbon in the weft and glass in the warp direction
increasing the range of the mechanical properties available to the designers and manufacturers
of particular components [7, 10]. Fabrics offer some significant advantages over filament
bundles since they can conform to curves surfaces without the risk of wrinkling whilst fibre
performs tailored to the shape of the final component are also possible. Nonetheless,
convolution at the crossover points in woven fabrics or loops in knitted fabrics reduces the final
reinforcing level achievable.
The fibres need to be surface treated prior to impregnation in order to achieve good level of
adhesion with the matrix. The fibre surface is roughened by chemical etching following
coating size. The level of adhesion of the fibres to the matrix is critical for the final mechanical
properties of the FRP composite produced. Poor fibre adhesion to the matrix can result in fibre
pull-outs and fibre debonding reducing the mechanical properties and fatigue lifetime of the
FRP composite considerably during monotonic or cyclic loading conditions.
Carbon fibres are chemically inert and the fibre-matrix interface quality achieved poor if no
surface treatment is carried out [56]. For this reason, different methods of carbon fibre surface
activation have been developed. These can be categorised into oxidative and non-oxidative
processes [57].
FRP composites can be classified based on the embedded fibre length, to continuous (fibre
length > 15x critical length), and discontinuous fibre (fibre length < critical length) [46].
Depending on the fibre direction fibre composites can be classified to unidirectional,
23
bidirectional, multidirectional, woven or random as mentioned earlier. Different fibre layouts
can be used to satisfy different operational requirements. For example unidirectional FRP
composites have very good mechanical properties in the direction parallel to fibre direction but
poor transverse properties. If the component is expected to be loaded in various directions then
a multi-directional FRP is more appropriate. Also for structural components requiring high
impact resistance, multi-directional fibre direction composite are again preferred.
Although the FRP composite strength arises primarily from the mechanical properties and
orientation of the reinforcing fibres, the matrix is equally important. The ability of the matrix to
provide protection to the fibres, support them and provide out-of-plane strength is also relevant
for the overall performance of an FRP composite. Thus, a good match between the properties
of the reinforcing fibres and the matrix is particularly beneficial for the overall mechanical
properties of the final FRP material.
It should be noted that different reinforcing fibres can be employed in manufacturing versatile
FRP composites resulting in lower overall cost and hybrid mechanical properties, e.g. glass
fibres with carbon fibres. The difficulty lies in the integration of two different types of fibre
bundles with considerably different dimensions and number of filaments present. Thus the
effective hybridisation of two different types of bundles is currently the subject of extensive
research [58].
2.4 Carbon FRP Composites
Carbon fibres with a 7-8 μm diameter are formed of crystallite or fibril structural units which
have similar atomic structure to that of graphite. The crystallites consist of small graphite units
24
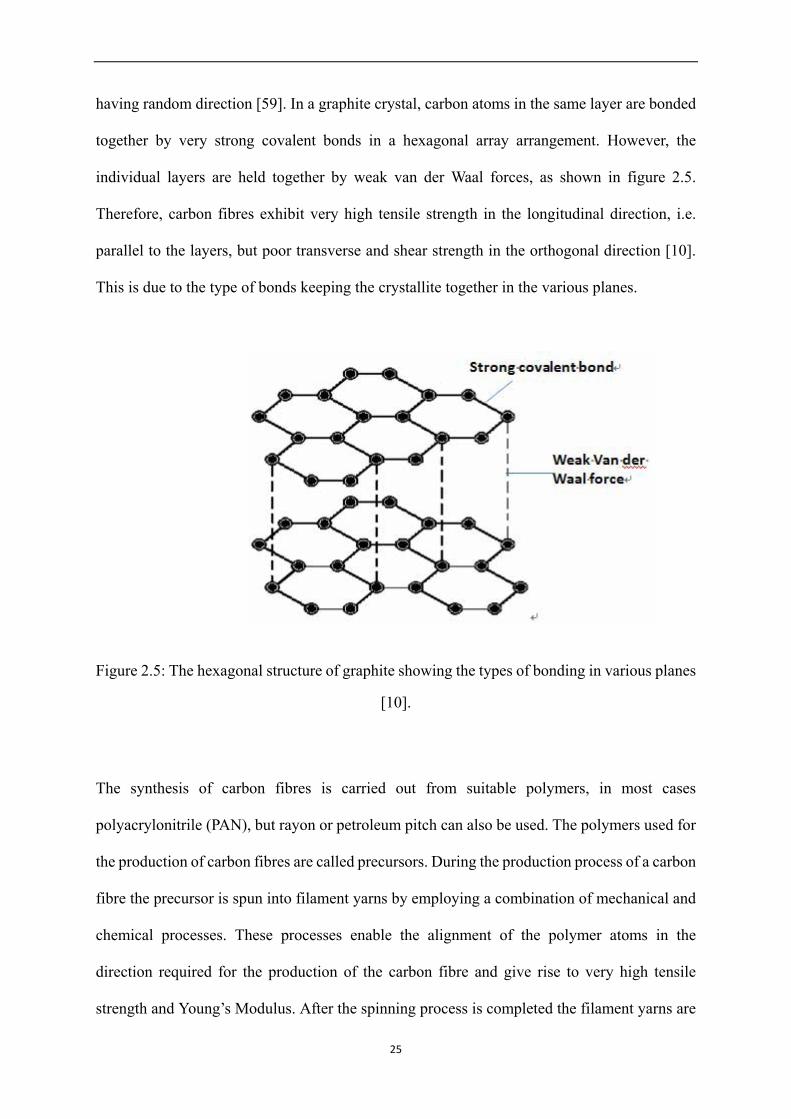
having random direction [59]. In a graphite crystal, carbon atoms in the same layer are bonded
together by very strong covalent bonds in a hexagonal array arrangement. However, the
individual layers are held together by weak van der Waal forces, as shown in figure 2.5.
Therefore, carbon fibres exhibit very high tensile strength in the longitudinal direction, i.e.
parallel to the layers, but poor transverse and shear strength in the orthogonal direction [10].
This is due to the type of bonds keeping the crystallite together in the various planes.
Figure 2.5: The hexagonal structure of graphite showing the types of bonding in various planes
[10].
The synthesis of carbon fibres is carried out from suitable polymers, in most cases
polyacrylonitrile (PAN), but rayon or petroleum pitch can also be used. The polymers used for
the production of carbon fibres are called precursors. During the production process of a carbon
fibre the precursor is spun into filament yarns by employing a combination of mechanical and
chemical processes. These processes enable the alignment of the polymer atoms in the
direction required for the production of the carbon fibre and give rise to very high tensile
strength and Young’s Modulus. After the spinning process is completed the filament yarns are
25
heated to remove non-carbon atoms that can cause a reduction in the final mechanical
properties of the carbon fibre. This process is known as carbonisation and results into the final
carbon fibre product which can then be wound on to suitable bobbins [10].
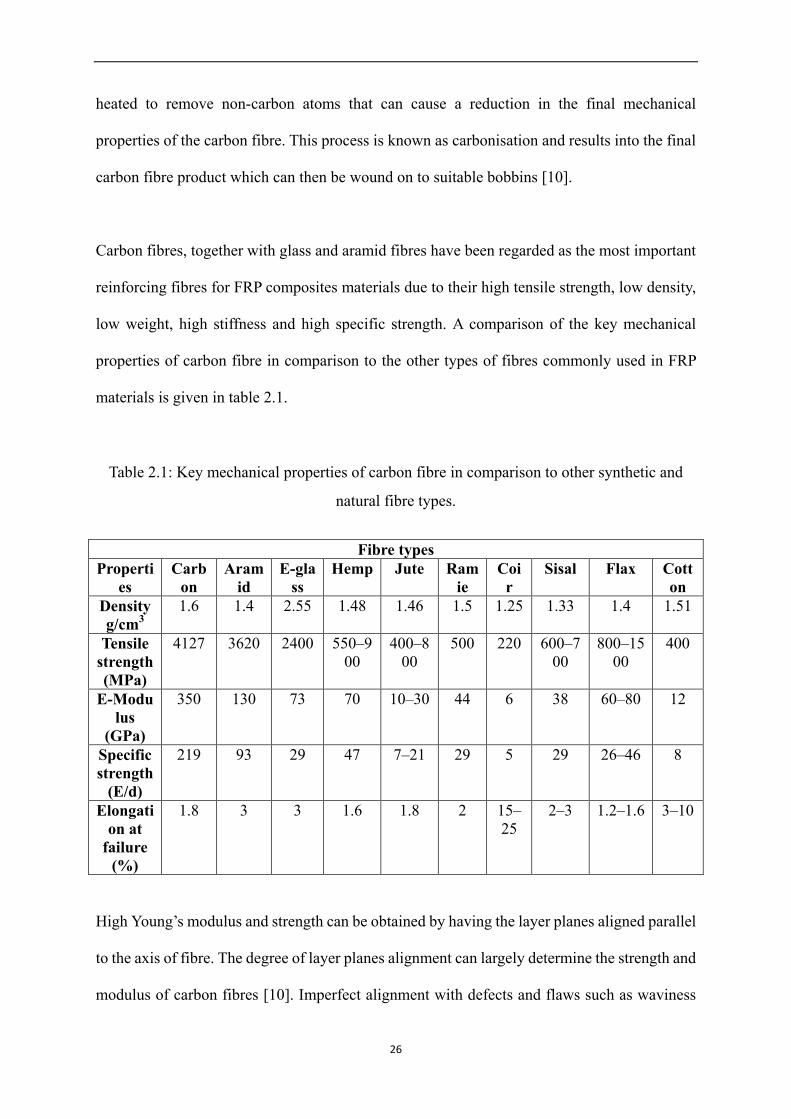
Carbon fibres, together with glass and aramid fibres have been regarded as the most important
reinforcing fibres for FRP composites materials due to their high tensile strength, low density,
low weight, high stiffness and high specific strength. A comparison of the key mechanical
properties of carbon fibre in comparison to the other types of fibres commonly used in FRP
materials is given in table 2.1.
Table 2.1: Key mechanical properties of carbon fibre in comparison to other synthetic and
natural fibre types.
Fibre types Properti
es Carb
on Aram
id E-gla
ss Hemp Jute Ram
ie Coi
r Sisal Flax Cott
on Density g/cm3
1.6 1.4 2.55 1.48 1.46 1.5 1.25 1.33 1.4 1.51
Tensile strength (MPa)
4127 3620 2400 550–900
400–800
500 220 600–700
800–1500
400
E-Modulus
(GPa)
350 130 73 70 10–30 44 6 38 60–80 12
Specific strength
(E/d)
219 93 29 47 7–21 29 5 29 26–46 8
Elongation at
failure (%)
1.8 3 3 1.6 1.8 2 15–25
2–3 1.2–1.6 3–10
High Young’s modulus and strength can be obtained by having the layer planes aligned parallel
to the axis of fibre. The degree of layer planes alignment can largely determine the strength and
modulus of carbon fibres [10]. Imperfect alignment with defects and flaws such as waviness
26
and cross-over are inevitable during the production process. Defects and flaws are distributed
along the fibre length, lowering the mechanical properties of fibres and making tensile
properties variable [10].
It is believed that the longer the fibre length, the greater the probability of defects and flaws in
the fibres. Therefore the tensile strength of the fibre can decrease with the increment of fibre
length [60]. In order to evaluate the tensile properties of fibres, two methods can be used;
single fibre testing and fibre bundle testing [61]. In this study the fibre bundle testing method
has been used as it is more straightforward to carry out and appropriate for the more effective
evaluation of the AE technique with which this project is primarily concerned. This method has
been used for the assessment of AE technique in numerous other studies [62-68].
The fibre length embedded in matrix plays a critical role in determining its reinforcement
efficiency. In a fibre-matrix system, the tensile stress transmitted from the matrix to the fibres,
is maximum in the centre of the fibre but there is no tensile load transmitted to fibre ends [10].
This means that the maximum tensile load is only achieved at the axial centre of fibre.
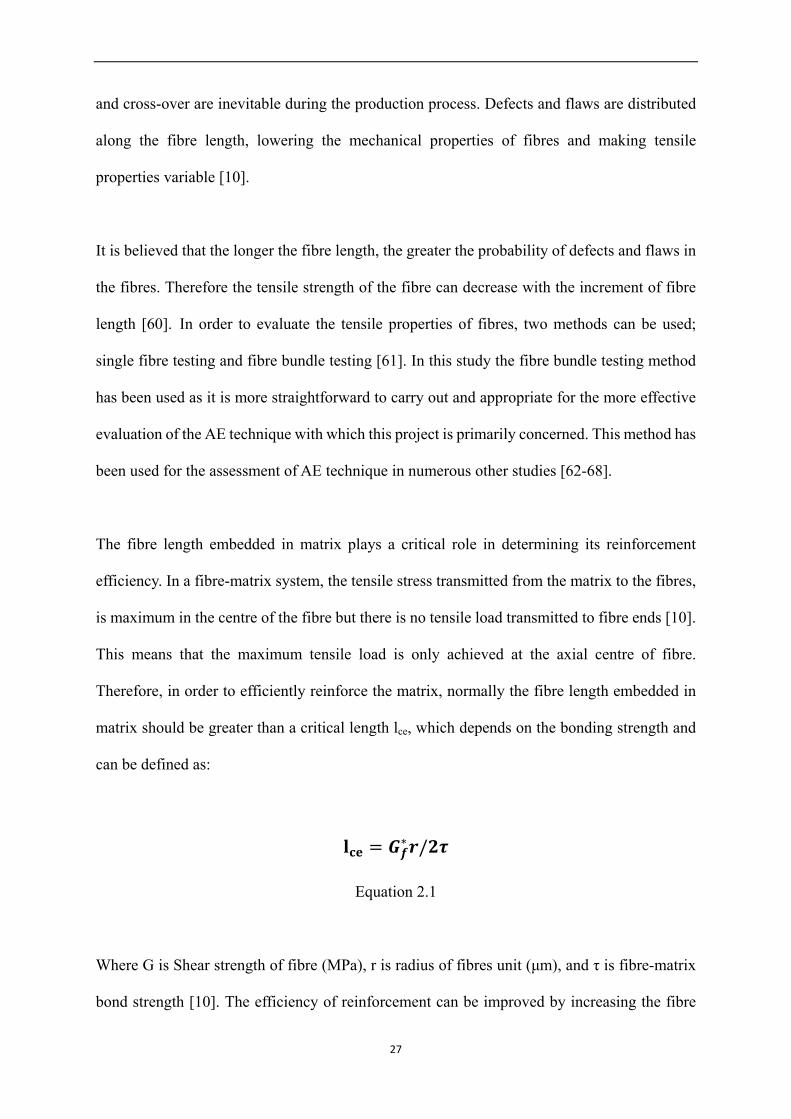
Therefore, in order to efficiently reinforce the matrix, normally the fibre length embedded in
matrix should be greater than a critical length lce, which depends on the bonding strength and
can be defined as:
𝐥𝐜𝐞 = 𝑮𝒇∗𝒓/𝟐𝝉
Equation 2.1
Where G is Shear strength of fibre (MPa), r is radius of fibres unit (μm), and τ is fibre-matrix
bond strength [10]. The efficiency of reinforcement can be improved by increasing the fibre
27
length depending on the design of the component and provided waviness is kept to a minimum
[46]. Nonetheless, the maximum shear stress is built-up at the fibre ends while is zero at the
centre of fibre. Ttherefore debonding between fibre and matrix usually initiates in the fibre
ends [10].
The matrix binds the fibres together, transmits and distributes the applied load to the fibres.
Thus, the load born by the matrix is small. The matrix also provides protection to the fibre
reinforcement keeping the fibres separated and preventing crack growth [46]. In CFRP
composites, the matrix is usually epoxy resin but other types of resins can be employed as
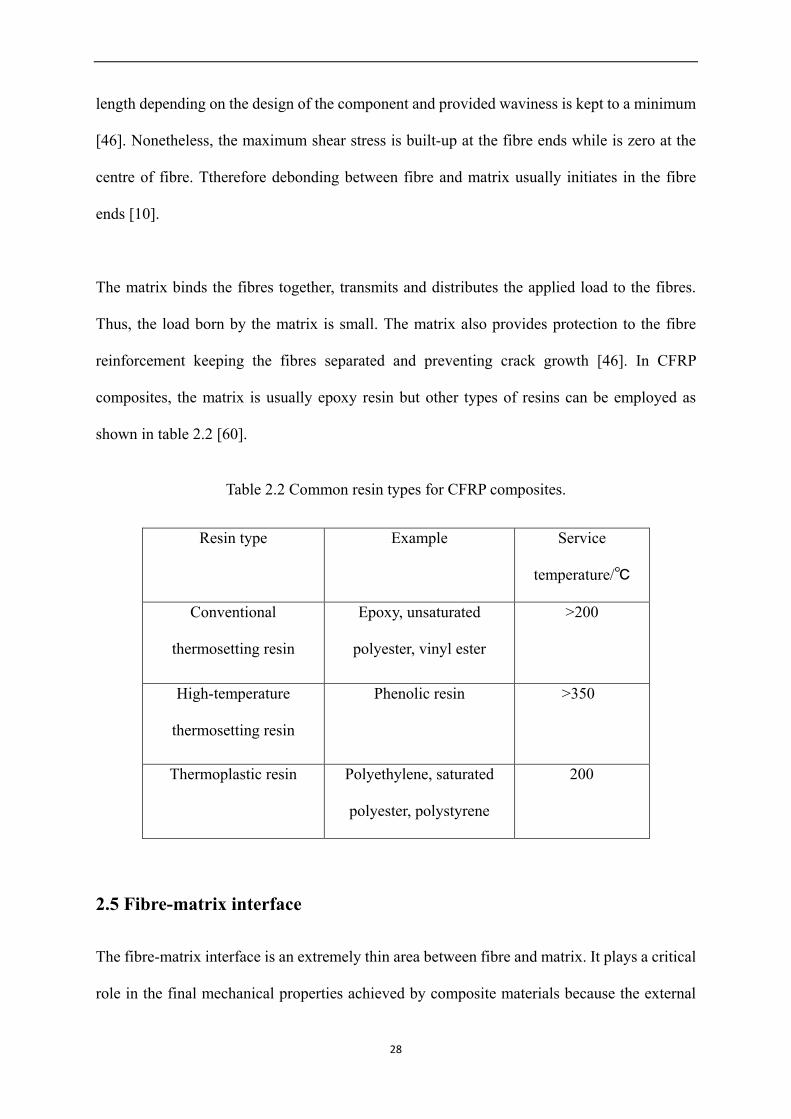
shown in table 2.2 [60].
Table 2.2 Common resin types for CFRP composites.
Resin type Example Service
temperature/℃
Conventional
thermosetting resin
Epoxy, unsaturated
polyester, vinyl ester
>200
High-temperature
thermosetting resin
Phenolic resin >350
Thermoplastic resin Polyethylene, saturated
polyester, polystyrene
200
2.5 Fibre-matrix interface
The fibre-matrix interface is an extremely thin area between fibre and matrix. It plays a critical
role in the final mechanical properties achieved by composite materials because the external
28
applied load acting on the matrix is transmitted to the fibres via this interface. The strength of
the fibre-matrix interface largely depends on the bonding quality between the fibres and matrix.
The interface bonding is specific to each fibre-matrix system [69]. A very complex chemical
bond is formed in the case of carbon/epoxy FRP composites. In this case, the surface of carbon
is highly active, and easily absorbs gases, therefore various functional groups such as “–C-OH”
and “-C=O” can be produced at the edge of the basal planes of carbon by treatment like heating
in oxygen, these functional groups then can bond with unsaturated resin to form interface bond
[69]. The bonding strength is largely determined by the reactivity of the surface of carbon.
Composites with strong interface (higher bonding strength) have higher strength and stiffness
than composites with weak interface [10]. However, composites with strong interface are
brittle with a maximum elastic elongation to failure of 2-3% with no plastic deformation
occurring. A relatively weak interface is required in some special cases [60].
2.6 Manufacturing processes of fibre-reinforced composites
There are various manufacturing routes for fibre-reinforced composites. These can be widely
classified into two types: open mould process such as autoclave and filament winding, and
closed mould process such as pultrusion and resin infusion.
In the case of autoclave, pre-preg sheets (unidirectional fibre pre-impregnated with resin and
partially cured) with required shape are stacked in predetermined fibre orientation. Then the
pre-preg is placed on the mould surface and covered with plastic bags. After that, the pre-preg
laminations are cured under the required pressure and temperature in the autoclave [10].
29
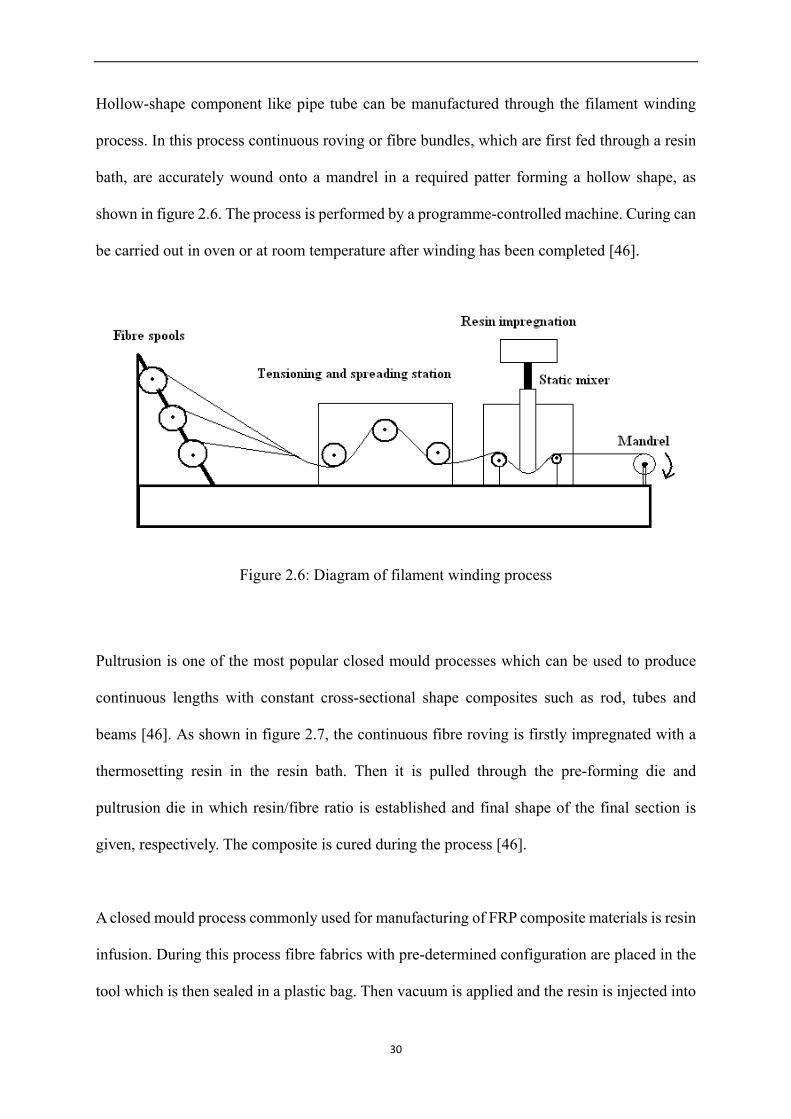
Hollow-shape component like pipe tube can be manufactured through the filament winding
process. In this process continuous roving or fibre bundles, which are first fed through a resin
bath, are accurately wound onto a mandrel in a required patter forming a hollow shape, as
shown in figure 2.6. The process is performed by a programme-controlled machine. Curing can
be carried out in oven or at room temperature after winding has been completed [46].
Figure 2.6: Diagram of filament winding process
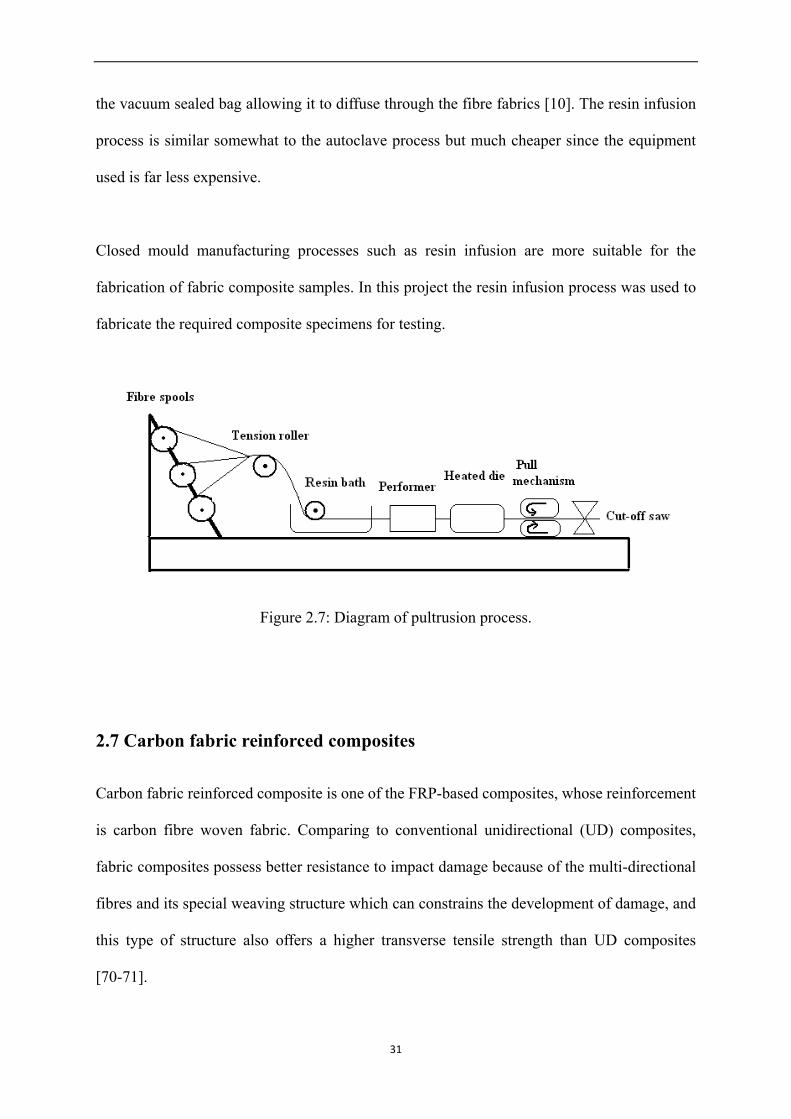
Pultrusion is one of the most popular closed mould processes which can be used to produce
continuous lengths with constant cross-sectional shape composites such as rod, tubes and
beams [46]. As shown in figure 2.7, the continuous fibre roving is firstly impregnated with a
thermosetting resin in the resin bath. Then it is pulled through the pre-forming die and
pultrusion die in which resin/fibre ratio is established and final shape of the final section is
given, respectively. The composite is cured during the process [46].
A closed mould process commonly used for manufacturing of FRP composite materials is resin
infusion. During this process fibre fabrics with pre-determined configuration are placed in the
tool which is then sealed in a plastic bag. Then vacuum is applied and the resin is injected into
30
the vacuum sealed bag allowing it to diffuse through the fibre fabrics [10]. The resin infusion
process is similar somewhat to the autoclave process but much cheaper since the equipment
used is far less expensive.
Closed mould manufacturing processes such as resin infusion are more suitable for the
fabrication of fabric composite samples. In this project the resin infusion process was used to
fabricate the required composite specimens for testing.
Figure 2.7: Diagram of pultrusion process.
2.7 Carbon fabric reinforced composites
Carbon fabric reinforced composite is one of the FRP-based composites, whose reinforcement
is carbon fibre woven fabric. Comparing to conventional unidirectional (UD) composites,
fabric composites possess better resistance to impact damage because of the multi-directional
fibres and its special weaving structure which can constrains the development of damage, and
this type of structure also offers a higher transverse tensile strength than UD composites
[70-71].
31
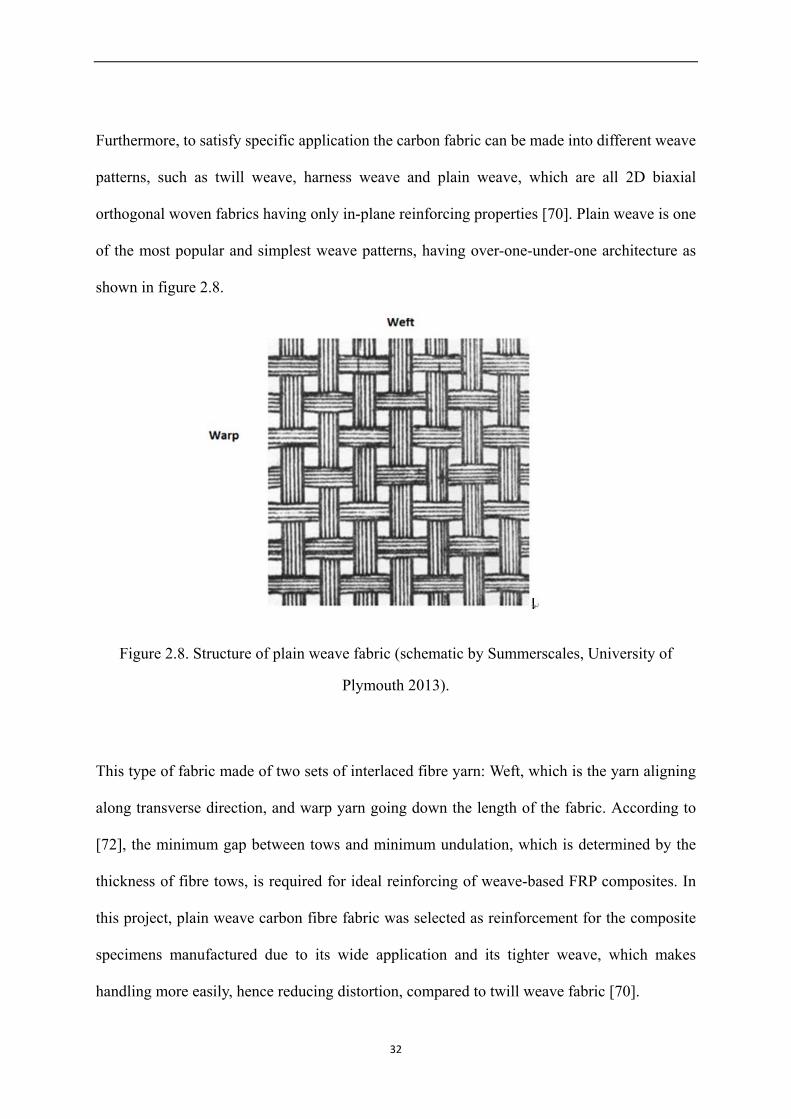
Furthermore, to satisfy specific application the carbon fabric can be made into different weave
patterns, such as twill weave, harness weave and plain weave, which are all 2D biaxial
orthogonal woven fabrics having only in-plane reinforcing properties [70]. Plain weave is one
of the most popular and simplest weave patterns, having over-one-under-one architecture as
shown in figure 2.8.
Figure 2.8. Structure of plain weave fabric (schematic by Summerscales, University of
Plymouth 2013).
This type of fabric made of two sets of interlaced fibre yarn: Weft, which is the yarn aligning
along transverse direction, and warp yarn going down the length of the fabric. According to
[72], the minimum gap between tows and minimum undulation, which is determined by the
thickness of fibre tows, is required for ideal reinforcing of weave-based FRP composites. In
this project, plain weave carbon fibre fabric was selected as reinforcement for the composite
specimens manufactured due to its wide application and its tighter weave, which makes
handling more easily, hence reducing distortion, compared to twill weave fabric [70].
32
Fabric reinforced composites have complex internal 3D architecture as the result of waviness
generated by the interweaving yarns [72]. Therefore, some particular failure mechanisms that
do not occur in unidirectional FRP composites are likely be seen in fabric reinforced
composites due to the complex stress/strain field induced by the 3D architecture, for example,
intra-ply delamination, transverse and shear failure and fracture of pure resin area [72]. The
methods used to analyse the mechanical properties of fabric FRP composites have been
developed based on analytical and numerical models. Most of these methods rely on the
technique which analyses the smallest geometrical repetitive unit cell (RUC) of the composite
material [72]. The properties and failure mechanisms of 2D plain weave composites have been
investigated by numerous of studies [73-76]. In the study by Zhou [73], the transverse and
longitudinal tows damage and matrix crack of plain weave composite were evaluated using
numerical models based on modified Finite element analysis (FEA) Furthermore, the
strain/stress and progressive failure behaviour of plain weave composite were studied by Naik
[74]. The value of analytical and numerical models is undeniable in understanding the failure
mechanisms of FRP composites. However, usually in the case of analytical models simplified
assumption may be required. Numerical models require high modelling effort and custom
numerical discretisation in order to produce results comparable to those seen in experimental
work [72].
The study of the complicated damage mechanisms of fabric reinforced composites using AE
technique is thus of particular interest. Since the various failure modes do generate AE signals
with different features and energies it is possible to assess damage propagation. Moreover,
there have been a limited number of studies investigating the damage evolution of plain weave
composites using AE technique.
33
CHAPTER 3
Defects and Damage Mechanisms in Composite Materials
34
3.1 Introduction
Composite materials, including CFRPs, are required to be lightweight and exhibit excellent
mechanical strength, fatigue and environmental resistance. Nonetheless, like all other materials,
composite materials can contain manufacturing defects or become damaged while in-service or
during handling and installation. These are also the three categories in which damage in
composite materials can be classified.
The presence of manufacturing defects or damage arising due to exposure to in-service
conditions or inappropriate handling and installation has precarious consequences to the
overall performance of the composite materials and their fatigue limit and lifetime. It is
therefore, that all defects regardless of their type are detected using suitable inspection
techniques as early as possible to avoid disastrous consequences that may arise from
catastrophic failure of a component manufactured from a composite material.
As discussed earlier, the damage mechanisms of composite materials and CFRPs in particular
are very complex. Since composite materials consist of two different materials and possibly
several layers bonded together, non-destructive testing (NDT) based on traditional techniques
such as ultrasonic testing (UT) is not straightforward at all.
The complexity of the inspection rises further if we take into account the requirement not only
to detect a defect but also to assess quantitatively or at least qualitatively within an acceptable
margin of confidence the severity of the damage present. It is well understood that finding a
defect is inadequate in order to determine the need for maintenance, repair or replacement of a
component regardless whether it is made of an alloy, polymer, ceramic or composite material.
35

It is thus imperative when inspection of structural components is carried out to be able to
determine a multitude of parameters, including type of defect present, orientation, location,
size and shape of the flaw. Knowledge of these defect parameters is required if sound decisions
are to be made regarding the maintenance requirements of a particular structure or component
concerned.
In the modern industrial world competition is severe throughout all sectors. However, in the
aerospace, automotive, maritime and wind energy sectors, i.e. the industries which are
currently making most use of advanced composite materials and especially CFRP, competition
is even stronger and more aggressive.
Therefore, maintenance strategies are critical in ensuring as a minimum the complete return of
the investment (ROI) at the end of the intended lifetime of a particular project (e.g. an offshore
wind turbine or aircraft). The only exception to this rule is the sports industry where
maintenance is not a priority since in most cases composite components are expendable and are
intended for a one-off application in each competition event.
3.2 Manufacturing defects
Despite the advances and improvements achieved in the production process of composite
materials which have resulted in products with much better quality, it is still possible that
microscopic or macroscopic manufacturing defects may be present.
Manufacturing defects, such as voids, fibre waviness, poor adhesion of the interface, etc.,
which can be occasionally found in composite materials and more specifically in CFRP, can
36
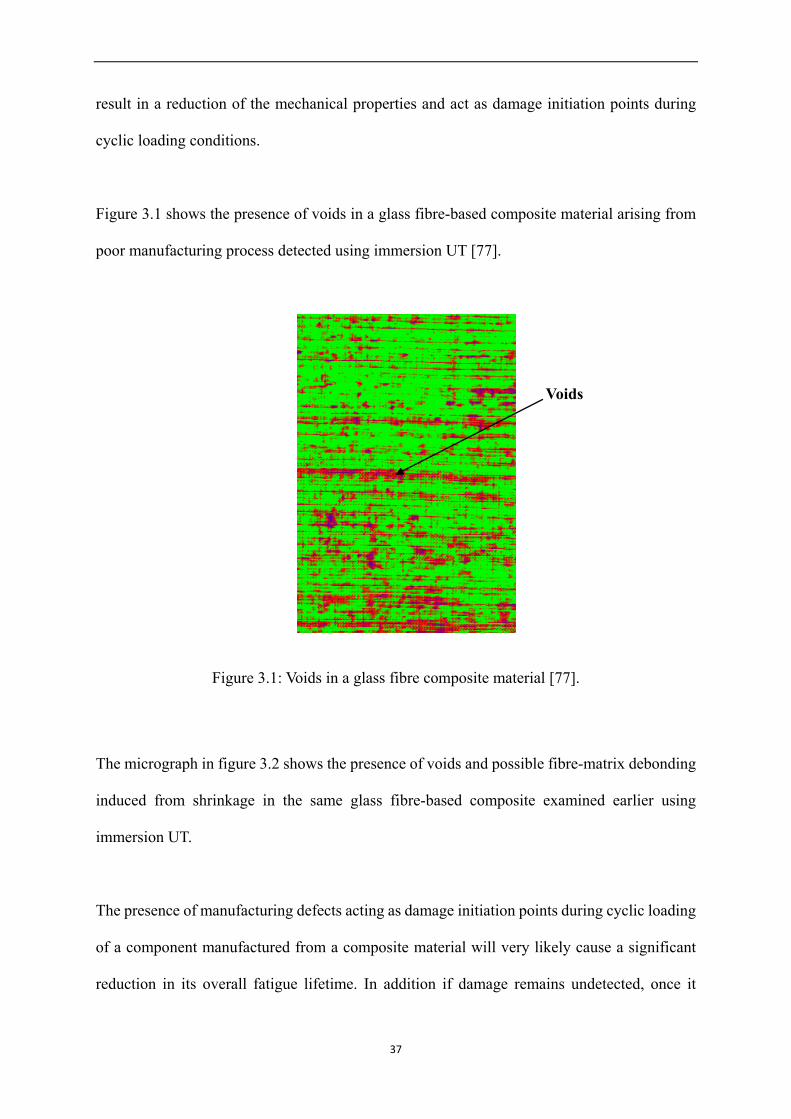
result in a reduction of the mechanical properties and act as damage initiation points during
cyclic loading conditions.
Figure 3.1 shows the presence of voids in a glass fibre-based composite material arising from
poor manufacturing process detected using immersion UT [77].
Figure 3.1: Voids in a glass fibre composite material [77].
The micrograph in figure 3.2 shows the presence of voids and possible fibre-matrix debonding
induced from shrinkage in the same glass fibre-based composite examined earlier using
immersion UT.
The presence of manufacturing defects acting as damage initiation points during cyclic loading
of a component manufactured from a composite material will very likely cause a significant
reduction in its overall fatigue lifetime. In addition if damage remains undetected, once it
Voids
37
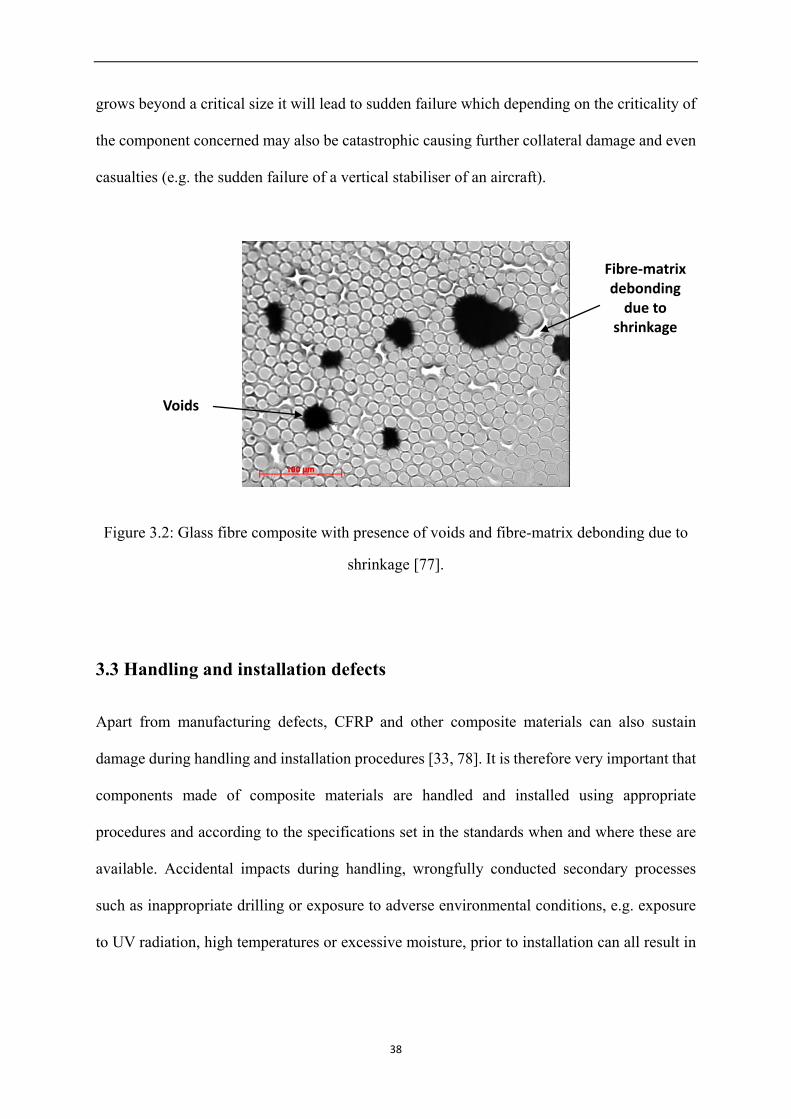
grows beyond a critical size it will lead to sudden failure which depending on the criticality of
the component concerned may also be catastrophic causing further collateral damage and even
casualties (e.g. the sudden failure of a vertical stabiliser of an aircraft).
Figure 3.2: Glass fibre composite with presence of voids and fibre-matrix debonding due to
shrinkage [77].
3.3 Handling and installation defects
Apart from manufacturing defects, CFRP and other composite materials can also sustain
damage during handling and installation procedures [33, 78]. It is therefore very important that
components made of composite materials are handled and installed using appropriate
procedures and according to the specifications set in the standards when and where these are
available. Accidental impacts during handling, wrongfully conducted secondary processes
such as inappropriate drilling or exposure to adverse environmental conditions, e.g. exposure
to UV radiation, high temperatures or excessive moisture, prior to installation can all result in
Fibre-matrix debonding
due to shrinkage
Voids
38
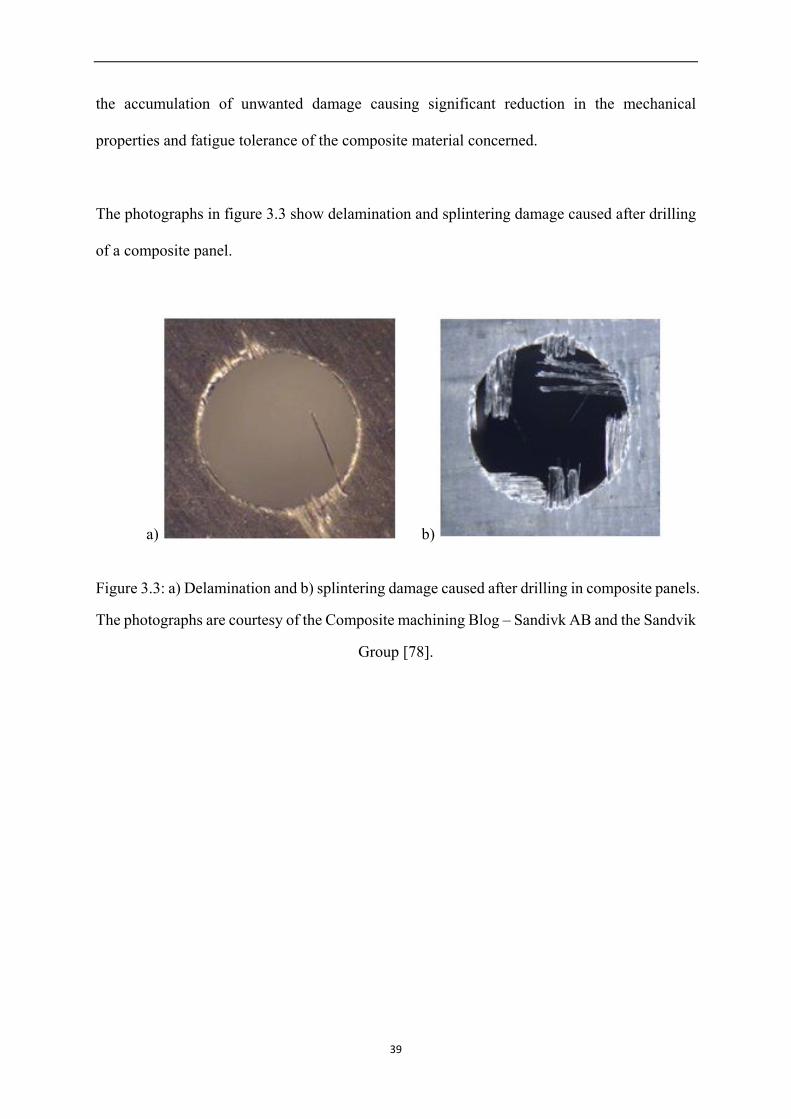
the accumulation of unwanted damage causing significant reduction in the mechanical
properties and fatigue tolerance of the composite material concerned.
The photographs in figure 3.3 show delamination and splintering damage caused after drilling
of a composite panel.
a) b)
Figure 3.3: a) Delamination and b) splintering damage caused after drilling in composite panels.
The photographs are courtesy of the Composite machining Blog – Sandivk AB and the Sandvik
Group [78].
39
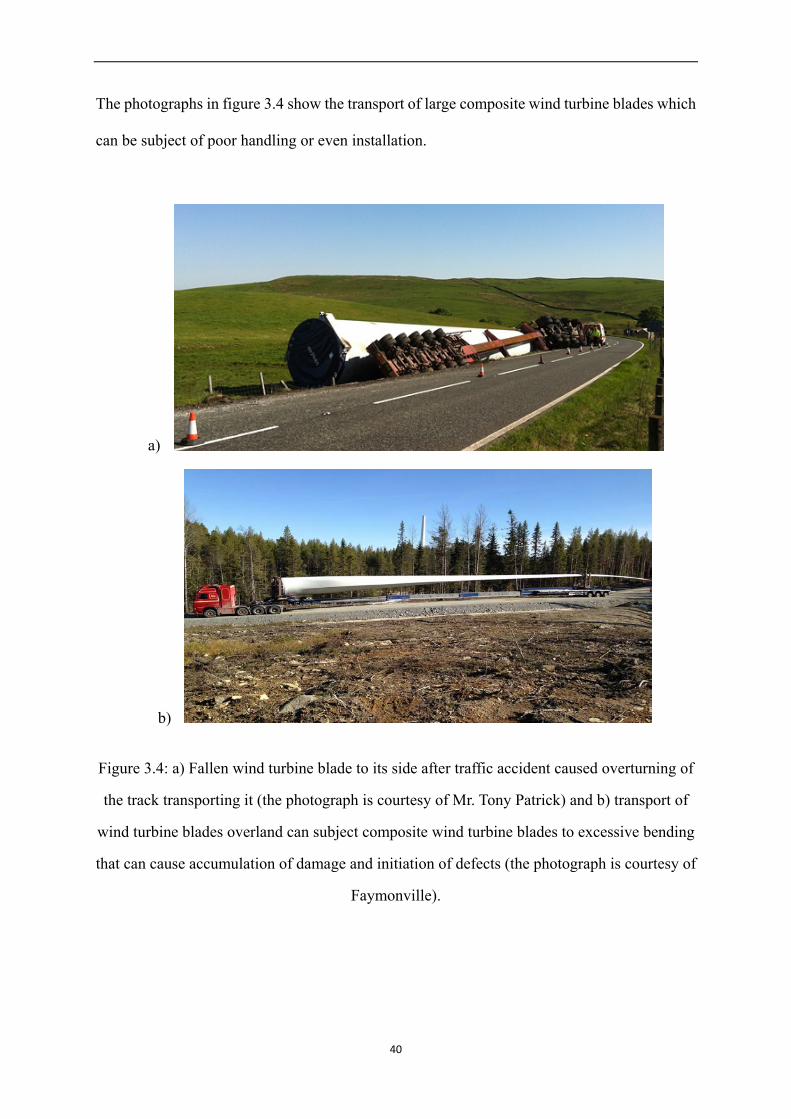
The photographs in figure 3.4 show the transport of large composite wind turbine blades which
can be subject of poor handling or even installation.
a)
b)
Figure 3.4: a) Fallen wind turbine blade to its side after traffic accident caused overturning of
the track transporting it (the photograph is courtesy of Mr. Tony Patrick) and b) transport of
wind turbine blades overland can subject composite wind turbine blades to excessive bending
that can cause accumulation of damage and initiation of defects (the photograph is courtesy of
Faymonville).
40
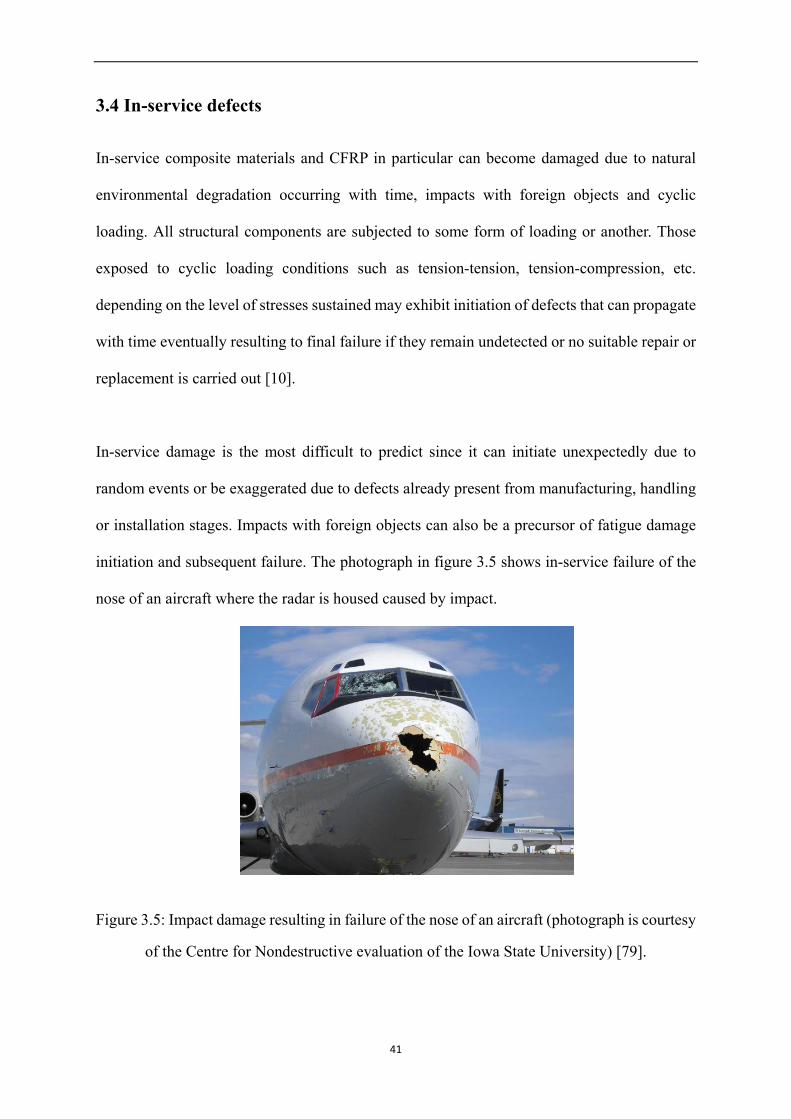
3.4 In-service defects
In-service composite materials and CFRP in particular can become damaged due to natural
environmental degradation occurring with time, impacts with foreign objects and cyclic
loading. All structural components are subjected to some form of loading or another. Those
exposed to cyclic loading conditions such as tension-tension, tension-compression, etc.
depending on the level of stresses sustained may exhibit initiation of defects that can propagate
with time eventually resulting to final failure if they remain undetected or no suitable repair or
replacement is carried out [10].
In-service damage is the most difficult to predict since it can initiate unexpectedly due to
random events or be exaggerated due to defects already present from manufacturing, handling
or installation stages. Impacts with foreign objects can also be a precursor of fatigue damage
initiation and subsequent failure. The photograph in figure 3.5 shows in-service failure of the
nose of an aircraft where the radar is housed caused by impact.
Figure 3.5: Impact damage resulting in failure of the nose of an aircraft (photograph is courtesy
of the Centre for Nondestructive evaluation of the Iowa State University) [79].
41
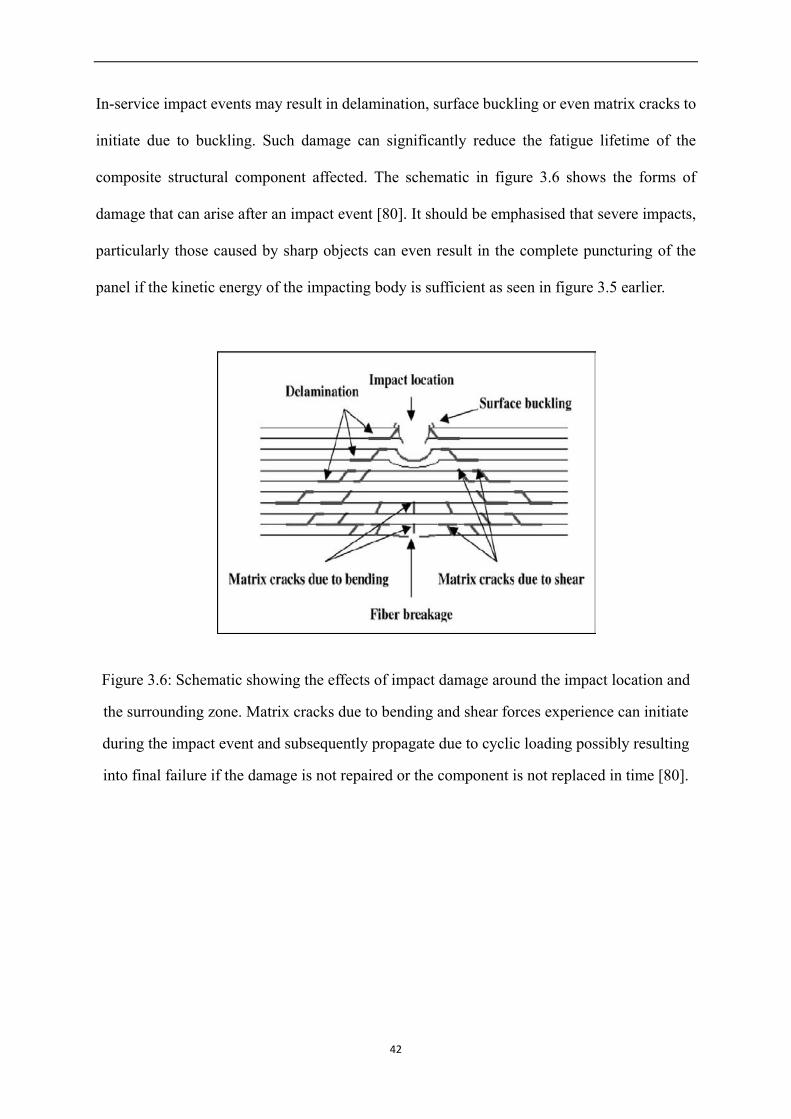
In-service impact events may result in delamination, surface buckling or even matrix cracks to
initiate due to buckling. Such damage can significantly reduce the fatigue lifetime of the
composite structural component affected. The schematic in figure 3.6 shows the forms of
damage that can arise after an impact event [80]. It should be emphasised that severe impacts,
particularly those caused by sharp objects can even result in the complete puncturing of the
panel if the kinetic energy of the impacting body is sufficient as seen in figure 3.5 earlier.
Figure 3.6: Schematic showing the effects of impact damage around the impact location and
the surrounding zone. Matrix cracks due to bending and shear forces experience can initiate
during the impact event and subsequently propagate due to cyclic loading possibly resulting
into final failure if the damage is not repaired or the component is not replaced in time [80].
42
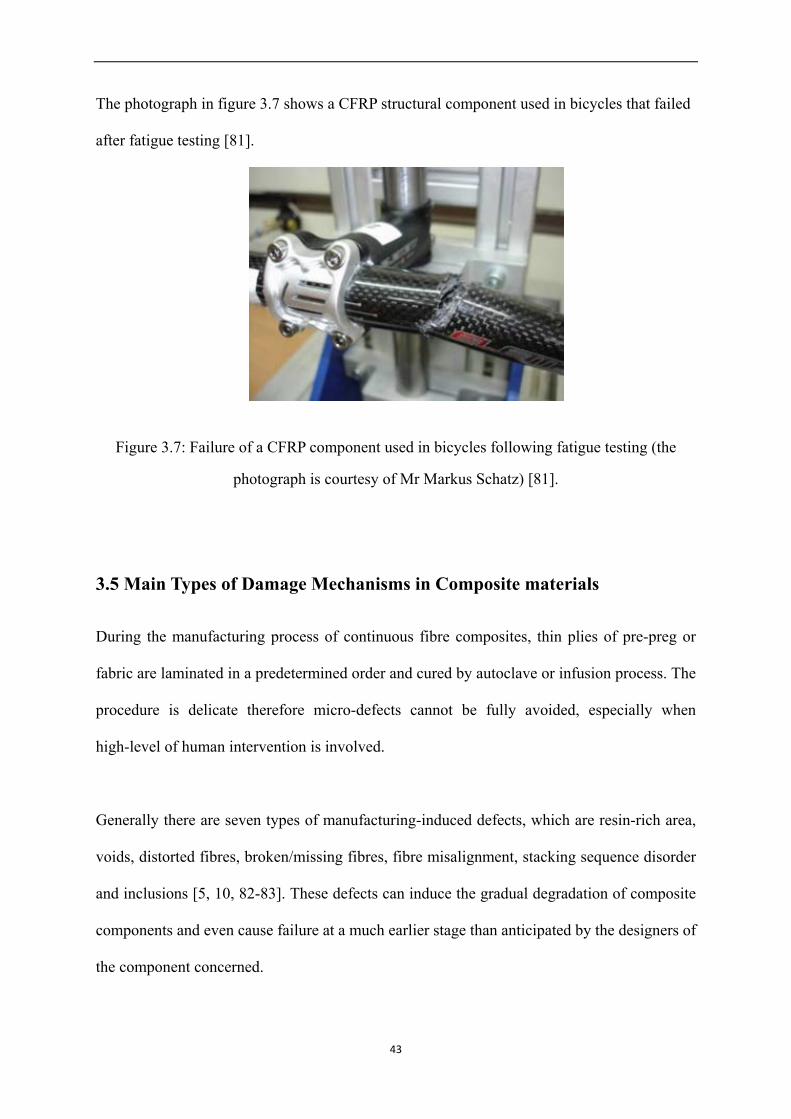
The photograph in figure 3.7 shows a CFRP structural component used in bicycles that failed
after fatigue testing [81].
Figure 3.7: Failure of a CFRP component used in bicycles following fatigue testing (the
photograph is courtesy of Mr Markus Schatz) [81].
3.5 Main Types of Damage Mechanisms in Composite materials
During the manufacturing process of continuous fibre composites, thin plies of pre-preg or
fabric are laminated in a predetermined order and cured by autoclave or infusion process. The
procedure is delicate therefore micro-defects cannot be fully avoided, especially when
high-level of human intervention is involved.
Generally there are seven types of manufacturing-induced defects, which are resin-rich area,
voids, distorted fibres, broken/missing fibres, fibre misalignment, stacking sequence disorder
and inclusions [5, 10, 82-83]. These defects can induce the gradual degradation of composite
components and even cause failure at a much earlier stage than anticipated by the designers of
the component concerned.
43
Due to the importance of defects in the overall structural integrity and quality of mechanical
properties of composite materials the effects of various types of defects such as fibre waviness,
voids, holes, etc., on the structural integrity of composite materials have been extensively
investigated in numerous studies [84-94].
Resin-rich areas are common in composite materials, especially in woven fabric-based
composites whose nature induces resin-rich area at the cross-over points [5]. Damage initiation
can occur in the resin-rich area and therefore, it can lead to the gradual and rapid degradation of
the mechanical performance of the composite.
Voids are another common defect present in composite materials, particularly those used in
maritime applications which are not autoclaved but are produced using predominantly hand
lay-up manufacturing processes. During the hand lay-up process if not properly carried out can
produce high levels of voids resulting from entrapment of air or volatiles [95]. In the aerospace
industry where autoclaves and pre-pregs are extensively used the occurrence of voids is
negligible.
There are two basic types of voids: a) along fibres and b) between laminates [10]. The presence
of voids between laminates is a type of defect that has a noteworthy effect on the interlaminar
shear strength (ILSS) of the composite. According to Summerscales [96], the ILSS can
decrease by 7% as void content increases by 1% up to a total void content of about 4%.
Furthermore, the degradation of other mechanical properties due to the first 1% of voids such
as flexural strength (30% decrement), tensile properties (3% decrement) and impact strength (8%
decrement) has also been reported [96].
44
Distorted fibres due to waviness are the result of the large difference of thermal expansion
coefficient between carbon fibre and polymer matrix. This can induce the build-up of residual
stresses during the cooling stage and therefore fibre distortion or kinking [97-102]. The effect
of distorted fibre or fibre waviness on the tensile properties of composite materials was firstly
investigated by Van Dreumel and Kamp in 1977, who found a 20% decrease in the tensile
strength of the CFRC material studied [102].
Fibres can be broken during handling or processing stage causing a significant decrease in the
tensile strength of CFRC. A previous study on CFRC laminates (0̊, ±45̊) by Cantwell and
Morton in 1992 revealed that tensile strength reduced by 25% when a single tow was cut in the
sample [103].
The same authors reported that the introduction of paper inclusions 10 mm in diameter used to
simulate void defects resulted in reduction of the compressive strength of carbon fibre
honeycomb sandwich by 25% [103].
Fibre orientation is one of the determinant factors on the strength and stiffness of CFRC, as
mentioned earlier CFRC may have higher strength and stiffness along the fibre direction.
Therefore the predicted mechanical properties can be degraded by a fibre misalignment angle
of only ten degrees (10°). Moreover the loading on the interface between fibres and matrix can
be changed from pure tension/compression to shear loading when there is ten to twenty degrees
(10-20°) of fibre misalignment angle. Hence, misalignment in this range can result in a
noticeable decrease of the tensile strength of a composite material [97].
45
Another important manufacturing defect which is not uncommon is the incorrect stacking
sequence of fibre laminates. This mainly occurs when complex arrangement of fibre
orientations is required in CFRC to optimise the design strength and performance. For example,
if the placement of two closed layers were transposed in a structural CFRC component made of
hundreds of fabric layers, then the bending properties of the component may be degraded. It is
believed that this kind of defect is critical to flexural properties but it has less influence on
tension/compression properties [96].
Besides these classic manufacturing defects mentioned above, there are some types of other
defects that can be present in CFRC components such as hole-shape defects on single fabric
layer, through-hole defects, notch and saw scratch caused by improper handling or incorrect
secondary processes. The influence of such defects on the mechanical properties of the
composite materials can be detrimental resulting in unexpected failure of the affected
components. These types of defects have also been investigated in this study together with AE
monitoring.
Table 3.1 summarises some of the most common types of defects found in composite materials
and their effect in the mechanical properties of the composite materials.
46
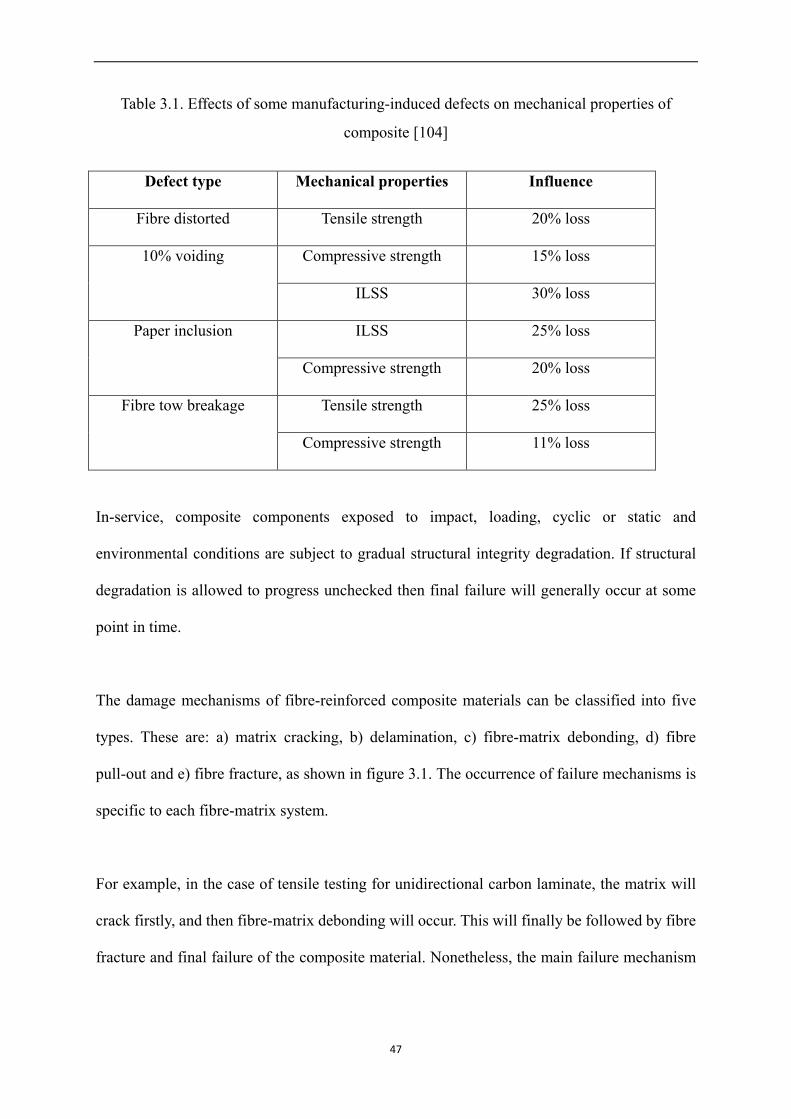
Table 3.1. Effects of some manufacturing-induced defects on mechanical properties of
composite [104]
Defect type Mechanical properties Influence
Fibre distorted Tensile strength 20% loss
10% voiding
Compressive strength 15% loss
ILSS 30% loss
Paper inclusion ILSS 25% loss
Compressive strength 20% loss
Fibre tow breakage Tensile strength 25% loss
Compressive strength 11% loss
In-service, composite components exposed to impact, loading, cyclic or static and
environmental conditions are subject to gradual structural integrity degradation. If structural
degradation is allowed to progress unchecked then final failure will generally occur at some
point in time.
The damage mechanisms of fibre-reinforced composite materials can be classified into five
types. These are: a) matrix cracking, b) delamination, c) fibre-matrix debonding, d) fibre
pull-out and e) fibre fracture, as shown in figure 3.1. The occurrence of failure mechanisms is
specific to each fibre-matrix system.
For example, in the case of tensile testing for unidirectional carbon laminate, the matrix will
crack firstly, and then fibre-matrix debonding will occur. This will finally be followed by fibre
fracture and final failure of the composite material. Nonetheless, the main failure mechanism
47
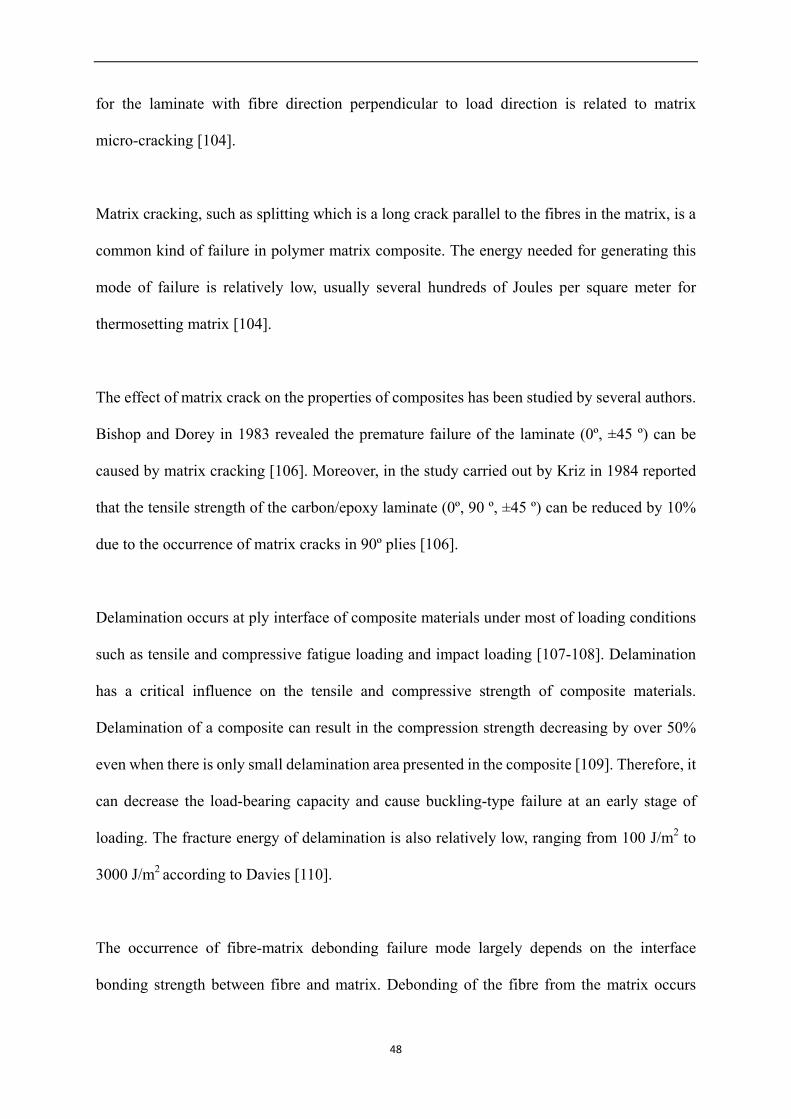
for the laminate with fibre direction perpendicular to load direction is related to matrix
micro-cracking [104].
Matrix cracking, such as splitting which is a long crack parallel to the fibres in the matrix, is a
common kind of failure in polymer matrix composite. The energy needed for generating this
mode of failure is relatively low, usually several hundreds of Joules per square meter for
thermosetting matrix [104].
The effect of matrix crack on the properties of composites has been studied by several authors.
Bishop and Dorey in 1983 revealed the premature failure of the laminate (0º, ±45 º) can be
caused by matrix cracking [106]. Moreover, in the study carried out by Kriz in 1984 reported
that the tensile strength of the carbon/epoxy laminate (0º, 90 º, ±45 º) can be reduced by 10%
due to the occurrence of matrix cracks in 90º plies [106].
Delamination occurs at ply interface of composite materials under most of loading conditions
such as tensile and compressive fatigue loading and impact loading [107-108]. Delamination
has a critical influence on the tensile and compressive strength of composite materials.
Delamination of a composite can result in the compression strength decreasing by over 50%
even when there is only small delamination area presented in the composite [109]. Therefore, it
can decrease the load-bearing capacity and cause buckling-type failure at an early stage of
loading. The fracture energy of delamination is also relatively low, ranging from 100 J/m2 to
3000 J/m2 according to Davies [110].
The occurrence of fibre-matrix debonding failure mode largely depends on the interface
bonding strength between fibre and matrix. Debonding of the fibre from the matrix occurs
48
when the shear stress in fibre-matrix interface exceeds the bonding strength inevitably causing
the separation of the fibre from the matrix as shown in figure 3.8.
Figure 3.8: Schematic description of crack propagation in a fibre reinforced composite
The level of fibre surface treatment during manufacturing, which can increase bonding strength,
in turn, critically determines the amount of fibre-matrix debonding. This means that debonding
can be reduced by using fibres with high levels of surface treatment [103].
The occurrence of fibre pull-out or fibre fracture largely depends on the fibre length “le”
embedded in the matrix. If the fibre length increases over the critical length lce, then the fibre
will fracture before pull-out can occur. For fibre pull-out failure, the pull-out energy of 110
J/m2 for carbon-fibre/epoxy composite has been reported by Kirk et al. in 1978 [111].
Matri
Fibr
Delaminitio
Debondin Crack
Fibre
49
Since fibres play the main role in sustaining applied load in fibre-reinforced composite
materials, their damages may result in large reduction of stiffness and strength of components,
even a small amount of fibre breakages can cause failure [109]. Because of the brittleness of the
fibre, its fracture energy goes up to 60 KJ/m2 for untreated CFRC [112].
The composite materials used in this study are plain weave carbon fabric (0º, 90 º fibre
direction) composites whose failure mechanisms are specific and complex. As reported in
previous studies, unidirectional fibre laminates experience matrix cracking, fibre-matrix
debonding, fibre pull-out and fibre fracture during longitudinal tensile testing [113-114].
The internal structures of weave carbon fabric composites are complicated and therefore
intra-ply delamination, transverse and shear failure and fracture of pure resin area may occur in
this type kind of composites [115].
Ingress of moisture can also cause variations in the anticipated mechanical properties of
composite materials and therefore it is highly undesirable [116-117]. Normally, composite
materials which are expected to operate in wet environments, i.e. exposed to rain, or are
in-service at sea will be protected using appropriate coating so as to prevent the absorption of
moisture causing detrimental effects to the mechanical properties.
50

CHAPTER 4
Non-Destructive Testing of Composite Materials
51

4.1 Introduction
Components manufactured from composite materials such as CFRPs need to be inspected at
various stages of their lifetime using appropriate non-destructive testing (NDT) technique.
This is done in order to ensure satisfactory quality as well as so that there are no critical defects
which can compromise the structural integrity of composite components. The presence of
mechanical damage in a composite component can eventually result in catastrophic failure if it
remains unchecked. Structural composite components are normally inspected throughout their
life cycle from production stages, after installation and while being in-service.
Inspection of in-service components is normally carried out during pre-determined outages and
according to the maintenance schedules anticipated by the design engineers for a component
operating under certain environmental and loading conditions. The maintenance schedule is
normally heavily dependent on the criticality of the structural component concerned, the cost
of the downtime incurred during maintenance intervals and the operational conditions
encountered in-service.
Having said that, unscheduled inspections are not ruled out, particularly if known abnormal
events have occurred that may have induced damage unexpectedly or have caused initiation of
certain damage mechanisms which can contribute to the reduction of the overall fatigue
lifetime of a composite component. An appropriate example of such a case is the accidental
impact of a foreign object on the wing of an aircraft or a lightning strike on a wind turbine blade.
Such events are likely to cause damage on the composite component that will necessitate an
earlier than scheduled inspection.
52
Once the type of the damage has been assessed and the severity quantified appropriate
maintenance in the form of repairs or complete replacement of the component concerned can
be carried out. Through this approach the risk of catastrophic failure can be averted, avoiding
unnecessary downtime and further damage of the asset affected.
In order to inspect composite components various NDT techniques can be employed including
visual inspection, dye penetrant inspection (DPI), ultrasonic testing (UT), Long Range
Ultrasonics (LRU), eddy current testing (ECT), active thermography, shearography and
radiography. It should be emphasised that ECT is only applicable for CFRC materials due to
the electrically conductive nature of carbon fibres that allows generation of eddy currents.
Variables of UT have also been considered for the non-destructive evaluation of the structural
integrity of composite materials such as laser ultrasonics, acoustography, ultrasonic
spectroscopy and acousto-ultrasonics [31]. The uses of impact-echo testing and vibration
analysis have also been considered but these techniques provide more qualitative rather than
quantitative results. Moreover, they either require data trending or numerous calibration
samples in order to reveal the severity and possibly the type of defect present.
Structural health monitoring (SHM) techniques such as acoustic emission, fibre bragg gratings
(FBGs), vibration and strain gauges can be employed for the continuous and online evaluation
of the structural integrity of FRC components and the loads they sustain. However, these
techniques will be the subject of discussion of the following chapter. The present chapter is
concerned with the discussion of NDT techniques carried out manually by inspection
engineers.
53
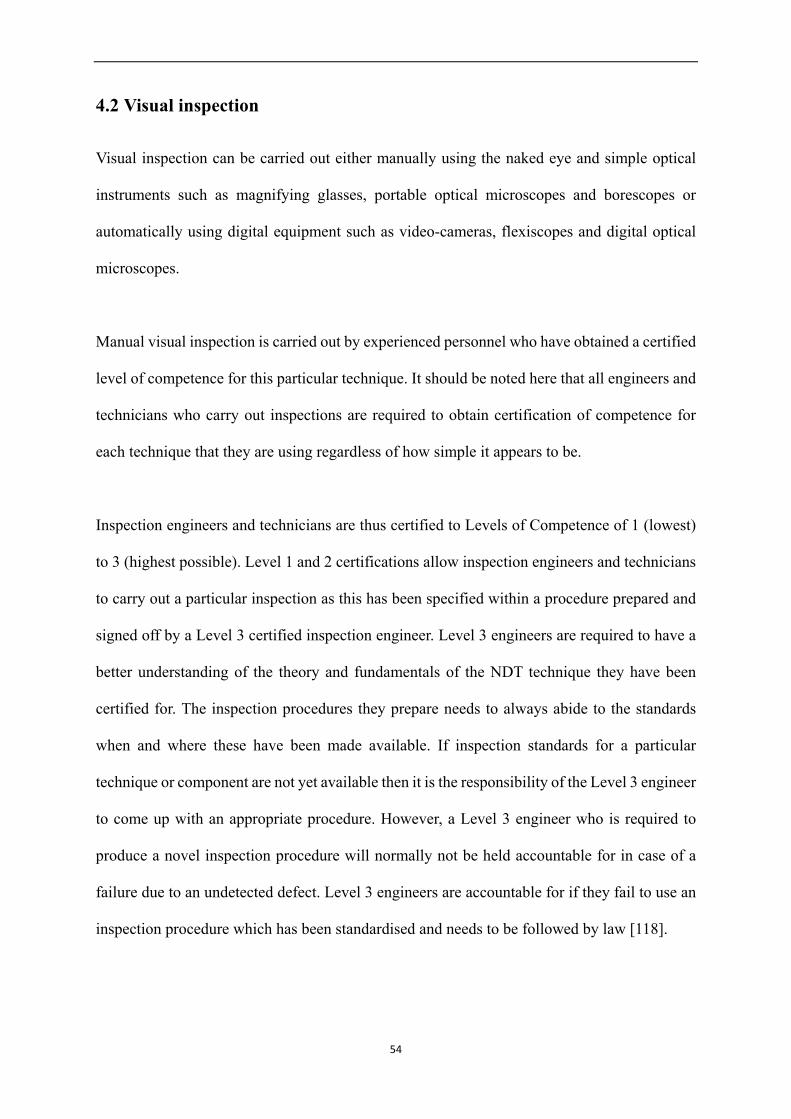
4.2 Visual inspection
Visual inspection can be carried out either manually using the naked eye and simple optical
instruments such as magnifying glasses, portable optical microscopes and borescopes or
automatically using digital equipment such as video-cameras, flexiscopes and digital optical
microscopes.
Manual visual inspection is carried out by experienced personnel who have obtained a certified
level of competence for this particular technique. It should be noted here that all engineers and
technicians who carry out inspections are required to obtain certification of competence for
each technique that they are using regardless of how simple it appears to be.
Inspection engineers and technicians are thus certified to Levels of Competence of 1 (lowest)
to 3 (highest possible). Level 1 and 2 certifications allow inspection engineers and technicians
to carry out a particular inspection as this has been specified within a procedure prepared and
signed off by a Level 3 certified inspection engineer. Level 3 engineers are required to have a
better understanding of the theory and fundamentals of the NDT technique they have been
certified for. The inspection procedures they prepare needs to always abide to the standards
when and where these have been made available. If inspection standards for a particular
technique or component are not yet available then it is the responsibility of the Level 3 engineer
to come up with an appropriate procedure. However, a Level 3 engineer who is required to
produce a novel inspection procedure will normally not be held accountable for in case of a
failure due to an undetected defect. Level 3 engineers are accountable for if they fail to use an
inspection procedure which has been standardised and needs to be followed by law [118].
54
Visual inspection procedures can only be used to assess the surface of the FRC component for
visible defects. For that reason the surface of the component to be inspected needs to be clean,
without any coatings being present. Furthermore, the size of the defects needs to be such that
can be seen either by naked eye or using the instruments available. Normally, the technique can
only be used to assess the surface length of any defects found and cannot provide any
information regarding their depth. However, it may be often possible to assess the type of the
defect detected, e.g. delamination, cracking and impact related defect. Furthermore, it is
usually possible to evaluate the exact location of the defect which is an important parameter for
determining structural integrity. Figure 4.1 shows a digital USB optical microscope used for
the detection of microscopic damage on the surface of FRC components.
Figure 4.1: Photograph of digital USB optical microscope (the photograph is courtesy of Mr.
Rico Shen).
4.3 Dye Penetrant Inspection
DPI is another surface inspection technique which makes use of special coloured of fluorescent
dies in order to reveal surface breaking defects which are not easily observable with simple
55
visual inspection. The technique is based on the application of the dye on the surface of the
FRC component to be inspected. After allowing sufficient time for the time to dwell the excess
dye is wiped out and the developer is applied. Any dye that has penetrated through a crack will
be drawn back out providing a clearly visible indication. As in visual inspection this technique
does not provide any information regarding the depth of the defect but only the surface length.
It should also be made clear that in FRC materials not all types of surface defects are detectable
since the dye needs to penetrate inside. Hence impact damage-related defects causing
delamination and microcracks internally although they may clearly visible during simple visual
inspection, dye penetrant inspection will not give any indication unless part of the surface has
cracked near the zone of the impact event. The schematics in figure 4.2 demonstrate the basic
steps of DPI.
Figure 4.2: Schematics showing the basic principles of DPI. The schematics are courtesy of the
American Society for Non-Destructive Testing [119].
It should be noted that although the technique has very few material limitations as long as they
are not porous, it does require very clean inspection surface and the quality of the result can be
56
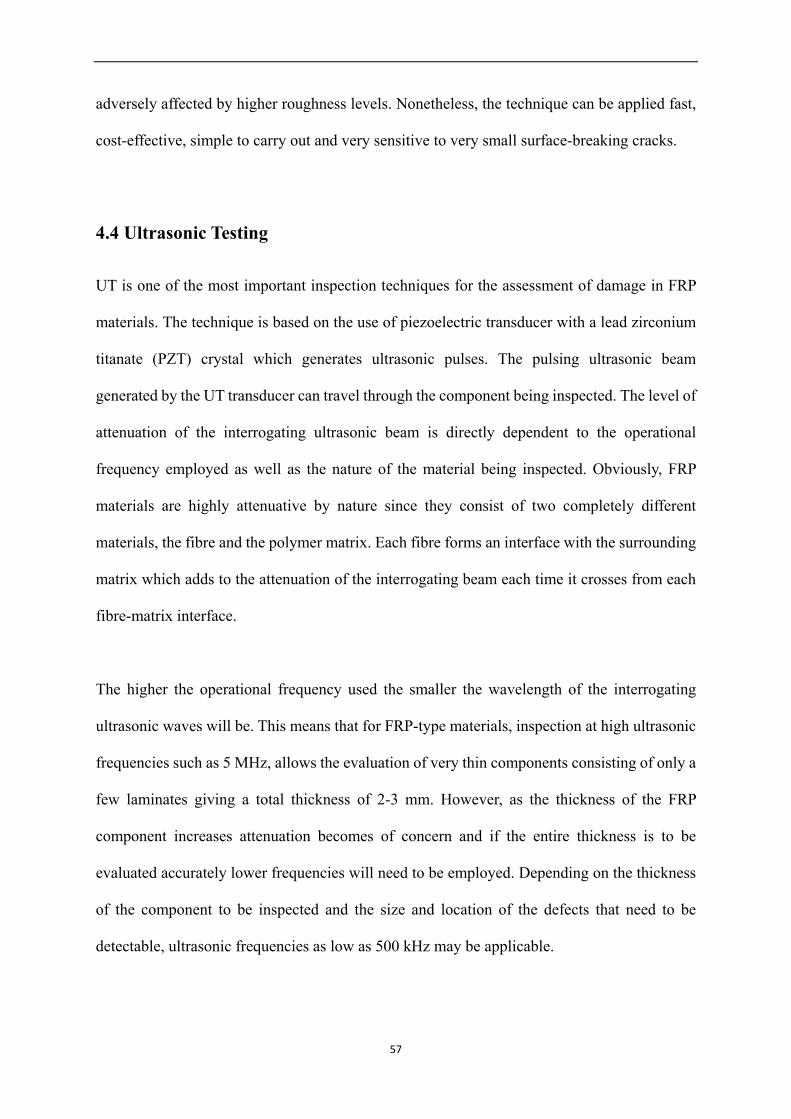
adversely affected by higher roughness levels. Nonetheless, the technique can be applied fast,
cost-effective, simple to carry out and very sensitive to very small surface-breaking cracks.
4.4 Ultrasonic Testing
UT is one of the most important inspection techniques for the assessment of damage in FRP
materials. The technique is based on the use of piezoelectric transducer with a lead zirconium
titanate (PZT) crystal which generates ultrasonic pulses. The pulsing ultrasonic beam
generated by the UT transducer can travel through the component being inspected. The level of
attenuation of the interrogating ultrasonic beam is directly dependent to the operational
frequency employed as well as the nature of the material being inspected. Obviously, FRP
materials are highly attenuative by nature since they consist of two completely different
materials, the fibre and the polymer matrix. Each fibre forms an interface with the surrounding
matrix which adds to the attenuation of the interrogating beam each time it crosses from each
fibre-matrix interface.
The higher the operational frequency used the smaller the wavelength of the interrogating
ultrasonic waves will be. This means that for FRP-type materials, inspection at high ultrasonic
frequencies such as 5 MHz, allows the evaluation of very thin components consisting of only a
few laminates giving a total thickness of 2-3 mm. However, as the thickness of the FRP
component increases attenuation becomes of concern and if the entire thickness is to be
evaluated accurately lower frequencies will need to be employed. Depending on the thickness
of the component to be inspected and the size and location of the defects that need to be
detectable, ultrasonic frequencies as low as 500 kHz may be applicable.
57
With UT it is possible not only to detect hidden as well as surface breaking defects, but also to
assess their exact location, orientation, size and type. However, very small defects deeply
hidden in the component may be very difficult or impossible to detect due to the highly
attenuative nature of FRP materials and CFRC more specifically. The quality of the UT
inspection can be improved if instead of single crystal transducers, ultrasonic phased arrays
containing several piezoelectric elements are used instead. Ultrasonic phased arrays can cover
a larger area of the component being inspected and the interrogating beam can be stirred or
focused in areas of interest by employing suitable delays in exciting the different transducer
elements. Since multiple elements are used more ultrasonic energy is introduced in the FRP
component under inspection making the detection of smaller defects more likely. Nonetheless,
even ultrasonic phased arrays cannot entirely solve the problem of attenuation.
It should be noted that ultrasonic phased arrays are considerably more expensive instruments
than conventional UT equipment. Ultrasonic phased array inspection requires separate training
and certification as it has considerable differences in the operation of the equipment in
comparison to standard UT instruments.
If moisture ingress is not an issue immersion tanks can be used to inspect an entire component
automatically and generate a two-dimensional (2D) map of the inspection results such as the
one shown in figure 3.1 in chapter 3. Figure 4.3 shows a typical immersion tank.
58
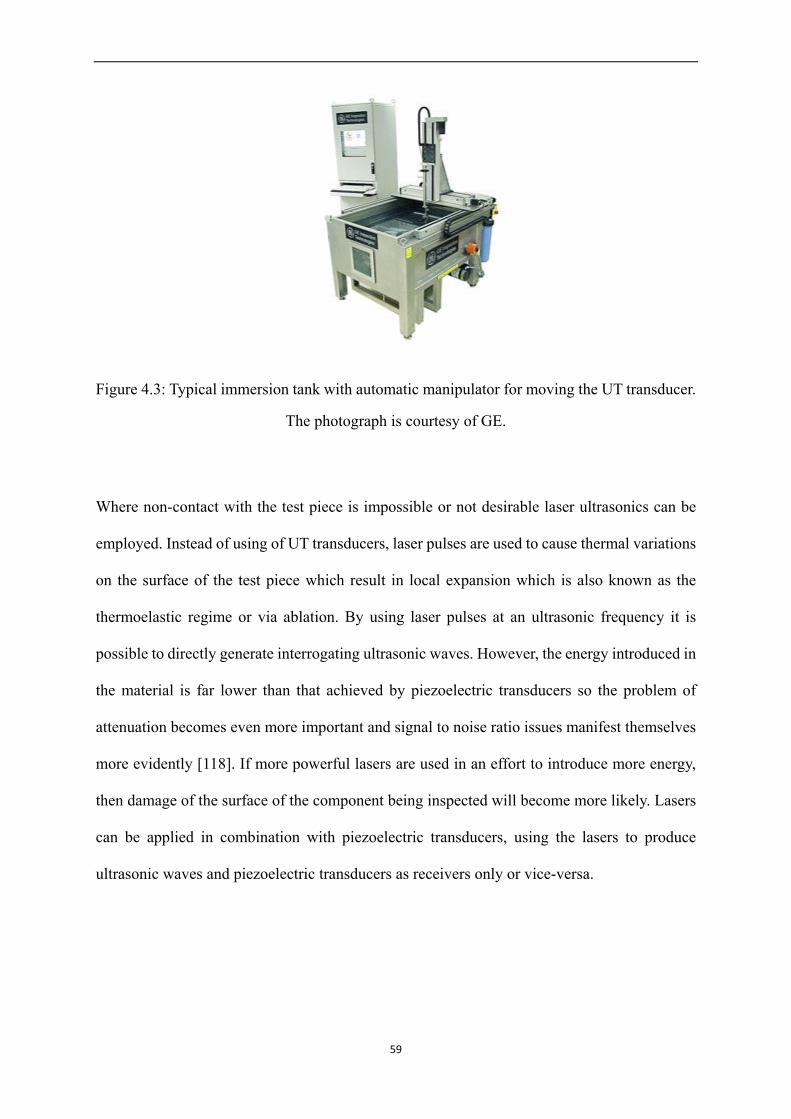
Figure 4.3: Typical immersion tank with automatic manipulator for moving the UT transducer.
The photograph is courtesy of GE.
Where non-contact with the test piece is impossible or not desirable laser ultrasonics can be
employed. Instead of using of UT transducers, laser pulses are used to cause thermal variations
on the surface of the test piece which result in local expansion which is also known as the
thermoelastic regime or via ablation. By using laser pulses at an ultrasonic frequency it is
possible to directly generate interrogating ultrasonic waves. However, the energy introduced in
the material is far lower than that achieved by piezoelectric transducers so the problem of
attenuation becomes even more important and signal to noise ratio issues manifest themselves
more evidently [118]. If more powerful lasers are used in an effort to introduce more energy,
then damage of the surface of the component being inspected will become more likely. Lasers
can be applied in combination with piezoelectric transducers, using the lasers to produce
ultrasonic waves and piezoelectric transducers as receivers only or vice-versa.
59
Acoustography, ultrasonic spectroscopy and acousto-ultrasonics are variants of conventional
UT which can be useful in certain special occasions. However, they are influenced by the same
factors that affect conventional UT [31].
4.5 Eddy current testing
The application of ECT requires that the material exhibits some acceptable level of electrical
conductivity. Carbon fibres do exhibit some electrical conductivity which is sufficiently high to
permit the inspection of CFRC materials using ECT [120]. The sensitivity of the inspection
depends on the frequency of the exciting coils. The higher the frequency, the higher the
sensitivity to smaller defects will be. However, at the same time as frequency increases the
depth of penetration of the inspection will decrease [118].
ECT can be employed using single pencil probes or arrays with multiple elements.
Multi-frequency ECT enables the inspection of different depths of the component in a single
inspection. Structural surface, surface breaking and hidden defects are detectable with ECT,
including missing carbon fibre bundles, lanes, suspensions, fringes, missing sewing threads
and angle errors [120].
ECT is based on the changes of the complex impedance signal of the search coils. The
technique is semi-quantitative and therefore accurate sizing of the defects may involve a
certain level of error. The micrographs in figure 4.4 show some of the defects detectable in
CFRC using ECT.
60
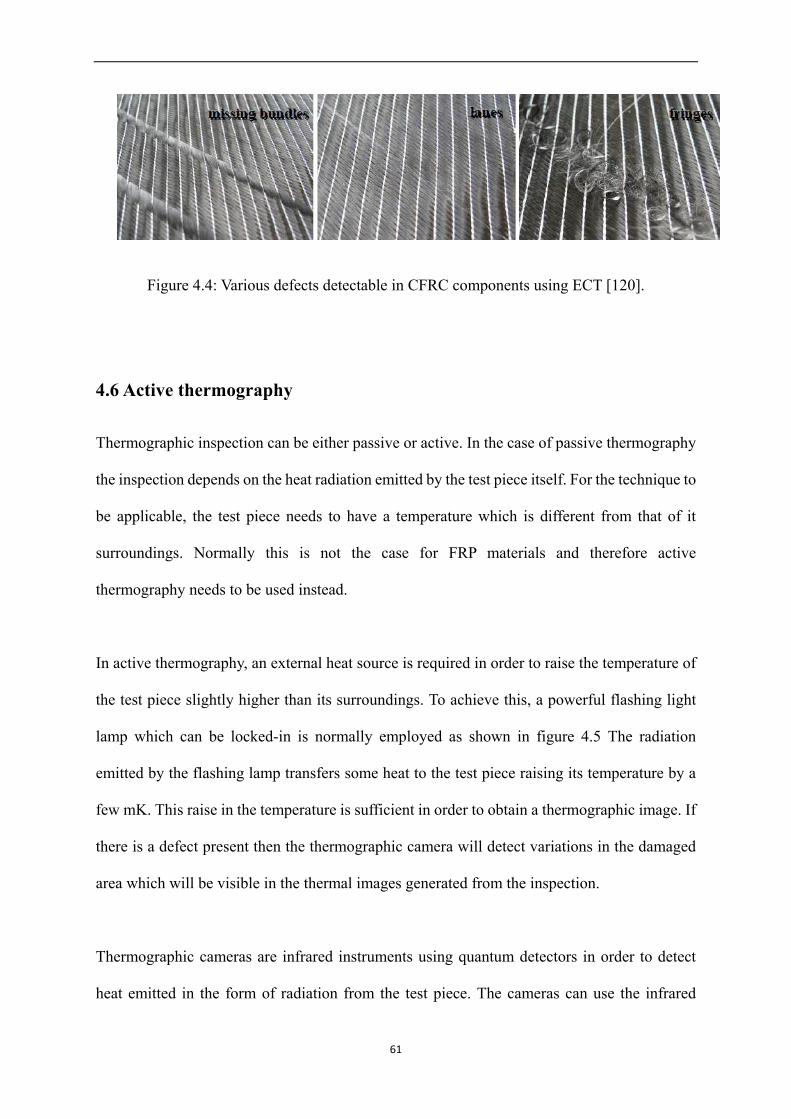
Figure 4.4: Various defects detectable in CFRC components using ECT [120].
4.6 Active thermography
Thermographic inspection can be either passive or active. In the case of passive thermography
the inspection depends on the heat radiation emitted by the test piece itself. For the technique to
be applicable, the test piece needs to have a temperature which is different from that of it
surroundings. Normally this is not the case for FRP materials and therefore active
thermography needs to be used instead.
In active thermography, an external heat source is required in order to raise the temperature of
the test piece slightly higher than its surroundings. To achieve this, a powerful flashing light
lamp which can be locked-in is normally employed as shown in figure 4.5 The radiation
emitted by the flashing lamp transfers some heat to the test piece raising its temperature by a
few mK. This raise in the temperature is sufficient in order to obtain a thermographic image. If
there is a defect present then the thermographic camera will detect variations in the damaged
area which will be visible in the thermal images generated from the inspection.
Thermographic cameras are infrared instruments using quantum detectors in order to detect
heat emitted in the form of radiation from the test piece. The cameras can use the infrared
61
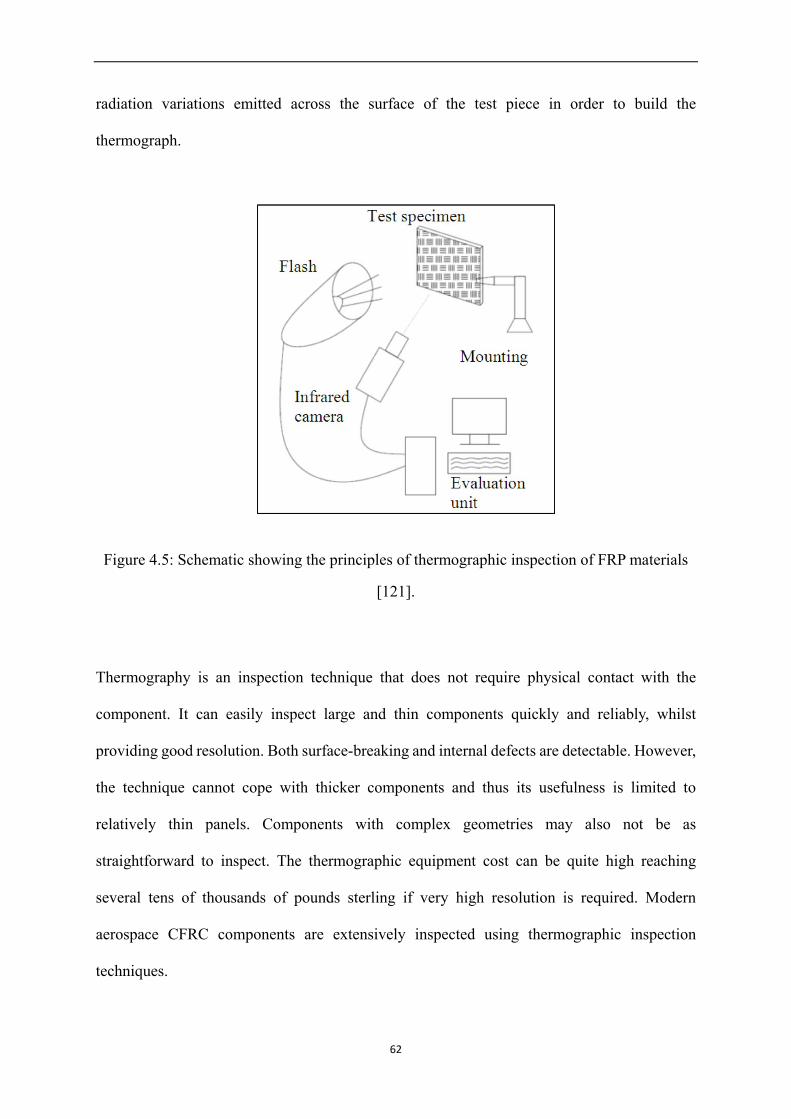
radiation variations emitted across the surface of the test piece in order to build the
thermograph.
Figure 4.5: Schematic showing the principles of thermographic inspection of FRP materials
[121].
Thermography is an inspection technique that does not require physical contact with the
component. It can easily inspect large and thin components quickly and reliably, whilst
providing good resolution. Both surface-breaking and internal defects are detectable. However,
the technique cannot cope with thicker components and thus its usefulness is limited to
relatively thin panels. Components with complex geometries may also not be as
straightforward to inspect. The thermographic equipment cost can be quite high reaching
several tens of thousands of pounds sterling if very high resolution is required. Modern
aerospace CFRC components are extensively inspected using thermographic inspection
techniques.
62

4.7 Shearography
Shearography is an automated optical inspection technique which is often used for the
inspection of composite materials for the detection of delamination defects. Conventional
shearography is based on the principles of optical interference in order to detect delamination
defects in CFRC and other FRPs. The technique is based in the illumination of the test piece
using a divergent laser beam. The scattered light is projected onto an image plane using a
shearing lens which causes the image to shear. The interference between the sheared and direct
images are used to create the shearographic pattern which effectively maps the distribution of
local surface strain. A reference image needs to be acquired from a structurally sound area
which will then be used to compare the rest of the structure and identify any defects present
through detection of changes in the fringe pattern [31].
This technique does require that the test piece is loaded in order to reveal the presence of
defects therefore care should be exercised to avoid damaging the component during the
inspection. The technique is semi-quantitave and the equipment involved has a high cost.
Nonetheless, shearography is highly applicable for the inspection of FRPs.
4.8 Radiography
Radiographic inspection of FRP components can be carried out either using an X-ray or gamma
ray source. Normally, FRP inspection with radiography is carried out using X-ray sources and
digital detectors rather than films such as those used in conventional field radiographic
inspection. This is due to the small thickness and low density of FRP components which
enables the use of low energy X-ray sources. Moreover, micro-focus resolutions instruments
63
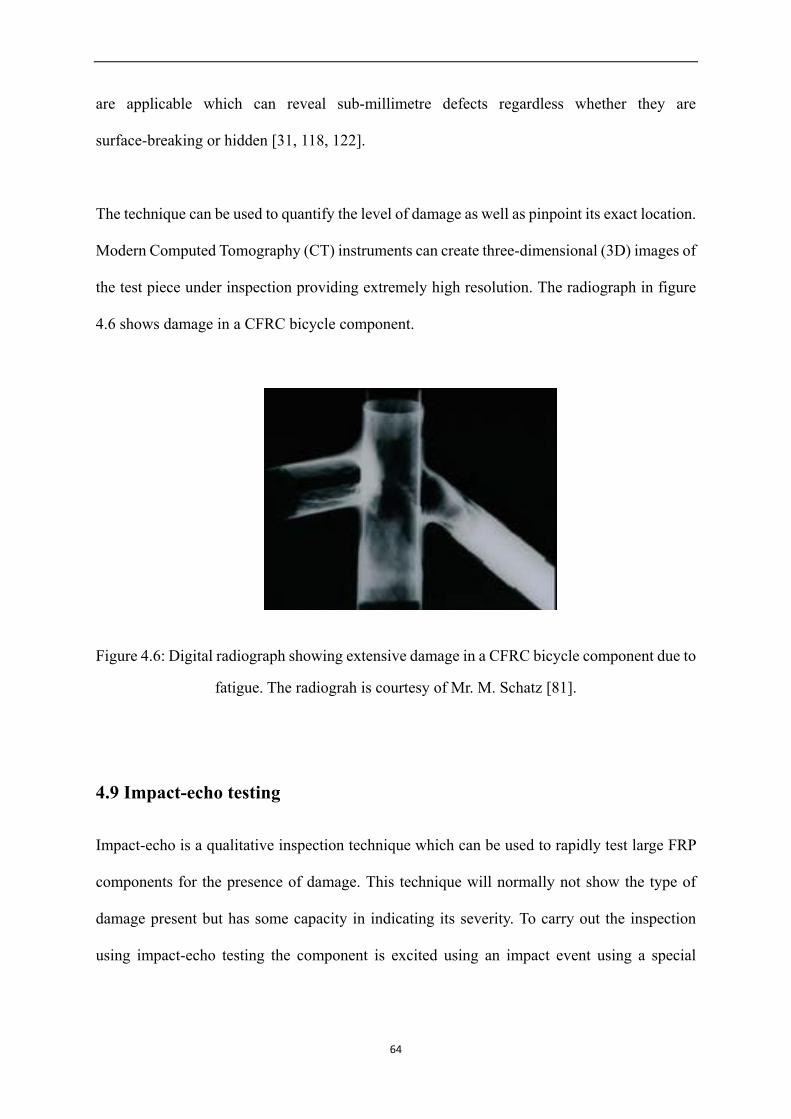
are applicable which can reveal sub-millimetre defects regardless whether they are
surface-breaking or hidden [31, 118, 122].
The technique can be used to quantify the level of damage as well as pinpoint its exact location.
Modern Computed Tomography (CT) instruments can create three-dimensional (3D) images of
the test piece under inspection providing extremely high resolution. The radiograph in figure
4.6 shows damage in a CFRC bicycle component.
Figure 4.6: Digital radiograph showing extensive damage in a CFRC bicycle component due to
fatigue. The radiograh is courtesy of Mr. M. Schatz [81].
4.9 Impact-echo testing
Impact-echo is a qualitative inspection technique which can be used to rapidly test large FRP
components for the presence of damage. This technique will normally not show the type of
damage present but has some capacity in indicating its severity. To carry out the inspection
using impact-echo testing the component is excited using an impact event using a special
64
hammer. The reflected stress waves are then captured by a piezoelectric transducer suitably
mounted on the test piece.
The resulting waveforms are subsequently transformed from the time domain to the frequency
domain in order to generate the power spectrum. By comparing the power spectra generated
from different calibration samples containing different levels of damage it is possible to
determine the severity of damage and possibly its location or depth. This technique is not
commonly applied for the inspection of FRP components due to its high level of uncertainty
and requirement for high resolution. Temperature compensation in the measurement is also
necessary. Nonetheless, it is applicable but its significant limitations need to be taken into
account [118].
4.10 Vibration analysis
Vibration analysis has similarities with the impact-echo technique. The structure needs to be
excited by some external source either due to loading conditions or impact. The operational
frequency in vibration analysis is much lower in comparison to impact-echo ranging from 1 Hz
up to a few kHz (<25 kHz). Vibration is detected using accelerometers which have been
suitably mounted on the structure under inspection. During the analysis temperature
compensation is required like in the impact-echo testing.
Vibration analysis can only detect large variations in the structure and requires trending of the
data to provide meaningful results. However, apart from detecting severe damage, it can also
provide information regarding the loads sustained by a component. Vibration analysis is not
65

commonly used for the evaluation of FRP materials with the exception of wind turbine blades
[118].
In the case of FRP wind turbine blades vibration analysis has been used in order to detect the
presence of ice on the blades or broken tips after lightning events. In the aerospace industry and
most of the other industrial sectors vibration analysis has very limited applicability due to the
requirement of data trending, the low resolution level achievable and calibration requirements.
66

CHAPTER 5
Structural Health Monitoring of Composite Materials
67
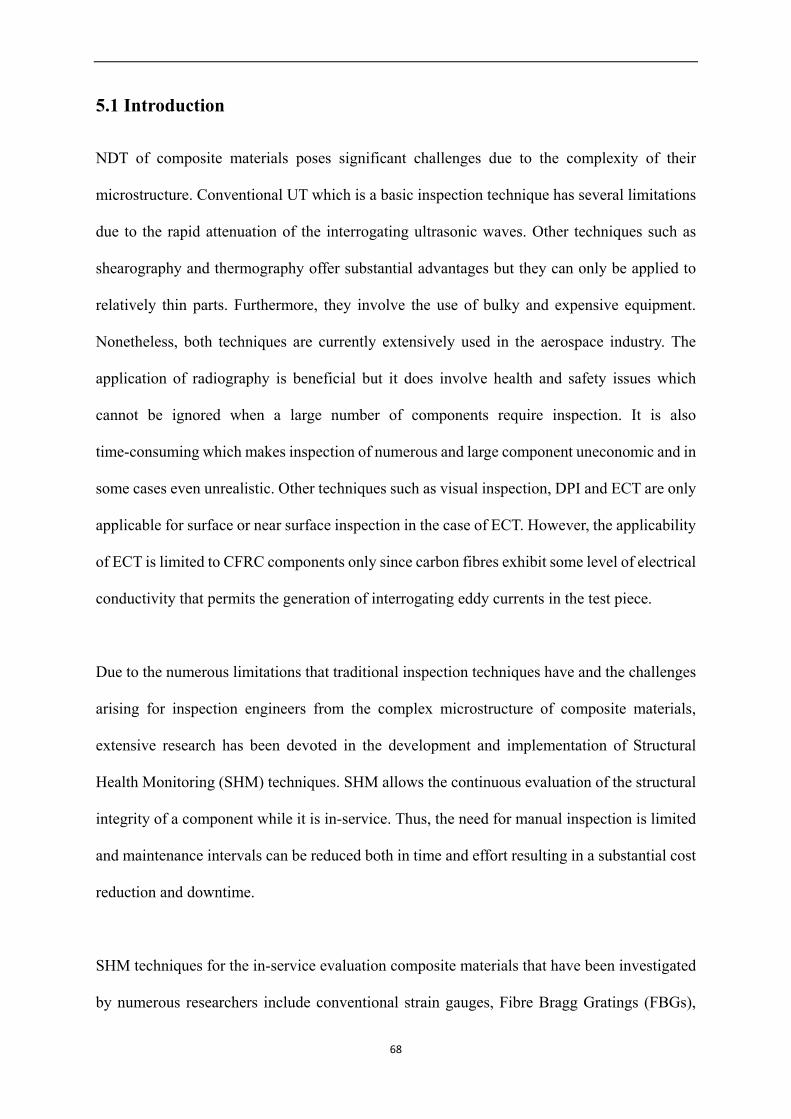
5.1 Introduction
NDT of composite materials poses significant challenges due to the complexity of their
microstructure. Conventional UT which is a basic inspection technique has several limitations
due to the rapid attenuation of the interrogating ultrasonic waves. Other techniques such as
shearography and thermography offer substantial advantages but they can only be applied to
relatively thin parts. Furthermore, they involve the use of bulky and expensive equipment.
Nonetheless, both techniques are currently extensively used in the aerospace industry. The
application of radiography is beneficial but it does involve health and safety issues which
cannot be ignored when a large number of components require inspection. It is also
time-consuming which makes inspection of numerous and large component uneconomic and in
some cases even unrealistic. Other techniques such as visual inspection, DPI and ECT are only
applicable for surface or near surface inspection in the case of ECT. However, the applicability
of ECT is limited to CFRC components only since carbon fibres exhibit some level of electrical
conductivity that permits the generation of interrogating eddy currents in the test piece.
Due to the numerous limitations that traditional inspection techniques have and the challenges
arising for inspection engineers from the complex microstructure of composite materials,
extensive research has been devoted in the development and implementation of Structural
Health Monitoring (SHM) techniques. SHM allows the continuous evaluation of the structural
integrity of a component while it is in-service. Thus, the need for manual inspection is limited
and maintenance intervals can be reduced both in time and effort resulting in a substantial cost
reduction and downtime.
SHM techniques for the in-service evaluation composite materials that have been investigated
by numerous researchers include conventional strain gauges, Fibre Bragg Gratings (FBGs),
68
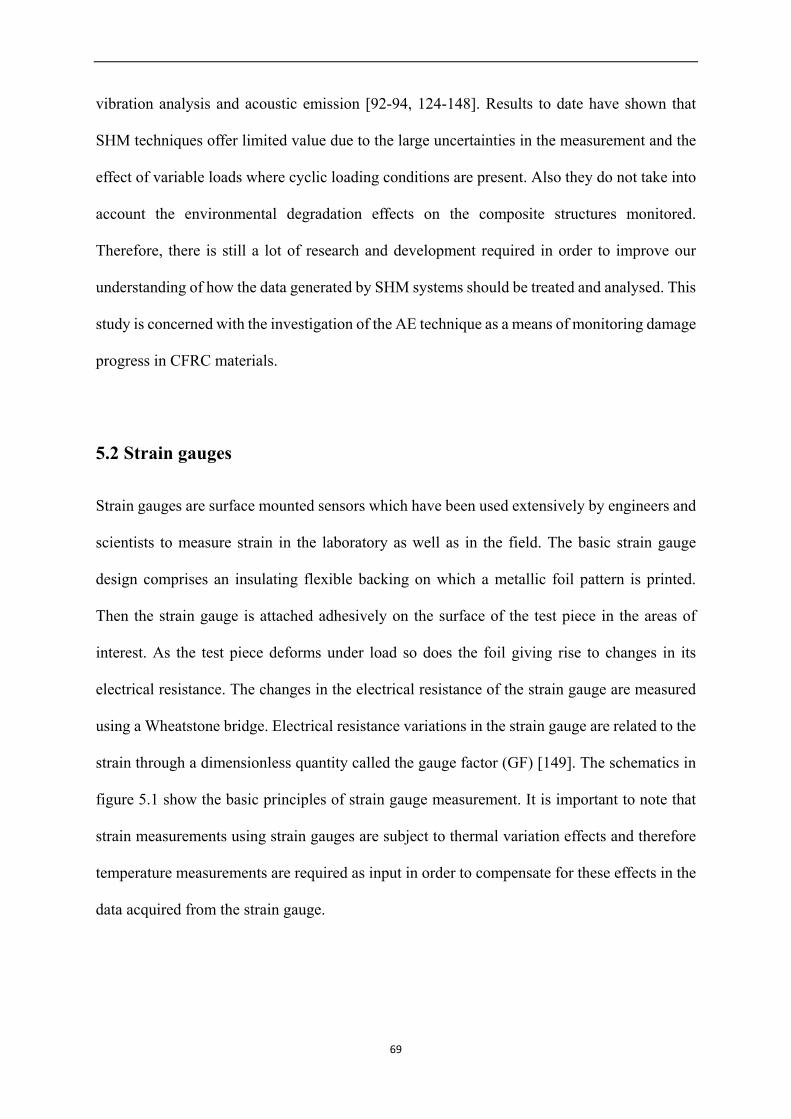
vibration analysis and acoustic emission [92-94, 124-148]. Results to date have shown that
SHM techniques offer limited value due to the large uncertainties in the measurement and the
effect of variable loads where cyclic loading conditions are present. Also they do not take into
account the environmental degradation effects on the composite structures monitored.
Therefore, there is still a lot of research and development required in order to improve our
understanding of how the data generated by SHM systems should be treated and analysed. This
study is concerned with the investigation of the AE technique as a means of monitoring damage
progress in CFRC materials.
5.2 Strain gauges
Strain gauges are surface mounted sensors which have been used extensively by engineers and
scientists to measure strain in the laboratory as well as in the field. The basic strain gauge
design comprises an insulating flexible backing on which a metallic foil pattern is printed.
Then the strain gauge is attached adhesively on the surface of the test piece in the areas of
interest. As the test piece deforms under load so does the foil giving rise to changes in its
electrical resistance. The changes in the electrical resistance of the strain gauge are measured
using a Wheatstone bridge. Electrical resistance variations in the strain gauge are related to the
strain through a dimensionless quantity called the gauge factor (GF) [149]. The schematics in
figure 5.1 show the basic principles of strain gauge measurement. It is important to note that
strain measurements using strain gauges are subject to thermal variation effects and therefore
temperature measurements are required as input in order to compensate for these effects in the
data acquired from the strain gauge.
69
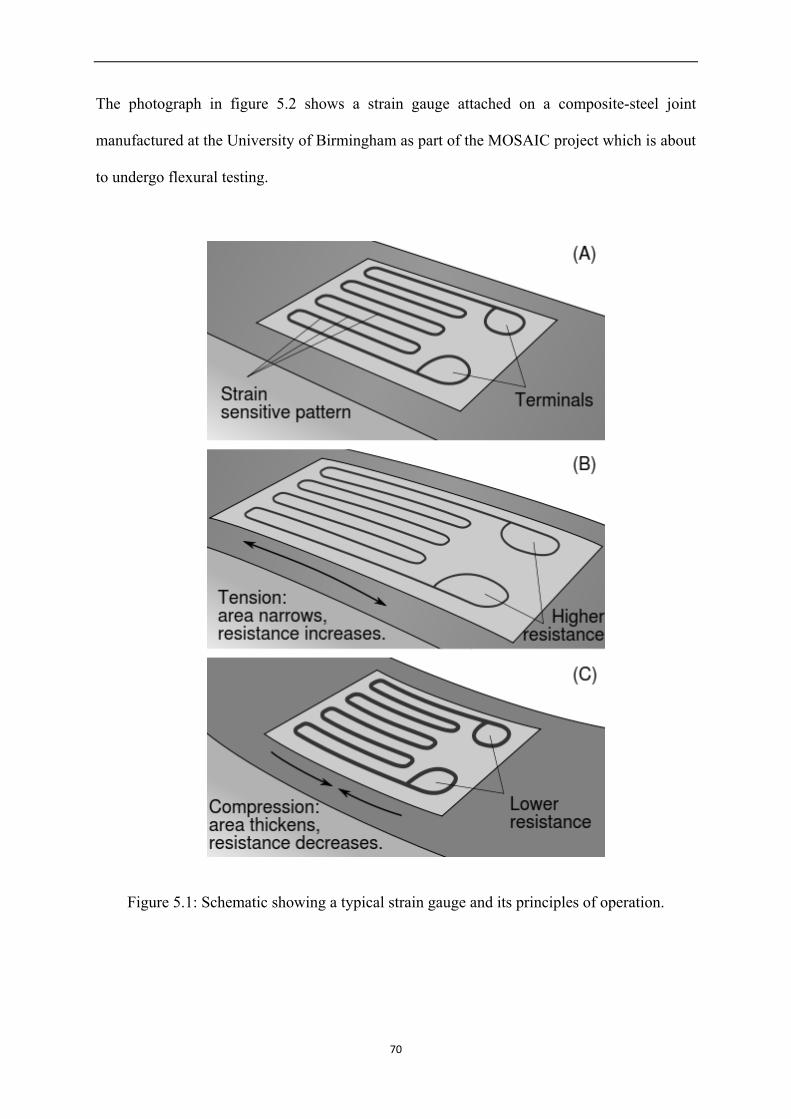
The photograph in figure 5.2 shows a strain gauge attached on a composite-steel joint
manufactured at the University of Birmingham as part of the MOSAIC project which is about
to undergo flexural testing.
Figure 5.1: Schematic showing a typical strain gauge and its principles of operation.
70
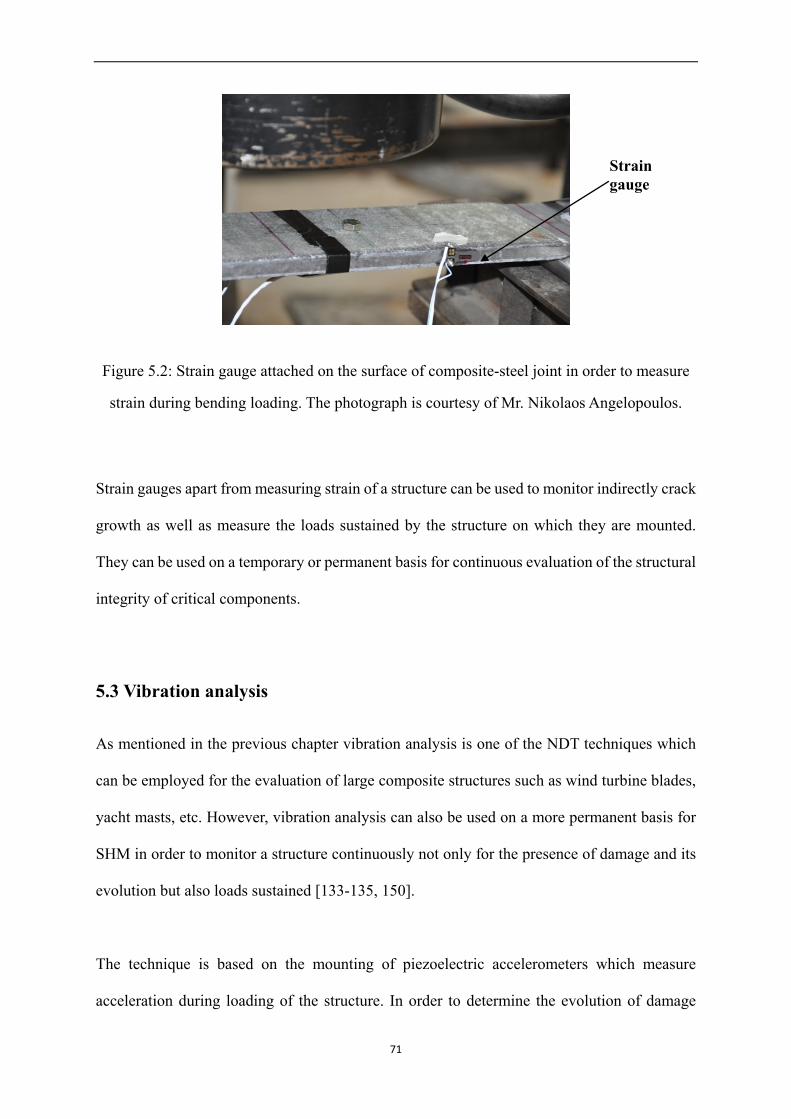
Figure 5.2: Strain gauge attached on the surface of composite-steel joint in order to measure
strain during bending loading. The photograph is courtesy of Mr. Nikolaos Angelopoulos.
Strain gauges apart from measuring strain of a structure can be used to monitor indirectly crack
growth as well as measure the loads sustained by the structure on which they are mounted.
They can be used on a temporary or permanent basis for continuous evaluation of the structural
integrity of critical components.
5.3 Vibration analysis
As mentioned in the previous chapter vibration analysis is one of the NDT techniques which
can be employed for the evaluation of large composite structures such as wind turbine blades,
yacht masts, etc. However, vibration analysis can also be used on a more permanent basis for
SHM in order to monitor a structure continuously not only for the presence of damage and its
evolution but also loads sustained [133-135, 150].
The technique is based on the mounting of piezoelectric accelerometers which measure
acceleration during loading of the structure. In order to determine the evolution of damage
Strain gauge
71
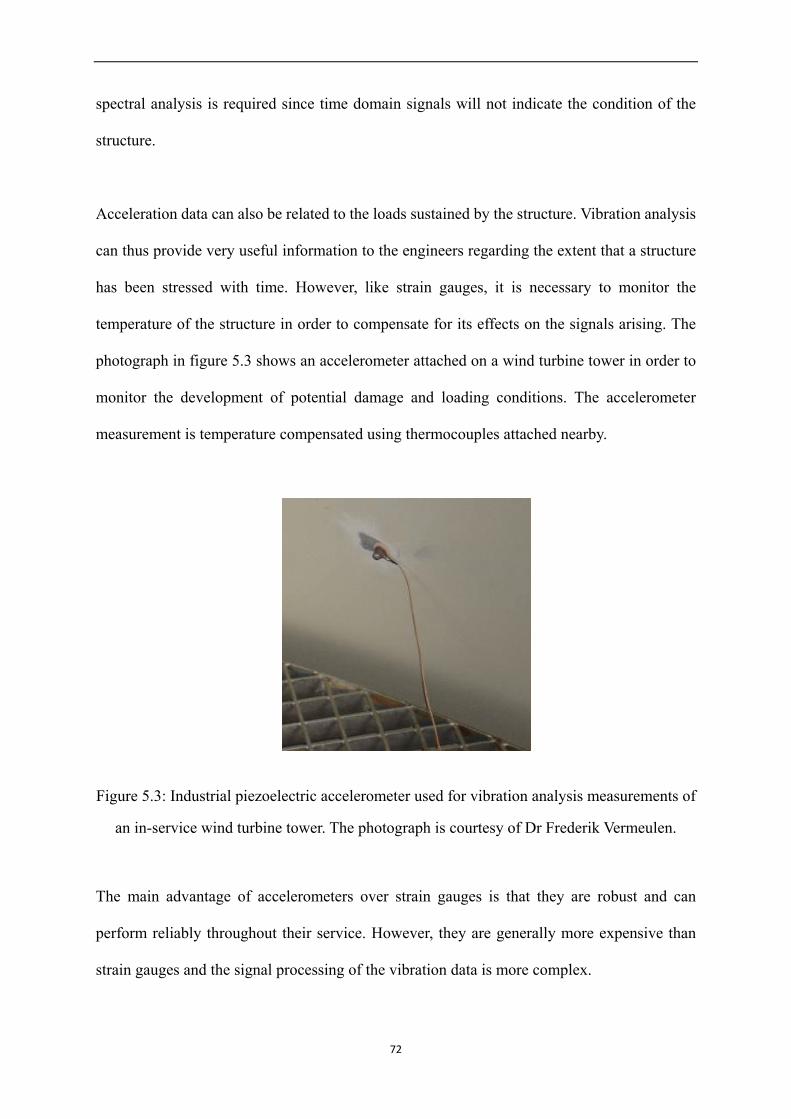
spectral analysis is required since time domain signals will not indicate the condition of the
structure.
Acceleration data can also be related to the loads sustained by the structure. Vibration analysis
can thus provide very useful information to the engineers regarding the extent that a structure
has been stressed with time. However, like strain gauges, it is necessary to monitor the
temperature of the structure in order to compensate for its effects on the signals arising. The
photograph in figure 5.3 shows an accelerometer attached on a wind turbine tower in order to
monitor the development of potential damage and loading conditions. The accelerometer
measurement is temperature compensated using thermocouples attached nearby.
Figure 5.3: Industrial piezoelectric accelerometer used for vibration analysis measurements of
an in-service wind turbine tower. The photograph is courtesy of Dr Frederik Vermeulen.
The main advantage of accelerometers over strain gauges is that they are robust and can
perform reliably throughout their service. However, they are generally more expensive than
strain gauges and the signal processing of the vibration data is more complex.
72
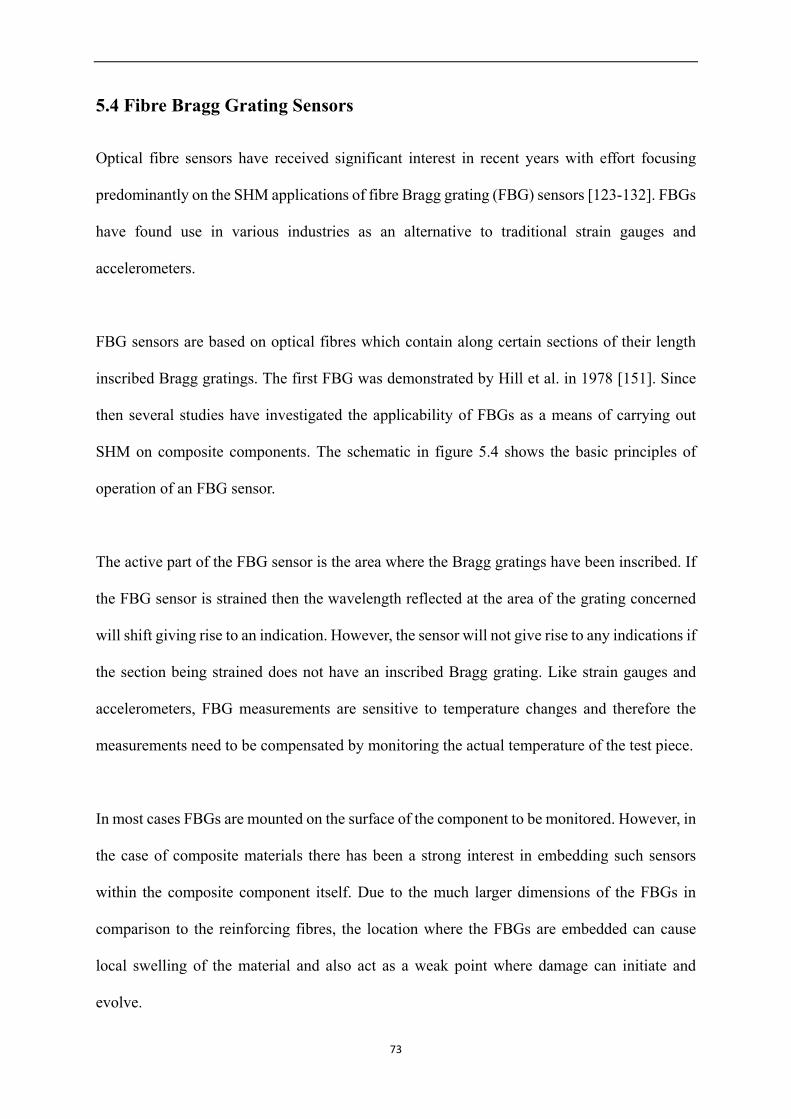
5.4 Fibre Bragg Grating Sensors
Optical fibre sensors have received significant interest in recent years with effort focusing
predominantly on the SHM applications of fibre Bragg grating (FBG) sensors [123-132]. FBGs
have found use in various industries as an alternative to traditional strain gauges and
accelerometers.
FBG sensors are based on optical fibres which contain along certain sections of their length
inscribed Bragg gratings. The first FBG was demonstrated by Hill et al. in 1978 [151]. Since
then several studies have investigated the applicability of FBGs as a means of carrying out
SHM on composite components. The schematic in figure 5.4 shows the basic principles of
operation of an FBG sensor.
The active part of the FBG sensor is the area where the Bragg gratings have been inscribed. If
the FBG sensor is strained then the wavelength reflected at the area of the grating concerned
will shift giving rise to an indication. However, the sensor will not give rise to any indications if
the section being strained does not have an inscribed Bragg grating. Like strain gauges and
accelerometers, FBG measurements are sensitive to temperature changes and therefore the
measurements need to be compensated by monitoring the actual temperature of the test piece.
In most cases FBGs are mounted on the surface of the component to be monitored. However, in
the case of composite materials there has been a strong interest in embedding such sensors
within the composite component itself. Due to the much larger dimensions of the FBGs in
comparison to the reinforcing fibres, the location where the FBGs are embedded can cause
local swelling of the material and also act as a weak point where damage can initiate and
evolve.
73
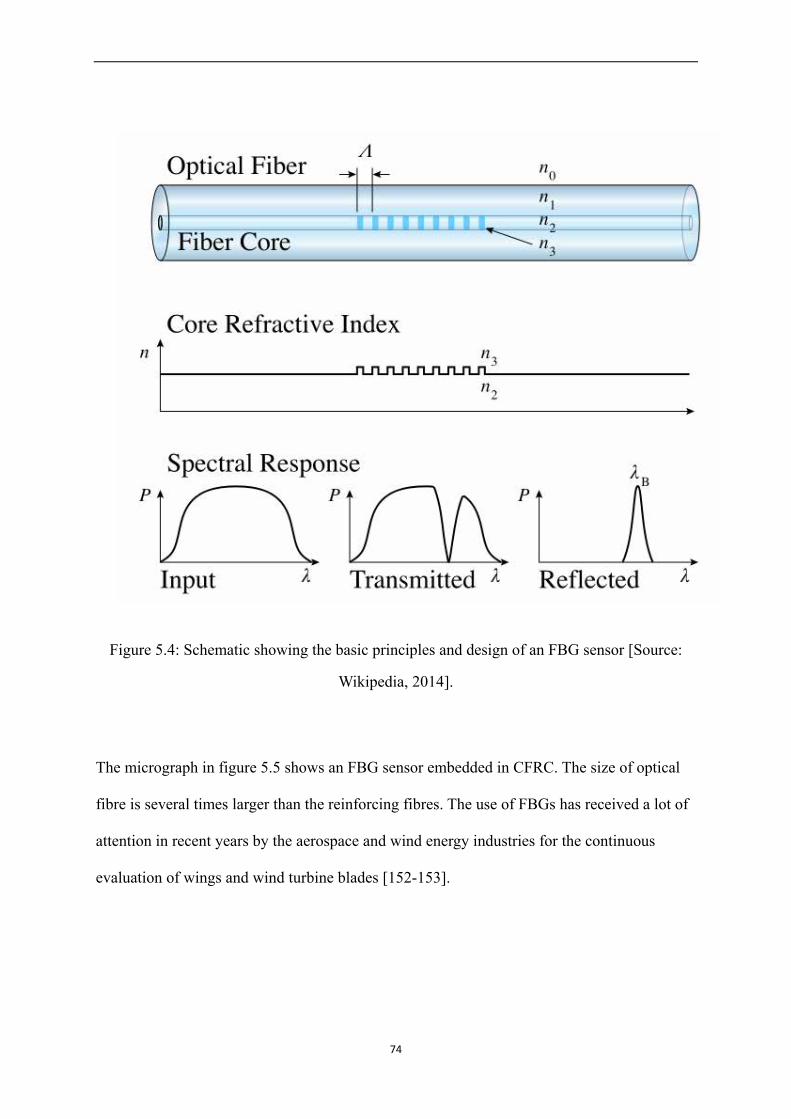
Figure 5.4: Schematic showing the basic principles and design of an FBG sensor [Source:
Wikipedia, 2014].
The micrograph in figure 5.5 shows an FBG sensor embedded in CFRC. The size of optical
fibre is several times larger than the reinforcing fibres. The use of FBGs has received a lot of
attention in recent years by the aerospace and wind energy industries for the continuous
evaluation of wings and wind turbine blades [152-153].
74
Figure 5.5: Photograph showing an optical fibre embedded in a thermo-hardened composite
material. The micrograph is courtesy of FOS & S B.V.B.A., Belgium.
5.5 Acoustic emission
The first documented application of modern AE was in 1964 where the technique was
employed for testing damage evolution in rocket-motor casings by Green et al. [154]. However,
it was Joseph Kaiser who pioneered the research of modern AE technology as it is known today
[155]. Kaiser’s carried a major laboratory study of AE phenomena under laboratory conditions
and reported his findings on his fundamental paper published in 1953.
In its early years, the AE technique was rarely applied on composite materials due to their
orthotropic nature of their microstructure. The microstructure of composite materials caused
substantial difficulties in identifying the various damage mechanisms occurring in them
through AE. Nonetheless, in more recent years, thanks to advanced computers complex AE
signal analysis methods such as the pattern recognition technique have been enabled. These
techniques have allowed significant improvements in achieving relatively reliable
discrimination of the different damage mechanisms. Consequently there has been a significant
increase in the interest of applying the AE technique for SHM of composite materials.
75
Comparing with traditional NDT methods, the main difference of the AE technique is its
passive nature. Other NDT method such as UT and thermography require active external
energy input in order to interrogate the test piece and obtain feedback information regarding
their structural integrity. On the other hand the AE method only depends on the energy
generated from the damage sources emitting stress waves as they evolve during sufficient
loading of the components tested [156].
Although AE testing results cannot provide information regarding the shape and size of the
damage or defects within the components tested, it is nonetheless a global technique which can
be applied to cover the entire structure of large components. Moreover, using statistical
information it may be possible to extrapolate relatively accurately the severity of the damage
present.
The AE method can be applied for initial inspection of components in one off tests. However,
its main strength is its applicability for continuous evaluation of critical structural components
and monitor damage propagation. Statistical tools can be used to ascertain the damage severity
at least qualitatively although under certain conditions semi-quantitative evaluation may also
be possible.
5.6 Fundamentals of acoustic emission
As mentioned in the previous paragraph AE is based on the detection of transient stress (elastic
waves) produced due to the sudden and rapid release of energy caused by propagation of
damage in a material, e.g. crack growth. A crack emitting transient stress waves from its tip is
an indication that it is growing. However, unwanted noise can be produced and detected by AE
sensors due to opening and closing of the crack’s surfaces and friction between them [45].
76

Most of AE activity associated with damage events occurs between frequencies of 100 kHz to
300 kHz which are not audible by human [156]. The AE phenomena are irreversible, and they
will not occur until the loading or stress exceeds the previous maximum loading or stress
applied on a material during repeated testing. This is known as the Kaiser Effect and its
understanding is very important for the successful application of the AE technique in the field.
The AE phenomena contain two basic processes: a) the generation of stress waves from a
source and b) the propagation of these waves from the source to the sensor. When materials
subject to mechanical loading and stress, the inner stress field balance is broken, and they may
deform elastically or plastically, depend on the magnitude of stress that has been applied in
order to achieve a new stress field balance.
Large amounts of AE activity will be generated when materials deform plastically, during
initiation and propagation of cracks. In composite materials such as CFRC, delamination,
debonding, matrix cracking, fibre pull-out and fibre fracture are the main sources of AE
activity.
On the microscopic scale, when metallic materials undergo plastic deformation,
crystallographic planes slip past each other through dislocations releasing energy stored in
materials [156-157]. Some of the energy is dissipated in the form of transient stress waves
which are detectable by AE sensors.
Stress waves travel from the source point through the materials’s microstructure eventually
reaching the surface and causing minor surface displacements which can be detected by the AE
sensor. AE sensors are typically piezoelectric crystals which are capable of detecting surface
displacements as small as 25 pm. The piezoelectric crystal will then convert the mechanical
movement into an electric signal which is suitably amplified by a pre-amplifier and amplifier
before being acquired by a suitable high-speed data acquisition (DAQ) board.
77
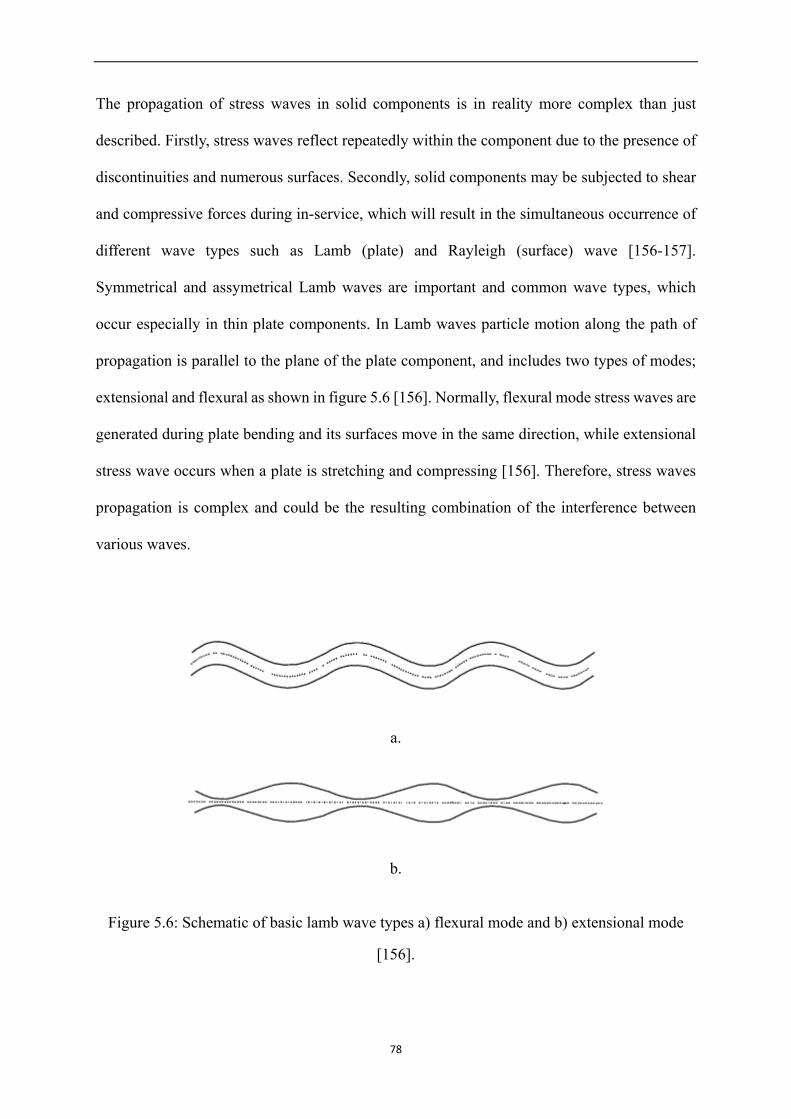
The propagation of stress waves in solid components is in reality more complex than just
described. Firstly, stress waves reflect repeatedly within the component due to the presence of
discontinuities and numerous surfaces. Secondly, solid components may be subjected to shear
and compressive forces during in-service, which will result in the simultaneous occurrence of
different wave types such as Lamb (plate) and Rayleigh (surface) wave [156-157].
Symmetrical and assymetrical Lamb waves are important and common wave types, which
occur especially in thin plate components. In Lamb waves particle motion along the path of
propagation is parallel to the plane of the plate component, and includes two types of modes;
extensional and flexural as shown in figure 5.6 [156]. Normally, flexural mode stress waves are
generated during plate bending and its surfaces move in the same direction, while extensional
stress wave occurs when a plate is stretching and compressing [156]. Therefore, stress waves
propagation is complex and could be the resulting combination of the interference between
various waves.
a.
b.
Figure 5.6: Schematic of basic lamb wave types a) flexural mode and b) extensional mode
[156].
78
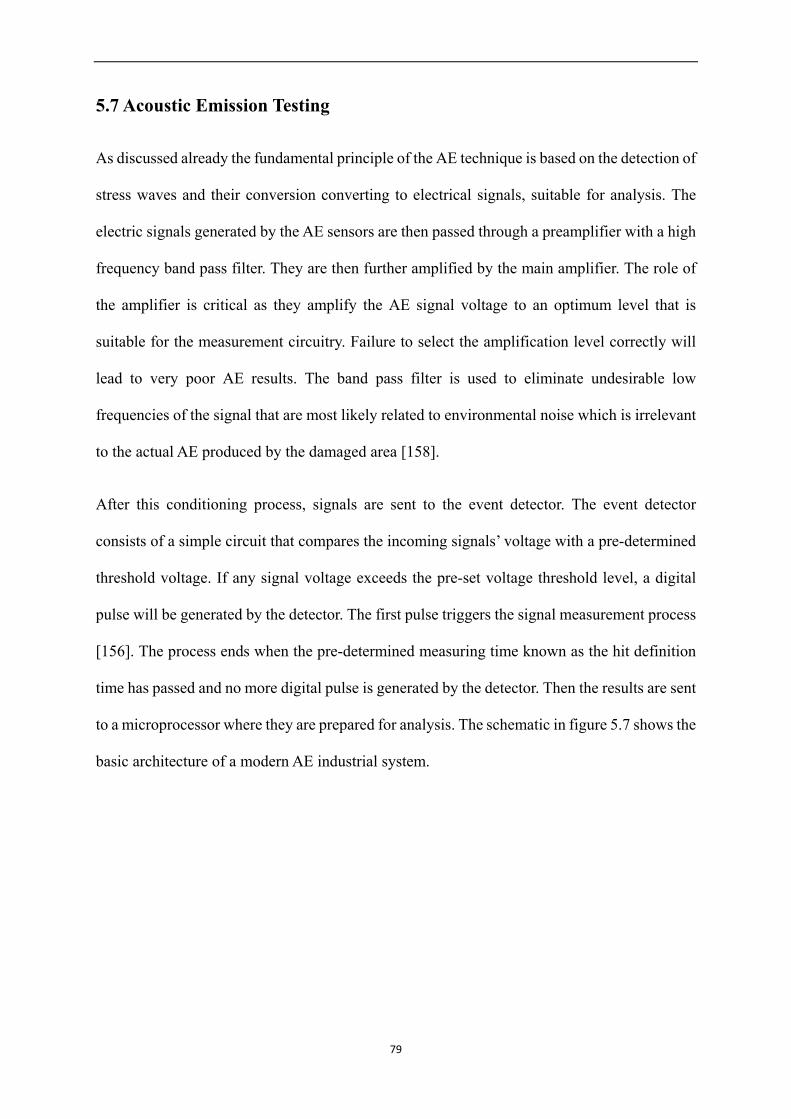
5.7 Acoustic Emission Testing
As discussed already the fundamental principle of the AE technique is based on the detection of
stress waves and their conversion converting to electrical signals, suitable for analysis. The
electric signals generated by the AE sensors are then passed through a preamplifier with a high
frequency band pass filter. They are then further amplified by the main amplifier. The role of
the amplifier is critical as they amplify the AE signal voltage to an optimum level that is
suitable for the measurement circuitry. Failure to select the amplification level correctly will
lead to very poor AE results. The band pass filter is used to eliminate undesirable low
frequencies of the signal that are most likely related to environmental noise which is irrelevant
to the actual AE produced by the damaged area [158].
After this conditioning process, signals are sent to the event detector. The event detector
consists of a simple circuit that compares the incoming signals’ voltage with a pre-determined
threshold voltage. If any signal voltage exceeds the pre-set voltage threshold level, a digital
pulse will be generated by the detector. The first pulse triggers the signal measurement process
[156]. The process ends when the pre-determined measuring time known as the hit definition
time has passed and no more digital pulse is generated by the detector. Then the results are sent
to a microprocessor where they are prepared for analysis. The schematic in figure 5.7 shows the
basic architecture of a modern AE industrial system.
79
Figure 5.7: Simplified schematic showing the principles of a modern industrial AE system
[157].
5.8 Acoustic Emission signals
The classic AE signal is represented a voltage-time waveform as shown in figure 5.8. Each AE
signal contains numerous features such as threshold, amplitude, duration, count to peak, counts,
rise time and signal energy. These features are critical in discriminating signals between noise
and various damage sources. The amplitude, which is the greatest measured voltage or peak
voltage in the capture signal waveform, is one of the most important parameters for AE signal
analysis since the detectability of signals in its basic approach depends on this. The AE
amplitude can be measured either in V or converted to dB. In most systems the dB unit is
preferred and it normally ranges from 34 dB (minimum threshold due to electric noise) to 99
dB (signal saturation point). The signal duration describes the time interval between the first
and the last threshold crossings and is measured in μs. Amplitude variations and duration
combined together give the basic shape of the signal waveform.
The signal energy is another important feature as it describes the intensity of an AE event. It is
the area under voltage-time envelope. The signal counts are related to the number of times the
80
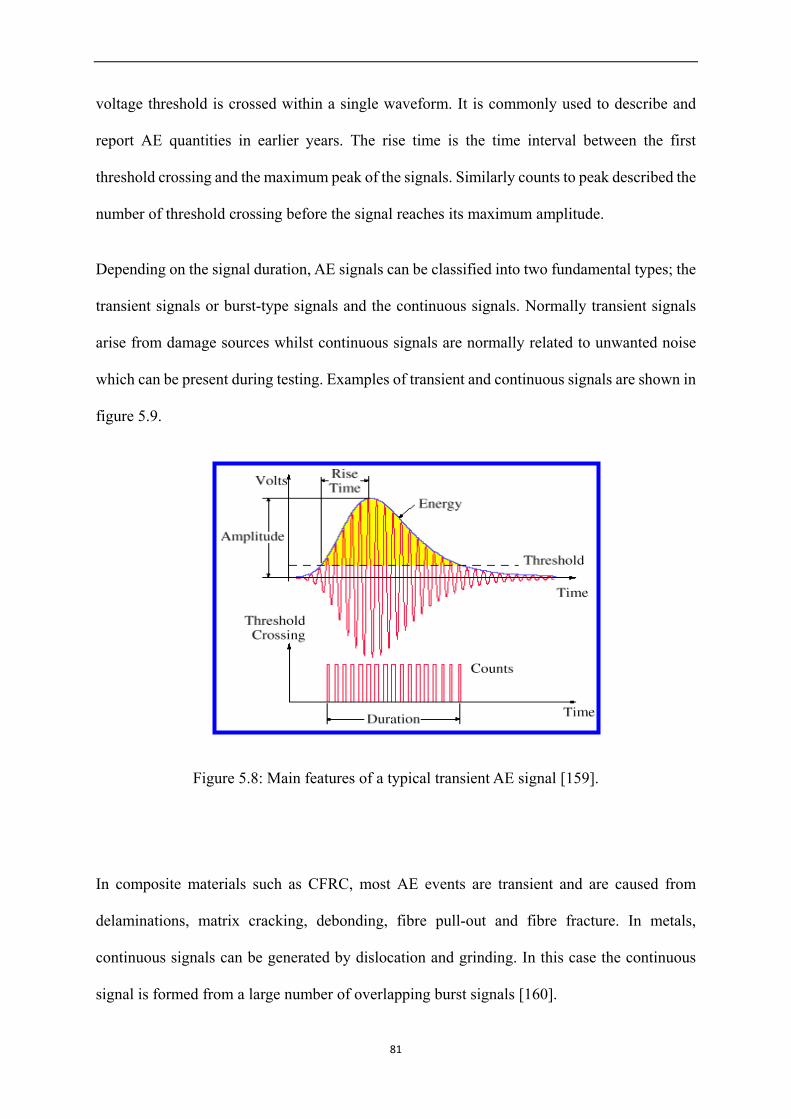
voltage threshold is crossed within a single waveform. It is commonly used to describe and
report AE quantities in earlier years. The rise time is the time interval between the first
threshold crossing and the maximum peak of the signals. Similarly counts to peak described the
number of threshold crossing before the signal reaches its maximum amplitude.
Depending on the signal duration, AE signals can be classified into two fundamental types; the
transient signals or burst-type signals and the continuous signals. Normally transient signals
arise from damage sources whilst continuous signals are normally related to unwanted noise
which can be present during testing. Examples of transient and continuous signals are shown in
figure 5.9.
Figure 5.8: Main features of a typical transient AE signal [159].
In composite materials such as CFRC, most AE events are transient and are caused from
delaminations, matrix cracking, debonding, fibre pull-out and fibre fracture. In metals,
continuous signals can be generated by dislocation and grinding. In this case the continuous
signal is formed from a large number of overlapping burst signals [160].
81
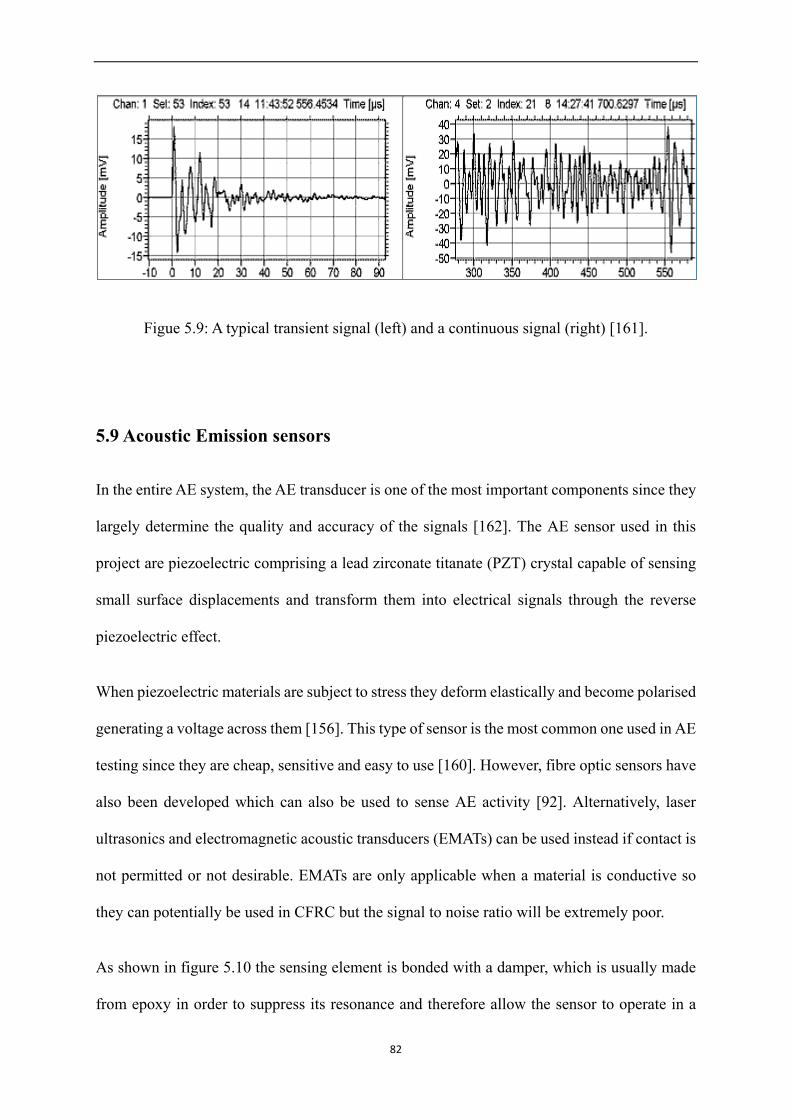
Figue 5.9: A typical transient signal (left) and a continuous signal (right) [161].
5.9 Acoustic Emission sensors
In the entire AE system, the AE transducer is one of the most important components since they
largely determine the quality and accuracy of the signals [162]. The AE sensor used in this
project are piezoelectric comprising a lead zirconate titanate (PZT) crystal capable of sensing
small surface displacements and transform them into electrical signals through the reverse
piezoelectric effect.
When piezoelectric materials are subject to stress they deform elastically and become polarised
generating a voltage across them [156]. This type of sensor is the most common one used in AE
testing since they are cheap, sensitive and easy to use [160]. However, fibre optic sensors have
also been developed which can also be used to sense AE activity [92]. Alternatively, laser
ultrasonics and electromagnetic acoustic transducers (EMATs) can be used instead if contact is
not permitted or not desirable. EMATs are only applicable when a material is conductive so
they can potentially be used in CFRC but the signal to noise ratio will be extremely poor.
As shown in figure 5.10 the sensing element is bonded with a damper, which is usually made
from epoxy in order to suppress its resonance and therefore allow the sensor to operate in a
82
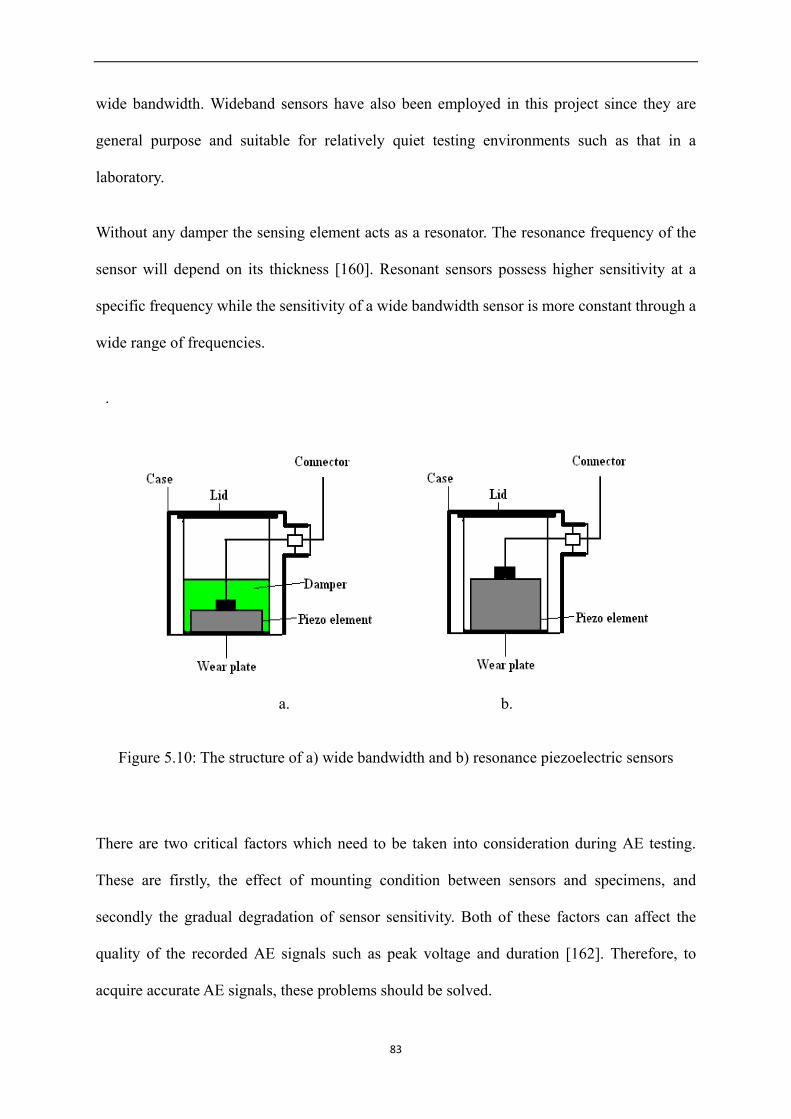
wide bandwidth. Wideband sensors have also been employed in this project since they are
general purpose and suitable for relatively quiet testing environments such as that in a
laboratory.
Without any damper the sensing element acts as a resonator. The resonance frequency of the
sensor will depend on its thickness [160]. Resonant sensors possess higher sensitivity at a
specific frequency while the sensitivity of a wide bandwidth sensor is more constant through a
wide range of frequencies.
.
a. b.
Figure 5.10: The structure of a) wide bandwidth and b) resonance piezoelectric sensors
There are two critical factors which need to be taken into consideration during AE testing.
These are firstly, the effect of mounting condition between sensors and specimens, and
secondly the gradual degradation of sensor sensitivity. Both of these factors can affect the
quality of the recorded AE signals such as peak voltage and duration [162]. Therefore, to
acquire accurate AE signals, these problems should be solved.
83

In this project, the mounting condition has been taken into consideration and thus a suitable
couplant based on paraffin has been selected to couple the sensors on the specimen. Also
sufficient pressure has been applied to make sure the sensor has consistent coupling throughout
the test. The couplant is used to increase the transmittance of the stress waves between the
sensor and the specimen. Common couplants can be pine-resin, glue or silicon grease although
in this case paraffin has been selected instead.
Sensitivity degradation of sensors commonly occurs because degradation of the couplant with
time, commonly due to high temperature within the operating environment or excessive
moisture. Before testing is assumed calibration of the sensors is required first to ensure their
correct coupling before testing begins. To do this a simple and quick calibration method called
pencil lead break (PLB) or Hsu-Nielsen test is carried out.
In PLB testing, an AE signal, which is similar to natural AE burst type signals, is generated by
breaking a 0.5mm diameter 2H graphite lead by around 3 mm length. A guiding a plastic ring is
applied to ensure constant break angle of the lead tip in each test, as presented in figure 5.11.
For good mounting condition an AE signal with the amplitude over 90 dB should be generated
during a PLB test lead [163].
Figure 5.11: Schematic representation of pencil lead break method
84
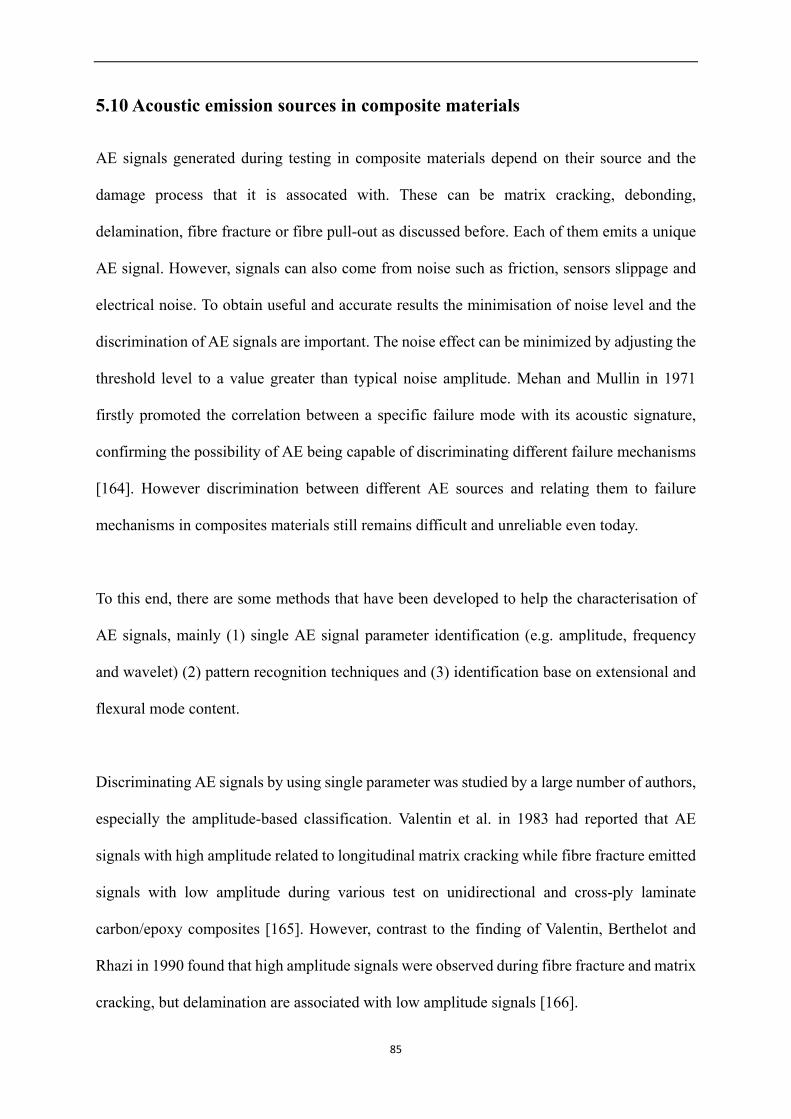
5.10 Acoustic emission sources in composite materials
AE signals generated during testing in composite materials depend on their source and the
damage process that it is assocated with. These can be matrix cracking, debonding,
delamination, fibre fracture or fibre pull-out as discussed before. Each of them emits a unique
AE signal. However, signals can also come from noise such as friction, sensors slippage and
electrical noise. To obtain useful and accurate results the minimisation of noise level and the
discrimination of AE signals are important. The noise effect can be minimized by adjusting the
threshold level to a value greater than typical noise amplitude. Mehan and Mullin in 1971
firstly promoted the correlation between a specific failure mode with its acoustic signature,
confirming the possibility of AE being capable of discriminating different failure mechanisms
[164]. However discrimination between different AE sources and relating them to failure
mechanisms in composites materials still remains difficult and unreliable even today.
To this end, there are some methods that have been developed to help the characterisation of
AE signals, mainly (1) single AE signal parameter identification (e.g. amplitude, frequency
and wavelet) (2) pattern recognition techniques and (3) identification base on extensional and
flexural mode content.
Discriminating AE signals by using single parameter was studied by a large number of authors,
especially the amplitude-based classification. Valentin et al. in 1983 had reported that AE
signals with high amplitude related to longitudinal matrix cracking while fibre fracture emitted
signals with low amplitude during various test on unidirectional and cross-ply laminate
carbon/epoxy composites [165]. However, contrast to the finding of Valentin, Berthelot and
Rhazi in 1990 found that high amplitude signals were observed during fibre fracture and matrix
cracking, but delamination are associated with low amplitude signals [166].
85
These two contradictory results could be explained by a possible reason. According to Ni and
Iwamoto the amplitude of the AE signal in composite materials largely depends on the distance
between sensors and AE source because of the attenuation effect [167]. Therefore
amplitude-based analysis methods may not be reliable according to Zheng et al. [144].
Frequency-based analysis methods are used by some of other researchers since frequency is not
affected by sensor distance but are sensor, location and material dependent [166].
According to the studies carried out by Groot in 1995 [168] and Ramirez-Jimenez in 2004
[169], various composite specimens have been tested, and both studies revealed that fibre
breakage generated high frequency signals while signals associated with fibre pull-out located
in intermediate frequency range, and the signals of matrix cracking have low frequency range.
Moreover, Peter in 1995 also reported that the frequency of signals associated with fibre
breakage is higher than 300 kHz, for fibre pull-out the frequency ranges from180 to 240 kHz,
and matrix cracking generated signals having the frequency between 90 and 180 kHz [114].
Nevertheless classification of AE signals based solely on frequency can be affected by the
conditions of sensors. Therefore, other identification methods that are not solely rely on single
parameter, such as pattern recognition techniques were used to improve signal identification.
Pattern recognition technique, which classifies a set of AE data into several groups that indicate
the internal structure of the data, contains two types: supervised and unsupervised [141]. With
supervised methods such as K-means algorithm, input signals are associated to a cluster with
known feature (i.e. failure mode) while in unsupervised case, for example Kohonen's
self-organizing map (SOM), the cluster feature is unknown and signals are grouped according
86
to their similar characteristics in the data structure [170]. However, SOM (unsupervised) and
K-means algorithms (supervised) can be combined to obtain the best clustering quality [113].
Furthermore, the Modal Acoustic Emission technique, which is based on waveform types
(extensional or flexural mode), can be used to classify AE signals. Its efficiency was
demonstrated by Surgeon and Wevers in 1999, but it is impractical for the examination of every
single waveform [171].
The validity of AE techniques for damage monitoring has been assessed in numerous previous
studies. According to Oliveira, six different AE waveforms were identified after the tensile test
of FRP samples, and different damage mechanisms of FRP can be identified by the modal
nature of AE waveforms [172]. Moevus in 2007 reported the success in distinguishing the
different failure mechanisms of two SiC/ [Si–B–C] composites using AE techniques [173]. The
failure mechanism sequence of cross-ply CFRC during compressive loading was studied by
Mizutani et al. in 1999 by using the AE method combined with modal analysis of Lamb waves,
and the examination of microscopy [174]. Revealing the damage mechanisms of cross-ply
CFRC as follow, fibre breakage in the front layer, transverse matrix crack in the mid-layer,
delamination and splitting. Bussiba et al. in 2007 used AE methods to track the damage
accumulation profiles of Glare 2 fibre metal laminate, Gr/Ep and C/C composites during
uniaxial loading and bending using notched and integrated samples, and applied wavelet
transforms to process the AE signals [175]. According to AE results, they reported different
damage accumulation profiles for different samples, and the transition of failure
micro-mechanisms with respect to the effect of various parameters such as temperature,
orientation and density of samples.
87
Furthermore, the AE method has been reportedly used to study the interfacial properties of
single fibre composite (SFC) as well. In SFC testing, the correspondence between observed
fibre breakages (by optical microscopy) and number of AE events had been demonstrated by
Clough in 1996 [176]. This allowed the calculation of the interfacial shear strength (IFSS) by
using the Kelly-Tyson model [177].
During AE testing of fibre-reinforced composites, fibre breakages usually release the greatest
energy and exhibit the highest frequency and amplitude content in AE signal [178].
Furthermore, fibre, as the reinforcement phase, sustains a large portion of applied load; its
properties crucially determined the mechanical properties of composites. Therefore, to
evaluate the AE events of carbon-fibre based composite the characterisation of the AE events
of carbon fibre failure mechanisms is essential.
88

CHAPTER 6
Experimental Methodology
89
6.1 Introduction
This chapter is concerned with the description of the experimental methodology employed
during the project. The materials, specimen types and tests carried out during the project in
order to assess the overall capability of the acoustic emission technique are described in detail.
6.2 Carbon fibre bundle samples
As received carbon fibre bundles (T700SC) supplied by TORAYCA company were used in this
study. Each bundle contains 12000 filaments, and each filament has a 7 μm diameter. In order
to evaluate the AE events associated with tensile test of carbon fibre bundles, 4 types of
samples were employed, as shown in Table 6.1. To obtain relative accurate results, ten samples
were produced for each kind of sample with the exception of sample 200 Sm, of which only
five samples were produced.
Carbon fibre bundles with the length longer than required gauge length cut from spooled fibre.
The two free ends of each specimen were laid in the middle of the aluminium end-tabs and
tightly bonded together by resin. Attention has been paid to ensure even tension distribution on
each filament, but perfect distribution cannot be achieved due to the large number of filaments.
Twisted samples were made just prior to tensile test by twisting as-received samples twice.
Small bundle samples were produced by simply hand-separating a whole bundle into three
small bundles with the roughly same width, and then attached to the end-tabs.
The key characteristics of the type T700SC carbon fibre bundle are summarised in table 6.2.
Carbon fibre bundles with the length longer than required gauge length (200mm) cut from
spooled fibre.
90
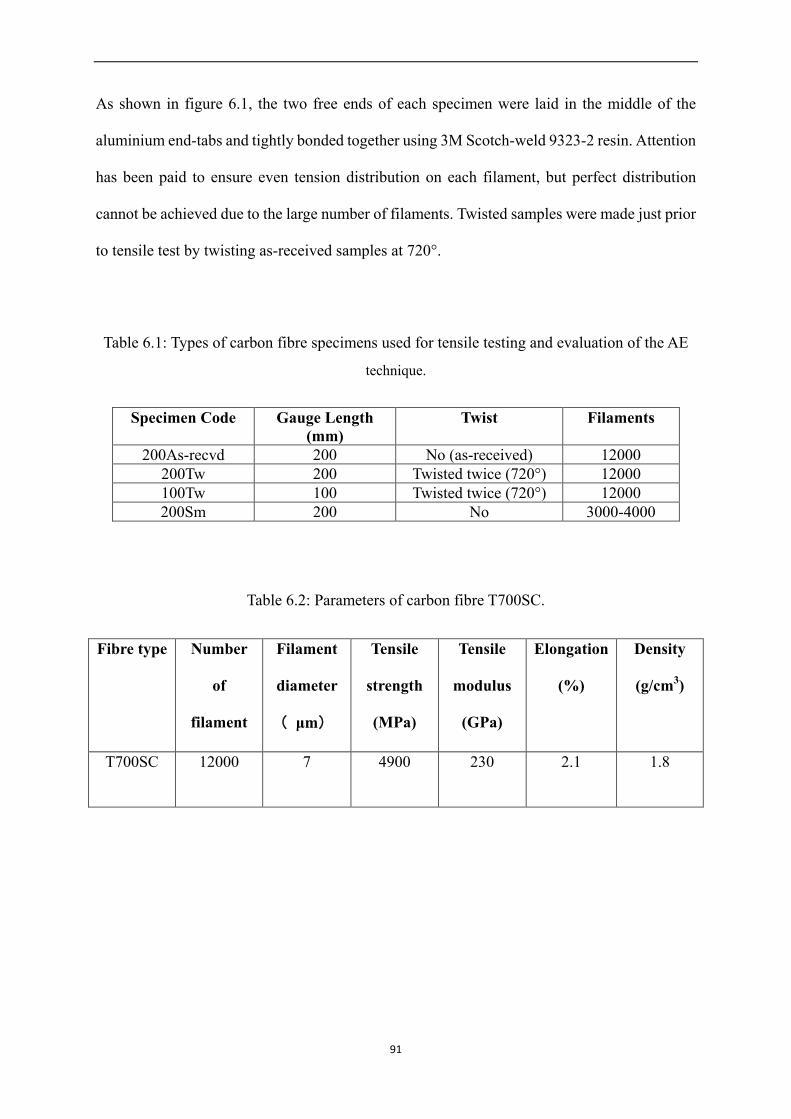
As shown in figure 6.1, the two free ends of each specimen were laid in the middle of the
aluminium end-tabs and tightly bonded together using 3M Scotch-weld 9323-2 resin. Attention
has been paid to ensure even tension distribution on each filament, but perfect distribution
cannot be achieved due to the large number of filaments. Twisted samples were made just prior
to tensile test by twisting as-received samples at 720°.
Table 6.1: Types of carbon fibre specimens used for tensile testing and evaluation of the AE
technique.
Specimen Code Gauge Length (mm)
Twist Filaments
200As-recvd 200 No (as-received) 12000 200Tw 200 Twisted twice (720°) 12000 100Tw 100 Twisted twice (720°) 12000 200Sm 200 No 3000-4000
Table 6.2: Parameters of carbon fibre T700SC.
Fibre type Number
of
filament
Filament
diameter
( μm)
Tensile
strength
(MPa)
Tensile
modulus
(GPa)
Elongation
(%)
Density
(g/cm3)
T700SC 12000 7 4900 230 2.1 1.8
91
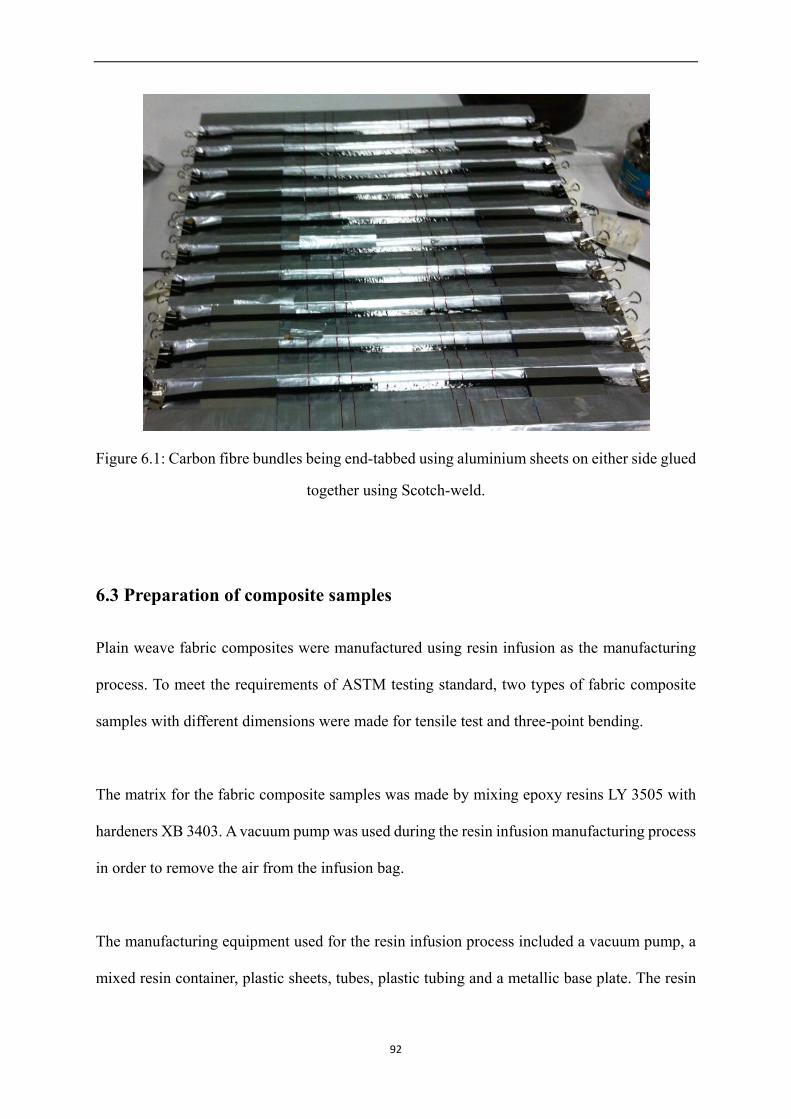
Figure 6.1: Carbon fibre bundles being end-tabbed using aluminium sheets on either side glued
together using Scotch-weld.
6.3 Preparation of composite samples
Plain weave fabric composites were manufactured using resin infusion as the manufacturing
process. To meet the requirements of ASTM testing standard, two types of fabric composite
samples with different dimensions were made for tensile test and three-point bending.
The matrix for the fabric composite samples was made by mixing epoxy resins LY 3505 with
hardeners XB 3403. A vacuum pump was used during the resin infusion manufacturing process
in order to remove the air from the infusion bag.
The manufacturing equipment used for the resin infusion process included a vacuum pump, a
mixed resin container, plastic sheets, tubes, plastic tubing and a metallic base plate. The resin
92

infusion process started with the preparation of the vacuum bagging system. As shown in
figure 6.2, a plastic film was placed on the base plate to enable the easy release of the
composite at the end. Then the first peeled ply with size larger than that of composite was
placed on the plastic film to enhance the vertical impregnation process. Carbon fabrics were
stacked onto the first peel ply, after that second peel ply was placed onto the fabrics, and
followed by a resin flow media.
After the stacking of these plies in correct sequence, the omega tube as the inlet was placed
onto the resin flow media. Another omega tube as the outlet was placed onto the first peel ply,
and the plastic hoses were inserted into both omega tubes.
The whole system was covered with two plastic sheets and sealed. The system was evacuated,
and when the vacuum pressure reached about 0.9 bar, the plastic hose was inserted into the
resin inlet tube and immersed into a resin tank to allow the resin to be infused into the fabrics,
as shown in figure 6.3. A curing time of eight hours was required for the resin infusion process
to be completed under room temperature.
93
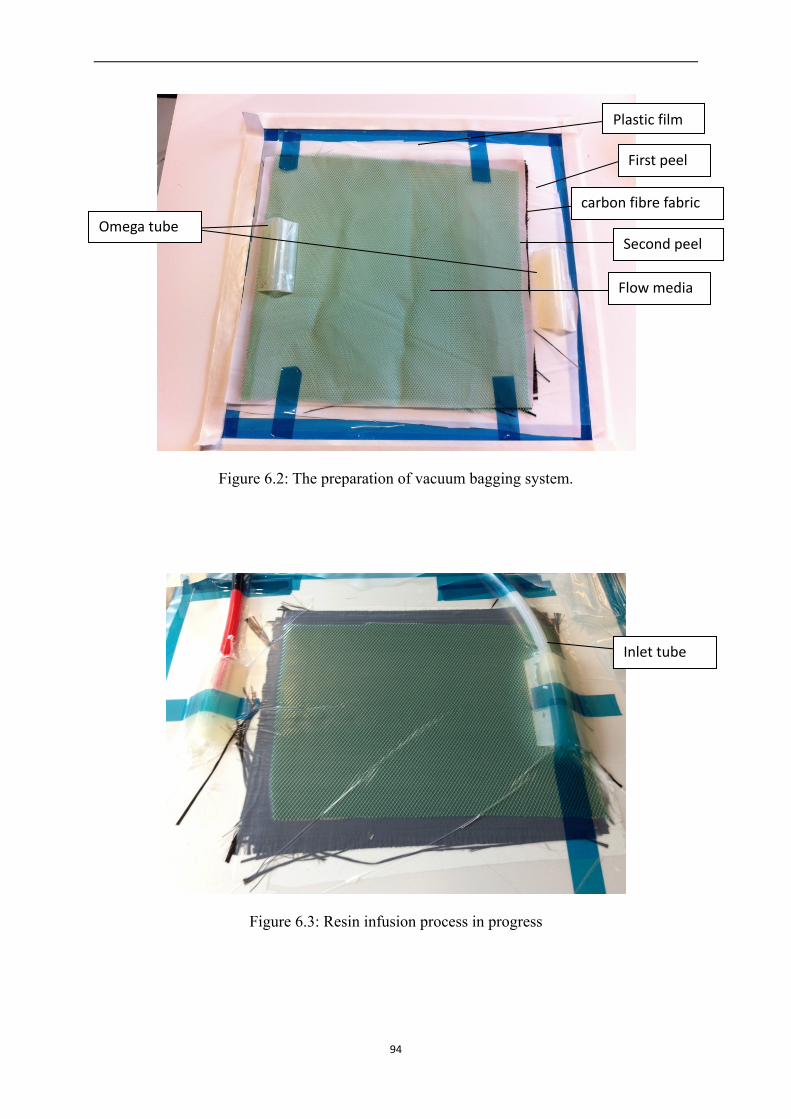
Figure 6.2: The preparation of vacuum bagging system.
Figure 6.3: Resin infusion process in progress
Omega tube
Flow media
Second peel
carbon fibre fabric
First peel
Plastic film
Inlet tube
94
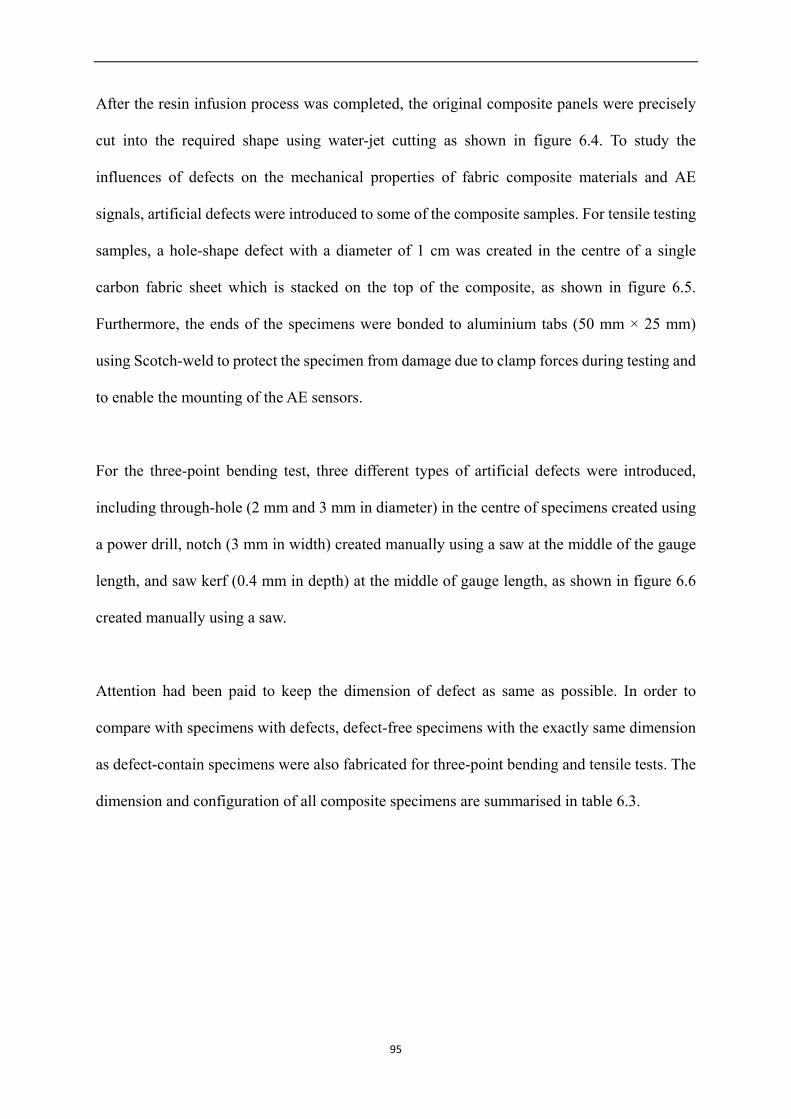
After the resin infusion process was completed, the original composite panels were precisely
cut into the required shape using water-jet cutting as shown in figure 6.4. To study the
influences of defects on the mechanical properties of fabric composite materials and AE
signals, artificial defects were introduced to some of the composite samples. For tensile testing
samples, a hole-shape defect with a diameter of 1 cm was created in the centre of a single
carbon fabric sheet which is stacked on the top of the composite, as shown in figure 6.5.
Furthermore, the ends of the specimens were bonded to aluminium tabs (50 mm × 25 mm)
using Scotch-weld to protect the specimen from damage due to clamp forces during testing and
to enable the mounting of the AE sensors.
For the three-point bending test, three different types of artificial defects were introduced,
including through-hole (2 mm and 3 mm in diameter) in the centre of specimens created using
a power drill, notch (3 mm in width) created manually using a saw at the middle of the gauge
length, and saw kerf (0.4 mm in depth) at the middle of gauge length, as shown in figure 6.6
created manually using a saw.
Attention had been paid to keep the dimension of defect as same as possible. In order to
compare with specimens with defects, defect-free specimens with the exactly same dimension
as defect-contain specimens were also fabricated for three-point bending and tensile tests. The
dimension and configuration of all composite specimens are summarised in table 6.3.
95
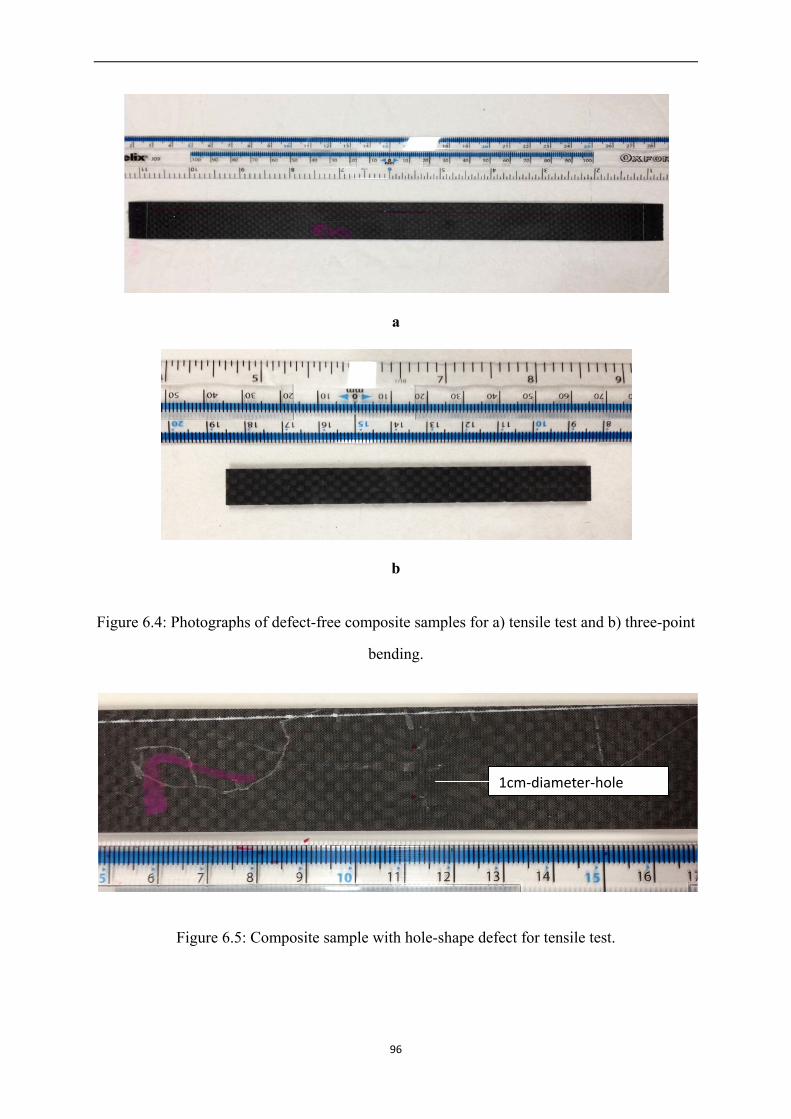
a
b
Figure 6.4: Photographs of defect-free composite samples for a) tensile test and b) three-point
bending.
Figure 6.5: Composite sample with hole-shape defect for tensile test.
1cm-diameter-hole
96
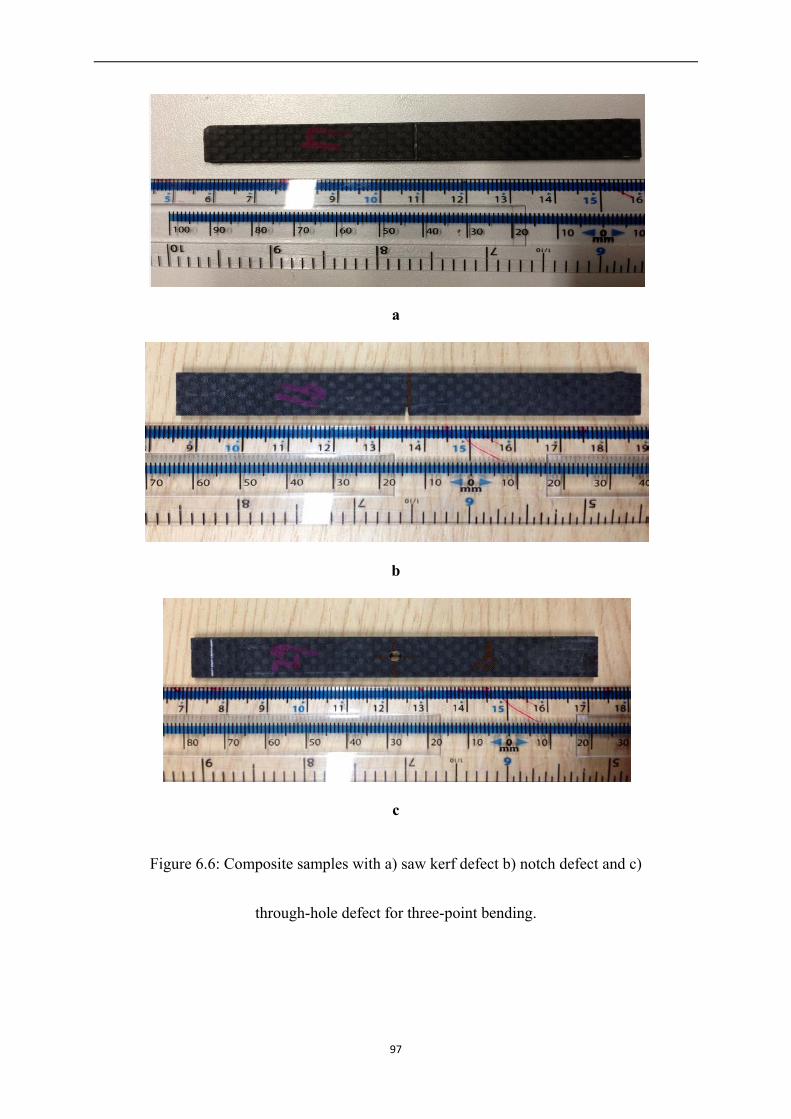
a
b
c
Figure 6.6: Composite samples with a) saw kerf defect b) notch defect and c)
through-hole defect for three-point bending.
97
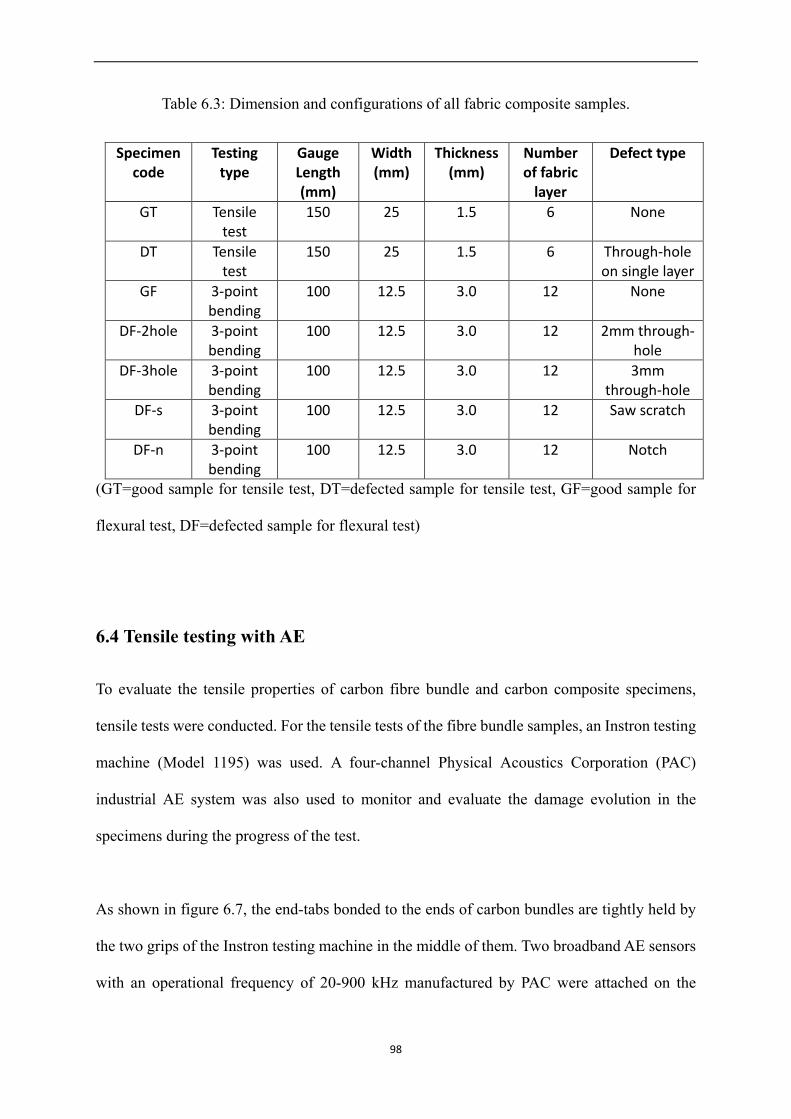
Table 6.3: Dimension and configurations of all fabric composite samples.
Specimen code
Testing type
Gauge Length (mm)
Width (mm)
Thickness (mm)
Number of fabric
layer
Defect type
GT Tensile test
150 25 1.5 6 None
DT Tensile test
150 25 1.5 6 Through-hole on single layer
GF 3-point bending
100 12.5 3.0 12 None
DF-2hole 3-point bending
100 12.5 3.0 12 2mm through- hole
DF-3hole 3-point bending
100 12.5 3.0 12 3mm through-hole
DF-s 3-point bending
100 12.5 3.0 12 Saw scratch
DF-n 3-point bending
100 12.5 3.0 12 Notch
(GT=good sample for tensile test, DT=defected sample for tensile test, GF=good sample for
flexural test, DF=defected sample for flexural test)
6.4 Tensile testing with AE
To evaluate the tensile properties of carbon fibre bundle and carbon composite specimens,
tensile tests were conducted. For the tensile tests of the fibre bundle samples, an Instron testing
machine (Model 1195) was used. A four-channel Physical Acoustics Corporation (PAC)
industrial AE system was also used to monitor and evaluate the damage evolution in the
specimens during the progress of the test.
As shown in figure 6.7, the end-tabs bonded to the ends of carbon bundles are tightly held by
the two grips of the Instron testing machine in the middle of them. Two broadband AE sensors
with an operational frequency of 20-900 kHz manufactured by PAC were attached on the
98
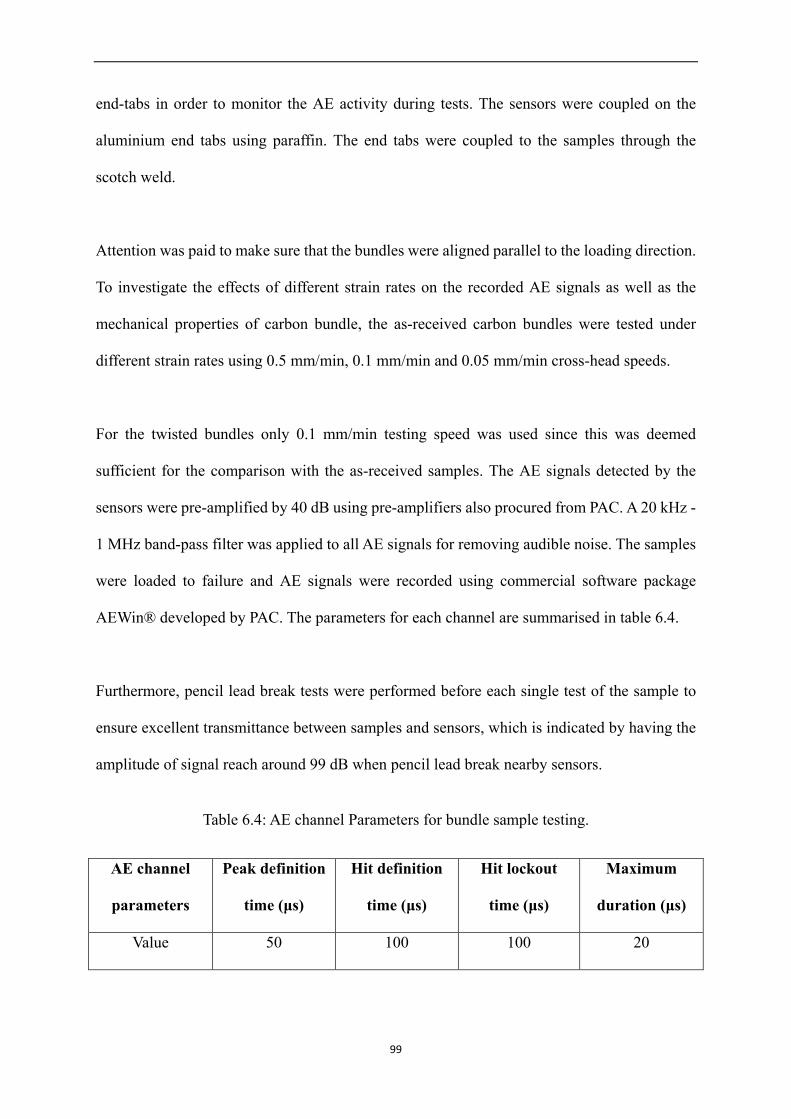
end-tabs in order to monitor the AE activity during tests. The sensors were coupled on the
aluminium end tabs using paraffin. The end tabs were coupled to the samples through the
scotch weld.
Attention was paid to make sure that the bundles were aligned parallel to the loading direction.
To investigate the effects of different strain rates on the recorded AE signals as well as the
mechanical properties of carbon bundle, the as-received carbon bundles were tested under
different strain rates using 0.5 mm/min, 0.1 mm/min and 0.05 mm/min cross-head speeds.
For the twisted bundles only 0.1 mm/min testing speed was used since this was deemed
sufficient for the comparison with the as-received samples. The AE signals detected by the
sensors were pre-amplified by 40 dB using pre-amplifiers also procured from PAC. A 20 kHz -
1 MHz band-pass filter was applied to all AE signals for removing audible noise. The samples
were loaded to failure and AE signals were recorded using commercial software package
AEWin® developed by PAC. The parameters for each channel are summarised in table 6.4.
Furthermore, pencil lead break tests were performed before each single test of the sample to
ensure excellent transmittance between samples and sensors, which is indicated by having the
amplitude of signal reach around 99 dB when pencil lead break nearby sensors.
Table 6.4: AE channel Parameters for bundle sample testing.
AE channel
parameters
Peak definition
time (μs)
Hit definition
time (μs)
Hit lockout
time (μs)
Maximum
duration (μs)
Value 50 100 100 20
99

Figure 6.7: The set-up of tensile test for carbon bundle specimens (as-received).
The tensile failure of the composite specimens requires a much larger applied load compared to
carbon bundle samples, therefore the tensile tests of composite specimens were carried out by
using Zwick/Roell testing machine whose maximum load can reach up to 20 kN. As shown in
figure 6.8, the composite specimen was clamped tightly by two grips of the testing machine on
its end-tabs. Effort was made to ensure the correct alignment of the system according to ASTM
standard (D 3039). After the specimen was clamped two wideband AE sensors, which are the
same to the one used in carbon bundle sample tests, were attached directly on the sample
instead of the end tabs. Paraffin was used to couple the sensors on the samples by covering the
sensors' surfaces with a certain amount of paraffin (2mm thickness roughly) via a small
wooden stick.
100
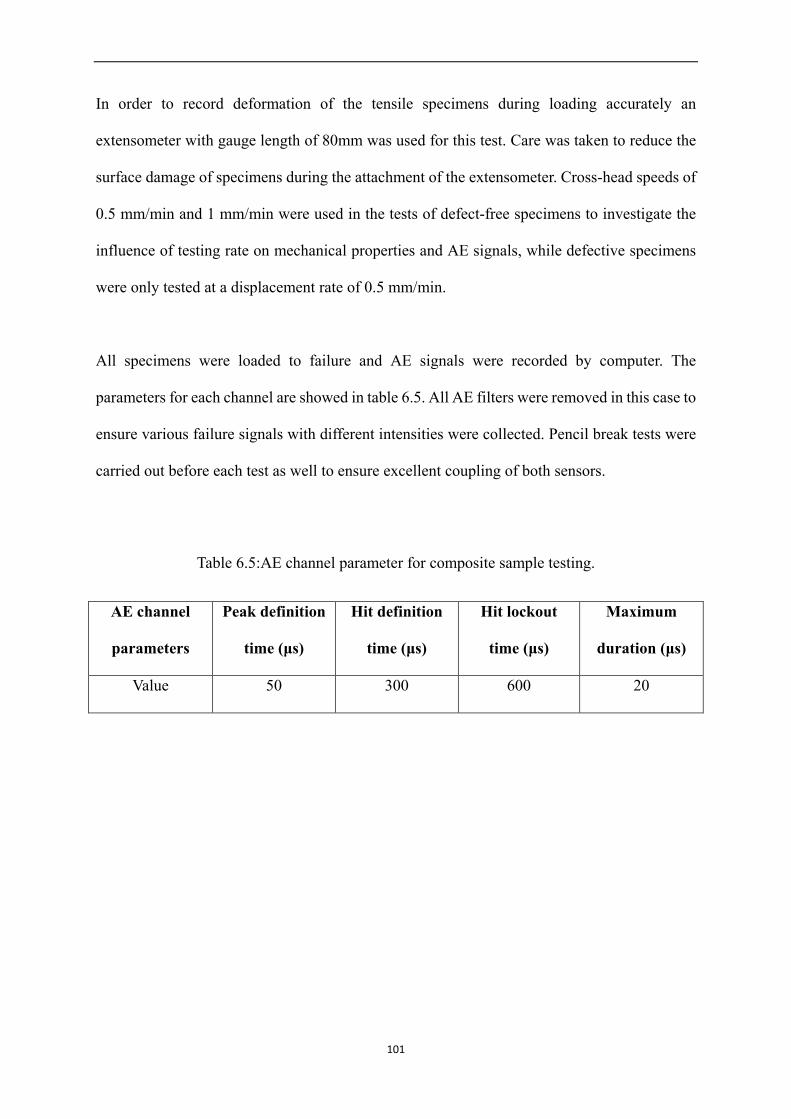
In order to record deformation of the tensile specimens during loading accurately an
extensometer with gauge length of 80mm was used for this test. Care was taken to reduce the
surface damage of specimens during the attachment of the extensometer. Cross-head speeds of
0.5 mm/min and 1 mm/min were used in the tests of defect-free specimens to investigate the
influence of testing rate on mechanical properties and AE signals, while defective specimens
were only tested at a displacement rate of 0.5 mm/min.
All specimens were loaded to failure and AE signals were recorded by computer. The
parameters for each channel are showed in table 6.5. All AE filters were removed in this case to
ensure various failure signals with different intensities were collected. Pencil break tests were
carried out before each test as well to ensure excellent coupling of both sensors.
Table 6.5:AE channel parameter for composite sample testing.
AE channel
parameters
Peak definition
time (μs)
Hit definition
time (μs)
Hit lockout
time (μs)
Maximum
duration (μs)
Value 50 300 600 20
101
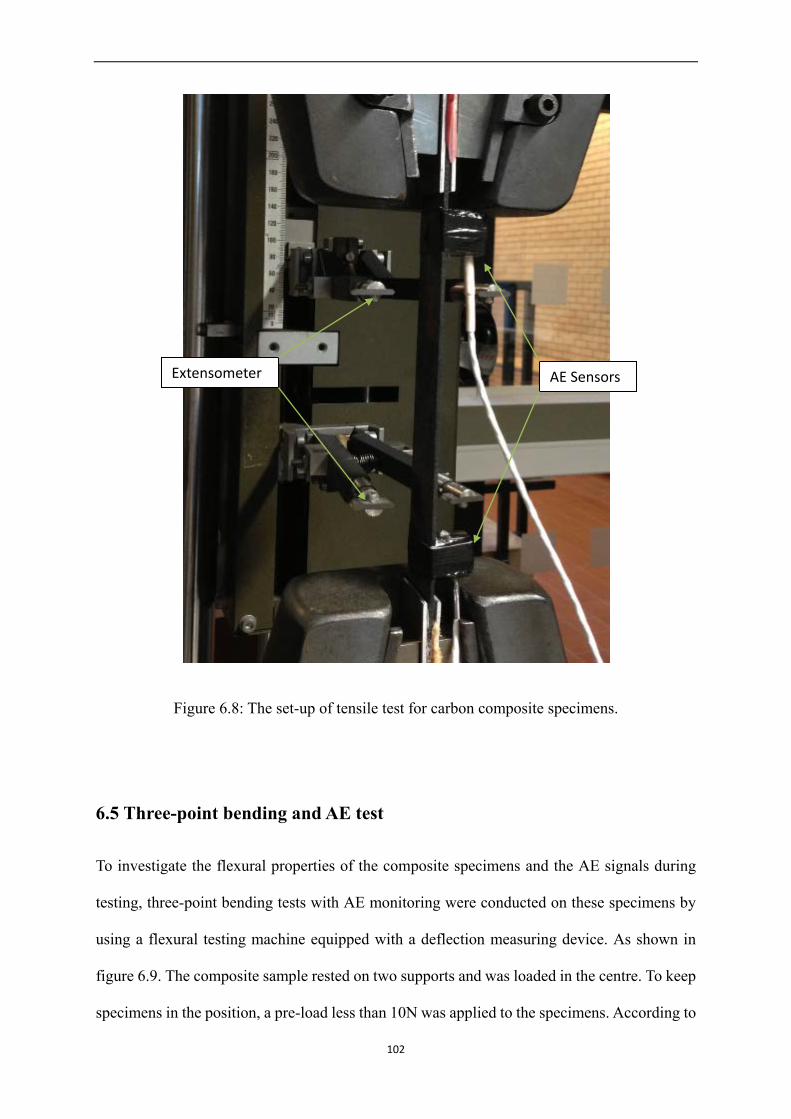
Figure 6.8: The set-up of tensile test for carbon composite specimens.
6.5 Three-point bending and AE test
To investigate the flexural properties of the composite specimens and the AE signals during
testing, three-point bending tests with AE monitoring were conducted on these specimens by
using a flexural testing machine equipped with a deflection measuring device. As shown in
figure 6.9. The composite sample rested on two supports and was loaded in the centre. To keep
specimens in the position, a pre-load less than 10N was applied to the specimens. According to
AE Sensors Extensometer
102
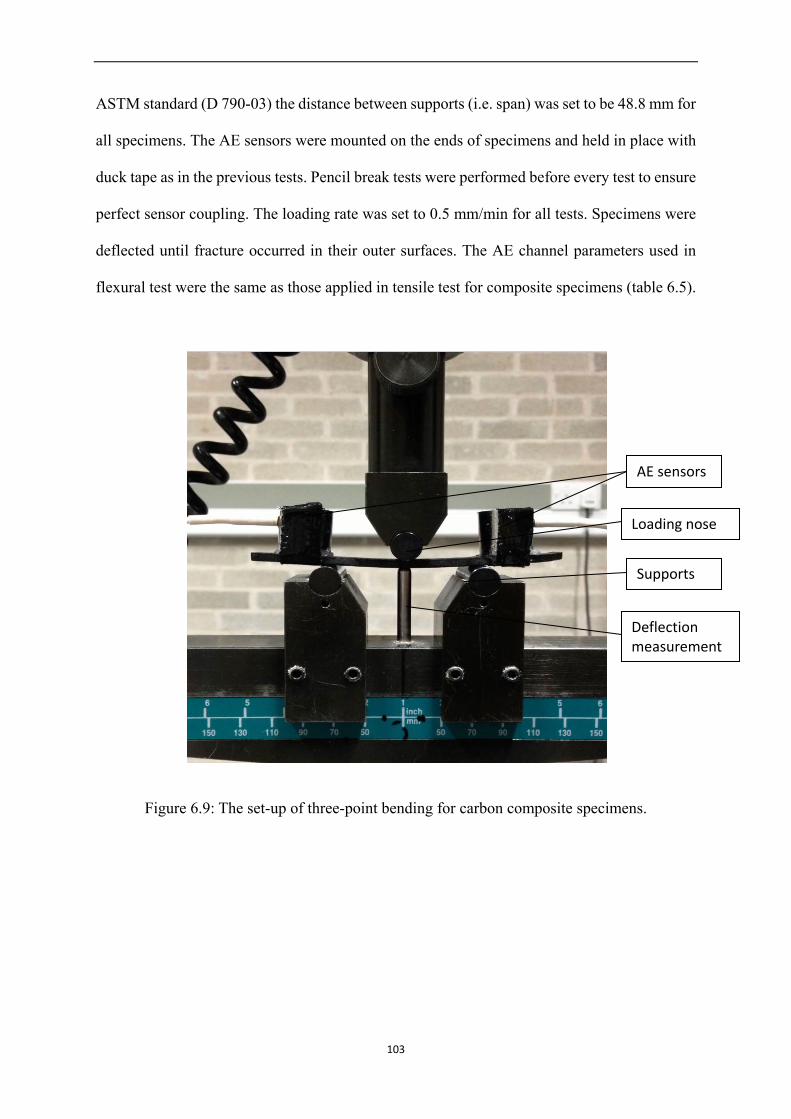
ASTM standard (D 790-03) the distance between supports (i.e. span) was set to be 48.8 mm for
all specimens. The AE sensors were mounted on the ends of specimens and held in place with
duck tape as in the previous tests. Pencil break tests were performed before every test to ensure
perfect sensor coupling. The loading rate was set to 0.5 mm/min for all tests. Specimens were
deflected until fracture occurred in their outer surfaces. The AE channel parameters used in
flexural test were the same as those applied in tensile test for composite specimens (table 6.5).
Figure 6.9: The set-up of three-point bending for carbon composite specimens.
AE sensors
Supports
Loading nose
Deflection measurement
103

CHAPTER 7
Results and Discussion for Carbon Fibre Bundles
104
7.1 Introduction
The seventh and eighth chapter of this thesis present the main results of the experimental work
carried out. The results have been analysed and the key findings are discussed in detail. The
chapter is split into two main sections. The seventh chapter is concerned with the experiments
carried out on carbon fibre bundles, starting with tests on a limited number of filaments
(<5,000) followed by tests on the as-received bundles containing ~12,000 filaments. These
tests have been carried out to establish the capability of the AE technique in the most simplified
condition with only carbon fibres being present. The eighth chapter goes on to present the key
findings from the experiments carried out on composite samples using tensile and three-point
bending tests. The results from the carbon fibre tests have been used to establish a sound
analysis methodology for the AE data collected for the much more complicated composite
samples which involve several damage mechanisms.
7.2 Carbon fibre bundle samples
In the first part of this chapter, the results from tensile testing of various carbon fibre bundle
samples under different conditions are presented and discussed. This includes AE noise signal
filtering of the bundle samples, tensile testing on small bundle samples with less than 5,000
filaments, tensile testing on as received bundle and twisted bundle samples with 12,000
filaments and tensile testing on as received bundle under different testing speed rates. With the
analyses of the results from these tests, some fundamental information about carbon fibre
failure behaviour and the AE activity arising during tensile failure has been established.
105
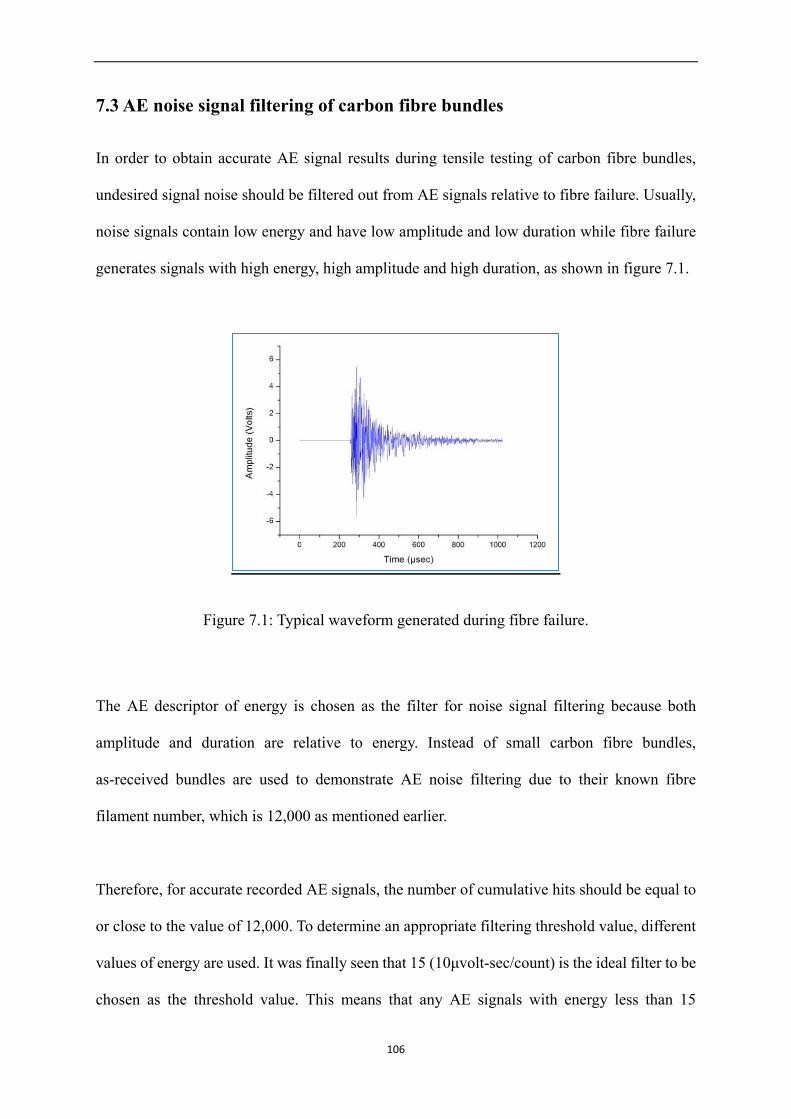
7.3 AE noise signal filtering of carbon fibre bundles
In order to obtain accurate AE signal results during tensile testing of carbon fibre bundles,
undesired signal noise should be filtered out from AE signals relative to fibre failure. Usually,
noise signals contain low energy and have low amplitude and low duration while fibre failure
generates signals with high energy, high amplitude and high duration, as shown in figure 7.1.
Figure 7.1: Typical waveform generated during fibre failure.
The AE descriptor of energy is chosen as the filter for noise signal filtering because both
amplitude and duration are relative to energy. Instead of small carbon fibre bundles,
as-received bundles are used to demonstrate AE noise filtering due to their known fibre
filament number, which is 12,000 as mentioned earlier.
Therefore, for accurate recorded AE signals, the number of cumulative hits should be equal to
or close to the value of 12,000. To determine an appropriate filtering threshold value, different
values of energy are used. It was finally seen that 15 (10μvolt-sec/count) is the ideal filter to be
chosen as the threshold value. This means that any AE signals with energy less than 15
106
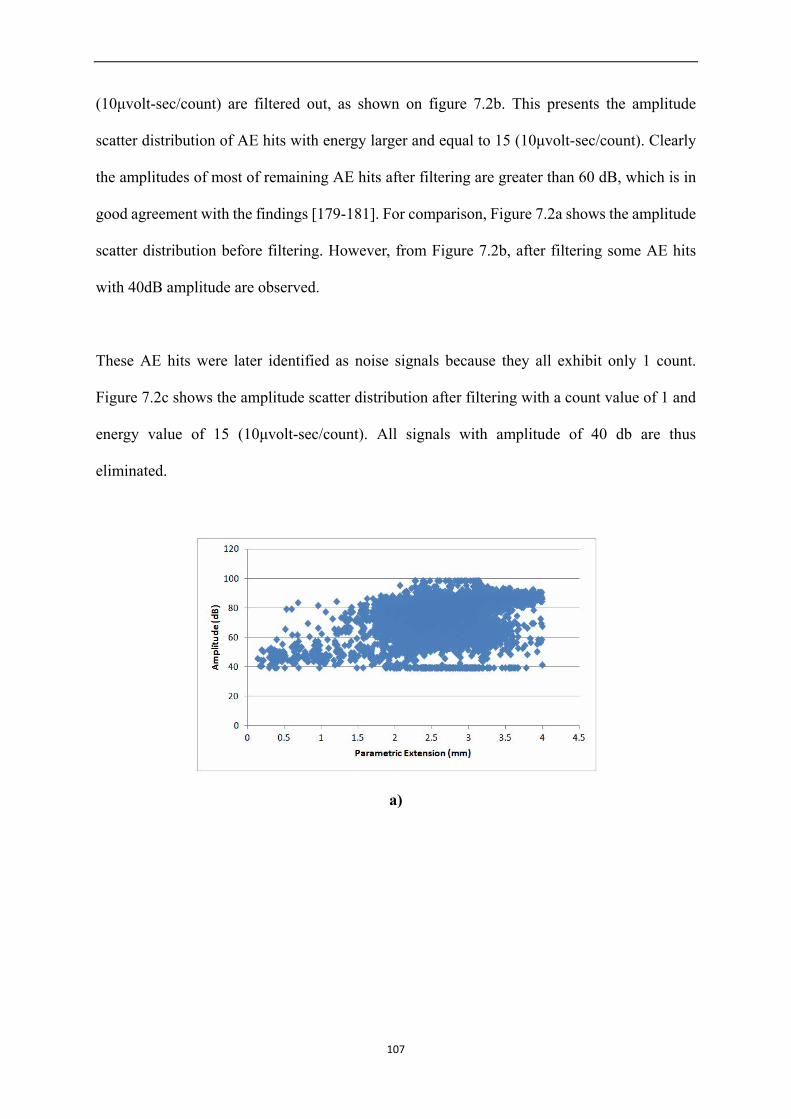
(10μvolt-sec/count) are filtered out, as shown on figure 7.2b. This presents the amplitude
scatter distribution of AE hits with energy larger and equal to 15 (10μvolt-sec/count). Clearly
the amplitudes of most of remaining AE hits after filtering are greater than 60 dB, which is in
good agreement with the findings [179-181]. For comparison, Figure 7.2a shows the amplitude
scatter distribution before filtering. However, from Figure 7.2b, after filtering some AE hits
with 40dB amplitude are observed.
These AE hits were later identified as noise signals because they all exhibit only 1 count.
Figure 7.2c shows the amplitude scatter distribution after filtering with a count value of 1 and
energy value of 15 (10μvolt-sec/count). All signals with amplitude of 40 db are thus
eliminated.
a)
107
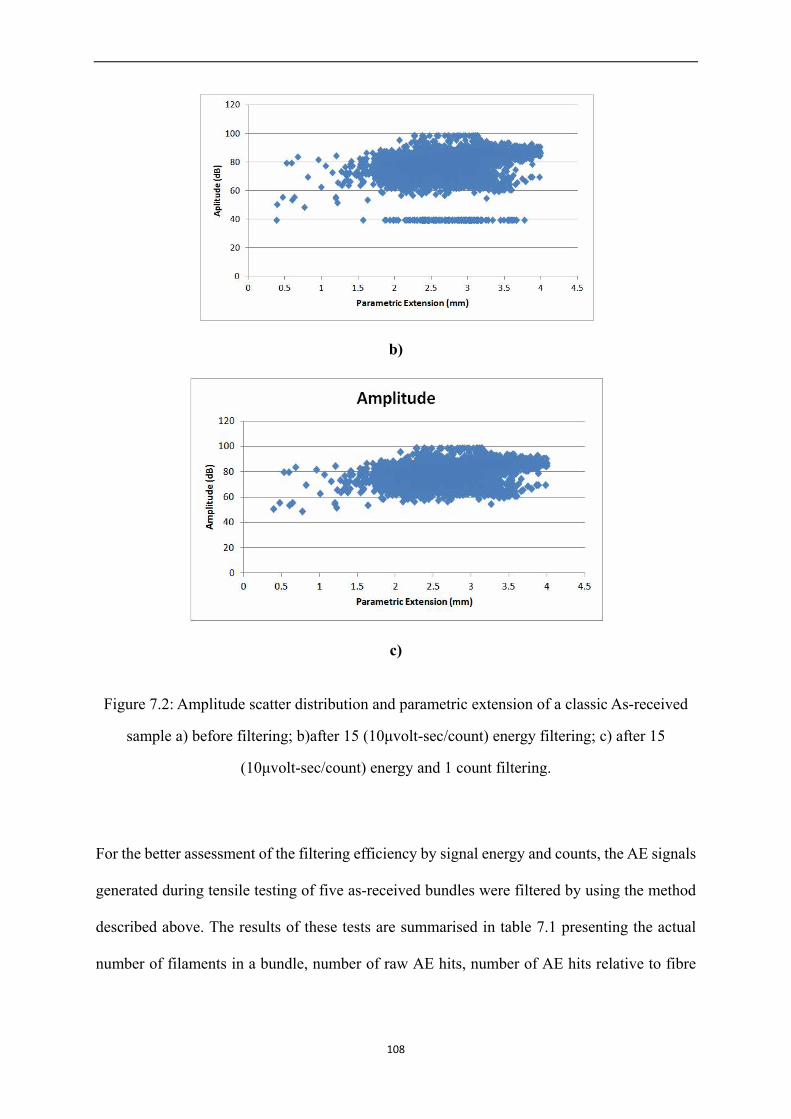
b)
c)
Figure 7.2: Amplitude scatter distribution and parametric extension of a classic As-received
sample a) before filtering; b)after 15 (10μvolt-sec/count) energy filtering; c) after 15
(10μvolt-sec/count) energy and 1 count filtering.
For the better assessment of the filtering efficiency by signal energy and counts, the AE signals
generated during tensile testing of five as-received bundles were filtered by using the method
described above. The results of these tests are summarised in table 7.1 presenting the actual
number of filaments in a bundle, number of raw AE hits, number of AE hits relative to fibre
108
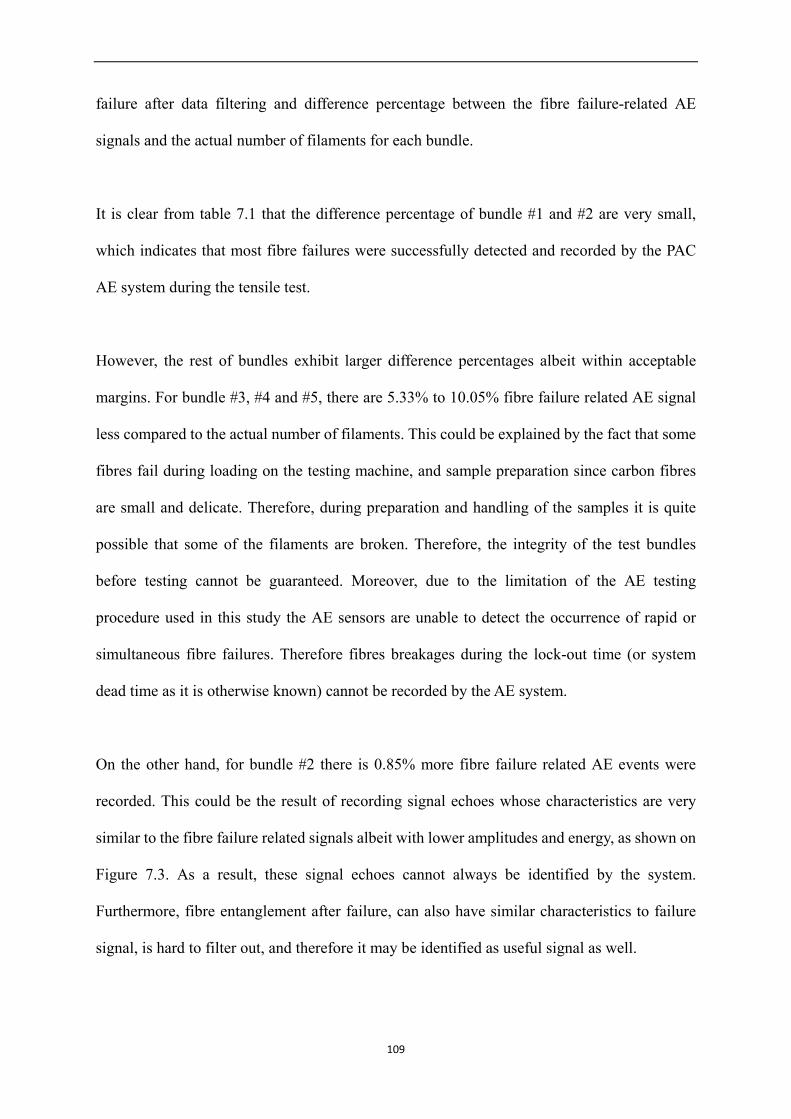
failure after data filtering and difference percentage between the fibre failure-related AE
signals and the actual number of filaments for each bundle.
It is clear from table 7.1 that the difference percentage of bundle #1 and #2 are very small,
which indicates that most fibre failures were successfully detected and recorded by the PAC
AE system during the tensile test.
However, the rest of bundles exhibit larger difference percentages albeit within acceptable
margins. For bundle #3, #4 and #5, there are 5.33% to 10.05% fibre failure related AE signal
less compared to the actual number of filaments. This could be explained by the fact that some
fibres fail during loading on the testing machine, and sample preparation since carbon fibres
are small and delicate. Therefore, during preparation and handling of the samples it is quite
possible that some of the filaments are broken. Therefore, the integrity of the test bundles
before testing cannot be guaranteed. Moreover, due to the limitation of the AE testing
procedure used in this study the AE sensors are unable to detect the occurrence of rapid or
simultaneous fibre failures. Therefore fibres breakages during the lock-out time (or system
dead time as it is otherwise known) cannot be recorded by the AE system.
On the other hand, for bundle #2 there is 0.85% more fibre failure related AE events were
recorded. This could be the result of recording signal echoes whose characteristics are very
similar to the fibre failure related signals albeit with lower amplitudes and energy, as shown on
Figure 7.3. As a result, these signal echoes cannot always be identified by the system.
Furthermore, fibre entanglement after failure, can also have similar characteristics to failure
signal, is hard to filter out, and therefore it may be identified as useful signal as well.
109
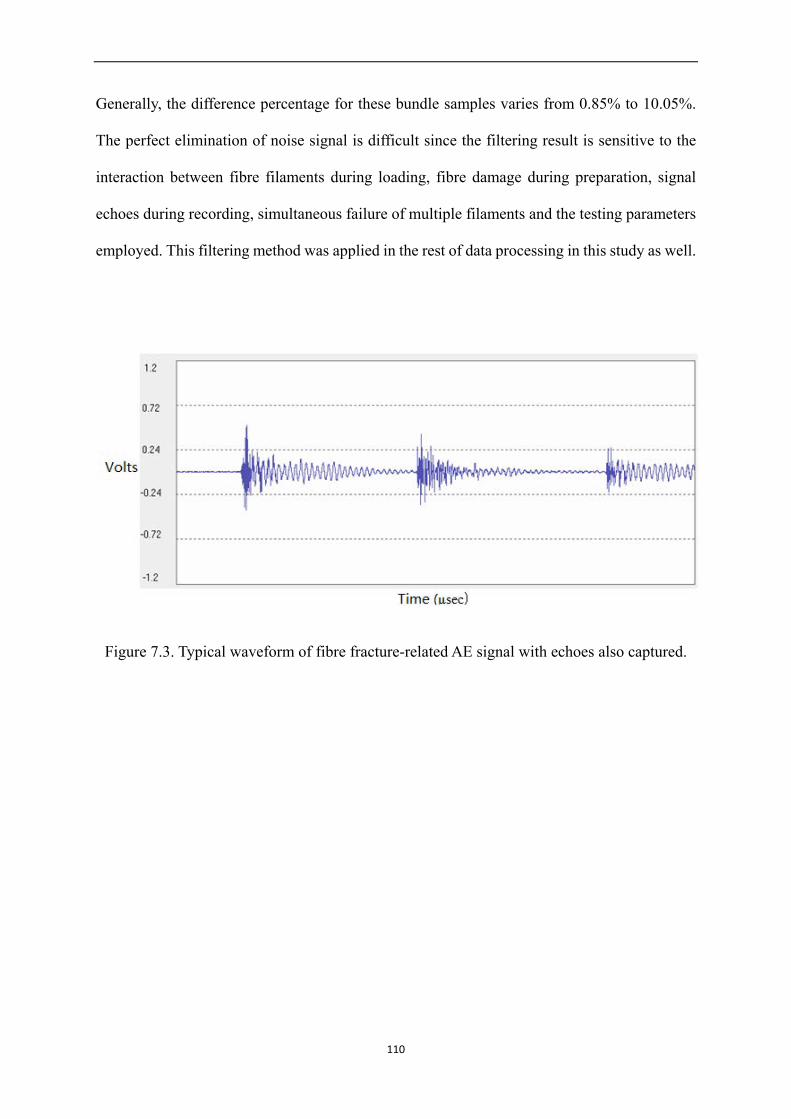
Generally, the difference percentage for these bundle samples varies from 0.85% to 10.05%.
The perfect elimination of noise signal is difficult since the filtering result is sensitive to the
interaction between fibre filaments during loading, fibre damage during preparation, signal
echoes during recording, simultaneous failure of multiple filaments and the testing parameters
employed. This filtering method was applied in the rest of data processing in this study as well.
Figure 7.3. Typical waveform of fibre fracture-related AE signal with echoes also captured.
110
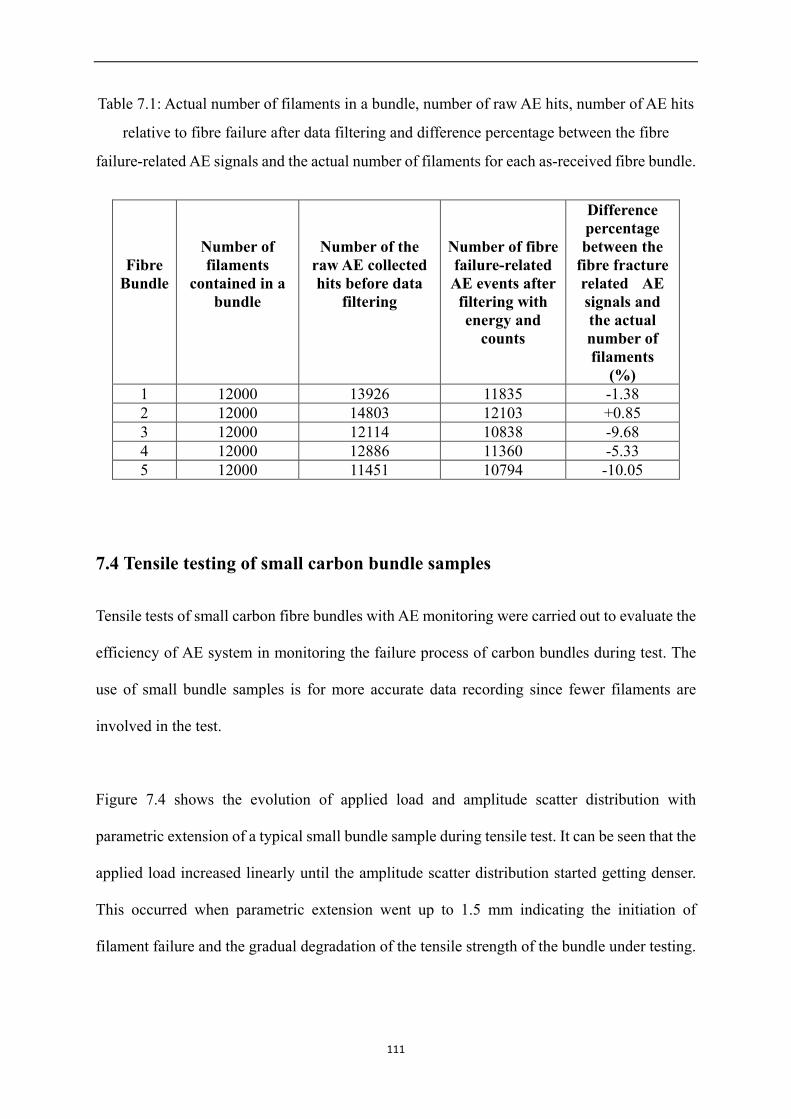
Table 7.1: Actual number of filaments in a bundle, number of raw AE hits, number of AE hits
relative to fibre failure after data filtering and difference percentage between the fibre
failure-related AE signals and the actual number of filaments for each as-received fibre bundle.
Fibre Bundle
Number of filaments
contained in a bundle
Number of the raw AE collected hits before data
filtering
Number of fibre failure-related AE events after
filtering with energy and
counts
Difference percentage between the
fibre fracture related AE signals and the actual number of filaments
(%) 1 12000 13926 11835 -1.38 2 12000 14803 12103 +0.85 3 12000 12114 10838 -9.68 4 12000 12886 11360 -5.33 5 12000 11451 10794 -10.05
7.4 Tensile testing of small carbon bundle samples
Tensile tests of small carbon fibre bundles with AE monitoring were carried out to evaluate the
efficiency of AE system in monitoring the failure process of carbon bundles during test. The
use of small bundle samples is for more accurate data recording since fewer filaments are
involved in the test.
Figure 7.4 shows the evolution of applied load and amplitude scatter distribution with
parametric extension of a typical small bundle sample during tensile test. It can be seen that the
applied load increased linearly until the amplitude scatter distribution started getting denser.
This occurred when parametric extension went up to 1.5 mm indicating the initiation of
filament failure and the gradual degradation of the tensile strength of the bundle under testing.
111
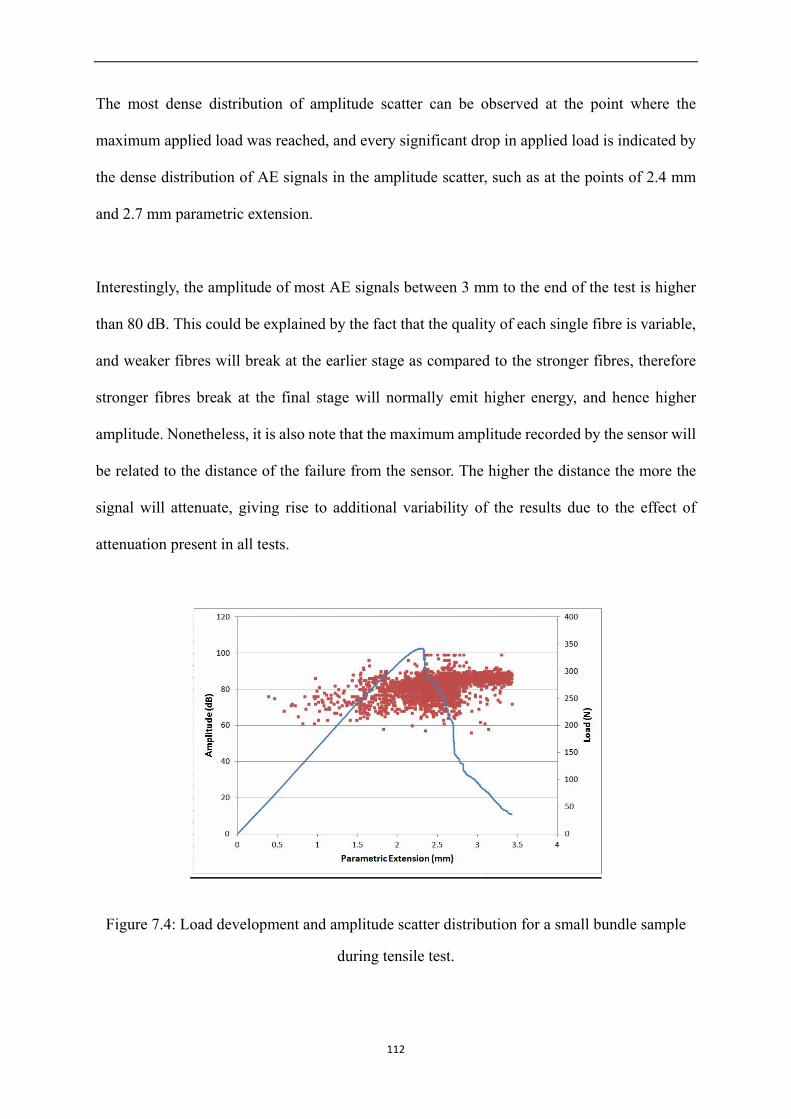
The most dense distribution of amplitude scatter can be observed at the point where the
maximum applied load was reached, and every significant drop in applied load is indicated by
the dense distribution of AE signals in the amplitude scatter, such as at the points of 2.4 mm
and 2.7 mm parametric extension.
Interestingly, the amplitude of most AE signals between 3 mm to the end of the test is higher
than 80 dB. This could be explained by the fact that the quality of each single fibre is variable,
and weaker fibres will break at the earlier stage as compared to the stronger fibres, therefore
stronger fibres break at the final stage will normally emit higher energy, and hence higher
amplitude. Nonetheless, it is also note that the maximum amplitude recorded by the sensor will
be related to the distance of the failure from the sensor. The higher the distance the more the
signal will attenuate, giving rise to additional variability of the results due to the effect of
attenuation present in all tests.
Figure 7.4: Load development and amplitude scatter distribution for a small bundle sample
during tensile test.
112
Figure 7.5 illustrates the evolution of applied load and cumulative fibre fracture related AE hits
along with parametric extension for the aforementioned small bundle. It can be seen from the
plot in figure 7.5 that AE hit accumulation evidently started at around 1.5 mm extension, where
is also the starting point for non-linearly increase of applied load.
Furthermore, when the maximum applied is reached (at around 2.4mm) the cumulative number
of AE hits increases sharply, indicating a large number of fibres failing at that point. Therefore,
the evolution of applied load is relative to that of the cumulative number of AE hits. Generally,
the AE system is capable of monitoring the mechanical evolution of the fibre bundles, and it is
also able to monitor their failure evolution at failure starting stage and final failure stage.
Figure 7.5: The evolution of applied load and cumulative AE hits with parametric extension.
113
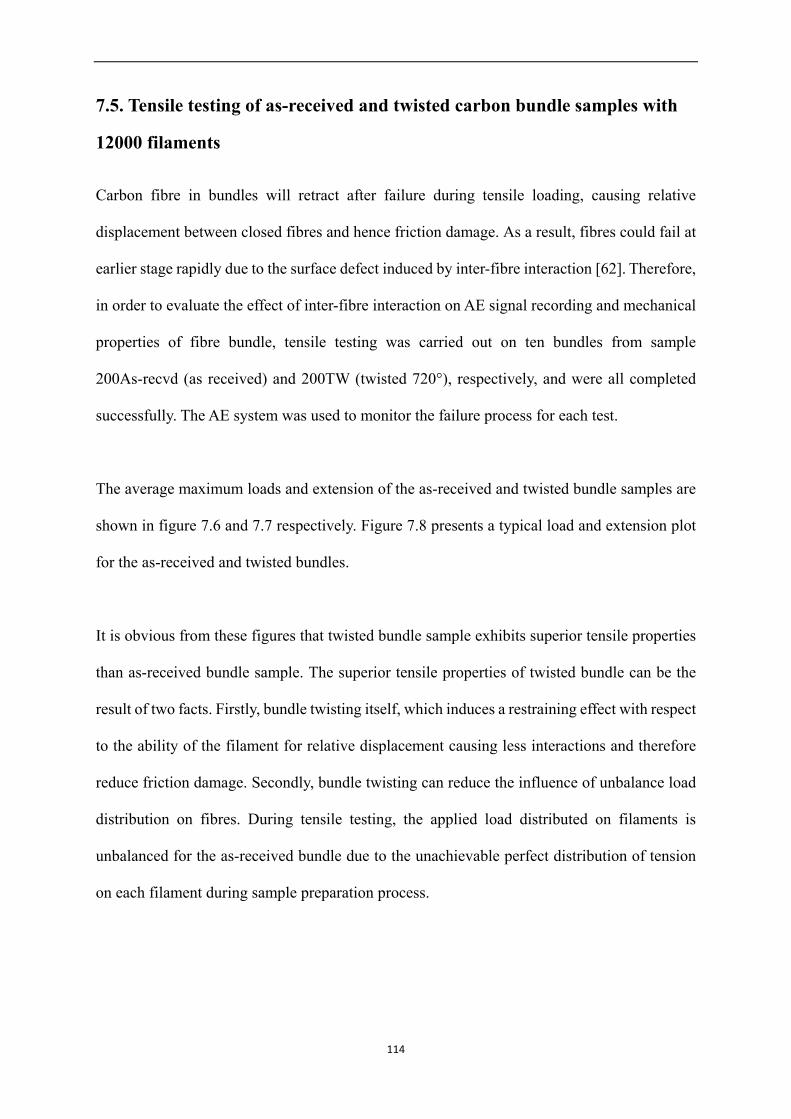
7.5. Tensile testing of as-received and twisted carbon bundle samples with
12000 filaments
Carbon fibre in bundles will retract after failure during tensile loading, causing relative
displacement between closed fibres and hence friction damage. As a result, fibres could fail at
earlier stage rapidly due to the surface defect induced by inter-fibre interaction [62]. Therefore,
in order to evaluate the effect of inter-fibre interaction on AE signal recording and mechanical
properties of fibre bundle, tensile testing was carried out on ten bundles from sample
200As-recvd (as received) and 200TW (twisted 720°), respectively, and were all completed
successfully. The AE system was used to monitor the failure process for each test.
The average maximum loads and extension of the as-received and twisted bundle samples are
shown in figure 7.6 and 7.7 respectively. Figure 7.8 presents a typical load and extension plot
for the as-received and twisted bundles.
It is obvious from these figures that twisted bundle sample exhibits superior tensile properties
than as-received bundle sample. The superior tensile properties of twisted bundle can be the
result of two facts. Firstly, bundle twisting itself, which induces a restraining effect with respect
to the ability of the filament for relative displacement causing less interactions and therefore
reduce friction damage. Secondly, bundle twisting can reduce the influence of unbalance load
distribution on fibres. During tensile testing, the applied load distributed on filaments is
unbalanced for the as-received bundle due to the unachievable perfect distribution of tension
on each filament during sample preparation process.
114
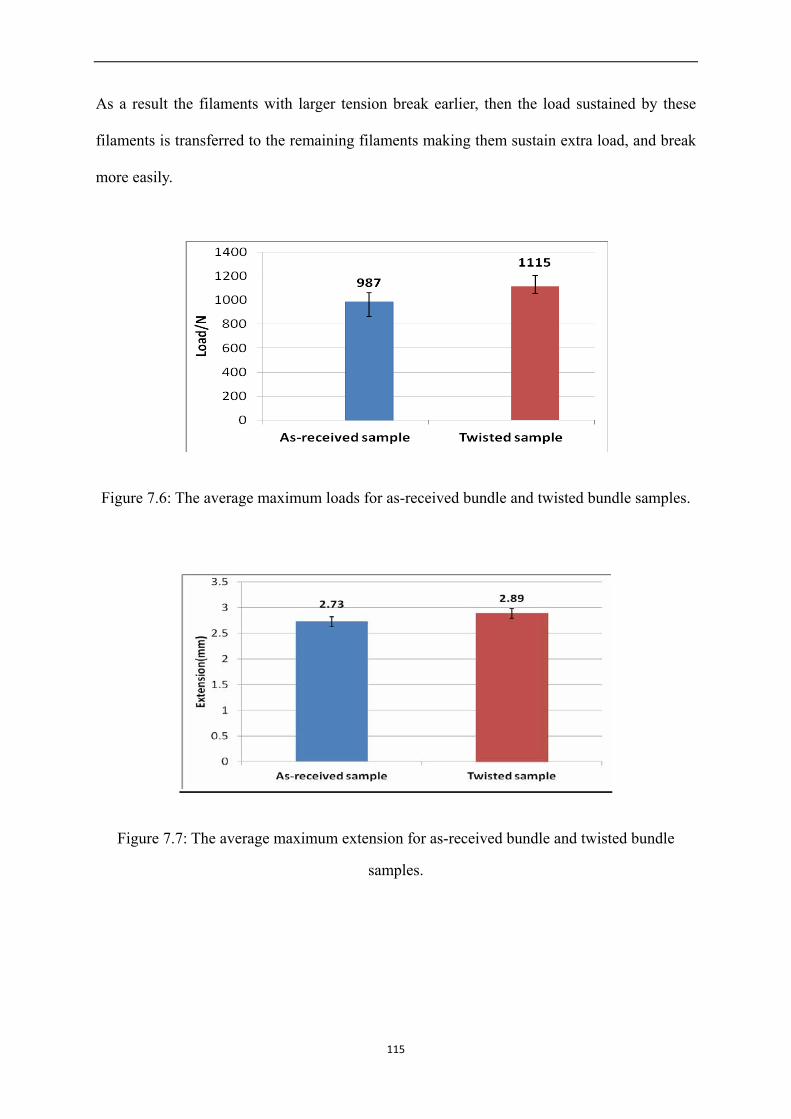
As a result the filaments with larger tension break earlier, then the load sustained by these
filaments is transferred to the remaining filaments making them sustain extra load, and break
more easily.
Figure 7.6: The average maximum loads for as-received bundle and twisted bundle samples.
Figure 7.7: The average maximum extension for as-received bundle and twisted bundle
samples.
115
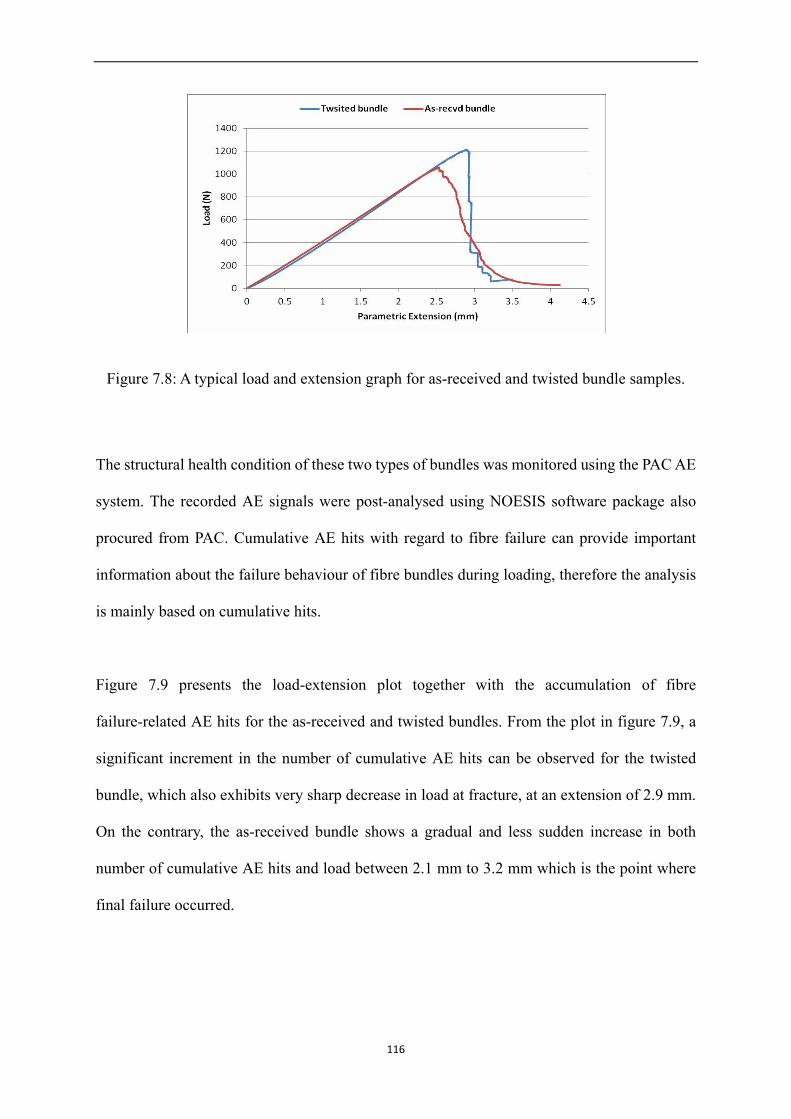
Figure 7.8: A typical load and extension graph for as-received and twisted bundle samples.
The structural health condition of these two types of bundles was monitored using the PAC AE
system. The recorded AE signals were post-analysed using NOESIS software package also
procured from PAC. Cumulative AE hits with regard to fibre failure can provide important
information about the failure behaviour of fibre bundles during loading, therefore the analysis
is mainly based on cumulative hits.
Figure 7.9 presents the load-extension plot together with the accumulation of fibre
failure-related AE hits for the as-received and twisted bundles. From the plot in figure 7.9, a
significant increment in the number of cumulative AE hits can be observed for the twisted
bundle, which also exhibits very sharp decrease in load at fracture, at an extension of 2.9 mm.
On the contrary, the as-received bundle shows a gradual and less sudden increase in both
number of cumulative AE hits and load between 2.1 mm to 3.2 mm which is the point where
final failure occurred.
116
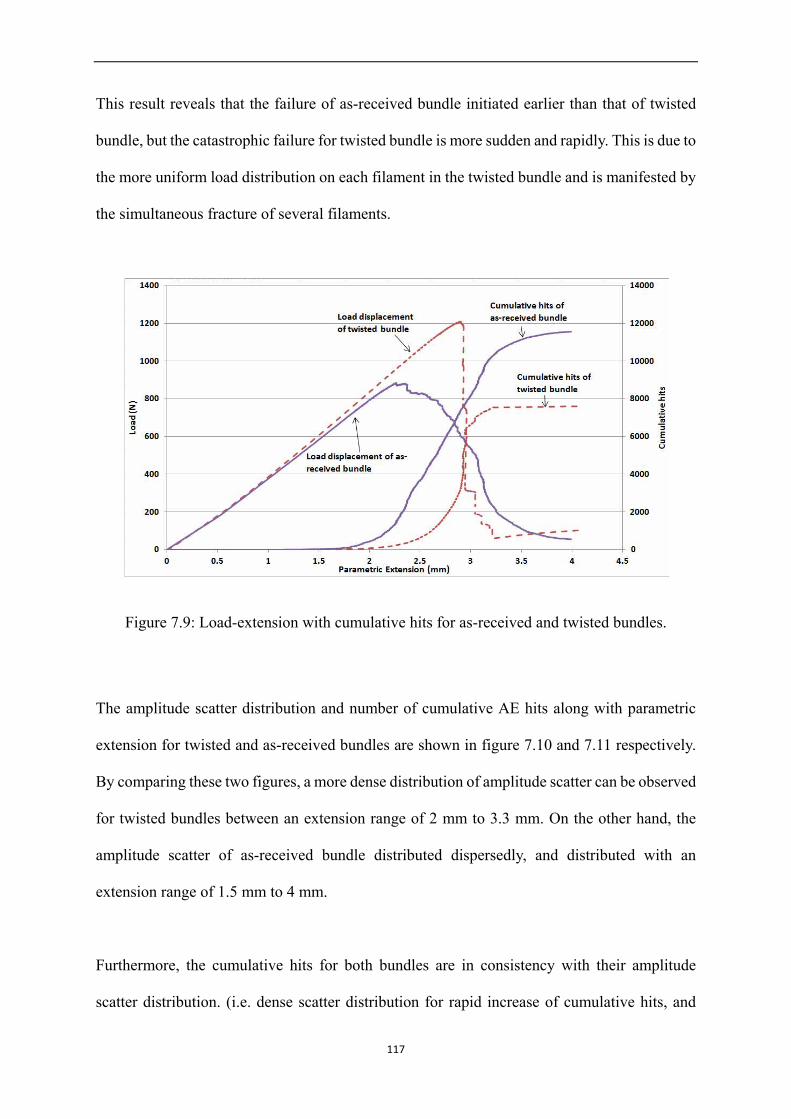
This result reveals that the failure of as-received bundle initiated earlier than that of twisted
bundle, but the catastrophic failure for twisted bundle is more sudden and rapidly. This is due to
the more uniform load distribution on each filament in the twisted bundle and is manifested by
the simultaneous fracture of several filaments.
Figure 7.9: Load-extension with cumulative hits for as-received and twisted bundles.
The amplitude scatter distribution and number of cumulative AE hits along with parametric
extension for twisted and as-received bundles are shown in figure 7.10 and 7.11 respectively.
By comparing these two figures, a more dense distribution of amplitude scatter can be observed
for twisted bundles between an extension range of 2 mm to 3.3 mm. On the other hand, the
amplitude scatter of as-received bundle distributed dispersedly, and distributed with an
extension range of 1.5 mm to 4 mm.
Furthermore, the cumulative hits for both bundles are in consistency with their amplitude
scatter distribution. (i.e. dense scatter distribution for rapid increase of cumulative hits, and
117
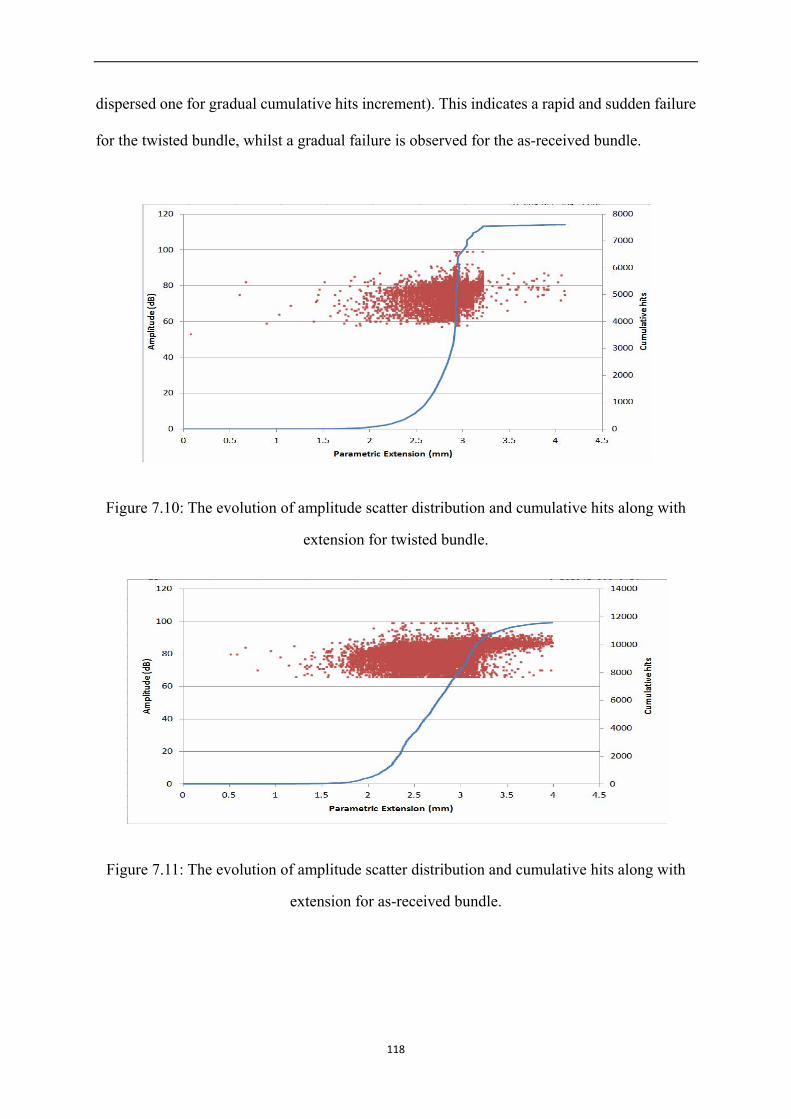
dispersed one for gradual cumulative hits increment). This indicates a rapid and sudden failure
for the twisted bundle, whilst a gradual failure is observed for the as-received bundle.
Figure 7.10: The evolution of amplitude scatter distribution and cumulative hits along with
extension for twisted bundle.
Figure 7.11: The evolution of amplitude scatter distribution and cumulative hits along with
extension for as-received bundle.
118
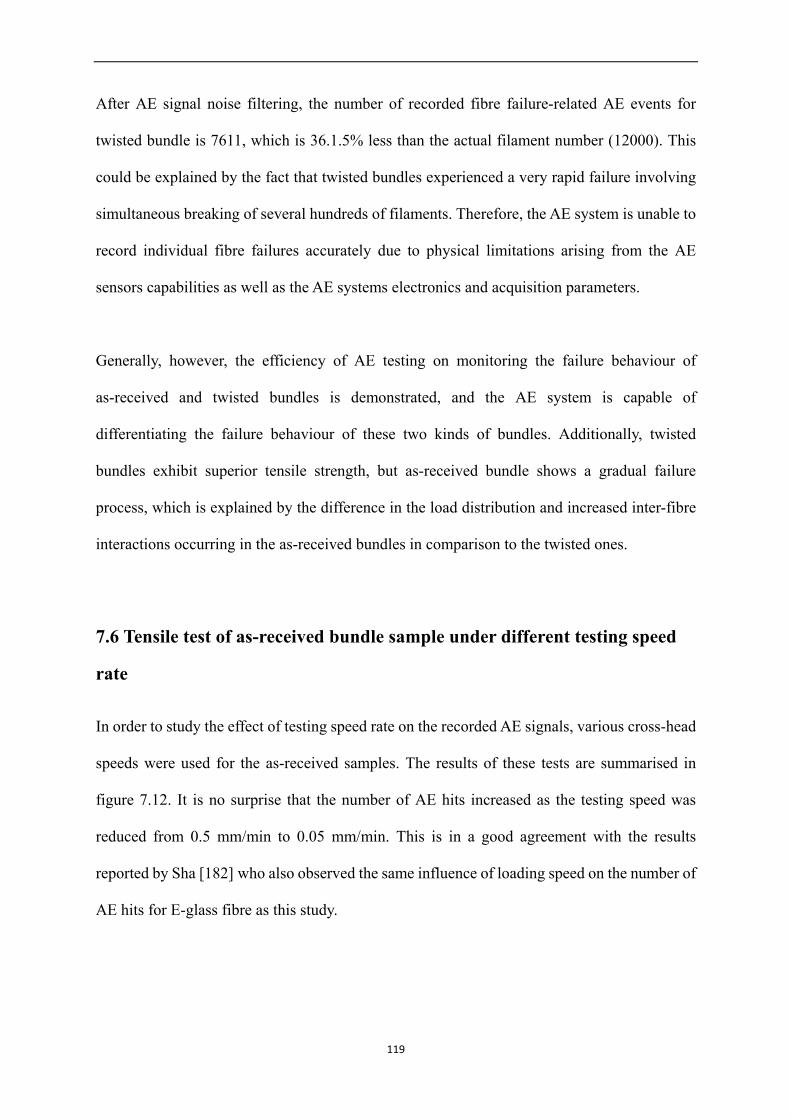
After AE signal noise filtering, the number of recorded fibre failure-related AE events for
twisted bundle is 7611, which is 36.1.5% less than the actual filament number (12000). This
could be explained by the fact that twisted bundles experienced a very rapid failure involving
simultaneous breaking of several hundreds of filaments. Therefore, the AE system is unable to
record individual fibre failures accurately due to physical limitations arising from the AE
sensors capabilities as well as the AE systems electronics and acquisition parameters.
Generally, however, the efficiency of AE testing on monitoring the failure behaviour of
as-received and twisted bundles is demonstrated, and the AE system is capable of
differentiating the failure behaviour of these two kinds of bundles. Additionally, twisted
bundles exhibit superior tensile strength, but as-received bundle shows a gradual failure
process, which is explained by the difference in the load distribution and increased inter-fibre
interactions occurring in the as-received bundles in comparison to the twisted ones.
7.6 Tensile test of as-received bundle sample under different testing speed
rate
In order to study the effect of testing speed rate on the recorded AE signals, various cross-head
speeds were used for the as-received samples. The results of these tests are summarised in
figure 7.12. It is no surprise that the number of AE hits increased as the testing speed was
reduced from 0.5 mm/min to 0.05 mm/min. This is in a good agreement with the results
reported by Sha [182] who also observed the same influence of loading speed on the number of
AE hits for E-glass fibre as this study.
119
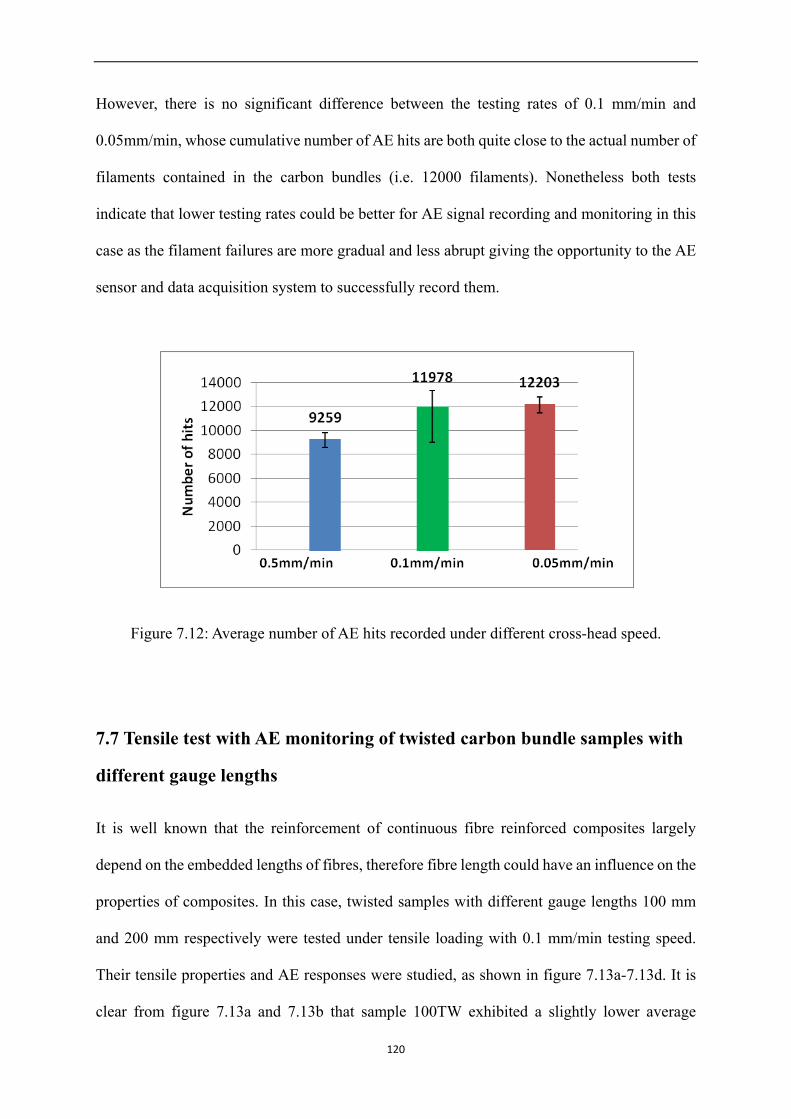
However, there is no significant difference between the testing rates of 0.1 mm/min and
0.05mm/min, whose cumulative number of AE hits are both quite close to the actual number of
filaments contained in the carbon bundles (i.e. 12000 filaments). Nonetheless both tests
indicate that lower testing rates could be better for AE signal recording and monitoring in this
case as the filament failures are more gradual and less abrupt giving the opportunity to the AE
sensor and data acquisition system to successfully record them.
Figure 7.12: Average number of AE hits recorded under different cross-head speed.
7.7 Tensile test with AE monitoring of twisted carbon bundle samples with
different gauge lengths
It is well known that the reinforcement of continuous fibre reinforced composites largely
depend on the embedded lengths of fibres, therefore fibre length could have an influence on the
properties of composites. In this case, twisted samples with different gauge lengths 100 mm
and 200 mm respectively were tested under tensile loading with 0.1 mm/min testing speed.
Their tensile properties and AE responses were studied, as shown in figure 7.13a-7.13d. It is
clear from figure 7.13a and 7.13b that sample 100TW exhibited a slightly lower average
120
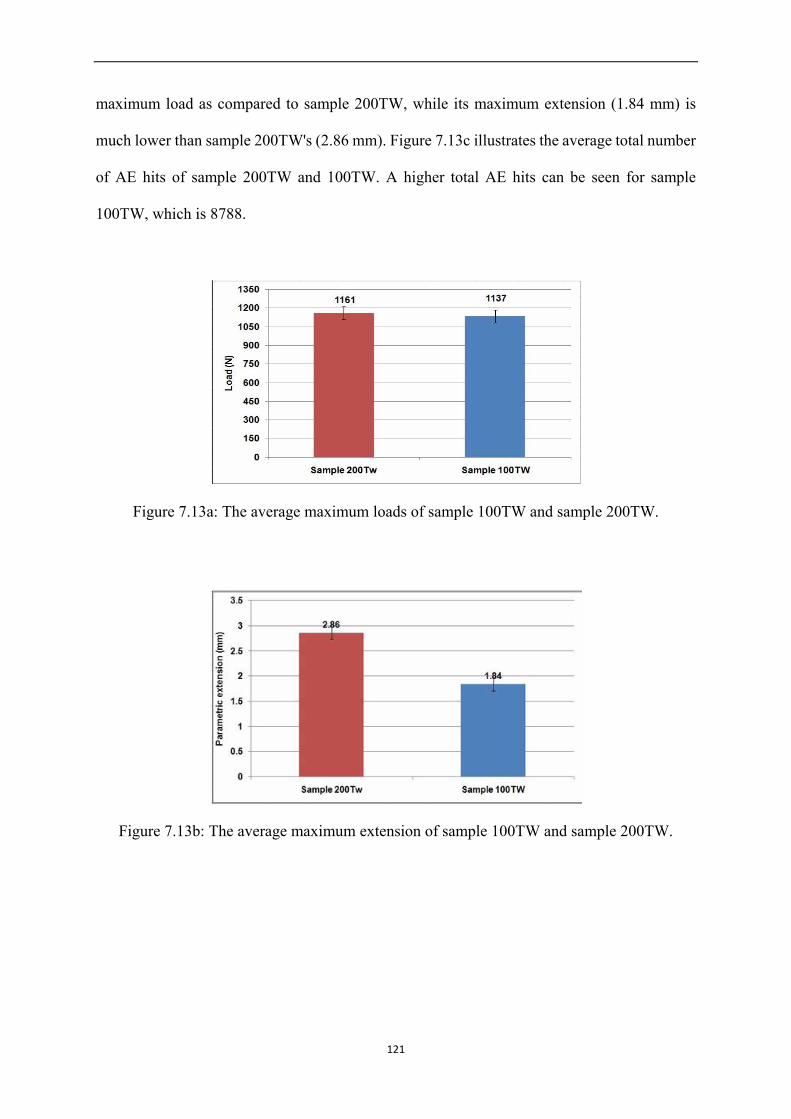
maximum load as compared to sample 200TW, while its maximum extension (1.84 mm) is
much lower than sample 200TW's (2.86 mm). Figure 7.13c illustrates the average total number
of AE hits of sample 200TW and 100TW. A higher total AE hits can be seen for sample
100TW, which is 8788.
Figure 7.13a: The average maximum loads of sample 100TW and sample 200TW.
Figure 7.13b: The average maximum extension of sample 100TW and sample 200TW.
121
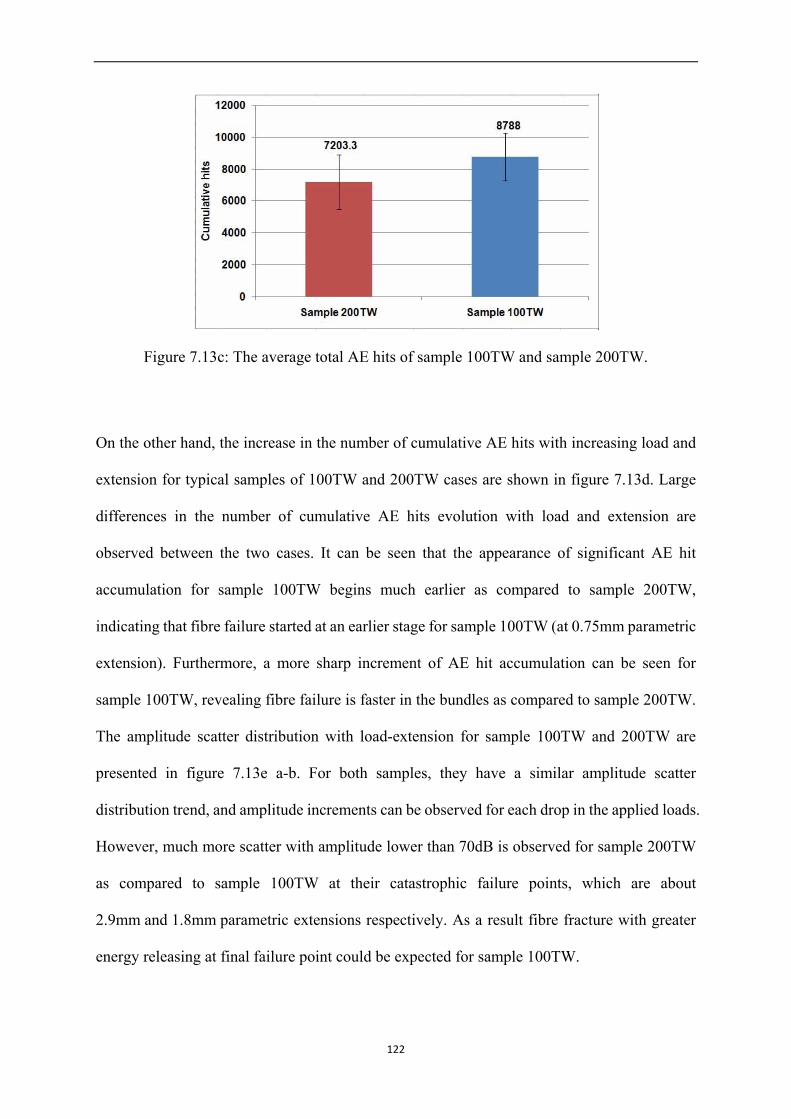
Figure 7.13c: The average total AE hits of sample 100TW and sample 200TW.
On the other hand, the increase in the number of cumulative AE hits with increasing load and
extension for typical samples of 100TW and 200TW cases are shown in figure 7.13d. Large
differences in the number of cumulative AE hits evolution with load and extension are
observed between the two cases. It can be seen that the appearance of significant AE hit
accumulation for sample 100TW begins much earlier as compared to sample 200TW,
indicating that fibre failure started at an earlier stage for sample 100TW (at 0.75mm parametric
extension). Furthermore, a more sharp increment of AE hit accumulation can be seen for
sample 100TW, revealing fibre failure is faster in the bundles as compared to sample 200TW.
The amplitude scatter distribution with load-extension for sample 100TW and 200TW are
presented in figure 7.13e a-b. For both samples, they have a similar amplitude scatter
distribution trend, and amplitude increments can be observed for each drop in the applied loads.
However, much more scatter with amplitude lower than 70dB is observed for sample 200TW
as compared to sample 100TW at their catastrophic failure points, which are about
2.9mm and 1.8mm parametric extensions respectively. As a result fibre fracture with greater
energy releasing at final failure point could be expected for sample 100TW.
122
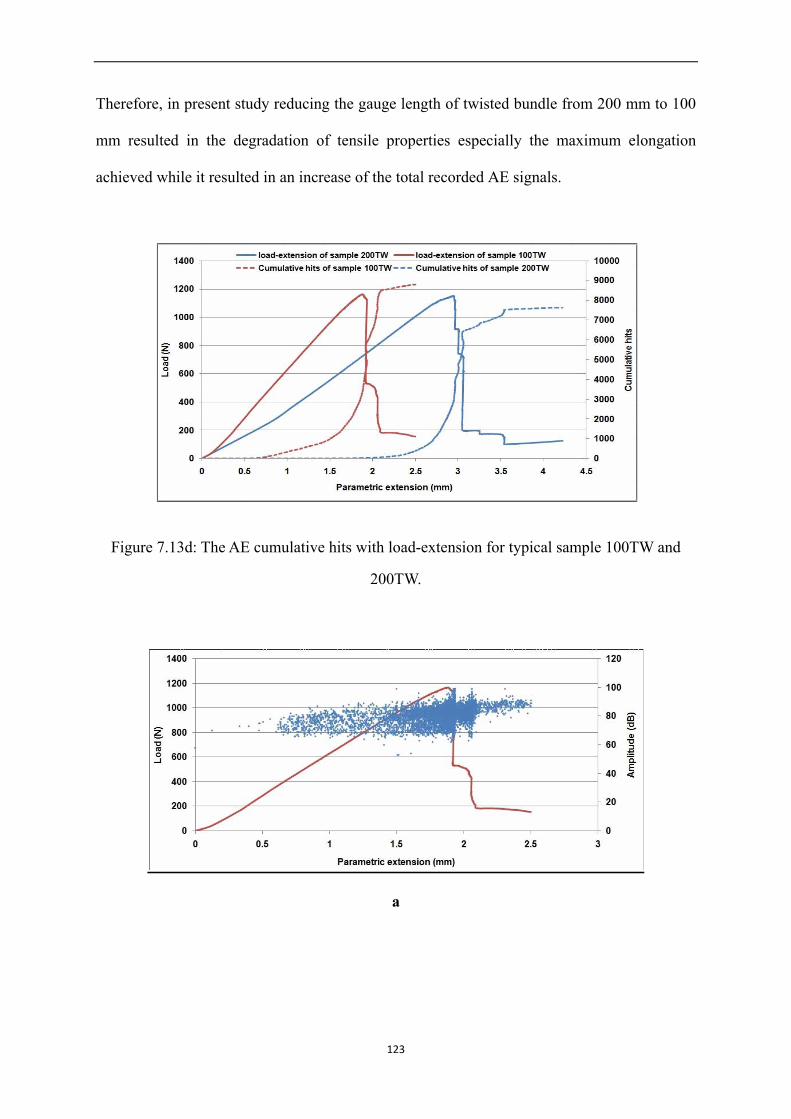
Therefore, in present study reducing the gauge length of twisted bundle from 200 mm to 100
mm resulted in the degradation of tensile properties especially the maximum elongation
achieved while it resulted in an increase of the total recorded AE signals.
Figure 7.13d: The AE cumulative hits with load-extension for typical sample 100TW and
200TW.
a
123
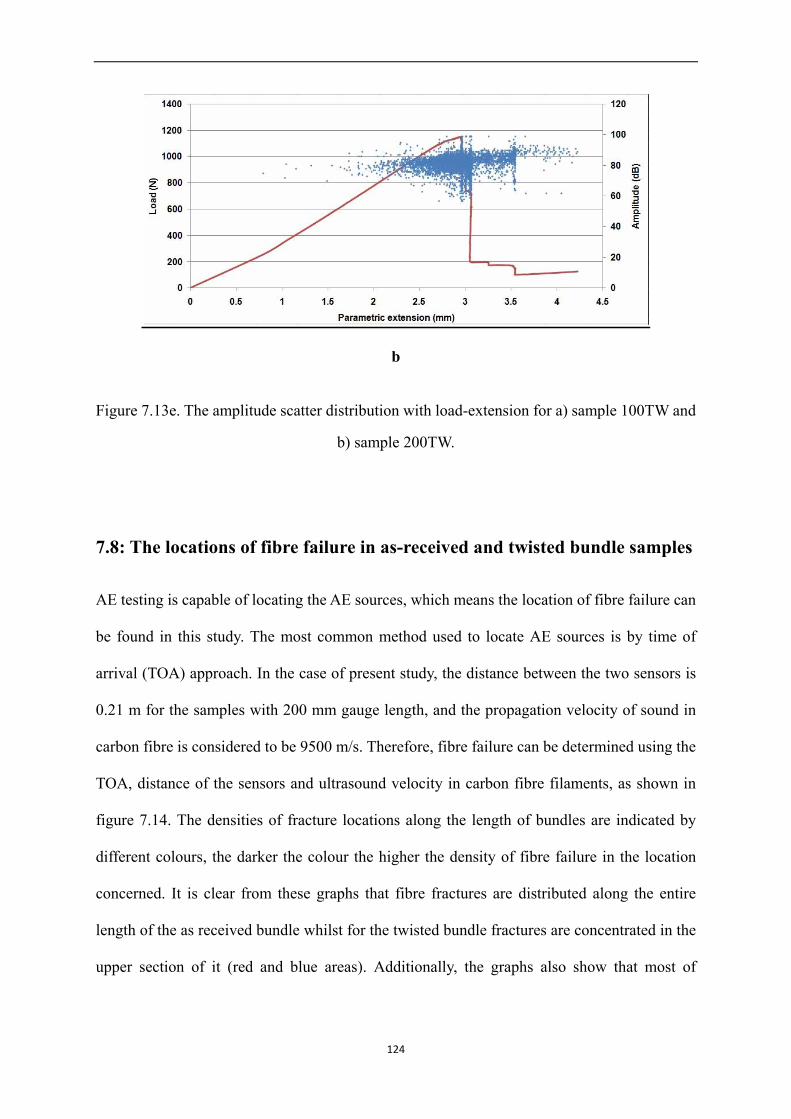
b
Figure 7.13e. The amplitude scatter distribution with load-extension for a) sample 100TW and
b) sample 200TW.
7.8: The locations of fibre failure in as-received and twisted bundle samples
AE testing is capable of locating the AE sources, which means the location of fibre failure can
be found in this study. The most common method used to locate AE sources is by time of
arrival (TOA) approach. In the case of present study, the distance between the two sensors is
0.21 m for the samples with 200 mm gauge length, and the propagation velocity of sound in
carbon fibre is considered to be 9500 m/s. Therefore, fibre failure can be determined using the
TOA, distance of the sensors and ultrasound velocity in carbon fibre filaments, as shown in
figure 7.14. The densities of fracture locations along the length of bundles are indicated by
different colours, the darker the colour the higher the density of fibre failure in the location
concerned. It is clear from these graphs that fibre fractures are distributed along the entire
length of the as received bundle whilst for the twisted bundle fractures are concentrated in the
upper section of it (red and blue areas). Additionally, the graphs also show that most of
124
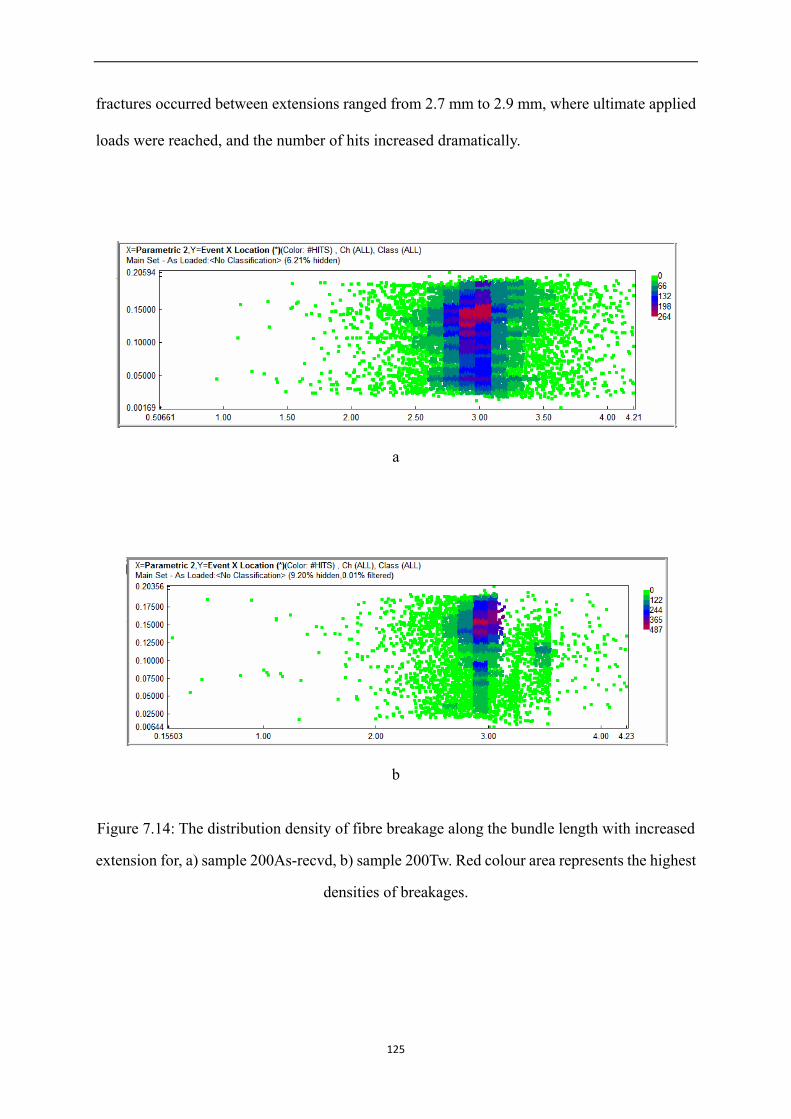
fractures occurred between extensions ranged from 2.7 mm to 2.9 mm, where ultimate applied
loads were reached, and the number of hits increased dramatically.
a
b
Figure 7.14: The distribution density of fibre breakage along the bundle length with increased
extension for, a) sample 200As-recvd, b) sample 200Tw. Red colour area represents the highest
densities of breakages.
125

Therefore, in the first part of this project some fundamental results about carbon bundle
samples can be obtained as follows, a) the raw AE signals recorded by the AE system consist of
signal noise and fibre break related signals, for accurate post-analysis the signal noise can be
filtered out by using energy and count-based filters; b) The efficiency of AE system on
monitoring failure mechanism of fibre bundle is demonstrated by the tensile test of small
carbon bundle sample with AE test; c) Twisted bundle exhibits a superior tensile properties
than as-received one, and the AE system is capable of differentiating the failure behaviour of
these two types of bundles; 4) The benefit of using lower tensile testing rate for AE signal
recording is obvious. 5) Reducing the gauge length of twisted bundle from 200mm to 100mm
resulting in the degradation of tensile properties especially the elongation while the total
recorded AE signals increased; 6) The location of fibre fracture distributed densely in the upper
section of twisted bundle, while for as received bundle its fracture locations spread around the
bundle length, and this is in good agreement with the results from former mechanical testing
and AE testing.
126
CHAPTER 8
Results and Discussion for Carbon Fibre Reinforced
Composites
127
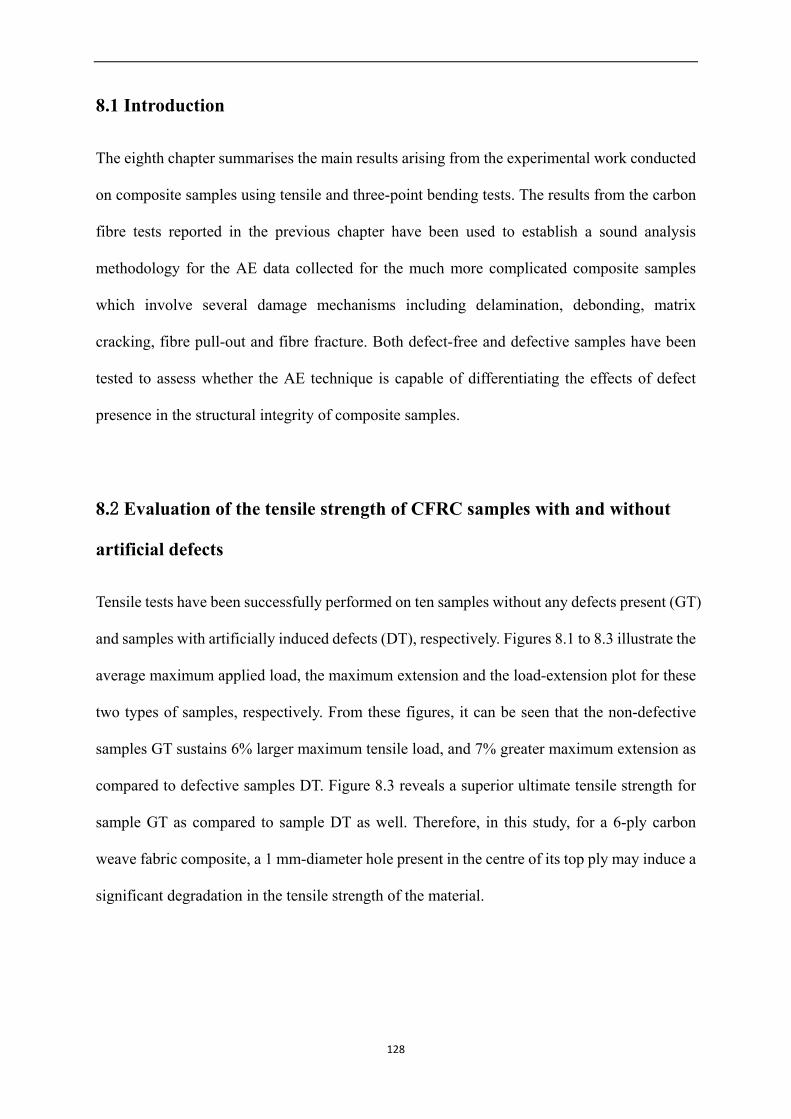
8.1 Introduction
The eighth chapter summarises the main results arising from the experimental work conducted
on composite samples using tensile and three-point bending tests. The results from the carbon
fibre tests reported in the previous chapter have been used to establish a sound analysis
methodology for the AE data collected for the much more complicated composite samples
which involve several damage mechanisms including delamination, debonding, matrix
cracking, fibre pull-out and fibre fracture. Both defect-free and defective samples have been
tested to assess whether the AE technique is capable of differentiating the effects of defect
presence in the structural integrity of composite samples.
8.2 Evaluation of the tensile strength of CFRC samples with and without
artificial defects
Tensile tests have been successfully performed on ten samples without any defects present (GT)
and samples with artificially induced defects (DT), respectively. Figures 8.1 to 8.3 illustrate the
average maximum applied load, the maximum extension and the load-extension plot for these
two types of samples, respectively. From these figures, it can be seen that the non-defective
samples GT sustains 6% larger maximum tensile load, and 7% greater maximum extension as
compared to defective samples DT. Figure 8.3 reveals a superior ultimate tensile strength for
sample GT as compared to sample DT as well. Therefore, in this study, for a 6-ply carbon
weave fabric composite, a 1 mm-diameter hole present in the centre of its top ply may induce a
significant degradation in the tensile strength of the material.
128
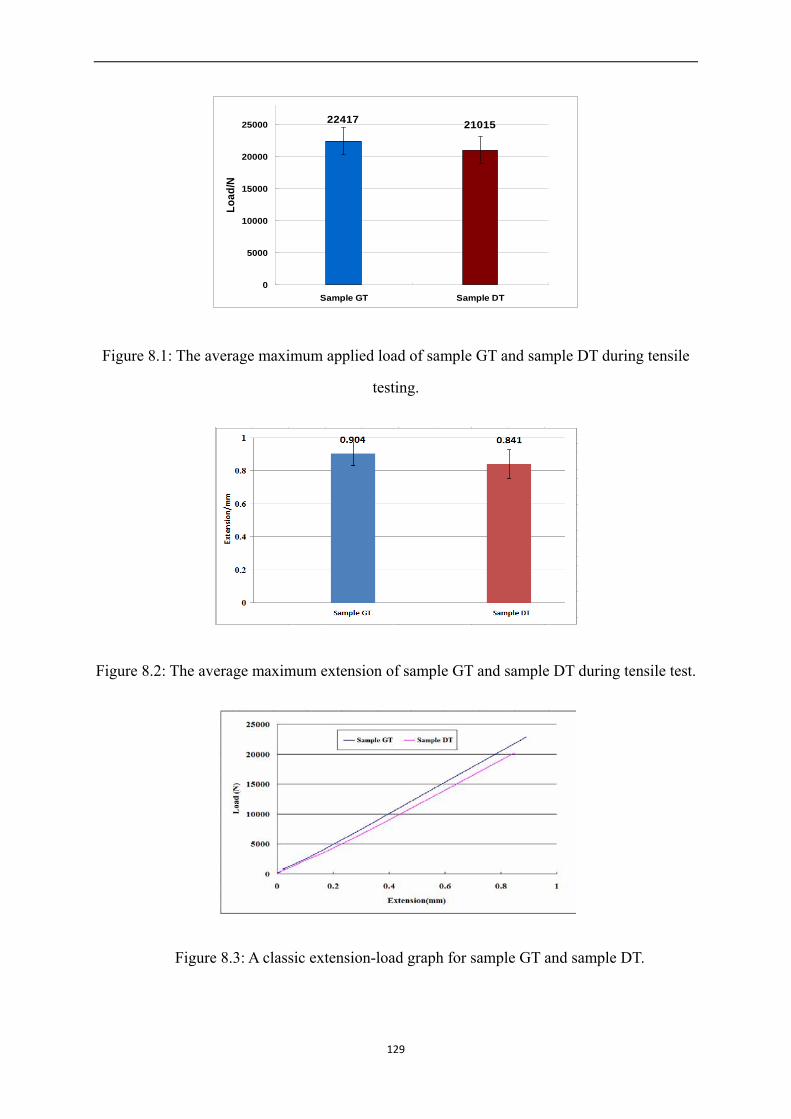
Figure 8.1: The average maximum applied load of sample GT and sample DT during tensile
testing.
Figure 8.2: The average maximum extension of sample GT and sample DT during tensile test.
Figure 8.3: A classic extension-load graph for sample GT and sample DT.
22417 21015
0
5000
10000
15000
20000
25000
Sample GT Sample DT
Load
/N
129
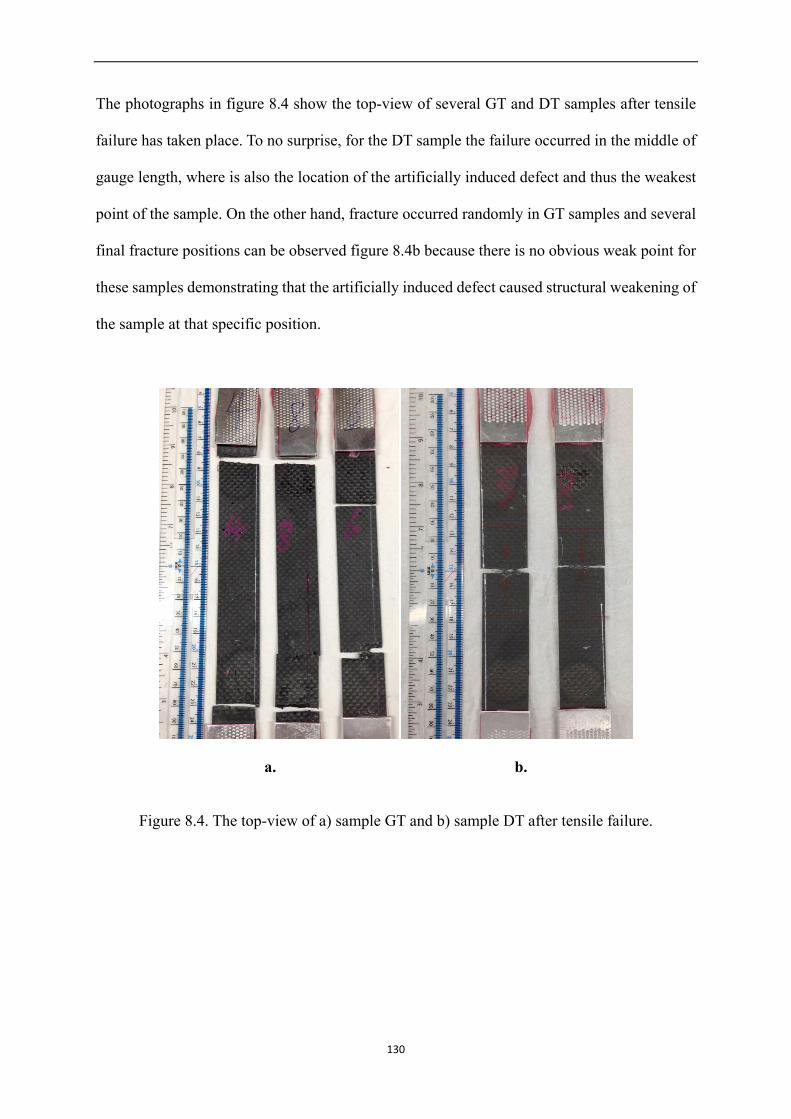
The photographs in figure 8.4 show the top-view of several GT and DT samples after tensile
failure has taken place. To no surprise, for the DT sample the failure occurred in the middle of
gauge length, where is also the location of the artificially induced defect and thus the weakest
point of the sample. On the other hand, fracture occurred randomly in GT samples and several
final fracture positions can be observed figure 8.4b because there is no obvious weak point for
these samples demonstrating that the artificially induced defect caused structural weakening of
the sample at that specific position.
a. b.
Figure 8.4. The top-view of a) sample GT and b) sample DT after tensile failure.
130
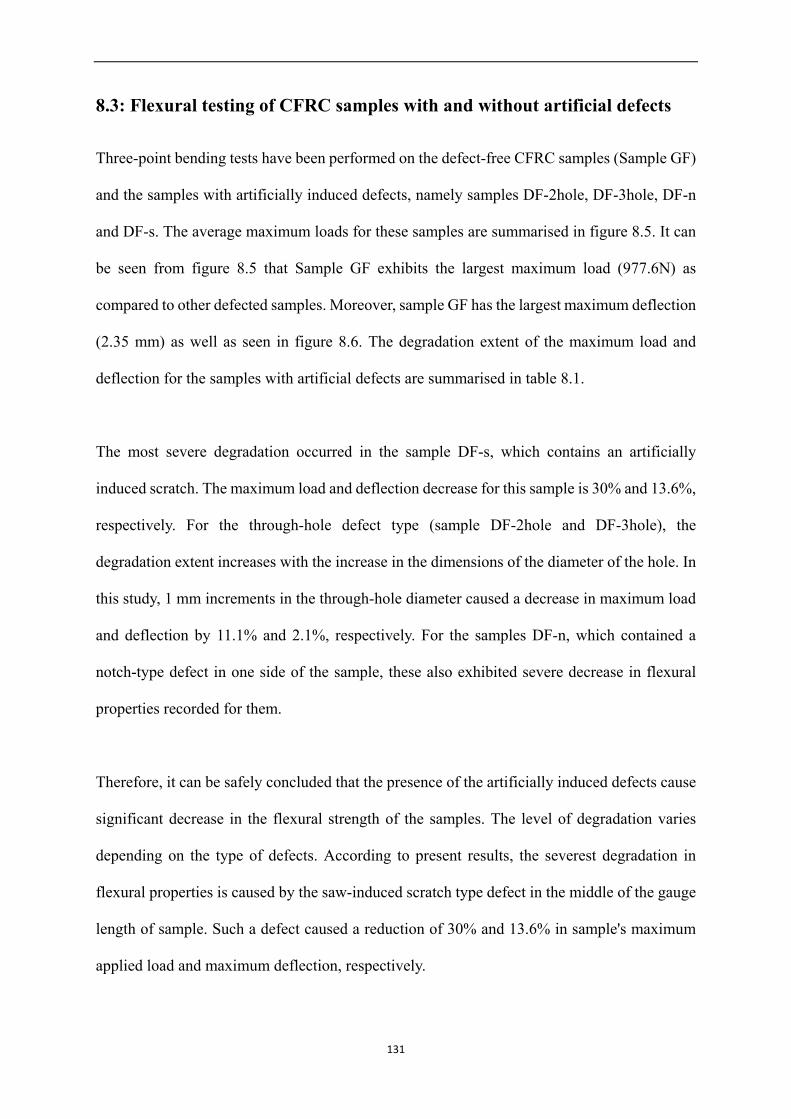
8.3: Flexural testing of CFRC samples with and without artificial defects
Three-point bending tests have been performed on the defect-free CFRC samples (Sample GF)
and the samples with artificially induced defects, namely samples DF-2hole, DF-3hole, DF-n
and DF-s. The average maximum loads for these samples are summarised in figure 8.5. It can
be seen from figure 8.5 that Sample GF exhibits the largest maximum load (977.6N) as
compared to other defected samples. Moreover, sample GF has the largest maximum deflection
(2.35 mm) as well as seen in figure 8.6. The degradation extent of the maximum load and
deflection for the samples with artificial defects are summarised in table 8.1.
The most severe degradation occurred in the sample DF-s, which contains an artificially
induced scratch. The maximum load and deflection decrease for this sample is 30% and 13.6%,
respectively. For the through-hole defect type (sample DF-2hole and DF-3hole), the
degradation extent increases with the increase in the dimensions of the diameter of the hole. In
this study, 1 mm increments in the through-hole diameter caused a decrease in maximum load
and deflection by 11.1% and 2.1%, respectively. For the samples DF-n, which contained a
notch-type defect in one side of the sample, these also exhibited severe decrease in flexural
properties recorded for them.
Therefore, it can be safely concluded that the presence of the artificially induced defects cause
significant decrease in the flexural strength of the samples. The level of degradation varies
depending on the type of defects. According to present results, the severest degradation in
flexural properties is caused by the saw-induced scratch type defect in the middle of the gauge
length of sample. Such a defect caused a reduction of 30% and 13.6% in sample's maximum
applied load and maximum deflection, respectively.
131
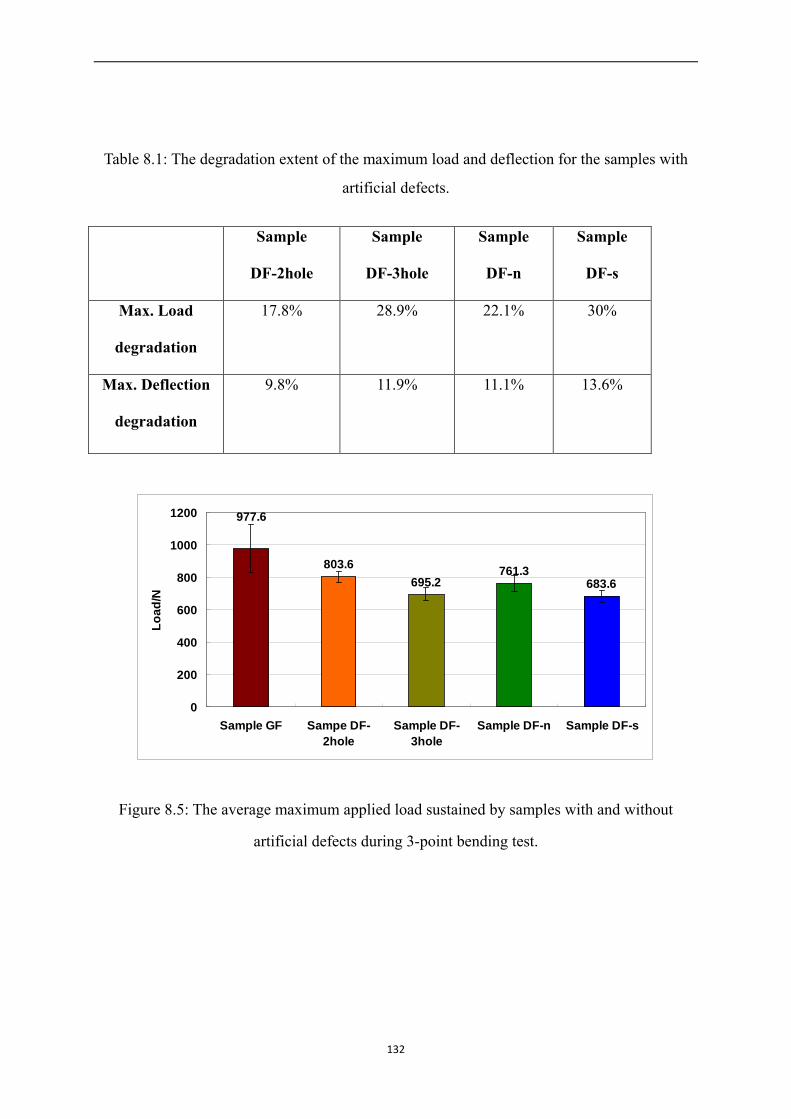
Table 8.1: The degradation extent of the maximum load and deflection for the samples with
artificial defects.
Sample
DF-2hole
Sample
DF-3hole
Sample
DF-n
Sample
DF-s
Max. Load
degradation
17.8% 28.9% 22.1% 30%
Max. Deflection
degradation
9.8% 11.9% 11.1% 13.6%
Figure 8.5: The average maximum applied load sustained by samples with and without
artificial defects during 3-point bending test.
977.6
803.6695.2
761.3683.6
0
200
400
600
800
1000
1200
Sample GF Sampe DF-2hole
Sample DF-3hole
Sample DF-n Sample DF-s
Load
/N
132
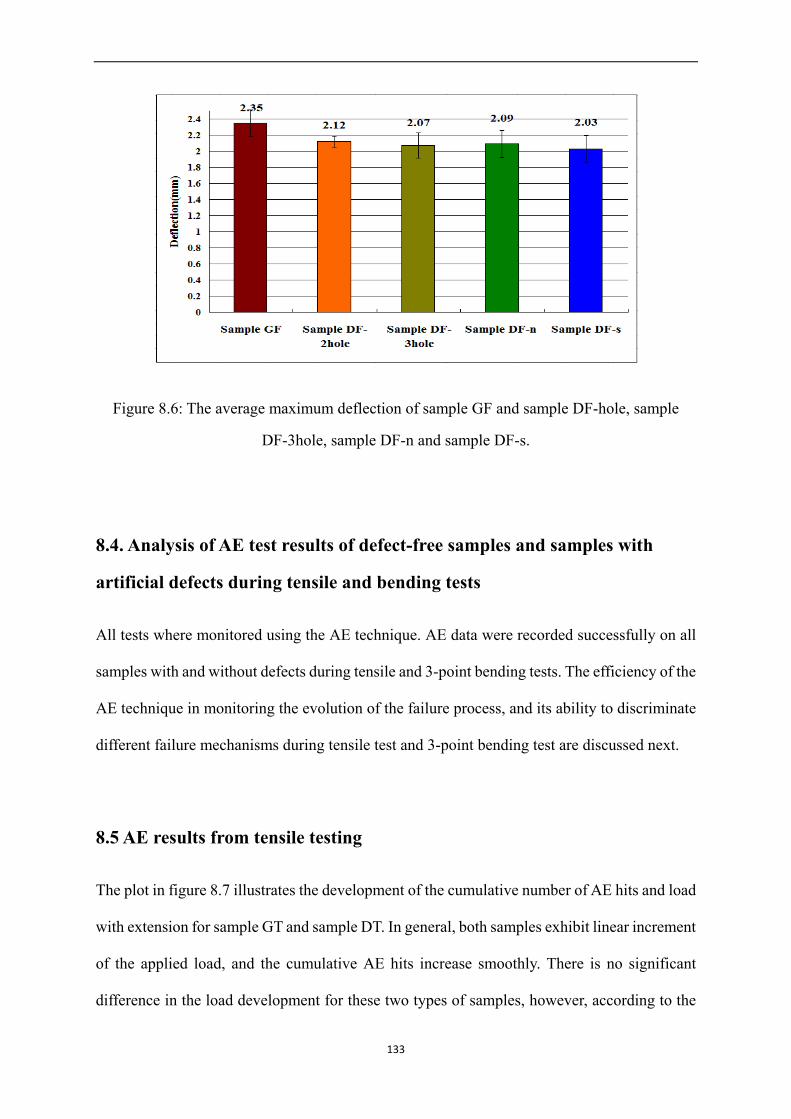
Figure 8.6: The average maximum deflection of sample GF and sample DF-hole, sample
DF-3hole, sample DF-n and sample DF-s.
8.4. Analysis of AE test results of defect-free samples and samples with
artificial defects during tensile and bending tests
All tests where monitored using the AE technique. AE data were recorded successfully on all
samples with and without defects during tensile and 3-point bending tests. The efficiency of the
AE technique in monitoring the evolution of the failure process, and its ability to discriminate
different failure mechanisms during tensile test and 3-point bending test are discussed next.
8.5 AE results from tensile testing
The plot in figure 8.7 illustrates the development of the cumulative number of AE hits and load
with extension for sample GT and sample DT. In general, both samples exhibit linear increment
of the applied load, and the cumulative AE hits increase smoothly. There is no significant
difference in the load development for these two types of samples, however, according to the
133
cumulative number of AE hits, the significant increase in AE activity for sample DT starts
earlier than that of sample GT. The rate of accumulation of AE hits for sample DT is faster than
that of GT. This result indicates that damage evolution clearly begins earlier in sample DT as
compared to sample GT, which is due to the artificial defect present in the sample DT.
Figure 8.7: Load-extension with cumulative hits for sample GT and sample DT.
The graph in figure 8.8 illustrates the evolution of AE cumulative energy and load with
extension for sample GT and sample DT. From this graph, it can be easily observed that the
energy accumulation of sample DT starts at round 0.38 mm extension, which is much earlier
than that of sample GT whose energy accumulation starts at 0.79 mm extension. Again this
result indicates an earlier failure occurred in sample DT as compared to sample GT. In addition,
generally these two kinds of samples exhibit a gradually increased cumulative energy, which
can be classified into 5 phases as present in figure 8.8. Taking sample GT as an example, in
phase 1 AE energy accumulation is silent until 0.79 mm extension has been reached. At this
134
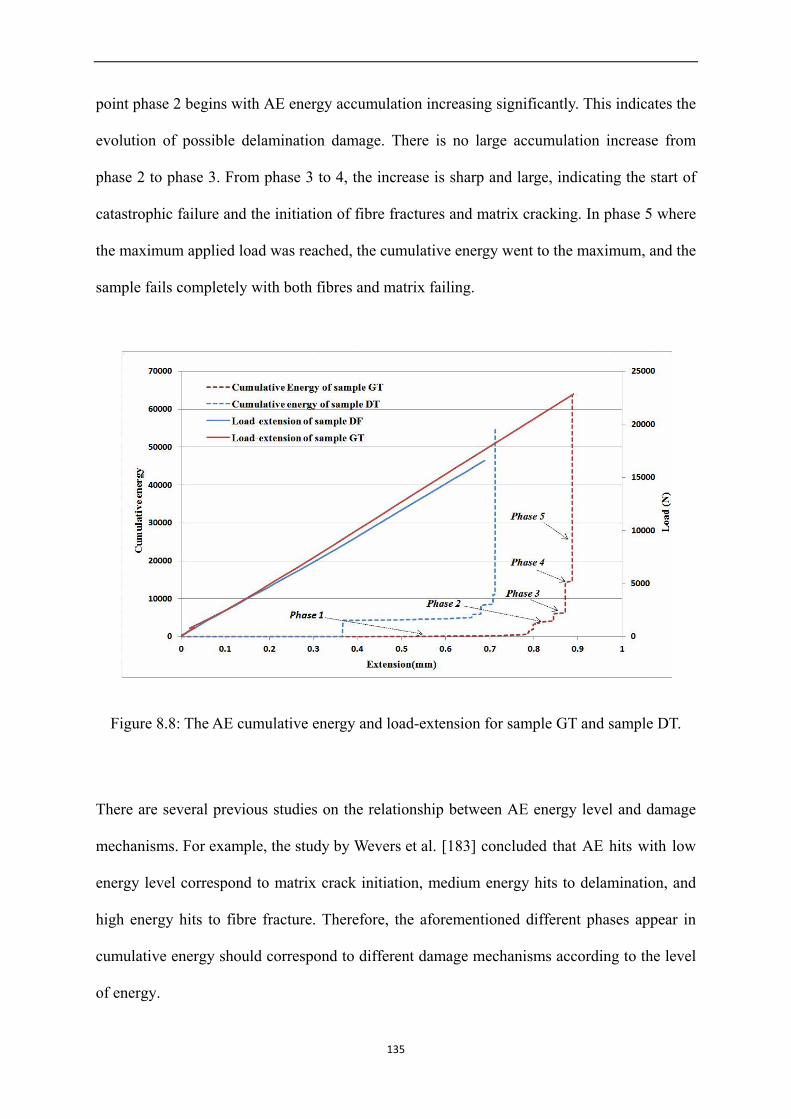
point phase 2 begins with AE energy accumulation increasing significantly. This indicates the
evolution of possible delamination damage. There is no large accumulation increase from
phase 2 to phase 3. From phase 3 to 4, the increase is sharp and large, indicating the start of
catastrophic failure and the initiation of fibre fractures and matrix cracking. In phase 5 where
the maximum applied load was reached, the cumulative energy went to the maximum, and the
sample fails completely with both fibres and matrix failing.
Figure 8.8: The AE cumulative energy and load-extension for sample GT and sample DT.
There are several previous studies on the relationship between AE energy level and damage
mechanisms. For example, the study by Wevers et al. [183] concluded that AE hits with low
energy level correspond to matrix crack initiation, medium energy hits to delamination, and
high energy hits to fibre fracture. Therefore, the aforementioned different phases appear in
cumulative energy should correspond to different damage mechanisms according to the level
of energy.
135
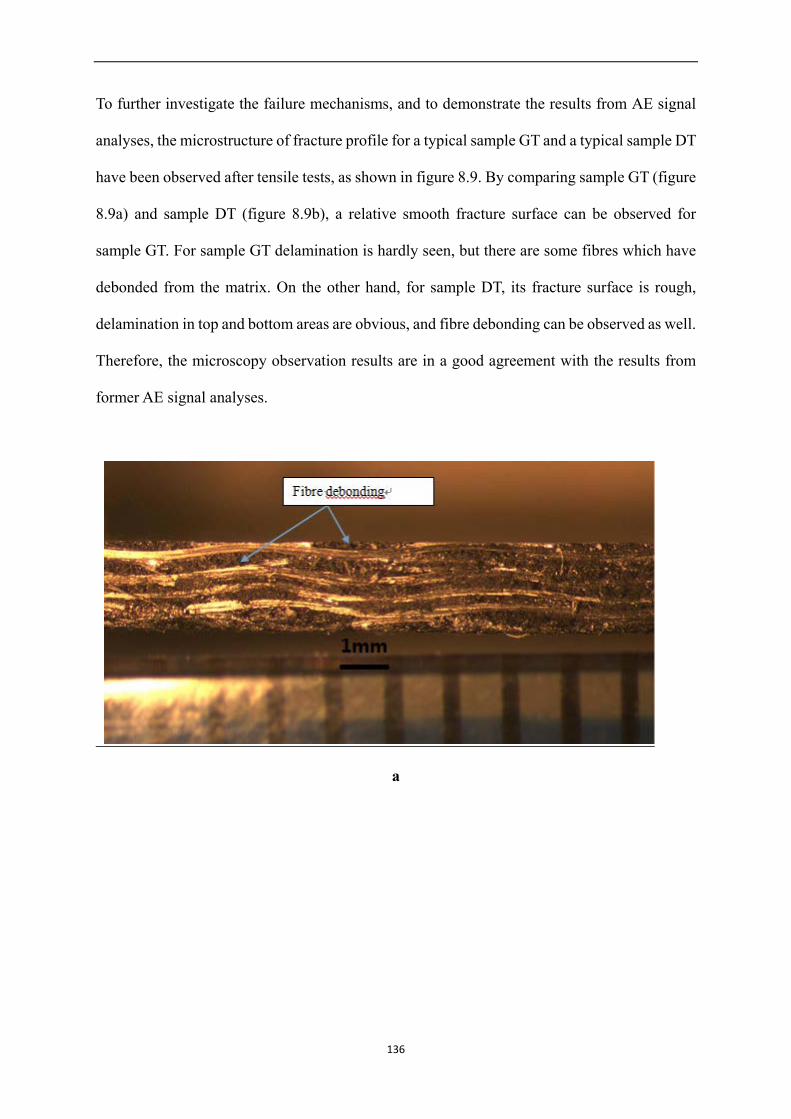
To further investigate the failure mechanisms, and to demonstrate the results from AE signal
analyses, the microstructure of fracture profile for a typical sample GT and a typical sample DT
have been observed after tensile tests, as shown in figure 8.9. By comparing sample GT (figure
8.9a) and sample DT (figure 8.9b), a relative smooth fracture surface can be observed for
sample GT. For sample GT delamination is hardly seen, but there are some fibres which have
debonded from the matrix. On the other hand, for sample DT, its fracture surface is rough,
delamination in top and bottom areas are obvious, and fibre debonding can be observed as well.
Therefore, the microscopy observation results are in a good agreement with the results from
former AE signal analyses.
a
136
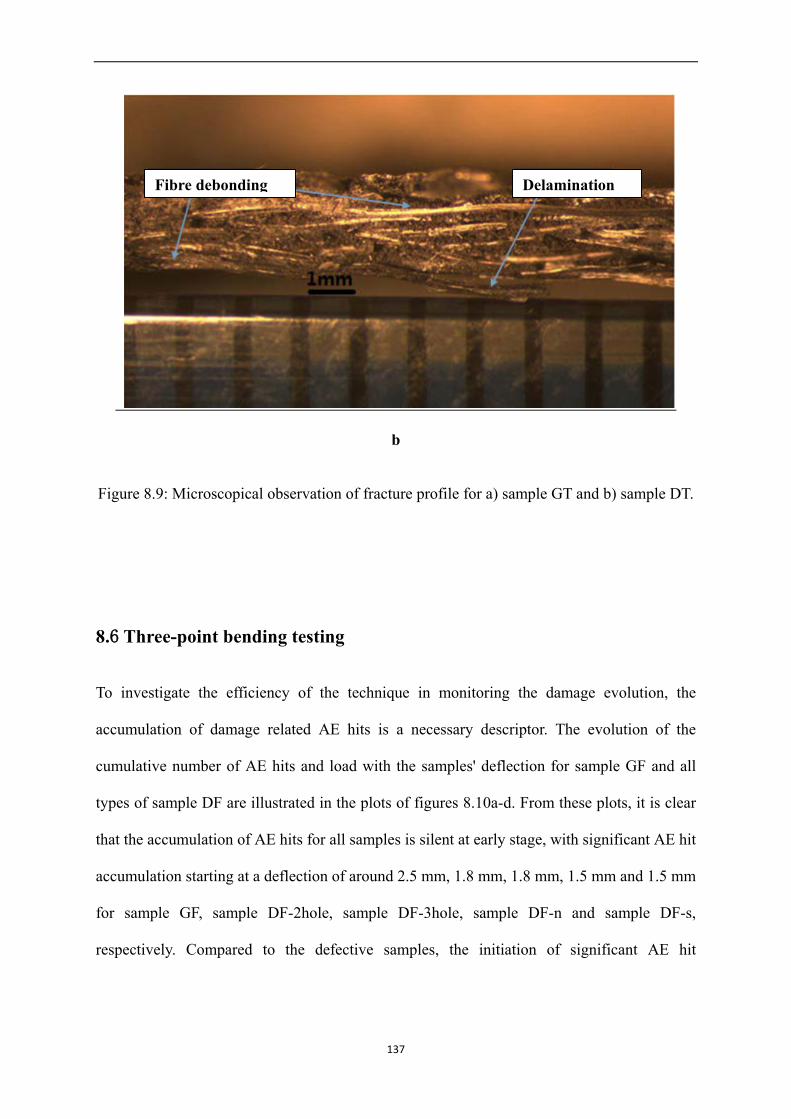
b
Figure 8.9: Microscopical observation of fracture profile for a) sample GT and b) sample DT.
8.6 Three-point bending testing
To investigate the efficiency of the technique in monitoring the damage evolution, the
accumulation of damage related AE hits is a necessary descriptor. The evolution of the
cumulative number of AE hits and load with the samples' deflection for sample GF and all
types of sample DF are illustrated in the plots of figures 8.10a-d. From these plots, it is clear
that the accumulation of AE hits for all samples is silent at early stage, with significant AE hit
accumulation starting at a deflection of around 2.5 mm, 1.8 mm, 1.8 mm, 1.5 mm and 1.5 mm
for sample GF, sample DF-2hole, sample DF-3hole, sample DF-n and sample DF-s,
respectively. Compared to the defective samples, the initiation of significant AE hit
Fibre debonding Delamination
137
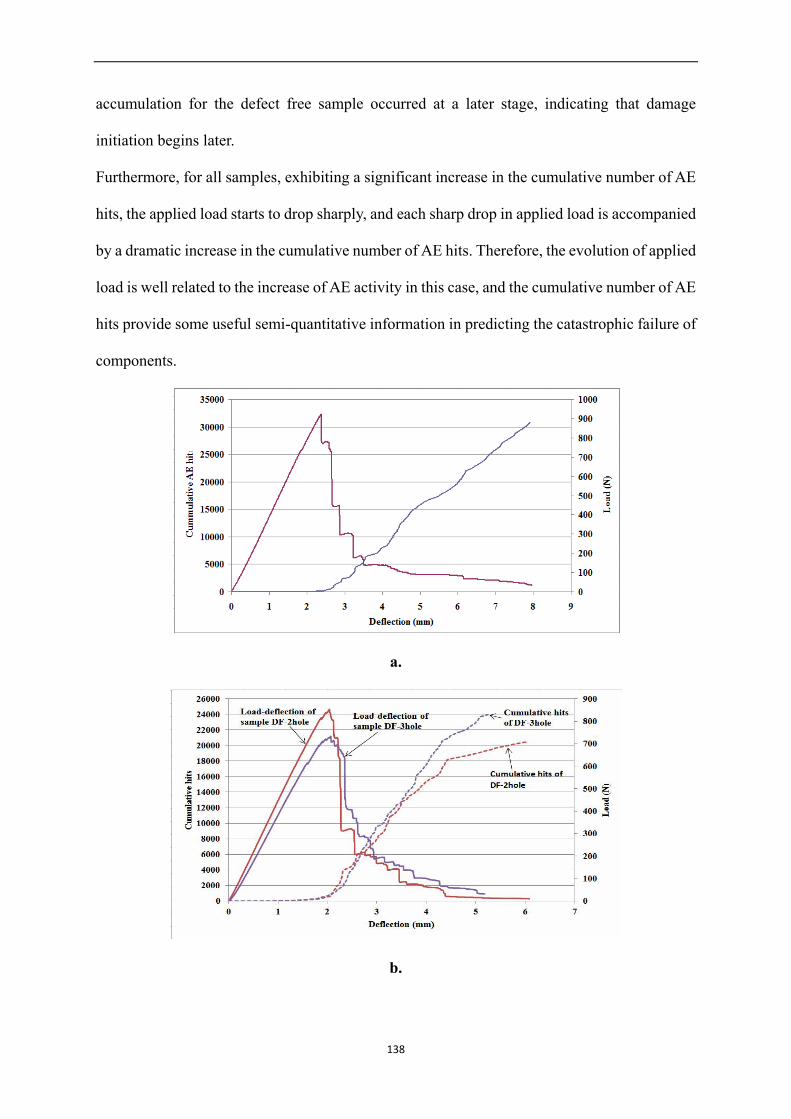
accumulation for the defect free sample occurred at a later stage, indicating that damage
initiation begins later.
Furthermore, for all samples, exhibiting a significant increase in the cumulative number of AE
hits, the applied load starts to drop sharply, and each sharp drop in applied load is accompanied
by a dramatic increase in the cumulative number of AE hits. Therefore, the evolution of applied
load is well related to the increase of AE activity in this case, and the cumulative number of AE
hits provide some useful semi-quantitative information in predicting the catastrophic failure of
components.
a.
b.
138
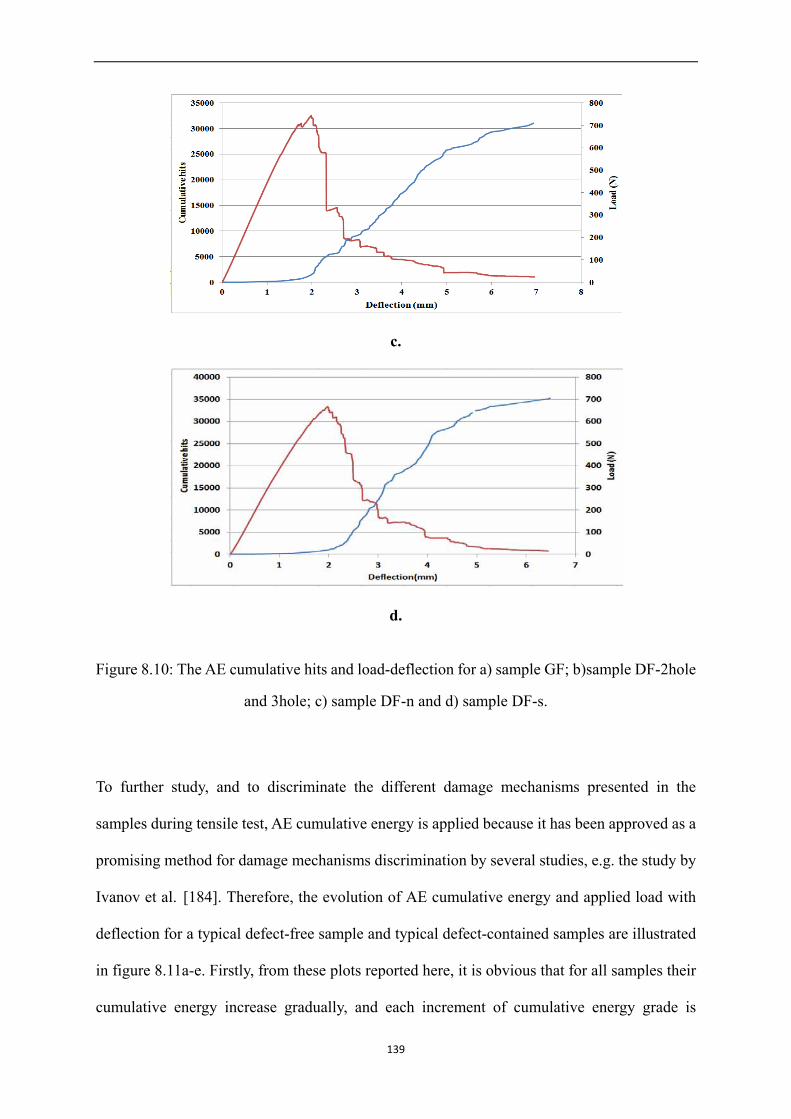
c.
d.
Figure 8.10: The AE cumulative hits and load-deflection for a) sample GF; b)sample DF-2hole
and 3hole; c) sample DF-n and d) sample DF-s.
To further study, and to discriminate the different damage mechanisms presented in the
samples during tensile test, AE cumulative energy is applied because it has been approved as a
promising method for damage mechanisms discrimination by several studies, e.g. the study by
Ivanov et al. [184]. Therefore, the evolution of AE cumulative energy and applied load with
deflection for a typical defect-free sample and typical defect-contained samples are illustrated
in figure 8.11a-e. Firstly, from these plots reported here, it is obvious that for all samples their
cumulative energy increase gradually, and each increment of cumulative energy grade is
139
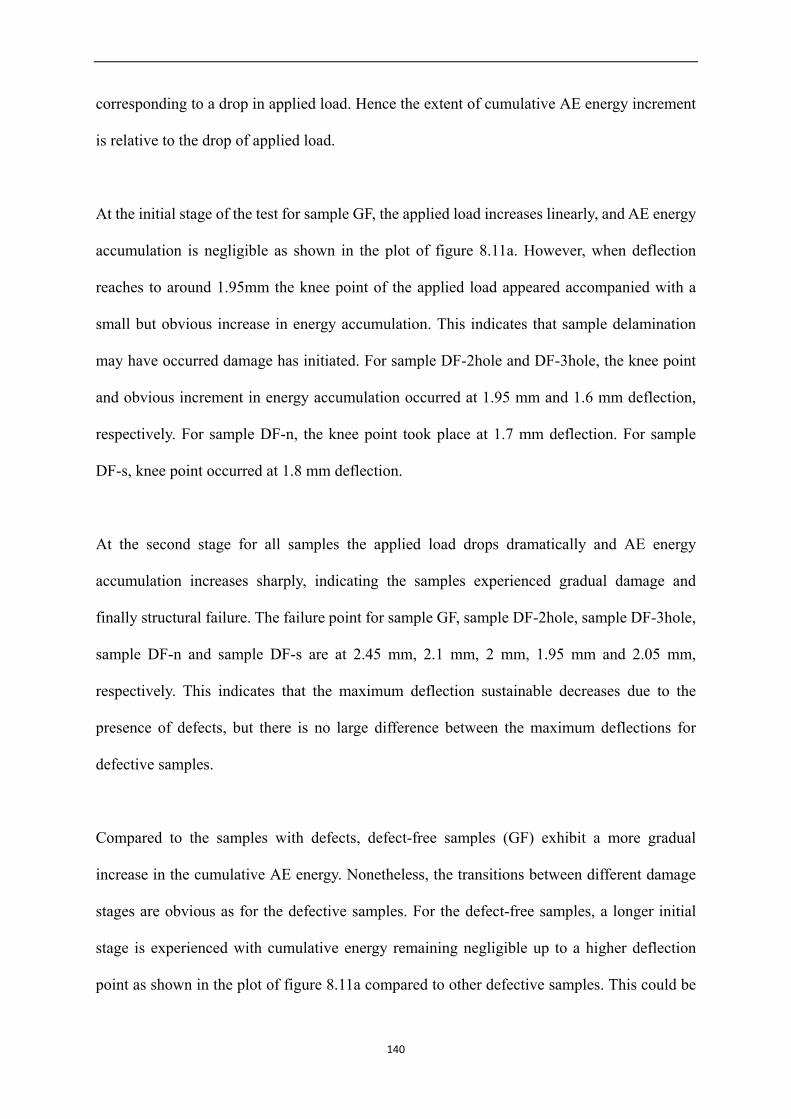
corresponding to a drop in applied load. Hence the extent of cumulative AE energy increment
is relative to the drop of applied load.
At the initial stage of the test for sample GF, the applied load increases linearly, and AE energy
accumulation is negligible as shown in the plot of figure 8.11a. However, when deflection
reaches to around 1.95mm the knee point of the applied load appeared accompanied with a
small but obvious increase in energy accumulation. This indicates that sample delamination
may have occurred damage has initiated. For sample DF-2hole and DF-3hole, the knee point
and obvious increment in energy accumulation occurred at 1.95 mm and 1.6 mm deflection,
respectively. For sample DF-n, the knee point took place at 1.7 mm deflection. For sample
DF-s, knee point occurred at 1.8 mm deflection.
At the second stage for all samples the applied load drops dramatically and AE energy
accumulation increases sharply, indicating the samples experienced gradual damage and
finally structural failure. The failure point for sample GF, sample DF-2hole, sample DF-3hole,
sample DF-n and sample DF-s are at 2.45 mm, 2.1 mm, 2 mm, 1.95 mm and 2.05 mm,
respectively. This indicates that the maximum deflection sustainable decreases due to the
presence of defects, but there is no large difference between the maximum deflections for
defective samples.
Compared to the samples with defects, defect-free samples (GF) exhibit a more gradual
increase in the cumulative AE energy. Nonetheless, the transitions between different damage
stages are obvious as for the defective samples. For the defect-free samples, a longer initial
stage is experienced with cumulative energy remaining negligible up to a higher deflection
point as shown in the plot of figure 8.11a compared to other defective samples. This could be
140
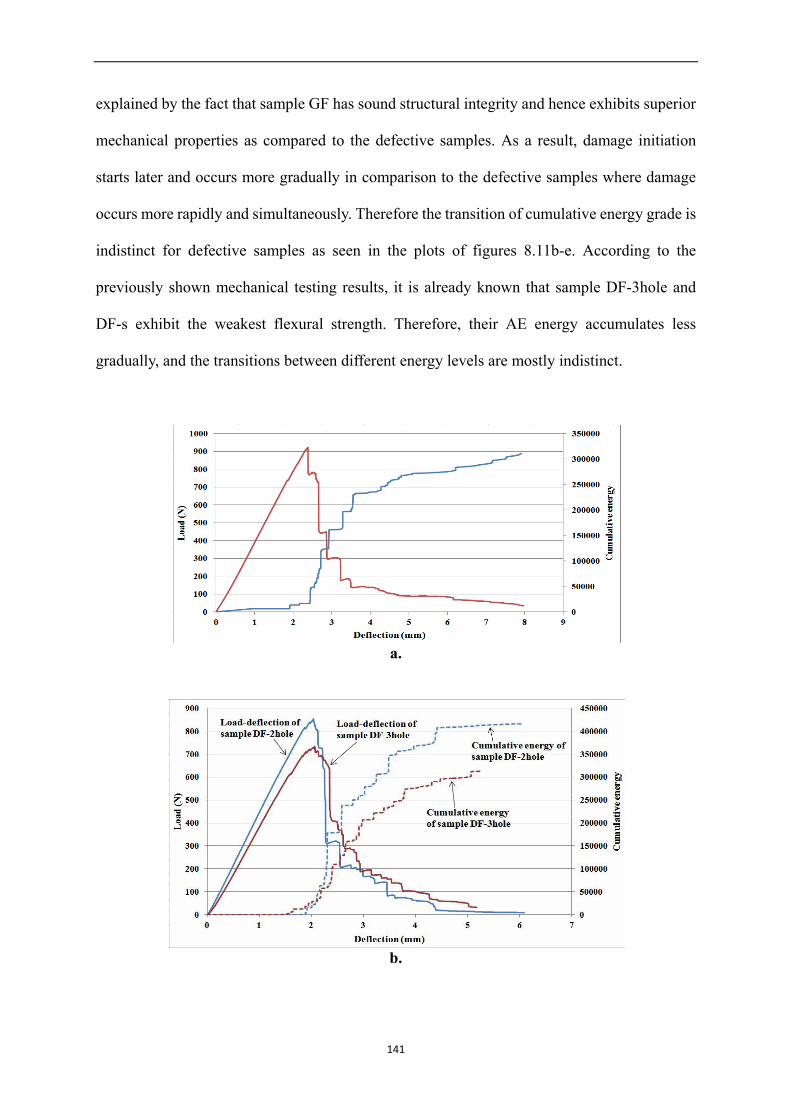
explained by the fact that sample GF has sound structural integrity and hence exhibits superior
mechanical properties as compared to the defective samples. As a result, damage initiation
starts later and occurs more gradually in comparison to the defective samples where damage
occurs more rapidly and simultaneously. Therefore the transition of cumulative energy grade is
indistinct for defective samples as seen in the plots of figures 8.11b-e. According to the
previously shown mechanical testing results, it is already known that sample DF-3hole and
DF-s exhibit the weakest flexural strength. Therefore, their AE energy accumulates less
gradually, and the transitions between different energy levels are mostly indistinct.
a.
b.
141
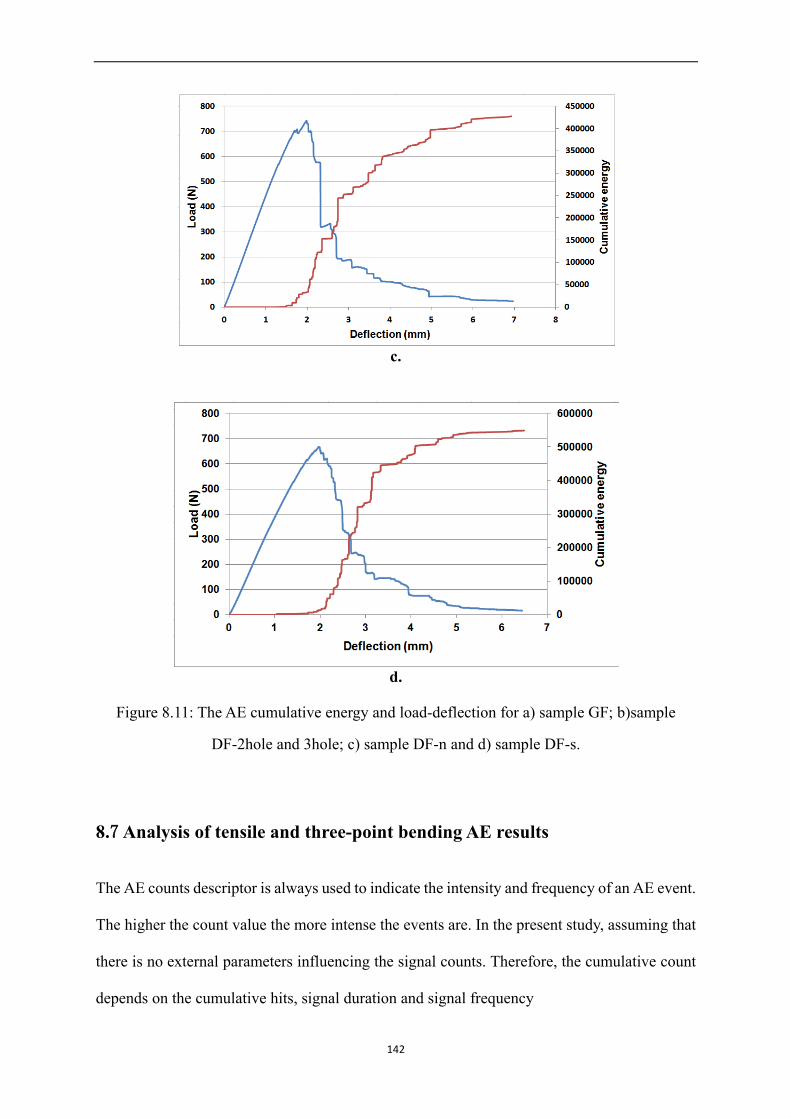
c.
d.
Figure 8.11: The AE cumulative energy and load-deflection for a) sample GF; b)sample
DF-2hole and 3hole; c) sample DF-n and d) sample DF-s.
8.7 Analysis of tensile and three-point bending AE results
The AE counts descriptor is always used to indicate the intensity and frequency of an AE event.
The higher the count value the more intense the events are. In the present study, assuming that
there is no external parameters influencing the signal counts. Therefore, the cumulative count
depends on the cumulative hits, signal duration and signal frequency
142
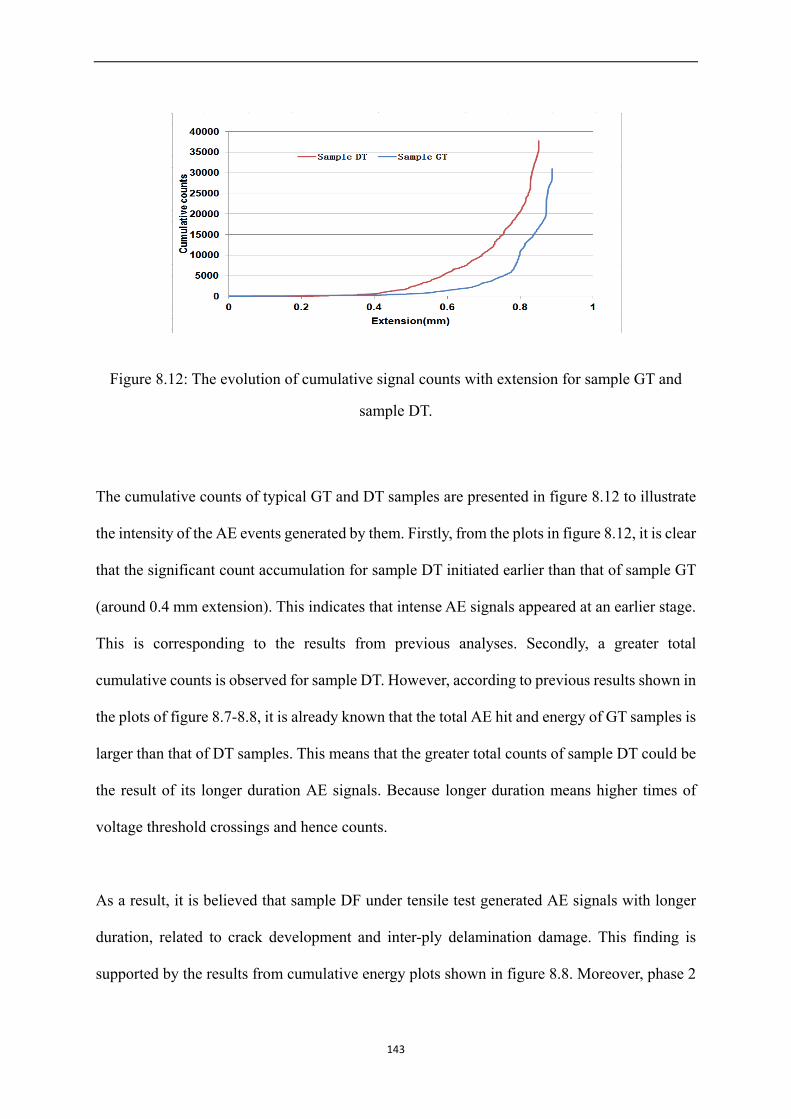
Figure 8.12: The evolution of cumulative signal counts with extension for sample GT and
sample DT.
The cumulative counts of typical GT and DT samples are presented in figure 8.12 to illustrate
the intensity of the AE events generated by them. Firstly, from the plots in figure 8.12, it is clear
that the significant count accumulation for sample DT initiated earlier than that of sample GT
(around 0.4 mm extension). This indicates that intense AE signals appeared at an earlier stage.
This is corresponding to the results from previous analyses. Secondly, a greater total
cumulative counts is observed for sample DT. However, according to previous results shown in
the plots of figure 8.7-8.8, it is already known that the total AE hit and energy of GT samples is
larger than that of DT samples. This means that the greater total counts of sample DT could be
the result of its longer duration AE signals. Because longer duration means higher times of
voltage threshold crossings and hence counts.
As a result, it is believed that sample DF under tensile test generated AE signals with longer
duration, related to crack development and inter-ply delamination damage. This finding is
supported by the results from cumulative energy plots shown in figure 8.8. Moreover, phase 2
143
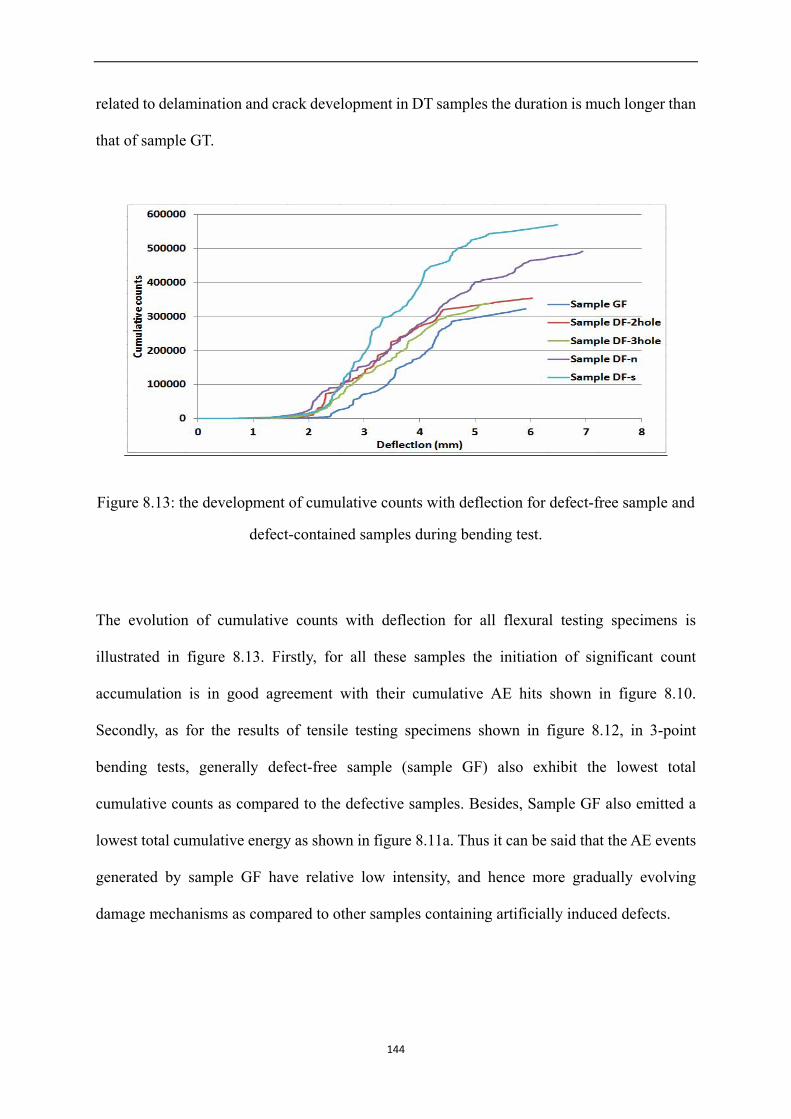
related to delamination and crack development in DT samples the duration is much longer than
that of sample GT.
Figure 8.13: the development of cumulative counts with deflection for defect-free sample and
defect-contained samples during bending test.
The evolution of cumulative counts with deflection for all flexural testing specimens is
illustrated in figure 8.13. Firstly, for all these samples the initiation of significant count
accumulation is in good agreement with their cumulative AE hits shown in figure 8.10.
Secondly, as for the results of tensile testing specimens shown in figure 8.12, in 3-point
bending tests, generally defect-free sample (sample GF) also exhibit the lowest total
cumulative counts as compared to the defective samples. Besides, Sample GF also emitted a
lowest total cumulative energy as shown in figure 8.11a. Thus it can be said that the AE events
generated by sample GF have relative low intensity, and hence more gradually evolving
damage mechanisms as compared to other samples containing artificially induced defects.
144
For the samples with through-hole defects (sample DF-2hole and DF-3hole), these exhibit
similar evolution trend as sample GF. Sample DF-2hole has a only slightly higher total counts
as compared to sample GF. Therefore, this might reveal similar damage evolution mechanisms
between sample GF and sample DF-2hole. Comparison between sample DF-2hole and
DF-3hole indicates a greater and faster count accumulation for sample DF-3hole
demonstrating faster damage evolution in DF-3hole.
Sample DF-n also exhibits a larger and faster count accumulation compared with sample GF.
Moreover, from previous results of cumulative hits and cumulative energy shown in figures
8.10 and 8.11), it can be seen that these two samples have similar cumulative hits (around
30,000), while much higher cumulative energy is seen for sample DF-n (about 120,000
(10μvolt-sec/count) higher). In this case, the larger cumulative count of sample DF-n might be
related to the higher cumulative energy which is related to signal amplitude and duration.
Therefore, the damage evolution occurring in sample DF-n during flexural test is more intense.
The largest difference in count accumulation is observed between sample DF-s and sample GF,
which is approximately 270,000. According to previous results shown in figure 8.10 and 8.11,
the difference between their cumulative hits is 5000, and the cumulative energy difference is
190,000 (10μvolt-sec/count), which is quite large. In this case, the cumulative energy
difference dominates the large difference in count accumulation between these two types of
samples.
Furthermore, the development trend of cumulative count for sample DF-s quite differs from
sample GF's, as it increases more steeply. Hence, the combination of these two results reveals
145
that failure in sample DF-s could be quicker and more intense in terms of AE activity
generation.
The distribution of amplitude scatter may provide some useful information regarding the
relationship of the AE activity and damage evolution in CFRCs. According to the previous
results for carbon fibre bundle AE tests (figure 7.10 and 7.11), it has already been known that
the most of AE sources emitted are from fibre fractures which may have an amplitude range
between 60-95 dB. Therefore, this might be helpful in identifying the amplitude ranges of AE
signals generated by fibre failure in CFRC samples.
The amplitude scatter distribution with load-extension for typical tensile testing CFRC
specimens is illustrated in the plots of figure 8.14a-b. In general, the distribution trends of
amplitude scatter for these two specimens are closely related to the applied loads. It is evident
that the amplitude level increases with the increase of applied load. Comparison between these
two samples indicates that the majority of hits for sample DT are predominantly concentrated
between 40-60 dB amplitude, while for sample GT, at final stage (0.78mm-0.9mm extension)
there is considerable AE activity in the range of 60-80 dB amplitude.
According to the aforementioned AE results from carbon fibre bundle tensile tests, the AE
signals with amplitude between 60-80 dB should be generated by the fracture of carbon fibres
parallel to loading direction at the final stage. Therefore, sample GT might generate more AE
signals associated with fibre fracture as compared to sample DT. This result could be due to the
artificial hole defect on the top ply of sample DT, which can reduce the number of fibre
filaments breaking and hence reduce fibre fracture related-AE signals.
146
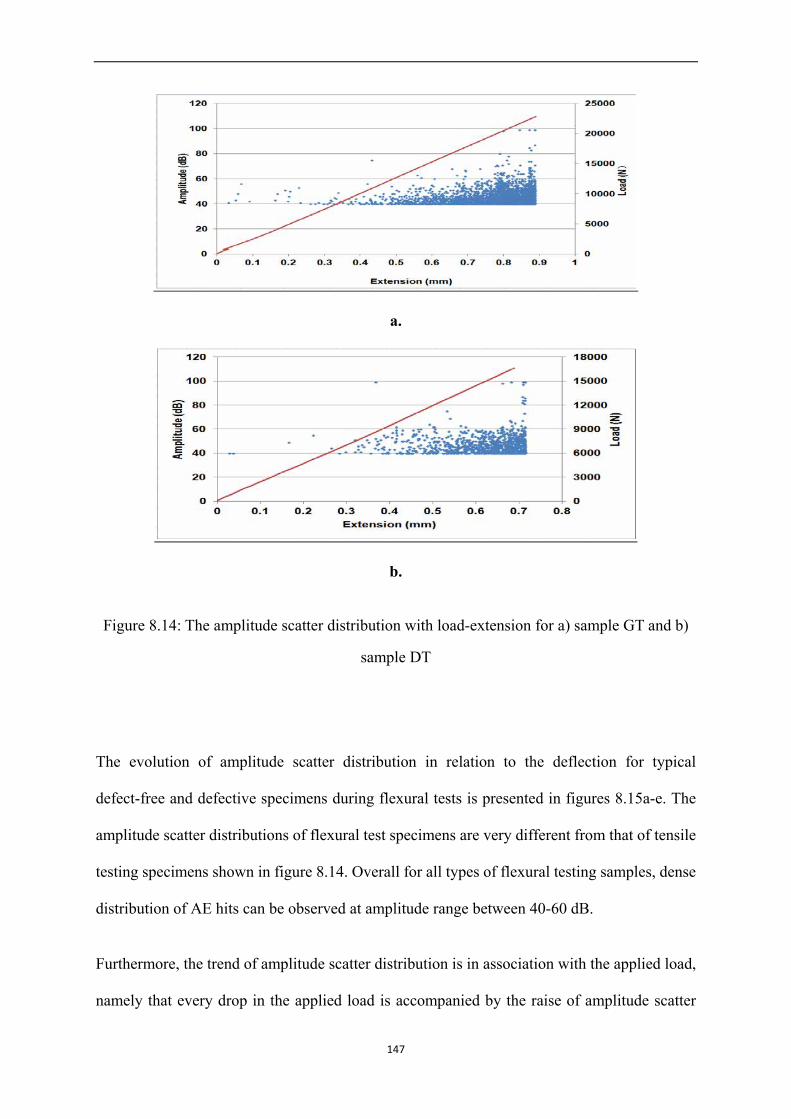
a.
b.
Figure 8.14: The amplitude scatter distribution with load-extension for a) sample GT and b)
sample DT
The evolution of amplitude scatter distribution in relation to the deflection for typical
defect-free and defective specimens during flexural tests is presented in figures 8.15a-e. The
amplitude scatter distributions of flexural test specimens are very different from that of tensile
testing specimens shown in figure 8.14. Overall for all types of flexural testing samples, dense
distribution of AE hits can be observed at amplitude range between 40-60 dB.
Furthermore, the trend of amplitude scatter distribution is in association with the applied load,
namely that every drop in the applied load is accompanied by the raise of amplitude scatter
147
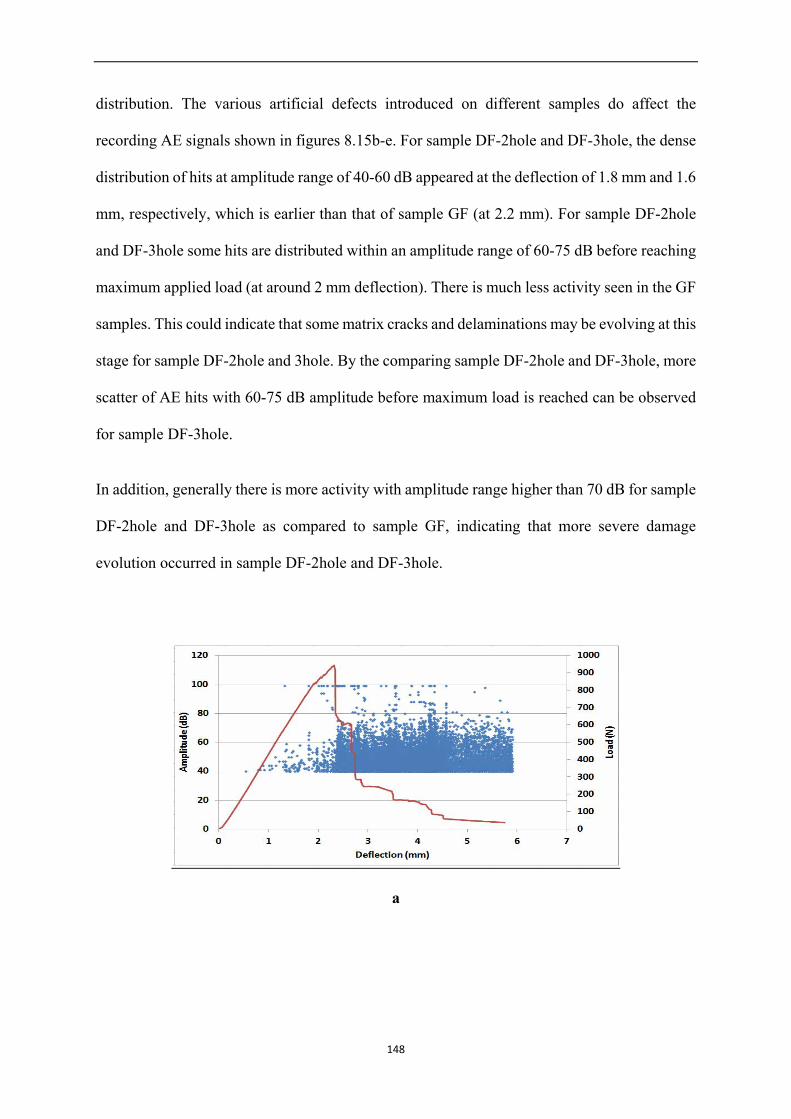
distribution. The various artificial defects introduced on different samples do affect the
recording AE signals shown in figures 8.15b-e. For sample DF-2hole and DF-3hole, the dense
distribution of hits at amplitude range of 40-60 dB appeared at the deflection of 1.8 mm and 1.6
mm, respectively, which is earlier than that of sample GF (at 2.2 mm). For sample DF-2hole
and DF-3hole some hits are distributed within an amplitude range of 60-75 dB before reaching
maximum applied load (at around 2 mm deflection). There is much less activity seen in the GF
samples. This could indicate that some matrix cracks and delaminations may be evolving at this
stage for sample DF-2hole and 3hole. By the comparing sample DF-2hole and DF-3hole, more
scatter of AE hits with 60-75 dB amplitude before maximum load is reached can be observed
for sample DF-3hole.
In addition, generally there is more activity with amplitude range higher than 70 dB for sample
DF-2hole and DF-3hole as compared to sample GF, indicating that more severe damage
evolution occurred in sample DF-2hole and DF-3hole.
a
148
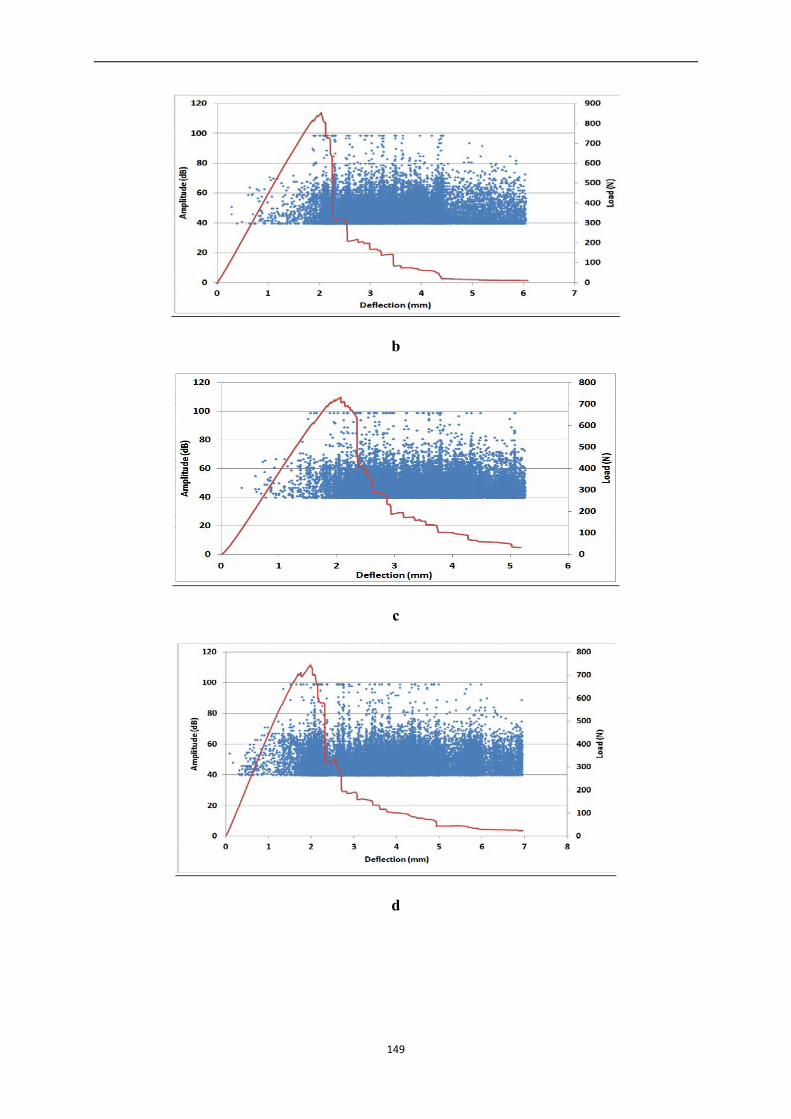
b
c
d
149
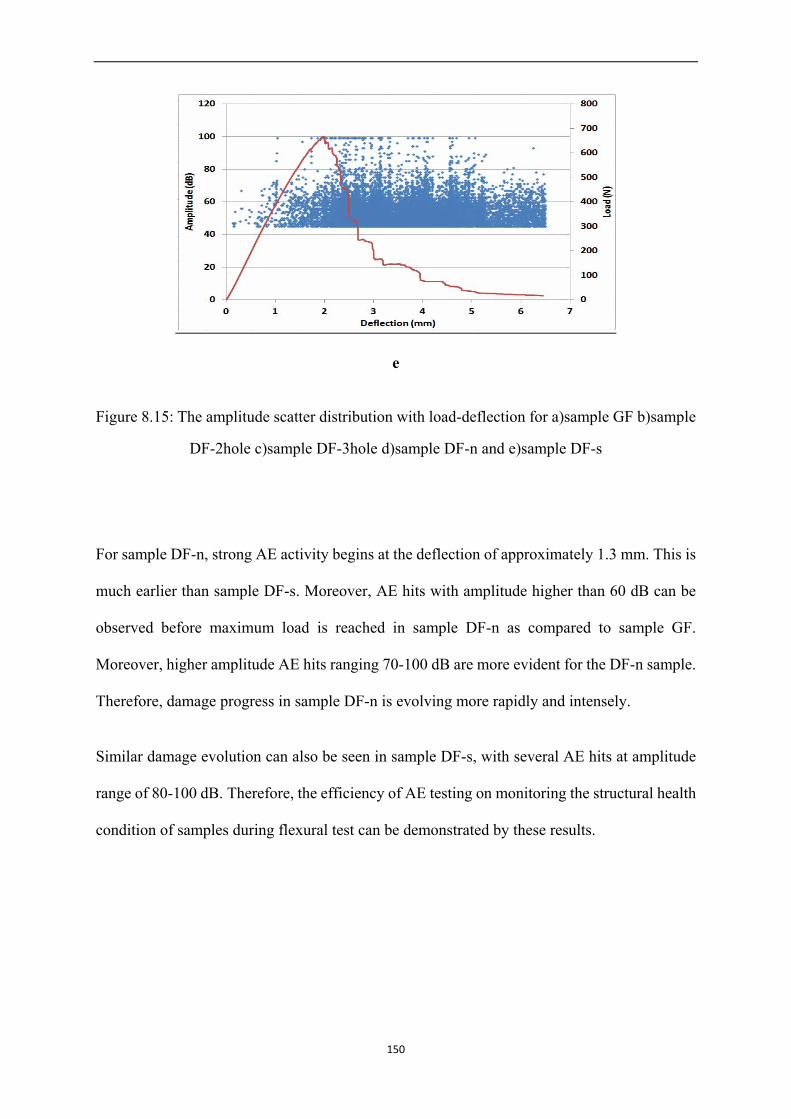
e
Figure 8.15: The amplitude scatter distribution with load-deflection for a)sample GF b)sample
DF-2hole c)sample DF-3hole d)sample DF-n and e)sample DF-s
For sample DF-n, strong AE activity begins at the deflection of approximately 1.3 mm. This is
much earlier than sample DF-s. Moreover, AE hits with amplitude higher than 60 dB can be
observed before maximum load is reached in sample DF-n as compared to sample GF.
Moreover, higher amplitude AE hits ranging 70-100 dB are more evident for the DF-n sample.
Therefore, damage progress in sample DF-n is evolving more rapidly and intensely.
Similar damage evolution can also be seen in sample DF-s, with several AE hits at amplitude
range of 80-100 dB. Therefore, the efficiency of AE testing on monitoring the structural health
condition of samples during flexural test can be demonstrated by these results.
150
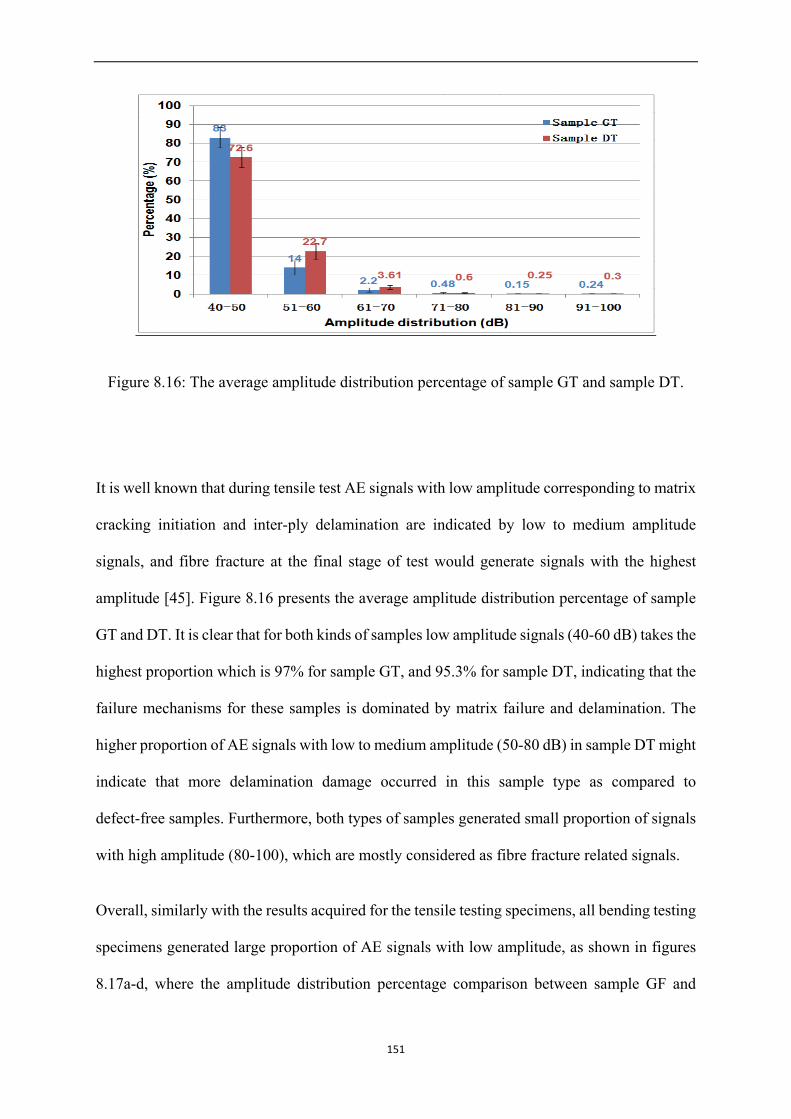
Figure 8.16: The average amplitude distribution percentage of sample GT and sample DT.
It is well known that during tensile test AE signals with low amplitude corresponding to matrix
cracking initiation and inter-ply delamination are indicated by low to medium amplitude
signals, and fibre fracture at the final stage of test would generate signals with the highest
amplitude [45]. Figure 8.16 presents the average amplitude distribution percentage of sample
GT and DT. It is clear that for both kinds of samples low amplitude signals (40-60 dB) takes the
highest proportion which is 97% for sample GT, and 95.3% for sample DT, indicating that the
failure mechanisms for these samples is dominated by matrix failure and delamination. The
higher proportion of AE signals with low to medium amplitude (50-80 dB) in sample DT might
indicate that more delamination damage occurred in this sample type as compared to
defect-free samples. Furthermore, both types of samples generated small proportion of signals
with high amplitude (80-100), which are mostly considered as fibre fracture related signals.
Overall, similarly with the results acquired for the tensile testing specimens, all bending testing
specimens generated large proportion of AE signals with low amplitude, as shown in figures
8.17a-d, where the amplitude distribution percentage comparison between sample GF and
151
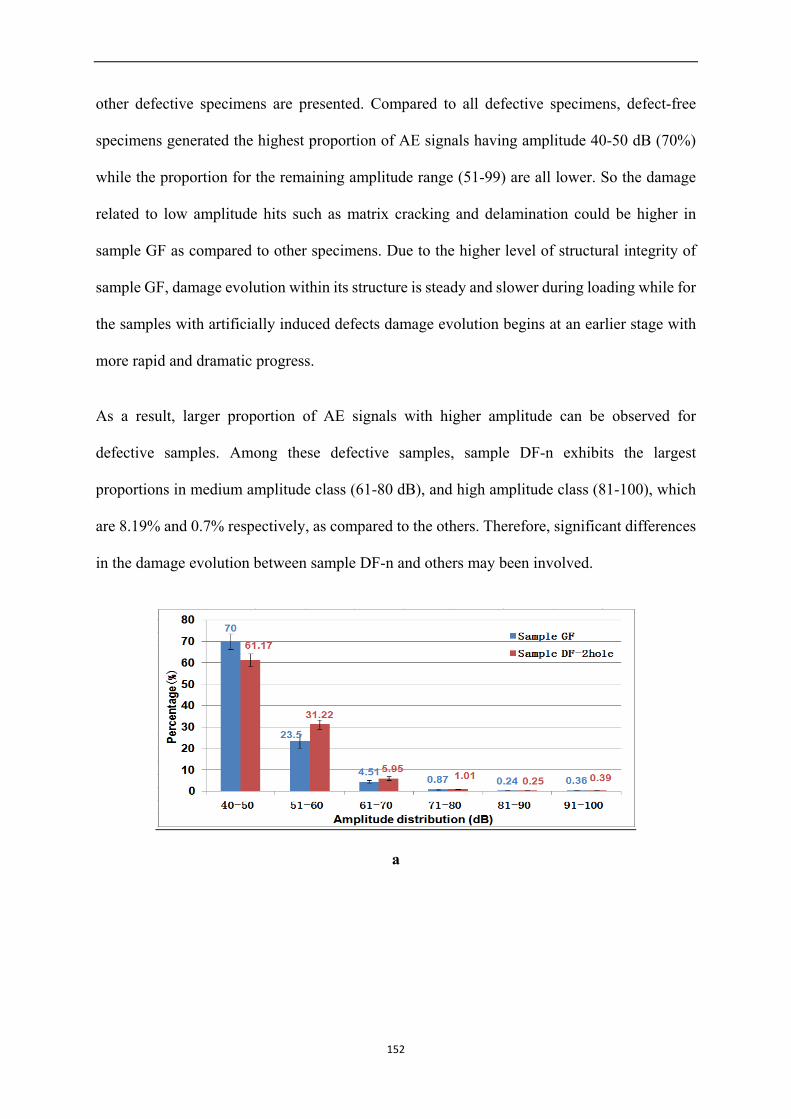
other defective specimens are presented. Compared to all defective specimens, defect-free
specimens generated the highest proportion of AE signals having amplitude 40-50 dB (70%)
while the proportion for the remaining amplitude range (51-99) are all lower. So the damage
related to low amplitude hits such as matrix cracking and delamination could be higher in
sample GF as compared to other specimens. Due to the higher level of structural integrity of
sample GF, damage evolution within its structure is steady and slower during loading while for
the samples with artificially induced defects damage evolution begins at an earlier stage with
more rapid and dramatic progress.
As a result, larger proportion of AE signals with higher amplitude can be observed for
defective samples. Among these defective samples, sample DF-n exhibits the largest
proportions in medium amplitude class (61-80 dB), and high amplitude class (81-100), which
are 8.19% and 0.7% respectively, as compared to the others. Therefore, significant differences
in the damage evolution between sample DF-n and others may been involved.
a
152
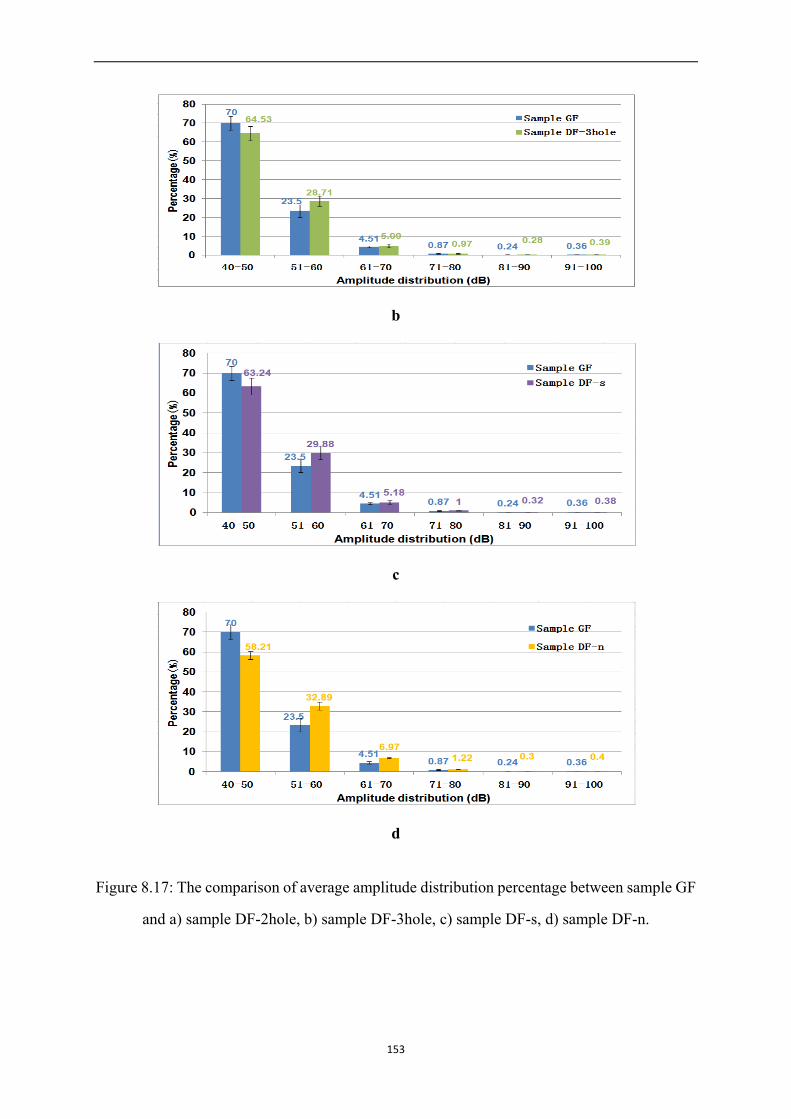
b
c
d
Figure 8.17: The comparison of average amplitude distribution percentage between sample GF
and a) sample DF-2hole, b) sample DF-3hole, c) sample DF-s, d) sample DF-n.
153
In general, the samples with and without artificially induced defects did generate different
amplitude distribution patterns. The amplitude distribution varies according to the defect types.
Therefore, amplitude might be considered as an useful indicator in this study for discriminating
damage mechanisms in different samples. However, for accurate identification of damage
mechanisms, other information such as cumulative energy and AE hits must be taken into
account as well.
To demonstrate the identification of damage mechanisms the fracture profile of samples was
observed using a stereoscope. In the present study, the specimens used for 3-point bending tests
were made of 12-ply laminated plain weave composites. Therefore the damage mechanisms
involved are complex due to their anisotropic inner structures and the fibre cross-over.
According to Ullah [185] for textile composites, damage begins with matrix micro-cracks,
fibre-matrix debonding, fibre failure within ply, and then followed by intra-ply delamination,
finally inter-ply delamination and ultimately fibre fracture.
In bending test, the major damage mechanisms could be matrix cracks, delamination and fibre
fracture. Due to the limitation of the testing method applied in this study, the micrographs of a
step-by-step damage progression are not available, however, the fractured specimens after
3-point bending test were observed using a stereoscope. In figure 8.18a-e, the side-view and
back-view (tensile side) of a typical sample GF and typical samples with defects are presented.
The presence of delamination, fibre debonding and fibre fracture can be clearly observed from
these pictures.
In sample GF (Fig. 8.18a), the presence of delamination, fabric fracture, fibre fracture and
longitudinal crack can be observed. Delamination mainly occurred in the top and bottom plies
of the sample.
154
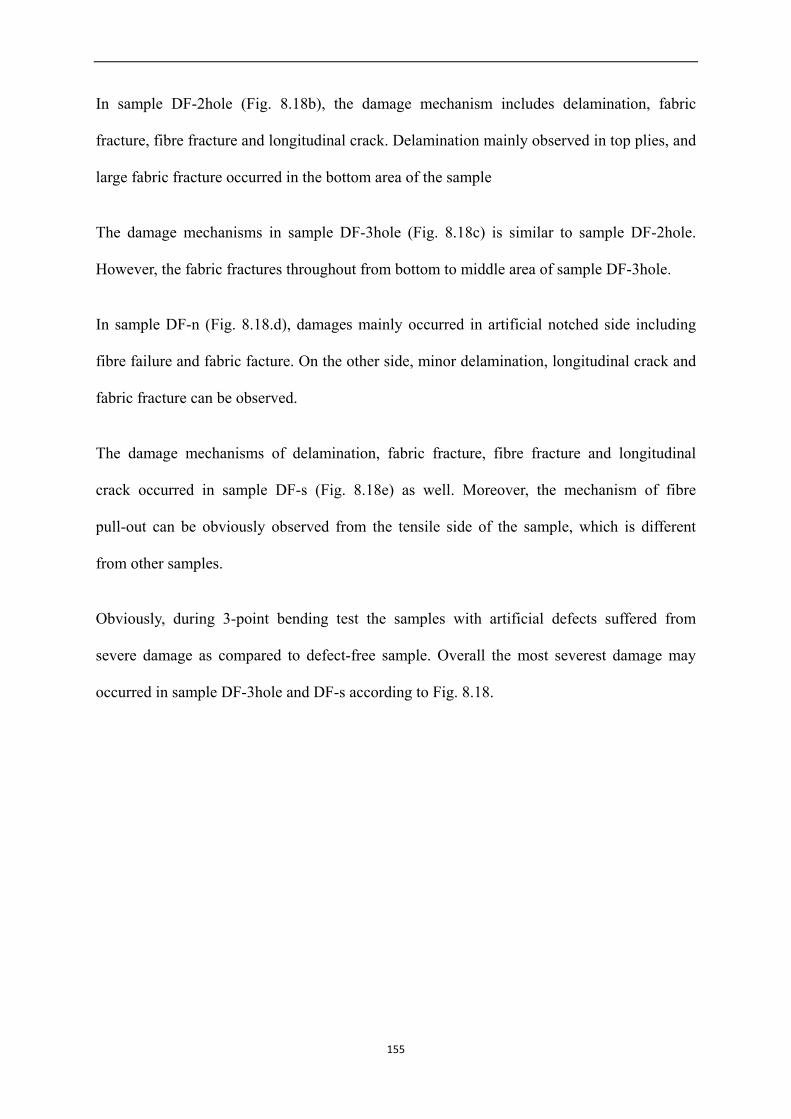
In sample DF-2hole (Fig. 8.18b), the damage mechanism includes delamination, fabric
fracture, fibre fracture and longitudinal crack. Delamination mainly observed in top plies, and
large fabric fracture occurred in the bottom area of the sample
The damage mechanisms in sample DF-3hole (Fig. 8.18c) is similar to sample DF-2hole.
However, the fabric fractures throughout from bottom to middle area of sample DF-3hole.
In sample DF-n (Fig. 8.18.d), damages mainly occurred in artificial notched side including
fibre failure and fabric facture. On the other side, minor delamination, longitudinal crack and
fabric fracture can be observed.
The damage mechanisms of delamination, fabric fracture, fibre fracture and longitudinal
crack occurred in sample DF-s (Fig. 8.18e) as well. Moreover, the mechanism of fibre
pull-out can be obviously observed from the tensile side of the sample, which is different
from other samples.
Obviously, during 3-point bending test the samples with artificial defects suffered from
severe damage as compared to defect-free sample. Overall the most severest damage may
occurred in sample DF-3hole and DF-s according to Fig. 8.18.
155
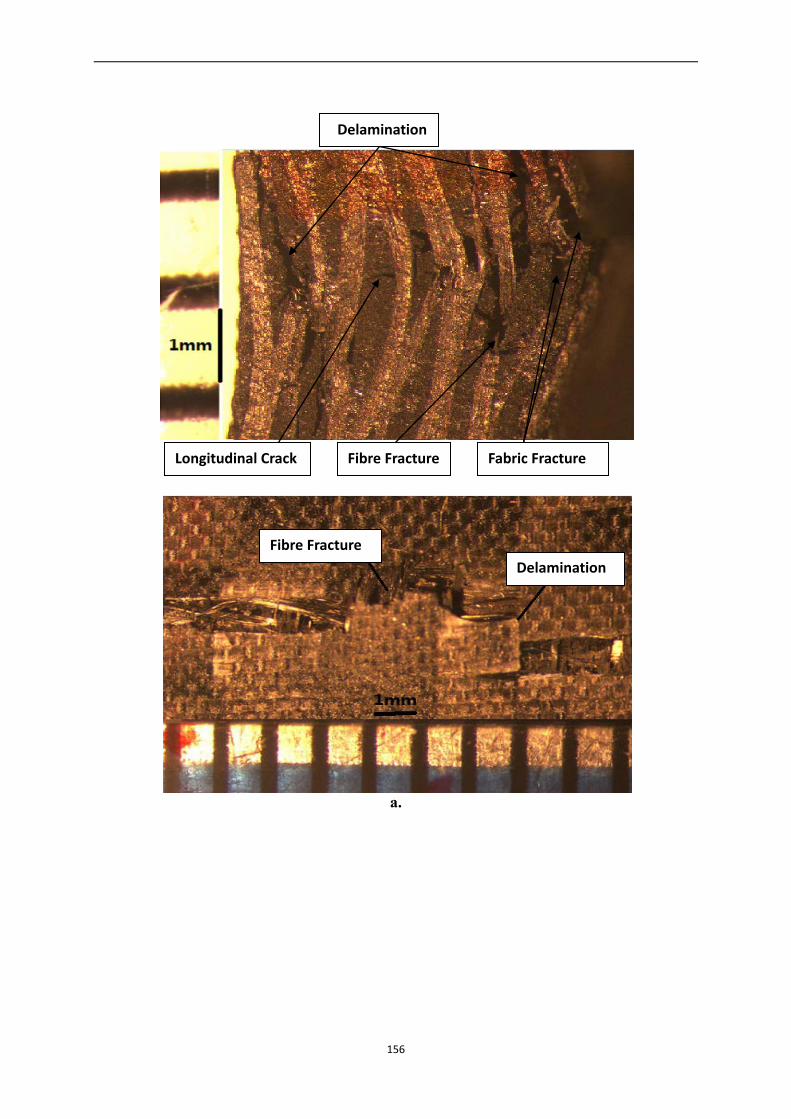
a.
Delamination
Longitudinal Crack Fibre Fracture Fabric Fracture
Fibre Fracture Delamination
156
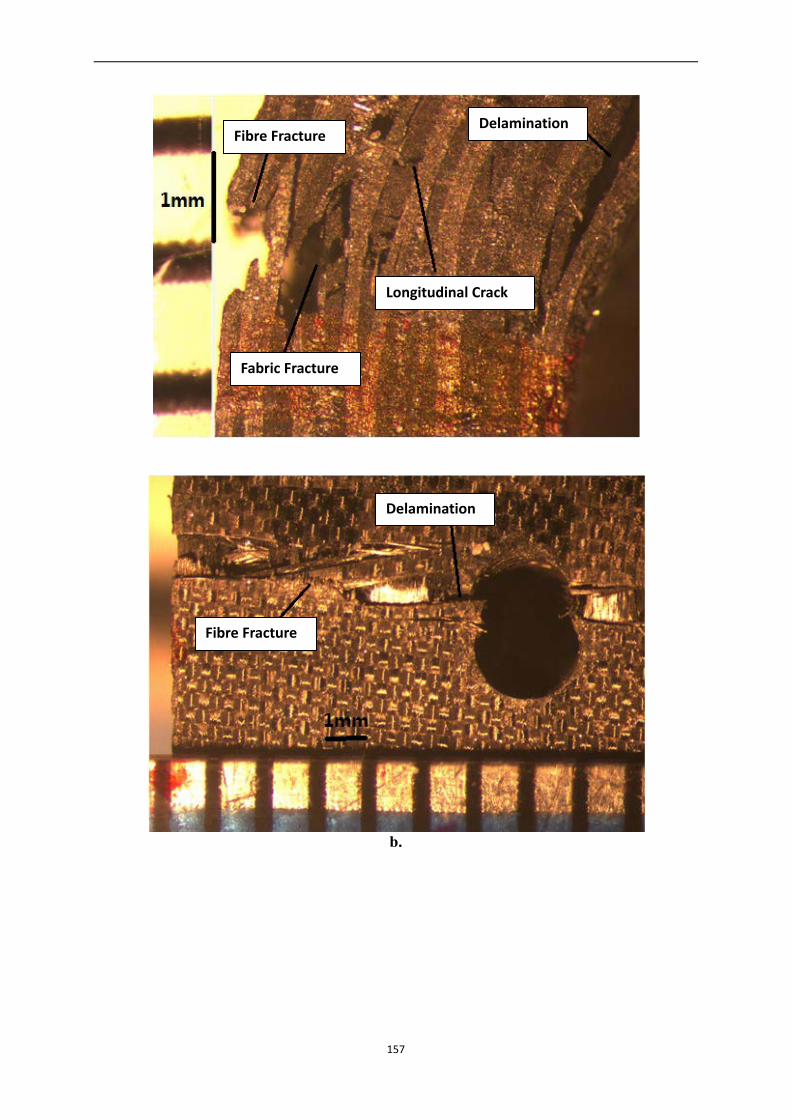
b.
Fibre Fracture
Fabric Fracture
Longitudinal Crack
Delamination
Delamination
Fibre Fracture
157
c.
Fibre Fracture
Fibre Fracture
Delamination
Delamination
Fabric Fracture
158
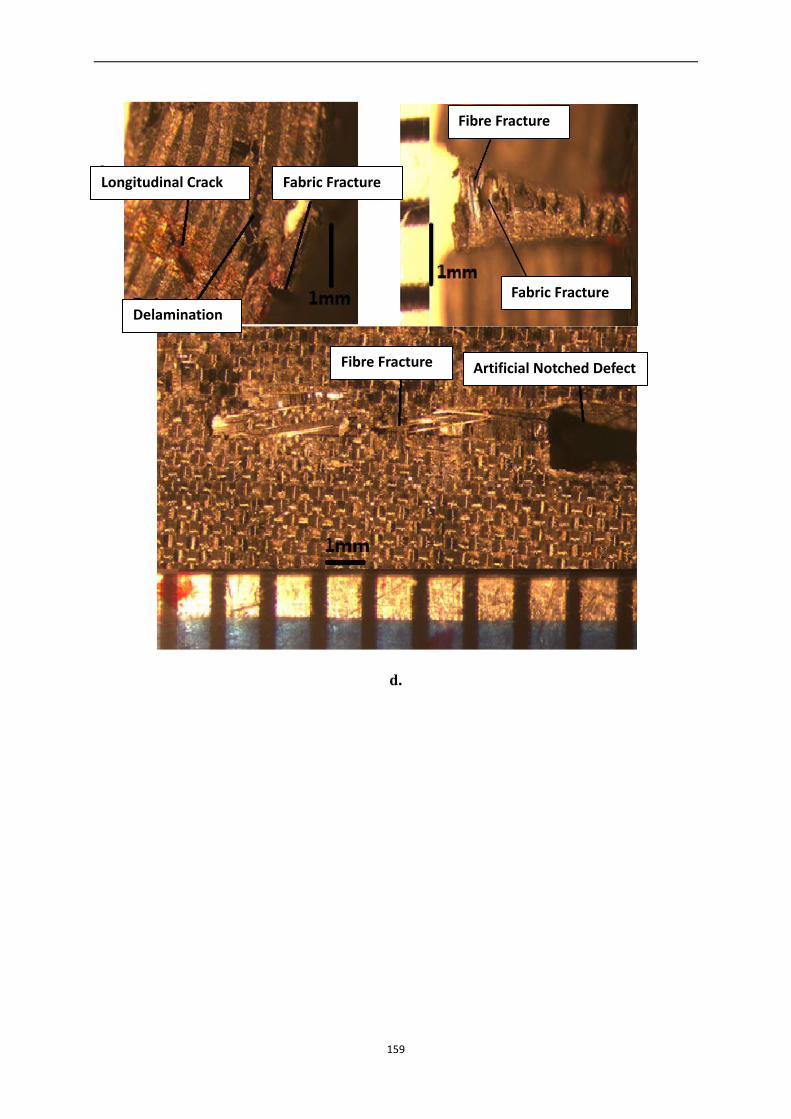
d.
Fabric Fracture
Delamination
Longitudinal Crack
Fibre Fracture
Fabric Fracture
Fibre Fracture Artificial Notched Defect
159
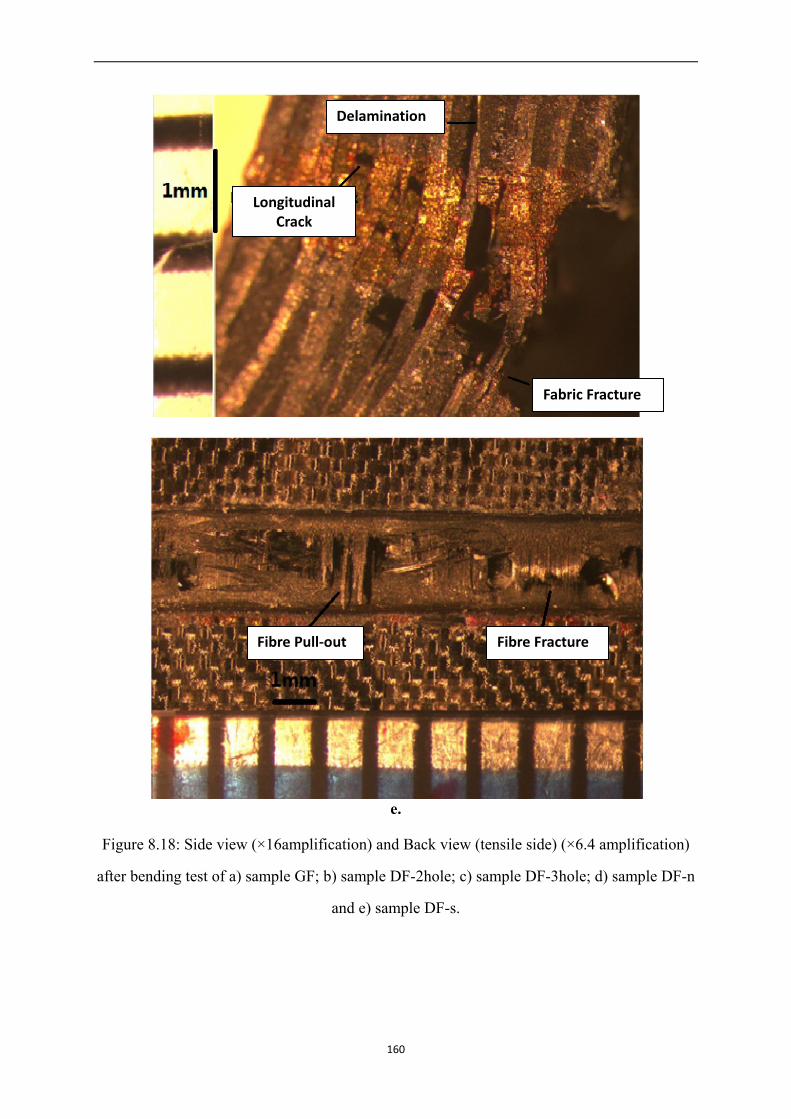
e.
Figure 8.18: Side view (×16amplification) and Back view (tensile side) (×6.4 amplification)
after bending test of a) sample GF; b) sample DF-2hole; c) sample DF-3hole; d) sample DF-n
and e) sample DF-s.
Delamination
Longitudinal Crack
Fabric Fracture
Fibre Fracture Fibre Pull-out
160
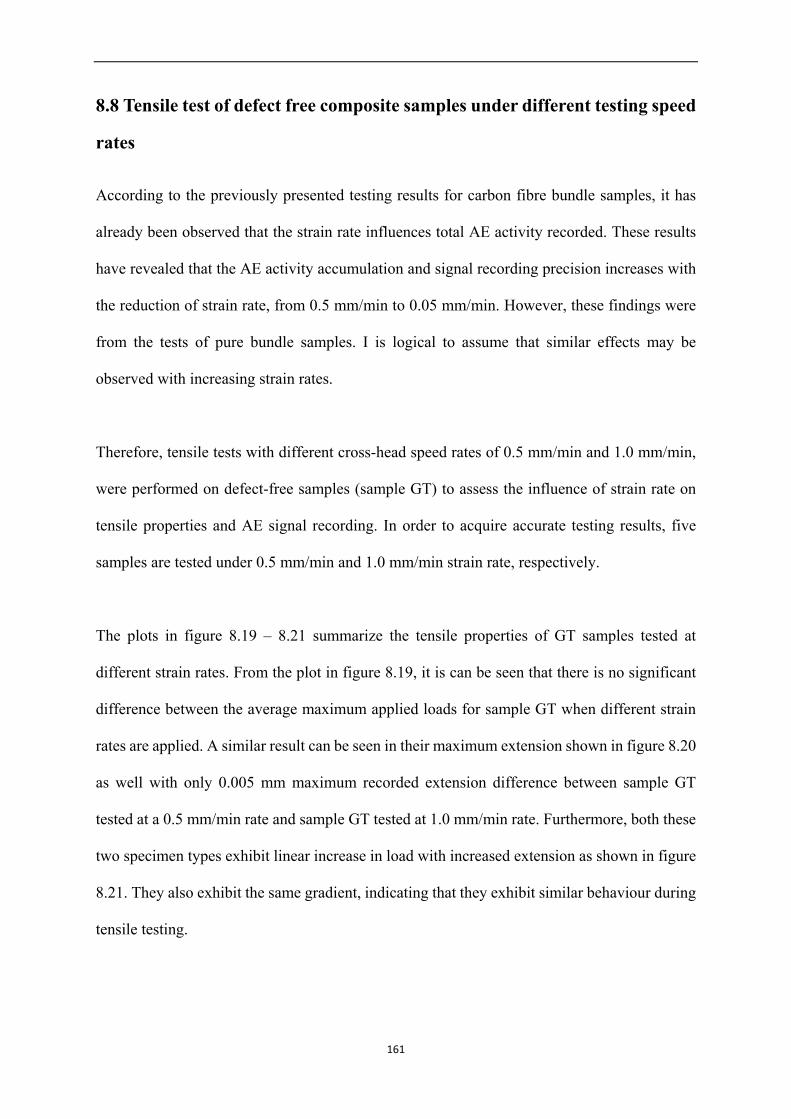
8.8 Tensile test of defect free composite samples under different testing speed
rates
According to the previously presented testing results for carbon fibre bundle samples, it has
already been observed that the strain rate influences total AE activity recorded. These results
have revealed that the AE activity accumulation and signal recording precision increases with
the reduction of strain rate, from 0.5 mm/min to 0.05 mm/min. However, these findings were
from the tests of pure bundle samples. I is logical to assume that similar effects may be
observed with increasing strain rates.
Therefore, tensile tests with different cross-head speed rates of 0.5 mm/min and 1.0 mm/min,
were performed on defect-free samples (sample GT) to assess the influence of strain rate on
tensile properties and AE signal recording. In order to acquire accurate testing results, five
samples are tested under 0.5 mm/min and 1.0 mm/min strain rate, respectively.
The plots in figure 8.19 – 8.21 summarize the tensile properties of GT samples tested at
different strain rates. From the plot in figure 8.19, it is can be seen that there is no significant
difference between the average maximum applied loads for sample GT when different strain
rates are applied. A similar result can be seen in their maximum extension shown in figure 8.20
as well with only 0.005 mm maximum recorded extension difference between sample GT
tested at a 0.5 mm/min rate and sample GT tested at 1.0 mm/min rate. Furthermore, both these
two specimen types exhibit linear increase in load with increased extension as shown in figure
8.21. They also exhibit the same gradient, indicating that they exhibit similar behaviour during
tensile testing.
161
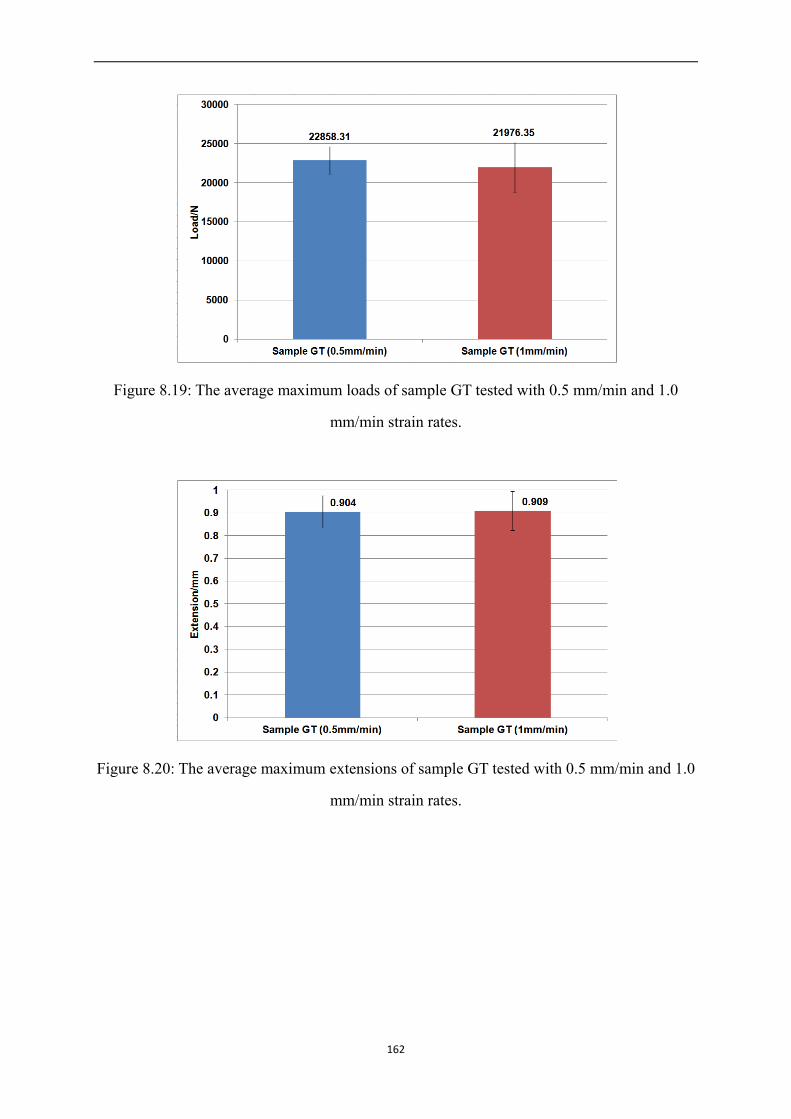
Figure 8.19: The average maximum loads of sample GT tested with 0.5 mm/min and 1.0
mm/min strain rates.
Figure 8.20: The average maximum extensions of sample GT tested with 0.5 mm/min and 1.0
mm/min strain rates.
162
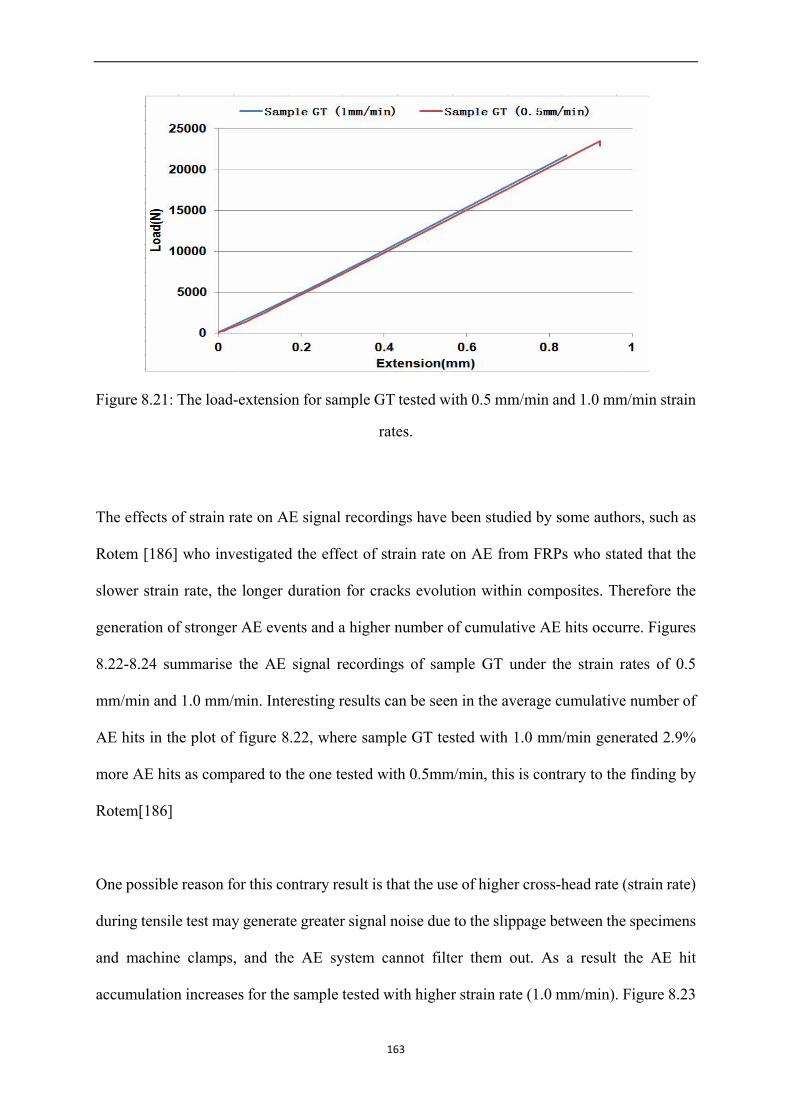
Figure 8.21: The load-extension for sample GT tested with 0.5 mm/min and 1.0 mm/min strain
rates.
The effects of strain rate on AE signal recordings have been studied by some authors, such as
Rotem [186] who investigated the effect of strain rate on AE from FRPs who stated that the
slower strain rate, the longer duration for cracks evolution within composites. Therefore the
generation of stronger AE events and a higher number of cumulative AE hits occurre. Figures
8.22-8.24 summarise the AE signal recordings of sample GT under the strain rates of 0.5
mm/min and 1.0 mm/min. Interesting results can be seen in the average cumulative number of
AE hits in the plot of figure 8.22, where sample GT tested with 1.0 mm/min generated 2.9%
more AE hits as compared to the one tested with 0.5mm/min, this is contrary to the finding by
Rotem[186]
One possible reason for this contrary result is that the use of higher cross-head rate (strain rate)
during tensile test may generate greater signal noise due to the slippage between the specimens
and machine clamps, and the AE system cannot filter them out. As a result the AE hit
accumulation increases for the sample tested with higher strain rate (1.0 mm/min). Figure 8.23
163

illustrates the increase in the cumulative number of AE hits with extension for two typical
defect-free samples (sample GT 6 and 9) tested with 0.5 mm/min and 1.0 mm/min strain rate
respectively. Overall, these two specimens exhibit a similar development of cumulative AE hits.
The difference between them is the point where the start of significant increase in AE activity
begins. This is observed to be earlier for the sample tested with 1.0mm/min (at around 4.3mm
extension) due to the faster damage development under higher strain rate.
In addition, the development of AE cumulative energies with testing time of two typical
samples from the tests under 0.5 mm/min and 1.0 mm/min strain rates respectively are
illustrated in figure 8.24. Clearly, the total AE cumulative energy is greater for the sample
tested with 0.5 mm/min as compared to the other one. Moreover, for the sample tested with 0.5
mm/min, the cumulative AE energy level increases gradually and sharply. The increase
process is longer than for the other sample tested at higher strain rate.
On the other hand, the cumulative energy increment of the sample tested with 1.0 mm/min
strain rate is rapid, and the transitions between energy levels are indistinct. As mentioned
before, the cumulative energy is relative to damage evolution, therefore, figure 8.24 indicates a
rapid damage propagation in the sample tested with 1.0 mm/min rate as compared to the one
with 0.5 mm/min strain rate, which is in agreement with the finding from Rotem [186]. In the
meantime, slower strain rate gives a more clear cumulative energy evolution, which is better
for the understanding of damage mechanisms.
164
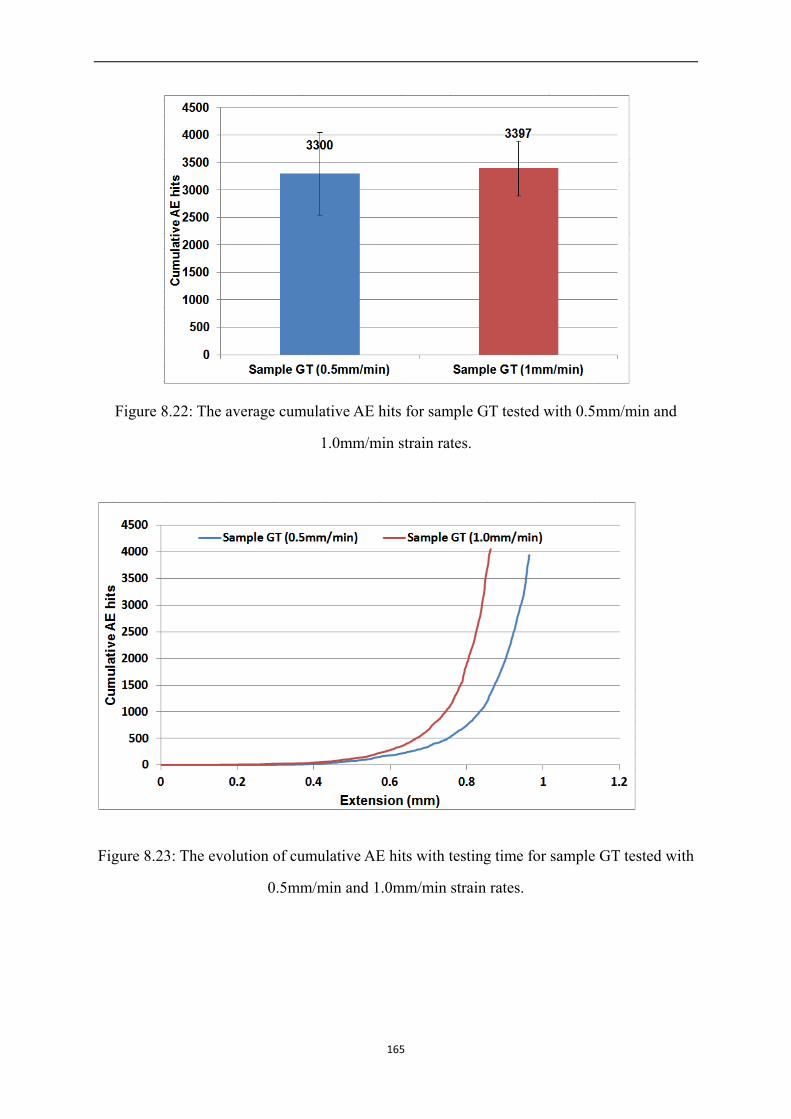
Figure 8.22: The average cumulative AE hits for sample GT tested with 0.5mm/min and
1.0mm/min strain rates.
Figure 8.23: The evolution of cumulative AE hits with testing time for sample GT tested with
0.5mm/min and 1.0mm/min strain rates.
165
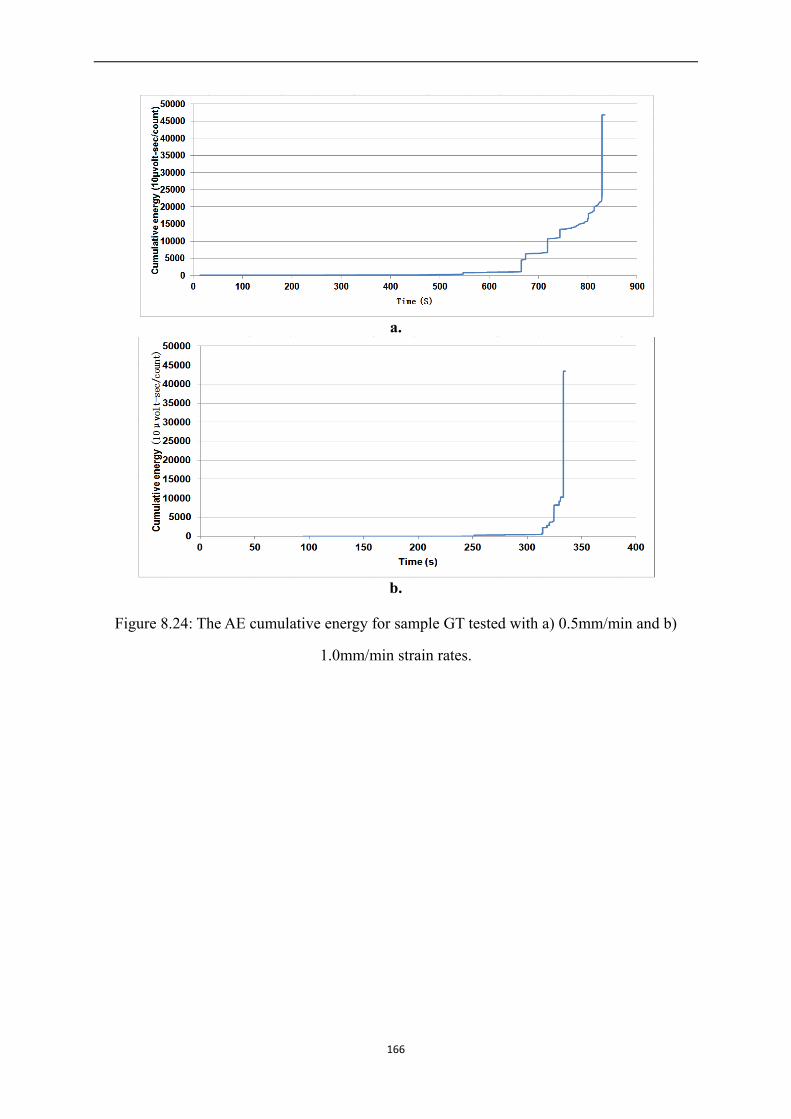
a.
b.
Figure 8.24: The AE cumulative energy for sample GT tested with a) 0.5mm/min and b)
1.0mm/min strain rates.
166

CHAPTER 9
Conclusions and Future Work
167
9.1 Conclusions
Inspection of FRP materials and more specifically CFRCs is particularly challenging with
traditional NDT techniques. This is due to the complex microstructure that CFRCs and other
FRP composite materials have. As a result SHM techniques and AE in particular have received
significant attention in recent years in order to monitor in-service components manufactured
from composite materials.
The AE technique offer several advantages since only a limited number of sensors are required
in order to monitor a large structure and locate where damage has initiated. However,
identification of damage mechanisms and rate of damage evolution remains a challenging
subject despite the significant research that has been carried out to date.
The purpose of this study has been to investigate the level of applicability of the AE technique
in monitoring CFRC materials and signal processing methods which can help engineers to
discriminate the various damage mechanisms involved. To build fundamental understanding in
the application of the AE technique initial tests were carried out on carbon fibre bundle tests to
simplify the variables during analysis of the AE data.
The carbon fibre bundle tests were followed by extensive tests on CFRC samples free of defect
as well as defective ones. It was ascertained that the energy, amplitude and counts of AE hits
are extremely useful in assessing damage evolution in CFRC and potentially identifying the
prevailing damage mechanisms as they evolve.
168
However, more in depth research is required which will couple the AE data with the actual
analysis. This can be the subject of future work recommended in the next section of the present
chapter.
9.2 Future work
The present study has highlighted some of the key aspects of the AE technique in monitoring
damage evolution in CFRC materials. Some signal processing methodologies have been
evaluated and confirmed as appropriate for the evaluation of the structural integrity of CFRC
materials.
Nonetheless, significant amount of work remains to be carried out. More specifically, AE data
and mechanical tests results analysis should be carried out in conjunction with detailed and in
depth microscopical analysis of the samples tested. Interrupted tests may be particularly
beneficial towards this direction.
Moreover, an investigation of the waveforms arising during different intervals of the tensile
tests is lacking in this study and would be particularly useful in any future study. The results of
this study have been in good agreement with other published work by a number of authors and
can be used as stepping stone towards a more fundamental understanding of the AE technique
and its application in SHM of FRP materials and specifically, CFRCs.
Finally, an in depth investigation of the effect of attenuation on the signals acquired would be
needed to improve our overall understanding on the effect this has on the signals acquired as
well as the overall variability of the AE hits recorded at different stages of tests. Fatigue testing
would also add significant value to this research. This is a type of test that was desirable to have
169

been carried out during this study but unfortunately was not possible due to the limited time
available.
Nonetheless the usefulness of the present results is obvious and it is hoped that these can be
used by researchers following up this work.
170
CHAPTER 10
References
1. Chawla, K. K., Composite materials: Science and Engineering, Third Edition, Springer,
2013.
2. Barbero, E. J., Introduction to composite materials design, Second Edition, CRC Press,
2010.
3. Reid, S. R. and Zhou, G. (Eds.), Impact behaviour of fibre-reinforced composite
materials and structures, Woodhead Publishing Limited, UK, 2000.
4. Christensens, R. M., Fibre reinforced composite materials, Applied Mechanics Reviews,
Vol. 38, Issue 10, October 1985, pp. 1267-1270.
5. Cantwell, W. J., Morton, J. The impact resistance of composite materials – a review, Vol.
22, Issue 5, September 1991, pp. 347-362.
6. Hodzic, A., Shanks, R., Natural Fibre Composites, Materials, Processes and
Applications, Woodhead Publishing, 2014.
7. Soutis, C., Carbon fibre reinforced plastics in aircraft construction, Materials Science
and Engineering A, Vol. 412, 2005, pp. 171-176.
8. Soutis, C., Fibre reinforced composites in aircraft construction, Progress in Aerospace
Sciences, Vol. 41, 2005, pp. 143-151.
9. Kelly, A. (Ed.), Concise encyclopaedia of composite materials, New York, Pergamon,
1994.
10. Hull, D., An introduction to composite materials, Cambridge, University Press, 1987.
171
11. Wambua, P., Ivens, J., Verpoest, I., Natural fibres: can they replace glass in fibre
reinforced plastics?, Composites Science and Technology, Vol. 63, Issue 9, July 2003,
pp. 1259-1264.
12. Joshi, S. V., Drzal, L. T., Mohanty, A. K., Arora, S., Are natural fibre composites
environmentally superior to glass fibre reinforced composites?, Composites Part A:
Applied Science and Manufacturing, Vol. 35, Issue 3, March 2004, pp. 371-376.
13. Taking the lead: A350XWB, EADS Presentation, December 2006.
14. Boeing B787 Dreamliner factsheet, Boeing Corporation, 2014.
15. Eurofighter Typhoon, the aircraft, available on www.eurofighter.com website. 2014.
16. Shenoi, R.A. and Wellicome, J. F. (Eds.), Composite materials in maritime structures,
Volume 1: Fundamental aspects, Cambridge University Press, Cambridge, 2008.
17. Smith, C. S., Design of Marine Structures in Composite Materials, Elsevier Applied
Science Publishers, London 1990.
18. Forbes J, Judd G. Design, fabrication and testing of composite superstructures for
warships. In: Proceedings of the International Conference on Advances in Marine
Structures III, Dunfermline, 20-23 May 1997.
19. LR5 Submersible Submarine Rescue Vessel, United Kingom, Naval Technology Market
& Customer Insight, naval-technology.com, 2014.
20. Beardmore, P., Johnson, C. F., The potential for composites in structural automotive
applications, Composites Science and Technology, Vol. 26, Issue 4, 1986, pp. 251-281.
21. Beardmore, P., Composite structures for automobiles, Composite Structures, Vol. 5,
Issue 3, 1986, pp. 163-176.
22. Thornton, P. H., Jeryan, R. A., Crash energy management in composite automotive
structures, International Journal of Impact Engineering, Vol. 7, Issue 2, 1988, pp.
167-180.
172
23. Park, C.-K., Kan, C.-K., Hollowell, W. T., Evaluation of crashworthiness of a
carbon-fibre-reinforced polymer (CFRP) ladder frame in a body-on-frame vehicle,
International Journal of Crashworthiness, Vol. 19, Issue 1, 2014, pp. 27-41.
24. Drewry, M. A., Georgiou, G. A., A review of NDT techniques for wind turbines, Insight –
Non-Destructive Testing and Condition Monitoring, Vol. 49, Number 3, March 2007, pp.
137-141.
25. Red, C., Wind turbine blades: big and getting bigger, Composites Technology, June
2008, Vol. 14, Issue 3, pp. 42-47.
26. Gardiner, G., Wind blade manufacturing, part 2: Are thermoplastic composites the
future?, Composites World, November 2008, Vol. 16, Issue 6, pp. 50-57.
27. Froes, F. H., Is the use of advanced materials in sports equipment unethical?, Journal of
Materials, Vol. 49, Issue 2, 1997, pp. 15-19.
28. Easterling, K. E., Advanced materials for sports equipment, Springer Netherlands, 1993.
29. Dong-xiao, H. E., Review of the application of advanced composite in aviation and
aerospace, Hi-tech Fibre & Application, 2006.
30. Hollaway, L. C., Thermoplastic-Carbon Fibre Composites Could Aid Solar-Based
Power Generation: Possible Support System for Solar Power Satellites, Journal of
Composites for Construction, Vol. 15, Special Issue in Honour of Professor Urs Meier,
2011, pp. 239-247.
31. Kapadia, A., Best Practice Guide on Non-Destructive Testing of Composite Materials,
National Composites Network, 2008.
32. Oster, Reinhold, Non-destructive testing methodologies on helicopter fibre composite
components challenges today and in the future, 18th World Conference on
Non-Destructive Testing, 16-20 April 2012, Durban, South Africa.
173
33. Smith, R. A., Composite Defects and Their Detection, Materials Science and
Engineering – Volume 3, Encyclopaedia of Life Support Systems (EOLSS), 2009, pp.
103-143.
34. ASTM E2580 – 12, Standard practice for Ultrasonic Testing of flat panel composites
and sandwich core materials used in aerospace applications.
35. Workley, F., Composite aircraft materials: Standardisation, Aviation Pros, 1st
September 2003.
36. Balageas, D. L., Bourasseau, S., Dupont, M., Lemistre, M., Kaczmarek, H., Osmont, D.,
Structural Health Monitoring for composite structures, Cobem, 24 September 1999.
37. Dupont, M., Osmont, D., Gouyon, R. and Balageas, D.L., 1999, Permanent monitoring
of damaging impacts by a piezoelectric sensor based integrated system, Proceedings of
the Second International Workshop on Structural Health Monitoring, September 7-10,
1999, Stanford, California, USA.
38. Leng, J., Asundi, A., Structural health monitoring of smart composite materials by
using EFPI and FBG sensors, Sensors and Actuators A: Physical, Vol. 103, Issue 5, 15
February 2003, pp. 330-340.
39. Ihn, J. B., Chang, F. K., Pitch-Catch active sensing methods in structural health
monitoring for aircraft structures, Structural Health Monitoring, Vol. 7, No. 1, March
2008, pp. 5-19.
40. Sohn, H., Farrar, C. R., Hemez, F., Czarnecki, J., A review of Structural Health
Monitoring literature 1996-2001, 2004.
41. Majumder, M., Gangopadhyay, T. K., Chakraborty, A. K., Dasgupta, K., Bhattacharya,
D. K., Fibre Bragg gratings in structural health monitoring – Present Status and
applications, Sensors and Actuators A: Physical, Vol. 147, Issue 1, 15 September 2008,
pp. 150-164.
174
42. Prosser, W. H., Advanced AE techniques in composite materials research, Journal of
Acoustic Emission, Vol. 14, Issue 3-4, 1996, pp. S1-S11.
43. Scholey, J. J., Wilcox, P. D., Lee, C. K., Friswell, M. I, Wisnom, M. R., Acoustic
emission in wide composite specimens, Advanced Materials Research, Vols. 13-14, 2006,
pp. 325-332.
44. De Rosa, I. M., Santulli, C., Sarasini, F., Acoustic emission for monitoring the
mechanical behaviour of natural fibre composites: A literature review, Composites: Part
A, Composites: Part A 40, 2009, pp. 1456-1469.
45. Pollock, A., Acoustic emission inspection, ASM Handbook, Vol. 17, pp. 278-294, 1989.
46. Callister, W. D., An Introduction to Materials Science and Engineering, Eight Edition,
Wiley and Sons, New York, 2010.
47. Drawings from website: www.engineersedge.com
48. Price range acquired from Smither Rapra’s website: www.rapra.net
49. Yang, S.-M., Investigation into recycling Carbon Fibre, Final Year Project Thesis,
School of Engineering, Faculty of Technology, University of Plymouth, April 2009.
50. Pickering S. J., Recycling technologies for thermoset composite materials – current
status, Composites: Part A: applied science and manufacturing, Vol. 37, 2006, pp.
1206-1215.
51. Recycling of waste glass fibre reinforced plastic with microwave pyrolysis, LIFE07
ENV/S/000904, Layman’s report, June 2012.
52. Yang, Y., Boom, R., Irion, B., van Heerden, D.-J., Kuiper, P., de Wit, H., Recycling of
composite materials, Chemical Engineering and Processing, Process Intensification, Vol.
51, pp. 53-68, January 2012.
53. Malnati, P., Reinforced thermoplastics: LFRT/GMT roundup, Composites World, 8
January 2007.
175
54. Mitschang, P., Blinzer, M., Wöginger, A., Processign technologies for continuous fibre
reinforced thermoplastics with novel polymer blends, Composites Science and
Technology, Vol. 63, 2003, pp. 2099-2110.
55. Hamerton, I., Thermosseting and thermoplastic polymer matrices for composites,
Presentation, University of Surrey.
56. Geigl, H. K., Studies on carbon fibre surface chemistry and on the development of
carbon hollow fibres, Thesis, Chemical Faculty University of Karlsruhe, Karlsruhe,
Germany (in German), 1979.
57. Wegener, A., Carbon fibre matrix adhesion depending on the fibre treatment, Project
Thesis, Institute for Textile Technology of RWTH, Aachen University, Aachen,
Germany, (in German) 2011.
58. Murray, R., Hybrid FRP composite materials, 18 month Ph.D. progress report
presentation, School of Metallurgy and Materials, The University of Birmingham,
Birmingham, UK, 2013.
59. Johnson, W. and Watt, W. ‘Structure of high-modulus carbon fibres’ Nature, Lond.,;
384(5099); 215. 1967
60. Gill, R. M. Carbon Fibres in Composite Materials, Butterworth, Canada 1972.
61. Hill, R., & E. U. Okoroafor, Weibull statistics of fibre bundle failure using mechanical
and acoustic emission testing: the influence of interfibre friction. Composites 26, pp.
699-705, 1994.
62. Mili, M. R., Bouchaour, T., and Merle, P., Estimation of Weibull parameters from
loose-bundle tests, Composites Science and Technology 56, 1996, pp. 831-834.
63. Mili, M. R., Moevus, M., Godin, N. Statistical fracture of E-glass fibres using a bundle
tensile test and acoustic emission monitoring, Composites Science and Technology 68,
2008, pp. 1800–1808.
176
64. Jihan, S., Siddiqui, A. M., Sweet, M. A. S., Fracture strength of E-glass fibre strands
using acoustic emission, NDT&E International, Vol. 30, No. 6, 1997, pp. 383-388.
65. Andersons, J., Joffeb, R., Hojoc, M., Ochiai, S., Glass fibre strength distribution
determined by common experimental methods, Composites Science and Technology Vol.
62, 2002, pp. 131–145.
66. Oskouei, A. R. and Ahmadi, M. I., Fracture Strength Distribution in E-Glass Fiber
Using Acoustic Emission, Journal of Composite Material, Vol. 44, No. 6, 2010, pp.
693-705.
67. Hamstad, M. A. and Moore, R. L., Acoustic Emission from Single and Multiple Kevlar
49 Filament Breaks, Journal of Composite Materials Vol. 20, No. 46, 1986, pp. 46-66.
68. MacQueen J. B., Some methods for classification and analysis of multivariate
observations, In the Proceedings of the Fifth Symposium on Mathematical Statistics and
Probability, vol. 1, University of California Press, Berkeley, CA, 1967, pp. 281-297.
69. Hull, D., & Clyne, W., An introduction to composite materials. First ed., Cambridge:
Cambridge University press 1981.
70. Ullah, H., Harland, A. R., Silberschmidt, V. V. Damage and fracture in carbon fabric
reinforced composites under impact bending. Composite structure 101, 2013, pp.
144-156.
71. Gao, F., Boniface, L., Ogin, S.L., Smith, P.A. and Greaves, R.P. ‘Damage accumulation
in woven-fabric CFRP laminates under tensile loading: Part 1. Observations of damage
accumulation’ Composites science and technology 59, 1999, pp. 123-136.
72. Adumitroaie, A. and Barbero, E. J. ‘Beyond plain weave fabrics – II. Mechanical
properties’ Composite structure 93, 2011, pp. 1449-1462.
73. Zhou, Y., Lu, Z. and Yang Z. ‘Progressive damage analysis and strength prediction of
2D plain weave composites’ Composite Part: B 47, 2013, pp. 220-229.
177
74. Naik, N. and Ganesh, V. ‘Failure behavior of plain weave fabric laminates under
onaxis uniaxial tensile loading: I – laminate geometry’. J. Compos Mater. 1996;
30(16): 1748–78.
75. Naik, N. and Ganesh, V. ‘Failure behavior of plain weave fabric laminates under
onaxis uniaxial tensile loading: II – analytical predictions’. J Compos Mater 1996;
30(16):1779–882.
76. Ito, M. and Chou, T. ‘And Stress Field Composites under Tensile of Plain-Weave
Loading’ Composite science and technology 1997; 97; 787-800.
77. Surya D. Pandita, Mayorkinos Papaelias and Gerard F. Fernando, Report on MOSAIC
FP7 project deliverable 2.2, September 2014.
78. Composite machining Blog – Sandivk AB and the Sandvik Group,
http://compositemachining.org/glossary-of-terms/
79. Centre for Nondestructive Evaluation, Iowa State University, Iowa, U.S.A.
https://www.cnde.iastate.edu/microwave-nde/microwave-patch-sensor
80. Tien-Wei, S., Yu-Hao, P. Impact resistance and damage characteristics of composite
laminates. Composite Structures, 62, 2003, pp. 193–203.
81. Schatz, M., Operational reliability of CFRP sports equipment, Techische Universitat
Munchen,
http://www.llb.mw.tum.de/en/research/fiber-composite-structures/cfrp-bicycles/
82. Gurit Guide to Composites, http://www.gurit.com/guide-to-composites.aspx
83. Scottbader CRYSTIC® Composites Handbook,
http://www.scottbader.com/uploads/files/3381_crystic-handbook-dec-05.pdf
84. O'Brien, T. K., Delamination Durability of Composite Materials for Rotorcraft, U.S.,
Army Research and Technology Activity, Langley, VA. LAR-13753.
178
85. Leung, C.L. and D.H. Kaelble. Moisture Diffusion Analysis for Composite
Microdamage, In the Proceedings of the 29th Meeting of the Mechanical Failures
Prevention Group, 23-25 May 1979, Gaithersburg, MD.
86. Crump, S., A Study of Blister Formation in Gel-Coated Laminates, In the Proceedings of
the International Conference Marine Applications of Composite Materials, 24-26 March
1986, Melbourne, FL: Florida Institute of Technology.
87. Blackwell, E., et al. Marine Composite Structure Failures and Their Causes, Proc. of the
Atlantic Marine Surveyors, Inc. Blistering and Laminate Failures in Fiberglass Boat
Hulls. 9-10 Feb. 1988. Miami, Florida, U.S.A.
88. USCG NVIC No. 8-87. Notes on Design, Construction, Inspection and Repair of Fibre
Reinforced Plastic (FRP) Vessels, 6 November 1987, U.S.A.
89. Saunders, D. S., Galea, S. C., Deirmendijian, G. K., The development of fatigue damage
around fastener holes in thick graphite/epoxy composite laminates, Composites, Vol. 24,
Issue 4, June 1993, pp. 309-321.
90. Pan, E., Yang, B., Cai, G., Yuan, F. G., Stress analyses around holes in composite
laminates using boundary element method, Engineering Analysis with Boundary
Elements, Vol. 25, Issue 1, January 2001, pp. 31-40.
91. Sollero, P., Aliabadi, M. H., Anisotropic analysis of cracks emanating from circular
holes in composite laminates using the boundary element method, Engineering Fracture
Mechanics, Vol. 49, Issue 2, September 1994, pp. 213-224.
92. Fernando, G. F. and Degamber, B., Process monitoring of fibre reinforced composites
using optical fibre sensors, International Materials Reviews, Vol. 51, Issue 2, April 2006,
pp. 65-106.
179
93. Martin, A. R., Fernando, G. F., Hale, K. F., Impact damage detection in filament wound
tubes using embedded optical fibre sensors, Smart Materials and Structures, Vol. 6,
Issue 4, 1997, pp. 470-476.
94. Badcock, R. A., Fernando, G. F., Fatigue damage detection in carbon fibre-reinforced
composites using an intensity-based optical fibre sensor, In the SPIE Proceedings,
Smart Structures and Materials 1995, Vol. 2444, Applications: Materials/Process
Control, 422, April 20, 1995.
95. MOSAIC Consortium FP7 Project D2.2 Report on Composite Materials for Maritime
Applications, 2014.
96. Summerscales, J., Manufacturing Defects in Fibre Reinforced Plastics Composites,
Insight, Vol. 36, Issue 12, December 1994, pp. 936-942.
97. Frankle, R.S., Jones, D. R., Roberts, B. L., Shusto, M. L., Analysis of composite material
containing defects, In the Proceedings of the 10th Conference of Composite Materials -
Testing and Design, San Francisco, 24-25 April 1992, pp 320-329.
98. Highsmith, A. L., Davis, J. J. and Helms, K. L. E., The influence of fibre waviness on the
compressive behaviour of unidirectional continuous fibre composites, In the Proceedings
of the 10th Conference of Composite Materials - Testing and Design, San Francisco,
24-25 April 1992, pp 20-36.
99. Rai, H. G., Rogers, C. W. and Crane, D. A., Mechanics of curved fibre composites, Journal
of Reinforced Plastics and Composites, May 1992, Vol. 11, Issue 5, pp. 552-566.
100. Mrse, A. M. and Piggott, M. R., Compression properties of unidirectional carbon fibre
laminates II: the effects of unintentional and intentional fibre misalignments,
Composite Science and Technology, 1993, Vol. 46, Issue 3, pp. 219-227.
180
101. Wisnom, M. R., The effect of fibre waviness on the relationship between compressive
and flexural strengths of unidirectional composites, Journal of Composite Materials, Vol.
28, Issue 1, 1994, 66-76.
102. Van Dreumel, W. H. M. and Kamp, J. L. M., Non Hookean behaviour in the fibre
direction of carbon fibre composites and the influence of fibre waviness on the tensile
properties, Report of Delft University of Technology, Department of Aerospace
Engineering, Report LR-251, Delft, The Netherlands, 1977.
103. Cantwell, W. J., Morton, J., The significance of damage and defects and their
detection in composite materials: a review, Journal of Strain Analysis for Engineering
Design, Vol. 27, Issue 1, pp. 29-42.
104. Lee, S. M., ‘A comparison of fracture toughness of matrix controlled failure modes :
delamination and transverse cracking’, J . composite Mater., 1986; 20; 185-196.
105. Bishop, S. M. and Dorey, G., The effect of damage on the tensile and compressive
performance of carbon fibre laminates, DTIC Document, 1983.
106. Kriz, R. D., ‘Influence of ply cracks on fracture strength of graphite/epoxy laminates
at 76K’ Effects of defects in composite materials, ASTM STP836, 1984, 250-265.
107. Kellas, S., Enoironmental effects on fatigue damage in notched carbonfibre
composites, PhD Thesis, University of London, 1988.
108. Cantwell, W. J., Impact damage in carbon fibre composites, PhD Thesis, University of
London, 1985.
109. Bishop, S. M., The significance of defects on the failure of fibre composites, AGARD
SMP subcommittee on defects. 1981.
110. Davies, P., Delamination behaviour of thermoplastic matrix composites (in French).
PhD Thesis, University of Compiegne, 1987.
181
111. Kirk, J. N. Munro, M., Beaumont, P. W. R., The fracture energy of hybrid carbon and
glass fibre composites, Journal of Materials Science, Vol. 13, 1978, pp. 2197-2204.
112. Dorey, G., Effect of service environment on composite materials, AGARD CP,
1980,288.
113. Gutkin, R., Green, C.J., Vangrattanachai, S., Pinho, S.T., Robinson, P., Curtis, P.T. On
acoustic emission for failure investigation in CFRP: Pattern recognition and peak
frequency analyses Mechanical systems and signal processing. 2011; 25; 1393-1407
114. Peter, J., Groot. D., Peter, A., Wijnen, M., Roger, B., Janssen, F., Real-Time Frequency
Determination of Acoustic Emission for Different Fracture Mechanisms in
Carbon/Epoxy Composites, Composite science and technology 1995; 55; 405-412.
115. Adumitroaie, A., Barbero, E. J. ‘Beyond plain weave fabrics – II. Mechanical
properties’ Composite structure 2011; 93; 1449-1462
116. Springer, G.S., Environmental Effects on Composite Materials, Technomic Publishing:
Lancaster, PA, 1984.
117. Eric Greene Associates, Marine Composites, Second Edition, 1999, U.S.A.
118. Papaelias, M., Design Against Structural Failure Lecture notes, The University of
Birmingham, Birmingham, UK, 2013.
119. Liquid Penetrant Testing, American Society for Non-Destructive Testing,
https://www.asnt.org/MinorSiteSections/AboutASNT/Intro-to-NDT
120. Heuer, H. and Schulze, M. H., Eddy current testing of carbon fibre materials by high
resolution directional sensors, In the Proceedings of the International Workshop on
Smart Materials, Structures and NDT in Aerospace, NDT in Canada 2011 Conference,
2-4 November 2011, Montreal, Quebec, Canada.
182
121. Maier, A., Schmidt, R., Oswald-Tranta, B., Schledjewski, R., Non-destructive
thermography analysis of impact damage on large-scale CFRP automotive parts,
Materials, 7 (1), 2014, pp. 413-429.
122. Das, G. C., Sharma, V. K., Sreeramkrishnan, P., Singh, G., Radiography of thin
sections of aluminium and composites with Americium-241 and X-rays, In the
Proceedings of the 10th APCNDT, Brisbane, Australia, 17-21 September 2001.
123. Rao, Y. J., Recent progress in applications of in-fibre Bragg grating sensors, Optics
and Lasers in Engineering, Vol. 31, Issue 4, April 1999, pp. 297-324.
124. Kuang, K. S. C., Kenny, R., Whelan, M. P., Cantwell, W. J., Chalker, P. R., Embedded
fibre Bragg grating sensors in advanced composite materials, Vol. 61, Issue 10, August
2001, pp. 1379-1387.
125. Majumder, M., Kumar Gangopadhyay, T., Kumar Chakraborty, A., Dasgupta, K.,
Bhattacharya, D. K., Fibre Bragg gratings in structural health monitoring – Present
status and applications, Vol. 147, Issue 1, 15 September 2008, pp. 150-164.
126. Guemes, J. A., Menendez, J. M., Response of Bragg grating fibre-optic sensors when
embedded in composite laminates, Vol. 62, Issues 7-8, June 2002, pp. 959-966.
127. Luyckx, G., Voet, E., Lammens, N., Degrieck, J., Strain measurements of composite
laminates with embedded fibre Bragg gratings: Criticism and opportunities for research,
Sensors, Vol. 11, Issue 1, 2011, pp. 384-408.
128. Murukeshan, V. M., Chan, P. Y., Ong, L. S., Seah, L. K., Cure monitoring of smart
composites using fibre Bragg grating based embedded sensors, Vol. 79, Issue 2, 1
February 2000, pp. 153-161.
129. Doyle, C. Martin, A., Liu, T., Wu, M., Hayes, S., Crosby, P. A., Powell, G. R., Brooks,
D, Fernando, G. F., In-situ process and condition monitoring of advanced
183
fibre-reinforced composite materials using optical fibres, Smart Materials and
Structures, Vol. 7, Issue 2, 1998, p. 145.
130. Liu, T., Fernando, G. F., A frequency division multiplexed low-fitness fibre optic
Fabry-Perot sensor system for strain and displacement measurements, Review of
Scientific Instruments, Vol. 71, Issue 3, 2000, pp. 1275.
131. Kaddour, A.S., Al-Salehi, F. A. R., Al-Hassani, S. T. S., Electrical resistance
measurement technique for detecting failure in CFRP materials at high strain rates,
Composite Science and Technology, Vol. 51, Issue 3, 1994, pp. 377-385.
132. Lau, K-T., Yuan, L., Zhou, L-m., Wu, J., Woo, C-h., Strain monitoring in FRP
laminates and concrete beams using FBG sensors, Composite Structures, Vol. 51, Issue
1, January 2001, pp. 9-20.
133. Shi, G., Lam, K. Y., Finite Element Vibration Analysis of composite beams based on
higher-order beam theory, Journal of Sound and Vibration, Vol. 219, Issue 4, 28 January
1999, pp. 707-721.
134. Lee, L. J., Fan, Y. J. Bending and vibration analysis of composite sandwich plates, Vol.
60, Issue 1, 3 July 1996, pp. 103-112.
135. Shu, D., Della, C. N., Free vibration analysis of composite beams with two
non-overlapping delaminations, International Journal of Mechanical Sciences, Vol. 46,
Issue 4, April 2004, pp. 509-526.
136. Liu, K., Ferguson, S. M., Measures, R. M., Fibre-optic interferometric sensor for the
detection of acoustic emission within composite materials, Optics Letters, Vol. 15, Issue
22, 1990, pp. 1255-1257.
137. Barre, S., Benzeggagh, M. L., On the use of acoustic emission to investigate damage
mechanisms in glass-fibre-reinforced polypropylene, Composites Science and
Technology, Vol. 52, Issue 3, 1994, pp. 369-376.
184
138. Kline, R. A., Acoustic emission in composites, Manual on experimental methods for
mechanical testing of composites, Springer Netherlands, 1989, pp. 105-113.
139. Groot, P. J., Winjen, P. A. M., Janssen, R. B. F., Real-time frequency determination of
acoustic emission for different fracture mechanisms in carbon/epoxy composites,
Composites Science and Technology, Vol. 55, Issue 4, 1995, pp. 405-412.
140. Prosser, W. H., Jackson, K. E., Kellas, S., Smitth, B. T., McKeon, J., Friedman, A.,
Advanced waveform based acoustic emission detection of matrix cracking in composites,
Materials Evaluation, Vol. 53, Issue 9, September 1995, pp. 1052-1058.
141. Godin, N., Huguet, S., Gaertner, R., Salmon, L., Clustering of acoustic emission
signals collected during tensile tests on unidirectional glass/polyester composite using
supervised and unsupervised classifiers, NDT&E International, Vol. 37, Issue 4, June
2004, pp. 253-264.
142. Beral, B. and Speckmann, H, Structural health monitoring (SHM) for aircraft
structure: a challenge for system developers and aircraft manufacturers, International
workshop on structural health monitoring, 2003, Stanford University, U.S.A.
143. Christian G., Marie L. P., Florent E., Bernard L., The detection of aeronautical defects
in situ oncomposite structures using Non Destructive Testing, Composite structure, Vol.
93, 2011, pp.1328-1336.
144. Zheng, G. et al., Blind deconvolution of acoustic emission signals for damage
identification in composites, Nondestructive Evaluation of Aging Materials and
Composite (3993), 2000, pp. 47-55.
145. Kanji Ono and Antolino Gallego, Research and Application of AE on Advanced
Composites, In the Proceedings of EWGAE 2012, Granada, Spain, 12-15 September
2012.
146. Anastassopoulos, A. A., Kouroussis, Niloaidis, V. N., Proust, A., Dutton, A. G.,
185
Blanch, M. J., Jones, L. E., Vionis, P., Lekou, D. J., van Delft, D. R. V., Joosse, P. A.,
Philippidis, T. P., Kossivas, T., Fernando, G., Structural integrity evaluation of wind
turbine blades using pattern recognition analysis on acoustic emission data, EWGAE
22, Vol. 1, 2002, pp. 21-28.
147. Joose, P. A., Blanch, M. J., Dutton, A. G., Kouroussis, D. A., Philippidis, T. P., Vionis,
P., Acoustic emission monitoring of small wind turbine blades, In the Proceedings of the
21st ASME Wind Energy Symposium, 2002, AIAA-2002-0063, pp. 1-11.
148. Krikera, G. R., Shinde, V., Schulz, M. J., Ghoshal, A., Sundaresan, M., Allemang, R.,
Damage localization in composite and metallic structures using a structural neural
system and simulated acoustic emissions, Mechanical Systems and Signal Processing,
Vol. 21, 2007, p. 280-297.
149. Shull, L. C., Basic Circuits, Hannah, R. L. and Reed, S. E. (Eds.), Strain gauge users’
manual, Society for Experimental Mechanics, 1992.
150. Vermeulen, Frederik and Papaelias, M., High frequency vibration spectral monitoring
for wind turbine tower structural damage detection, In the Proceedings of the CM 2010,
June 2010, UK.
151. Hill, K. O., Fuji, Y., Johnson, D. C. Kawasaki, B.S., Photosensitivity in optical fibre
waveguides: application to reflection fibre fabrication, Applied Physics Letters, Vol. 32,
Issue 10, 1978, p. 647.
152. Kim, S-W., Kim, E-H., Rim, M-S., Shrestha, P., Lee, I., Structural performance tests
of down scaled composite wind turbine blade using embedded fibre Bragg grating
sensors, International Journal of Aeronautical and Space Science, Vol. 12, Issue 4, 2011,
pp. 346-353.
186
153. Udd, E., Structural Health Monitoring using FBGs for aerospace and composite
manufacturing, In the Proceedings of Optical Fibre Sensors Conference, Cancun,
Mexico, 23 October 2006.
154. Green, A., Lockman, C. S., Steele, R. K. Modern Plastics, 41, 1964, pp. 137-139.
155. Kaiser, J. Erkentnisse und Folgerungen aus der Messung von Geräuschen bei
Zugbeanspruchung von metallischen Werkstoffen, Arch. Eisenhüttenwesen, Vol. 24,
1953, pp. 43–45 (in German).
156. Hellier, C., 2001 “Chapter 10: Acoustic Emission Testing” Handbook of
Nondestructive Evaluation 1st ed., McGraw Hill professional.
157. Narisawa, I. & H. OBA, "An evaluation of acoustic emission from fibre-reinforced
composites" Journal of material science pp. 1984, 1777-1779.
158. Husin, S., Mba, D., & Hamzah, R. R., Viability of the Application of Acoustic
Emission technology for the Process and management of maintenance in industries:
Defect Detection, On-Line Condition Monitoring, Diagnostic and Prognostic Tools,
International Multiconference of Engineers and Computes Scientists, Hong Kong. 2010,
pp. 1698-1706.
159. Huang, M., Jiang, L., Liaw, P. K., Brooks, C. R., Seeley, R., & Klarstrom, D. L., Using
Acoustic Emission in Fatigue and Fracture Materials Research, Journal of Materials,
Vol. 50, Issue 11, November 1998.
160. Scruby, C. B. Instrument Science And Technology: An introduction to acoustic
emission J. Phys. E: Sci. Instrum. 1987; 20; 946-953.
161. Vallen, H., AE testing fundamentals, equipment, applications, In the Proceedings of
ECNDT 2002.
187
162. Higo, Y. and Inaba, H. The general problems of AE sensors’. Acoustic Emission:
Current practice and Future Direction (Edited by Sachse, W., Roget, J. and Yamaguchi,
K.), 1991, ASTM PA19103, (ASTM, Philadelphia), 7-24.
163. Groose, C. ‘Hsu-Nielsen source’ NDT 2002. (Online source:
http://www.ndt.net/ndtaz/content.php?id=474)
164. Mehan, R. L., and Mulin, J. V. Analysis of composite failure mechanisms using
acoustic emission, Journal of Composite Materials Vol 5, pp266-269 April 1971
165. Valentin, D., Bonniau, P. and Bunsell, A.R. Failure mechanism discrimination in
carbon fibre-reinforced epoxy composites. Composites 1983; 14; 345–351.
166. Berthelot, J. M. and Rhazi, J. Acoustic emission in carbon fibre composites
Composites. science and technology 1990; 37; 411-428
167. Ni, Q.Q. and Iwamoto, M. Wavelet transform of acoustic emission signals in failure of
model composites. Engineering Fracture Mechanics 2002; 69; 717–728.
168. Groot, P.J. de, Wijnen, P.A.M. and Janssen, R.B.F. Real-time frequency determination
of acoustic emission for different fracture mechanisms in carbon/epoxy composites.
Composites Science and Technology 1995; 55; 405–412.
169. Ramirez-Jimenez, C.R., Papadakis, N., Reynolds, N., Gan, T.H., Purnell, P. and
Pharaoh, M. Identification of failure modes in glass/polypropylene composites by means
of the primary frequency content of the acoustic emission event Composites Science and
Technology 2004; 64; 1819–1827.
170. Godin, N., Huguet, S. and Gaertner. integration of the Kohonen’s self-organising map
and k-means algorithm for the segmentation of the AE data collected during tensile test
on cross-ply composites NDT&E international 2005; 38; 299-309
171. Surgeon, M. and Wevers, M. Modal analysis of acoustic emission signals from CFRP
laminates. NDT&E International 1999; 32; 311–322.
188
172. Oliveira R. de, & Marques A.T., Health monitoring of FRP using acoustic emission
and artificial neural networks. Computers and Structures 2008 (86) pp367-373
173. Moevus, M., N. Godin , Mili. M. R., Rouby,D., Reynaud,P., Fantozzi, G. & Farizy, G.
Analysis of damage mechanisms and associated acoustic emission in two
SiCf/[Si–B–C] composites exhibiting different tensile behaviours. Part II:
Unsupervised acoustic emission data clustering Composites Science and Technology
pp. 1258–1259 2008
174. Muzitani, Y., Nagashima, K., Takemoto, M. &Ono, K., Fracture mechanism
characterization of cross-ply carbon-fibre composites using acoustic emission analysis
NDT&E international 33:101-100 2000
175. Bussiba, A., Kupiec, M., Ifergane, S., Piat, R. & Bohlke, T., Damage evolution and
fracture events sequence in various composites by acoustic emission technique
Composite science and technology 68:1144-1155 2007
176. Clough, R. B. & McDonough, W. G., The measurement of fibre strength parameters in
fragmentation tests by using acoustic emission. Compos Sci Technol 56(10):1119-27
1996
177. Kelly A. & Tyson WR., Tensile properties of fibre reinforced metals: copper/tungsten
and copper/molybdenum Mech phys solids 13(6):329-50.
178. Kanji O., & Antolino G., Research and Application of AE on Advanced Composites
2012 ( http://ndt.net/article/ewgae2012/content/papers/34_Ono.pdf)
179. White, R.G., Tretout, M., Acoustic emission detection using a piezoelectric gauge for
failure mechanisms, Composite Vol.10 pp 101-109 April 1979.
180. Guild, F. J., Walton, D., Adams, R. D., Smort, D., The application of acoustic
emission to fibre-reinforced composite materials, Composite Vol. 7 pp173-179 July
1976
189
181. Lenain, J. C., Caracterisation par emission acoustique des mecanismes de rupture
des materiaux composites en vue d'un controle non destructif des structures, Proc of
Les Premieres Journees Nationales sur les Conmposites Paris September 1978
pp127-133.
182. Sha J., Siddiqui, A. M., Sweet, M. A. S., Fracture strength of E-glass fibre strands
using acoustic emission NDT&E International (30) pp383-388 1996
183. Wevers, M., Verpoest, I., De Meester P, Aernoudt, E., Identification of fatigue failure
modes in carbon fibre reinforced composites with the energy discriminating acoustic
emission method. AE: current practice and future directions, ASTM STP, p. 1077
184. Ivanov D. S., Lomov, S. V. A., Bogdanovich, E., Karahan, M., Verpoest, I., A
Comparative study of tensile properties of non-crimp 3D orthogonal weave and
multi-layer plain weave E-glass composites. Part 2: comprehensive experimental results.
Composites Part A: Applied Science and Manufacturing 40 (8). 2009
185. Ullah H., Harland, A. R., Silberschmidt, V. V., Damage modelling in woven-fabric
CFRP laminates under large-deflection bending, Computational Materials Science (64).
2012
186. Rotem, A., Effect of strain rate on acoustic emission from fibre composites,
Composites Vol. 9 pp33-36 January 1978
190