Embed Size (px)
Citation preview
Structural Validity of the Woodcock Johnson III Cognitive
in a Referred Sample
by
Tracy Strickland
A Dissertation Presented in Partial Fulfillment
of the Requirements for the Degree
Doctor of Philosophy
Approved April 2012 by the
Graduate Supervisory Committee:
Marley Watkins, Co-Chair
Linda Caterino, Co-Chair
Samuel Green
ARIZONA STATE UNIVERSITY
May 2012
i
ABSTRACT
The structural validity of the WJ-III Cognitive was investigated using the
GIA-Extended Battery test scores of 529, six-to-thirteen-year-old students
referred for a psychoeducational evaluation. The results of an exploratory factor
analysis revealed 11 of the 14 tests loaded on their expected factors. For the
factors Gc, Gf, Gs, and Gv, both tests associated with the factor loaded highly; for
Gsm, Glr, and Ga, only one test associated with each factor loaded highly.
Obtained congruence coefficients supported the similarity between the factors Gs,
Gf, Gc, Glr, and Gv for the current referred sample and the normative factor
structure. Gsm and Ga were not found to be similar. The WJ-III Cognitive
structure established in the normative sample was not fully replicated in this
referred sample. The Schmid-Leiman orthogonalization procedure identified a
higher-order factor structure with a second-order, general ability factor, g, which
accounted for approximately 38.4% of common variance and 23.1% of total
variance among the seven, first-order factors. However, g accounted for more
variance in both associated tests for only the orthogonal first-order factor Gf. In
contrast, the Gc and Gs factors accounted for more variance than the general
factor for both of their respective tests. The Gsm, Glr, Ga, and Gv factors
accounted for more variance than g for one of the two tests associated with each
factor. The outcome indicates Gc, Gf, Gs, and Gv were supported and thus are
likely factors that can be utilized in assessment while Gsm, Glr, and Gr were not
supported by this study. Additionally, results indicate that interpretation of the
WJ-III scores should not ignore the global ability factor.
ii
ACKNOWLEDGMENTS
My appreciation and gratitude go out to my committee, Dr. Marley
Watkins, Dr. Linda Caterino, Dr. Amanda Sullivan, and Dr. Samuel Green, for
their continuing support. I thank Dr. Caterino for her unfailing optimism and
guidance not only through the completing of my dissertation but throughout my
academic career in the program; as well as for providing the sample. I thank Dr.
Sullivan for her time and willingness to participate on my committee. A very
heartfelt thanks goes to Dr. Green for his kind and generous offer to participate in
my committee at the last moment. I am extremely grateful for the time and
support I received from my chair, Dr. Watkins. His remarkable feedback and
high expectations pushed me to create the best final product I could; this was truly
appreciated.
I would also like to thank my cohort for their encouragement and support.
I could not have gone through this process without having such wonderful people
in my life. Special thanks go to Kerry Lawton for always being willing to provide
statistical assistance in a manner that I could understand; Selena Nakano for
always being willing to lend a hand and listen to my fears and frustrations; Lisa
Hildreth for being a sounding board in all aspects of my life; and Paula McCall
and Kisha Nosov for their friendship and advice.
I would like to thank my family for their love and continued belief in my
ability to succeed, for always being there and encouraging me to try my best and
their constant support. Mom, Dad, Steph, and Brad you are amazing. Finally, I
iii
would like to thank my husband, Brandon Allen, I could not have done this
without you; I love you. We did it!!
iv
TABLE OF CONTENTS
Page
LIST OF TABLES……………………………………………………………….vi
LIST OF FIGURES...…………………………………………………………...viii
CHAPTER
1 STRUCTURAL VALIDITY OF THE WOODCOCK JOHNSON III
COGNITIVE IN A REFERRED SAMPLE .................................... 1
Pyschometric Characteristics ............................................................... 3
Intelligence Tests................................................................................... 6
WISC-IV ................................................................................................ 6
WJ-III ..................................................................................................... 8
Structural Validity of the WJ-III Cognitive ...................................... 14
Current Study....................................................................................... 22
2 METHOD ................................................................................................ 24
Participants .......................................................................................... 24
Instruments ......................................................................................... 29
WJ-III Tests of Cognitive Abilities.................................................... 29
Procedure ............................................................................................. 34
Data Analyses ...................................................................................... 35
3 RESULTS ................................................................................................ 42
Replicatory Factor Analysis ............................................................... 43
Congruence Coefficient for Obtained Factor Structures .................. 53
v
CHAPTER Page
Schmid-Leiman Orthogonalization Procedure ................................. 53
4 DISCUSSION ......................................................................................... 57
Limitations ........................................................................................... 61
Future Research ................................................................................... 62
Implications for Practice ..................................................................... 62
REFERENCES ........................................................................................................... 64
APPENDIX
A EFA OF STUDENTS WITH A PRIMARY CLASSIFICATION OF A
SPECIFIC LEARNING DISABILITY .......................................... 71
B EFA OF STUDENTS WHO DID NOT QUALIFY OR DID NOT
HAVE A PRIMARY CLASSIFICATION OF A SPECIFIC
LEARNING DISABILITY ............................................................. 72
vi
LIST OF TABLES
Table Page
1. Hypothesized CHC Theoretical Factor Structure of the WJ-III Cog . 12
2. WJ-III Cog GIA-Extended Factor Loadings ....................................... 17
3. WJ-III Cog GIA-Extended Factor Loadings Ages 6-8 ........................ 18
4. WJ-III Cog GIA-Extended Factor Loadings Ages 9-13 ..................... 19
5. Representation of Ethnicities in the Sample ........................................ 25
6. Primary Special Education Classifications in the Sample .................. 26
7. Percentages Primary Special Education Classifications by Ethnicities
for the Sample ...................................................................................... 27
8. Characteristics of Students in the Sample School District ................. 28
9. Student Academic Achievement In the Sample School District ........ 29
10. WJ-III Cog GIA-Extended Battery Test Descriptions ................. 32-34
11. WJ-III Cog Normative Data Correlation Coefficients 6-13 ........ 38-39
12. Mean & SDs on WJ-III Cog Test Scores of Sample ........................ 43
13. Structure of WJ-III Cog with Principal Axis Extraction & Promax
Rotation of 7 Factors from the Normative Sample ........................... 45
14. Structure Matrix of WJ-III Cog with Principal Axis Extraction &
Promax Rotation of 7 Factors from the Normative Sample ............ 46
15. Structure of WJ-III Cog with Principal Axis Extraction & Promax
Rotation of 7 Factors Among Sample ............................................... 48
16. Structure Matrix of WJ-III Cog with Principal Axis Extraction &
Promax Rotation of 7 Factors Among Sample ................................. 49
vii
17. Factor Intercorrelations of WJ-III Cog Among Sample & Correlation
Coefficients Between Normative & Referred Sample ...................... 50
18. Loadings & Percent Variance Accounted for in WJ-III Cog Sample
According to Orthogonalized Higher Order Factor Model ......... 55-56
viii
LIST OF FIGURES
Table Page
1. Higher-order factor results from the WJ-III Cog normative sample .. 51
2. Higher-order factor results from the sample of students referred for
special education eligibility ................................................................ 52
1
Chapter 1
STRUCTURAL VALIDITY OF THE WOODCOCK JOHNSON III
COGNITIVE IN A REFERRED SAMPLE
In the 2006-2007 school year, more than 6.5 million children received
special education services (U. S. Department of Education National Center for
Educational Statistics, 2009b). The large number of students in special education
has a major impact on schools in terms of finances and the human resources
needed to classify and serve these students, as well as effects on the students
themselves.
The cost of special education is considerable. According to the Center for
Special Education Finance (2003), the average expenditure for a student with a
disability in 2000 was $12,525, compared to only $6,556 for a student in regular
education. Additionally, schools must provide quality education for these
students through the employment of well-trained special education teachers. The
No Child Left Behind Act of 2001 made as one of its goals that teachers be highly
qualified and that these teachers ensure special education students meet the
standards required for making adequate yearly progress (NCLB). Currently there
is a shortage of fully certified special education teachers to meet this demand
(Boe, 2006).
Special education classification has important consequences for students
as well. Students with disabilities typically do not achieve commensurately with
their nondisabled peers and do not appear to make significant educational gains
2
while enrolled in special education programs (Hocutt, 1996; Kavale & Forness,
1999; Morgan, Frisco, Farkas, & Hibel, 2010). In the 2006-2007 school year,
only 56.1% of students served under the Individuals with Disabilities Education
Act received a standard high school diploma, while 25.5% dropped out; the
remaining students either received a certificate of completion, reached maximum
age, or died (U. S. Department of Education National Center for Educational
Statistics, 2009a). These results are particularly important as the majority of
students in special education retain their special education classification
throughout their school years (Bielinski & Ysseldyke, 2000). Because the
outcomes of special education eligibility decisions have such important
consequences, it is critical that the assessments used to make these judgments be
valid.
According to the Individuals with Disabilities Education Act (IDEA,
2004), all students being considered for special education must receive a full and
individual evaluation to determine their eligibility for special education services.
Full and individual evaluations typically include assessments of cognitive ability,
academic achievement, social and emotional status, adaptive behavior, and motor
and communication ability, as well as vision and hearing ability. Of these areas,
assessment of cognitive ability with individual intelligence tests is included in
many special education eligibility evaluations. Accordingly, school psychologists
spend approximately two-thirds of their time on activities related to special
education classification, and a typical school psychologist administers
approximately 70 intelligence tests a year (Curtis, Lopez, Castillo, Batsche, &
3
Smith, 2008; Reschly & Ysseldyke, 2002). As cognitive ability assessments are
used so frequently to make high-stakes eligibility decisions, it is imperative that
school psychologists select tests that are fair and appropriate (Joint Committee on
Testing Practices, 2004). This includes selecting a test only after evaluating its
usefulness; specifically, that there is strong evidence supporting a test’s reliability
and validity.
Psychometric Characteristics
When choosing a test, it is important to be knowledgeable about both its
reliability and validity evidence for proposed score interpretations (AERA, APA,
& NCME, 1999; NASP, 2000). Validity, the most fundamental consideration
when testing, “refers to the degree to which evidence and theory support the
interpretations of test scores entailed by proposed uses of tests” (AERA et al.,
1999, p. 9). Cronbach and Meehl (1955) originally described four types of
validity: predictive, concurrent, content, and construct. Predictive and concurrent
validity both describe how well a test correlates with another test. Content
validity investigates how well a test measures all aspects of the domain it purports
to measure. Finally, construct validity examines whether the test measures the
construct it claims to measure.
Messick (1995) described two major threats to construct validity:
construct underrepresentation and construct-irrelevant variance. Construct
underrepresentation occurs when a test fails to measure all aspects of the construct
of interest, indicating the test is too narrow. Construct-irrelevant variance occurs
when the test measures aspects of constructs other than the construct under
4
investigation. That is, the test is too broad. Thus, it is critical that the construct
be clearly defined and adequately measured. This requirement was reinforced by
the Standards for Educational and Psychological Testing (AERA et al., 1999),
which stated that “the population(s) for which a test is appropriate should be
clearly delimited, and the construct that the test is intended to assess should be
clearly described” (p. 17).
Messick (1995) believed the traditional types of validity were incomplete
and that a more comprehensive view suggested that all validity criteria for
educational and psychological measurement is construct validity. Messick
delineated six types of construct validity evidence: content, substantive,
generalizability, external, consequential, and structural. Content validity refers to
whether the content of the test is truly relevant to the construct of interest.
Substantive validity examines whether the underlying processes involved in
responding are consistent with the construct being measured. Generalizability
provides evidence that the interpretations made based on the test are valid across
different populations and forms of the test. External validity looks at the
relationship between scores and a criterion: it includes convergent and
discriminant validity. Convergent evidence shows how well the test correlates
with other tests of the same construct, while discriminant evidence shows how
distinct the test is from tests of different constructs. Consequential validity
provides evidence of the intended and unintended consequences of scores
interpreted from the test: it demonstrates the social consequences, both positive
and negative, of the test. Finally, structural validity maintains that the structure of
5
the test should match the structure of the construct under investigation.
According to Loevinger (1957), “the structural component of validity refers to the
extent to which structural relations between test items parallel the structural
relations of other manifestations of the trait being measured” (p. 661). Taken
together, these different aspects of validity provide a basis for how test scores
may be interpreted to make outcome decisions.
The Standards for Educational and Psychological Testing (AERA et al.,
1999) recognized that all measures of validity are measures of construct validity
as “all test scores are viewed as measures of some construct, so the phrase is
redundant with validity” (p. 174). The Standards described five types of validity
evidence to be obtained when evaluating a test, all of which align closely with
those defined by Messick (1995): evidence based on test content (content
validity); evidence based on response processes (substantive validity); evidence
based on consequences of testing (consequential validity); evidence based on
relation to other variables which includes convergent and discriminant evidence
(external validity), test-criterion relationships (external validity), validity
generalization (generalizability); and evidence based on internal structure
(structural validity).
Examination of validity evidence is critical when developing and
evaluating tests of cognitive abilities. Validity is key for both the interpretation of
an individual’s test score as well as any implications for action that are taken
based on an individual’s test score (Messick, 1995). Given the frequent use of
cognitive tests in special education evaluations and the high-stakes eligibility
6
decisions made based on the results of these tests, it is vitally important that
cognitive ability tests show strong validity evidence to support their use and
interpretation.
Intelligence Tests
While many intelligence tests are currently published, the Wechsler
Intelligence Scale for Children–Fourth Edition (WISC-IV; Wechsler, 2003a) is
currently the most popular cognitive ability test (Kaufman, Flanagan, Alfonso, &
Mazola, 2006). To determine the appropriateness of using a particular
intelligence test, it is necessary to examine its validity, as well as its theoretical
and empirical bases.
WISC-IV. The WISC-IV shows adequate validity evidence in areas such
as relation to other variables (convergent and discriminant evidence, test-criterion
relationships). For example, the WISC-IV is highly correlated with other
Wechsler scales; the WISC-IV Full Scale IQ (FSIQ) and the Wechsler
Intelligence Scale for Children–Third Edition (WISC-III; Wechsler, 1991) FSIQ
showed a correlation of .89. The WISC-IV FSIQ is also highly correlated with
the Wechsler Individual Achievement Test–Second Edition (WIAT-II; Wechsler,
2001) Total Achievement score at .87.
The WISC-IV Technical and Interpretive Manual (Wechsler, 2003b)
provides evidence of structural validity based on an oblique four-factor model
using exploratory and confirmatory first-order factor analysis; however, higher-
order factor analyses were not reported. The four first-order factors are the
Verbal Comprehension Index (VCI), Perceptual Reasoning Index (PRI),
7
Processing Speed Index (PSI), and Working Memory Index (WMI). While this
four-factor structure corresponds to the theoretical structure articulated in the
WISC-IV Technical and Interpretive Manual (Wechsler, 2003b), it fails to include
the potential role of general intelligence, g, although the inclusion of a FSIQ score
implies that such a construct is present in the test. Thus, there is a disconnect
between the four-factor theoretical structure described in the manual and the
actual structure of the test, which includes a higher-order factor, g, as measured
by the FSIQ. This has important implications for the interpretation and use of
tests scores as second-order factors should not be interpreted based on first-order
factors (McCain, 1996).
Watkins (2006), using an orthogonal higher-order structural analysis of the
standardization sample and the core 10 subtests, found a four-factor model similar
to that presented in the WISC-IV technical manual (Wechsler, 2003b). However,
the greatest amount of common (71.3%) and total (38.3%) variance was
accounted for by the general factor, g. Comparable results were found in studies
using clinical samples, indicating a four-factor structure with g accounting for the
greatest amount of variance (Bodin, Pardini, Burns, & Stevens, 2009; Watkins,
Wilson, Kotz, Carbone, & Babula, 2006). These latter two studies suggest that
the current interpretation structure of the test may not be optimal for clinical
samples (Bodin et al., 2009; Watkins et al., 2006).
A second major critique of the WISC-IV is its lack of a theoretical
foundation (Kaufman et al., 2006; Keith, Fine, Taub, Reynolds, & Kranzler,
2006). When the Wechsler Intelligence Scale for Children (WISC; Wechsler,
8
1949) was originally designed, Wechsler appeared to adopt the singular g theory
of intelligence, “intelligence is the aggregate or global capacity of the individual
to act purposefully, to think rationally and to deal effectively with his
environment” (Wechsler, 1944, p. 3). However, just as conceptualizations of
validity have changed over time (AERA et al., 1999; Cronbach & Meehl, 1955),
conceptualizations of intelligence have evolved since Wechsler first published the
WISC. Specifically, theories of intelligence have progressed from Spearman’s
single general ability (g), which encompasses almost all cognitive tasks, to the
Cattell-Horn Gf-Gc theory, which includes fluid intelligence (Gf) (novel problem-
solving ability, reasoning skills, and incidental learning) and crystallized
intelligence (Gc) (consolidated knowledge gained through acculturation), to
Gardner’s theory of multiple intelligences, which includes cognitive and non-
cognitive tasks (Flanagan, McGrew, & Ortiz, 1999). Wechsler has not aligned
with these changes in intelligence theory in the development of revisions to his
original test (Kaufman et al., 2006). The most current edition of Wechsler’s
intelligence tests for children, the WISC-IV, is the most closely related to modern
intelligence theory, with its inclusion of a fluid intelligence measure in addition to
its existing crystallized intelligence measure. However, “it still lacks an explicit
theoretical framework” (Keith et al., 2006, p. 109), and a test must be grounded in
theory for interpretation to be valid and meaningful (Kamphaus, Winsor, Rowe, &
Kim, 1997).
Woodcock-Johnson-III. The initial Woodcock-Johnson cognitive
battery, Part One of the Woodcock-Johnson Psycho-Educational Battery – Tests
9
of Cognitive Ability (WJPEB; Woodcock & Johnson, 1977), was developed in
1977 and lacked a theoretical model (Schrank, Flanagan, Woodcock, & Mascolo,
2002). It was comprised of 12 tests measuring a range of broad and complex
cognitive abilities. Subsequent factor and cluster analyses defined the four broad
abilities covered in the test: Knowledge-Comprehension, Reasoning-Thinking,
Memory-Learning, and Discrimination-Perception. These cognitive tests were
differentially weighted to give a more statistically sound overall measure of
intelligence, termed Broad Cognitive Ability.
The second version of the Woodcock-Johnson, the Woodcock-Johnson
Psychoeducational Battery-Revised (WJ-R; Woodcock & Johnson, 1989) was
introduced a decade later. It was in this revision of the test that a theoretical
foundation was first claimed as the basis of construction; specifically, the Cattell-
Horn Gf-Gc theory of intelligence (Woodcock & Johnson, 1989). The Cattell-
Horn Gf-Gc theory hypothesized the existence of seven broad abilities, including
Cattell’s original abilities of Fluid Intelligence (Gf) and Crystallized Intelligence
(Gc), which fully encompassed an individual’s mental capacity (Horn, 1968).
The WJ-R included 10 new tests and introduced a structure of seven broad
cognitive factors and a hierarchical general intelligence factor. Confirmatory
factor analysis of the seven factors of the WJ-R Cognitive, as well as the
Quantitative Ability (Gq) factor from the WJ-R Tests of Achievement, was
conducted using a sample of 2,261 participants from the 4,261 participants in the
normative sample (Woodcock & Johnson, 1989). The results of the factor
analysis indicated that each of the tests in the WJ-R Cognitive battery loaded
10
highly on its respective factor. As each factor was measured using two tests
which loaded only on that particular factor, the WJ-R Cognitive was found to be a
strong measure of the abilities delineated in the Gf-Gc theory of intelligence
(Woodcock, 1990). Additionally, the use of factor analysis in the identification of
the ability factors measured by the WJ-R Cognitive was particularly noteworthy
(Reschly, 1990).
Between the publication of the WJ-R and the introduction of the
Woodcock-Johnson Tests of Cognitive Abilities III (WJ-III Cognitive;
Woodcock, McGrew, & Mather, 2001), the Cattell-Horn-Carroll (CHC)
hierarchical theory of intelligence emerged, combining the Cattell-Horn Gf-Gc
theory with Carroll’s three-stratum theory (Schrank et al., 2002). This new theory
proposed a hierarchical structure of intelligence with three levels: an overarching
general intelligence (g), 10 broad abilities, and more than 70 narrow abilities. The
WJ-III used this theory in its development “as a blueprint to build more breadth
into the broad factors of the WJ-III, thus providing greater generalizability
(validity) of the factor scores to other situations. This was accomplished…by
creating the factor score from two or more tests of qualitatively different
narrow…abilities” (Schrank et al., 2002, p. 6). The result of this revised
theoretical structure led to the inclusion of eight new tests and two significantly
revised tests for the WJ-III, for a total of 20 tests in the complete cognitive battery
(McGrew & Woodcock, 2001). This current incarnation of the Woodcock-
Johnson cognitive battery is considered an operational measurement model of the
CHC theory (Taub & McGrew, 2004).
11
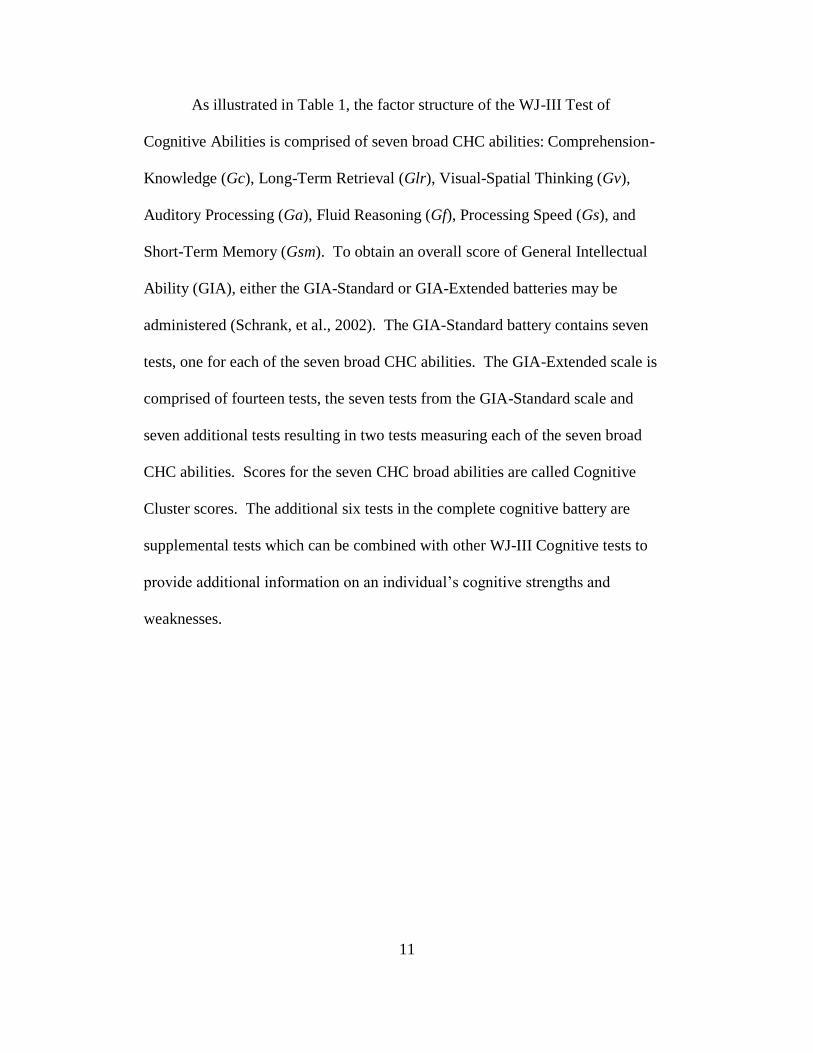
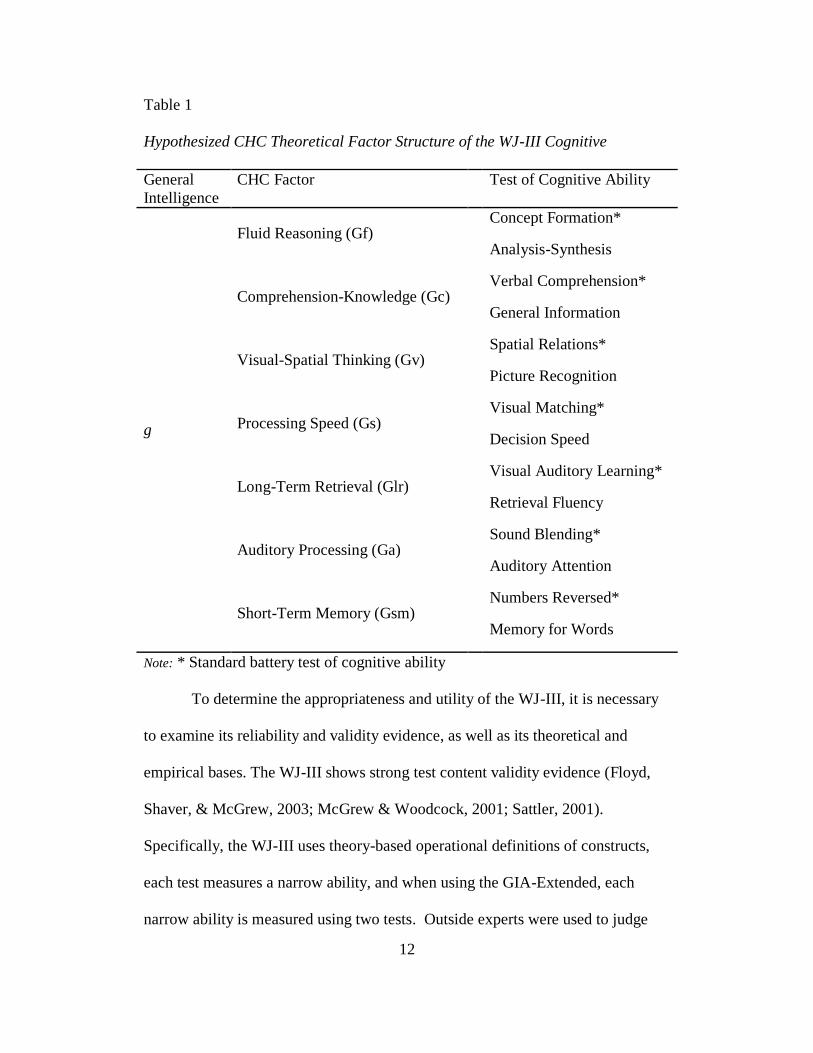
As illustrated in Table 1, the factor structure of the WJ-III Test of
Cognitive Abilities is comprised of seven broad CHC abilities: Comprehension-
Knowledge (Gc), Long-Term Retrieval (Glr), Visual-Spatial Thinking (Gv),
Auditory Processing (Ga), Fluid Reasoning (Gf), Processing Speed (Gs), and
Short-Term Memory (Gsm). To obtain an overall score of General Intellectual
Ability (GIA), either the GIA-Standard or GIA-Extended batteries may be
administered (Schrank, et al., 2002). The GIA-Standard battery contains seven
tests, one for each of the seven broad CHC abilities. The GIA-Extended scale is
comprised of fourteen tests, the seven tests from the GIA-Standard scale and
seven additional tests resulting in two tests measuring each of the seven broad
CHC abilities. Scores for the seven CHC broad abilities are called Cognitive
Cluster scores. The additional six tests in the complete cognitive battery are
supplemental tests which can be combined with other WJ-III Cognitive tests to
provide additional information on an individual’s cognitive strengths and
weaknesses.
12
Table 1
Hypothesized CHC Theoretical Factor Structure of the WJ-III Cognitive
General
Intelligence
CHC Factor Test of Cognitive Ability
g
Fluid Reasoning (Gf) Concept Formation*
Analysis-Synthesis
Comprehension-Knowledge (Gc) Verbal Comprehension*
General Information
Visual-Spatial Thinking (Gv) Spatial Relations*
Picture Recognition
Processing Speed (Gs) Visual Matching*
Decision Speed
Long-Term Retrieval (Glr) Visual Auditory Learning*
Retrieval Fluency
Auditory Processing (Ga) Sound Blending*
Auditory Attention
Short-Term Memory (Gsm) Numbers Reversed*
Memory for Words
Note: * Standard battery test of cognitive ability
To determine the appropriateness and utility of the WJ-III, it is necessary
to examine its reliability and validity evidence, as well as its theoretical and
empirical bases. The WJ-III shows strong test content validity evidence (Floyd,
Shaver, & McGrew, 2003; McGrew & Woodcock, 2001; Sattler, 2001).
Specifically, the WJ-III uses theory-based operational definitions of constructs,
each test measures a narrow ability, and when using the GIA-Extended, each
narrow ability is measured using two tests. Outside experts were used to judge
13
whether the tests adequately measured the construct and were free from bias and
sensitivity issues. Additionally, as research has indicated, g is a critical factor in
measuring intelligence, and some broad abilities have stronger relationships with
g than others: “these research findings of differential relations of broad cognitive
abilities with general intelligence were incorporated via differential weightings of
tests contributing to the GIA-Ext and GIA-Std scores” (McGrew & Woodcock,
2001, p. 20). Adequate response process validity evidence was indicated by the
developers’ logical task analysis of the test stimuli, test requirements, and
responses processes, as well as the removal of construct irrelevant influences
(McGrew & Woodcock, 2001).
The WJ-III Cognitive Technical Manual (McGrew & Woodcock, 2001)
provides evidence based on consequences of testing, reporting that it is useful as a
tool to identify students with learning disabilities based on differences seen in
WJ-III Tests of Cognitive Abilities and WJ-III Tests of Achievement scores.
Reviews of the WJ-III Cognitive support its use in assessing cognitive ability and
predicting academic achievement, as well as its use as a tool in providing
important diagnostic information for identifying students with mental retardation,
giftedness, and ADHD (Floyd et al., 2003; Sattler, 2001). However, much more
empirical evidence is needed in terms of test utility (Sattler, 2001; Schrank &
Flanagan, 2003).
The WJ-III showed acceptable validity evidence based on relation to other
variables (Sattler, 2001). Convergent and discriminant validity evidence
indicated that WJ-III tests measuring similar abilities correlated highly with each
14
other and showed lower correlations with tests measuring different abilities
(McGrew & Woodcock, 2001). For example, WJ-III tests of Gc were highly
intercorrelated (.70 to .80) and showed lower correlations with tests of Gv (.20 to
.40). When compared to other tests of intelligence, such as the WISC-III and the
Stanford-Binet Intelligence Scale-Fourth Edition (Thorndike, Hagen, & Sattler,
1986), the WJ-III composite scores showed high correlations across samples
(.70s), which are comparable to those found with other intelligence batteries
(Floyd et al., 2003; McGrew & Woodcock, 2001). Correlations between WJ-III
composite scores and academic achievement test scores were substantial. For
example, across age groups the WJ-III Cognitive Gc was correlated between .65
and .87 with a measure of reading comprehension and between .57 and .81 with a
measure of math reasoning (McGrew & Woodcock, 2001).
Structural validity of the WJ-III Cognitive. Evidence based on internal
structure, or structural validity, indicates the degree to which the test structure
aligns with the constructs on which it was based (AERA et al., 1999; Messick,
1995). As presented in Table 1, the factor structure of the WJ-III Test of
Cognitive Abilities is based on the CHC theory of intelligence and is designed to
measure seven broad abilities with seven tests in the GIA-Standard battery and
fourteen tests in the GIA-Extended battery (Schrank et al., 2002).
Structural analyses, via confirmatory factor analyses (CFA), were
conducted using the factor structures derived from the norm samples of the
WJPEB and the WJ-R. Preliminary CFAs reported in the WJ-III Technical
Manual (McGrew & Woodcock, 2001) and conducted during data collection for
15
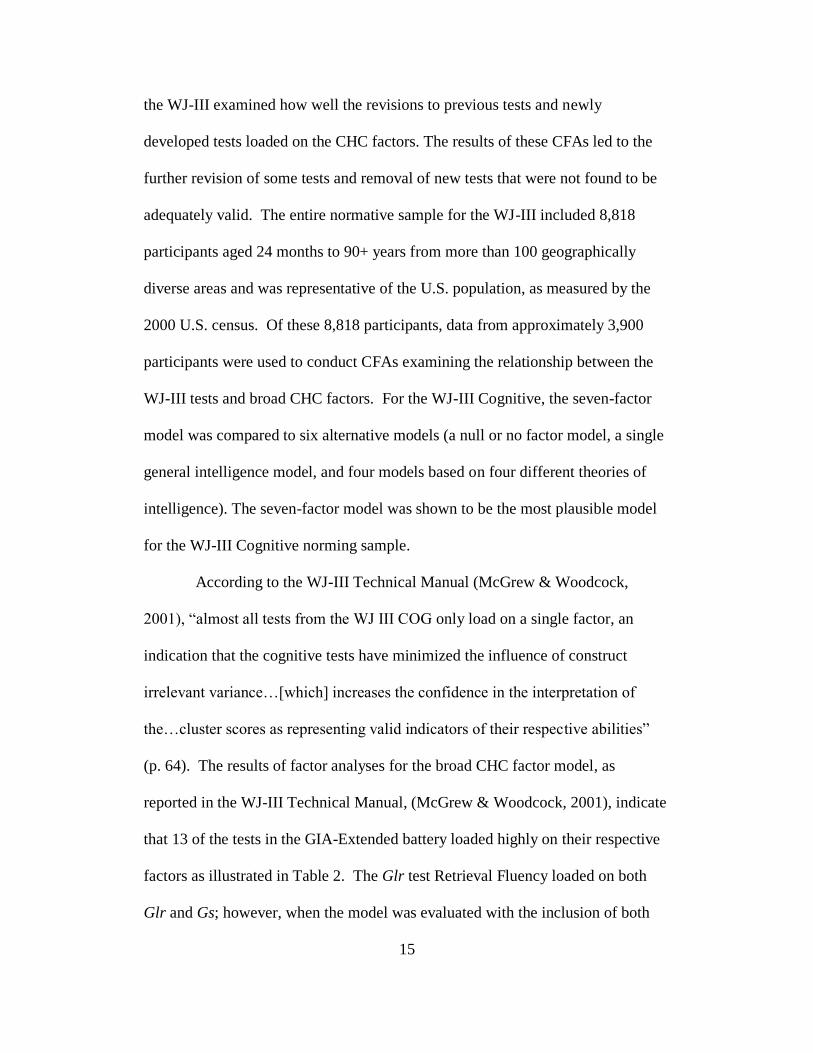
the WJ-III examined how well the revisions to previous tests and newly
developed tests loaded on the CHC factors. The results of these CFAs led to the
further revision of some tests and removal of new tests that were not found to be
adequately valid. The entire normative sample for the WJ-III included 8,818
participants aged 24 months to 90+ years from more than 100 geographically
diverse areas and was representative of the U.S. population, as measured by the
2000 U.S. census. Of these 8,818 participants, data from approximately 3,900
participants were used to conduct CFAs examining the relationship between the
WJ-III tests and broad CHC factors. For the WJ-III Cognitive, the seven-factor
model was compared to six alternative models (a null or no factor model, a single
general intelligence model, and four models based on four different theories of
intelligence). The seven-factor model was shown to be the most plausible model
for the WJ-III Cognitive norming sample.
According to the WJ-III Technical Manual (McGrew & Woodcock,
2001), “almost all tests from the WJ III COG only load on a single factor, an
indication that the cognitive tests have minimized the influence of construct
irrelevant variance…[which] increases the confidence in the interpretation of
the…cluster scores as representing valid indicators of their respective abilities”
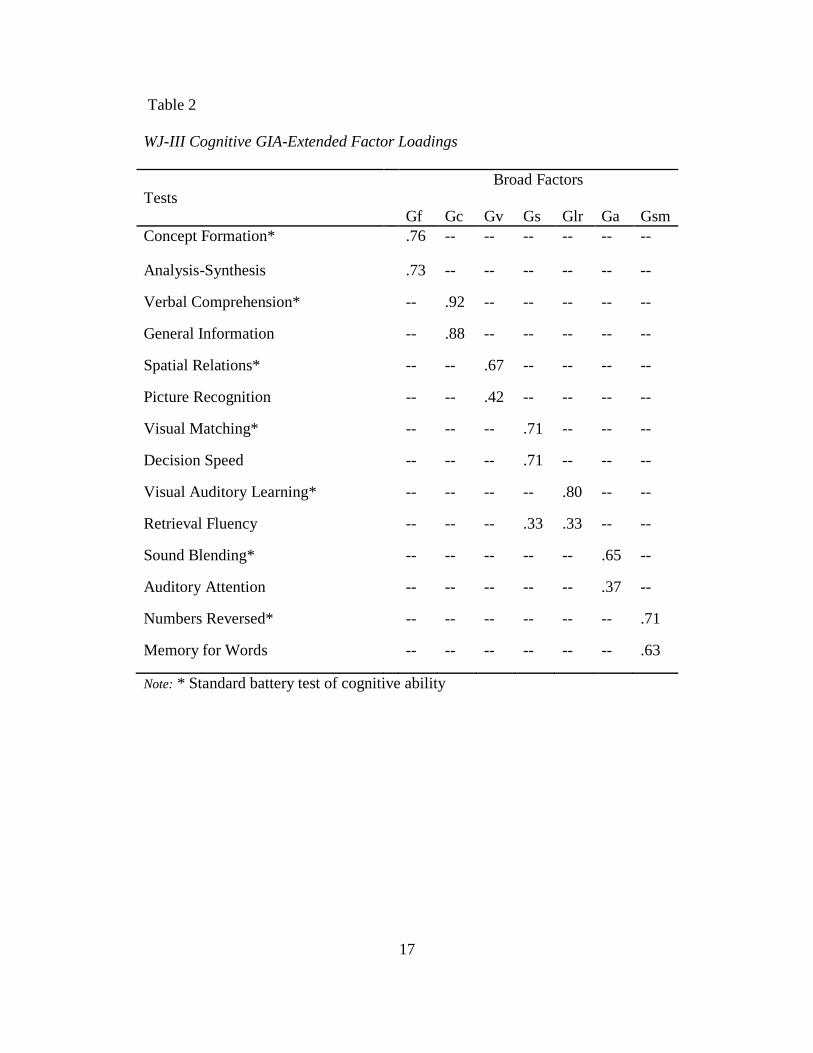
(p. 64). The results of factor analyses for the broad CHC factor model, as
reported in the WJ-III Technical Manual, (McGrew & Woodcock, 2001), indicate
that 13 of the tests in the GIA-Extended battery loaded highly on their respective
factors as illustrated in Table 2. The Glr test Retrieval Fluency loaded on both
Glr and Gs; however, when the model was evaluated with the inclusion of both
16
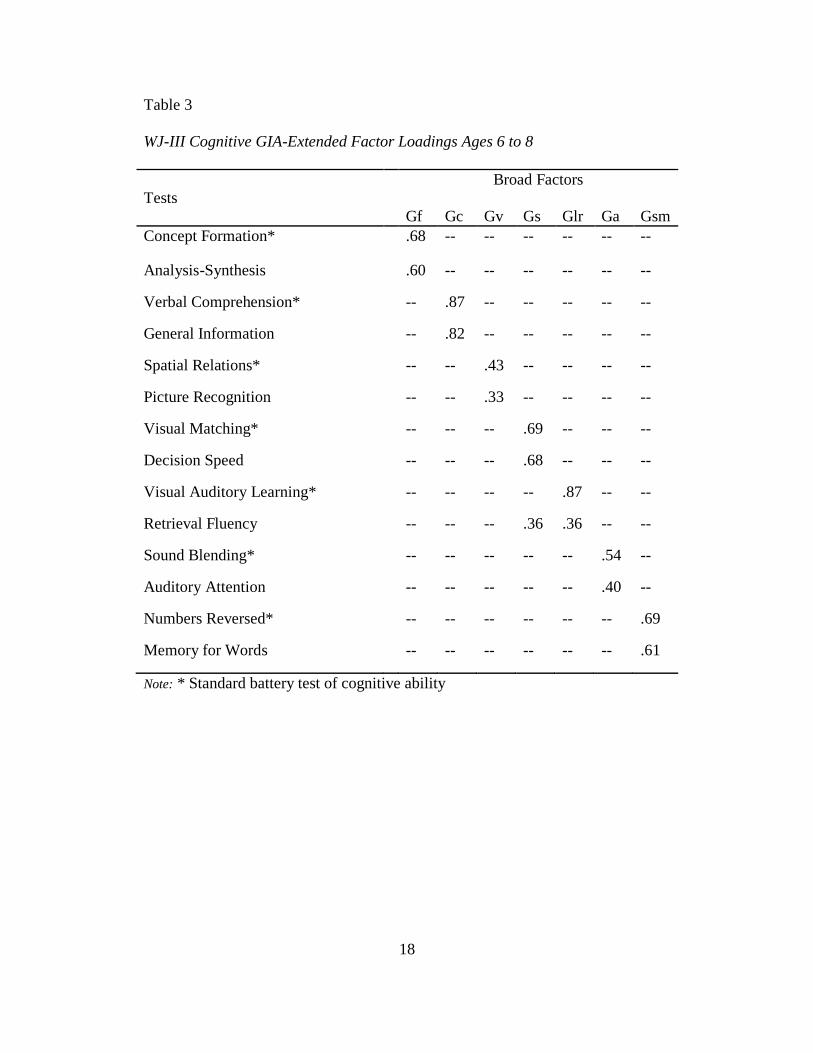
broad and narrow abilities, factor loadings indicated Retrieval Fluency to be
primarily a measure of the Glr narrow ability Naming Facility (.64). The results
of Confirmatory Factor Analyses for the CHC broad factor model, as reported in
the WJ-III Technical Manual (McGrew & Woodcock, 2001) are shown in Table 3
for ages 6 to 8 and Table 4 for ages 9 to 13.
17
Table 2
WJ-III Cognitive GIA-Extended Factor Loadings
Broad Factors
Tests
Gf
Gc
Gv
Gs
Glr
Ga
Gsm
Concept Formation* .76 -- -- -- -- -- --
Analysis-Synthesis .73 -- -- -- -- -- --
Verbal Comprehension* -- .92 -- -- -- -- --
General Information -- .88 -- -- -- -- --
Spatial Relations* -- -- .67 -- -- -- --
Picture Recognition -- -- .42 -- -- -- --
Visual Matching* -- -- -- .71 -- -- --
Decision Speed -- -- -- .71 -- -- --
Visual Auditory Learning* -- -- -- -- .80 -- --
Retrieval Fluency -- -- -- .33 .33 -- --
Sound Blending* -- -- -- -- -- .65 --
Auditory Attention -- -- -- -- -- .37 --
Numbers Reversed* -- -- -- -- -- -- .71
Memory for Words -- -- -- -- -- -- .63
Note: * Standard battery test of cognitive ability
18
Table 3
WJ-III Cognitive GIA-Extended Factor Loadings Ages 6 to 8
Broad Factors
Tests
Gf
Gc
Gv
Gs
Glr
Ga
Gsm
Concept Formation* .68 -- -- -- -- -- --
Analysis-Synthesis .60 -- -- -- -- -- --
Verbal Comprehension* -- .87 -- -- -- -- --
General Information -- .82 -- -- -- -- --
Spatial Relations* -- -- .43 -- -- -- --
Picture Recognition -- -- .33 -- -- -- --
Visual Matching* -- -- -- .69 -- -- --
Decision Speed -- -- -- .68 -- -- --
Visual Auditory Learning* -- -- -- -- .87 -- --
Retrieval Fluency -- -- -- .36 .36 -- --
Sound Blending* -- -- -- -- -- .54 --
Auditory Attention -- -- -- -- -- .40 --
Numbers Reversed* -- -- -- -- -- -- .69
Memory for Words -- -- -- -- -- -- .61
Note: * Standard battery test of cognitive ability
19
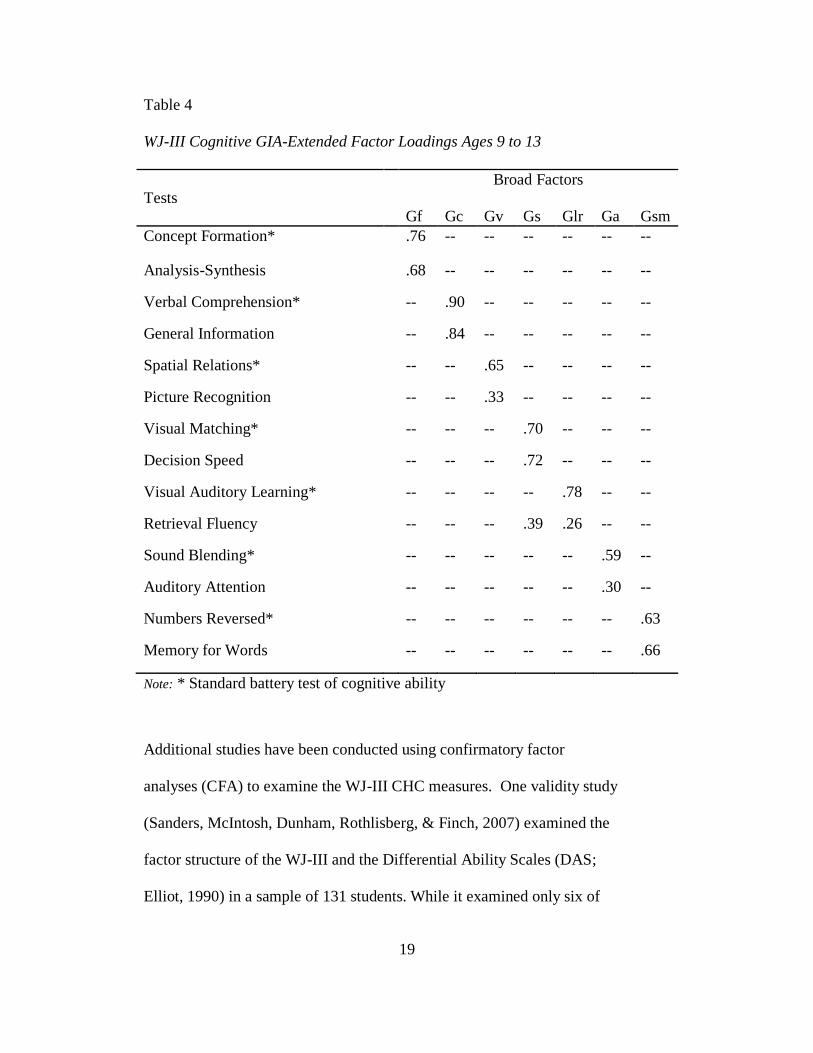
Table 4
WJ-III Cognitive GIA-Extended Factor Loadings Ages 9 to 13
Broad Factors
Tests
Gf
Gc
Gv
Gs
Glr
Ga
Gsm
Concept Formation* .76 -- -- -- -- -- --
Analysis-Synthesis .68 -- -- -- -- -- --
Verbal Comprehension* -- .90 -- -- -- -- --
General Information -- .84 -- -- -- -- --
Spatial Relations* -- -- .65 -- -- -- --
Picture Recognition -- -- .33 -- -- -- --
Visual Matching* -- -- -- .70 -- -- --
Decision Speed -- -- -- .72 -- -- --
Visual Auditory Learning* -- -- -- -- .78 -- --
Retrieval Fluency -- -- -- .39 .26 -- --
Sound Blending* -- -- -- -- -- .59 --
Auditory Attention -- -- -- -- -- .30 --
Numbers Reversed* -- -- -- -- -- -- .63
Memory for Words -- -- -- -- -- -- .66
Note: * Standard battery test of cognitive ability
Additional studies have been conducted using confirmatory factor
analyses (CFA) to examine the WJ-III CHC measures. One validity study
(Sanders, McIntosh, Dunham, Rothlisberg, & Finch, 2007) examined the
factor structure of the WJ-III and the Differential Ability Scales (DAS;
Elliot, 1990) in a sample of 131 students. While it examined only six of
20
the seven WJ-III Cognitive broad abilities (Ga was not included as it is not
assessed by the DAS) and did not include two WJ-III tests for every broad
ability, the results indicated each WJ-III test loaded on its respective broad
ability factor.
Simultaneous factor analyses conducted by Phelps, McGrew, Knopik, and
Ford (2005) investigated the CHC broad and narrow ability classifications of the
WJ-III and the WISC-III using two models: a CHC broad factor simultaneous
factor analysis and a CHC CFA simultaneous factor analysis that included CHC
narrow ability classifications. Using 148 randomly selected third to fifth grade
students from the WJ-III standardization sample, results indicated that all tests
except two loaded on their respective factors in both models. The Gv test of
Picture Recognition was not included due to the small sample-to-variable ratio;
the Glr test of Retrieval Fluency loaded on Glr in the model including narrow
abilities and on Gc in the broad ability model. This may have been due to the
small sample size, or it may indicate the Retrieval Fluency test is influenced by
knowledge (Gc). Similarly, in a study of the sex differences across ages in latent
cognitive abilities measured by the WJ-III Cognitive, results indicated all WJ-III
Cognitive tests loaded on the respective abilities except the Glr test of Retrieval
Fluency which showed cross-loadings with other factors (Keith, Reynolds, Patel,
& Ridley, 2008). As several studies have found that Retrieval Fluency cross-
loads with other factors, this may indicate further studies need to be done on this
test (Keith et al., 2008; McGrew & Woodcock, 2001; Phelps et al., 2005).
21
Little research has been conducted on the factor structure of the WJ-III
Cognitive using the 14 tests of the GIA-Extended battery. One exception was a
study by Taub and McGrew (2004), an author of the WJ-III Cognitive, that
investigated the invariance of the factor structure presented in the WJ-III technical
manual, using the WJ-III standardization sample across five age groups.
Configural invariance of the first- and second-order factors supported the seven
factor structure in five different age groups. Metric invariance indicated the seven
factor structure was invariant across age groups; the 14 tests were found to have
identical factor loadings on the seven broad ability factors. Another study (Floyd,
McGrew, Barry, Rafael, & Rogers, 2009) used the 14 tests of the WJ-III
Cognitive GIA-Extended battery to examine specificity estimates of the broad
ability composite scores and their g loadings at seven age levels. Using a large
subsample (n = 3,577) of the WJ-III normative sample, the authors used principal
factor analysis to obtain g loadings for each factor cluster, then obtained
specificity estimates for each factor cluster at each age level. Results indicated
the broad abilities Glr, Gf, and Gc appeared to be primarily measures of g across
age levels. The broad abilities Gv, Ga, and Gs were found to be primarily
measures of specific abilities; Gsm demonstrated sizable specificity effects at only
two age levels. Overall, studies conducted using the WJ-III standardization
sample show support for the seven-factor model (Floyd et al., 2009; McGrew &
Woodcock, 2001; Phelps et al., 2005; Sanders et al., 2007; Taub & McGrew,
2004).
22
Current Study
As high-stakes decisions are made based on the results of intelligence
tests, it is critical to establish internal structural validity evidence of tests to ensure
the constructs the test is intended to measure are indeed measured in the
populations on which these tests are used (AERA et al., 1999). Although the
WISC-IV (Wechsler, 2003a) is currently the most popular cognitive ability test, it
was not developed using modern conceptualizations of intelligence (Kamphaus,
Petoskey, & Rowe, 2000; Kaufman et al., 2006). In contrast, the WJ-III
(McGrew & Woodcock, 2001) was developed using the CHC theory of
intelligence and its seven-factor structure has been supported in several studies
using the WJ-III standardization sample. However, there is a lack of structural
validity evidence using a referred sample (Floyd et al., 2009; McGrew &
Woodcock, 2001; Phelps et al., 2005; Sanders et al., 2007; Taub & McGrew,
2004). Although the WJ-III Technical Manual (McGrew & Woodcock, 2001)
provided extensive data using factor analysis for special study samples
(preschool, ADHD, learning disabled, and across age groups) that supported the
seven-factor structure, these studies included additional tests, more than those
included in the GIA-Standard and GIA-Extended battery. Thus, factor analyses
presented in the Technical Manual may not reflect test administration as actually
performed by practitioners (Taub & McGrew, 2004).
Establishing the validity of the structure of the WJ-III in a referred sample
can provide further support for its use in samples that may show different patterns
of performance (Bodin et al., 2009; Strauss, Spreen, & Hunter, 2000) which may
23
not be reflected in the WJ-III normative sample as it was not reported how many
of the individuals in the normative sample received, or were eligible for, special
education services. Additionally, “the value of a given model can be greatly
enhanced if it can be replicated in new samples” (Raykov & Marcoulides, 2000,
p. 40). If the model cannot be replicated, this indicates a lack of structural
validity evidence for the model’s use in a referred sample and may lead to
inappropriate interpretation of an individual’s test scores, as well as inappropriate
actions being taken based on those scores (Messick, 1995). Consequently, this
study will examine to what extent the WJ-III Cognitive structure established in
the normative sample is replicated in a clinical sample of students referred for
special education.
24
Chapter 2
METHOD
Participants
The 529 participants in this study were 6 to 13 years of age (M = 9.47, SD
= 1.81). Of the 528 participants whose gender was specified, 62% were male and
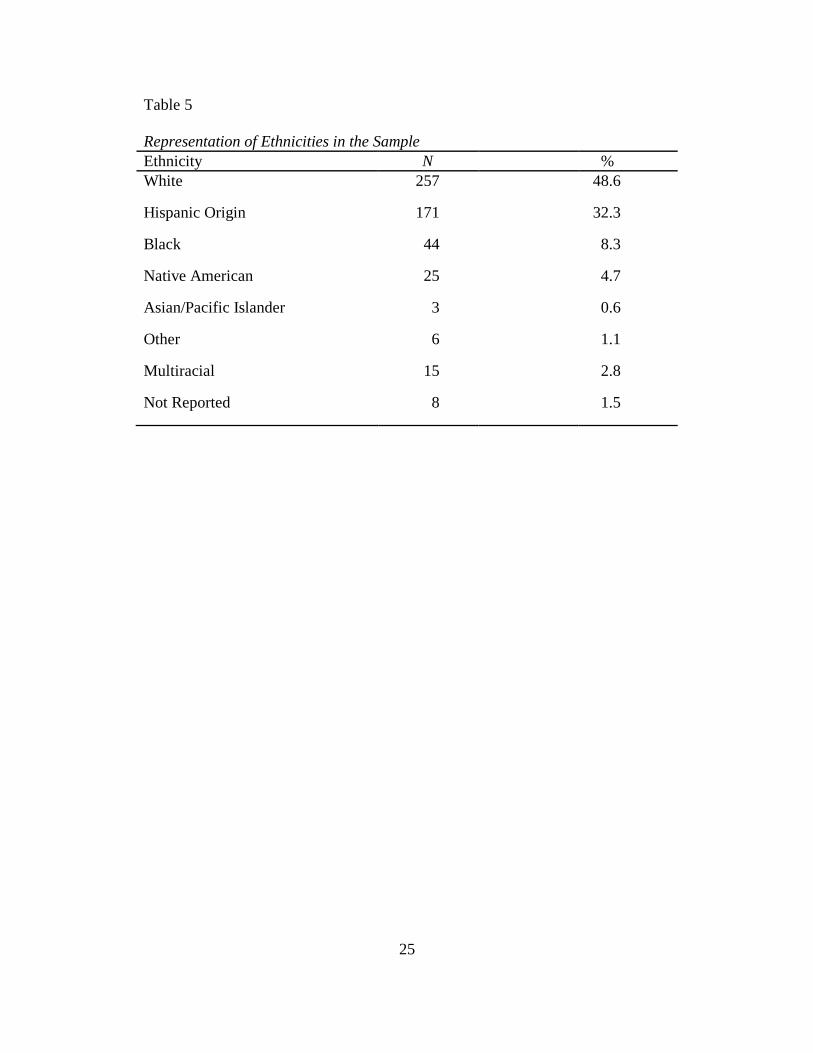
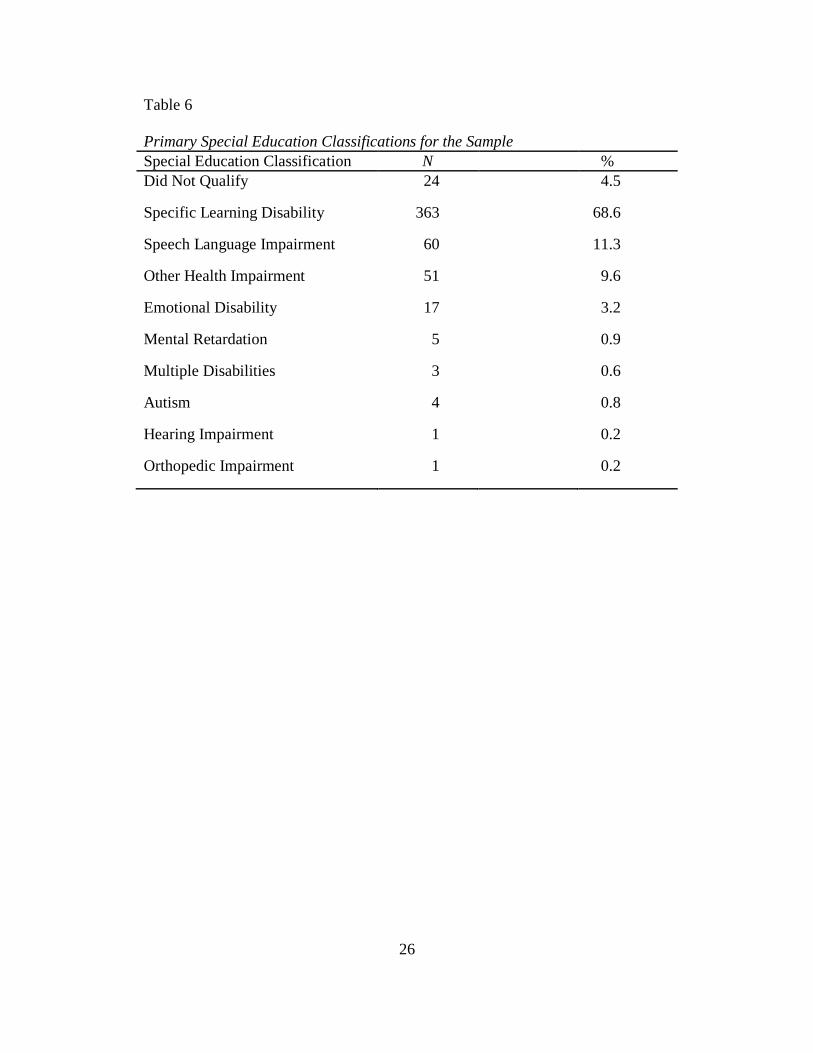
38% were female. Table 5 presents the frequencies and percentages of ethnicities
in the sample and Table 6 presents the frequencies and percentages of special
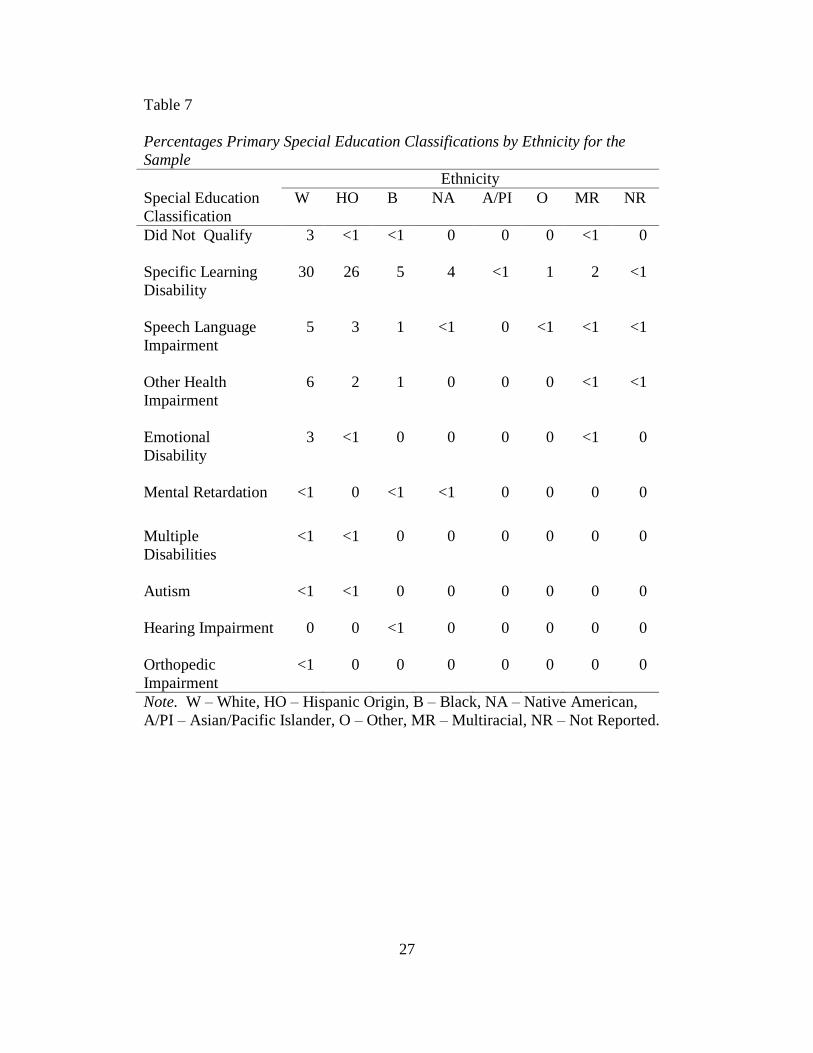
education classifications in the sample. Table 7 presents the percentages of
special education classifications by ethnicities in the sample.
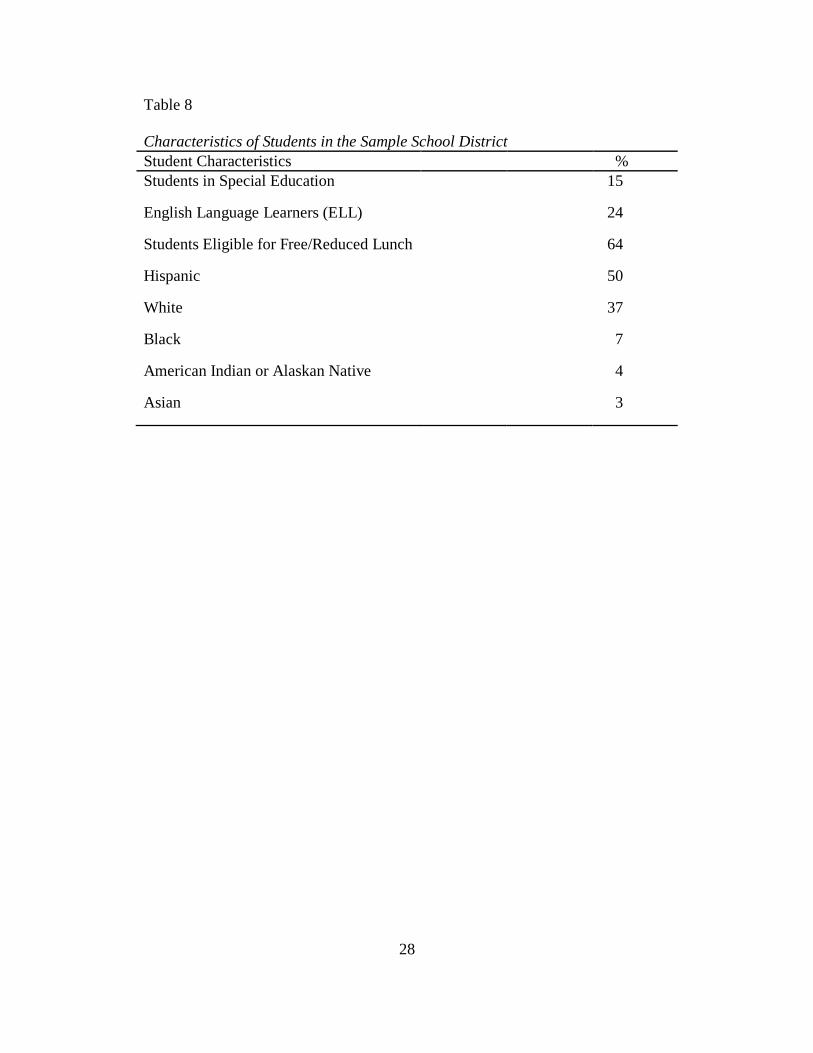
Information about student characteristics and academic achievement
within the participating school district, as reported by the Arizona Department of
Education (AZDE) and the National Center for Educational Statistics (NCES), is
presented in Tables 8 and 9.
25
Table 5
Representation of Ethnicities in the Sample
Ethnicity N %
White 257 48.6
Hispanic Origin 171 32.3
Black 44 8.3
Native American 25 4.7
Asian/Pacific Islander 3 0.6
Other 6 1.1
Multiracial 15 2.8
Not Reported 8 1.5
26
Table 6
Primary Special Education Classifications for the Sample
Special Education Classification N %
Did Not Qualify 24 4.5
Specific Learning Disability 363 68.6
Speech Language Impairment 60 11.3
Other Health Impairment 51 9.6
Emotional Disability 17 3.2
Mental Retardation 5 0.9
Multiple Disabilities 3 0.6
Autism 4 0.8
Hearing Impairment 1 0.2
Orthopedic Impairment 1 0.2
27
Table 7
Percentages Primary Special Education Classifications by Ethnicity for the
Sample
Ethnicity
Special Education
Classification
W HO B NA A/PI O MR NR
Did Not Qualify
3 <1 <1 0 0 0 <1 0
Specific Learning
Disability
30 26 5 4 <1 1 2 <1
Speech Language
Impairment
5 3 1 <1 0 <1 <1 <1
Other Health
Impairment
6 2 1 0 0 0 <1 <1
Emotional
Disability
3 <1 0 0 0 0 <1 0
Mental Retardation
<1 0 <1 <1 0 0 0 0
Multiple
Disabilities
<1 <1 0 0 0 0 0 0
Autism
<1 <1 0 0 0 0 0 0
Hearing Impairment
0 0 <1 0 0 0 0 0
Orthopedic
Impairment
<1 0 0 0 0 0 0 0
Note. W – White, HO – Hispanic Origin, B – Black, NA – Native American,
A/PI – Asian/Pacific Islander, O – Other, MR – Multiracial, NR – Not Reported.
28
Table 8
Characteristics of Students in the Sample School District
Student Characteristics %
Students in Special Education 15
English Language Learners (ELL) 24
Students Eligible for Free/Reduced Lunch 64
Hispanic 50
White 37
Black 7
American Indian or Alaskan Native 4
Asian 3
29
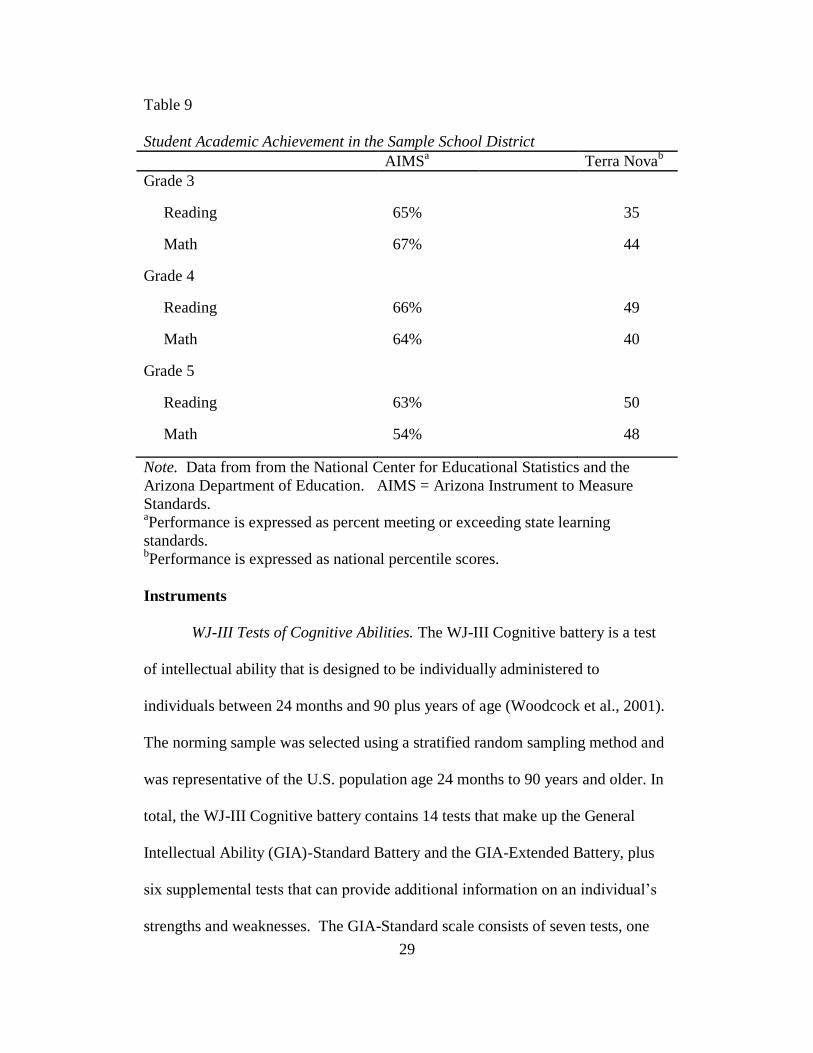
Table 9
Student Academic Achievement in the Sample School District
AIMSa Terra Nova
b
Grade 3
Reading 65% 35
Math 67% 44
Grade 4
Reading 66% 49
Math 64% 40
Grade 5
Reading 63% 50
Math 54% 48
Note. Data from from the National Center for Educational Statistics and the
Arizona Department of Education. AIMS = Arizona Instrument to Measure
Standards. aPerformance is expressed as percent meeting or exceeding state learning
standards. bPerformance is expressed as national percentile scores.
Instruments
WJ-III Tests of Cognitive Abilities. The WJ-III Cognitive battery is a test
of intellectual ability that is designed to be individually administered to
individuals between 24 months and 90 plus years of age (Woodcock et al., 2001).
The norming sample was selected using a stratified random sampling method and
was representative of the U.S. population age 24 months to 90 years and older. In
total, the WJ-III Cognitive battery contains 14 tests that make up the General
Intellectual Ability (GIA)-Standard Battery and the GIA-Extended Battery, plus
six supplemental tests that can provide additional information on an individual’s
strengths and weaknesses. The GIA-Standard scale consists of seven tests, one
30
for each of the broad CHC abilities. The GIA-Extended scale is comprised of
fourteen tests, the seven tests from the GIA-Standard scale, and seven additional
tests resulting in two tests for each of the seven broad CHC abilities, giving seven
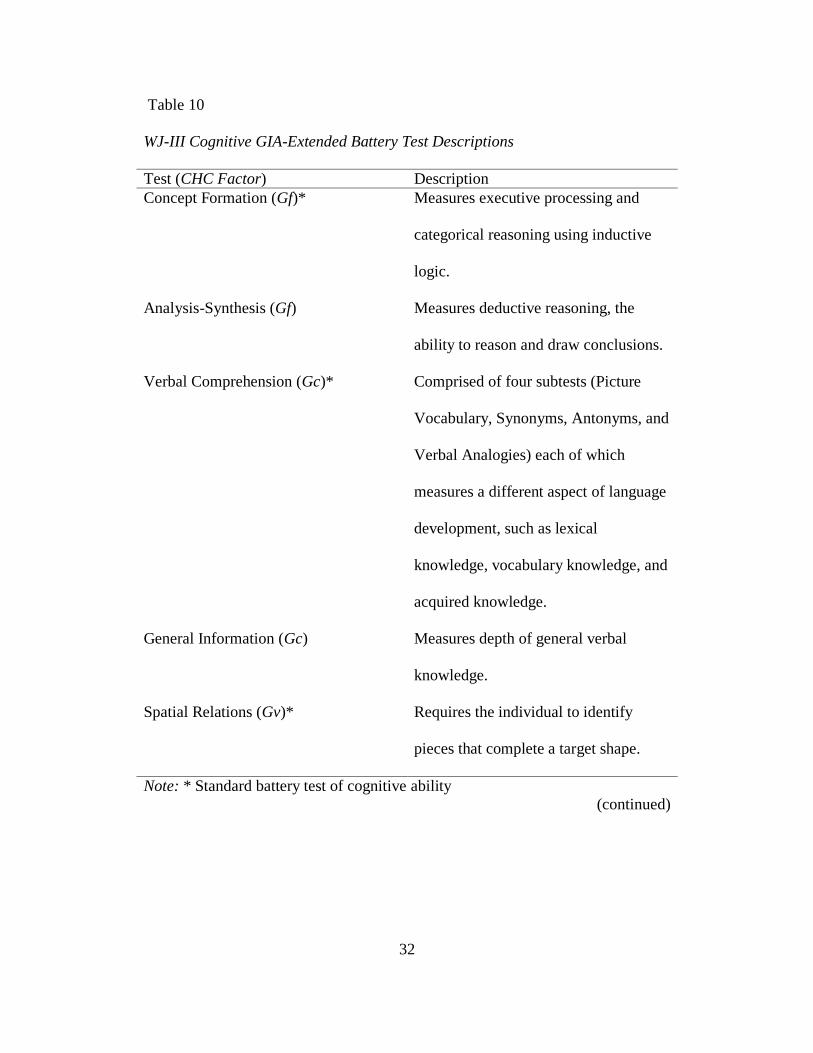
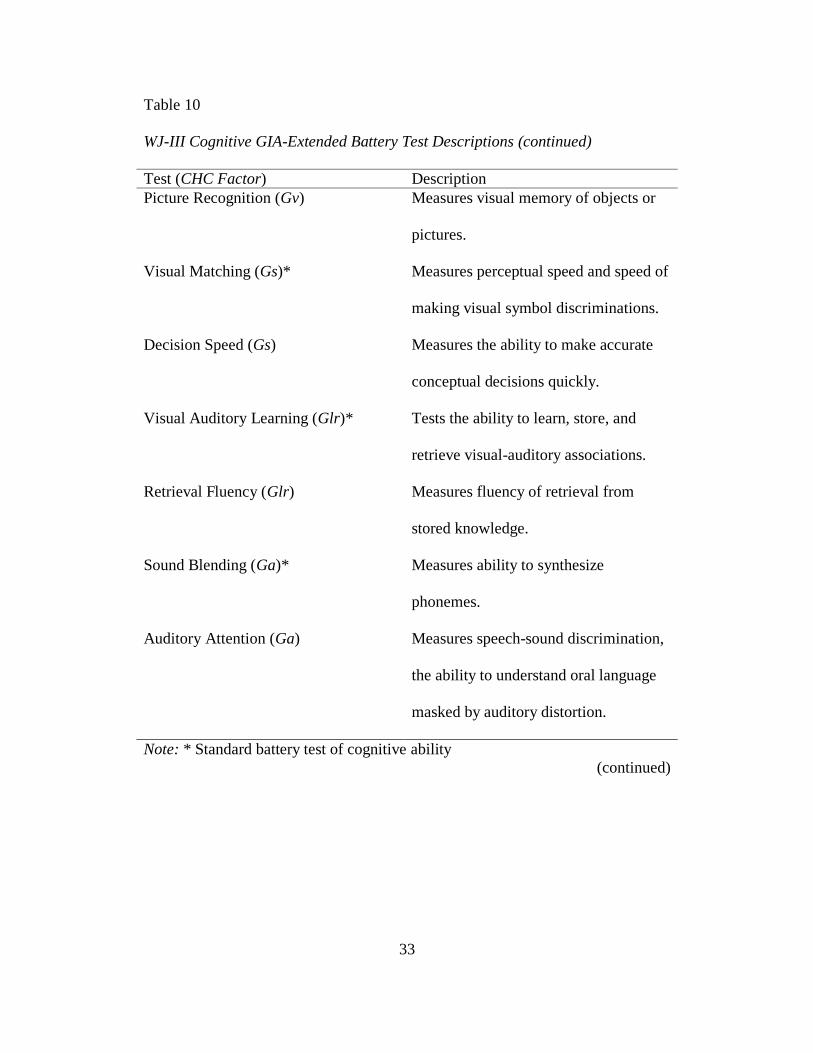
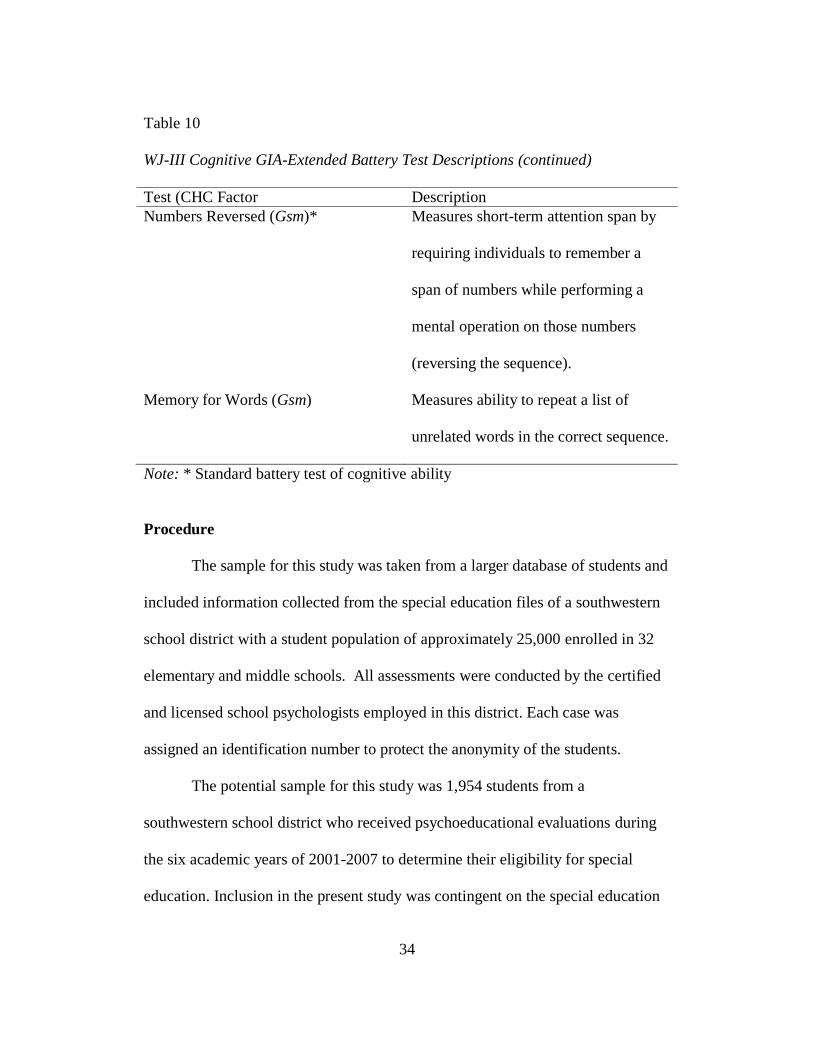
cognitive cluster scores (one cluster score for each CHC ability). Table 10
provides a summary of the 14 tests used in this study that measure the seven CHC
factors in the standard and extended batteries (Woodcock et al., 2001, p. 11-15).
Additionally, the WJ III Cognitive battery provides three cognitive
performance cluster scores that measure broad categories of cognitive abilities
(Verbal Ability, Thinking Ability, and Cognitive Efficiency), a general
intellectual ability score that represents g and accounts for the most variance in
overall performance, and a brief intellectual ability score that consists of three
tests (Verbal Comprehension, Concept Formation, and Visual Matching) and is
used for screening purposes. The WJ-III Tests of Cognitive Ability have a
standard score of 100 and a standard deviation of 15.
Woodcock et al.(2001) reported reliability coefficients, estimated by the
split-half procedure, for the tests of cognitive ability as being between .60 and .96,
with the majority of test reliabilities falling at .80 or higher. Tests of concurrent
validity for the WJ-III cognitive Verbal Ability cluster, compared to the Stanford
Binet-IV measure of Verbal Reasoning and the WISC-III measure of Verbal
Comprehension, were reported at .65 and .78, respectively. Concurrent validity
studies between the WJ-III achievement broad reading and basic reading clusters
and the WIAT reading composite and basic reading measures were reported at .67
and .82, respectively. Factor analytic studies indicated the WJ-III clusters closely
31
aligned with the CHC factor model. Studies conducted with students with
learning disabilities indicated support for using the WJ-III as a tool for diagnosing
students with learning disabilities (Woodcock et al., 2001).
32
Table 10
WJ-III Cognitive GIA-Extended Battery Test Descriptions
Test (CHC Factor) Description
Concept Formation (Gf)* Measures executive processing and
categorical reasoning using inductive
logic.
Analysis-Synthesis (Gf) Measures deductive reasoning, the
ability to reason and draw conclusions.
Verbal Comprehension (Gc)* Comprised of four subtests (Picture
Vocabulary, Synonyms, Antonyms, and
Verbal Analogies) each of which
measures a different aspect of language
development, such as lexical
knowledge, vocabulary knowledge, and
acquired knowledge.
General Information (Gc) Measures depth of general verbal
knowledge.
Spatial Relations (Gv)* Requires the individual to identify
pieces that complete a target shape.
Note: * Standard battery test of cognitive ability
(continued)
33
Table 10
WJ-III Cognitive GIA-Extended Battery Test Descriptions (continued)
Test (CHC Factor) Description
Picture Recognition (Gv) Measures visual memory of objects or
pictures.
Visual Matching (Gs)* Measures perceptual speed and speed of
making visual symbol discriminations.
Decision Speed (Gs) Measures the ability to make accurate
conceptual decisions quickly.
Visual Auditory Learning (Glr)* Tests the ability to learn, store, and
retrieve visual-auditory associations.
Retrieval Fluency (Glr) Measures fluency of retrieval from
stored knowledge.
Sound Blending (Ga)* Measures ability to synthesize
phonemes.
Auditory Attention (Ga) Measures speech-sound discrimination,
the ability to understand oral language
masked by auditory distortion.
Note: * Standard battery test of cognitive ability
(continued)
34
Table 10
WJ-III Cognitive GIA-Extended Battery Test Descriptions (continued)
Test (CHC Factor Description
Numbers Reversed (Gsm)* Measures short-term attention span by
requiring individuals to remember a
span of numbers while performing a
mental operation on those numbers
(reversing the sequence).
Memory for Words (Gsm) Measures ability to repeat a list of
unrelated words in the correct sequence.
Note: * Standard battery test of cognitive ability
Procedure
The sample for this study was taken from a larger database of students and
included information collected from the special education files of a southwestern
school district with a student population of approximately 25,000 enrolled in 32
elementary and middle schools. All assessments were conducted by the certified
and licensed school psychologists employed in this district. Each case was
assigned an identification number to protect the anonymity of the students.
The potential sample for this study was 1,954 students from a
southwestern school district who received psychoeducational evaluations during
the six academic years of 2001-2007 to determine their eligibility for special
education. Inclusion in the present study was contingent on the special education
35
record including a score for each of the 14 WJ-III Cognitive tests included in the
GIA-Extended battery (McGrew & Woodcock, 2001) and a reported age of 6 to
13 years. A total of 529 cases met this criterion.
Data Analyses
In cases where the goal of analysis is testing factor structure based on an
existing theory, confirmatory factor analysis (CFA) is typically employed (Keith,
2005; Meyers, Gamst, & Guarino, 2006). However, Carroll (1993, 1995) and
others (Browne, 2001; Goldberg & Velicer, 2006; Gorsuch, 2003) also
recommended using exploratory factor analysis for studying structural validity.
An advantage of using EFA is that it describes the observed associations between
the variables in an underlying factor structure without being restricted by a priori
hypotheses, and EFA allows for variables to load on more than one factor
(Gorsuch, 2003). This method of allowing for variables to load on multiple
factors is not unique to EFA; however, it is the technique Carroll employed when
creating his structural model, the theoretical basis of the WJ-III.
CFA, alternatively, tests an a priori hypothesis of the factor structure and
typically assumes simple structure with zero cross-loadings (Brown, 2006; Saas &
Schmitt, 2010). By limiting factors to load on one factor, the factor
intercorrelations may be inflated if each variable is not a pure measure of each
factor and the factors may be distorted (Asparouhov & Muthen, 2009).
Additionally, “repeated discoveries of the same factor structure derived from
exploratory techniques [across independent samples] provide stronger evidence
36
for that structure than would be provided by the same number of confirmatory
factor analyses” (Goldberg & Velicer, 2006, p. 233).
Replicatory factor analysis (Ben-Porath, 1990) is a cross-validation
technique using exploratory factor analysis to examine whether the factor
structure found in an instrument’s large normative sample is replicated in other
populations on whom the measure will be used (Butcher, 1985). In this procedure,
a representative sample of the group with whom the instrument is to be
adopted completes the assessment instrument; the data is then factor
analyzed using the same EFA techniques for extraction, estimation of
communalities, and rotation, as were used in the original development and
validation of the instrument. In this new analysis, the number of factors
extracted is constrained to the number of factions identified in the research
with the instrument in its culture of origin (Allen & Walsh, 2000, p. 70).
Following these recommendations, a replicatory exploratory factor analysis was
conducted to determine if the first-order factor structure in the referred sample is
similar to the structure found in the WJ-III normative sample.
In the development of the WJ-III (McGrew & Woodcock, 2001), the
internal factor structure analyses were based on the exploratory and confirmatory
analyses of the WJPEB (Woodcock & Johnson, 1977) and WJ-R (Woodcock &
Johnson, 1989) norm data. As the previously validated broad ability Gf-Gc theory
provided the structure for the WJ-R, and the CHC theory utilized in the structure
of the WJ-III was derived from the Gf-Gc theory, internal structure validity
evidence for the WJ-III was collected using primarily CFAs. Thus, an
37
exploratory factor analysis, using the correlation coefficients from the normative
data in the WJ-III Technical Manual (McGrew & Woodcock, 2001) for the
primary school-age sample, ages 6 to 13, was conducted for the purposes of this
study (see Table 11).
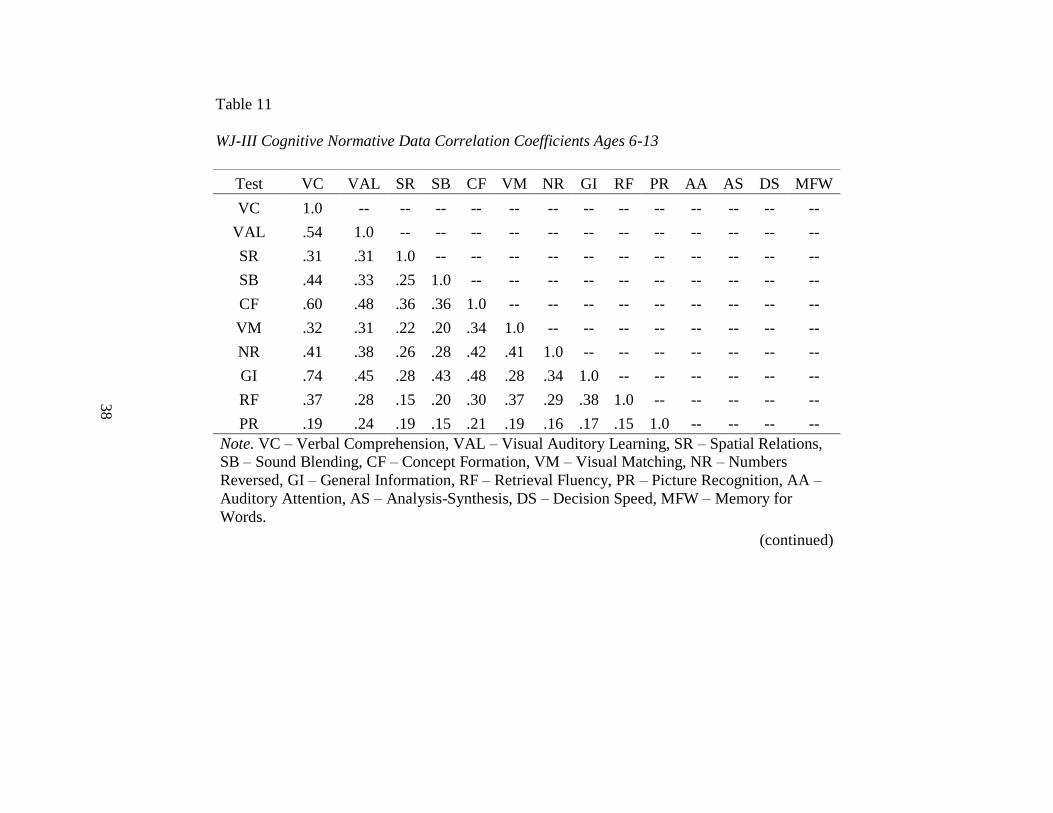
Table 11
WJ-III Cognitive Normative Data Correlation Coefficients Ages 6-13
Test VC VAL SR SB CF VM NR GI RF PR AA AS DS MFW
VC 1.0 -- -- -- -- -- -- -- -- -- -- -- -- --
VAL .54 1.0 -- -- -- -- -- -- -- -- -- -- -- --
SR .31 .31 1.0 -- -- -- -- -- -- -- -- -- -- --
SB .44 .33 .25 1.0 -- -- -- -- -- -- -- -- -- --
CF .60 .48 .36 .36 1.0 -- -- -- -- -- -- -- -- --
VM .32 .31 .22 .20 .34 1.0 -- -- -- -- -- -- -- --
NR .41 .38 .26 .28 .42 .41 1.0 -- -- -- -- -- -- --
GI .74 .45 .28 .43 .48 .28 .34 1.0 -- -- -- -- -- --
RF .37 .28 .15 .20 .30 .37 .29 .38 1.0 -- -- -- -- --
PR .19 .24 .19 .15 .21 .19 .16 .17 .15 1.0 -- -- -- --
Note. VC – Verbal Comprehension, VAL – Visual Auditory Learning, SR – Spatial Relations, SB – Sound Blending, CF – Concept Formation, VM – Visual Matching, NR – Numbers
Reversed, GI – General Information, RF – Retrieval Fluency, PR – Picture Recognition, AA –
Auditory Attention, AS – Analysis-Synthesis, DS – Decision Speed, MFW – Memory for
Words.
(continued)
38
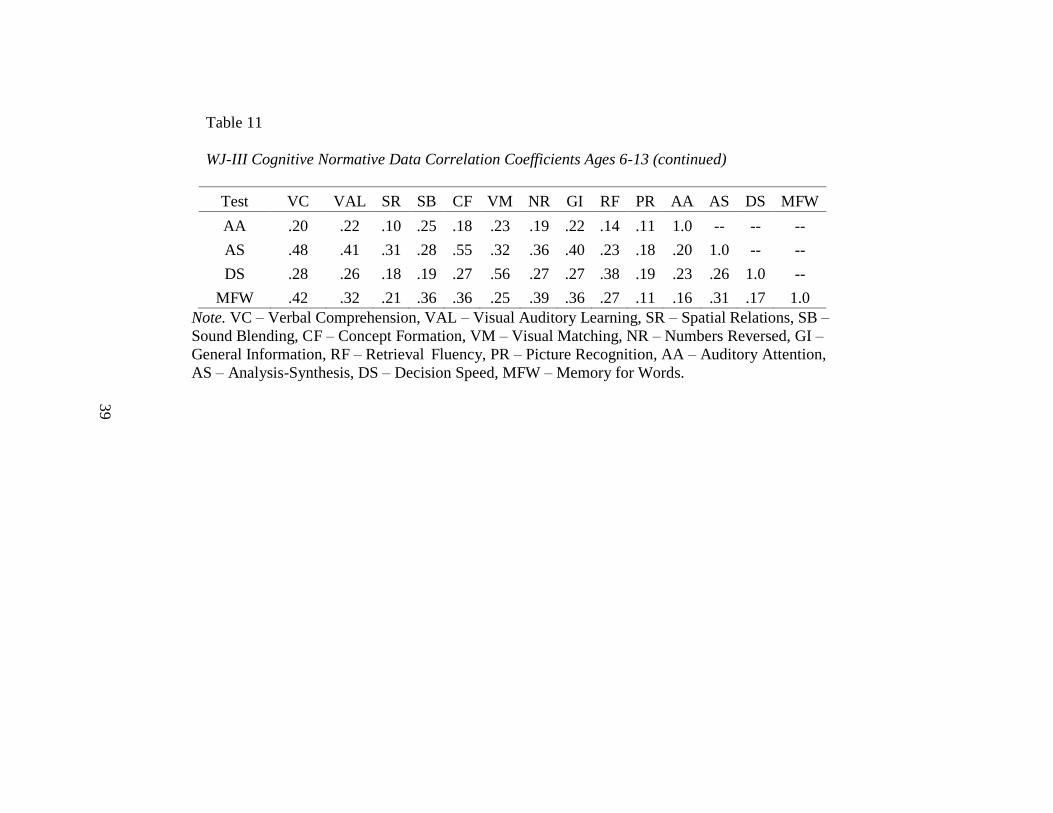
Table 11
WJ-III Cognitive Normative Data Correlation Coefficients Ages 6-13 (continued)
Test VC VAL SR SB CF VM NR GI RF PR AA AS DS MFW
AA .20 .22 .10 .25 .18 .23 .19 .22 .14 .11 1.0 -- -- --
AS .48 .41 .31 .28 .55 .32 .36 .40 .23 .18 .20 1.0 -- --
DS .28 .26 .18 .19 .27 .56 .27 .27 .38 .19 .23 .26 1.0 --
MFW .42 .32 .21 .36 .36 .25 .39 .36 .27 .11 .16 .31 .17 1.0
Note. VC – Verbal Comprehension, VAL – Visual Auditory Learning, SR – Spatial Relations, SB –
Sound Blending, CF – Concept Formation, VM – Visual Matching, NR – Numbers Reversed, GI –
General Information, RF – Retrieval Fluency, PR – Picture Recognition, AA – Auditory Attention,
AS – Analysis-Synthesis, DS – Decision Speed, MFW – Memory for Words.
39
40
The exploratory factor analysis of the WJ-III normative data was
conducted using the principal axis method for factor extraction, which explicitly
focuses on common variance among the measures (Henson & Roberts, 2006).
Seven factors will be extracted in accordance with the proposed factor structure of
the WJ-III (McGrew & Woodcock, 2001). Promax rotation, an oblique rotation
method, will be used to permit correlations among factors (Fabrigar, Wegener,
MacCallum, & Strahan, 1999).
The factor structure of the current study was compared to the existing
factor structure for the WJ-III Cognitive (McGrew & Woodcock, 2001) by
examining coefficients of factor similarity through calculation of coefficients of
congruence (rc; Dolan, Oort, Stoel, & Wicherts, 2009; Lee & Ashton, 2007;
Lorenzo-Seva & ten Berge, 2006). As outlined by Lorenzo-Seva and ten Berge
(2006), rc values will be interpreted as good indicators of factor similarity if >.95,
fair indicators if between .85 and .94, and poor indicators if less than .85.
Following the exploratory factor analysis and based on the
recommendations of Carroll (1993, 1995), as well as the supporting research of
Goldberg and Velicer (2006), the Schmid-Leiman orthogonalization procedure
(Schmid & Leiman, 1957) was used to further examine the factor structure of the
WJ-III Cognitive within the current sample of referral students. The Schmid-
Leiman procedure is an orthogonalization procedure used when analyzing a
higher-order factor structure, such as that found in the Woodcock-Johnson III.
The Schmid-Leiman (1957) procedure is used for “transforming an oblique factor
analysis solution containing a hierarchy of higher-order factors into an orthogonal
41
solution which not only preserves the desired interpretation characteristics of the
oblique solution, but also discloses the hierarchical structuring of the variables”
(p. 53). Using the Schmid-Leiman procedure in this study allowed for the
extraction of the variance accounted for by the higher-order factor, g, and the
proportion of variance accounted for by the first-order factors, the broad abilities,
independent of the g factor. The Schmid-Leiman (1957) procedure was used on
the derived first-order factor solution from the EFA using the SPSS syntax code
provided by Wolff and Preising (2005). This provides information regarding the
proportion of WJ-III test variance accounted for by the second-order factor
(general ability or g) independent of the first-order factors, in line with the theory
driving the WJ-III factor structure.
42
Chapter 3
RESULTS
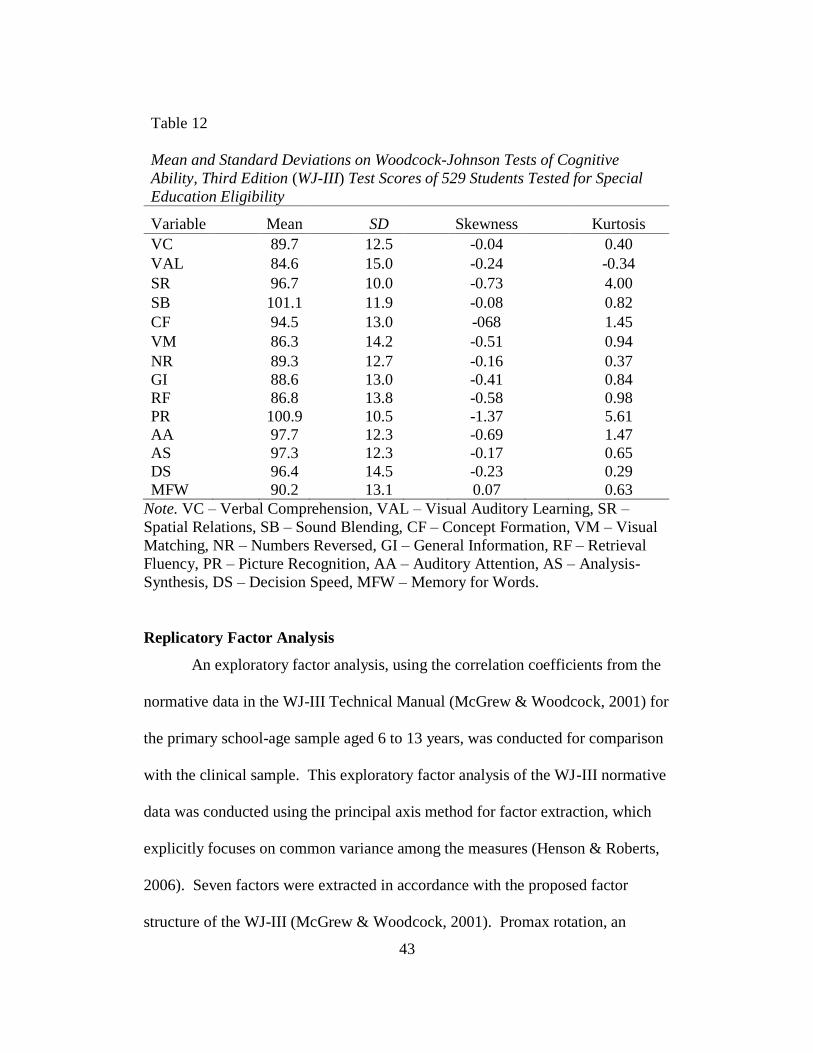
The mean, standard deviation, skewness, and kurtosis for the WJ-III
Cognitive tests of the referred sample are reported in Table 12. Score
distributions from the current sample appear to be relatively normal, with -1.37
the largest skew and 5.61 the largest kurtosis (Fabrigar et al., 1999).
43
Table 12
Mean and Standard Deviations on Woodcock-Johnson Tests of Cognitive
Ability, Third Edition (WJ-III) Test Scores of 529 Students Tested for Special
Education Eligibility
Variable Mean SD Skewness Kurtosis
VC 89.7 12.5 -0.04 0.40
VAL 84.6 15.0 -0.24 -0.34
SR 96.7 10.0 -0.73 4.00
SB 101.1 11.9 -0.08 0.82
CF 94.5 13.0 -068 1.45
VM 86.3 14.2 -0.51 0.94
NR 89.3 12.7 -0.16 0.37
GI 88.6 13.0 -0.41 0.84
RF 86.8 13.8 -0.58 0.98
PR 100.9 10.5 -1.37 5.61
AA 97.7 12.3 -0.69 1.47
AS 97.3 12.3 -0.17 0.65
DS 96.4 14.5 -0.23 0.29
MFW 90.2 13.1 0.07 0.63
Note. VC – Verbal Comprehension, VAL – Visual Auditory Learning, SR –
Spatial Relations, SB – Sound Blending, CF – Concept Formation, VM – Visual
Matching, NR – Numbers Reversed, GI – General Information, RF – Retrieval
Fluency, PR – Picture Recognition, AA – Auditory Attention, AS – Analysis-
Synthesis, DS – Decision Speed, MFW – Memory for Words.
Replicatory Factor Analysis
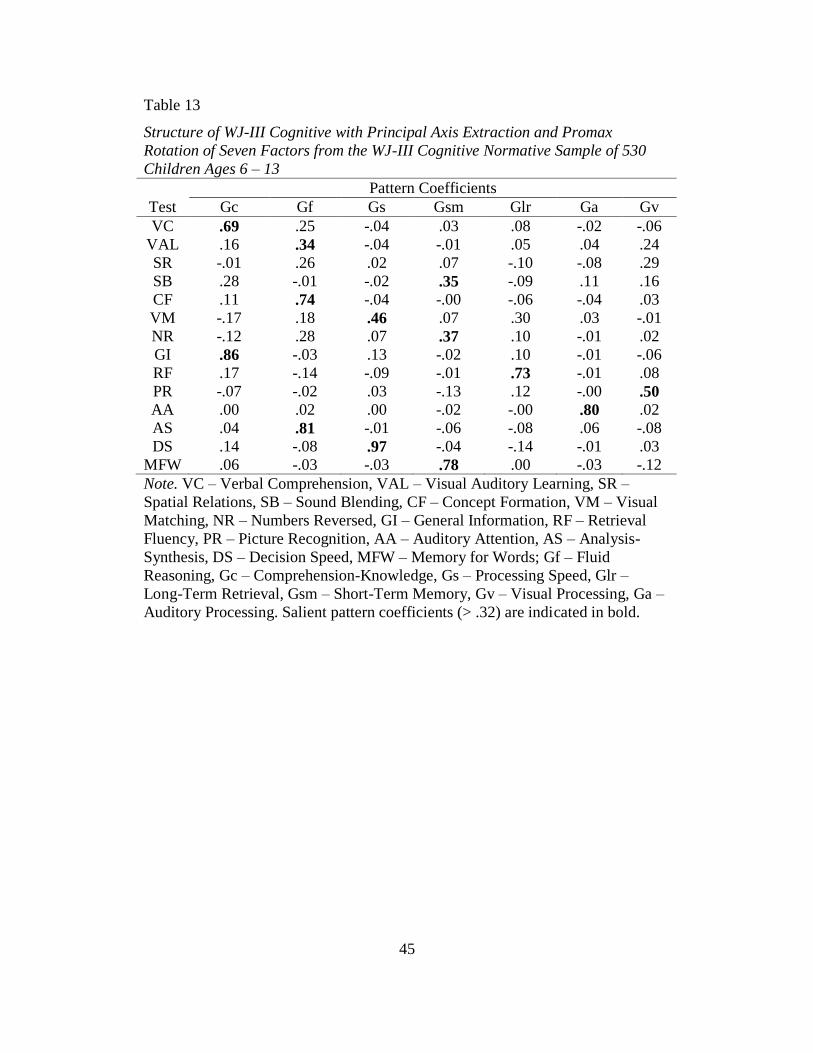
An exploratory factor analysis, using the correlation coefficients from the
normative data in the WJ-III Technical Manual (McGrew & Woodcock, 2001) for
the primary school-age sample aged 6 to 13 years, was conducted for comparison
with the clinical sample. This exploratory factor analysis of the WJ-III normative
data was conducted using the principal axis method for factor extraction, which
explicitly focuses on common variance among the measures (Henson & Roberts,
2006). Seven factors were extracted in accordance with the proposed factor
structure of the WJ-III (McGrew & Woodcock, 2001). Promax rotation, an
44
oblique rotation method, was used to permit correlations among factors (Fabrigar
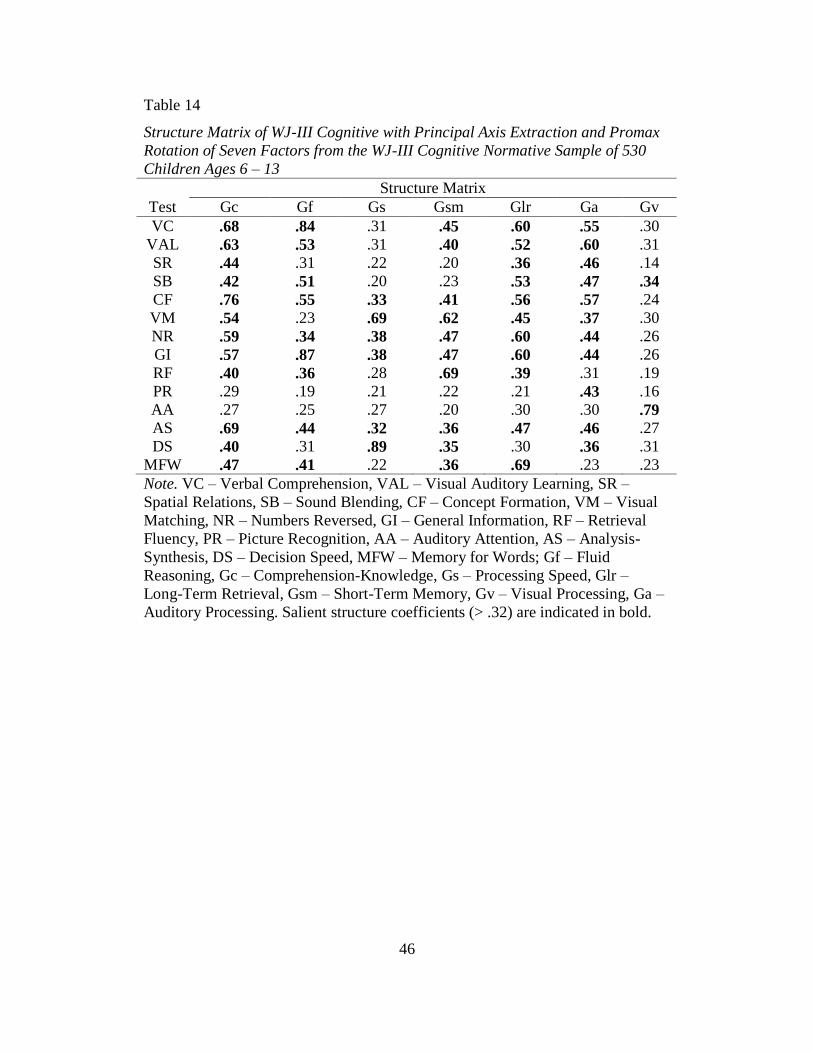
et al., 1999). Pattern coefficients from this exploratory factor analysis are
reported in Table 13. The structure matrix from this exploratory factor analysis is
reported in Table 14.
45
Table 13
Structure of WJ-III Cognitive with Principal Axis Extraction and Promax
Rotation of Seven Factors from the WJ-III Cognitive Normative Sample of 530
Children Ages 6 – 13
Pattern Coefficients
Test Gc Gf Gs Gsm Glr Ga Gv
VC .69 .25 -.04 .03 .08 -.02 -.06
VAL .16 .34 -.04 -.01 .05 .04 .24
SR -.01 .26 .02 .07 -.10 -.08 .29
SB .28 -.01 -.02 .35 -.09 .11 .16
CF .11 .74 -.04 -.00 -.06 -.04 .03
VM -.17 .18 .46 .07 .30 .03 -.01
NR -.12 .28 .07 .37 .10 -.01 .02
GI .86 -.03 .13 -.02 .10 -.01 -.06
RF .17 -.14 -.09 -.01 .73 -.01 .08
PR -.07 -.02 .03 -.13 .12 -.00 .50
AA .00 .02 .00 -.02 -.00 .80 .02
AS .04 .81 -.01 -.06 -.08 .06 -.08
DS .14 -.08 .97 -.04 -.14 -.01 .03
MFW .06 -.03 -.03 .78 .00 -.03 -.12
Note. VC – Verbal Comprehension, VAL – Visual Auditory Learning, SR –
Spatial Relations, SB – Sound Blending, CF – Concept Formation, VM – Visual
Matching, NR – Numbers Reversed, GI – General Information, RF – Retrieval
Fluency, PR – Picture Recognition, AA – Auditory Attention, AS – Analysis-
Synthesis, DS – Decision Speed, MFW – Memory for Words; Gf – Fluid
Reasoning, Gc – Comprehension-Knowledge, Gs – Processing Speed, Glr –
Long-Term Retrieval, Gsm – Short-Term Memory, Gv – Visual Processing, Ga –
Auditory Processing. Salient pattern coefficients (> .32) are indicated in bold.
46
Table 14
Structure Matrix of WJ-III Cognitive with Principal Axis Extraction and Promax
Rotation of Seven Factors from the WJ-III Cognitive Normative Sample of 530
Children Ages 6 – 13
Structure Matrix
Test Gc Gf Gs Gsm Glr Ga Gv
VC .68 .84 .31 .45 .60 .55 .30
VAL .63 .53 .31 .40 .52 .60 .31
SR .44 .31 .22 .20 .36 .46 .14
SB .42 .51 .20 .23 .53 .47 .34
CF .76 .55 .33 .41 .56 .57 .24
VM .54 .23 .69 .62 .45 .37 .30
NR .59 .34 .38 .47 .60 .44 .26
GI .57 .87 .38 .47 .60 .44 .26
RF .40 .36 .28 .69 .39 .31 .19
PR .29 .19 .21 .22 .21 .43 .16
AA .27 .25 .27 .20 .30 .30 .79
AS .69 .44 .32 .36 .47 .46 .27
DS .40 .31 .89 .35 .30 .36 .31
MFW .47 .41 .22 .36 .69 .23 .23
Note. VC – Verbal Comprehension, VAL – Visual Auditory Learning, SR –
Spatial Relations, SB – Sound Blending, CF – Concept Formation, VM – Visual
Matching, NR – Numbers Reversed, GI – General Information, RF – Retrieval
Fluency, PR – Picture Recognition, AA – Auditory Attention, AS – Analysis-
Synthesis, DS – Decision Speed, MFW – Memory for Words; Gf – Fluid
Reasoning, Gc – Comprehension-Knowledge, Gs – Processing Speed, Glr –
Long-Term Retrieval, Gsm – Short-Term Memory, Gv – Visual Processing, Ga –
Auditory Processing. Salient structure coefficients (> .32) are indicated in bold.
47
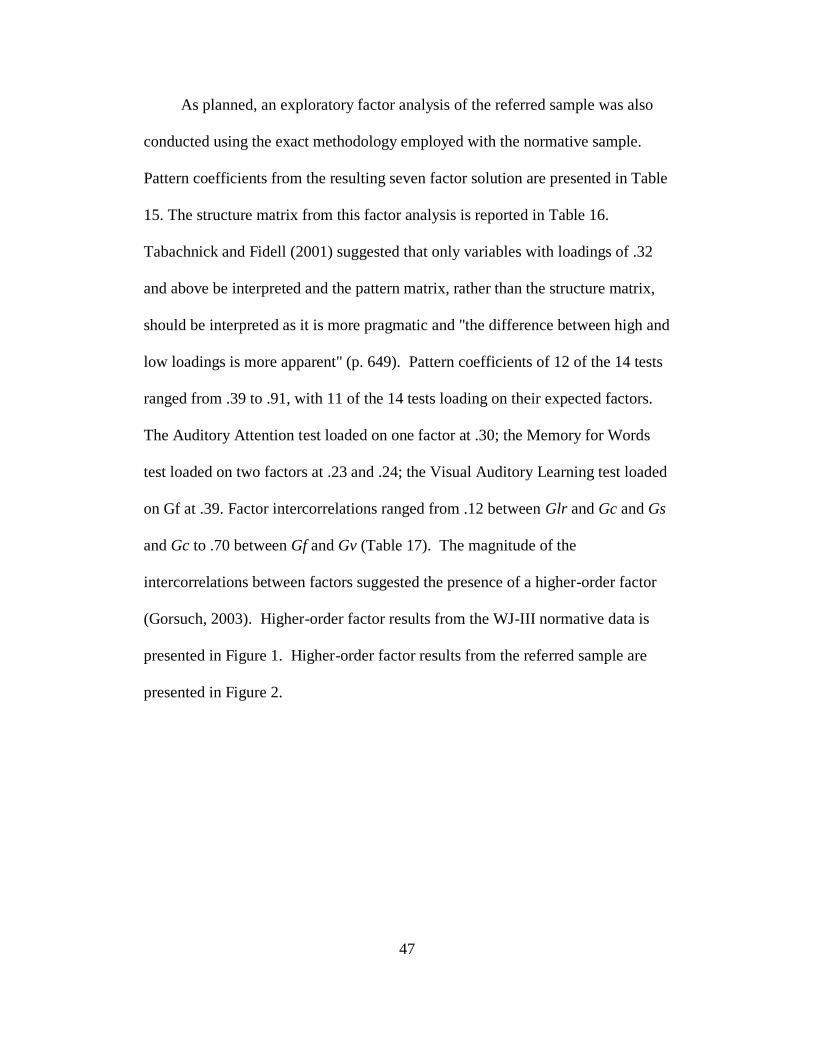
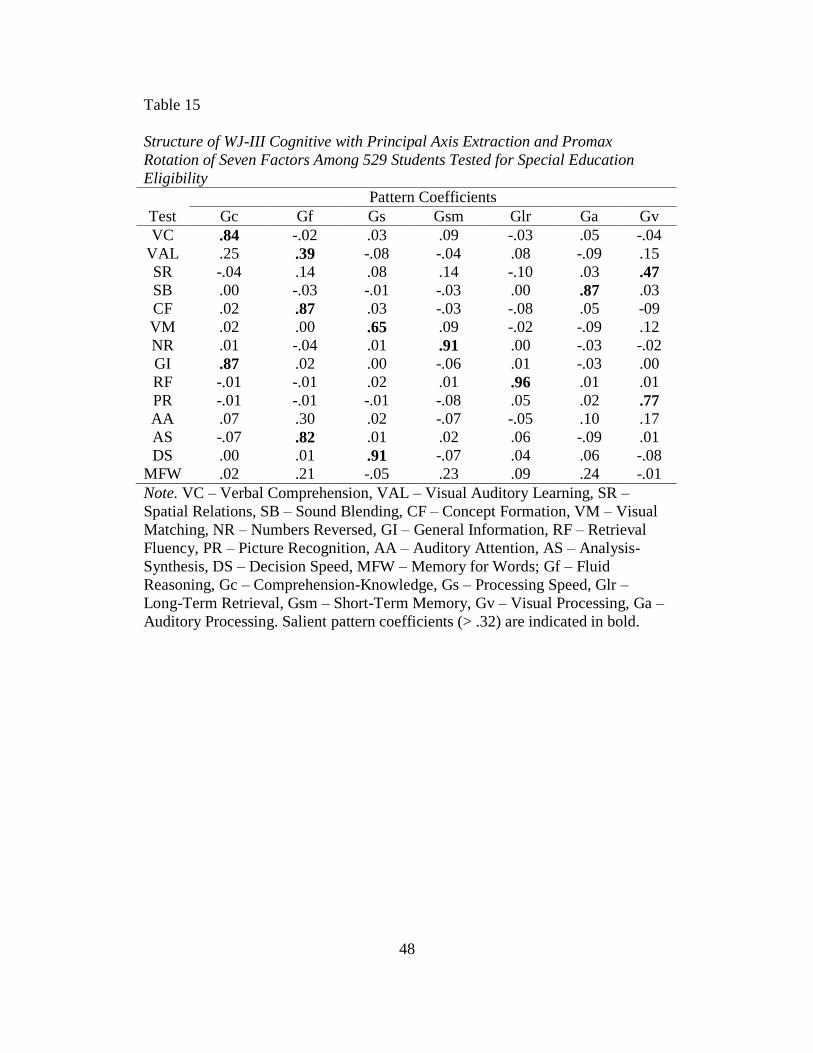
As planned, an exploratory factor analysis of the referred sample was also
conducted using the exact methodology employed with the normative sample.
Pattern coefficients from the resulting seven factor solution are presented in Table
15. The structure matrix from this factor analysis is reported in Table 16.
Tabachnick and Fidell (2001) suggested that only variables with loadings of .32
and above be interpreted and the pattern matrix, rather than the structure matrix,
should be interpreted as it is more pragmatic and "the difference between high and
low loadings is more apparent" (p. 649). Pattern coefficients of 12 of the 14 tests
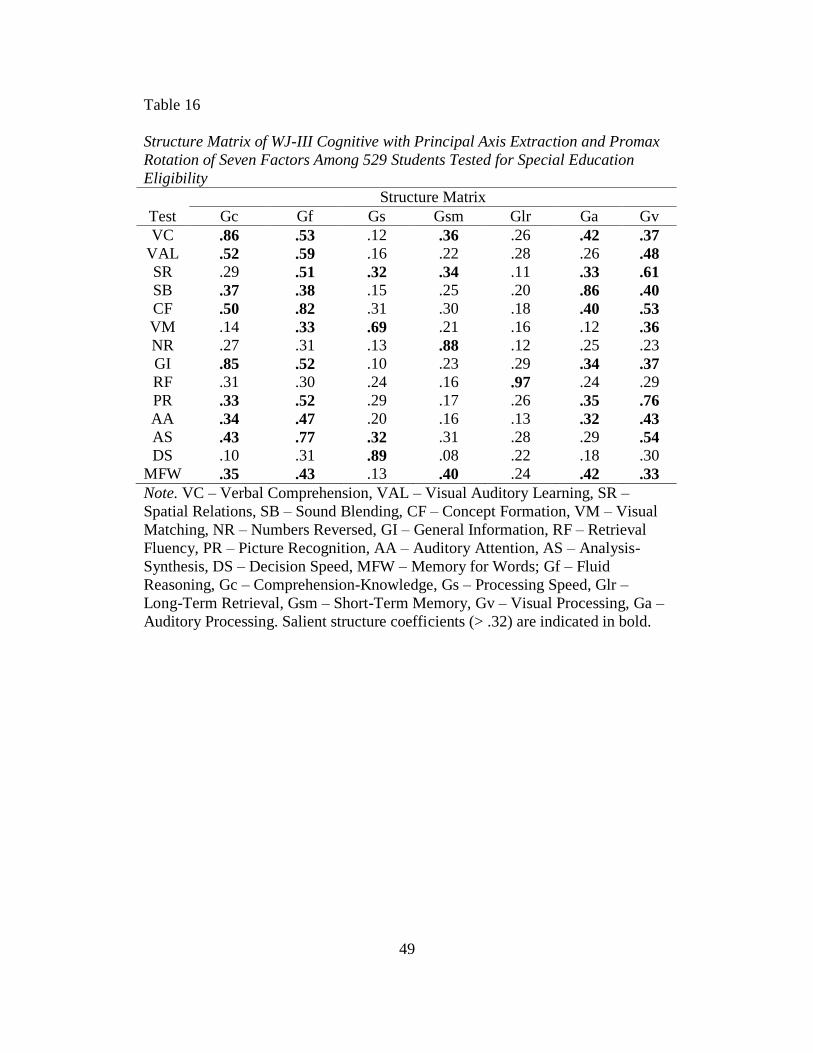
ranged from .39 to .91, with 11 of the 14 tests loading on their expected factors.
The Auditory Attention test loaded on one factor at .30; the Memory for Words
test loaded on two factors at .23 and .24; the Visual Auditory Learning test loaded
on Gf at .39. Factor intercorrelations ranged from .12 between Glr and Gc and Gs
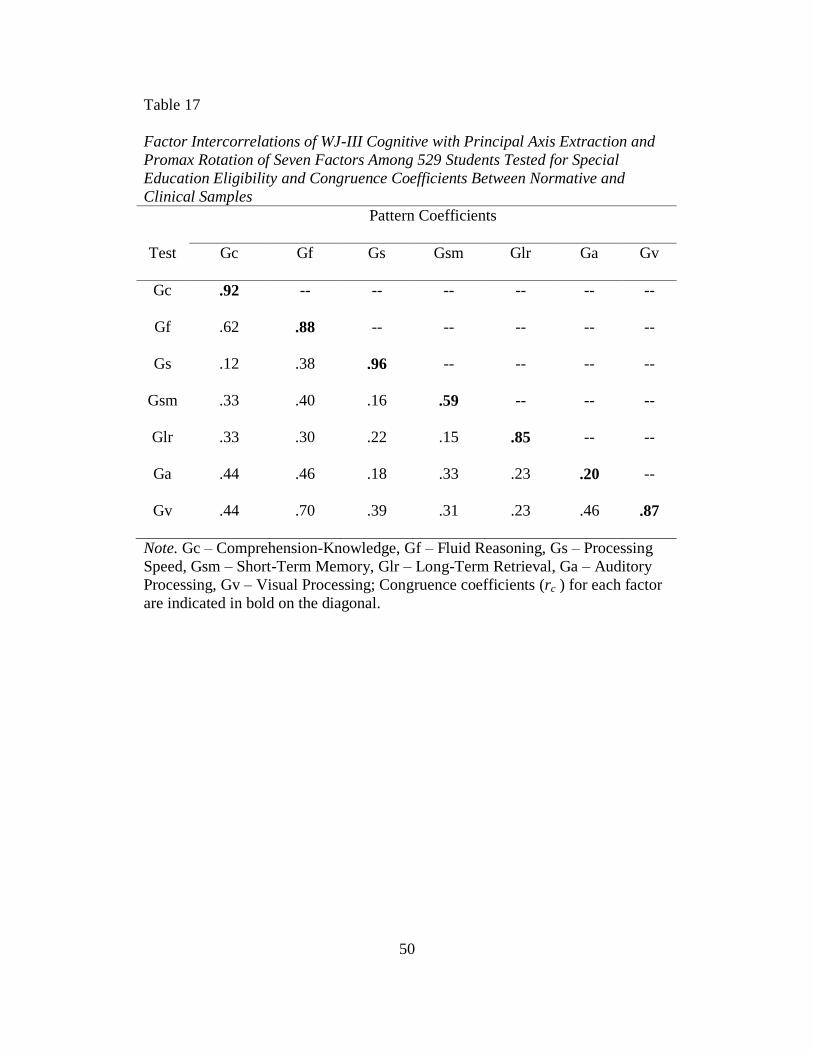
and Gc to .70 between Gf and Gv (Table 17). The magnitude of the
intercorrelations between factors suggested the presence of a higher-order factor
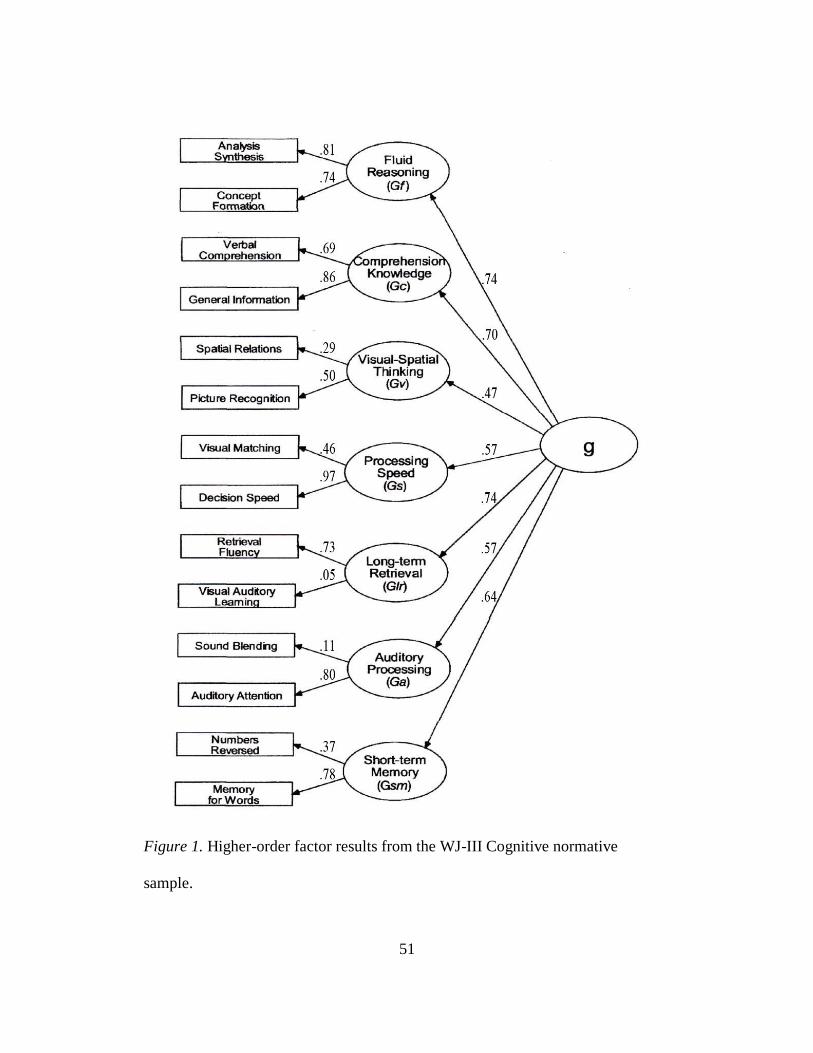
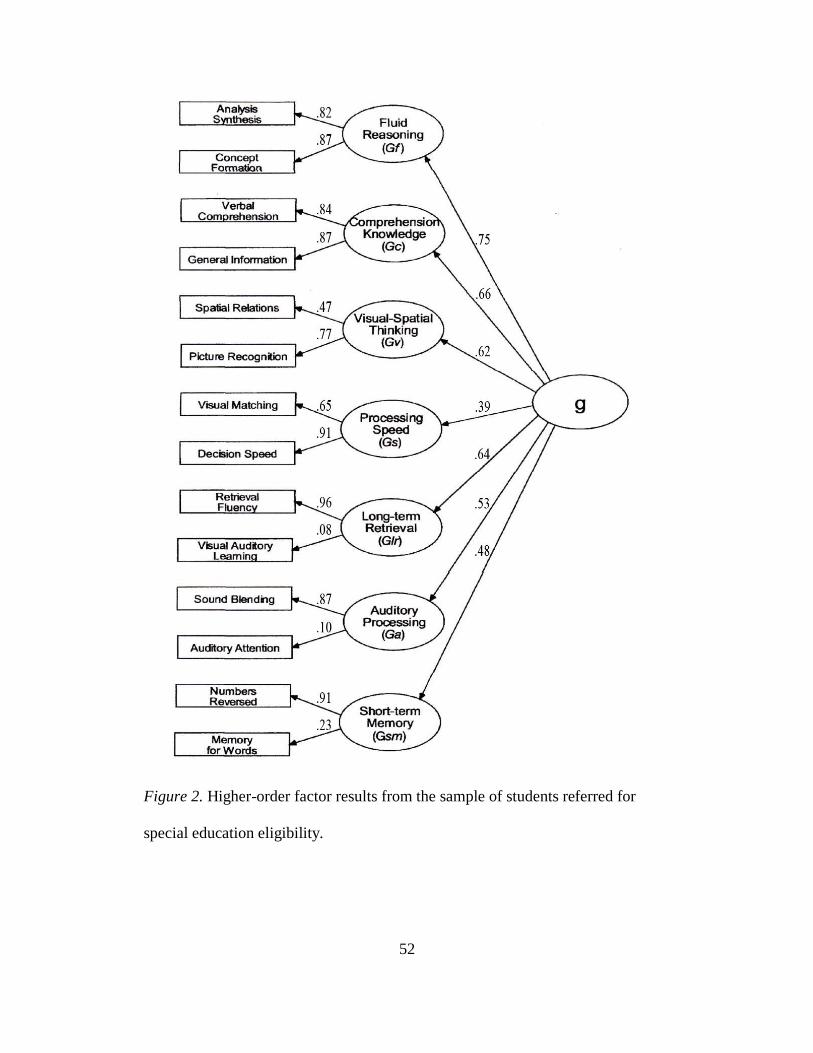
(Gorsuch, 2003). Higher-order factor results from the WJ-III normative data is
presented in Figure 1. Higher-order factor results from the referred sample are
presented in Figure 2.
48
Table 15
Structure of WJ-III Cognitive with Principal Axis Extraction and Promax
Rotation of Seven Factors Among 529 Students Tested for Special Education
Eligibility
Pattern Coefficients
Test Gc Gf Gs Gsm Glr Ga Gv
VC .84 -.02 .03 .09 -.03 .05 -.04
VAL .25 .39 -.08 -.04 .08 -.09 .15
SR -.04 .14 .08 .14 -.10 .03 .47
SB .00 -.03 -.01 -.03 .00 .87 .03
CF .02 .87 .03 -.03 -.08 .05 -09
VM .02 .00 .65 .09 -.02 -.09 .12
NR .01 -.04 .01 .91 .00 -.03 -.02
GI .87 .02 .00 -.06 .01 -.03 .00
RF -.01 -.01 .02 .01 .96 .01 .01
PR -.01 -.01 -.01 -.08 .05 .02 .77
AA .07 .30 .02 -.07 -.05 .10 .17
AS -.07 .82 .01 .02 .06 -.09 .01
DS .00 .01 .91 -.07 .04 .06 -.08
MFW .02 .21 -.05 .23 .09 .24 -.01
Note. VC – Verbal Comprehension, VAL – Visual Auditory Learning, SR –
Spatial Relations, SB – Sound Blending, CF – Concept Formation, VM – Visual
Matching, NR – Numbers Reversed, GI – General Information, RF – Retrieval
Fluency, PR – Picture Recognition, AA – Auditory Attention, AS – Analysis-
Synthesis, DS – Decision Speed, MFW – Memory for Words; Gf – Fluid
Reasoning, Gc – Comprehension-Knowledge, Gs – Processing Speed, Glr –
Long-Term Retrieval, Gsm – Short-Term Memory, Gv – Visual Processing, Ga –
Auditory Processing. Salient pattern coefficients (> .32) are indicated in bold.
49
Table 16
Structure Matrix of WJ-III Cognitive with Principal Axis Extraction and Promax
Rotation of Seven Factors Among 529 Students Tested for Special Education
Eligibility
Structure Matrix
Test Gc Gf Gs Gsm Glr Ga Gv
VC .86 .53 .12 .36 .26 .42 .37
VAL .52 .59 .16 .22 .28 .26 .48
SR .29 .51 .32 .34 .11 .33 .61
SB .37 .38 .15 .25 .20 .86 .40
CF .50 .82 .31 .30 .18 .40 .53
VM .14 .33 .69 .21 .16 .12 .36
NR .27 .31 .13 .88 .12 .25 .23
GI .85 .52 .10 .23 .29 .34 .37
RF .31 .30 .24 .16 .97 .24 .29
PR .33 .52 .29 .17 .26 .35 .76
AA .34 .47 .20 .16 .13 .32 .43
AS .43 .77 .32 .31 .28 .29 .54
DS .10 .31 .89 .08 .22 .18 .30
MFW .35 .43 .13 .40 .24 .42 .33
Note. VC – Verbal Comprehension, VAL – Visual Auditory Learning, SR –
Spatial Relations, SB – Sound Blending, CF – Concept Formation, VM – Visual
Matching, NR – Numbers Reversed, GI – General Information, RF – Retrieval
Fluency, PR – Picture Recognition, AA – Auditory Attention, AS – Analysis-
Synthesis, DS – Decision Speed, MFW – Memory for Words; Gf – Fluid
Reasoning, Gc – Comprehension-Knowledge, Gs – Processing Speed, Glr –
Long-Term Retrieval, Gsm – Short-Term Memory, Gv – Visual Processing, Ga –
Auditory Processing. Salient structure coefficients (> .32) are indicated in bold.
50
Table 17
Factor Intercorrelations of WJ-III Cognitive with Principal Axis Extraction and
Promax Rotation of Seven Factors Among 529 Students Tested for Special
Education Eligibility and Congruence Coefficients Between Normative and
Clinical Samples
Pattern Coefficients
Test Gc Gf Gs Gsm Glr Ga Gv
Gc .92 -- -- -- -- -- --
Gf .62 .88 -- -- -- -- --
Gs .12 .38 .96 -- -- -- --
Gsm .33 .40 .16 .59 -- -- --
Glr .33 .30 .22 .15 .85 -- --
Ga .44 .46 .18 .33 .23 .20 --
Gv .44 .70 .39 .31 .23 .46 .87
Note. Gc – Comprehension-Knowledge, Gf – Fluid Reasoning, Gs – Processing
Speed, Gsm – Short-Term Memory, Glr – Long-Term Retrieval, Ga – Auditory
Processing, Gv – Visual Processing; Congruence coefficients (rc ) for each factor
are indicated in bold on the diagonal.
51
Figure 1. Higher-order factor results from the WJ-III Cognitive normative
sample.
52
Figure 2. Higher-order factor results from the sample of students referred for
special education eligibility.
53
Congruence Coefficient for Obtained Factor Structures
To test the obtained factor structure of the sample of students referred for
special education against the WJ-III Cognitive normative sample, the congruence
coefficient (rc ) was calculated for each factor (Table 17). Lorenzo-Seva and ten
Berge (2006) suggested that values of rc >.95 indicate good factor similarity, rc
values between .85-.94 indicate fair congruence, and values of rc less than .85
indicate the factor structure is not similar. Based upon these guidelines, the
obtained congruence coefficients indicate that the first order factor Gs in this
sample has good factor similarity with the normative factor structure; Gf, Gc, Glr,
and Gv have fair factor similarity; and Gsm and Ga were not similar to the
normative factor structure.
Schmid-Leiman Orthogonalization Procedure
The Schmid-Leiman (1957) transformation was used to decompose the
variance of the first-order, seven-factor oblique structure of the WJ-III Cognitive
clinical sample into several orthogonal components. The first-order factors
accounted for 6.5% (Gv) to 12.8% (Gs) of common variance and 3.9% (Gv) to
7.7% (Gs) of total variance. In contrast, the higher-order general ability factor
accounted for approximately 38.4% of common variance and 23.1% of the total
variance.
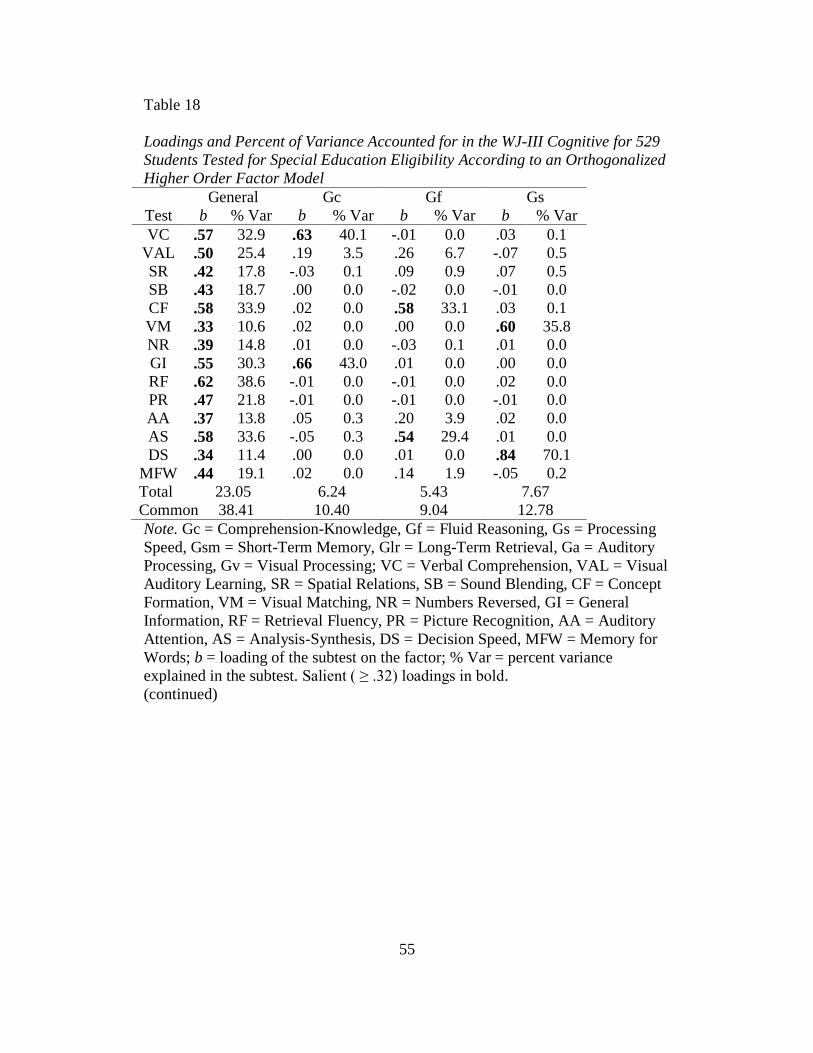
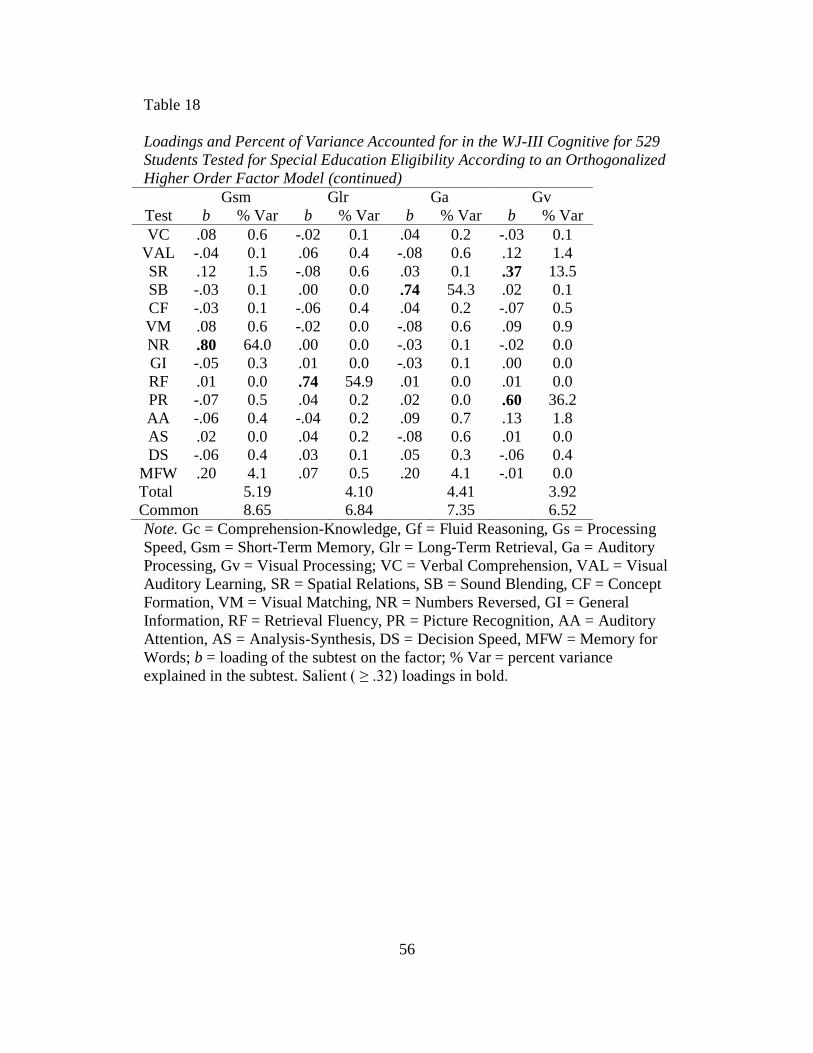
The results presented in Table 18 indicate that the second-order general
ability factor (g) accounted for more variance in each of the WJ-III Cognitive
tests than the orthogonal first-order factor Gf. For example, g accounted for
54
33.9% and 33.6% of the variance in the Concept Formations and Analysis-
Synthesis tests, respectively, whereas the Gf factor acounted for 33.1% and 29.4%
of the variance in those same two tests. In contrast, the Gc and Gs factors
accounted for more variance than the general factor for both of their respective
tests. The Gsm, Glr, Ga, and Gv factors accounted for more variance than g for
one of the two tests associated with each factor (Numbers Reversed, Retrieval
Fluency Sound Blending, and Picture Recognition, respectively).
55
Table 18
Loadings and Percent of Variance Accounted for in the WJ-III Cognitive for 529
Students Tested for Special Education Eligibility According to an Orthogonalized
Higher Order Factor Model
General Gc Gf Gs
Test b % Var b % Var b % Var b % Var
VC .57 32.9 .63 40.1 -.01 0.0 .03 0.1
VAL .50 25.4 .19 3.5 .26 6.7 -.07 0.5
SR .42 17.8 -.03 0.1 .09 0.9 .07 0.5
SB .43 18.7 .00 0.0 -.02 0.0 -.01 0.0
CF .58 33.9 .02 0.0 .58 33.1 .03 0.1
VM .33 10.6 .02 0.0 .00 0.0 .60 35.8
NR .39 14.8 .01 0.0 -.03 0.1 .01 0.0
GI .55 30.3 .66 43.0 .01 0.0 .00 0.0
RF .62 38.6 -.01 0.0 -.01 0.0 .02 0.0
PR .47 21.8 -.01 0.0 -.01 0.0 -.01 0.0
AA .37 13.8 .05 0.3 .20 3.9 .02 0.0
AS .58 33.6 -.05 0.3 .54 29.4 .01 0.0
DS .34 11.4 .00 0.0 .01 0.0 .84 70.1
MFW .44 19.1 .02 0.0 .14 1.9 -.05 0.2
Total 23.05 6.24 5.43 7.67
Common 38.41 10.40 9.04 12.78
Note. Gc = Comprehension-Knowledge, Gf = Fluid Reasoning, Gs = Processing
Speed, Gsm = Short-Term Memory, Glr = Long-Term Retrieval, Ga = Auditory
Processing, Gv = Visual Processing; VC = Verbal Comprehension, VAL = Visual
Auditory Learning, SR = Spatial Relations, SB = Sound Blending, CF = Concept
Formation, VM = Visual Matching, NR = Numbers Reversed, GI = General
Information, RF = Retrieval Fluency, PR = Picture Recognition, AA = Auditory
Attention, AS = Analysis-Synthesis, DS = Decision Speed, MFW = Memory for
Words; b = loading of the subtest on the factor; % Var = percent variance
explained in the subtest. Salient ( ≥ .32) loadings in bold.
(continued)
56
Table 18
Loadings and Percent of Variance Accounted for in the WJ-III Cognitive for 529
Students Tested for Special Education Eligibility According to an Orthogonalized
Higher Order Factor Model (continued)
Gsm Glr Ga Gv
Test b % Var b % Var b % Var b % Var
VC .08 0.6 -.02 0.1 .04 0.2 -.03 0.1
VAL -.04 0.1 .06 0.4 -.08 0.6 .12 1.4
SR .12 1.5 -.08 0.6 .03 0.1 .37 13.5
SB -.03 0.1 .00 0.0 .74 54.3 .02 0.1
CF -.03 0.1 -.06 0.4 .04 0.2 -.07 0.5
VM .08 0.6 -.02 0.0 -.08 0.6 .09 0.9
NR .80 64.0 .00 0.0 -.03 0.1 -.02 0.0
GI -.05 0.3 .01 0.0 -.03 0.1 .00 0.0
RF .01 0.0 .74 54.9 .01 0.0 .01 0.0
PR -.07 0.5 .04 0.2 .02 0.0 .60 36.2
AA -.06 0.4 -.04 0.2 .09 0.7 .13 1.8
AS .02 0.0 .04 0.2 -.08 0.6 .01 0.0
DS -.06 0.4 .03 0.1 .05 0.3 -.06 0.4
MFW .20 4.1 .07 0.5 .20 4.1 -.01 0.0
Total 5.19 4.10 4.41 3.92
Common 8.65 6.84 7.35 6.52
Note. Gc = Comprehension-Knowledge, Gf = Fluid Reasoning, Gs = Processing
Speed, Gsm = Short-Term Memory, Glr = Long-Term Retrieval, Ga = Auditory
Processing, Gv = Visual Processing; VC = Verbal Comprehension, VAL = Visual
Auditory Learning, SR = Spatial Relations, SB = Sound Blending, CF = Concept
Formation, VM = Visual Matching, NR = Numbers Reversed, GI = General
Information, RF = Retrieval Fluency, PR = Picture Recognition, AA = Auditory
Attention, AS = Analysis-Synthesis, DS = Decision Speed, MFW = Memory for
Words; b = loading of the subtest on the factor; % Var = percent variance
explained in the subtest. Salient ( ≥ .32) loadings in bold.
57
Chapter 4
DISCUSSION
The results of an exploratory factor analysis using the correlation
coefficients from the normative data reported in the WJ-III Technical Manual
(McGrew & Woodcock, 2001) for the primary school age sample, aged 6 to 13
years, revealed that at least one test loaded on each of the seven factors. However,
the 14 tests of the WJ-III Cognitive GIA-Extended Battery did not all load highly
on their respective factors according to the structure presented in the WJ-III
Technical Manual. For the factors Gc, Gf, Gs, and Gsm, both tests associated
with the factor loaded highly; for Glr, Ga, and Gv, only one test associated with
each factor loaded highly. The Visual Auditory Learning test, which is proposed
to be a measure of Glr, loaded highly on Gf; the Sound Blending Test loaded on
Gsm rather than its associated test Ga; the Spatial Recognition test did not load
saliently high on any factor, it loaded on Gv at .29.
The results of an exploratory factor analysis of a sample of 529 students
referred for special education revealed 11 of the 14 tests loading on their expected
factors. For the factors Gc, Gf, Gs, and Gv, both tests associated with the factor
loaded highly; for Gsm, Glr, and Ga, only one test associated with each factor
loaded highly. The Visual Auditory Learning test, which is proposed to be a
measure of Glr, loaded highly on Gf, as it did in the exploratory factor analysis
conducted on the normative sample. The Auditory Attention test, associated with
Ga, loaded on Gf at .30; the Memory for Words test, associated with Gsm, loaded
on Gsm at .23 and Ga .24. The results of the current study did not replicate
58
previous research where either all tests loaded on their respective factors (Taub &
McGrew, 2004), or all tests, with the exception of the Glr test of Retrieval
Fluency, loaded on their respective factors (Keith et al., 2008; McGrew &
Woodcock, 2001; Phelps et al., 2005).
Obtained congruence coefficients indicated good similarity between the
factor Gs, and fair similarity between Gf, Gc, Glr, and Gv for the current clinical
sample and the normative factor structure. Gsm and Ga were not found to be
similar. The WJ-III Cognitive structure established in the normative sample was
not fully replicated in this sample of students referred for special education. This
indicates, for this particular study, the WJ-III Cognitive did not mirror the
proposed CHC-based, seven-factor structure with two tests supporting each
factor. This outcome is important given the WJ-III Cognitive GIA-Extended
Battery does not meet the criteria suggested by Velicer and Fava (1998) that
“variable sampling has a critical effect on the interpretation of factor patterns.
Under the best conditions, the minimum of three variables per factor or
component is critical” (p. 243). However, while the factor structure was not
replicated for all seven factors, four factors were similar and supported by the two
associated tests of each of those factors, Gc, Gf, Gs, and Gv, indicating these
factors are likely valid measures. Of the three factors, Gsm, Glr, and Ga,
previous research has shown Glr to be the factor most often not supported,
specifically, the Glr test Retrieval Fluency, is shown to load highly on multiple
factors (Keith et al., 2008; McGrew & Woodcock, 2001; Phelps et al., 2005).
59
Further research could be conducted to investigate the lack of support for Gsm,
Glr, and Ga.
As predicted, the Schmid-Leiman orthogonalization procedure identified a
higher-order factor structure with a second-order, general ability factor, g. In the
current referred sample, the general ability factor accounted for approximately
38.4% of common variance and 23.1% of total variance among the seven, first-
order factors. However, g accounted for more variance in both associated tests
for only the orthogonal first-order factor Gf. In contrast, the Gc and Gs factors
accounted for more variance than the general factor for both of their respective
tests. The Gsm, Glr, Ga, and Gv factors accounted for more variance than g for
one of the two tests associated with each factor. Previous research by Floyd et al.
(2009) supports Gf as primarily a measure of g; however, their study found Glr
and Gc to be primarily measures of g as well. These results are comparable with
other research indicating the factors most associated with g are Gf, Glr, and Gv
(Taub & McGrew 2004). Thus, in this study, the results are similar to previous
studies with Gf as primarily a measure of g, however, Gc was not found to be
primarily a measure of g.
There are several possible reasons the structure was not replicated in this
sample of students referred for special education. The age of the sample may
have been influential. Gsm and Glr, both measures of memory, were not fully
supported in this study. Previous research suggests memory ability increases with
age, due to factors such as the development of memory strategies increasing with
age and capacity of memory stores (De Alwis, Myerson, Hershey, & Hale, 2009;
60
Schrank & Flanagan, 2003). Ga, a measure of auditory processing, specifically
the test of Auditory Attention, was not fully supported in this referred sample.
Research suggests this ability may be impacted by age, specifically age-related
factors such as attention and auditory system maturity may affect performance on
tests measuring auditory processing (Dawes & Bishop, 2008).
The nature of the sample may have been a factor in the results not
replicating the proposed WJ-III factor structure. The majority of this referred
sample had a primary special education eligibility classification of a Specific
Learning Disability. Results of an exploratory factor analysis looking only at the
363 students with a primary classification of a Specific Learning Disability are
presented in Appendix A. All tests loaded on their respective factors with the
exception of Memory for Words, a test of Gsm, which loaded on Ga, and
Auditory Attention, a test of Ga, which loaded on Glr. This may indicate these
tests are not measuring the abilities they are hypothesized to measure in students
with a Specific Learning Disability. Results of an exploratory factor analysis
looking at the 166 students who did not qualify for special education, or had a
primary special education eligibility classification other than a Specific Learning
Disability are presented in Appendix B. Factor loadings in this sample were
much more difficult to delineate with four tests, the Glr test of Visual Auditory
Learning, the Gs test of Decision Speed, and both tests of Gf (Concept Formation
and Analysis-Synthesis), loading on more than one factor. This supports the need
for further research to be conducted on the factor structure of this instrument for
students with eligibility classifications other than a Specific Learning Disability.
61
Another possible explanation for the sample structure not replicating the
normative structure could be due to the amount of variance accounted for by g for
specific tests. In the sample of students referred for special education, the three
tests which did not load on their respective tests, Auditory Attention, Memory for
Words, and Visual Auditory Learning, showed g accounted for more variance
than any factor. This indicates these tests may be measures of general ability
rather than their associated factors. Additionally, g accounted for more variance
for both tests of Gf. Previous research has suggested difficulties in differentiating
Gf from g (Gustafsson, 1984).
Limitations
There are limitations to the current study that can be improved upon in
future studies. First, the current sample is relatively limited. The sample size was
adequate (Tabachnick & Fidell, 2001); however, it was derived from only one
school district in central Arizona. This district is not representative of U.S. school
districts nationwide; specifically, the sample over represents students of Hispanic
origin when compared to the percentage of the total U.S. population who identify
as being of Hispanic origin (2010 U.S. Census Bureau). The method of data
collection was also a limiting factor. The data were collected from archival
special education records, thus the accuracy of the professionals who originally
conducted, scored, and recorded the data is assumed. Another limitation of the
study is that the current sample was derived from a sample of students referred for
special education, without examining the structure for each special education
62
classification category, including those students who did not qualify for special
education.
Future Research
Little research has been conducted exploring the structural validity of the
WJ-III Cognitive using the 14 tests of the GIA-Extended Battery. Further factor
analytic studies are necessary to examine the validity of the seven-factor model
proposed by the developers of the WJ-III Cognitive with larger and more diverse
samples to demonstrate the measure’s generalizability to the population on which
it is being used. Future studies could also investigate the structural validity of the
WJ-III Cognitive in samples of special education students delineated by special
education category, as well as in other geographical populations of the United
States. As high-stakes decisions are made based on the results of intelligence
tests, such as the WJ-III Cognitive, it is imperative that sufficient, statistically
sound, independent research support the proposed factor structure, in such a way
that reflects the test administration as performed by practitioners in order to be
considered a psychometrically sound assessment.
Implications for Practice
The results of this study did not fully replicate the factor structure proposed
in the WJ-III Technical Manual (McGrew & Woodcock 2001), indicating a lack
of structural validity for the model’s use in a referred sample. The implications of
these results for school psychology practice may include inappropriate
interpretation of an individual’s test scores and inappropriate action being taken
based on these scores. Thus, school psychologists should be cautious when
63
selecting an assessment instrument and interpreting the results of their chosen
measures. High-stakes decisions, such as special education eligibility, should be
determined based, not on the result of one assessment, but multiple sources of
data, including multiple measures in the area of concern. Gs was strongly
supported while Gc, Gf, and Gv were fairly supported and thus are likely factors
that can be utilized in assessment. Gsm, Glr, and Gr were not supported by this
study and should probably only be used if further research can confirm their
validity in referral samples. This study found the presence of a higher order
factor, g, which accounted for 38.4% of the common variance, indicating
practitioners should not ignore this factor in their interpretation of cognitive
ability. The interpretation of higher-order factor scores when g accounts for the
majority of the variance has been recommended by previous research (Bodin et
al., 2009; Watkins, 2006; Watkins et al., 2006).
64
REFERENCES
Allen, J. & Walsh, J. A. (2000). A construct-based approach to equivalence:
Methodologies for cross-cultural/multicultural personality assessment
research. In R. H. Dana (Ed.), Handbook of cross-cultural and
multicultural personality assessment (pp. 63-86). Mahwah, NJ: Erlbaum.
American Educational Research Association, American Psychological
Association, & National Council on Measurement in Education. (1999).
Standards for educational and psychological testing. Washington, DC:
American Educational Research Association.
Asparouhov, T., & Muthen, B. (2009). Exploratory structural equation modeling.
Structural Equation Modeling, 16, 397-438.
Ben-Porath, Y. (1990). Cross-cultural assessment of personality: The case for
replicatory factor analysis. In J. N. Butcher & C. D. Spielberger (Eds.),
Advances in personality assessment (Vol. 8, pp. 27-48). Hillsdale, NJ:
Erlbaum.
Bielinski, J., & Ysseldyke, J. E. (2000). Interpreting trends in the performance of
special education students (Technical Report 27). Minneapolis, MN:
National Center on Educational Outcomes, University of Minnesota.
Bodin, D., Pardini, D. A., Burns, T. G., & Stevens, A. B. (2009). Higher order
factor structure of the WISC-IV in a clinical neuropsychology sample.
Child Neuropsychology, 15, 417-424.
Boe, E. (2006). Long-term trends in the national demand, supply, and shortage of
special education teachers. Journal of Special Education, 40, 138-150.
Brown, T. A. (2006). Confirmatory factor analysis for applied research. New
York, NY: Guilford.
Browne, M. W. (2001). An overview of analytic rotation in exploratory factor
analysis. Multivariate Behavioral Research, 36, 111-150.
Butcher, J. N. (1985). Current developments in MMPI use: An international
perspective. In J. N. Butcher & C. D. Spielberger (Eds.), Advances in
personality assessment (Vol. 4, pp. 83-94). Hillsdale, NJ: Erlbaum.
Carroll, J. B. (1993). Human cognitive abilities: A survey of factor-analytical
studies. New York, NY: Cambridge University Press.
Carroll, J. B. (1995). On methodology in the study of cognitive abilities.
Multivariate Behavioral Research, 30, 429-452.
65
Center for Special Education Finance. (2003). Total expenditures for students
with disabilities, 1999-2000: Spending variation by disability. Retrieved
from
http://www.csefair.org/publications/seep/national/Final_SEEP_Report_5.p
df
Cronbach, L. J., & Meehl, P. E. (1955). Construct validity in psychological tests.
Psychological Bulletin, 52, 281-302.
Curtis, M. J., Lopez, A. D., Castillo, G. M., Batsche, D. M., & Smith, J. C.
(2008). The status of school psychology: Demographic characteristics,
employment conditions, professional practices, and continuing
professional development. NASP Communiqué, 36(5), 27-29.
Dawes, P., & Bishop, D. V. M. (2008). Maturation of visual and auditory
temporal processing in school-aged children. Journal of Speech,
Language, and Hearing Research, 51(4), 1002-1015.
De Alwis, D., Myerson, J., Hershey, T., & Hale, S. (2009). Children's higher
order cognitive abilities and the development of secondary memory.
Psychonomic Bulletin & Review, 16(5), 925-930.
Dolan, C. V., Oort, F. J., Stoel, R. D., & Wicherts, J. M. (2009). Testing
measurement invariance in the target rotated multigroup exploratory factor
model. Structural Equation Modeling, 16, 295-314.
Elliot, C. D. (1990). Differential Ability Scales. San Antonio, TX: Psychological
Corporation.
Fabrigar, L. R., Wegener, D. T., MacCullum, R. C., & Strahan, E. J. (1999).
Evaluating the use of exploratory factor analysis in psychological
research. Psychological Methods, 4, 272-299.
Flanagan, D. P., McGrew, K. S., & Ortiz, S. O. (1999). The Wechsler intelligence
scales and Gf-Gc theory: A contemporary approach to interpretation.
Boston, MA: Allyn & Bacon.
Floyd, R. G., McGrew, K. S., Barry, A., Fawziya, R., & Rogers, J. (2009).
General and specific effects on Cattell-Horn-Carroll broad ability
composites: Analysis of the Woodcock-Johnson III normative update
Cattell-Horn-Carroll factor clusters across development. School
Psychology Review, 38, 249-265.
66
Floyd, R. G., Shaver, R. B., & McGrew, K. S. (2003). Interpretation of the
Woodcock-Johnson III tests of cognitive abilities: Acting on evidence. In
F. A. Schrank & D. P. Flanagan (Eds.), WJ III clinical use and
interpretation (pp. 1-46). San Diego, CA: Academic Press.
Goldberg, L. R., & Velicer, W. F. (2006). Principles of exploratory factor
analysis. In S. Strack (Ed.), Differentiating normal and abnormal
personality (2nd
ed., pp. 209- 237). New York, NY: Springer.
Gorsuch, R. L. (2003). Factor analysis. In J. A. Schinka & W. F. Velicer (Eds.)
Handbook of psychology: Research methods in psychology (Vol. 2., pp.
143-164). Hoboken, NJ: Wiley.
Gustafsson, J. E. (1984). A unifying model for the structure of intellectual
abilities. Intelligence, 8, 179-203.
Henson, R. K., & Roberts, J. K. (2006). Use of exploratory factor analysis in
published research: Common errors and some comment on improved
practice. Educational and Psychological Measurement, 66, 393-416.
Hocutt, A. M. (1996). Effectiveness of special education: Is placement the critical
factor? The Future of Children, 6(1), 77-102.
Horn, J. L. (1968). Organization of abilities and the development of intelligence.
Psychological Review, 75, 242-259.
Individuals with Disabilities Education Act of 2004, 20 U.S.C. § 1400 (2004).
Joint Committee on Testing Practices. (2004). Code of fair testing practices in
education. Washington, DC: American Psychological Association.
Kamphaus, R. W., Petoskey, M. D., & Rowe, E. W. (2000). Current trends in
psychological testing of children. Professional Psychology: Research and
Practice, 31, 155-164.
Kamphaus, R. W., Winsor, A. P., Rowe, E. W., & Kim, S. (1997). A history of
intelligence test interpretation. In D. P. Flanagan, J. L. Genshaft, & P. L.
Harrison (Eds.), Contemporary intellectual assessment: Theories, tests,
and issues (pp. 23-38). New York, NY: Guilford.
Kavale, K. A., & Forness, S. R. (1999). Effectiveness of special education. In C.
R. Reynolds & T. B. Gutkin (Eds.), The handbook of school psychology
(3rd ed., pp. 984-1024). New York, NY: Wiley.
67
Kaufman, A. S., Flanagan, D. P., Alfonso, V. C., & Mascolo, J. T. (2006). Test
review: Wechsler intelligence scale for children, fourth edition (WISC-
IV). Journal of Psychoeducational Assessment, 24, 278-295.
Keith, T. Z. (2005) Using confirmatory factor analysis to aid in understanding the
constructs measured by intelligence tests. In D. P. Flanagan & P. L.
Harrison (Eds.), Contemporary Intellectual Assessment: Theories, tests
and issues (2nd
ed., pp. 581-614). New York, NY: Guilford.
Keith, T. Z, Fine, J. G., Taub, G. E., Reynolds, M. R., & Kranzler, J. H. (2006).
Higher order, multisample, confirmatory factor analysis of the Wechsler
Intelligence Scale for Children – Fourth Edition: What does it measure?
School Psychology Review, 35, 108-127.
Keith, T. Z., Reynolds, M. R., Patel, P. G., & Ridley, K. P. (2008). Sex
differences in latent cognitive abilities ages 6 to 59: Evidence from the
Woodcock-Johnson III tests of cognitive abilities. Intelligence, 36, 502-
525.
Lee, K., & Ashton, M. C. (2007). Factor analysis in personality research. In R. W.
Robins, R. C. Fraley, & R. F. Krueger (Eds.), Handbook of research
methods in personality psychology (pp. 424-443). New York, NY:
Guilford.
Loevinger, J. (1957). Objective tests as instruments of psychological theory.
Psychological Reports, 3, 635-694.
Lorenzo-Seva, U., & ten Berge, J. M. F. (2006). Tucker’s congruence coefficient
as a meaningful index of factor similarity. Methodology, 2, 57-64.
McCain, A. L. (1996). Hierarchical analytical methods that yield different
perspectives on dynamics: Aids to interpretation. Advances in Social
Science Methodology, 4, 229-240.
McGrew, K. S., & Woodcock, R. W. (2001). Technical manual. Woodcock
Johnson III. Itasca, IL: Riverside Publishing.
Messick, S. (1995). Validity of psychological assessment: Validation of
inferences from persons’ responses and performances as scientific inquiry
into score meaning. American Psychologist, 50, 741-749.
Meyers, L. S., Gamst, G., & Guarino, A. (2006). Data screening. In Applied
multivariate research: Design and interpretation (pp. 43-73). Thousand
Oaks, CA: Sage.
68
Morgan, P. L., Frisco, M. L., Farkas, G., & Hibel, J. (2010). A propensity score
matching analysis of the effects of special education services. Journal of
Special Education, 43, 236-254.
National Association of School Psychologists. (2000). Professional conduct
manual. Bethesda, MD: National Association of School Psychologists.
No Child Left Behind Act of 2001, 20 U.S.C. § 6319 (2001).
Phelps, L., McGrew, K. S., Knopik, S. N., & Ford, L. (2005). The general (g),
broad, and narrow CHC stratum characteristics of the WJ-III and WISC-
III tests: A confirmatory cross-battery investigation. School Psychology
Quarterly, 2, 66-88.
Raykov, T., & Marcoulides, G. A. (2000). A first course in structural equation
modeling. Mahwah, NJ: Erlbaum.
Reschly, D. J. (1990). Found: Our intelligences: What do they mean? Journal of
Psychoeducational Assessment, 8, 259-267.
Reschly, D. J., & Ysseldyke, J. E. (2002). Paradigm shift: The past is not the
future. In A. Thomas & J. Grimes (Eds.), Best practices in school
psychology IV (pp. 3-20). Bethesda, MD: National Association of School
Psychologists.
Saas, D. A., & Schmitt, T. A. (2010). A comparative investigation of rotation
criteria within exploratory factor analysis. Multivariate Behavioral
Research, 45, 73-103.
Sanders, S., McIntosh, D. E., Dunham, M., Rothlisberg, B. A., & Finch, H.
(2007). Joint confirmatory factor analysis of the Differential Ability Scales
and the Woodcock-Johnson tests of cognitive abilities – third edition.
Psychology in the Schools, 44, 119-138.
Sattler, J. M. (2001). Assessment of children: Cognitive applications, fourth
edition. La Mesa, CA: Sattler.
Schmid, J., & Leiman, J. M. (1957). The development of hierarchical factor
solutions. Psychometrika, 22, 53-61.
Schrank, F. A., & Flanagan, D. P. (2003). WJ III clinical use and interpretation:
Scientist-practitioner perspectives. San Diego, CA: Academic Press.
Schrank, F. A., Flanagan, D. P., Woodcock, R. W., & Mascolo, J. T. (2002).
Essentials of WJ III cognitive abilities assessment. New York, NY: Wiley.
69
Strauss, E., Spreen, O., & Hunter, M. (2000). Implications of test revisions for
research. Psychological Assessment, 12, 237-244.
Tabachnick, B. G., & Fidell, L. S. (2001). Using multivariate statistics. Boston,
MA: Allyn and Bacon.
Taub, G. E., & McGrew, K. S. (2004). A confirmatory factor analysis of Cattell-
Horn-Carroll theory and cross-age invariance of the Woodock-Johnson
tests of cognitive abilities III. School Psychology Quarterly, 19, 72-87.
Thorndike, R. L., Hagen, E. P., & Sattler, J. M. (1986). Stanford-Binet
Intelligence Scale: Fourth Edition. Itasca, IL: Riverside Publishing.
U.S. Census Bureau. (2010). Census Redistricting Data (Public Law 94-171)
Summary File Tables P1 and P2. Retrieved February 26, 2012, from
http://www.census.gov/prod/cen2010/briefs/c2010br-02.pdf
U. S. Department of Education National Center for Educational Statistics.
(2009a). Digest of education statistics table 110: Number of 14- through
21-year-old students served under Individuals with Disabilities Education
Act, Part B, who exited school, by exit reason, age, and type of disability:
United States and other jurisdictions, 2005-06 and 2006-07. Retrieved
from http://nces.ed.gov/programs/digest/d09/tables/dt09_110.asp
U. S. Department of Education National Center for Educational Statistics.
(2009b). Fast facts: Elementary/secondary students with disabilities.
Retrieved from http://nces.ed.gov/fastfacts/display.asp?id=64
Velicer, W. F., & Fava, J. L. (1998). Effects of variable and subject sampling on
factor pattern recovery. Psychological Methods, 3, 231-251.
Watkins, M. W. (2006). Orthogonal higher order structure of the Wechsler
Intelligence Scale for Children – Fourth Edition. Psychological
Assessment, 18, 123-125.
Watkins, M. W., Wilson, S. M., Kotz, K. M., Carbone, M. C., & Babula, T.
(2006). Factor structure of the Wechsler Intelligence Scale for Children-
Fourth Edition among referred students. Educational and Psychological
Measurement, 66, 975-983.
Wechsler, D. (1944). The measurement of adult intelligence (3rd ed.). Baltimore,
MD: Williams & Wilkins.
Wechsler, D. (1949). Wechsler Intelligence Scale for Children. San Antonio, TX:
The Psychological Corporation.
70
Wechsler, D. (1991). Wechsler Intelligence Scale for Children–Third Edition. San
Antonio, TX: The Psychological Corporation.
Wechsler, D. (2001) Wechsler Individual Achievement Test–Second Edition. San
Antonio, Texas: The Psychological Corporation.
Wechsler, D. (2003a). Wechsler Intelligence Scale for Children–Fourth Edition.
San Antonio, TX: The Psychological Corporation.
Wechsler, D. (2003b). Wechsler Intelligence Scale for Children–Fourth Edition
technical and interpretive manual. San Antonio, TX: The Psychological
Corporation.
Woodcock, R. W. (1990). Theoretical foundations of the WJ-R measures of
cognitive ability. Journal of Psychoeducational Assessment, 8, 231-258.
Woodcock, R. W., McGrew, K. S., & Mather, N. (2001). Woodcock-Johnson III
Tests of Cognitive Abilities. Itasca, IL: Riverside Publishing.
Woodcock, R. W., & Johnson, M. B. (1977). Woodcock-Johnson Psycho-
educational Battery. Itasca, IL: Riverside Publishing.
Woodcock, R. W., & Johnson, M. B. (1989). Woodcock-Johnson Psycho-
educational Battery – Revised. Itasca, IL: Riverside Publishing.
Wolff, H. G., & Preising, K. (2005). Exploring item and higher order factor
structure with the Schmid-Leiman solution: Syntax codes for SPSS and
SAS. Behavior Research Methods, 37, 45-58.
71
APPENDIX A
RESULTS OF AN EXPLORATORY FACTOR ANALYSIS OF STUDENTS
WITH A PRIMARY SPECIAL EDUCATION CLASSIFICATION OF A
SPECIFIC LEARNING DISABILITY
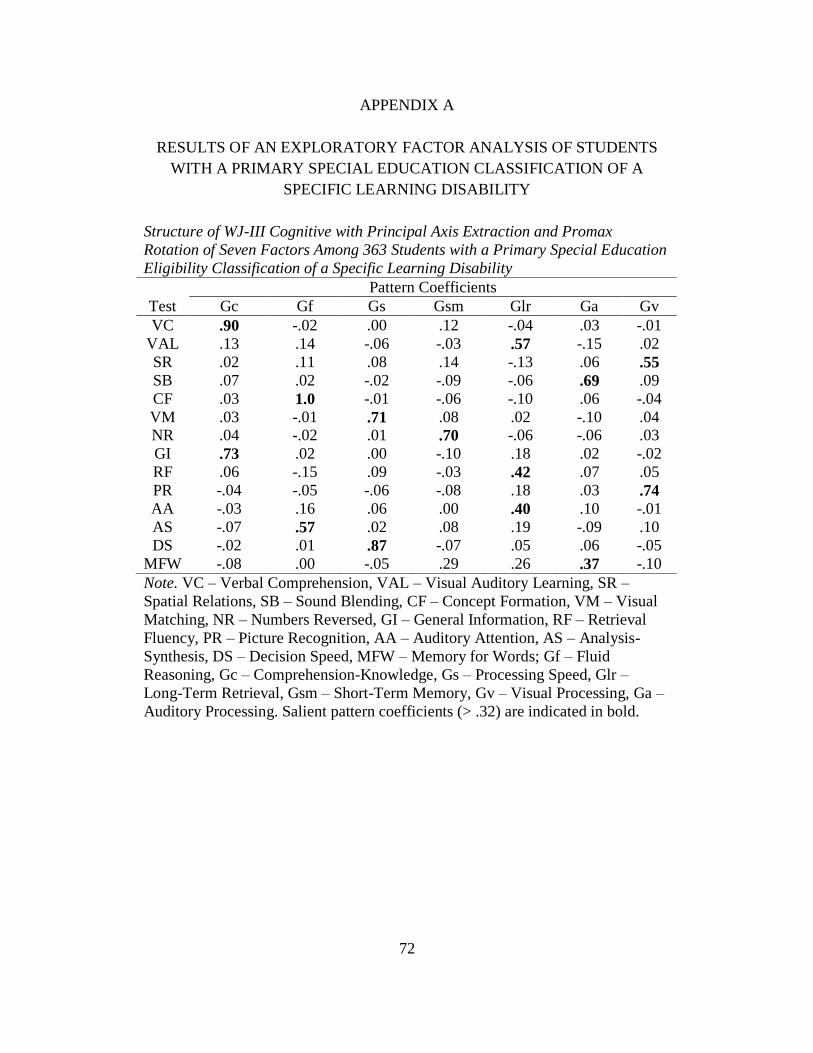
72
APPENDIX A
RESULTS OF AN EXPLORATORY FACTOR ANALYSIS OF STUDENTS
WITH A PRIMARY SPECIAL EDUCATION CLASSIFICATION OF A
SPECIFIC LEARNING DISABILITY
Structure of WJ-III Cognitive with Principal Axis Extraction and Promax
Rotation of Seven Factors Among 363 Students with a Primary Special Education
Eligibility Classification of a Specific Learning Disability
Pattern Coefficients
Test Gc Gf Gs Gsm Glr Ga Gv
VC .90 -.02 .00 .12 -.04 .03 -.01
VAL .13 .14 -.06 -.03 .57 -.15 .02
SR .02 .11 .08 .14 -.13 .06 .55
SB .07 .02 -.02 -.09 -.06 .69 .09
CF .03 1.0 -.01 -.06 -.10 .06 -.04
VM .03 -.01 .71 .08 .02 -.10 .04 NR .04 -.02 .01 .70 -.06 -.06 .03
GI .73 .02 .00 -.10 .18 .02 -.02
RF .06 -.15 .09 -.03 .42 .07 .05
PR -.04 -.05 -.06 -.08 .18 .03 .74
AA -.03 .16 .06 .00 .40 .10 -.01
AS -.07 .57 .02 .08 .19 -.09 .10
DS -.02 .01 .87 -.07 .05 .06 -.05
MFW -.08 .00 -.05 .29 .26 .37 -.10
Note. VC – Verbal Comprehension, VAL – Visual Auditory Learning, SR –
Spatial Relations, SB – Sound Blending, CF – Concept Formation, VM – Visual
Matching, NR – Numbers Reversed, GI – General Information, RF – Retrieval
Fluency, PR – Picture Recognition, AA – Auditory Attention, AS – Analysis-
Synthesis, DS – Decision Speed, MFW – Memory for Words; Gf – Fluid
Reasoning, Gc – Comprehension-Knowledge, Gs – Processing Speed, Glr –
Long-Term Retrieval, Gsm – Short-Term Memory, Gv – Visual Processing, Ga –
Auditory Processing. Salient pattern coefficients (> .32) are indicated in bold.
73
APPENDIX B
RESULTS OF AN EXPLORATORY FACTOR ANALYSIS OF STUDENTS
WHO DID NOT QUALIFY FOR SPECIAL EDUCATION ELIGIBILITY OR
HAD A PRIMARY CLASSIFICATION OTHER THAN A SPECIFIC
LEARNING DISABILITY
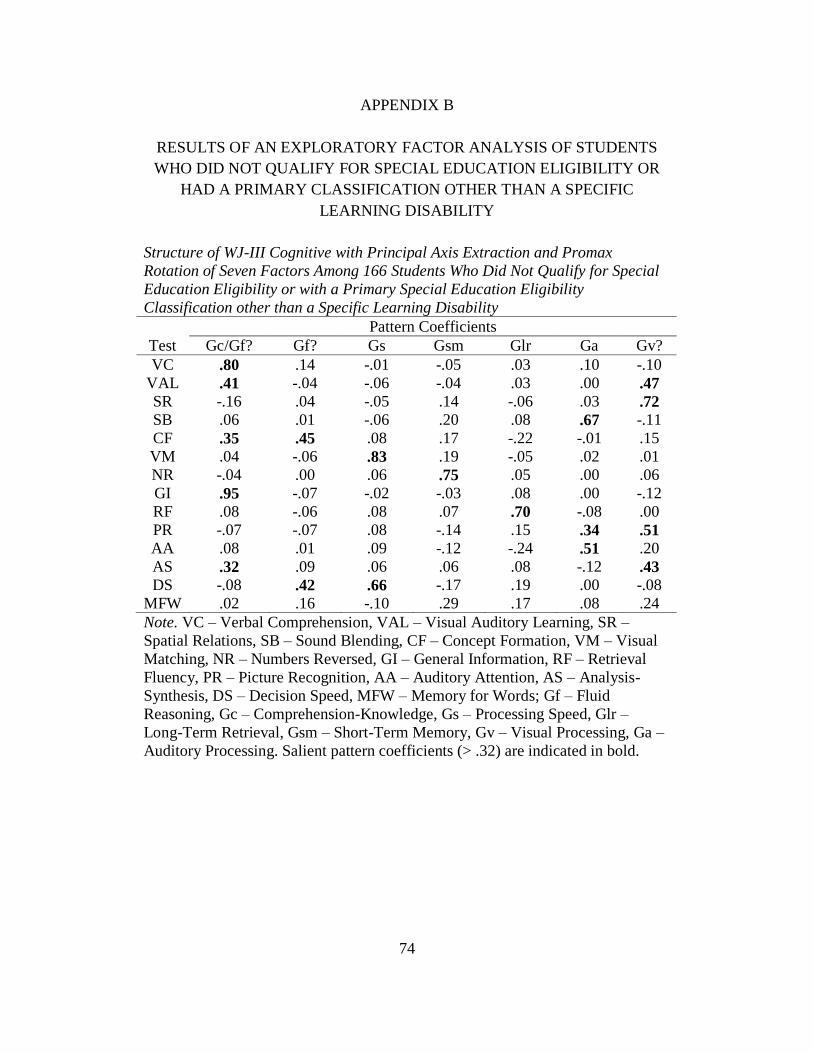
74
APPENDIX B
RESULTS OF AN EXPLORATORY FACTOR ANALYSIS OF STUDENTS
WHO DID NOT QUALIFY FOR SPECIAL EDUCATION ELIGIBILITY OR
HAD A PRIMARY CLASSIFICATION OTHER THAN A SPECIFIC
LEARNING DISABILITY
Structure of WJ-III Cognitive with Principal Axis Extraction and Promax
Rotation of Seven Factors Among 166 Students Who Did Not Qualify for Special
Education Eligibility or with a Primary Special Education Eligibility
Classification other than a Specific Learning Disability
Pattern Coefficients
Test Gc/Gf? Gf? Gs Gsm Glr Ga Gv?
VC .80 .14 -.01 -.05 .03 .10 -.10
VAL .41 -.04 -.06 -.04 .03 .00 .47
SR -.16 .04 -.05 .14 -.06 .03 .72
SB .06 .01 -.06 .20 .08 .67 -.11
CF .35 .45 .08 .17 -.22 -.01 .15
VM .04 -.06 .83 .19 -.05 .02 .01
NR -.04 .00 .06 .75 .05 .00 .06
GI .95 -.07 -.02 -.03 .08 .00 -.12
RF .08 -.06 .08 .07 .70 -.08 .00
PR -.07 -.07 .08 -.14 .15 .34 .51
AA .08 .01 .09 -.12 -.24 .51 .20
AS .32 .09 .06 .06 .08 -.12 .43
DS -.08 .42 .66 -.17 .19 .00 -.08
MFW .02 .16 -.10 .29 .17 .08 .24
Note. VC – Verbal Comprehension, VAL – Visual Auditory Learning, SR –
Spatial Relations, SB – Sound Blending, CF – Concept Formation, VM – Visual
Matching, NR – Numbers Reversed, GI – General Information, RF – Retrieval
Fluency, PR – Picture Recognition, AA – Auditory Attention, AS – Analysis-
Synthesis, DS – Decision Speed, MFW – Memory for Words; Gf – Fluid
Reasoning, Gc – Comprehension-Knowledge, Gs – Processing Speed, Glr –
Long-Term Retrieval, Gsm – Short-Term Memory, Gv – Visual Processing, Ga –
Auditory Processing. Salient pattern coefficients (> .32) are indicated in bold.