Embed Size (px)
Citation preview
Bea Naranjo Todd MoseleyTelephone: 713.522.4646
[email protected]@moseleycommercial.com
www.moseleycommercial.com4309 Center Street, Houston, Texas 77007
This property is subject to prior sale, lease or financing, change in price, rental or other conditions, corrections, errors, omissions or removal from the market without notice. All
information contained in this presentation, while based upon information supplied by sources deemed to be reliable, is not, in any way, warranted or guaranteed, either expressed or
implied, by Moseley Commercial Real Estate, Inc. All information contained herein should be verified to the satisfaction of the person relying thereon. This presentation is to be used
solely for information. Under no circumstances whatsoever is it to be deemed a contract, note, memorandum or any other form of binding commitment.
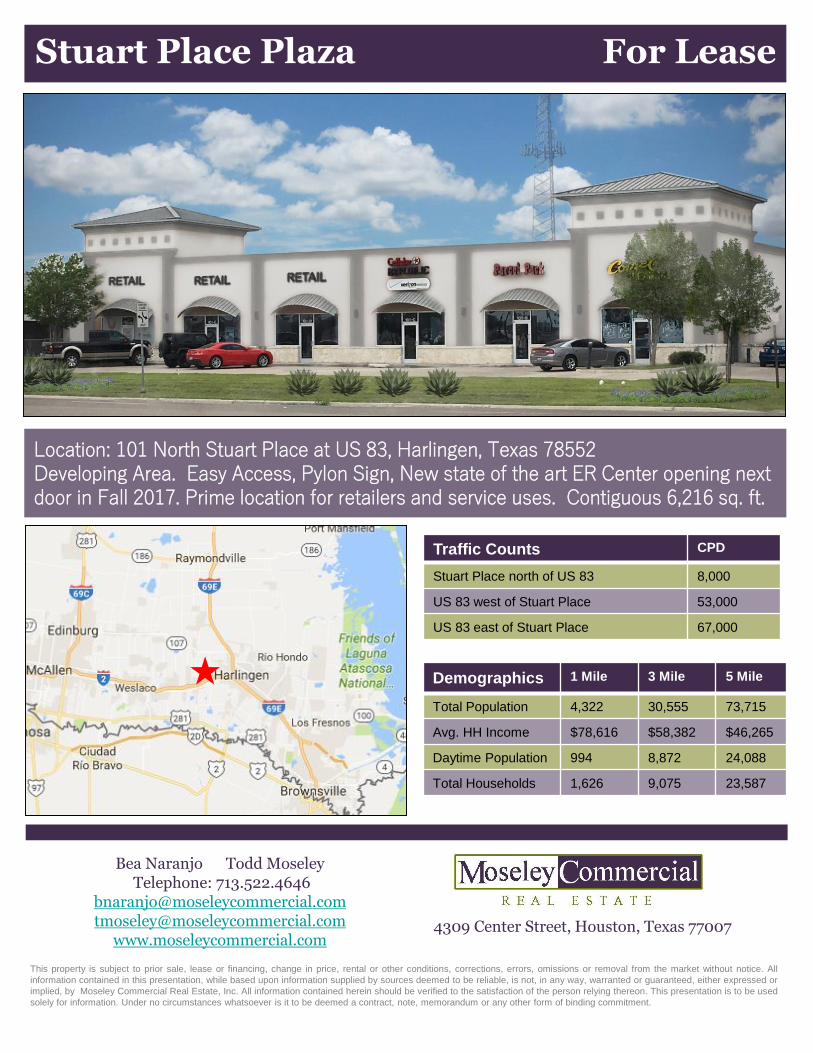
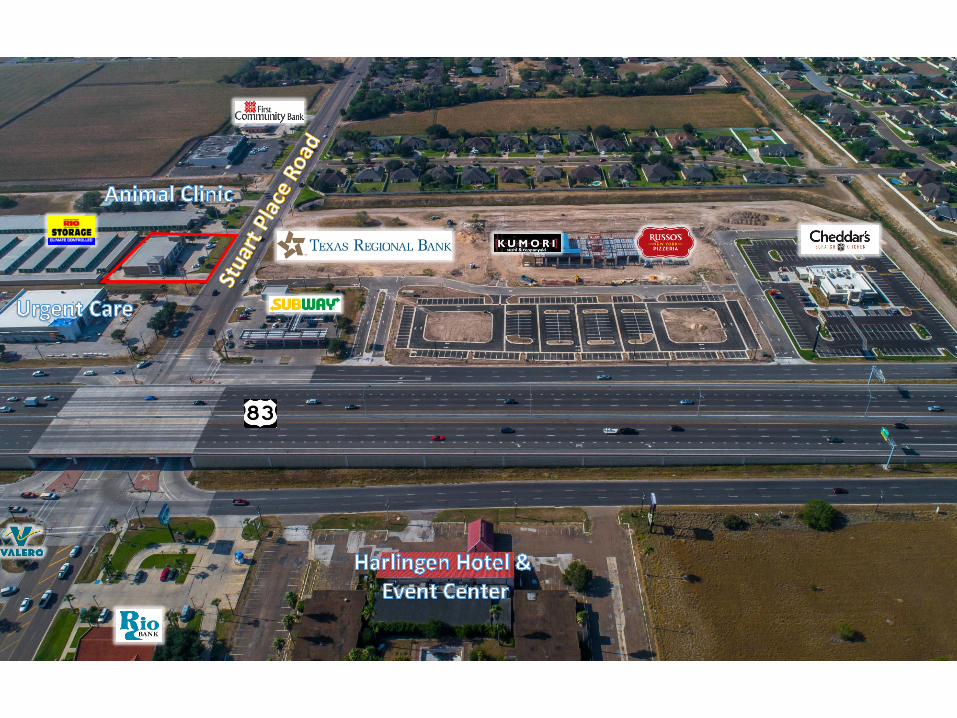
Stuart Place Plaza For Lease
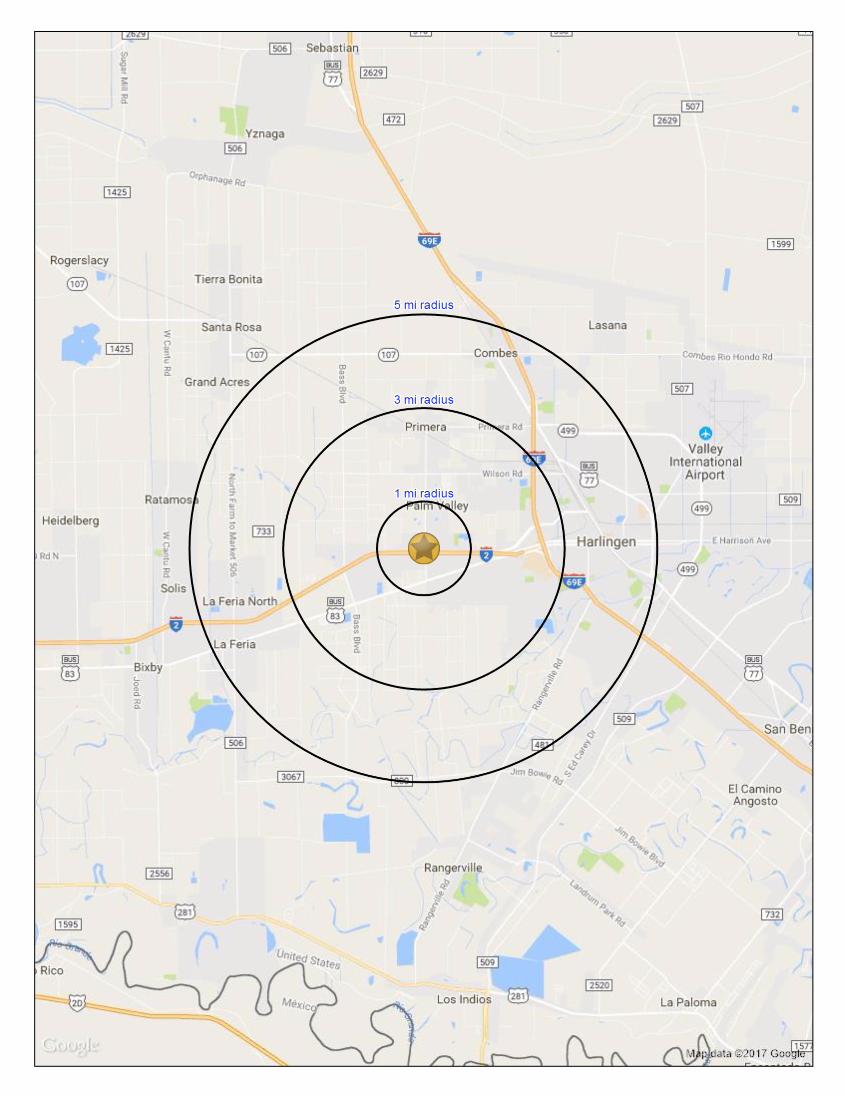
Demographics 1 Mile 3 Mile 5 Mile
Total Population 4,322 30,555 73,715
Avg. HH Income $78,616 $58,382 $46,265
Daytime Population 994 8,872 24,088
Total Households 1,626 9,075 23,587
Traffic Counts CPD
Stuart Place north of US 83 8,000
US 83 west of Stuart Place 53,000
US 83 east of Stuart Place 67,000
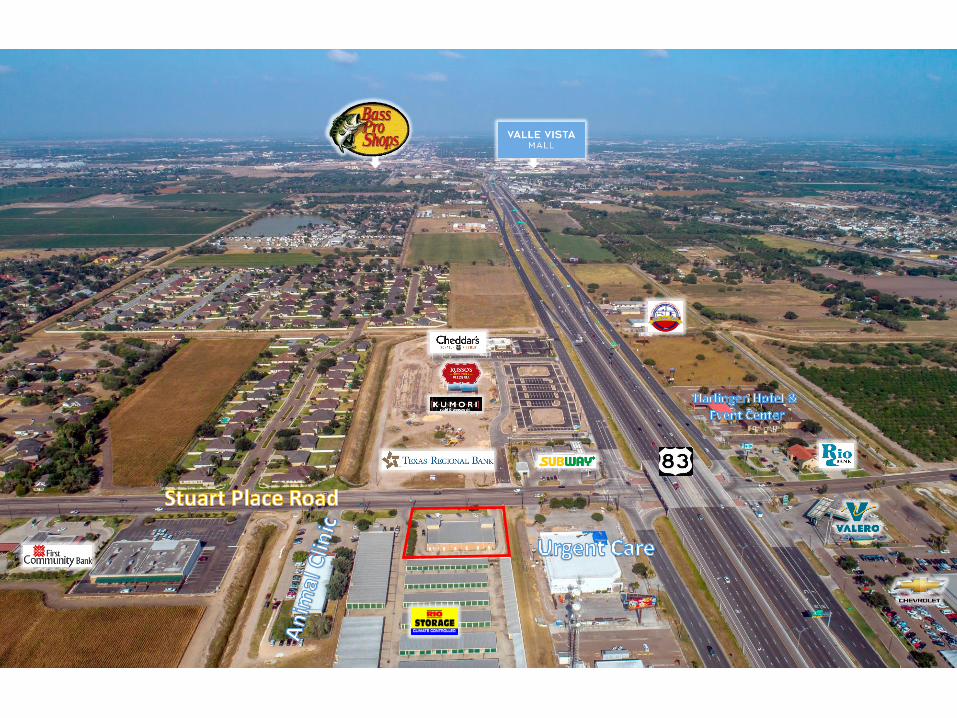
Location: 101 North Stuart Place at US 83, Harlingen, Texas 78552Developing Area. Easy Access, Pylon Sign, New state of the art ER Center opening next door in Fall 2017. Prime location for retailers and service uses. Contiguous 6,216 sq. ft.
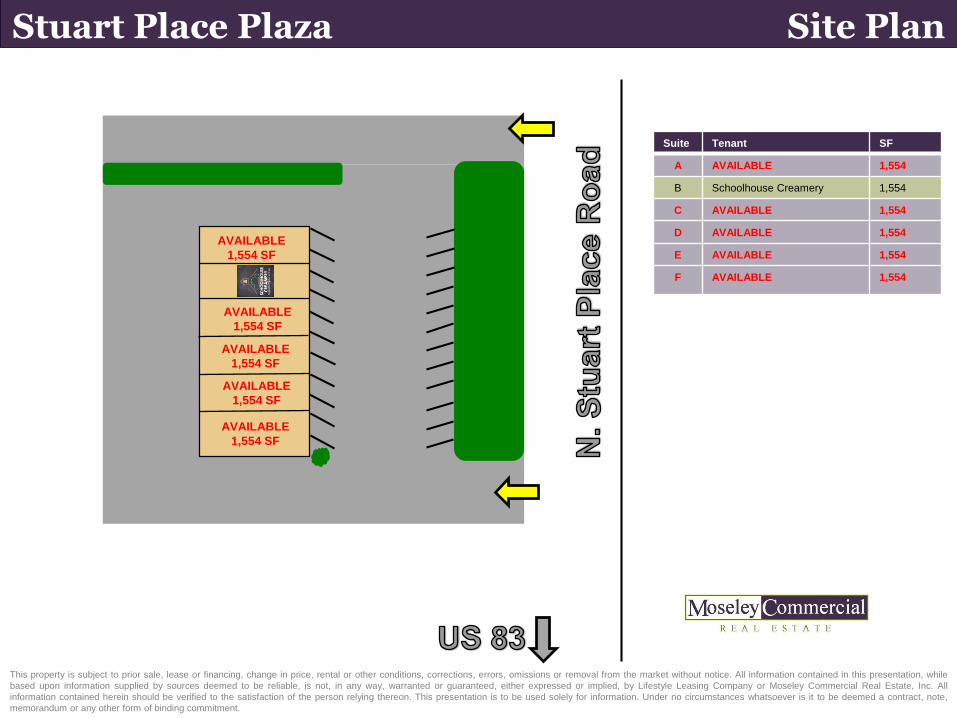
Stuart Place Plaza Site Plan
This property is subject to prior sale, lease or financing, change in price, rental or other conditions, corrections, errors, omissions or removal from the market without notice. All information contained in this presentation, while
based upon information supplied by sources deemed to be reliable, is not, in any way, warranted or guaranteed, either expressed or implied, by Lifestyle Leasing Company or Moseley Commercial Real Estate, Inc. All
information contained herein should be verified to the satisfaction of the person relying thereon. This presentation is to be used solely for information. Under no circumstances whatsoever is it to be deemed a contract, note,
memorandum or any other form of binding commitment.
Suite Tenant SF
A AVAILABLE 1,554
B Schoolhouse Creamery 1,554
C AVAILABLE 1,554
D AVAILABLE 1,554
E AVAILABLE 1,554
F AVAILABLE 1,554
AVAILABLE
1,554 SF
AVAILABLE
1,554 SF
AVAILABLE
1,554 SF
AVAILABLE
1,554 SF
AVAILABLE
1,554 SF
Demographic Source: Applied Geographic Solutions 10/2016, TIGER Geography page 1 of 3©2017, Sites USA, Chandler, Arizona, 480-491-1112
Th
is r
ep
ort
wa
s p
rod
uce
d u
sin
g d
ata
fro
m p
riva
te a
nd
go
vern
me
nt
sou
rce
s d
ee
me
d t
o b
e r
elia
ble
. T
he
info
rma
tio
n h
ere
in is
pro
vid
ed
with
ou
t re
pre
sen
tatio
n o
r w
arr
an
ty.
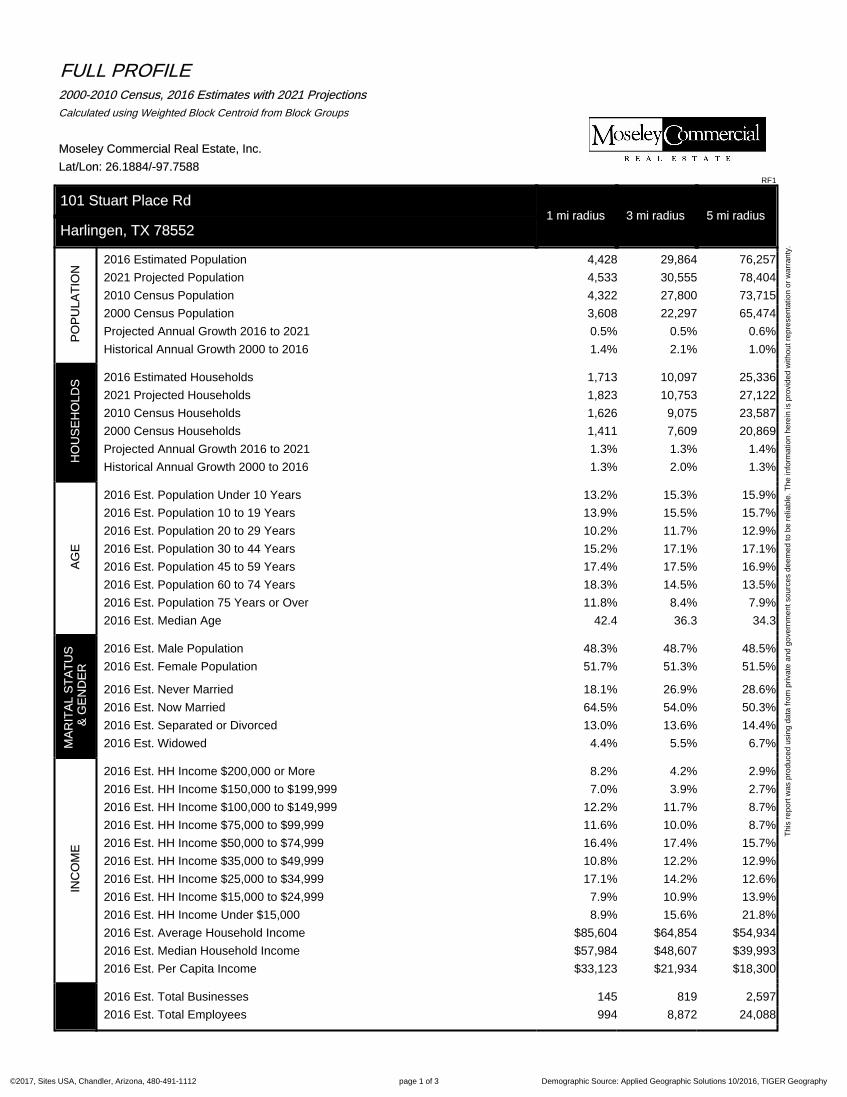
FULL PROFILE2000-2010 Census, 2016 Estimates with 2021 Projections
Calculated using Weighted Block Centroid from Block Groups
Moseley Commercial Real Estate, Inc.
Lat/Lon: 26.1884/-97.7588RF1
101 Stuart Place Rd1 mi radius 3 mi radius 5 mi radius
Harlingen, TX 78552
PO
PU
LA
TIO
N
2016 Estimated Population 4,428 29,864 76,257
2021 Projected Population 4,533 30,555 78,404
2010 Census Population 4,322 27,800 73,715
2000 Census Population 3,608 22,297 65,474
Projected Annual Growth 2016 to 2021 0.5% 0.5% 0.6%
Historical Annual Growth 2000 to 2016 1.4% 2.1% 1.0%
HO
US
EH
OL
DS
2016 Estimated Households 1,713 10,097 25,336
2021 Projected Households 1,823 10,753 27,122
2010 Census Households 1,626 9,075 23,587
2000 Census Households 1,411 7,609 20,869
Projected Annual Growth 2016 to 2021 1.3% 1.3% 1.4%
Historical Annual Growth 2000 to 2016 1.3% 2.0% 1.3%
AG
E
2016 Est. Population Under 10 Years 13.2% 15.3% 15.9%
2016 Est. Population 10 to 19 Years 13.9% 15.5% 15.7%
2016 Est. Population 20 to 29 Years 10.2% 11.7% 12.9%
2016 Est. Population 30 to 44 Years 15.2% 17.1% 17.1%
2016 Est. Population 45 to 59 Years 17.4% 17.5% 16.9%
2016 Est. Population 60 to 74 Years 18.3% 14.5% 13.5%
2016 Est. Population 75 Years or Over 11.8% 8.4% 7.9%
2016 Est. Median Age 42.4 36.3 34.3
MA
RIT
AL
ST
AT
US
&
GE
ND
ER
2016 Est. Male Population 48.3% 48.7% 48.5%
2016 Est. Female Population 51.7% 51.3% 51.5%
2016 Est. Never Married 18.1% 26.9% 28.6%
2016 Est. Now Married 64.5% 54.0% 50.3%
2016 Est. Separated or Divorced 13.0% 13.6% 14.4%
2016 Est. Widowed 4.4% 5.5% 6.7%
INC
OM
E
2016 Est. HH Income $200,000 or More 8.2% 4.2% 2.9%
2016 Est. HH Income $150,000 to $199,999 7.0% 3.9% 2.7%
2016 Est. HH Income $100,000 to $149,999 12.2% 11.7% 8.7%
2016 Est. HH Income $75,000 to $99,999 11.6% 10.0% 8.7%
2016 Est. HH Income $50,000 to $74,999 16.4% 17.4% 15.7%
2016 Est. HH Income $35,000 to $49,999 10.8% 12.2% 12.9%
2016 Est. HH Income $25,000 to $34,999 17.1% 14.2% 12.6%
2016 Est. HH Income $15,000 to $24,999 7.9% 10.9% 13.9%
2016 Est. HH Income Under $15,000 8.9% 15.6% 21.8%
2016 Est. Average Household Income $85,604 $64,854 $54,934
2016 Est. Median Household Income $57,984 $48,607 $39,993
2016 Est. Per Capita Income $33,123 $21,934 $18,300
2016 Est. Total Businesses 145 819 2,597
2016 Est. Total Employees 994 8,872 24,088
Demographic Source: Applied Geographic Solutions 10/2016, TIGER Geography page 2 of 3©2017, Sites USA, Chandler, Arizona, 480-491-1112
Th
is r
ep
ort
wa
s p
rod
uce
d u
sin
g d
ata
fro
m p
riva
te a
nd
go
vern
me
nt
sou
rce
s d
ee
me
d t
o b
e r
elia
ble
. T
he
info
rma
tio
n h
ere
in is
pro
vid
ed
with
ou
t re
pre
sen
tatio
n o
r w
arr
an
ty.
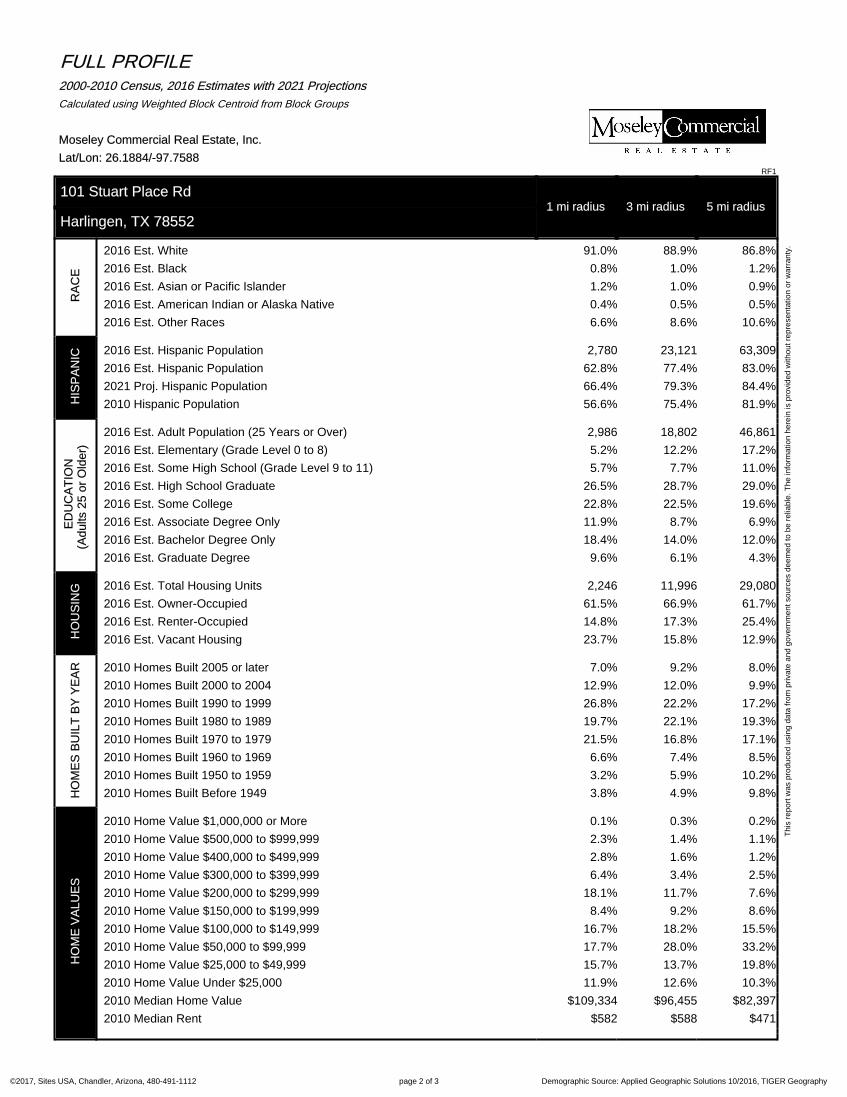
FULL PROFILE2000-2010 Census, 2016 Estimates with 2021 Projections
Calculated using Weighted Block Centroid from Block Groups
Moseley Commercial Real Estate, Inc.
Lat/Lon: 26.1884/-97.7588RF1
101 Stuart Place Rd1 mi radius 3 mi radius 5 mi radius
Harlingen, TX 78552
RA
CE
2016 Est. White 91.0% 88.9% 86.8%
2016 Est. Black 0.8% 1.0% 1.2%
2016 Est. Asian or Pacific Islander 1.2% 1.0% 0.9%
2016 Est. American Indian or Alaska Native 0.4% 0.5% 0.5%
2016 Est. Other Races 6.6% 8.6% 10.6%
HIS
PA
NIC 2016 Est. Hispanic Population 2,780 23,121 63,309
2016 Est. Hispanic Population 62.8% 77.4% 83.0%
2021 Proj. Hispanic Population 66.4% 79.3% 84.4%
2010 Hispanic Population 56.6% 75.4% 81.9%
ED
UC
AT
ION
(Ad
ults
25
or
Old
er)
2016 Est. Adult Population (25 Years or Over) 2,986 18,802 46,861
2016 Est. Elementary (Grade Level 0 to 8) 5.2% 12.2% 17.2%
2016 Est. Some High School (Grade Level 9 to 11) 5.7% 7.7% 11.0%
2016 Est. High School Graduate 26.5% 28.7% 29.0%
2016 Est. Some College 22.8% 22.5% 19.6%
2016 Est. Associate Degree Only 11.9% 8.7% 6.9%
2016 Est. Bachelor Degree Only 18.4% 14.0% 12.0%
2016 Est. Graduate Degree 9.6% 6.1% 4.3%
HO
US
ING 2016 Est. Total Housing Units 2,246 11,996 29,080
2016 Est. Owner-Occupied 61.5% 66.9% 61.7%
2016 Est. Renter-Occupied 14.8% 17.3% 25.4%
2016 Est. Vacant Housing 23.7% 15.8% 12.9%
HO
ME
S B
UIL
T B
Y Y
EA
R 2010 Homes Built 2005 or later 7.0% 9.2% 8.0%
2010 Homes Built 2000 to 2004 12.9% 12.0% 9.9%
2010 Homes Built 1990 to 1999 26.8% 22.2% 17.2%
2010 Homes Built 1980 to 1989 19.7% 22.1% 19.3%
2010 Homes Built 1970 to 1979 21.5% 16.8% 17.1%
2010 Homes Built 1960 to 1969 6.6% 7.4% 8.5%
2010 Homes Built 1950 to 1959 3.2% 5.9% 10.2%
2010 Homes Built Before 1949 3.8% 4.9% 9.8%
HO
ME
VA
LU
ES
2010 Home Value $1,000,000 or More 0.1% 0.3% 0.2%
2010 Home Value $500,000 to $999,999 2.3% 1.4% 1.1%
2010 Home Value $400,000 to $499,999 2.8% 1.6% 1.2%
2010 Home Value $300,000 to $399,999 6.4% 3.4% 2.5%
2010 Home Value $200,000 to $299,999 18.1% 11.7% 7.6%
2010 Home Value $150,000 to $199,999 8.4% 9.2% 8.6%
2010 Home Value $100,000 to $149,999 16.7% 18.2% 15.5%
2010 Home Value $50,000 to $99,999 17.7% 28.0% 33.2%
2010 Home Value $25,000 to $49,999 15.7% 13.7% 19.8%
2010 Home Value Under $25,000 11.9% 12.6% 10.3%
2010 Median Home Value $109,334 $96,455 $82,397
2010 Median Rent $582 $588 $471
Demographic Source: Applied Geographic Solutions 10/2016, TIGER Geography page 3 of 3©2017, Sites USA, Chandler, Arizona, 480-491-1112
Th
is r
ep
ort
wa
s p
rod
uce
d u
sin
g d
ata
fro
m p
riva
te a
nd
go
vern
me
nt
sou
rce
s d
ee
me
d t
o b
e r
elia
ble
. T
he
info
rma
tio
n h
ere
in is
pro
vid
ed
with
ou
t re
pre
sen
tatio
n o
r w
arr
an
ty.
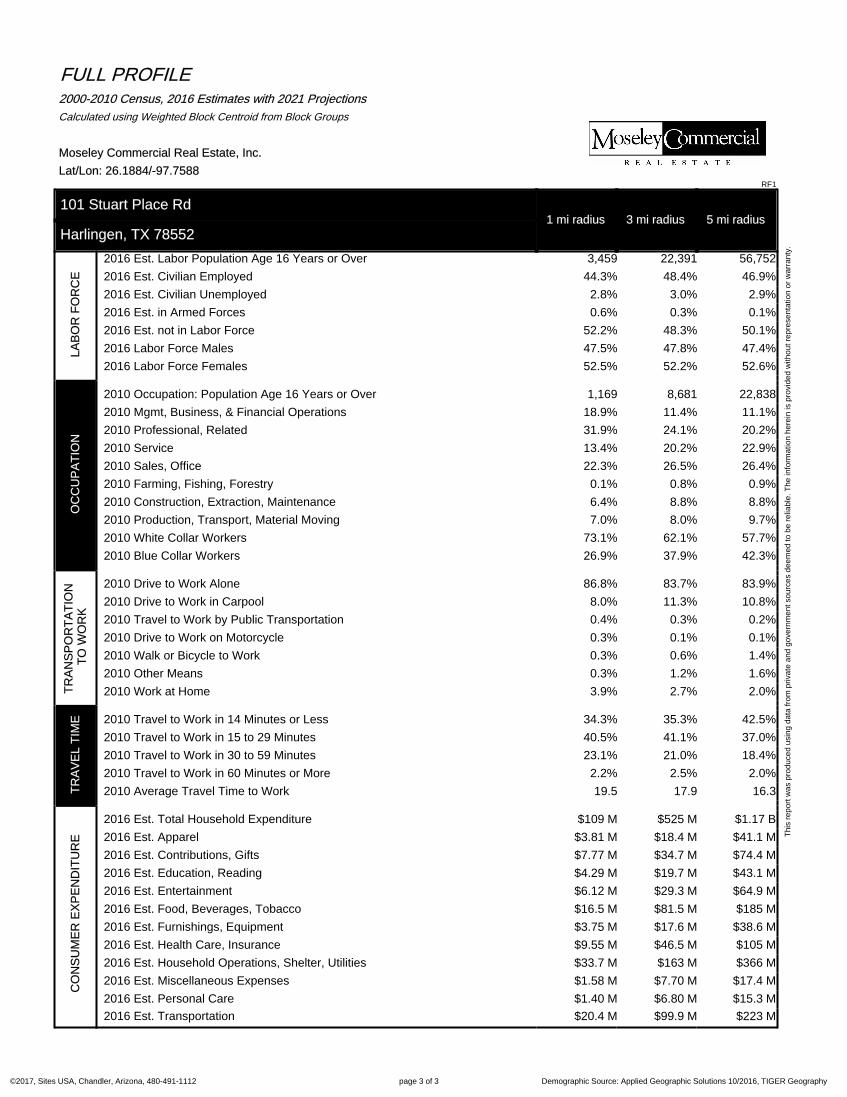
FULL PROFILE2000-2010 Census, 2016 Estimates with 2021 Projections
Calculated using Weighted Block Centroid from Block Groups
Moseley Commercial Real Estate, Inc.
Lat/Lon: 26.1884/-97.7588RF1
101 Stuart Place Rd1 mi radius 3 mi radius 5 mi radius
Harlingen, TX 78552
LA
BO
R F
OR
CE
2016 Est. Labor Population Age 16 Years or Over 3,459 22,391 56,752
2016 Est. Civilian Employed 44.3% 48.4% 46.9%
2016 Est. Civilian Unemployed 2.8% 3.0% 2.9%
2016 Est. in Armed Forces 0.6% 0.3% 0.1%
2016 Est. not in Labor Force 52.2% 48.3% 50.1%
2016 Labor Force Males 47.5% 47.8% 47.4%
2016 Labor Force Females 52.5% 52.2% 52.6%
OC
CU
PA
TIO
N
2010 Occupation: Population Age 16 Years or Over 1,169 8,681 22,838
2010 Mgmt, Business, & Financial Operations 18.9% 11.4% 11.1%
2010 Professional, Related 31.9% 24.1% 20.2%
2010 Service 13.4% 20.2% 22.9%
2010 Sales, Office 22.3% 26.5% 26.4%
2010 Farming, Fishing, Forestry 0.1% 0.8% 0.9%
2010 Construction, Extraction, Maintenance 6.4% 8.8% 8.8%
2010 Production, Transport, Material Moving 7.0% 8.0% 9.7%
2010 White Collar Workers 73.1% 62.1% 57.7%
2010 Blue Collar Workers 26.9% 37.9% 42.3%
TR
AN
SP
OR
TA
TIO
N
TO
WO
RK
2010 Drive to Work Alone 86.8% 83.7% 83.9%
2010 Drive to Work in Carpool 8.0% 11.3% 10.8%
2010 Travel to Work by Public Transportation 0.4% 0.3% 0.2%
2010 Drive to Work on Motorcycle 0.3% 0.1% 0.1%
2010 Walk or Bicycle to Work 0.3% 0.6% 1.4%
2010 Other Means 0.3% 1.2% 1.6%
2010 Work at Home 3.9% 2.7% 2.0%
TR
AV
EL
TIM
E 2010 Travel to Work in 14 Minutes or Less 34.3% 35.3% 42.5%
2010 Travel to Work in 15 to 29 Minutes 40.5% 41.1% 37.0%
2010 Travel to Work in 30 to 59 Minutes 23.1% 21.0% 18.4%
2010 Travel to Work in 60 Minutes or More 2.2% 2.5% 2.0%
2010 Average Travel Time to Work 19.5 17.9 16.3
CO
NS
UM
ER
EX
PE
ND
ITU
RE
2016 Est. Total Household Expenditure $109 M $525 M $1.17 B
2016 Est. Apparel $3.81 M $18.4 M $41.1 M
2016 Est. Contributions, Gifts $7.77 M $34.7 M $74.4 M
2016 Est. Education, Reading $4.29 M $19.7 M $43.1 M
2016 Est. Entertainment $6.12 M $29.3 M $64.9 M
2016 Est. Food, Beverages, Tobacco $16.5 M $81.5 M $185 M
2016 Est. Furnishings, Equipment $3.75 M $17.6 M $38.6 M
2016 Est. Health Care, Insurance $9.55 M $46.5 M $105 M
2016 Est. Household Operations, Shelter, Utilities $33.7 M $163 M $366 M
2016 Est. Miscellaneous Expenses $1.58 M $7.70 M $17.4 M
2016 Est. Personal Care $1.40 M $6.80 M $15.3 M
2016 Est. Transportation $20.4 M $99.9 M $223 M
11-2-2015
Information About Brokerage ServicesTexas law requires all real estate license holders to give the following informaƟon about
brokerage services to prospecƟve buyers, tenants, sellers and landlords.
TYPES OF REAL ESTATE LICENSE HOLDERS: .• A BROKER is responsible for all brokerage acƟviƟes, including acts performed by sales agents sponsored by the broker. • A SALES AGENT must be sponsored by a broker and works with clients on behalf of the broker.
A BROKER’S MINIMUM DUTIES REQUIRED BY LAW (A client is the person or party that the broker represents): • Put the interests of the client above all others, including the broker’s own interests; • Inform the client of any material informaƟon about the property or transacƟon received by the broker; • Answer the client’s quesƟons and present any offer to or counter-offer from the client; and • Treat all parƟes to a real estate transacƟon honestly and fairly.
A LICENSE HOLDER CAN REPRESENT A PARTY IN A REAL ESTATE TRANSACTION:
AS AGENT FOR OWNER (SELLER/LANDLORD): The broker becomes the property owner's agent through an agreement with the owner, usually in a wriƩen lisƟng to sell or property management agreement. An owner's agent must perform the broker’s minimum duƟes above and must inform the owner of any material informaƟon about the property or transacƟon known by the agent, including informaƟon disclosed to the agent or subagent by the buyer or buyer’s agent.
AS AGENT FOR BUYER/TENANT: The broker becomes the buyer/tenant's agent by agreeing to represent the buyer, usually through a wriƩen representaƟon agreement. A buyer's agent must perform the broker’s minimum duƟes above and must inform the buyer of any material informaƟon about the property or transacƟon known by the agent, including informaƟon disclosed to the agent by the seller or seller’s agent.
AS AGENT FOR BOTH - INTERMEDIARY: To act as an intermediary between the parƟes the broker must first obtain the wriƩen agreement of each party to the transacƟon. The wriƩen agreement must state who will pay the broker and, in conspicuous bold or underlined print, set forth the broker's obligaƟons as an intermediary. A broker who acts as an intermediary:
• Must treat all parƟes to the transacƟon imparƟally and fairly; • May, with the parƟes' wriƩen consent, appoint a different license holder associated with the broker to each party (owner and
buyer) to communicate with, provide opinions and advice to, and carry out the instrucƟons of each party to the transacƟon. • Must not, unless specifically authorized in wriƟng to do so by the party, disclose:
ᴑ that the owner will accept a price less than the wriƩen asking price; ᴑ that the buyer/tenant will pay a price greater than the price submiƩed in a wriƩen offer; and ᴑ any confidenƟal informaƟon or any other informaƟon that a party specifically instructs the broker in wriƟng not to
disclose, unless required to do so by law.
AS SUBAGENT: A license holder acts as a subagent when aiding a buyer in a transacƟon without an agreement to represent the buyer. A subagent can assist the buyer but does not represent the buyer and must place the interests of the owner first.
TO AVOID DISPUTES, ALL AGREEMENTS BETWEEN YOU AND A BROKER SHOULD BE IN WRITING AND CLEARLY ESTABLISH: • The broker’s duƟes and responsibiliƟes to you, and your obligaƟons under the representaƟon agreement. • Who will pay the broker for services provided to you, when payment will be made and how the payment will be calculated.
LICENSE HOLDER CONTACT INFORMATION: This noƟce is being provided for informaƟon purposes. It does not create an obligaƟon for you to use the broker’s services. Please acknowledge receipt of this noƟce below and retain a copy for your records.
Licensed Broker /Broker Firm Name or Primary Assumed Business Name
License No. Email Phone
Designated Broker of Firm License No. Email Phone
Licensed Supervisor of Sales Agent/Associate
License No. Email Phone
Sales Agent/Associate’s Name License No. Email Phone
Regulated by the Texas Real Estate Commission
Buyer/Tenant/Seller/Landlord Initials
InformaƟon available at www.trec.texas.gov IABS 1-0
Date