Embed Size (px)
Citation preview
Student Achievement in the Cisco Networking Academy: Performance in the CCNA1 Course
Alan Dennis,1 Hasan Cakir,2 Ali Korkmaz,2
Thomas Duffy,2 Barbara Bichelmeyer,2 JoAnne Bunnage.1 1. Kelley School of Business 2. School of Education
Indiana University, Bloomington, IN, 47405
Abstract
This paper examines the student, program delivery and school factors that influenced student achievement in the Cisco Networking Academy. The Academy uses the Internet to distribute a centrally developed curriculum and standards-based online testing, and combines that with local instructors who teach classes to students. This study, conducted with 10,371 students at 1,651 schools, found that individual student ability, gender, age, and motivation were the most important influences on student achievement. Instruction quality was also important, but unlike prior studies, the impact of school level factors was small. We conclude that this combination of centralized curriculum, standards-based testing, and local instruction worked equally well in a variety of environments and enabled students to reach their own potential.
1. Introduction∗
The Internet has created new opportunities for teaching and learning in the same way that it has created new opportunities for commerce [30]. Internet-based learning has grown dramatically over the past decade, primarily because non-traditional students have found it an efficient and effective venue to obtain additional training and education [58]. Although most online learning is conducted by having students and instructors interact primarily through the Internet, an alternative form called blended learning combines the Internet with face-to-face in-class instruction [41, 43, 53].
It is, of course, difficult to discuss the impact of technology-enabled learning in general because there are many different ways in which such programs can be designed and implemented. Therefore, in the rest of this paper, we focus on one specific technology-enabled learning program, the Cisco Networking Academy, and examine the individual and school factors that affect the success of its students. ∗This research was funded by a grant from the Cisco Learning Institute. We would like to thank David Alexander, Tara Collison, Amanda Cumberland, John Morgridge, Mark Svorinic, and the rest of CLI and Cisco Systems, Inc. for their help in this research.
The Cisco Networking Academy is a blended learning program which combines centralized curriculum and standards-based testing delivered over the Internet with local instruction. In other words, the program exerts strong control over the content but leaves the pedagogy of teaching to local instructors at each school.
The purpose of this study is to examine the factors that affect student achievement in this type of technology-enabled environment. We examine three classes of factors most often associated with variations in student academic success in traditional educational settings [34, 56]: school, program delivery, and student. If centralized curriculum and standards-based testing delivered over the Internet and taught by local instructors is successful, then the impact of these factors may be somewhat different than what has been found in traditional settings.
2. The Cisco Networking Academy
The Cisco Networking Academy was established
to provide networking education to students around the world. The Academy currently serves over 400,000 students at almost 10,000 high schools, community colleges, universities, and non-traditional settings (e.g., career centers, correctional facilities, shelters) in more than 150 countries around the world. The Academy offers several programs, the most popular of which is the Cisco Certified Network Associate (CCNA) program. The CCNA program consists of four separate courses taken in sequence (although at the university level, the first two CCNA courses are typically combined into one course, and the second two into a second course).
There are four key components to the Cisco Networking Academy environment: 1) a centralized curriculum distributed over the Internet; 2) standards-based testing distributed over the Internet; 3) locally customized instruction; and 4) an instructor support system for training, support, and certification.
First, all curriculum materials are designed by a Cisco team consisting of subject matter experts and educators and distributed over the Internet (traditional paper textbooks are also available, but not widely used). The curriculum is updated regularly
Proceedings of the 39th Hawaii International Conference on System Sciences - 2006
10-7695-2507-5/06/$20.00 (C) 2006 IEEE
based on task analyses of what network engineers need to work effectively in organizations and based on state department of education standards for high school level math, science, and language arts. Instructors and students may access materials from any computer with a Web browser using a proprietary course management system. The curriculum includes online, interactive learning materials such as readings, pictures, and animations, as well as a series of exercises intended to be conducted in a network lab. Network simulation tools are an optional part of the curriculum. Instructors can supplement the curriculum materials; the curriculum provided by Cisco is the minimum amount of material that must be covered.
Second, the standards-based competency tests provided by Cisco include both interactive online exams and hands-on practicum tests. These tests are developed by the same Cisco group that develops the Cisco certification exams and are intended to cover the same material to the same standards. The tests are designed using advanced statistical techniques most commonly used for state-wide or national exams rather than for classroom tests and provide immediate personalized feedback that highlights mistakes and directs students via links to sections of the curriculum they need to relearn. The tests are designed to be both formative and summative; students can retake tests following a mastery strategy, but all scores are recorded. The CCNA program defines minimum standards that students must achieve before they can progress to the next CCNA course. More than 30,000 online tests are taken each day.
Third, instructors have complete freedom in deciding how their courses will be taught. Some instructors use traditional lectures, others use small group discussion, while others use chapter tests to guide class discussion. Instructors are also free to decide how they use the standards-based tests to determine students’ grades for their school courses. For example, a university instructor might decide that a student’s first attempt final exam score would count for 80% of the course grade, while a high school instructor might allow students to use their highest grades after re-taking the tests multiple times.
Finally, there is an extensive support system for schools and instructors. All instructors must pass certification exams for each CCNA course before they can teach it. Instructors must take 16 hours of professional development each year and be re-certified every three years. Each school is linked to a Regional Training Center (RTC) that assists in delivering the program (more on RTCs below) and is invited to one meeting run by that RTC each year. All instructors have access to a 24/7 technical support hotline. Cisco provides an online community for
instructors, so that they can share teaching tips, teaching materials, and advice. School receive a quality assessment each year, and Cisco routinely monitors test scores and student course evaluations to ensure that the students are learning appropriately and are pleased with course quality. When problems are detected, help is provided to assist the schools.
What has enabled Cisco to grow the Academy from zero to almost 10,000 schools in less than 10 years is its tree-shaped management system. Cisco has 20 Cisco Academy Training Centers (CATCs) in the U.S. (and another 20 worldwide). The CATCs are the top of the management tree and are based at universities, community colleges, high schools, and military bases. Cisco works closely with the CATCs to design and implement the curriculum. The CATCs provide classes to students, but more importantly, each CATC manage 5 to 50 RTCs. The CATC provides training and support to the RTCs and assists them in implementing the program. Each RTC also offers classes to students and manages 10 to 50 Local Academies (LAs). There are approximately 625 RTCs and 4,500 LAs in the U.S. Cisco works directly only with the CATCs, leaving them to work with the RTCs to train the LAs to implement the program. However, Cisco engages instructors at all academies by running annual conferences and by offering internships each year for instructors to join the Academy administration and to help develop materials, tests, programs, and policies.
3. Theory
One of the main goals of the public education system in the U.S. has been to assure that all students receive the same quality of education. However, this goal has never been realized. Students in inner cities and rural areas perform less well overall than students in suburban schools [3, 25, 33]. There are vast differences between schools and districts in quality of schooling [8, 60]. The No Child Left Behind Act (NCLB) is an attempt to reduce this variance between schools. NCLB mandates high stakes testing and poses significant consequences if students in a school fail to show significant progress.
NCLB assumes that the disparity between schools is primarily a matter of the quality and management of instruction; when performance is poor, instruction will be improved if there are significant consequences for the failure to improve. Others assume disparities in resources and funding lead to disparities in achievement, while [4] argues that poverty is the main correlate (negative) with learning. The needs generated by poverty, he argues, dominate and distract from educational engagement: short-term
Proceedings of the 39th Hawaii International Conference on System Sciences - 2006
2
needs override potential long-term benefits. We believe the variables that impact effectiveness
of schooling are multifaceted and include individual, school, instruction, and community level variables. However, like NCLB, the Cisco approach assumes that high quality instruction can overcome the effects of many of those variables. The two approaches contrast in that the Academy model uses technology and a network system to provide a rich system of support for the instructional process. The curriculum and the assessments are all online and a 24/7 help line is available to provide subject matter support. These efforts hold the potential not only to provide a high quality curriculum and assessment system, but also to free instructors to work more closely with students and to focus on teaching activities.
Like NCLB, CCNA courses also use a big stick approach: end of course evaluations and standardized final exams are administered online to all students1 and those results are monitored to identify courses and academies where students are being “left behind.” However, rather than punishing “failing” schools, the Academy works to provide professional development and access to a network of fellow teachers to help teachers improve their practice.
While this mixture of centralized curriculum and local adaptations holds great promise, there is also the potential for problems. England’s national curriculum, perhaps the closest parallel to this model, has faced considerable problems. Perhaps the greatest problem has been a concern over dictating the content and structure of courses [29, 51]: at issue is ownership of the course. A related concern has been the limited ability to modify the curriculum to take into account local contexts [12, 19].
One way the CCNA program may be different from the English model is in the use of technology. Internet distribution makes the use of interactive simulations and demonstrations in the curriculum and assessment much easier, providing a richness of experience that typically would not be possible.
In this study, we examine key factors associated with student achievement in the first course of the four course CCNA sequence. Our focus is on three classes of factors most often associated with variations in student academic success in traditional educational settings [34, 56]: school, program delivery, and student. However, if the combination of centralized curriculum and local control is successful, then we would have somewhat different expectations for the impact of these factors than what has been found in traditional settings, as we outline below.
School factors are those that are characteristic of the high school or college other than the presence of 1 Instructors do not have prior access to the exam.
the Academy. Specifically we considered geographic location and SES as indicated by the location of the school in an enterprise zone, as indicators of the culture and resources associated with offering classes in different settings. If the strategy of a technology delivered standardized curriculum with the ability for local adaptations of instruction is effective, then we would expect it to nullify the variation in performance typically found between schools located in rural, suburban, urban, and economically disadvantaged areas [3, 6, 25, 55, 56]. If instructors can adapt their teaching practices to their students, then it is possible that this instructional model may reduce differences in level of performance between high school and college settings.
Program delivery factors are those features associated with the way the Academy program is implemented by local instructors. To the extent that instructors can adapt the curriculum and teaching methods to their context consistent with the goal of the Academy model, we would expect little variation due to the characteristics of the Academy program and the instructional delivery. Conversely, finding variations due to these factors would suggest a need to further understand their impact on success.
We examined the type of Academy to determine whether there is greater success of students in Regional Training Centers. Staff in RTCs teach courses but are also trainers of teachers at local academies, so we expect them to be more reflective and have greater insights into the teaching process [49]. The question is whether that greater expertise leads to a more successful learning experience.
Instruction quality is the second delivery variable we examined. If the students perceive variations in quality, and those variations are associated with student performance [7, 47], then it suggests that the support system does not lead to uniformly high quality. Such findings would suggest modifications in the instructor support system.
Third, we examined the impact of class size. Class sizes can vary from fewer than five students to over 20 students. A current goal in schooling policy is to reduce class size because of the evidence that class size is associated with student success [1, 20, 39]. We included class size as a variable for this reason. However, recent research suggests class size is less important for older students [18, 50].
Student factors included three types of variables: demographic, ability, and motivational. Three demographic variables were examined: student age, gender, and degree status. The CCNA program is taken by students ranging in age from 13 to older than 65, and age may be a factor in performance [5, 14, 38, 46, 48].
Proceedings of the 39th Hawaii International Conference on System Sciences - 2006
3
Gender is a particularly important variable because research shows that females take less interest and do less well in science and technology [15, 22] than males. There are significant policy initiatives to increase the enrollment and success of females in science and technology. If the CCNA program is successful in supporting both males and females, then this model will certainly deserve further examination as a method to engage females in the sciences.
Most students take CCNA courses as part of a formal educational program, whether a high school diploma, certificate program, or degree, but some do not. Traditional, degree-seeking, students often perform better than non-traditional students.
We included three ability variables: academic ability, technology ability, and problem-solving ability. Prior academic ability is one of the most important predictors of student achievement [21, 24, 62] and technology ability is the focus of the course. Hence, these are obvious individual difference factors that we would expect to be associated with success. We also examined the problem-solving skills of the students because problem-solving is such an integral part of the curriculum. Problem-solving is a common task for network engineers so the curriculum attempts to develop strong problem-solving ability in its students. Problem-solving refers to an individual’s ability to deal with problems that may be encountered in educational, occupational, and daily life [27]. Students who enter the program with strong problem-solving ability may be more likely to succeed than those who do not.
Motivation is the third set of student level factors considered in this study. An individual’s beliefs, goals, and expectancies are related to being engaged or disengaged in learning, and many research studies have linked motivation and engagement to individual achievement [17]. We examined both short-term and long-term motivation. The expected value of a behavior is an important motivator in the short-term [17]. Individuals who place a greater value on learning the material in a course are more likely to achieve at higher levels. Long-term motivation is also important. One potential source of long-term motivation is a student’s career goal; students who have selected a career closely related to an educational program tend to perform better than students who have not [2, 23]. A student’s desire for lifelong learning may also influence motivation and academic achievement over the long run. Students with more positive attitudes towards lifelong learning tend to persist in learning, be more self-directed students, and have more self-confidence [15]. They use better cognitive strategies to maximize their learning, such as being organized, which in turn leads to better performance [63].
4. Method
We used six sources of data. First, demographic data was provided by CCNA students upon enrolling in the program. Second, an intake survey was completed by students at the start of the course, administered through the Academy course management system. Third was final exam performance from the online exam administered by the Academy. Fourth, student course evaluation surveys were done through the course management system. Fifth was the U.S. Department of Housing and Urban Development (HUD) database defining economically disadvantaged regions. Sixth was the National Center for Education Statistics (NCES) database defining the school’s geographic location.
4.1 Participants
This study examined the performance of students
who completed the intake survey. We received a total of 13,738 surveys from students at 1,887 U.S. schools (approximately a 32% response rate). We used Hierarchical Linear Modeling as the analysis technique (see below), which requires that there be no missing values. We removed all data with any missing values, resulting in a data set of 10,371 students at 1,651 schools. Table 1 shows the descriptive statistics for the remaining students and the schools. This sample of students and schools is representative of the Academy program in the U.S.
4.2 Data
4.2.1 Final exam score. The dependent variable was the student’s final exam percentage score in the first CCNA course: the percentage of test items answered correctly as reported on the grade reports produced by the online testing system. Because the program uses a mastery learning approach that permits students to retake the final exam, we used the students’ first attempt scores only.
4.2.2 Student demographics. Gender was obtained from the student’s registration data and was coded as a 0-1 indicator variable. Age was obtained from a question on the intake survey. We classified students into age groups using indicator variables: 18 or less, 19-25, and 26 or older, reflecting the three major age groups in the program: high school students, college and university students, and non-traditional students. The student’s formal degree program status was captured by a question on the intake survey. Students enrolled in no degree, diploma, or certificate programs were coded using an indicator variable.
Proceedings of the 39th Hawaii International Conference on System Sciences - 2006
4
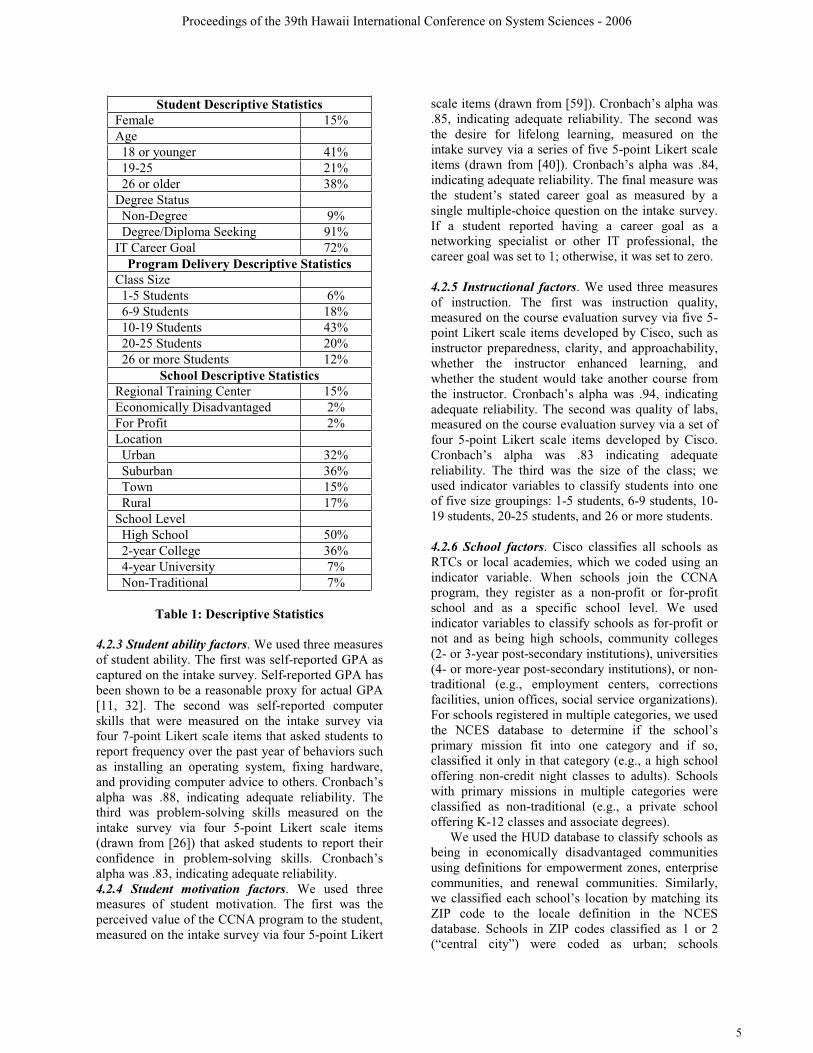
Student Descriptive Statistics Female 15% Age 18 or younger 41% 19-25 21% 26 or older 38% Degree Status Non-Degree 9% Degree/Diploma Seeking 91% IT Career Goal 72%
Program Delivery Descriptive Statistics Class Size 1-5 Students 6% 6-9 Students 18% 10-19 Students 43% 20-25 Students 20% 26 or more Students 12%
School Descriptive Statistics Regional Training Center 15% Economically Disadvantaged 2% For Profit 2% Location Urban 32% Suburban 36% Town 15% Rural 17% School Level High School 50% 2-year College 36% 4-year University 7% Non-Traditional 7%
Table 1: Descriptive Statistics
4.2.3 Student ability factors. We used three measures of student ability. The first was self-reported GPA as captured on the intake survey. Self-reported GPA has been shown to be a reasonable proxy for actual GPA [11, 32]. The second was self-reported computer skills that were measured on the intake survey via four 7-point Likert scale items that asked students to report frequency over the past year of behaviors such as installing an operating system, fixing hardware, and providing computer advice to others. Cronbach’s alpha was .88, indicating adequate reliability. The third was problem-solving skills measured on the intake survey via four 5-point Likert scale items (drawn from [26]) that asked students to report their confidence in problem-solving skills. Cronbach’s alpha was .83, indicating adequate reliability. 4.2.4 Student motivation factors. We used three measures of student motivation. The first was the perceived value of the CCNA program to the student, measured on the intake survey via four 5-point Likert
scale items (drawn from [59]). Cronbach’s alpha was .85, indicating adequate reliability. The second was the desire for lifelong learning, measured on the intake survey via a series of five 5-point Likert scale items (drawn from [40]). Cronbach’s alpha was .84, indicating adequate reliability. The final measure was the student’s stated career goal as measured by a single multiple-choice question on the intake survey. If a student reported having a career goal as a networking specialist or other IT professional, the career goal was set to 1; otherwise, it was set to zero. 4.2.5 Instructional factors. We used three measures of instruction. The first was instruction quality, measured on the course evaluation survey via five 5-point Likert scale items developed by Cisco, such as instructor preparedness, clarity, and approachability, whether the instructor enhanced learning, and whether the student would take another course from the instructor. Cronbach’s alpha was .94, indicating adequate reliability. The second was quality of labs, measured on the course evaluation survey via a set of four 5-point Likert scale items developed by Cisco. Cronbach’s alpha was .83 indicating adequate reliability. The third was the size of the class; we used indicator variables to classify students into one of five size groupings: 1-5 students, 6-9 students, 10-19 students, 20-25 students, and 26 or more students. 4.2.6 School factors. Cisco classifies all schools as RTCs or local academies, which we coded using an indicator variable. When schools join the CCNA program, they register as a non-profit or for-profit school and as a specific school level. We used indicator variables to classify schools as for-profit or not and as being high schools, community colleges (2- or 3-year post-secondary institutions), universities (4- or more-year post-secondary institutions), or non-traditional (e.g., employment centers, corrections facilities, union offices, social service organizations). For schools registered in multiple categories, we used the NCES database to determine if the school’s primary mission fit into one category and if so, classified it only in that category (e.g., a high school offering non-credit night classes to adults). Schools with primary missions in multiple categories were classified as non-traditional (e.g., a private school offering K-12 classes and associate degrees).
We used the HUD database to classify schools as being in economically disadvantaged communities using definitions for empowerment zones, enterprise communities, and renewal communities. Similarly, we classified each school’s location by matching its ZIP code to the locale definition in the NCES database. Schools in ZIP codes classified as 1 or 2 (“central city”) were coded as urban; schools
Proceedings of the 39th Hawaii International Conference on System Sciences - 2006
5
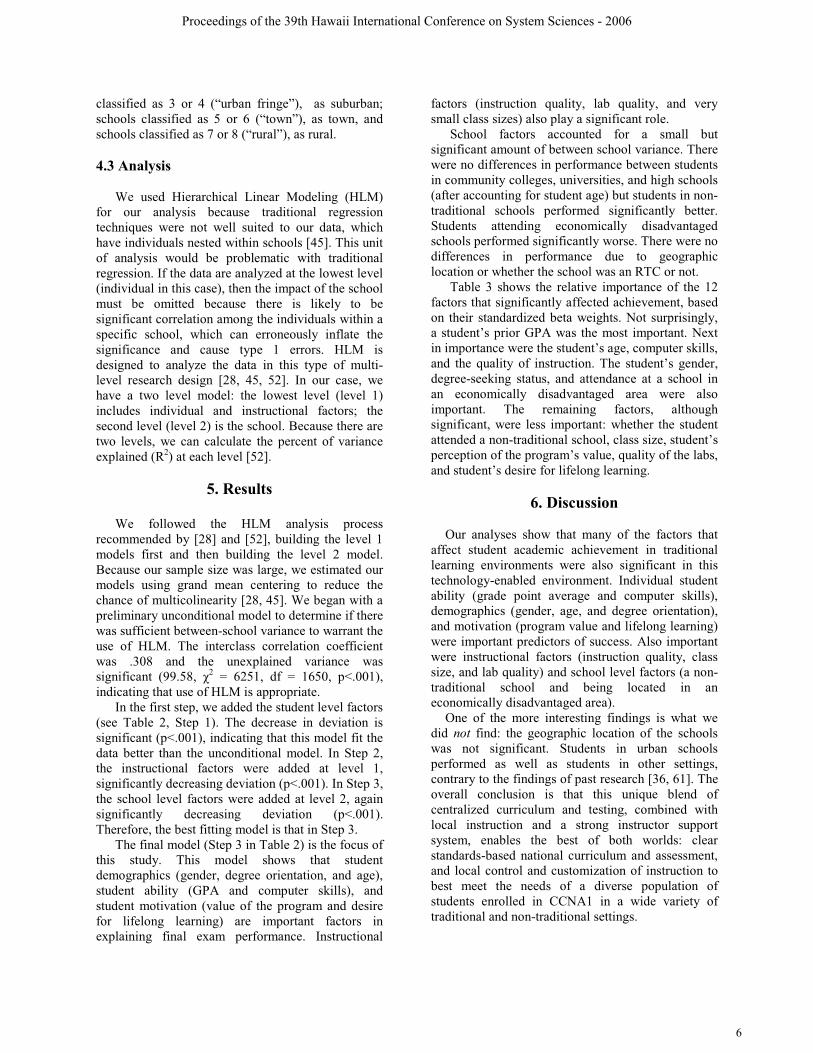
classified as 3 or 4 (“urban fringe”), as suburban; schools classified as 5 or 6 (“town”), as town, and schools classified as 7 or 8 (“rural”), as rural. 4.3 Analysis
We used Hierarchical Linear Modeling (HLM)
for our analysis because traditional regression techniques were not well suited to our data, which have individuals nested within schools [45]. This unit of analysis would be problematic with traditional regression. If the data are analyzed at the lowest level (individual in this case), then the impact of the school must be omitted because there is likely to be significant correlation among the individuals within a specific school, which can erroneously inflate the significance and cause type 1 errors. HLM is designed to analyze the data in this type of multi-level research design [28, 45, 52]. In our case, we have a two level model: the lowest level (level 1) includes individual and instructional factors; the second level (level 2) is the school. Because there are two levels, we can calculate the percent of variance explained (R2) at each level [52].
5. Results
We followed the HLM analysis process
recommended by [28] and [52], building the level 1 models first and then building the level 2 model. Because our sample size was large, we estimated our models using grand mean centering to reduce the chance of multicolinearity [28, 45]. We began with a preliminary unconditional model to determine if there was sufficient between-school variance to warrant the use of HLM. The interclass correlation coefficient was .308 and the unexplained variance was significant (99.58, 2 = 6251, df = 1650, p<.001), indicating that use of HLM is appropriate.
In the first step, we added the student level factors (see Table 2, Step 1). The decrease in deviation is significant (p<.001), indicating that this model fit the data better than the unconditional model. In Step 2, the instructional factors were added at level 1, significantly decreasing deviation (p<.001). In Step 3, the school level factors were added at level 2, again significantly decreasing deviation (p<.001). Therefore, the best fitting model is that in Step 3.
The final model (Step 3 in Table 2) is the focus of this study. This model shows that student demographics (gender, degree orientation, and age), student ability (GPA and computer skills), and student motivation (value of the program and desire for lifelong learning) are important factors in explaining final exam performance. Instructional
factors (instruction quality, lab quality, and very small class sizes) also play a significant role.
School factors accounted for a small but significant amount of between school variance. There were no differences in performance between students in community colleges, universities, and high schools (after accounting for student age) but students in non-traditional schools performed significantly better. Students attending economically disadvantaged schools performed significantly worse. There were no differences in performance due to geographic location or whether the school was an RTC or not.
Table 3 shows the relative importance of the 12 factors that significantly affected achievement, based on their standardized beta weights. Not surprisingly, a student’s prior GPA was the most important. Next in importance were the student’s age, computer skills, and the quality of instruction. The student’s gender, degree-seeking status, and attendance at a school in an economically disadvantaged area were also important. The remaining factors, although significant, were less important: whether the student attended a non-traditional school, class size, student’s perception of the program’s value, quality of the labs, and student’s desire for lifelong learning.
6. Discussion
Our analyses show that many of the factors that
affect student academic achievement in traditional learning environments were also significant in this technology-enabled environment. Individual student ability (grade point average and computer skills), demographics (gender, age, and degree orientation), and motivation (program value and lifelong learning) were important predictors of success. Also important were instructional factors (instruction quality, class size, and lab quality) and school level factors (a non-traditional school and being located in an economically disadvantaged area).
One of the more interesting findings is what we did not find: the geographic location of the schools was not significant. Students in urban schools performed as well as students in other settings, contrary to the findings of past research [36, 61]. The overall conclusion is that this unique blend of centralized curriculum and testing, combined with local instruction and a strong instructor support system, enables the best of both worlds: clear standards-based national curriculum and assessment, and local control and customization of instruction to best meet the needs of a diverse population of students enrolled in CCNA1 in a wide variety of traditional and non-traditional settings.
Proceedings of the 39th Hawaii International Conference on System Sciences - 2006
6
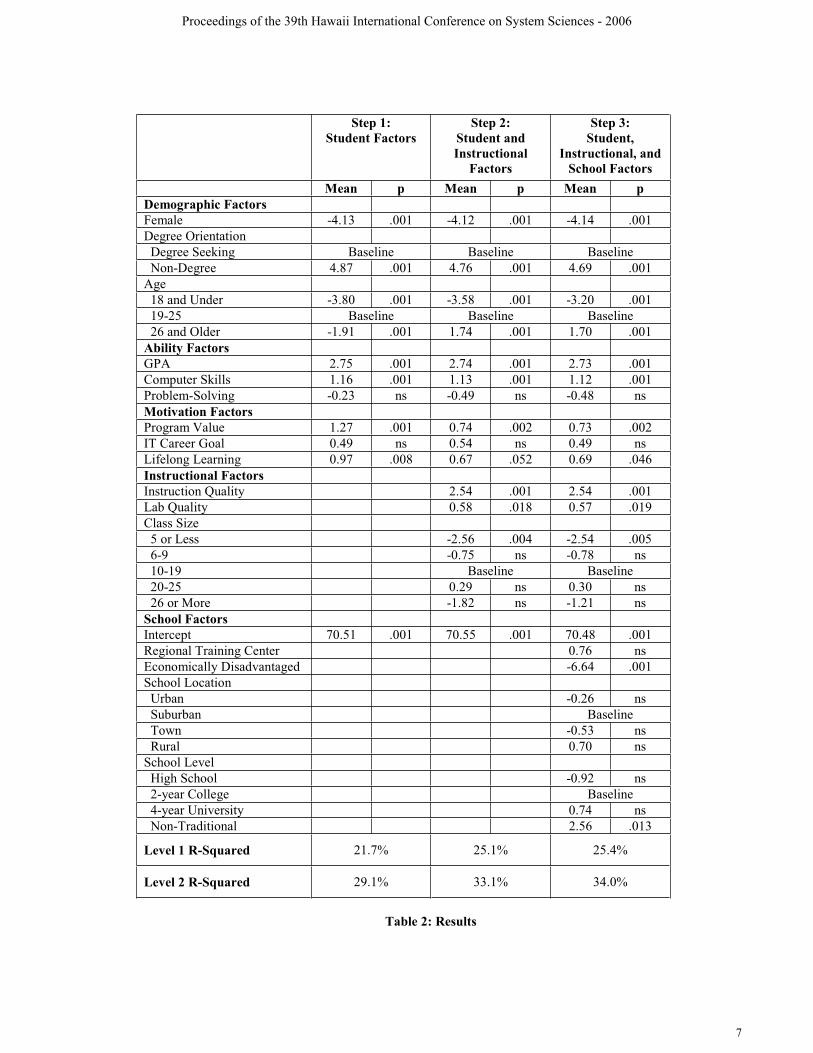
Step 1:
Student Factors Step 2:
Student and Instructional
Factors
Step 3: Student,
Instructional, and School Factors
Mean p Mean p Mean p Demographic Factors Female -4.13 .001 -4.12 .001 -4.14 .001 Degree Orientation Degree Seeking Baseline Baseline Baseline Non-Degree 4.87 .001 4.76 .001 4.69 .001 Age 18 and Under -3.80 .001 -3.58 .001 -3.20 .001 19-25 Baseline Baseline Baseline 26 and Older -1.91 .001 1.74 .001 1.70 .001 Ability Factors GPA 2.75 .001 2.74 .001 2.73 .001 Computer Skills 1.16 .001 1.13 .001 1.12 .001 Problem-Solving -0.23 ns -0.49 ns -0.48 ns Motivation Factors Program Value 1.27 .001 0.74 .002 0.73 .002 IT Career Goal 0.49 ns 0.54 ns 0.49 ns Lifelong Learning 0.97 .008 0.67 .052 0.69 .046 Instructional Factors Instruction Quality 2.54 .001 2.54 .001 Lab Quality 0.58 .018 0.57 .019 Class Size 5 or Less -2.56 .004 -2.54 .005 6-9 -0.75 ns -0.78 ns 10-19 Baseline Baseline 20-25 0.29 ns 0.30 ns 26 or More -1.82 ns -1.21 ns School Factors Intercept 70.51 .001 70.55 .001 70.48 .001 Regional Training Center 0.76 ns Economically Disadvantaged -6.64 .001 School Location Urban -0.26 ns Suburban Baseline Town -0.53 ns Rural 0.70 ns School Level High School -0.92 ns 2-year College Baseline 4-year University 0.74 ns Non-Traditional 2.56 .013
Level 1 R-Squared 21.7% 25.1% 25.4%
Level 2 R-Squared 29.1% 33.1% 34.0%
Table 2: Results
Proceedings of the 39th Hawaii International Conference on System Sciences - 2006
7
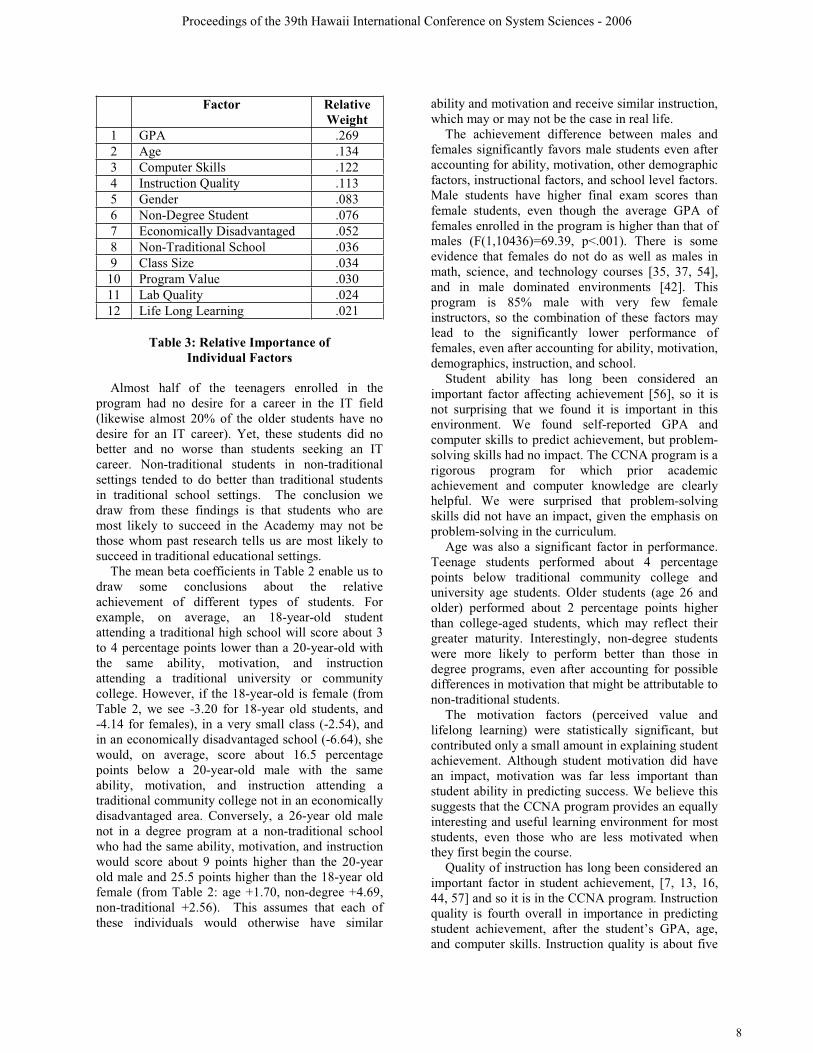
Factor Relative Weight
1 GPA .269 2 Age .134 3 Computer Skills .122 4 Instruction Quality .113 5 Gender .083 6 Non-Degree Student .076 7 Economically Disadvantaged .052 8 Non-Traditional School .036 9 Class Size .034
10 Program Value .030 11 Lab Quality .024 12 Life Long Learning .021
Table 3: Relative Importance of
Individual Factors
Almost half of the teenagers enrolled in the program had no desire for a career in the IT field (likewise almost 20% of the older students have no desire for an IT career). Yet, these students did no better and no worse than students seeking an IT career. Non-traditional students in non-traditional settings tended to do better than traditional students in traditional school settings. The conclusion we draw from these findings is that students who are most likely to succeed in the Academy may not be those whom past research tells us are most likely to succeed in traditional educational settings.
The mean beta coefficients in Table 2 enable us to draw some conclusions about the relative achievement of different types of students. For example, on average, an 18-year-old student attending a traditional high school will score about 3 to 4 percentage points lower than a 20-year-old with the same ability, motivation, and instruction attending a traditional university or community college. However, if the 18-year-old is female (from Table 2, we see -3.20 for 18-year old students, and -4.14 for females), in a very small class (-2.54), and in an economically disadvantaged school (-6.64), she would, on average, score about 16.5 percentage points below a 20-year-old male with the same ability, motivation, and instruction attending a traditional community college not in an economically disadvantaged area. Conversely, a 26-year old male not in a degree program at a non-traditional school who had the same ability, motivation, and instruction would score about 9 points higher than the 20-year old male and 25.5 points higher than the 18-year old female (from Table 2: age +1.70, non-degree +4.69, non-traditional +2.56). This assumes that each of these individuals would otherwise have similar
ability and motivation and receive similar instruction, which may or may not be the case in real life.
The achievement difference between males and females significantly favors male students even after accounting for ability, motivation, other demographic factors, instructional factors, and school level factors. Male students have higher final exam scores than female students, even though the average GPA of females enrolled in the program is higher than that of males (F(1,10436)=69.39, p<.001). There is some evidence that females do not do as well as males in math, science, and technology courses [35, 37, 54], and in male dominated environments [42]. This program is 85% male with very few female instructors, so the combination of these factors may lead to the significantly lower performance of females, even after accounting for ability, motivation, demographics, instruction, and school.
Student ability has long been considered an important factor affecting achievement [56], so it is not surprising that we found it is important in this environment. We found self-reported GPA and computer skills to predict achievement, but problem-solving skills had no impact. The CCNA program is a rigorous program for which prior academic achievement and computer knowledge are clearly helpful. We were surprised that problem-solving skills did not have an impact, given the emphasis on problem-solving in the curriculum.
Age was also a significant factor in performance. Teenage students performed about 4 percentage points below traditional community college and university age students. Older students (age 26 and older) performed about 2 percentage points higher than college-aged students, which may reflect their greater maturity. Interestingly, non-degree students were more likely to perform better than those in degree programs, even after accounting for possible differences in motivation that might be attributable to non-traditional students.
The motivation factors (perceived value and lifelong learning) were statistically significant, but contributed only a small amount in explaining student achievement. Although student motivation did have an impact, motivation was far less important than student ability in predicting success. We believe this suggests that the CCNA program provides an equally interesting and useful learning environment for most students, even those who are less motivated when they first begin the course.
Quality of instruction has long been considered an important factor in student achievement, [7, 13, 16, 44, 57] and so it is in the CCNA program. Instruction quality is fourth overall in importance in predicting student achievement, after the student’s GPA, age, and computer skills. Instruction quality is about five
Proceedings of the 39th Hawaii International Conference on System Sciences - 2006
8
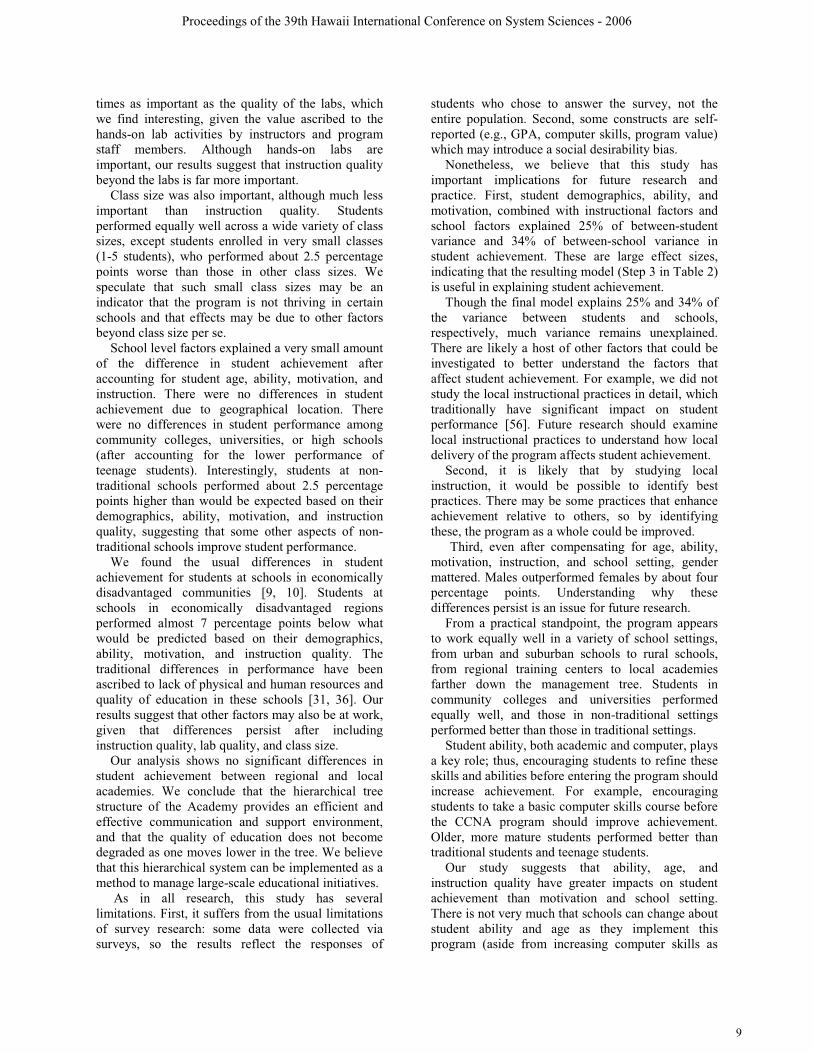
times as important as the quality of the labs, which we find interesting, given the value ascribed to the hands-on lab activities by instructors and program staff members. Although hands-on labs are important, our results suggest that instruction quality beyond the labs is far more important.
Class size was also important, although much less important than instruction quality. Students performed equally well across a wide variety of class sizes, except students enrolled in very small classes (1-5 students), who performed about 2.5 percentage points worse than those in other class sizes. We speculate that such small class sizes may be an indicator that the program is not thriving in certain schools and that effects may be due to other factors beyond class size per se.
School level factors explained a very small amount of the difference in student achievement after accounting for student age, ability, motivation, and instruction. There were no differences in student achievement due to geographical location. There were no differences in student performance among community colleges, universities, or high schools (after accounting for the lower performance of teenage students). Interestingly, students at non-traditional schools performed about 2.5 percentage points higher than would be expected based on their demographics, ability, motivation, and instruction quality, suggesting that some other aspects of non-traditional schools improve student performance.
We found the usual differences in student achievement for students at schools in economically disadvantaged communities [9, 10]. Students at schools in economically disadvantaged regions performed almost 7 percentage points below what would be predicted based on their demographics, ability, motivation, and instruction quality. The traditional differences in performance have been ascribed to lack of physical and human resources and quality of education in these schools [31, 36]. Our results suggest that other factors may also be at work, given that differences persist after including instruction quality, lab quality, and class size.
Our analysis shows no significant differences in student achievement between regional and local academies. We conclude that the hierarchical tree structure of the Academy provides an efficient and effective communication and support environment, and that the quality of education does not become degraded as one moves lower in the tree. We believe that this hierarchical system can be implemented as a method to manage large-scale educational initiatives.
As in all research, this study has several limitations. First, it suffers from the usual limitations of survey research: some data were collected via surveys, so the results reflect the responses of
students who chose to answer the survey, not the entire population. Second, some constructs are self-reported (e.g., GPA, computer skills, program value) which may introduce a social desirability bias.
Nonetheless, we believe that this study has important implications for future research and practice. First, student demographics, ability, and motivation, combined with instructional factors and school factors explained 25% of between-student variance and 34% of between-school variance in student achievement. These are large effect sizes, indicating that the resulting model (Step 3 in Table 2) is useful in explaining student achievement.
Though the final model explains 25% and 34% of the variance between students and schools, respectively, much variance remains unexplained. There are likely a host of other factors that could be investigated to better understand the factors that affect student achievement. For example, we did not study the local instructional practices in detail, which traditionally have significant impact on student performance [56]. Future research should examine local instructional practices to understand how local delivery of the program affects student achievement.
Second, it is likely that by studying local instruction, it would be possible to identify best practices. There may be some practices that enhance achievement relative to others, so by identifying these, the program as a whole could be improved.
Third, even after compensating for age, ability, motivation, instruction, and school setting, gender mattered. Males outperformed females by about four percentage points. Understanding why these differences persist is an issue for future research.
From a practical standpoint, the program appears to work equally well in a variety of school settings, from urban and suburban schools to rural schools, from regional training centers to local academies farther down the management tree. Students in community colleges and universities performed equally well, and those in non-traditional settings performed better than those in traditional settings.
Student ability, both academic and computer, plays a key role; thus, encouraging students to refine these skills and abilities before entering the program should increase achievement. For example, encouraging students to take a basic computer skills course before the CCNA program should improve achievement. Older, more mature students performed better than traditional students and teenage students.
Our study suggests that ability, age, and instruction quality have greater impacts on student achievement than motivation and school setting. There is not very much that schools can change about student ability and age as they implement this program (aside from increasing computer skills as
Proceedings of the 39th Hawaii International Conference on System Sciences - 2006
9
noted above). This, perhaps, is the good news. We believe that this form of technology-enabled environment which combines a centrally developed curriculum and standards-based testing distributed over the Internet with local delivery of instruction and strong instructor support enables students to perform at the level of their own abilities, influenced only slightly by the school setting. This program appears to close the traditional achievement gap between schools in different regions and enable students to reach their own potential.
References 1. Achilles, C.M., Harman, P., and Egelson, P., "Using
Research Results on Class Size to Improve Pupil Achievement Outcomes", Research in the Schools, 2(2), 1995, 23-30.
2. Alpern, B.E., "Factors That Influence Community College Transfer Students' Satisfaction with Their Baccalaureate Institutions", Michigan, 2000.
3. Barker, B., "Curricular Offerings in Small and Large High Schools: How Broad Is the Disparity?" Research in Rural Education, 3(1), 1985, 35-38.
4. Berliner, D.C., "The near Impossibility of Testing for Teacher Quality", Journal of Teacher Education, 56(3), 2005, 205-213.
5. Bjorklund, D.F. and Harnishfeger, K.K., "Developmental Differences in the Mental Effort Requirements for the Use of an Organizational Strategy in Free Recall", Journal of Experimental Child Psychology, 44(1), 1987, 109-125.
6. Bracey, G.W., "Debunking the Myths About Money for Schools", Educational Leadership, 53(3), 1995, 65-69.
7. Brophy, J. and Good, T.L., Teacher Behavior and Student Achievement, in Handbook of Research on Teaching, Wittrock, M.C., Editor, Macmillan, New York, 328-375, 1986.
8. Camilli, G. and Firestone, W.A., "Values and State Ratings: An Examination of the State-by-State Education Indicators in Quality Counts", Educational Measurement: Issues & Practice, 18(4), 1999, 17-25.
9. Campbell, J.R., Hombo, C.M., and Mazzeo, J., "NAEP 1999 Trends in Academic Progress: Three Decades of Student Performance", National Center for Education Statistics, Washington, DC, 2000.
10. Campbell, J.R., Voelkl, K.E., and Donahue, P.L., "NAEP 1996 Trends in Academic Progress. Achievement of U.S. Students in Science, 1969 to 1996; Mathematics, 1973 to 1996; Reading, 1971 to 1996; Writing, 1984 to 1996. Report in Brief", National Center for Education Statistics, Washington, DC, 1997.
11. Cassady, J.C., "Self-Reported GPA and SAT Scores. Eric Digest", 2001.
12. Cooper, P. and Davies, C., "The Impact of National Curriculum Assessment Arrangements on English Teachers' Thinking and Classroom Practice in English Secondary Schools", Teaching and Teacher Education, 9(5-6), 1993, 559-570.
13. Cotton, K., "The Schooling Practices That Matter Most", Northwest Regional Educational Lab, Portland,
OR, 2000. 14. Coyle, T.R. and Bjorklund, D.F., "Age Differences in,
and Consequences of, Multiple- and Variable-Strategy Use on a Multitrial Sort-Recall Task", Developmental Psychology, 33(2), 1997, 372-380.
15. Crombie, G. and Abarbanel, T., "Bridging the Gender Gap in High-Technology Education", NASSP Bulletin, 84(618), 2000, 64-73.
16. Darling-Hammond, L., "The Challenge of Staffing Our Schools", Educational Leadership, 58(8), 2001, 12-17.
17. Eccles, J.S. and Wigfield, A., "Motivational Beliefs, Values, and Goals", Annual Review of Psychology, 53(1), 2002, 109-132.
18. Fleming, T., Toutant, T., and Raptis, H., "Class Size and Effects: A Review. Fastback 497", Phi Delta Kappa Educational Foundation, Bloomington, IN, 2002.
19. Galton, M. and Hargreaves, L., "Classroom Practice and the National Curriculum in Small Rural Primary Schools", British Educational Research Journal, 24(1), 1998, 43-61.
20. Glass, G.V. and Smith, M.L., "Meta-Analysis of Research on the Relationship of Class-Size and Achievement. The Class Size and Instruction Project", Far West Lab. for Educational Research and Development, San Francisco, CA., 1978.
21. Gray, J. and Jesson, D., "Estimating Differences in the Examination of Performances", Oxford Review of Education, 16(2), 1990, 137-158.
22. Green, M.Y., "Why Aren't Girls More Tech Savvy?" NEA Today, 19(3), 2000, 31.
23. Haislett, J. and Hafer, A.A., "Predicting Success of Engineering Students during the Freshman Year", Career Development Quarterly, 39(1), 1990, 86-95.
24. Hakkinen, I., Kirjavainen, T., and Uusitalo, R., "School Resources and Student Achievement Revisited: New Evidence from Panel Data", Economics of Education Review, 22(3), 2003, 329-335.
25. Hannaway, J. and Talbert, J.E., "Bringing Context into Effective School Research: Urban-Suburban Differences", Educational Administration Quarterly, 29(2), 1993, 164-186.
26. Heppner, P.P. and Petersen, C.H., "The Development and Implications of a Personal Problem-Solving Inventory", Journal of Counseling Psychology, 29(1), 1982, 66-75.
27. Heppner, P.P., Witty, T.E., and Dixon, W., "Problem-Solving Appraisal and Human Adjustment: A Review of 20 Years of Research Using the Problem-solving Inventory", The Counseling Psychologist, 32(3), 2004, 344-428.
28. Hofmann, D.A., "An Overview of the Logic and Rationale of Hierarchical Linear Models", Journal of Management, 23(6), 1997, 723-744.
29. Jenkins, E.W., "The Impact of the National Curriculum on Secondary School Science Teaching in England and Wales", International Journal of Science Education, 22(3), 2000, 325-336.
30. Khan, B.H., "Web-Based Instruction (WBI): An Introduction", Educational Media International, 35(2), 1998, 63-71.
31. Kozol, J., Savage Inequalities: Children in America's Schools, Crown Publishers, New York, 1991.
Proceedings of the 39th Hawaii International Conference on System Sciences - 2006
10
32. Kuncel, N.R., Crede, M., and Thomas, L.L., "The Validity of Self-Reported Grade Point Averages, Class Ranks, and Test Scores: A Meta-Analysis and Review of the Literature", Review of Educational Research, 75(1), 2005, 63-82.
33. Lee, J. and McIntire, W.G. Understanding Rural Student Achievement: Identifying Instructional and Organizational Differences between Rural and Nonrural Schools. in the Annual Meeting of the American Educational Research Association, Montreal, Quebec, Canada, 1999.
34. Lee, V.E., "Using Hierarchical Linear Modeling to Study Social Contexts: The Case of School Effects", Educational Psychologist, 35(2), 2000, 125-141.
35. Levesque, K., "Public High School Graduates Who Participated in Vocational/Technical Education: 1982-1998. E.D. Tabs", National Center for Education Statistics, Washington, DC, 2003.
36. Lippman, L., Burns, S., and McArthur, E., "Urban Schools: The Challenge of Location and Poverty", National Center for Education Statistics, Washington, DC, 1996.
37. Manning, M.L., "Gender Differences in Young Adolescents' Mathematics and Science Achievement", Childhood Education, 74(3), 1998, 168-171.
38. Maurer, T.J., Weiss, E.M., and Barbeite, F.G., "A Model of Involvement in Work-Related Learning and Development Activity: The Effects of Individual, Situational, Motivational, and Age Variables", Journal of Applied Psychology, 88(4), 2003, 707-724.
39. McGiverin, J. and et al., "A Meta-Analysis of the Relation between Class Size and Achievement", Elementary School Journal, 90(1), 1989, 47-56.
40. Oddi, L.F., Ellis, A.J., and Roberson, J.A., "Construct Validation of the Oddi Continuing Learning Inventory", Adult Education Quarterly, 40(3), 1990, 139-145.
41. Osguthorpe, R.T. and Graham, C.R., "Blended Learning Environments", Quarterly Review of Distance Education, 4(3), 2003, 227-233.
42. Phan, O., "Women in Vocational Education and Training: An Analysis of 1996 and 1999 Data", National Centre for Vocational Education Research, Leabrook, Australia, 2001.
43. Polin, L., Learning in Dialogue with a Practicing Community, in Designing Environments for Distributed Learning: Learning Theory and Practice, Duffy, T.M. and Kirkley, J., Editors, Lawrence Erlbaum, Mahwah, NJ, 2004.
44. Porter, A.C. and Brophy, J., "Synthesis of Research on Good Teaching: Insights from the Work of the Institute for Research on Teaching", Educational Leadership, 45(8), 1988, 74-85.
45. Raundenbush, S.W. and Bryk, A.S., Hierachical Linear Models: Application and Data Analysis Methods, Sage Publications, Thousand Oaks, CA, 2002.
46. Rohwer, W.D., Jr. and Litrownik, J., "Age and Individual Differences in the Learning of a Memorization Procedure", Journal of Educational Psychology, 75(6), 1983, 799-810.
47. Rosenshine, B.V. and Stevens, R.J., Teaching Functions, in Handbook of Research on Teaching,
Wittrock, M.C., Editor, Macmillan, NY, 328-375, 1986. 48. Schneider, W., Korkel, J., and Weinert, F.E., "Domain-
Specific Knowledge and Memory Performance: A Comparison of High- and Low-Aptitude Children", Journal of Educational Psychology, 81(3), 1989, 306-312.
49. Schon, D., The Reflective Practitioner : How Professionals Think in Action, 1995.
50. Schwartz, W., "Class Size Reduction and Urban Students. Eric Digest", 2003.
51. Silvernail, D.L., "The Impact of England's National Curriculum and Assessment System on Classroom Practice", Educational Policy, 10(1), 1996, 46-62.
52. Snijders, T.A.B. and Bosker, R.J., Multilevel Analysis: An Introduction to Basic and Advanced Multilevel Modeling. , Sage Publications, Thousand Oaks CA, 1999.
53. Stinson, J., A Continuing Learning Community for Graduates of an MBA Program: The Experiment at Ohio University, in Designing Environments for Distributed Learning: Learning Theory and Practice, Duffy, T.M. and Kirkley, J., Editors, Lawrence Erlbaum, Mahwah, NJ, 2004.
54. Tate, W.F., "Race-Ethnicity, SES, Gender, and Language Proficiency Trends in Mathematics Achievement: An Update", Journal for Research in Mathematics Education, 28(6), 1997, 652-679.
55. Verstegen, D.A. and King, R.A., "The Relationship between School Spending and Student Achievement: A Review and Analysis of 35 Years of Production Function Research", Journal of Education Finance, 24(2), 1998, 243-262.
56. Walberg, H.J., "Improving the Productivity of America's Schools." Educational Leadership, 41(8), 1984, 19-27.
57. Wang, M.C., Haertel, G.D., and Walberg, H.J., "Toward a Knowledge Base for School Learning", Review of Educational Research, 63(3), 1993, 249-294.
58. Welsh, E.T., Wanberg, C.R., Brown, K.G., and Simmering, M.J., "E-Learning: Emerging Uses, Empirical Results and Future Directions", International Journal of Training and Development, 7(4), 2003, 245-258.
59. Wigfield, A. and Eccles, J.S., "Expectancy–Value Theory of Achievement Motivation", Contemporary Educational Psychology, (25), 2000, 68-81.
60. Williams, A., Blank, R.K., Potts, A., and Toye, C., "State Education Indicators with a Focus on Title I, 2000-01", US Department of Education, Washington, DC, 2004.
61. Wirt, J., Choy, S., Rooney, P., Hussar, P., Provasnik, S., and Hampden-Thomson, G., "The Condition of Education", US Dept. of Education, Washington, 2005.
62. Young, D.J., "Rural Differences in Student Achievement: The Effect of Student Perceptions", Educational Research & Evaluation, 6(3), 2000, 207-228.
63. Zimmerman, B.J. and Martinez-Pons, M., Perceptions of Efficacy and Strategy Use in the Self-Regulation of Learning, in Student Perceptions in the Classroom Schunk, D.H. and Meece, J.L., Editors, Lawrence Erlbaum, Hillsdale, NJ, 185-207, 1992.
Proceedings of the 39th Hawaii International Conference on System Sciences - 2006
11