Embed Size (px)
Citation preview
11
What Are You Seeing?
Student Data and Answer Booklet
Name: Date:
12
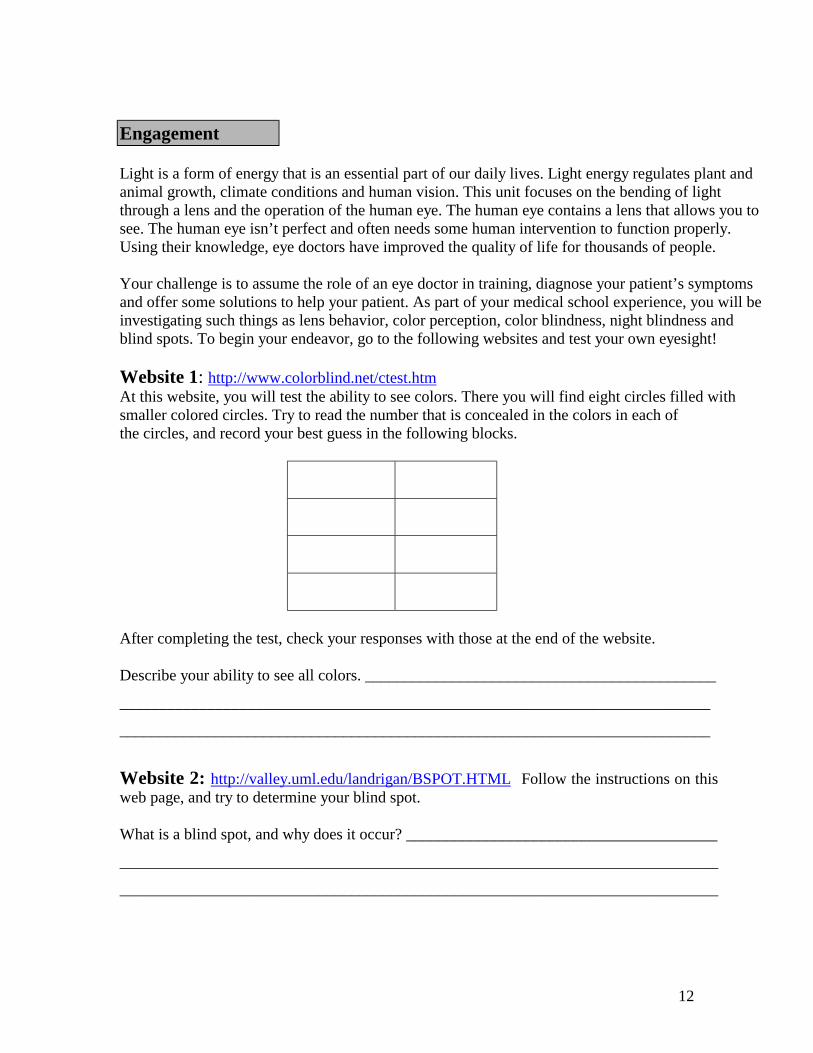
Engagement Light is a form of energy that is an essential part of our daily lives. Light energy regulates plant and animal growth, climate conditions and human vision. This unit focuses on the bending of light through a lens and the operation of the human eye. The human eye contains a lens that allows you to see. The human eye isn’t perfect and often needs some human intervention to function properly. Using their knowledge, eye doctors have improved the quality of life for thousands of people. Your challenge is to assume the role of an eye doctor in training, diagnose your patient’s symptoms and offer some solutions to help your patient. As part of your medical school experience, you will be investigating such things as lens behavior, color perception, color blindness, night blindness and blind spots. To begin your endeavor, go to the following websites and test your own eyesight! Website 1: http://www.colorblind.net/ctest.htm At this website, you will test the ability to see colors. There you will find eight circles filled with smaller colored circles. Try to read the number that is concealed in the colors in each of the circles, and record your best guess in the following blocks.
After completing the test, check your responses with those at the end of the website. Describe your ability to see all colors. ____________________________________________
__________________________________________________________________________
__________________________________________________________________________
Website 2: http://valley.uml.edu/landrigan/BSPOT.HTML Follow the instructions on this web page, and try to determine your blind spot. What is a blind spot, and why does it occur? _______________________________________
___________________________________________________________________________
___________________________________________________________________________
13
Describe your blind spot. ______________________________________________________
___________________________________________________________________________
___________________________________________________________________________
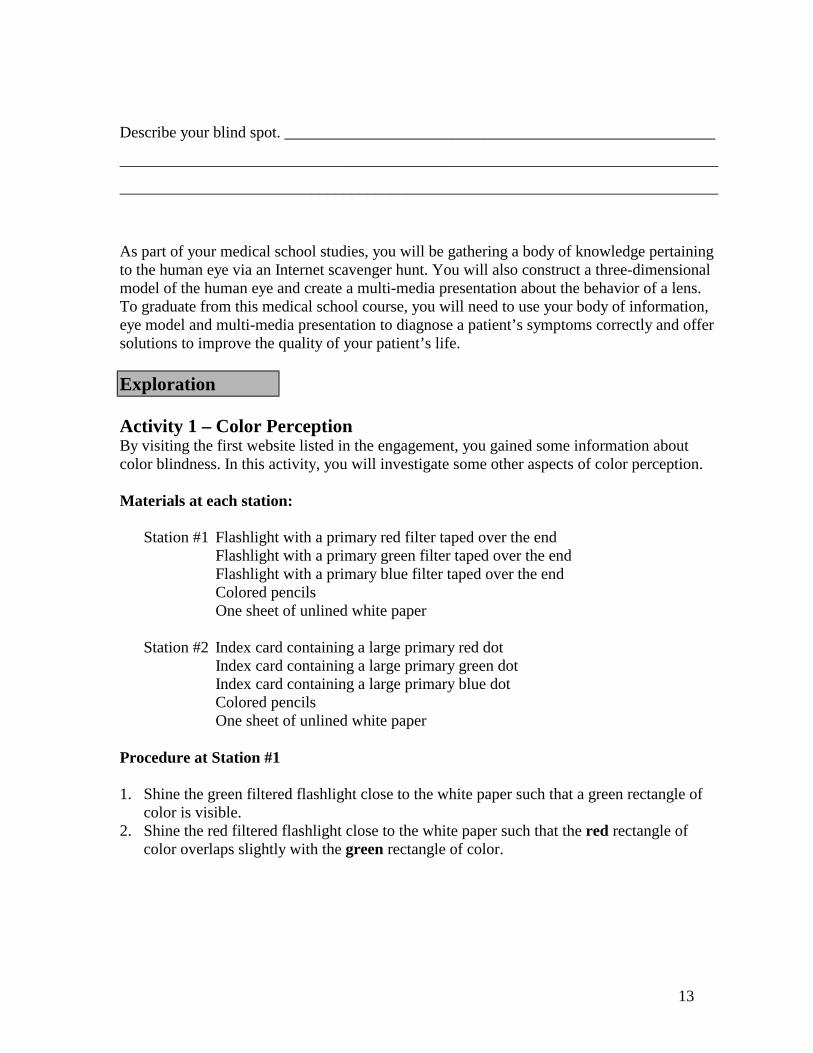
As part of your medical school studies, you will be gathering a body of knowledge pertaining to the human eye via an Internet scavenger hunt. You will also construct a three-dimensional model of the human eye and create a multi-media presentation about the behavior of a lens. To graduate from this medical school course, you will need to use your body of information, eye model and multi-media presentation to diagnose a patient’s symptoms correctly and offer solutions to improve the quality of your patient’s life. Exploration Activity 1 – Color Perception By visiting the first website listed in the engagement, you gained some information about color blindness. In this activity, you will investigate some other aspects of color perception. Materials at each station:
Station #1 Flashlight with a primary red filter taped over the end Flashlight with a primary green filter taped over the end Flashlight with a primary blue filter taped over the end Colored pencils One sheet of unlined white paper
Station #2 Index card containing a large primary red dot
Index card containing a large primary green dot Index card containing a large primary blue dot Colored pencils One sheet of unlined white paper
Procedure at Station #1 1. Shine the green filtered flashlight close to the white paper such that a green rectangle of
color is visible. 2. Shine the red filtered flashlight close to the white paper such that the red rectangle of
color overlaps slightly with the green rectangle of color.
14
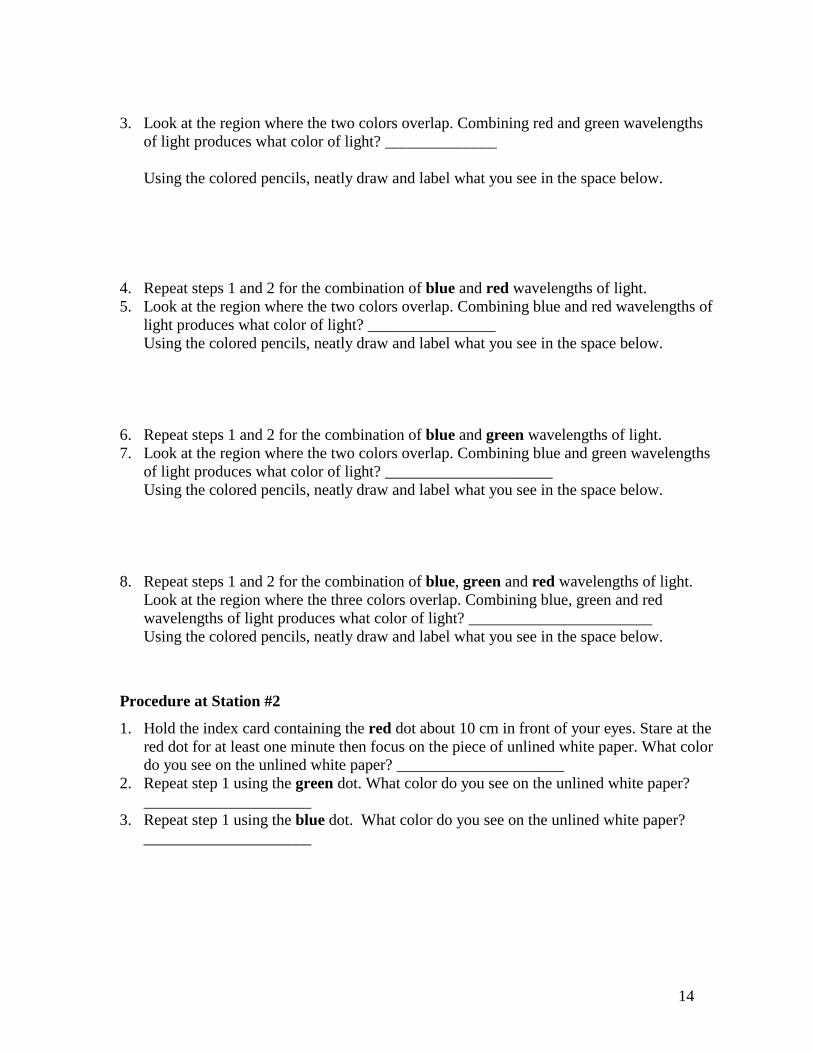
3. Look at the region where the two colors overlap. Combining red and green wavelengths
of light produces what color of light? ______________ Using the colored pencils, neatly draw and label what you see in the space below.
4. Repeat steps 1 and 2 for the combination of blue and red wavelengths of light. 5. Look at the region where the two colors overlap. Combining blue and red wavelengths of
light produces what color of light? ________________ Using the colored pencils, neatly draw and label what you see in the space below.
6. Repeat steps 1 and 2 for the combination of blue and green wavelengths of light. 7. Look at the region where the two colors overlap. Combining blue and green wavelengths
of light produces what color of light? _____________________ Using the colored pencils, neatly draw and label what you see in the space below.
8. Repeat steps 1 and 2 for the combination of blue, green and red wavelengths of light.
Look at the region where the three colors overlap. Combining blue, green and red wavelengths of light produces what color of light? _______________________ Using the colored pencils, neatly draw and label what you see in the space below.
Procedure at Station #2
1. Hold the index card containing the red dot about 10 cm in front of your eyes. Stare at the red dot for at least one minute then focus on the piece of unlined white paper. What color do you see on the unlined white paper? _____________________
2. Repeat step 1 using the green dot. What color do you see on the unlined white paper? _____________________
3. Repeat step 1 using the blue dot. What color do you see on the unlined white paper? _____________________
15
4. Color in the flag on your data sheet with the labeled colors. Be sure to color the blocks completely and as dark as you can. Hold the flag about 10 cm in front of your eyes. Stare at the flag at least one minute, then focus on the blank white area to the right of your colored flag.
yellow black green
5. What colors do you see on the white paper to the right of the flag? Using the colored
pencils, color and label the blank flag below with the colors that you saw.
Explanation
Language Usage: Whenever you see this picture, it is important to make sure that what you have written is clear and complete and that you have used correct spelling, grammar, punctuation and capitalization. Color
White light is the combination of the spectrum of colors: red, orange, yellow, green, blue, indigo and violet. White light can be formed in a variety of ways. If red, green and blue wavelengths of light are projected onto a white screen in the correct intensities, the screen will appear white. For this reason, red, green and blue are called the primary colors of light. The primary colors of light can be mixed by pairs to form three different colors of light. Red light + green light = yellow light Blue light + green light = cyan light (aqua) Red light + blue light = magenta light (hot pink)
16
The three colors yellow, cyan and magenta are called the secondary colors of light. The human eye perceives color through small cells called cones. If one color is looked at for a long time, the cones become stressed and stop sending messages to your brain for that particular wavelength of light.
Using observations that you made at Station #1 and the information on color found on page 15, defend your results for each step of Station #2. Write your explanation on the following lined paper.
__________________________________________________________________________
__________________________________________________________________________
__________________________________________________________________________
__________________________________________________________________________
__________________________________________________________________________
__________________________________________________________________________
__________________________________________________________________________
__________________________________________________________________________
__________________________________________________________________________
__________________________________________________________________________
__________________________________________________________________________
__________________________________________________________________________
__________________________________________________________________________
__________________________________________________________________________
__________________________________________________________________________
__________________________________________________________________________
__________________________________________________________________________
17
Exploration Activity 2 – Internet Scavenger Hunt As eye doctors in training, you will need to access information pertaining to several topics concerning the human eye. The Internet is an excellent source of current information, so let the search begin! Once you have found a site that provides the answer to a question, print out a hard copy. On the hard copy, highlight the answer to the question and label it with the question’s number. Also highlight the website address. At the end of the unit, you may need to revisit several of these sites or conduct additional searches in preparation for an oral presentation. The list of questions below is merely a guide to lead you to the numerous Internet sites regarding the human eye.
1. What term is used to describe the eye socket or deep cavity in the skull where the eyeball is
located? ________________________
2. Color blindness is caused by the absence of what in the eye? ____________________
3. What is the mailing address for the “National Eye Institute”?
________________________________________________________________________
4. What part of the brain receives the information from the optic nerve? ________________
5. Approximately how many elderly Americans out of 100 are affected by Glaucoma?
______________
6. Where in the eyeball is the “blind spot”? ____________________
7. What is a photoreceptor? ______________________
8. What is the difference in the amount of education needed to be an optometrist compared to
an ophthalmologist? _________________________
9. Cones are responsible for what type of vision?
___________________________________________________________________
10. Rods are responsible for what type of vision?
________________________________________________________________
11. How many long eye muscles extend from the eyeball to the skull? __________________
12. Approximately how many rods are contained in the retina? ___________________
18
Activity 2 – Internet Scavenger Hunt (con't.)
13. Why does Glaucoma eventually cause blindness?
_________________________________________________________________
14. Normal vision is 20/20. A person who is legally blind is 20/ ___________.
15. Locate the Braille alphabet. Spell your last name in Braille. _______________________
16. How is a “floater” formed in the eye? ________________________________________
17. When were the first contact lenses developed? ___________________________
18. How much can an experienced optometrist expect to earn? _______________________
19. Rhodopsin, an eye pigment, is made of what two parts? _________________________
20. What is the other term for nearsightedness? __________________________
21. What is the name of the eye disease that strikes very young children in which cancerous
tumors form in the retina of the eye? ______________________________________
22. What is the range of wavelengths of light that the human eye can detect?
_______________________________
23. Night blindness can be caused by a deficiency of what vitamin? ________________
24. What was George Wald known for in terms of eye research?
____________________________________________________________________
25. What is the purpose of a keratometer?
__________________________________________________________________

19
Explanation Activity 3 – Model of the Human Eye Having completed the Internet Scavenger Hunt, you have gained bits and pieces of information regarding the human eye. It is time to focus your investigation on the physical design of the human eye. Using materials of your choice, build a three-dimensional model of the human eye. Your model needs to include at a minimum the parts listed below. Each part needs to be labeled or identified in a key. The model will be used at the end of the unit as a visual aid in an oral presentation. Required Parts: Blind spot Iris Choroid Lens Ciliary muscle Optic nerve Cones and rods Pupil Cornea Retina Fovea Sclera Additional Parts: Aqueous humor Suspensory ligament Vitreous humor Sketch of the Human Eye: In the space below, draw and label the human eye with all of the required parts shown and labeled. You may want to review the Scientific Drawing Assessment Tool before you begin.

20
Model Design In the space below, describe in detail how you will build your model. Be sure to describe what materials will be used for each part. Also, describe how you will connect one part to another. The teacher must approve your design by signing on the line below before construction can begin. __________________________________________________________________________
__________________________________________________________________________
__________________________________________________________________________
__________________________________________________________________________
__________________________________________________________________________
__________________________________________________________________________
__________________________________________________________________________
__________________________________________________________________________
__________________________________________________________________________
__________________________________________________________________________
__________________________________________________________________________
__________________________________________________________________________
__________________________________________________________________________
__________________________________________________________________________
__________________________________________________________________________
__________________________________________________________________________
__________________________________________________________________________
__________________________________________________________________________
__________________________________________________________________________
__________________________________________________________________________
__________________________________________________________________________
Teacher’s signature
21
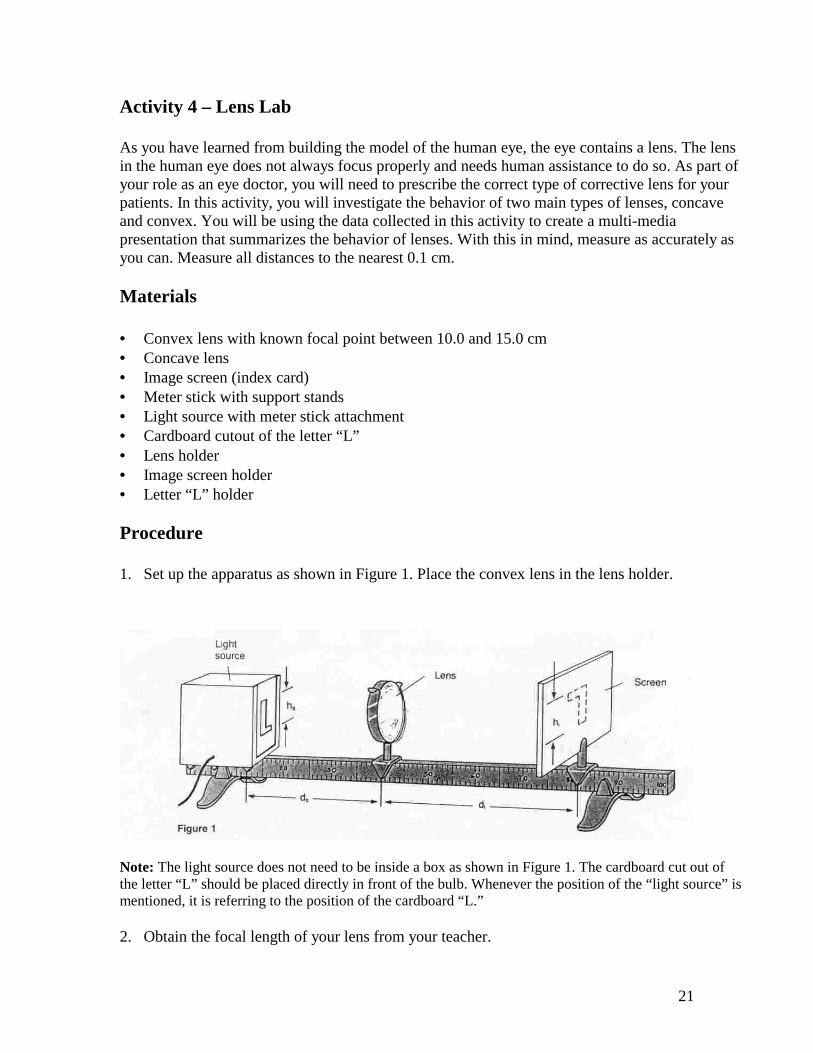
Activity 4 – Lens Lab As you have learned from building the model of the human eye, the eye contains a lens. The lens in the human eye does not always focus properly and needs human assistance to do so. As part of your role as an eye doctor, you will need to prescribe the correct type of corrective lens for your patients. In this activity, you will investigate the behavior of two main types of lenses, concave and convex. You will be using the data collected in this activity to create a multi-media presentation that summarizes the behavior of lenses. With this in mind, measure as accurately as you can. Measure all distances to the nearest 0.1 cm. Materials • Convex lens with known focal point between 10.0 and 15.0 cm • Concave lens • Image screen (index card) • Meter stick with support stands • Light source with meter stick attachment • Cardboard cutout of the letter “L” • Lens holder • Image screen holder • Letter “L” holder Procedure 1. Set up the apparatus as shown in Figure 1. Place the convex lens in the lens holder.
Note: The light source does not need to be inside a box as shown in Figure 1. The cardboard cut out of the letter “L” should be placed directly in front of the bulb. Whenever the position of the “light source” is mentioned, it is referring to the position of the cardboard “L.” 2. Obtain the focal length of your lens from your teacher.
22
3. Design a data table, in the space below, to record the following: the focal length of your lens,
whether the image is upright or inverted, distance (ds) between light source and lens, distance (di) between lens and image screen, height (hs) of light source, height (hi) of image and general location of object (i.e., beyond 2F, at 2F and between 2F and F). Refer to Figure 1 for clarity on the different measurements. Your table needs to hold data for three different lens positions.
Data Table for Activity 4 4. Slide the lens until it is 5.0 cm more than twice the focal length from the light source. Slide
the image screen along the meter stick until a well-defined, sharp image appears. Record all measurements and observation in your data table as specified in Procedure 3.
5. Repeat Procedure 4 with the lens at exactly twice the focal length (2F) from the light source. 6. Repeat Procedure 4 with the lens between 2F and F from the light source. 7. Position the lens at exactly one focal length (F) from the light source. Slide the image screen
along the meter stick. Can a well-defined, sharp image be formed on the screen? ______________
8. Position the lens less than F from the light source. Slide the image screen along the meter
stick. Can a well-defined, sharp image be formed on the screen? ___________ 9. With the lens still less than F from the light source, remove the image screen and look at the
light source through the lens. Is the image larger or smaller than the light source? ____________ Is the image upright or inverted relative to the light source? ______________
10. Without changing the position of the lens holder, replace the convex lens with the concave
lens. Look at the light source through the lens.
23
Is the image larger or smaller than the light source? ____________ Is the image upright or inverted relative to the light source? _________
Explanation There are two methods to verify that your lab data is accurate. One method is to use the thin lens and magnification equations found on page XXX. The second method is to draw a ray diagram to scale. Refer to the Student Resource Booklet and your teacher for information regarding these two methods. Elaboration 1. Using the measurements for focal length (F) and object distance (ds) from your Lens Lab
data table and the Thin Lens Equation provided in the Student Resource Booklet, calculate the theoretical image distance (di) for each of the three lens locations. Show the original equation, the numbers plugged into the equation and the final answer rounded to the correct number of significant digits and the appropriate unit. Beyond 2F:
24
At 2F:
Between 2F and F:
2. Using the measurements for the object distance (ds) and the object height (hs) from your
Lens Lab data table, the theoretical image distance (di) calculated using the Thin Lens Equation and the Magnification Equations provided in the Student Resource Booklet, calculate the theoretical image height (hi) for each of the three lens locations. Show the equation, numbers plugged into the equation and the final answer rounded to the correct number of significant digits with the appropriate unit.
Beyond 2F:
At 2F:
Between 2F and F:
25
3. Using a ruler and an appropriate scale, draw a ray diagram containing three principle rays
for each of the three lens locations in your data table. Use an arrow as the object instead of the letter “L.” Make the arrow the same height (hs) as the letter “L” that was used in the lab. Draw your ray diagrams on graph paper, and clearly state the scale that was used. Make all lines and measurements accurate to 0.1 cm. Use the values for focal length (F) and object distance (ds) from your data table to begin your ray diagram. After the diagram is complete, use a ruler and your scale to determine the values for image distance (di) and image height (hi).
4. On graph paper, draw a scale ray diagram containing three principle rays for your convex
lens with the object (arrow) placed between the lens and the focal point (F). You will need to choose an exact object distance (ds) in order to begin. Use the same object height (hs) that was used in the previous question. After the diagram is complete, use a ruler and your scale to determine the values for image distance (di) and image height (hi).
5. On graph paper, draw a scale ray diagram containing three principal rays for your concave lens with the object (arrow) placed between F and 2F. You will need to choose an exact object distance (ds) in order to begin. Use the same object height (hs) that was used in the previous question. After the diagram is complete, use a ruler and your scale to determine the values for image distance (di) and image height (hi).
26
6. Calculate the percent error between your experimental image distances (di) from your
data table and the convex theoretical image distances (di) calculated in Question 1. Beyond 2F: At 2F: Between F and 2F:
7. Calculate the percent error between your theoretical image distances (di) calculated in Question 1 and the image distances (di) from your ray diagrams.
Beyond 2F:
At 2F: Between F and 2F:
27
Activity 5 – Multi-media Presentation on Lens Behavior By collecting data during the Lens Lab, doing calculations using the Thin Lens Equation and drawing scale ray diagrams, you have accumulated a lot of information about the behavior of convex and concave lenses. It is time to compile this information into a multi-media presentation that summarizes the behavior of lenses. Using a computer slide show, Power Point presentation or something comparable, design a presentation that meets the criteria listed below. Your finished product will be used at the end of this unit as a visual aid in an oral presentation. Your presentation must visually show image formation for: Convex lens with the object: • A few centimeters beyond twice the focal length (2F) • At twice the focal length (2F) • Between twice the focal length (2F) and the focal length (F) • At the focal length (F) • Between the focal length (F) and the lens Concave lens with object: • Between twice the focal length (2F) and the focal length (F) Be sure to show: • At least 2 principle rays for each image • Relative orientation of image to object (up-right or inverted) • Relative size of image to object • Type of image (real or virtual) Note: The focus of this presentation is not to show the process of drawing a ray diagram. The goal is to show the variations in image formation caused by a change in the object’s location relative to the lens. A quality presentation requires planning. Use the Presentation Storyboard to layout your project before you begin work on the computer.

28

29

30
Activity 6 – Oral Presentation In order to graduate from your first year of Ophthalmology School, you must pass an oral exam. The “professor” (your teacher) will give you a series of questions based on the content from Activities 1-5. You will be expected to utilize observations, data, models, multi-media presentations and Internet information that you have generated throughout this unit as well as perform additional Internet searches in the process of preparing answers to the professor’s questions. The oral exam will be taken in front of the professor and your classmates.