Embed Size (px)
Citation preview

Paper ID #6972
Student Perceptions of Tactile and Virtual Learning Approaches: What CanWe Learn from their Viewpoint?
Dr. Kathy Schmidt Jackson, The Schreyer Institute for Teaching Excellence
Dr. Kathy Jackson is a senior research associate at Pennsylvania State University’s Schreyer Institutefor Teaching Excellence. In this position, she promotes Penn State’s commitment to enriching teachingand learning. Dr. Jackson works in all aspects of education including faculty development, instructionaldesign, engineering education, learner support, and evaluation.
Dr. Conrad Tucker, Pennsylvania State University, University ParkDr. Gul E. Okudan Kremer, Pennsylvania State University, University Park
Dr. Gul E. Okudan Kremer is an associate professor of Engineering and Industrial Engineering at Penn-sylvania State University. Her research focuses on decision analysis and design theory applied to improve-ment of products and systems. She has co-authored over 200 peer-reviewed papers to date and receivedseveral best paper awards. She has been also a National Research Council-US AFRL Summer FacultyFellow of the Human Effectiveness Directorate for 2002, 2003 and 2004, and a Fulbright Scholar from2010 to 2011.
c©American Society for Engineering Education, 2013

Student Perceptions of Tactile and Virtual Learning Approaches:
What Can We Learn from their Viewpoint?
Abstract
Active physical manipulation and touching of objects, also known as tactile interactions, are
generally viewed as effective ways for students to learn complex and abstract concepts.
Researchers, however, are still investigating how tactile instructional activities contribute to
deeper student learning. In traditional engineering design courses, students engage in tactile as
well as virtual learning experiences. This study aims to determine whether substantial differences
exist between tactile and virtual learning approaches on active learning outcomes. In this
preliminary study, we are investigating students’ perceptions of tactile and virtual learning
activities in an engineering design classroom and the challenges that students face in performing
these types of activities in a team-based approach.
Active learning can have many definitions and, in general, refers to various teaching and learning
strategies where students are responsible for their learning by interactive involvement – this is
not a passive lecture approach. With tactile learning, students are able to explore and manipulate
objects and materials, yet today’s students tend to do much of their exploration and object
manipulation through the use of computer technologies rather than through interactions with
physical products (e.g., virtual product dissection versus physical dissection). Some wonder if
students who no longer touch and handle objects are able to be effective abstract thinkers. Others
contend that because today’s students are more tech savvy, active learning is possible through
virtual interactions.
Our freshman students are introduced to engineering design in a course that incorporates both
digital and hands-on learning. This class provides students with theoretical fundamentals,
abstract thinking, and real-world applications that are taught through the framework of
sustainable design and environmental awareness. Students work in teams to complete their lab
assignments and their ability to successfully collaborate, use the various technologies, and create
novel solutions is dependent upon their ability to manipulate objects (either physically or
virtually). In this paper, we offer preliminary evidence on the comparison of tactile to virtual
learning as perceived by our students and share instructional issues that students feel either help
or hinder their ability to learn.
1 Introduction
Given that there are numerous ways to define engineering design, it follows that there are many
pedagogical approaches to teaching design. While most agree that “design, above all else,
defines the difference between an engineering education and a science education” 1, design
experiences in the curriculum are varied and uneven. Many students report that design methods

are typically taught at a high-level and in a compartmentalized fashion resulting in students
lacking incremental concrete experiences 2.
Today’s educators are faced with not only pedagogical concerns when it comes to teaching
engineering design, but they also need to adapt their strategies to best meet the needs of today’s
students. Many, if not most of the current crop of undergraduate engineering students, are less
likely to be “tinkers” than students of earlier generations. “That tinkering by the way is early
development of the ability to conduct critical analysis, an ability that is at the heart of
engineering” and students who enter engineering classes without it need hands-on classroom
experiences to overcome this deficit 3.
This generation, born between 1982 and 2002 known as the Millennials, are identified by Howe
and Strauss as sharing these seven predominant characteristics: special, confident, conventional,
sheltered, team-oriented, achieving and pressured 4.What is more telling, however, among this
age group aptly labeled “digital natives” by Prensky is their comfort and dependence upon digital
technologies 5. The technological capabilities of Millennials are recognized by many and
prompted Taylor to coin the term “technoliterate” to describe their unique perspective 6.While
Millennials are known to lead lives infused with technology, this is still a diverse group of
approximately 80 to 100 million Americans, who differ when it comes to specific technologies.
We cannot assume that millennial students will all have the same learning aptitude with
technologies nor will they all have the same desire to use these technologies 7,8
.
Not only are the students’ backgrounds and expectations changing, there is a greater emphasis on
classroom instruction that is active and involves the learners. While teaching methods that
promote student participation and active learning are often advocated, the term “active learning”
is not always clearly defined. Most educators assume that learning is inherently active; yet
research suggests that for students to be actively learning, they need to do more than just listen.
As such, “it is proposed that strategies promoting active learning be defined as instructional
activities involving students in doing and thinking about what they are doing 9.” Often people
assume that learning involves a hands-on component, but that is not a necessity. Hands-on
learning, however, can be active and involve thinking that goes way beyond mere manipulation
of objects.
The relative effectiveness of hands-on instruction is a topic much discussed in a variety of
disciplines. Engineers, in particular, question whether or not students benefit from tactile
learning experiences and whether or not these experiences need to involve physically handling
objects or whether digital techniques have the same impact. To clarify, digital learning
techniques refer to the use of technology and virtual infrastructure to communicate concepts and
activities relating to a course or curriculum while tactile or haptic learning relates to the physical
handling of an object. In either case, the learner’s hands are active and in use.
According to Taylor, Lederman, and Gibson 10
, something touched is more real than something
seen. Instructors in the sciences often espouse that active and physical manipulation is more
effective when learning complex and abstract science concepts 11
. Manipulation when it involves
intentional actions on the part of the learner can be motivating and increase attention to learning 12
. Yet current research still cannot attribute how concrete, tactile experiences contribute to
understanding science.
Engineering educators question how much, if any, virtual experiences can replace hands-on
learning. While there is not general answer to this question13
, there does seem to be consensus
that engineering students often have an aptitude for visual and tactile learning14
and that students
need these types of experiences to learn engineering. One area that has received considerable
interest is how drafting helps students develop 2D and 3D visualization skills. There is evidence
that hands-on problem solving influences improved spatial abilities15
and that the cognitive
processes used to physically draw a line are different than those that are needed to specify the
end points for a CAD representation 16
. A survey found that industry practitioners, faculty and
students believe there is value in learning how to construct technical drawings using a pencil and
that ‘the haptic experience of pencil and paper line production and layout, combined with the
discipline of using orthographic and axonometric projections appears to engender a deeper
appreciation of accepted conventions 16
.”
Some suggest that engineering students are dissatisfied with flat, non-engaging instructional
approaches and tools. A review of engineering mechanics projects found that none employed
haptics for the feel of forces involved 17
. With “feeling as believing” as their guide, a group of
Ohio State researchers developed a haptic interface to a set of software activities used by
engineering undergraduates and they found that students did gain a better understanding of
thebasic course concepts 18
. The purpose of this study is to probe student perceptions of digital
and tactile learning techniques. Do students have a preference for either of these approaches? Do
they believe that deeper learning occurs based on whether or not they were using digital or tactile
techniques? Gathering input on students’ perceptions is an important consideration 19
as these
perceptions can affect student engagement and learning 20
. It is noteworthy that if students
perceive a particular approach positively, they are more motivated to learn and will believe they
will learn more 21
. If professors are aware of students’ perceptions of digital and tactile learning,
they may be better able to design instruction that promotes deeper student learning.
2 Course Description
Introduction to Engineering Design (EDSGN100) is a first-year engineering design course,
required for most engineering majors at Penn State University. The class employs a design-
driven curriculum with emphasis placed on skills such as team-based design, communication
skills (graphical, oral and written), and computer-aided analysis tools. The course introduces
students to the engineering approach to problem solving with strong references to basic science
and math skills, as well as testing and evaluation design ideas by building prototypes. The design
projects are a total of at least 30 hours of in-class work (one-third of the course).
The course aims to teach students how to:
1. Use the design process well in all the course projects, ability to extend the design process to
general problem solving, and assess the value of creativity in the engineering design process.
2. Develop basic skills in 3-D solid modeling CAD (Computer-Aided Design) using SolidWorks.
3. Acquire 3D visualization skills to draw and communicate design ideas and concepts.
4. Contribute to team-based projects, solve inter-team problems and develop communication
skills.
5. Produce a well-organized reports and virtual portfolios summarizing design project work
3 Overview of Engineering Design Project
Students are presented with a sustainability-driven project by first introducing them to the global
impact of the current state of activities. Recent research published by the U.S. Environmental
Protection Agency indicates that approximately 789 million mobile devices are at the end of their
life, ready to be recycled. However, only about 11 % of those now considered "junk" were
recycled last year. The rate of consumption of natural resources, coupled with the abysmal
recycling statistics presents enormous challenges for future generations 22
.
Student teams (approximately 4-5 students/team) are assigned the task of developing a concept
for a new niche market for a sustainable consumer electronics product. Each student team is to
develop new concepts for a sustainable consumer electronics product. Each student team is to
analyze the current offerings in the market and design a product that will better meet needs of the
targeted environmentally conscious/green population.
The external design activities include following steps:
Step 1. Analysis of customer needs
Step 2. External search (Product Dissection and Benchmarking)
a. Component and assembly analysis
b. Literature Review
c. Patent Search
Step 3. Revising the design statement
Step 4. Internal work for concept generation
Step 5. Concept Generation (Conceptualization and Virtual Representation)
Step 6. Concept Selection
Step 7. Embodiment of the design and feasibility analysis
a. Materials and manufacturing processes
Step 8. Detail Design.
Steps 2 and 5, while distinct in their methodological approaches, relate to the same design
project, hereby enabling researchers to study student learning between these two steps
(tactile VS digital). That is, when students are presented with an engineering design

objective (in this case, a sustainability focused project), they first engage in hands- on
learning through product dissection/benchmarking (Step 2), followed by a
conceptualization of their design solutions in a digital environment (Step 5). Steps 2 and
5 are allocated approximately 2 weeks of in-class time (~4-6 hours) each with the
methodological distinctions made primarily based on the nature of the design task; tactile
primarily focuses on physical interactions with a design artifact, while digital primarily
focuses on the digital interactions of a design artifact.
3.1 Tactile Project Assignment: Sustainability-Driven Design
The tactile project assignment (Step 2) primarily focuses on Product Dissection and
Benchmarking. Here, students physically interact with products/components of products
for a more in-depth understanding of the configuration and interactions among product
components. During the product dissection and benchmarking exercise, students:
1. Disassemble, measure, and analyze the function of each component. The data is recorded
in the Bill of Materials (BOM) table created by students.
2. Insert pictures or sketch components to the visuals table in a data sheet. The names of the
components are indicated in the data sheet.
3. Study and indicate (using a tree structure) how components, subassemblies, and final
assembly relate to each other on data sheet 2.
Table 1 provides a visual representation of the results from a student team’s product
dissection activity.
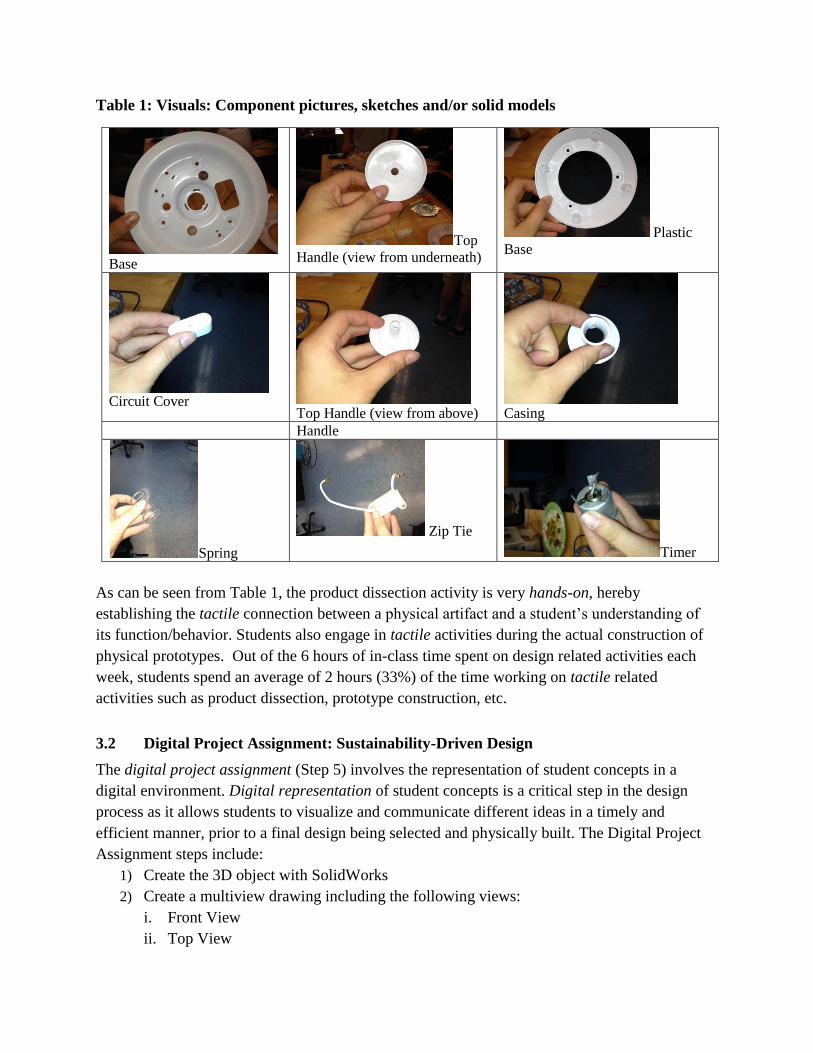
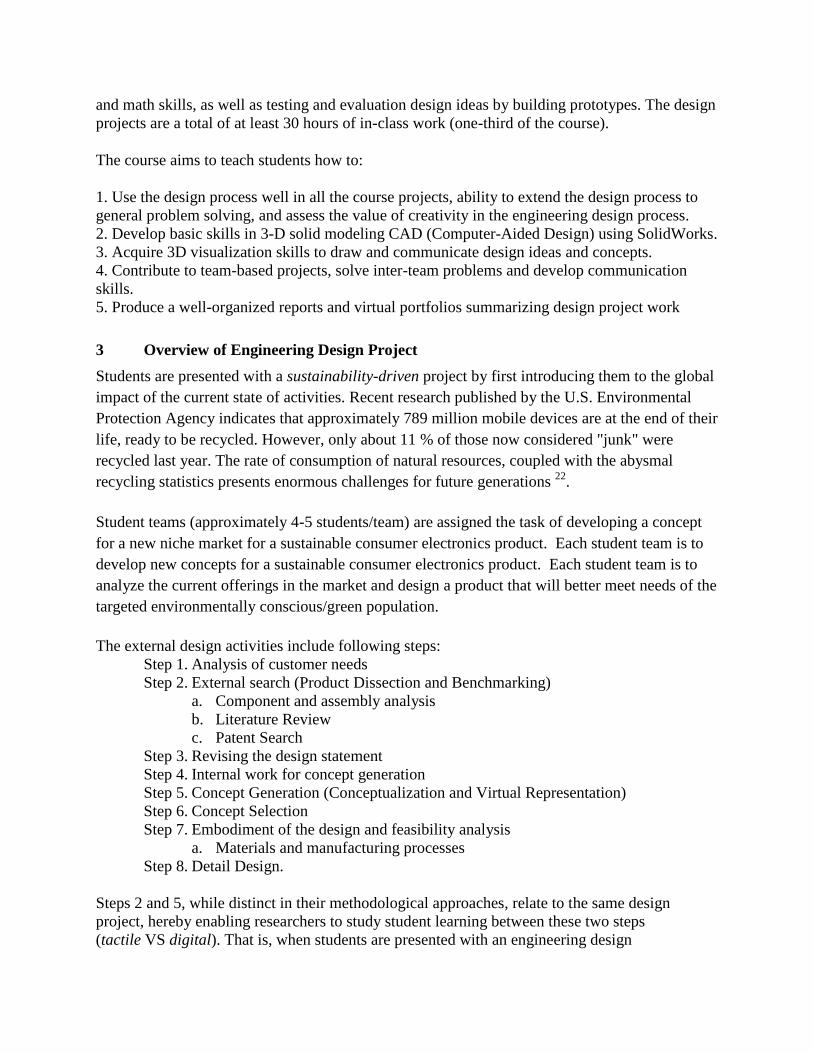
Table 1: Visuals: Component pictures, sketches and/or solid models
Base
Top
Handle (view from underneath)
Plastic
Base
Circuit Cover
Top Handle (view from above) Casing
Handle
Spring
Zip Tie
Timer
As can be seen from Table 1, the product dissection activity is very hands-on, hereby
establishing the tactile connection between a physical artifact and a student’s understanding of
its function/behavior. Students also engage in tactile activities during the actual construction of
physical prototypes. Out of the 6 hours of in-class time spent on design related activities each
week, students spend an average of 2 hours (33%) of the time working on tactile related
activities such as product dissection, prototype construction, etc.
3.2 Digital Project Assignment: Sustainability-Driven Design
The digital project assignment (Step 5) involves the representation of student concepts in a
digital environment. Digital representation of student concepts is a critical step in the design
process as it allows students to visualize and communicate different ideas in a timely and
efficient manner, prior to a final design being selected and physically built. The Digital Project
Assignment steps include:
1) Create the 3D object with SolidWorks
2) Create a multiview drawing including the following views:
i. Front View
ii. Top View

iii. Left View
iv. Isometric View
v. Detail Views
3) Drawing Details:
i. Fill the title block with student names and scale information
ii. Include a note explaining the dimensions
Figure 1: Example Solid Works models of student design projects
Figure 1 presents visual results of prototype CAD models that students have worked on during
digital design activities. Out of the 6 hours of in-class time spent on design related activities each
week, students spend an average of 2 hours (33%) of the time working on digital related
activities. Each student is provided with his/her own computer with CAD software installed.
Students can either work on sections of a CAD concept that then integrates with other sections
design by other team members, or individually design and complete an entire CAD prototype
from scratch and then compare different digital concepts within the team.
4 Description of Study and General Methodology
EDSGN100 is a course that is taught in multiple sections across various Penn State campuses.
While there is a suggested text and activities, each professor has freedom to adjust their
curriculum as needed. The two sections of this course participating in this study had different
professors, but similar course requirements. Student participation in this study was voluntary.
Since people who volunteer for a study may differ from non-volunteers, selection bias may exist.
With this preliminary study, action research (commonly known as research done by those in the
field to improve their practice) was used. This research does not involve the use of a control
group and is not attempting to make generalizations to other settings. The focus with action
research is on gathering information that can be used to change conditions in a particular
situation. Here we gathered information about the students and their perceptions on digital and
tactile instruction and based on our findings, we will make adaptions to our pedagogy.
Midway through the semester, students completed a questionnaire that included both open-ended
and scaled, retrospective pre-post responses. They also responded to some basic demographic
questions. Use of the retrospective design allows for learner self-reported changes in knowledge,
preferences, confidence, behaviors, and attitudes since it can be difficult for people to assess
their pre-program understanding or behaviors. This method can replace a pretest - posttest
approach since it takes less time and avoids pretest sensitivity and response shift bias resulting
from pretest overestimation and underestimation 23
. The retrospective method is nonetheless still
limited due to the vulnerability to bias in self-reporting (both social desirability and accuracy)
and by the limitations of individuals’ ability to accurately recall over time.
As described in the introduction, this study gathers students’ perceptions via a questionnaire.
Positive beliefs can influence student learning and this study aims to reveal how students react to
digital and tactile learning approaches. By separating the tactile activities from the digital
activities, researchers are able to clearly observe students’ perceptions of the two domains of
design education.
4.1 Description of the Population
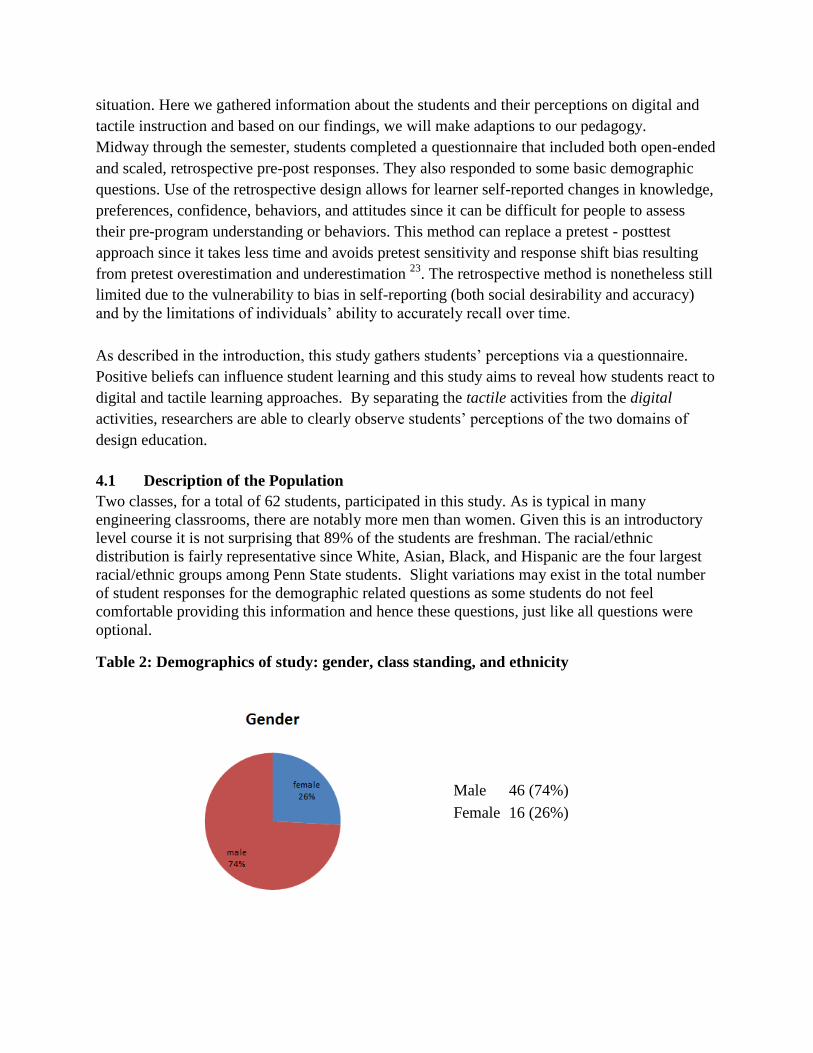
Two classes, for a total of 62 students, participated in this study. As is typical in many
engineering classrooms, there are notably more men than women. Given this is an introductory
level course it is not surprising that 89% of the students are freshman. The racial/ethnic
distribution is fairly representative since White, Asian, Black, and Hispanic are the four largest
racial/ethnic groups among Penn State students. Slight variations may exist in the total number
of student responses for the demographic related questions as some students do not feel
comfortable providing this information and hence these questions, just like all questions were
optional.
Table 2: Demographics of study: gender, class standing, and ethnicity
Male 46 (74%)
Female 16 (26%)

Ethnicity
African American (non-
Hispanic) 5 (8%)
Asian/Pacific Islanders 6 (10%)
Caucasian (non-Hispanic) 48 (76%)
Latino/Hispanic 4 (6%)
Native American 0 (0%)
Other 2 (3%)
4.2 Quantitative Survey Results
The quantitative analysis of the survey results aims to determine whether substantial differences
exist between tactile and virtual learning approaches on active learning outcomes. In this
preliminary study, we are investigating students’ perceptions of tactile and virtual learning
activities in an engineering design classroom and the challenges that students face in performing
these types of activities in a team-based setting. The results below provide quantitative evidence
of the correlations that exists between different variables (survey questions) in the survey. We
have chosen to highlight Figures 2-5 (box plots of survey items 2- 5) because they are questions
that are posed to reveal students’ perception of both tactile and digital experiences. Table 3
presents the summary of the survey statistics for each item number (survey items listed 1-10) to
help quantify the changes that are statistically significant.
Figure 2: Item 2 Pre-Post Figure 3: Item 4 Pre-Post
Item_2_(Post)Item_2_(Pre)
5
4
3
2
1
Da
ta
Useful to physically touch and manipulate products during design.
Item_4_(Post)Item_4_(Pre)
5
4
3
2
1
Da
ta
Learn easier when I am virtually manipulating products

Figure 4: Item 5 Pre-Post Figure 5: Item 6 Pre-Post
Table 3 provides the mean response values for the pre- and posttest for each of the survey
questions. The T-value represents the results from the student’s t-test which tests the null
hypothesis that the means of the pre and post-test are equal. Once the T-value is calculated, the
P-Value can then be determined and if a given statistical significance level (in this case 0.05), the
null hypothesis is rejected. The F Statistic in Table 3 is simply another statistical test used to
compare the variables in the regression model. The P-value is once again used to test for
statistical significance, rejecting the null hypothesis if the P-value is less than the statistical
significance level (in this case 0.05).
Item_5_(Post)Item_5_(Pre)
5
4
3
2
1
Da
taPhysically manipulating objects distracts me
Item_6_(Post)Item_6_(Pre)
5
4
3
2
1
Da
ta
I produce a better product when I work in a group of students

Table 3: Summary of Survey Statistics
Item Survey Items
Pre-
course
Mean
Post-
course
Mean
T-
Value
P-
Value
F
Statistic
P-
Value
1 My knowledge about the
environmental impact of a product. 2.468 3.532 -7.78 0.000 1.12 0.660
2 I find it useful to be able to
physically touch and manipulate
products when I am doing
engineering design.
3.339 3.903 -3.63 0.000 1.91 0.013
3 I find it useful to be able to
virtually manipulate products
(using tools like Solid
Works/CAD, HTML/Google, etc.)
when I am doing engineering
design.
3.339 4.194 -5.22 0.000 0.97 0.891
4 I find it easier learning when I am
virtually manipulating products 2.952 3.650 -4.12 0.000 0.72 0.205
5 I find it that physically
manipulating objects (such as
product dissection, campus tours,
3D scanning and printing) distracts
me from focusing on the
assignment
2.694 2.387 2.11 0.037 0.79 0.352
6 I produce a better product when I
work in a group of students 3.420 3.940 -2.82 0.006 0.93 0.776
7 Seeing a visual helps me make
connections between what I know
and new intangible material that I
am learning
3.855 4.210 -3.64 0.000 1.93 0.011
8 Manipulating something physically
helps me make connections
between what I know and new
intangible material that I am
learning.
3.806 4.177 -3.99 0.000 1.17 0.531
9 The use of virtual tools and
technologies hinders my learning
in this class
2.258 3.060 -4.53 0.000 0.94 0.801
10 In this class it is beneficial to have
alternative ways of understanding
the ideas or skills
3.645 4.268 -5.44 0.000 1.20 0.483
4.3 Qualitative Survey Results
In addition to the scaled responses, students were asked open-ended questions that allow students
to respond based on their belief systems rather than solely responding to questions responses that
are influenced by the researchers’ parameters. These questions along with representative
comments are provided below in Table 4. As the comments indicate, students came into the class
with computer skills, ranging from basic operational use to more advanced skills including some

use of CAD. Only a few of the students have practical hands-on experience although several
noted their usage of LEGOs and modeling clay. Group work and Solid Works were noted as
having an impact on their learning.
Table 4: Qualitative statements provided by the questionnaire
Questions/Responses Illustrative comments
What computer skills, if any,
did you bring into this class?
“I know how to use computers.”
“Basic proficiency with all Microsoft Office programs along
with a small amount of CAD.”
“I’m your average, *skilled* computer user.”
“I’m good with fixing problems and navigating an OS.”
“Some prior work in AutoCAD plus computer repair.”
What hands-on experience, if
any, did you bring into this
class?
“I designed a chair from cardboard.”
“I have worked on cars and have built chairs, ice rinks, and
houses.”
“None, but I’m good with LEGOs and modeling things with
clay and such.”
“I am an avid model rocket builder.”
List three things you have
learned in this course.
“How to use Solid Works.”
“How to generate ideas.”
“How to work in a group to design something.”
Briefly describe the
instructional methods that
were the most helpful to you.
“Comparing all the ideas that were generated from members
in my group.”
“Practice with Solid Works.”
“Class discussions.”
“Even though I hated them, all of the presentations were
extremely useful.”
“The tutorials were probably the most beneficial to me
because I had no prior experience using CAD.”
6 Discussion The pre and post correlations were evaluated separately with the results presented below.
Pearson correlation and regression analyses were completed in Minitab Statistical Software.
Pre-course:
1. Item2 is correlated to Item3.
2. Item 4 is correlated to Item3.
3. Item 5 is correlated to Item4.
4. Item 6 is correlated to Item4.
5. Item 7 is correlated to Item2.
6. Item 8 is correlated to items 2 and 3.
7. Item 8 negatively correlated with Item 5.
8. Item 8 correlates to Item 7.
9. Item 9 correlates with Item5.
10. Item 10 negatively correlates to Item 5.
11. Tactile skills correlate to Item 2.
12. Digital skills correlate to Item 4.
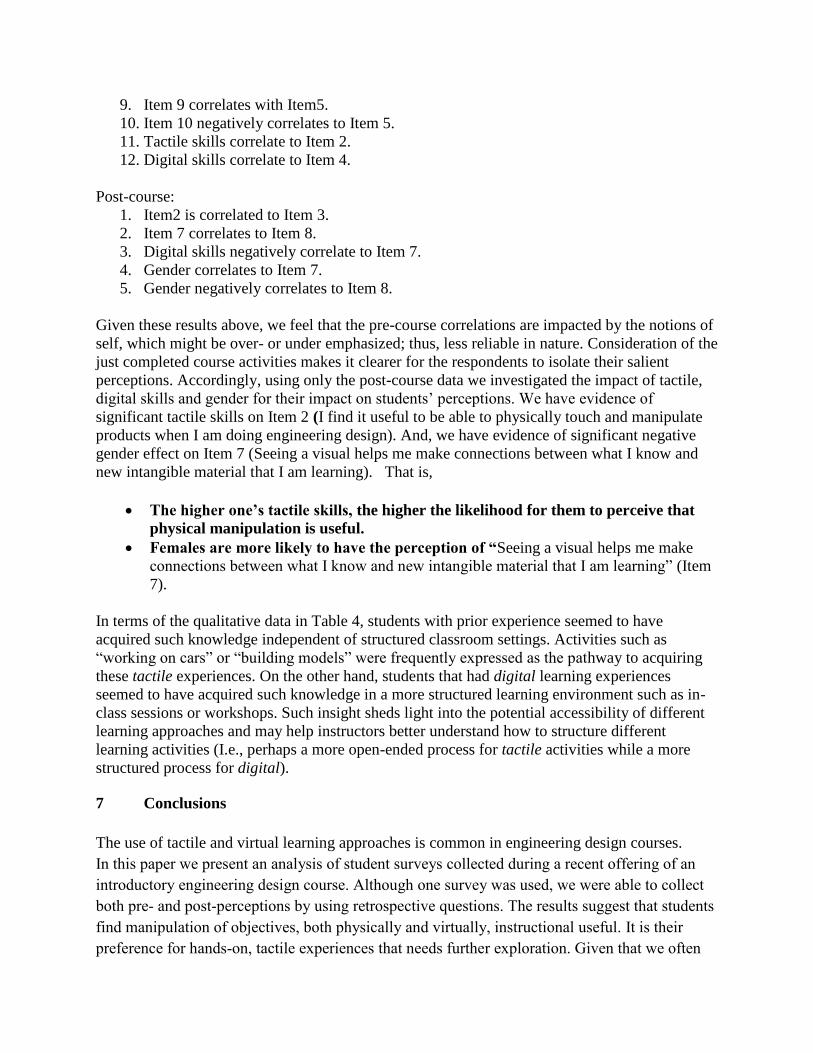
Post-course:
1. Item2 is correlated to Item 3.
2. Item 7 correlates to Item 8.
3. Digital skills negatively correlate to Item 7.
4. Gender correlates to Item 7.
5. Gender negatively correlates to Item 8.
Given these results above, we feel that the pre-course correlations are impacted by the notions of
self, which might be over- or under emphasized; thus, less reliable in nature. Consideration of the
just completed course activities makes it clearer for the respondents to isolate their salient
perceptions. Accordingly, using only the post-course data we investigated the impact of tactile,
digital skills and gender for their impact on students’ perceptions. We have evidence of
significant tactile skills on Item 2 (I find it useful to be able to physically touch and manipulate
products when I am doing engineering design). And, we have evidence of significant negative
gender effect on Item 7 (Seeing a visual helps me make connections between what I know and
new intangible material that I am learning). That is,
The higher one’s tactile skills, the higher the likelihood for them to perceive that
physical manipulation is useful.
Females are more likely to have the perception of “Seeing a visual helps me make
connections between what I know and new intangible material that I am learning” (Item
7).
In terms of the qualitative data in Table 4, students with prior experience seemed to have
acquired such knowledge independent of structured classroom settings. Activities such as
“working on cars” or “building models” were frequently expressed as the pathway to acquiring
these tactile experiences. On the other hand, students that had digital learning experiences
seemed to have acquired such knowledge in a more structured learning environment such as in-
class sessions or workshops. Such insight sheds light into the potential accessibility of different
learning approaches and may help instructors better understand how to structure different
learning activities (I.e., perhaps a more open-ended process for tactile activities while a more
structured process for digital).
7 Conclusions
The use of tactile and virtual learning approaches is common in engineering design courses.
In this paper we present an analysis of student surveys collected during a recent offering of an
introductory engineering design course. Although one survey was used, we were able to collect
both pre- and post-perceptions by using retrospective questions. The results suggest that students
find manipulation of objectives, both physically and virtually, instructional useful. It is their
preference for hands-on, tactile experiences that needs further exploration. Given that we often
think of today’s students as “digital natives” we may be making inaccurate assumptions about
their learning preferences. We also found that gender may have an influence on students’
preferences for the use of visuals in instruction. Our initial study will be useful as we further
explore these issues and as we include student performance outcomes related to the use of tactile
and virtual learning experiences.
References
1. Hodge, B.K. and Steele, W. G. (1995). Experiences with a curriculum with balanced design content in all
stems,” presented at the ASEE Annual Conference Proceedings, 225–211.
2. Wood, K.L., Jensen, D., Bezdek, J. and Otto, K. N. (2001). Reverse engineering and redesign: Courses to
incrementally and systematically teach design, Journal of Engineering Education, vol. 90, 363–374.
3. Janosz, D. (2011). Teaching tomorrow’s engineers today, http://www.teachingenuity.com/2011/05/
15/teaching-tomorrows-engineers-today/.
4. Howe, N. and Strauss, W. (2000). Millennials Rising: The Next Great Generation, First Edition Vintage Books.
5. Prensky, M. (2001). Digital natives, digital immigrants part 1,” On the Horizon, 9(5), 1–6.
6. Taylor, M. (2205). Generation neXt: Today’s postmodern student-meeting, teaching and serving. In A
Collection of papers on self-study and institutional improvement: Chicago: The Higher Learning Commission,
2, 99–107.
7. Oblinger, D. (2008). Growing up with google. What it means to education.
http://www.educause.edu/Resources/GrowingupwithGooglewhatitmeans/162862.
8. Lewis, J., Coursol, D., and Khan,L. (2001). College [email protected]: A study of comfort and the use of
technology. Journal of College Student Development, 42(6), 625–31.
9. Bonwell, C. C., & Eison, J. A (1991). Active learning: Creating excitement in the classroom. ASHEERIC
Higher Education Report No. 1, George Washington University, Washington, DC.
10. Taylor, M. M., Lederman, S. J., & Gibson, R. H. (1974). Tactual perception of texture. In E. C. Carterette & M.
P. Friedman (Eds.), Handbook of perception, Vol. 3: Biology of perceptual systems. New York: Academic.
11. Druyan, S. (1997). Effect of the kinesthetic conflict on promoting scientific reasoning. Journal of Research in
Science Teaching, 34, 1083-1099.
12. Sathian, K. (1998). Perceptual learning. Current Science, 75, 451-456.
13. Ma, J. & Nickerson, J.V. (2006). Hands-on, simulated and remote Laboratories: A comparative literature
review. ACM Computing Surveys, 38(3), Article No. 7, 1-24.
14. Sarasin, L. C. (1999). Learning style perspectives: Impact in the classroom. Madison, WI: Atwood Publishing.
15. Leopold, C., Gorska, R., &. Sorby, S. (2001). International experiences in developing the spatial visualization
abilities of engineering students. Journal for Geometry and Graphics, 5(1), 81– 91.
16. McLaren, S.V. (2008). Exploring perceptions and attitudes towards teaching and learning manual technical
drawing in a digital age. International Journal of Technology and Design, 18(2), 167-188.
17. Philpot, T.A., Hubing, R.E., Flori, R.H., Hall, D.B., Oglesby, V., & Yellamraju, V. (2003). Computer-based
instructional media for mechanics of materials. International Journal of Engineering Education, 19(6), 862-
873,
18. Williams, R.L., Xingxi, H., Franklin, T., & Wang, S. (2004). Haptics-augmented undergraduate engineering
education. Paper presented at the International Conference on Engineering Education, Gainesville, Florida.
19. Entwistle, N. (1991). Approaches to learning and perceptions of the learning environment. Higher Education,
22, 201-204.

20. Konings, K., Brand-Gruwel, S., & van Merrienboer, J. (2005). Towards more powerful learning environments
through combining the perspectives of designers, teachers, and students. British Journal of Educational
Psychology, 75, 645-660.
21. Struyven, K., Dochy, F., and Janssens, S. (2008). Students’ likes and dislikes regarding student-activating and
lecture-based educational settings: Consequences for students’ perceptions of the learning environment, student
learning and performance, European Journal of Psychology of Education, 23, 295-317.
22. usatoday, “Recycling of gadgets grows,” USATODAY.COM, n.d.,
http://www.usatoday.com/tech/news/story/2011-12-27/recycling-gadgets/52240824/1.
23. Pratt, C. C., McGuigan, W. M., & Katzev, A. R. (2000) Measuring program outcomes: Using retrospective
pretest methodology. American Journal of Evaluation, 21(3). 341-349.