Embed Size (px)
Citation preview
Student Satisfaction Inventory 2012 - 2013
Submitted April 2013
Page | 1
Contents
Introduction ................................................................................................................................................................................................. 2
Background ................................................................................................................................................................................................. 2
Student Satisfaction Inventory .................................................................................................................................................................... 4
Theme Analysis ........................................................................................................................................................................................ 12
Recommendations ..................................................................................................................................................................................... 17
Page | 2
Introduction
The Student Satisfaction Inventory (SSI) is one part of CCCC’s campaign to provide an environment for its students that is
innovative and competitive to the changing educational environment. In December 2012 the SSI was updated from a previously used
electronic version in fall 2011 and delivered through the college email system to students only. The call for participation this year was
done electronically through periodic student email in order to produce the most adequate sample size. On February 19, 2013, one last
email was sent out to students to warn the survey would close at the end of the day and they would have one last chance to complete
the survey.
In addition, the technology department provided space on the college web page with a link for students to access the electronic
survey. Students were informed they should only take the survey once and that the amount of time necessary to complete the survey
would be estimated at about 20 minutes. In order to ensure that CCCC students were the only students to take the survey, protocols
were followed that allowed the survey software to recognize only college computers, eliminating the possible invasion of unwanted
data.
Background
Upon reviewing the data it was deemed some of the data would have to be removed as some students took the survey more
than once. If this were the case, the students’ second entry would be deleted from the data to remain consistent throughout the process.
In 2012 the fall enrollment for Cankdeska Cikana Community College (CCCC) was 219 students. There are 20 degree and
certificate programs offered at CCCC. The program with the most students is liberal arts, which is an associate of arts program. The
next most frequent program is pre-nursing, which is an associate of science offering. In fall 2012, there were 90 male students and 129
female students. Full-time students were the most frequented with 132 and 87 students were part-time status.
The spring 2013 enrollment has 236 students enrolled (at the time of this report). Liberal Arts continues to be the most
frequented program with business administration gaining momentum with 29 students enrolled. There are 131 female students and 99
male students enrolled in spring 2013. There are 171 full-time students enrolled in this semester with 65 enrolled at part-time status.
The age group most frequented was 19 – 24 (n – 33, 33.7%) followed by 25 – 34 (n = 27, 27.6%) and finally age 35 – 44 (n = 20,
20.4%).
Page | 3
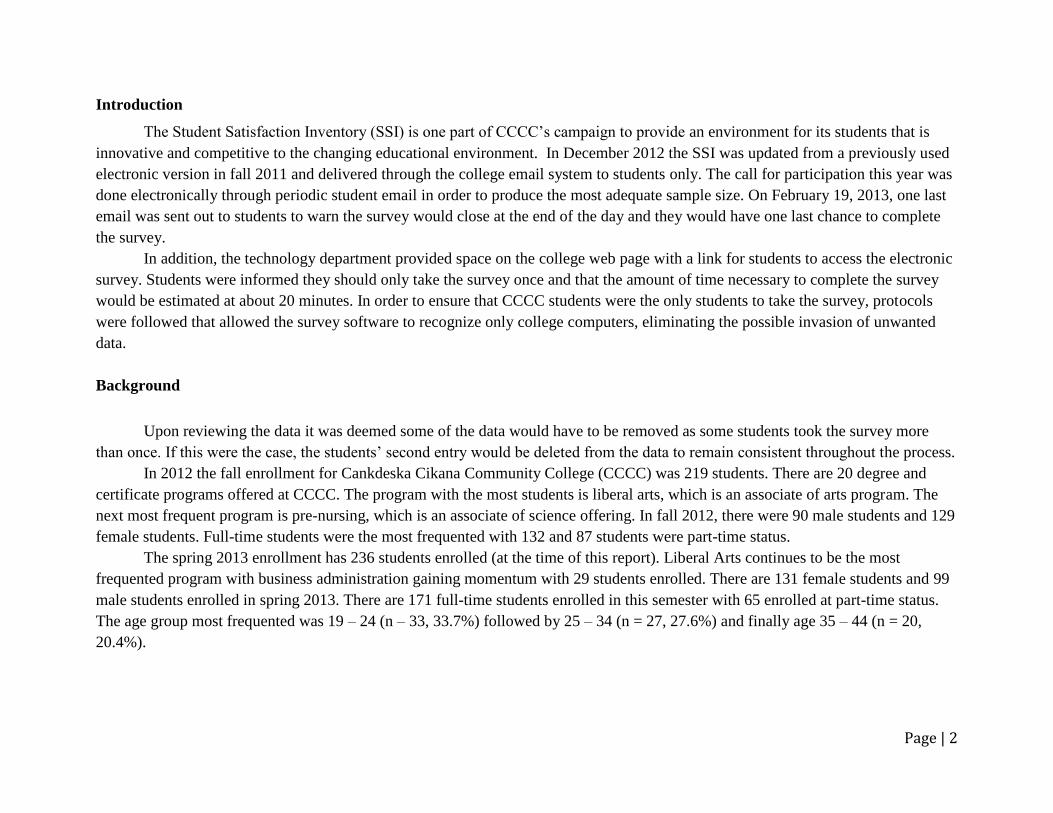
Tables 1 – 8
Respondent Profile
Current Enrollment Status N %
Day 56 50.5
Evening 1 .9
Days & Evening, but
mostly days
36 32.4
Days & Evening, but
mostly evening
3 2.7
Total 96 86.5
Missing 15 13.5
Age Category N %
18 or younger 4 3.6
19-24 37 33.3
35-44 28 25.2
45-54 1 .9
55 or older 5 4.5
Total 96 86.5
Missing 15 13.5
Current class load N %
Full-time (12 credits or
more per semester)
83 74.8
Part-time (6-11 credits) 10 9.0
Less than part-time (5
credits or less)
3 2.7
Total 96 86.5
Missing 15 13.5
Gender N %
Male 47 42.3
Female 48 43.2
Total 95 85.6
Missing 16 14.4
Class Level (years in
attendance at this
college)
N %
1 or less 52 46.8
2 29 26.1
3 9 8.1
4 or more 5 4.5
Total 95 85.6
Missing 16 14.4
Employment
N %
1 or less 52 46.8
2 29 26.1
3 9 8.1
4 or more 5 4.5
Total 95 85.6
Missing 16 14.4
Grade Point
Average
N %
3.6 – 4.0 20 18
3.1 – 3.5 22 19.8
2.6 – 3.0 17 15.3
2.1 – 2.5 17 15.3
2.0 or below 17 15.3
Total 93 83.8
Missing 18 16.2
Ethnicity N %
Alaska Native 2 1.8
American Indian 90 81.1
Black/African-
American
1 .9
Hispanic or Latino
(Including Puerto
Rican)
1 .9
Multi-Racial 2 1.8
Total 96 86.5
Missing 15 13.5
Page | 4
Student Satisfaction Inventory
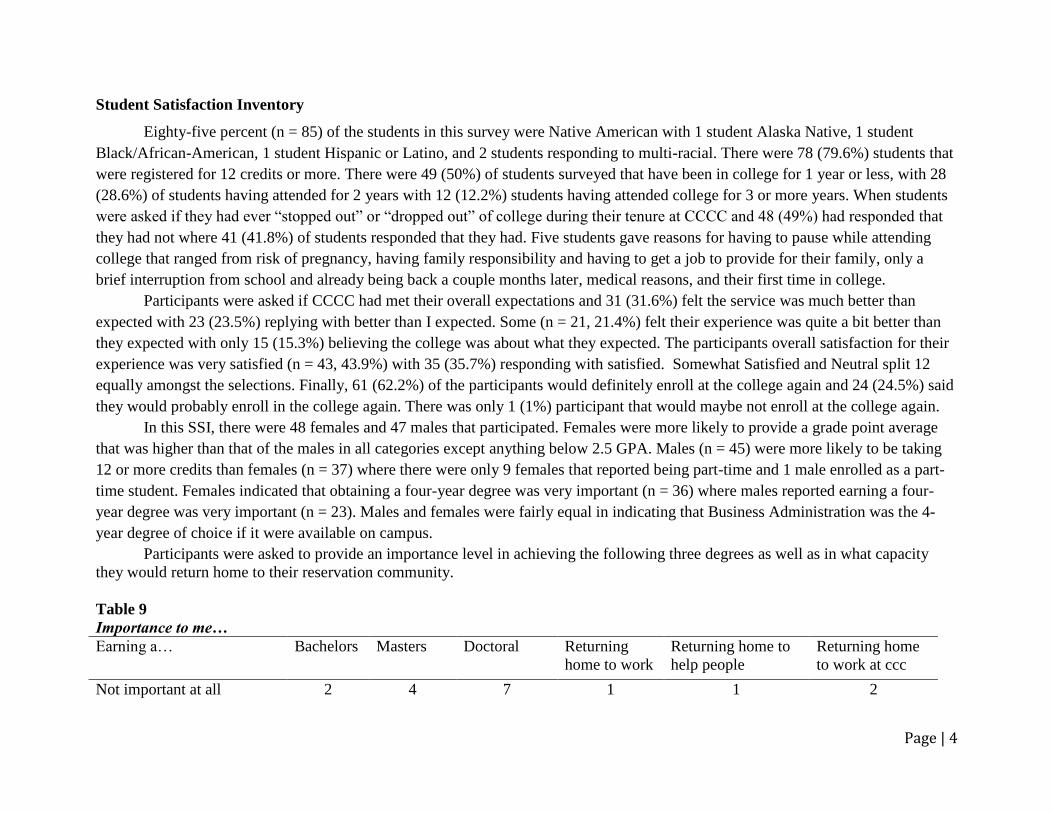
Eighty-five percent (n = 85) of the students in this survey were Native American with 1 student Alaska Native, 1 student
Black/African-American, 1 student Hispanic or Latino, and 2 students responding to multi-racial. There were 78 (79.6%) students that
were registered for 12 credits or more. There were 49 (50%) of students surveyed that have been in college for 1 year or less, with 28
(28.6%) of students having attended for 2 years with 12 (12.2%) students having attended college for 3 or more years. When students
were asked if they had ever “stopped out” or “dropped out” of college during their tenure at CCCC and 48 (49%) had responded that
they had not where 41 (41.8%) of students responded that they had. Five students gave reasons for having to pause while attending
college that ranged from risk of pregnancy, having family responsibility and having to get a job to provide for their family, only a
brief interruption from school and already being back a couple months later, medical reasons, and their first time in college.
Participants were asked if CCCC had met their overall expectations and 31 (31.6%) felt the service was much better than
expected with 23 (23.5%) replying with better than I expected. Some (n = 21, 21.4%) felt their experience was quite a bit better than
they expected with only 15 (15.3%) believing the college was about what they expected. The participants overall satisfaction for their
experience was very satisfied (n = 43, 43.9%) with 35 (35.7%) responding with satisfied. Somewhat Satisfied and Neutral split 12
equally amongst the selections. Finally, 61 (62.2%) of the participants would definitely enroll at the college again and 24 (24.5%) said
they would probably enroll in the college again. There was only 1 (1%) participant that would maybe not enroll at the college again.
In this SSI, there were 48 females and 47 males that participated. Females were more likely to provide a grade point average
that was higher than that of the males in all categories except anything below 2.5 GPA. Males (n = 45) were more likely to be taking
12 or more credits than females (n = 37) where there were only 9 females that reported being part-time and 1 male enrolled as a part-
time student. Females indicated that obtaining a four-year degree was very important (n = 36) where males reported earning a four-
year degree was very important (n = 23). Males and females were fairly equal in indicating that Business Administration was the 4-
year degree of choice if it were available on campus.
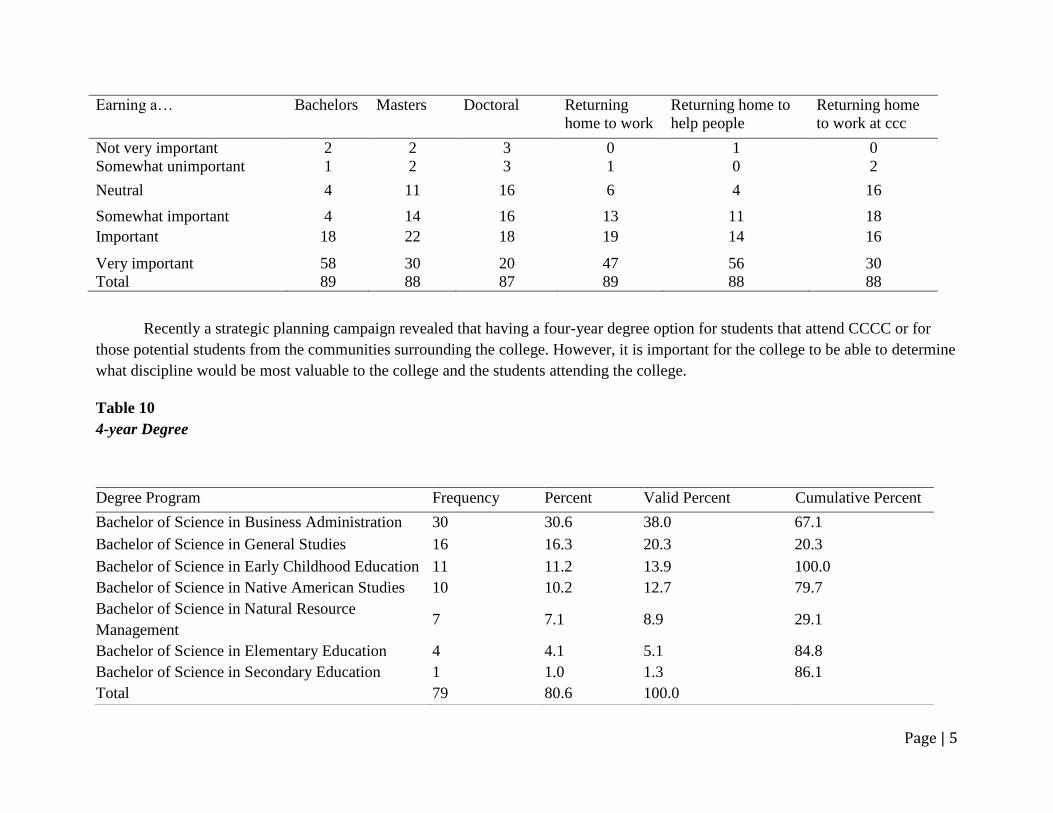
Participants were asked to provide an importance level in achieving the following three degrees as well as in what capacity
they would return home to their reservation community.
Table 9
Importance to me…
Earning a… Bachelors Masters Doctoral Returning
home to work
Returning home to
help people
Returning home
to work at ccc
Not important at all 2 4 7 1 1 2
Page | 5
Earning a… Bachelors Masters Doctoral Returning
home to work
Returning home to
help people
Returning home
to work at ccc
Not very important 2 2 3 0 1 0
Somewhat unimportant 1 2 3 1 0 2
Neutral 4 11 16 6 4 16
Somewhat important 4 14 16 13 11 18
Important 18 22 18 19 14 16
Very important 58 30 20 47 56 30
Total 89 88 87 89 88 88
Recently a strategic planning campaign revealed that having a four-year degree option for students that attend CCCC or for
those potential students from the communities surrounding the college. However, it is important for the college to be able to determine
what discipline would be most valuable to the college and the students attending the college.
Table 10
4-year Degree
Degree Program Frequency Percent Valid Percent Cumulative Percent
Bachelor of Science in Business Administration 30 30.6 38.0 67.1
Bachelor of Science in General Studies 16 16.3 20.3 20.3
Bachelor of Science in Early Childhood Education 11 11.2 13.9 100.0
Bachelor of Science in Native American Studies 10 10.2 12.7 79.7
Bachelor of Science in Natural Resource
Management 7 7.1 8.9 29.1
Bachelor of Science in Elementary Education 4 4.1 5.1 84.8
Bachelor of Science in Secondary Education 1 1.0 1.3 86.1
Total 79 80.6 100.0
Page | 6
It was deemed valuable to determine if a bachelor’s degree option were available to the student, what degree option would be most
beneficial. Data from the registrar’s database was collected and also reveals that many students are re-enrolling in programs to obtain
more than one two-year degree rather than transfer on to a four-year institution and matriculate into a bachelor program. Thus below
are responses to the question: If a four-year degree was available from this institution, which do you think would be the best option for
you and this community?
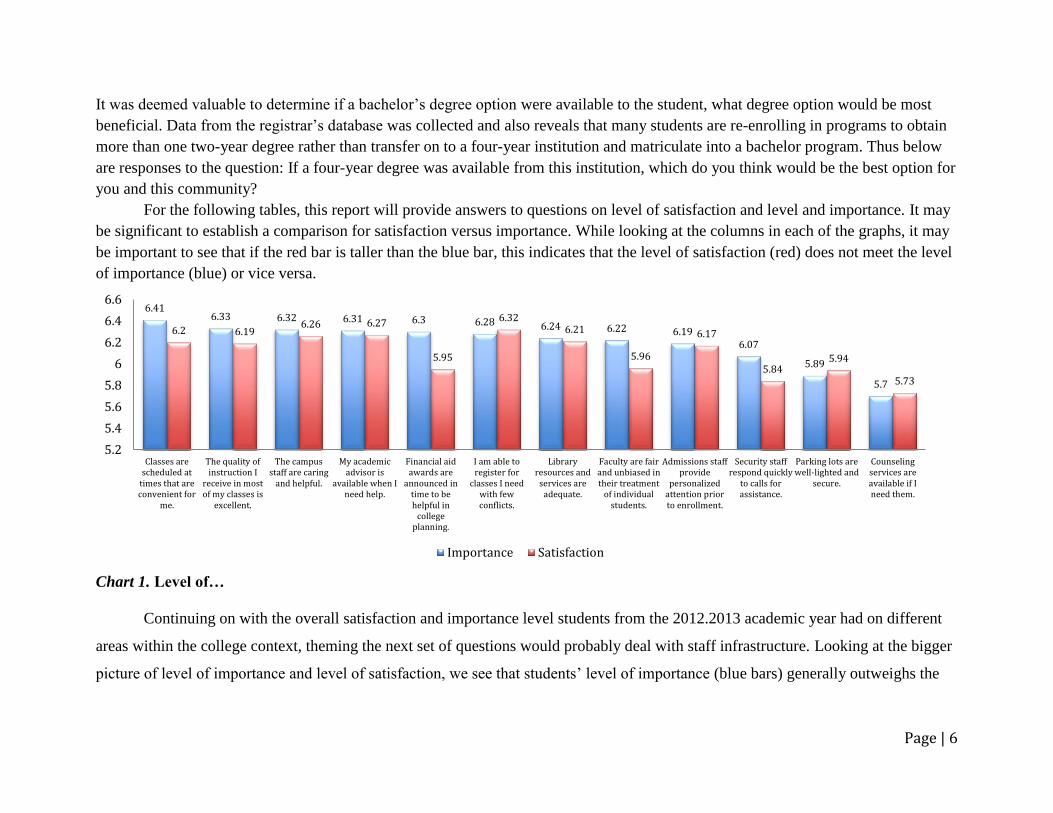
For the following tables, this report will provide answers to questions on level of satisfaction and level and importance. It may
be significant to establish a comparison for satisfaction versus importance. While looking at the columns in each of the graphs, it may
be important to see that if the red bar is taller than the blue bar, this indicates that the level of satisfaction (red) does not meet the level
of importance (blue) or vice versa.
Chart 1. Level of…
Continuing on with the overall satisfaction and importance level students from the 2012.2013 academic year had on different
areas within the college context, theming the next set of questions would probably deal with staff infrastructure. Looking at the bigger
picture of level of importance and level of satisfaction, we see that students’ level of importance (blue bars) generally outweighs the
6.41 6.33 6.32 6.31 6.3 6.28 6.24 6.22 6.19
6.07
5.89
5.7
6.2 6.19 6.26 6.27
5.95
6.32 6.21
5.96
6.17
5.84 5.94
5.73
5.2
5.4
5.6
5.8
6
6.2
6.4
6.6
Classes arescheduled at
times that areconvenient for
me.
The quality ofinstruction I
receive in mostof my classes is
excellent.
The campusstaff are caring
and helpful.
My academicadvisor is
available when Ineed help.
Financial aidawards are
announced intime to behelpful in
collegeplanning.
I am able toregister for
classes I needwith fewconflicts.
Libraryresources and
services areadequate.
Faculty are fairand unbiased intheir treatment
of individualstudents.
Admissions staffprovide
personalizedattention priorto enrollment.
Security staffrespond quickly
to calls forassistance.
Parking lots arewell-lighted and
secure.
Counselingservices areavailable if Ineed them.
Importance Satisfaction
Page | 7
level of satisfaction (red bars) the students are apparently feeling in regards to this measurement. In this particular chart, students
don’t appear to be getting their needs met for each of these items except where technology is mentioned.
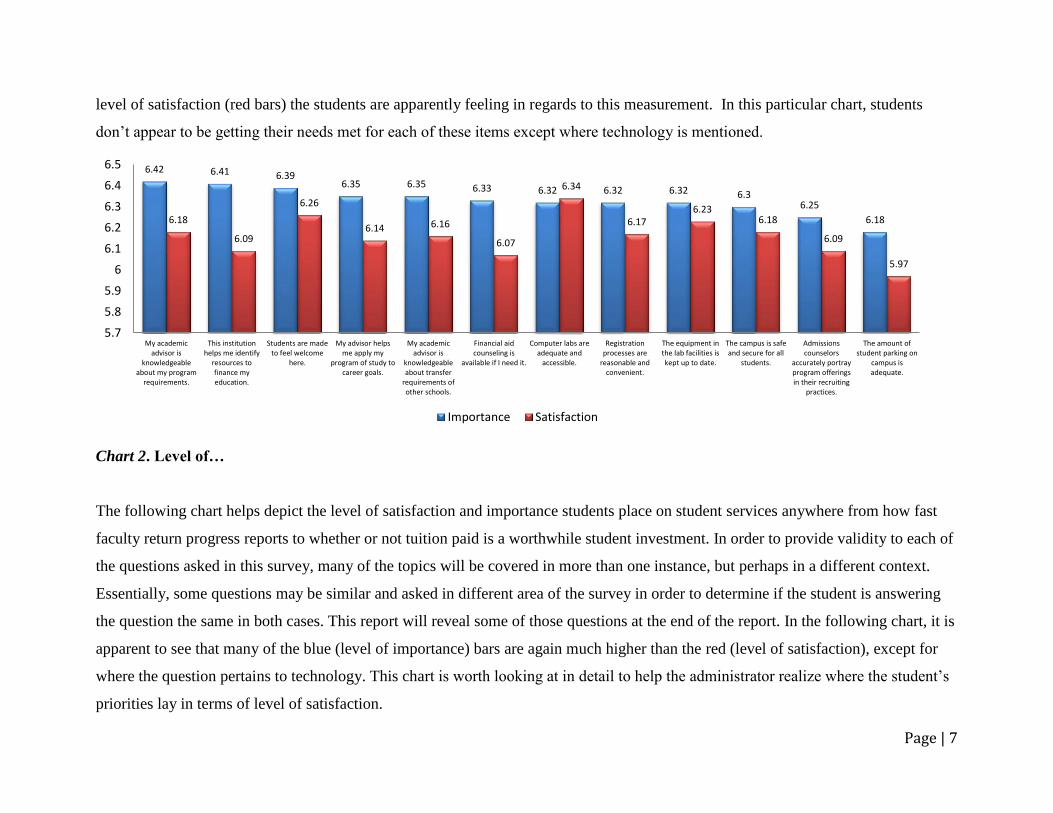
Chart 2. Level of…
The following chart helps depict the level of satisfaction and importance students place on student services anywhere from how fast
faculty return progress reports to whether or not tuition paid is a worthwhile student investment. In order to provide validity to each of
the questions asked in this survey, many of the topics will be covered in more than one instance, but perhaps in a different context.
Essentially, some questions may be similar and asked in different area of the survey in order to determine if the student is answering
the question the same in both cases. This report will reveal some of those questions at the end of the report. In the following chart, it is
apparent to see that many of the blue (level of importance) bars are again much higher than the red (level of satisfaction), except for
where the question pertains to technology. This chart is worth looking at in detail to help the administrator realize where the student’s
priorities lay in terms of level of satisfaction.
6.42 6.41 6.39 6.35 6.35 6.33 6.32 6.32 6.32 6.3
6.25
6.18 6.18
6.09
6.26
6.14 6.16
6.07
6.34
6.17 6.23
6.18
6.09
5.97
5.7
5.8
5.9
6
6.1
6.2
6.3
6.4
6.5
My academicadvisor is
knowledgeableabout my program
requirements.
This institutionhelps me identify
resources tofinance myeducation.
Students are madeto feel welcome
here.
My advisor helpsme apply my
program of study tocareer goals.
My academicadvisor is
knowledgeableabout transfer
requirements ofother schools.
Financial aidcounseling is
available if I need it.
Computer labs areadequate and
accessible.
Registrationprocesses are
reasonable andconvenient.
The equipment inthe lab facilities iskept up to date.
The campus is safeand secure for all
students.
Admissionscounselors
accurately portrayprogram offeringsin their recruiting
practices.
The amount ofstudent parking on
campus isadequate.
Importance Satisfaction
Page | 8
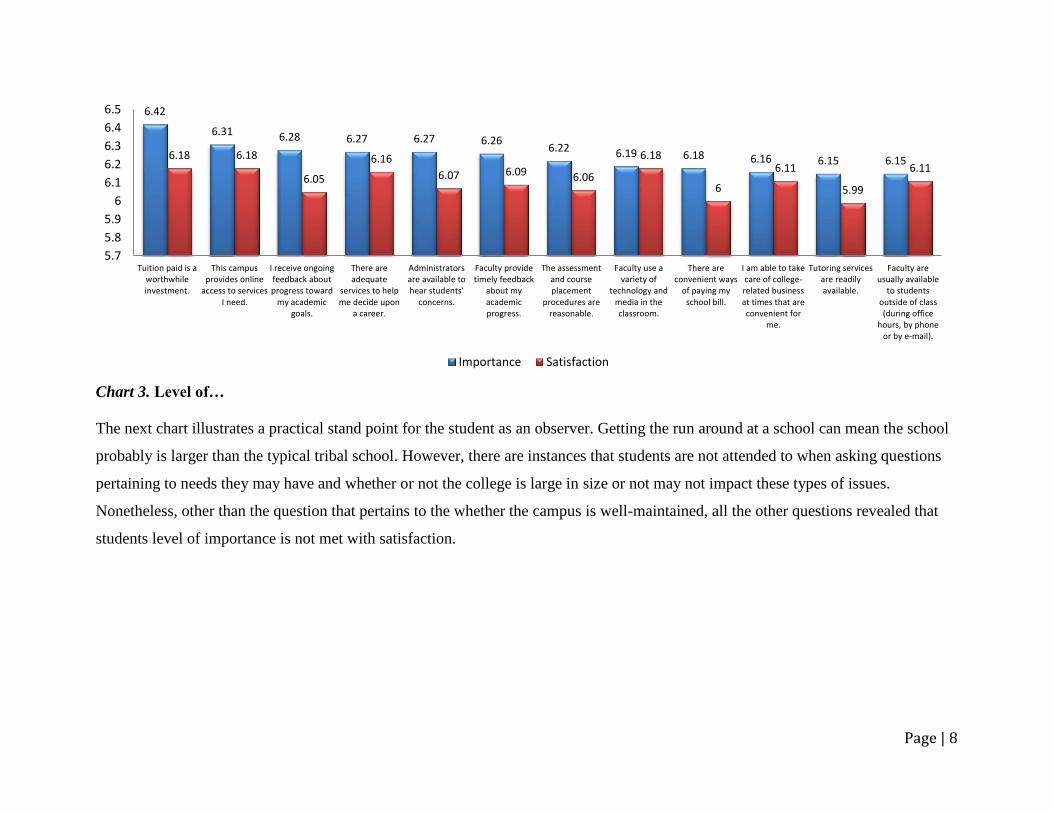
Chart 3. Level of…
The next chart illustrates a practical stand point for the student as an observer. Getting the run around at a school can mean the school
probably is larger than the typical tribal school. However, there are instances that students are not attended to when asking questions
pertaining to needs they may have and whether or not the college is large in size or not may not impact these types of issues.
Nonetheless, other than the question that pertains to the whether the campus is well-maintained, all the other questions revealed that
students level of importance is not met with satisfaction.
6.42
6.31 6.28 6.27 6.27 6.26 6.22 6.19 6.18 6.16 6.15 6.15 6.18 6.18
6.05
6.16
6.07 6.09 6.06
6.18
6
6.11
5.99
6.11
5.7
5.8
5.9
6
6.1
6.2
6.3
6.4
6.5
Tuition paid is aworthwhileinvestment.
This campusprovides online
access to servicesI need.
I receive ongoingfeedback aboutprogress toward
my academicgoals.
There areadequate
services to helpme decide upon
a career.
Administratorsare available tohear students'
concerns.
Faculty providetimely feedback
about myacademicprogress.
The assessmentand courseplacement
procedures arereasonable.
Faculty use avariety of
technology andmedia in theclassroom.
There areconvenient ways
of paying myschool bill.
I am able to takecare of college-related businessat times that areconvenient for
me.
Tutoring servicesare readilyavailable.
Faculty areusually available
to studentsoutside of class(during office
hours, by phoneor by e-mail).
Importance Satisfaction

Page | 9
Chart 4. Level of…
If the reader looks closely, he or she can begin to see the similarity, or categorical areas in some of the questions. As indicated earlier,
this is done on purpose to bring out a more valid instrument. In reference, chart 1 and chart 3 both have questions that pertain to
financial aid or tuition. This report will bring themes together to view later in this report so the reader will be able to target areas of
consideration.
6.21 6.13 6.12 6.07 6.04
5.8
6.07
5.68
6.22
5.63
5.89
5.54
5.2
5.4
5.6
5.8
6
6.2
6.4
There are sufficientcourse within myprogram of study
available each term.
This college offersopportunities to pursue
bachelors degrees.
On the whole, thecampus is well-
maintained.
This college offersopportunities to pursuegraduate or professional
degrees.
Most classes deal withpractical experiences
and applications.
I seldom get the "run-around" when seeking
information on thiscampus.
Importance Satisfcation
Page | 10
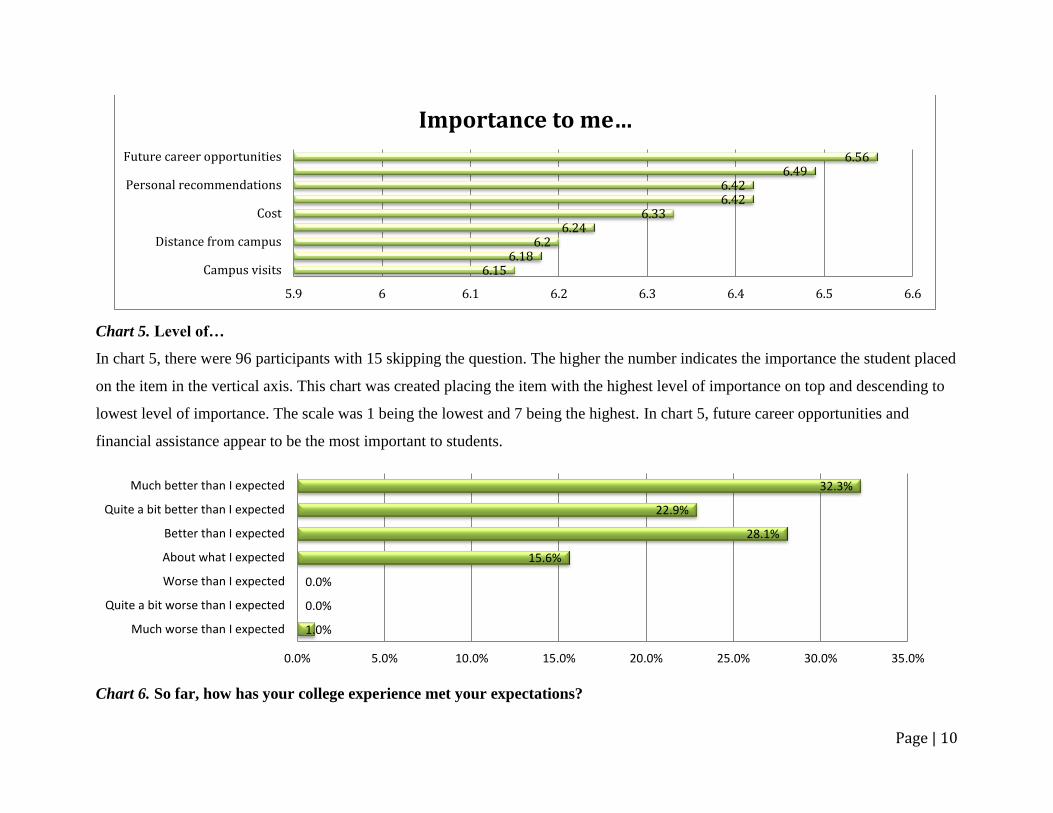
Chart 5. Level of…
In chart 5, there were 96 participants with 15 skipping the question. The higher the number indicates the importance the student placed
on the item in the vertical axis. This chart was created placing the item with the highest level of importance on top and descending to
lowest level of importance. The scale was 1 being the lowest and 7 being the highest. In chart 5, future career opportunities and
financial assistance appear to be the most important to students.
Chart 6. So far, how has your college experience met your expectations?
6.15 6.18
6.2 6.24
6.33 6.42 6.42
6.49 6.56
5.9 6 6.1 6.2 6.3 6.4 6.5 6.6
Campus visits
Distance from campus
Cost
Personal recommendations
Future career opportunities
Importance to me…
1.0%
0.0%
0.0%
15.6%
28.1%
22.9%
32.3%
0.0% 5.0% 10.0% 15.0% 20.0% 25.0% 30.0% 35.0%
Much worse than I expected
Quite a bit worse than I expected
Worse than I expected
About what I expected
Better than I expected
Quite a bit better than I expected
Much better than I expected
Page | 11
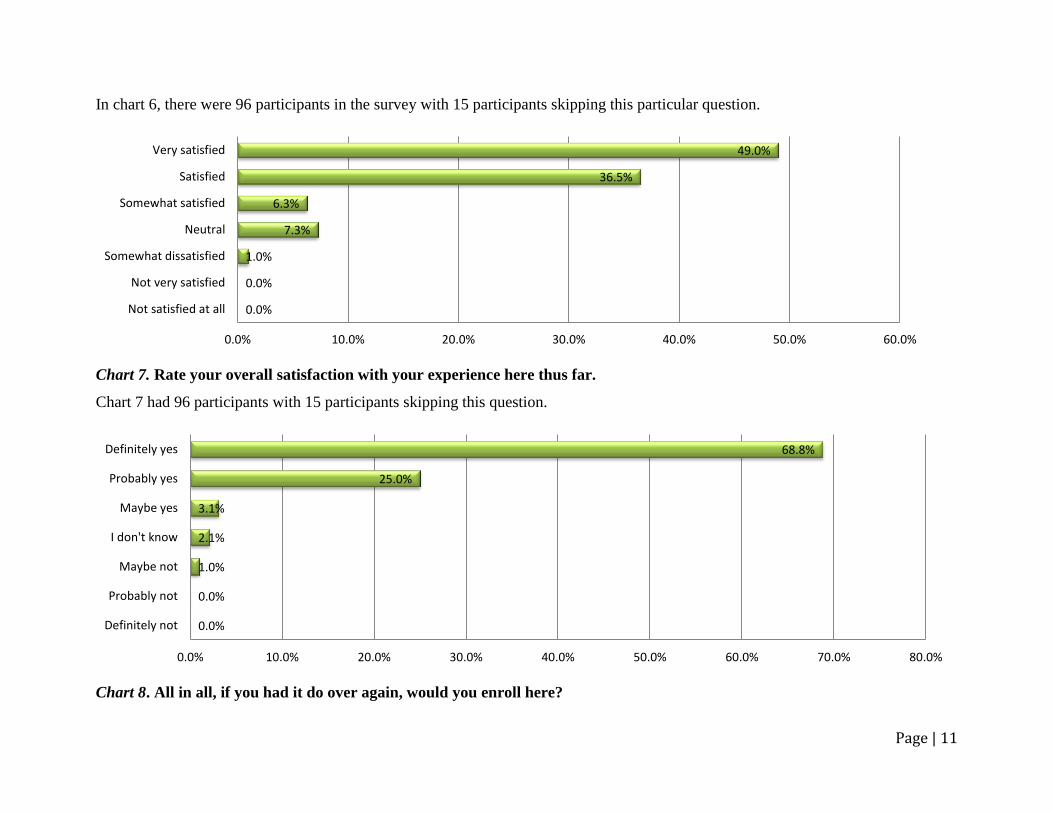
In chart 6, there were 96 participants in the survey with 15 participants skipping this particular question.
Chart 7. Rate your overall satisfaction with your experience here thus far.
Chart 7 had 96 participants with 15 participants skipping this question.
Chart 8. All in all, if you had it do over again, would you enroll here?
0.0%
0.0%
1.0%
7.3%
6.3%
36.5%
49.0%
Not satisfied at all
Not very satisfied
Somewhat dissatisfied
Neutral
Somewhat satisfied
Satisfied
Very satisfied
0.0% 10.0% 20.0% 30.0% 40.0% 50.0% 60.0%
0.0%
0.0%
1.0%
2.1%
3.1%
25.0%
68.8%
Definitely not
Probably not
Maybe not
I don't know
Maybe yes
Probably yes
Definitely yes
0.0% 10.0% 20.0% 30.0% 40.0% 50.0% 60.0% 70.0% 80.0%
Page | 12
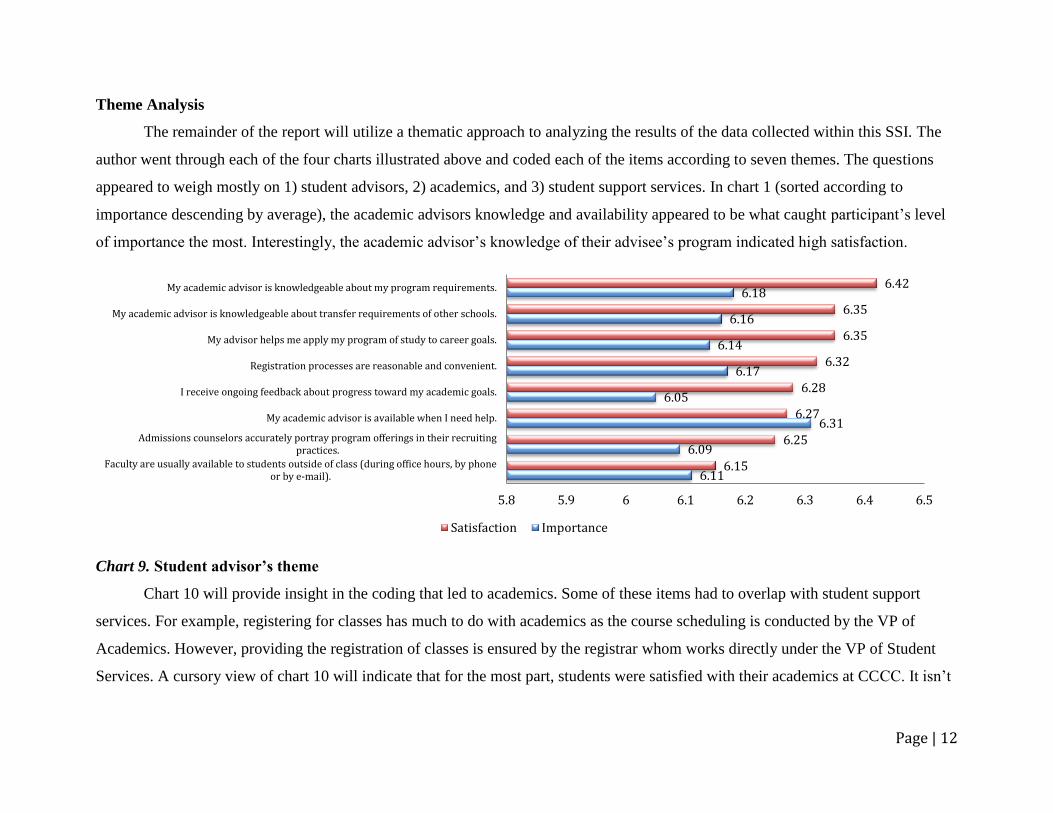
Theme Analysis
The remainder of the report will utilize a thematic approach to analyzing the results of the data collected within this SSI. The
author went through each of the four charts illustrated above and coded each of the items according to seven themes. The questions
appeared to weigh mostly on 1) student advisors, 2) academics, and 3) student support services. In chart 1 (sorted according to
importance descending by average), the academic advisors knowledge and availability appeared to be what caught participant’s level
of importance the most. Interestingly, the academic advisor’s knowledge of their advisee’s program indicated high satisfaction.
Chart 9. Student advisor’s theme
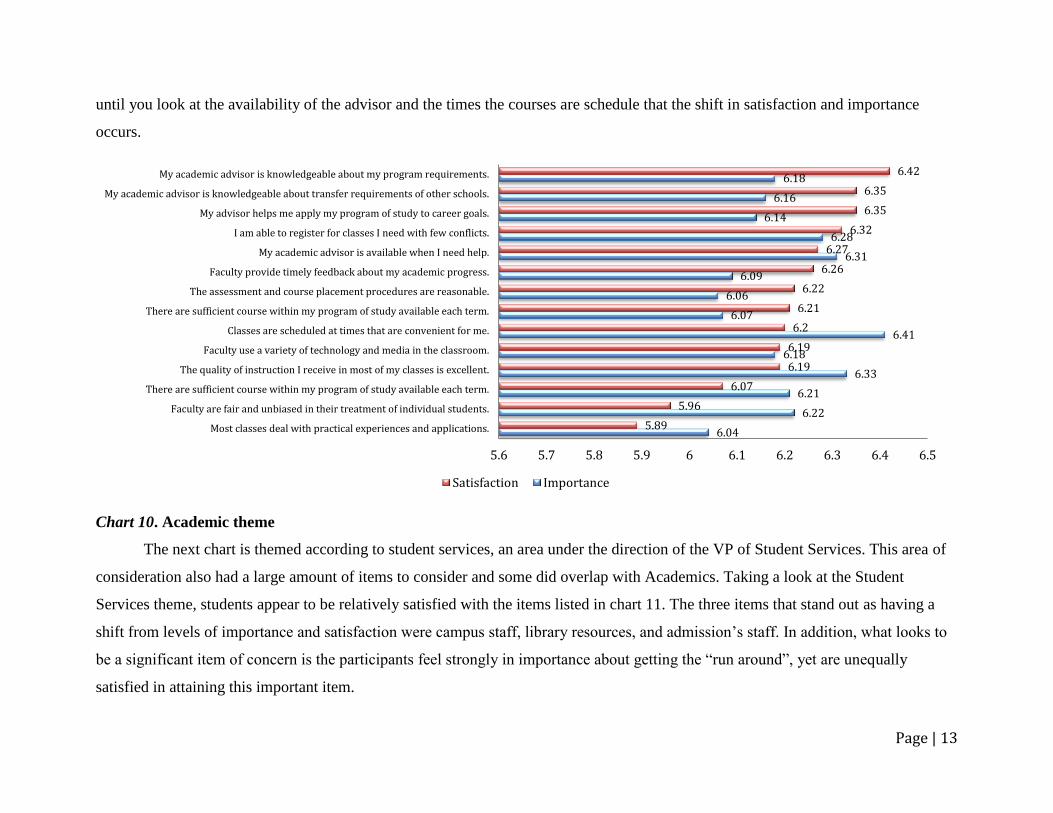
Chart 10 will provide insight in the coding that led to academics. Some of these items had to overlap with student support
services. For example, registering for classes has much to do with academics as the course scheduling is conducted by the VP of
Academics. However, providing the registration of classes is ensured by the registrar whom works directly under the VP of Student
Services. A cursory view of chart 10 will indicate that for the most part, students were satisfied with their academics at CCCC. It isn’t
6.11
6.09
6.31
6.05
6.17
6.14
6.16
6.18
6.15
6.25
6.27
6.28
6.32
6.35
6.35
6.42
5.8 5.9 6 6.1 6.2 6.3 6.4 6.5
Faculty are usually available to students outside of class (during office hours, by phoneor by e-mail).
Admissions counselors accurately portray program offerings in their recruitingpractices.
My academic advisor is available when I need help.
I receive ongoing feedback about progress toward my academic goals.
Registration processes are reasonable and convenient.
My advisor helps me apply my program of study to career goals.
My academic advisor is knowledgeable about transfer requirements of other schools.
My academic advisor is knowledgeable about my program requirements.
Satisfaction Importance
Page | 13
until you look at the availability of the advisor and the times the courses are schedule that the shift in satisfaction and importance
occurs.
Chart 10. Academic theme
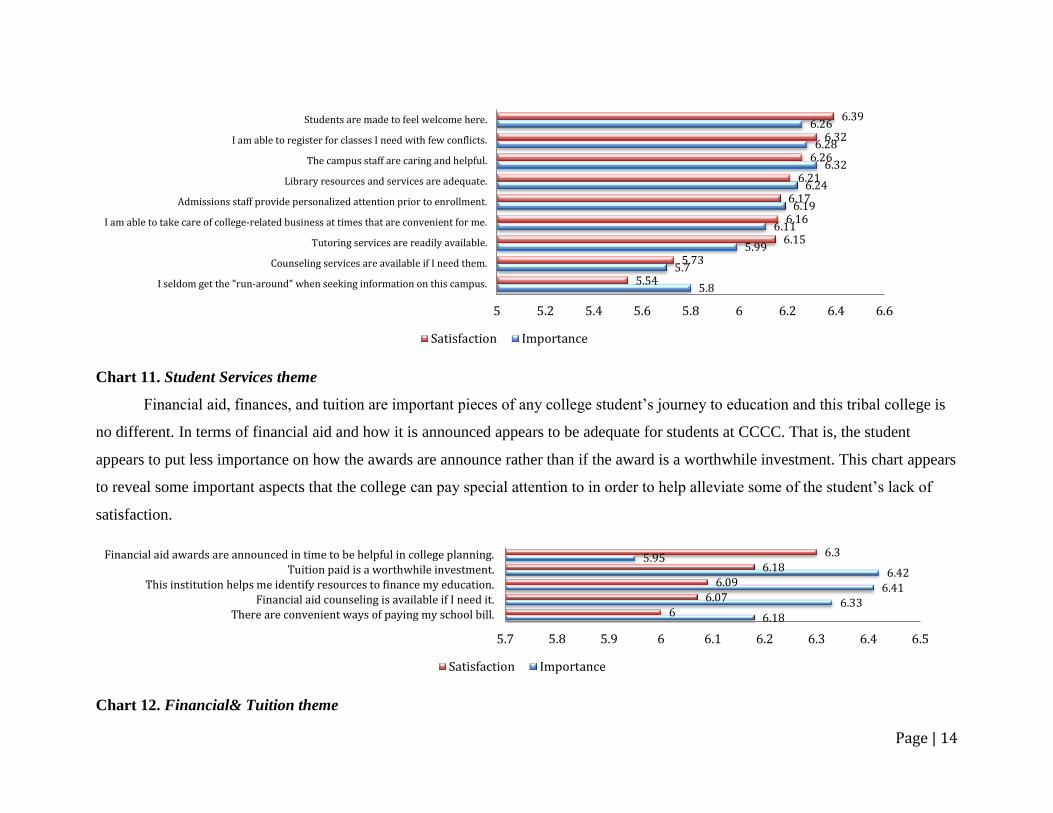
The next chart is themed according to student services, an area under the direction of the VP of Student Services. This area of
consideration also had a large amount of items to consider and some did overlap with Academics. Taking a look at the Student
Services theme, students appear to be relatively satisfied with the items listed in chart 11. The three items that stand out as having a
shift from levels of importance and satisfaction were campus staff, library resources, and admission’s staff. In addition, what looks to
be a significant item of concern is the participants feel strongly in importance about getting the “run around”, yet are unequally
satisfied in attaining this important item.
6.04
6.22
6.21
6.33
6.18
6.41
6.07
6.06
6.09
6.31
6.28
6.14
6.16
6.18
5.89
5.96
6.07
6.19
6.19
6.2
6.21
6.22
6.26
6.27
6.32
6.35
6.35
6.42
5.6 5.7 5.8 5.9 6 6.1 6.2 6.3 6.4 6.5
Most classes deal with practical experiences and applications.
Faculty are fair and unbiased in their treatment of individual students.
There are sufficient course within my program of study available each term.
The quality of instruction I receive in most of my classes is excellent.
Faculty use a variety of technology and media in the classroom.
Classes are scheduled at times that are convenient for me.
There are sufficient course within my program of study available each term.
The assessment and course placement procedures are reasonable.
Faculty provide timely feedback about my academic progress.
My academic advisor is available when I need help.
I am able to register for classes I need with few conflicts.
My advisor helps me apply my program of study to career goals.
My academic advisor is knowledgeable about transfer requirements of other schools.
My academic advisor is knowledgeable about my program requirements.
Satisfaction Importance
Page | 14
Chart 11. Student Services theme
Financial aid, finances, and tuition are important pieces of any college student’s journey to education and this tribal college is
no different. In terms of financial aid and how it is announced appears to be adequate for students at CCCC. That is, the student
appears to put less importance on how the awards are announce rather than if the award is a worthwhile investment. This chart appears
to reveal some important aspects that the college can pay special attention to in order to help alleviate some of the student’s lack of
satisfaction.
Chart 12. Financial& Tuition theme
5.8
5.7
5.99
6.11
6.19
6.24
6.32
6.28
6.26
5.54
5.73
6.15
6.16
6.17
6.21
6.26
6.32
6.39
5 5.2 5.4 5.6 5.8 6 6.2 6.4 6.6
I seldom get the "run-around" when seeking information on this campus.
Counseling services are available if I need them.
Tutoring services are readily available.
I am able to take care of college-related business at times that are convenient for me.
Admissions staff provide personalized attention prior to enrollment.
Library resources and services are adequate.
The campus staff are caring and helpful.
I am able to register for classes I need with few conflicts.
Students are made to feel welcome here.
Satisfaction Importance
6.18
6.33
6.41 6.42
5.95
6
6.07
6.09
6.18
6.3
5.7 5.8 5.9 6 6.1 6.2 6.3 6.4 6.5
There are convenient ways of paying my school bill.
Financial aid counseling is available if I need it.This institution helps me identify resources to finance my education.
Tuition paid is a worthwhile investment.
Financial aid awards are announced in time to be helpful in college planning.
Satisfaction Importance
Page | 15
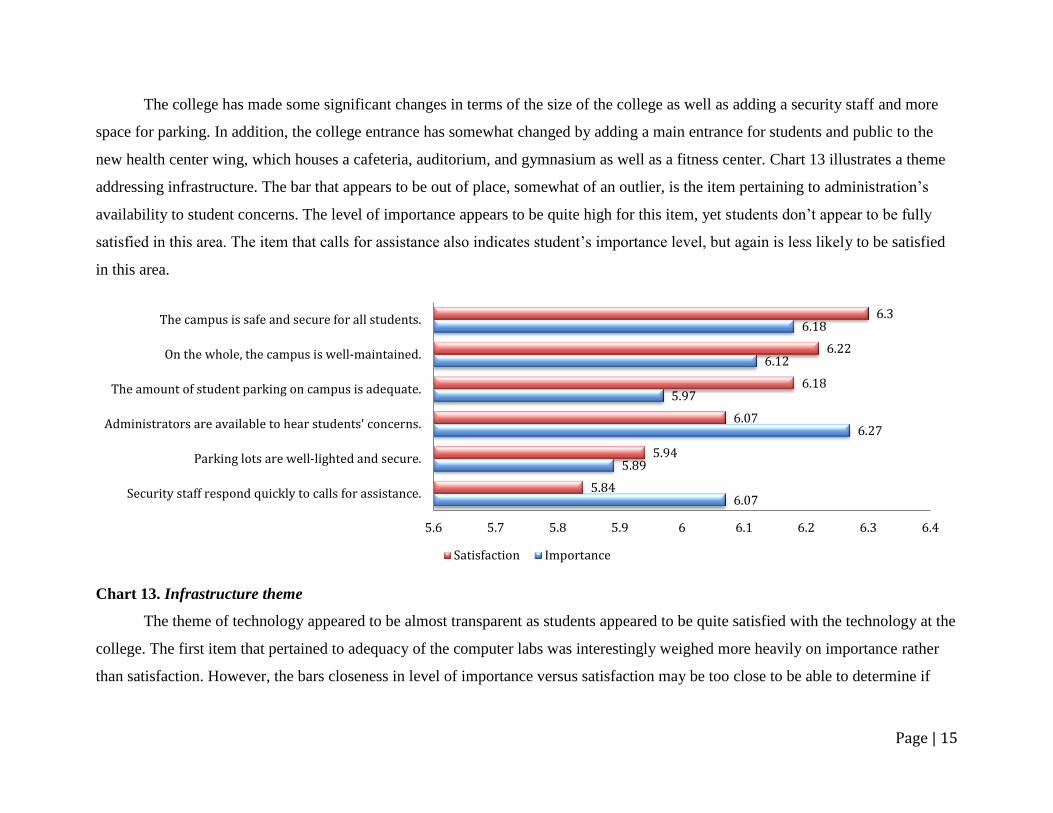
The college has made some significant changes in terms of the size of the college as well as adding a security staff and more
space for parking. In addition, the college entrance has somewhat changed by adding a main entrance for students and public to the
new health center wing, which houses a cafeteria, auditorium, and gymnasium as well as a fitness center. Chart 13 illustrates a theme
addressing infrastructure. The bar that appears to be out of place, somewhat of an outlier, is the item pertaining to administration’s
availability to student concerns. The level of importance appears to be quite high for this item, yet students don’t appear to be fully
satisfied in this area. The item that calls for assistance also indicates student’s importance level, but again is less likely to be satisfied
in this area.
Chart 13. Infrastructure theme
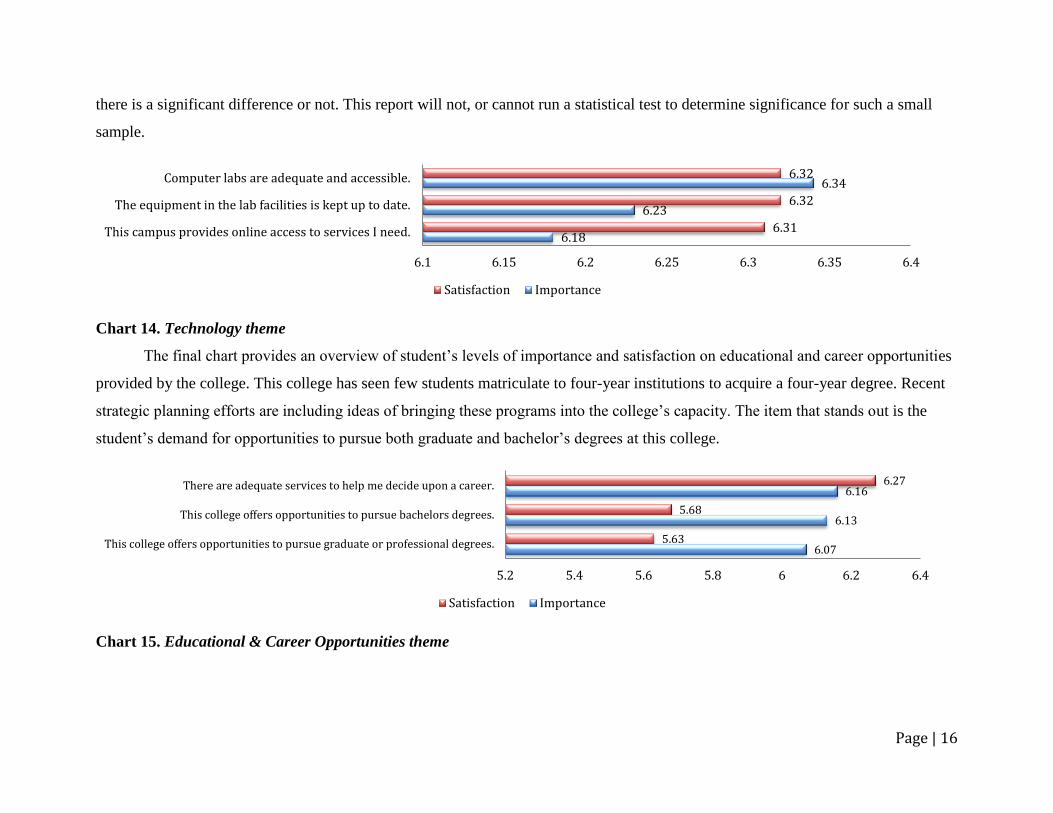
The theme of technology appeared to be almost transparent as students appeared to be quite satisfied with the technology at the
college. The first item that pertained to adequacy of the computer labs was interestingly weighed more heavily on importance rather
than satisfaction. However, the bars closeness in level of importance versus satisfaction may be too close to be able to determine if
6.07
5.89
6.27
5.97
6.12
6.18
5.84
5.94
6.07
6.18
6.22
6.3
5.6 5.7 5.8 5.9 6 6.1 6.2 6.3 6.4
Security staff respond quickly to calls for assistance.
Parking lots are well-lighted and secure.
Administrators are available to hear students' concerns.
The amount of student parking on campus is adequate.
On the whole, the campus is well-maintained.
The campus is safe and secure for all students.
Satisfaction Importance
Page | 16
there is a significant difference or not. This report will not, or cannot run a statistical test to determine significance for such a small
sample.
Chart 14. Technology theme
The final chart provides an overview of student’s levels of importance and satisfaction on educational and career opportunities
provided by the college. This college has seen few students matriculate to four-year institutions to acquire a four-year degree. Recent
strategic planning efforts are including ideas of bringing these programs into the college’s capacity. The item that stands out is the
student’s demand for opportunities to pursue both graduate and bachelor’s degrees at this college.
Chart 15. Educational & Career Opportunities theme
6.18
6.23
6.34
6.31
6.32
6.32
6.1 6.15 6.2 6.25 6.3 6.35 6.4
This campus provides online access to services I need.
The equipment in the lab facilities is kept up to date.
Computer labs are adequate and accessible.
Satisfaction Importance
6.07
6.13
6.16
5.63
5.68
6.27
5.2 5.4 5.6 5.8 6 6.2 6.4
This college offers opportunities to pursue graduate or professional degrees.
This college offers opportunities to pursue bachelors degrees.
There are adequate services to help me decide upon a career.
Satisfaction Importance
Page | 17
Recommendations
It is vitally important for an assessment activity like the SSI to attain as many responses as possible in order to obtain the most
reliable data. The average student enrollment has been around 245 students per semester. The SSI was conducted slightly over 2
months and achieved about a 39% return rate. The SSI is fairly lengthy and trying to use a hardcopy rather than an online format may
be more cumbersome to analysis, but a recommendation in order to determine whether a larger sample can be obtained.
Future career and educational opportunities appear to be of major importance to students of this institution. These items have
shown to be highly sought in strategic planning (2005, 2012) as well as well as this SSI. Recent institutional research has indicated
that students are not transferring to other colleges to attain advanced degrees beyond the associate level, but are enrolling in additional
two-year programs. The impact this can have on students for future educational endeavors is yet to be seen, but with recent
governmental sequestration and tightening constraints for federal student aid, a four-year degree program must be developed and
implemented at this college as soon as possible.
Academic advisors need to play more of a role in student’s educational journey as indicated within the analysis of the SSI.
Students indicated their need to have advisors at their disposal when need be. It is recommended that the college utilize an advisor-
student day where students meet with their advisor in a group session or on an individual basis. Under the Academic Theme, there was
a denoted difference in satisfaction and importance for when classes were scheduled in accordance with student convenience.
Developing a schedule that is synonymous with student needs may be a difficult task to accomplish, but one recommendation may be
to establish a student survey that polls students on times that best suit their needs in addition to developing a schedule well ahead of
the semester offering. The quality of instruction appears to be of concern to the students that participated in this survey. One method
of validating this concern is to periodically visit a classroom to observe the instructors teaching style and pedagogical technique. Class
sizes are important in college atmospheres and it may be an educational observation to see how instructors handle smaller classroom
sizes versus larger classroom sizes to determine if the instructors are showing different strategies. In addition, evaluators of these
classes may also utilize experimental research methods to determine if significant changes occur in how students respond to their class
Page | 18
sizes and teaching methodologies. The above suggestions for the Academic Theme may also reveal solutions to why students feel less
satisfied with why their programs of study are not being adequately addressed by course offerings, faculty appear to be biases in their
treatment of individual students, and if classes would be better if more practical experiences were used in terms of teaching activities.
The Student Services Theme indicated that campus staff is not as compassionate about their students as the students would like
for them to be. Students felt they were getting the “run around” by college personnel. Finally, admissions staff does not appear to be
giving students personal attention. It may be beneficial for staff training in student etiquette the college can utilize to lesson this
concern from the students. Financial aid appears to be of concern by the students and this is probably more connected to the lack of
education students receive on financial aid. Financial aid disbursements and student retention have been associated or linked together
in the past. This relationship should be researched more thoroughly to determine if education, disbursement, and satisfaction can all be
significantly and positively correlated to student retention.