Embed Size (px)
Citation preview

Students Attitudes towards Mathematics and School over Time: A Rasch Analysis*
Tilahun Mengesha Afrassa** School of Education*** The Flinders University of South Australia
AbstractIn 1964 and 1978, Australia participated in the IEA studies of mathematics at the 13-year-old level. In addition to mathematics achievement tests, in the two studies, students were required to respond to an attitude questionnaire concerning their attitudes towards mathematics, the learning of mathematics and school learning. A similar test was administered to a sample of Grade 8 students in the Addis Ababa Region in Ethiopia in 1996. This paper analyses and scales the attitude data from the three occasions by applying the Rasch model using the QUEST (Adams & Khoo, 1993) computer program. The attitudinal response data obtained from the students on the three occasions can be brought to common attitude scales. Each common scale is independent of both the samples of students tested and the samples of items employed. These common scales are used to examine the attitudinal differences between the two countries and the changes over time in the Australian students' attitudes towards mathematics. Conclusions are drawn as to the robustness of the common scales, the attitudes of students in the two countries and changes over time in the Australian students' attitudes towards mathematics.
Research findings have revealed that the achievement of students in different subjects depended on the level of attitude of the students towards the subject they were studying. Students with more favourable attitudes towards schooling and mathematics were found to be higher achievers in mathematics. However, students who considered that they were good at mathematics said that they liked the subject (Helfers, 1986). Whereas those who performed at a lower level recognized mathematics as a disliked subjects.
Milne (1992) conducted a study on attitudes towards mathematics on a sample of Australian students who were enrolled in a year-long bridging mathematics course. This researcher reported that these students had positive attitude towards mathematics. They were highly motivated, noted that mathematics was very useful, and had a positive attitude towards success.
Research findings have also reported that the attitudes of Australian students towards mathematics were declining across year levels (Fraser, 1979). Many years after Fraser's findings, Endalkachew (1990) and Tadesse (1993) undertook studies in Ethiopia which revealed that students' attitudes towards mathematics and their attitudes towards school and school learning remained low. From these studies, it would

be difficult to conclude that over recent decades the attitudes of students towards mathematics had moved lower, since these studies did not take place in the same schools and school systems and at the same year levels. However, because of technological developments, curricula changes and changes in the training of teachers, the attitudes of students might well have changed over time. Knowledge of such changes over time could help mathematics educators, in particular, to improve both their curricula and the training of teachers.
Methods Employed in the StudyUse of Rasch modelIn this study the Year 8 students' attitudes towards schooling and mathematics over time are measured using the Rasch model. This model
which is the most robust of the item response models, is used to equate students' attitudes between the Australian studies conducted in the First International Mathematics Study (FIMS) and Second International Mathematics Study (SIMS) and the Ethiopian Mathematics Study (EMS) on a common scale.
UnidimensionalityIn order to employ the Rasch model in analysing both view and attitude scales it was important to examine whether or not these scales were unidimensional since the unidimensionality of items is one of the requirements for the use of the Rasch model (Hambleton and Cook, 1977; Anderson, 1994). If the view and attitude items were found not to be unidimensional, it would not be possible to apply the Rasch procedures to the analysis.
Consequently, a literature search was undertaken to examine whether or not the test developers had examined the unidimensionality of these statements. The view and attitude statements employed in 1964, 1978 and 1996 were first developed for use in 1964. Wolf (1967) reported that after the items had been developed, they were submitted to a panel of judges for ranking the set of statements for placing them along the appropriate scales. A pilot study was also undertaken with a representative sample of about 150 students in each participating country to determine whether the pattern of responses was as expected by the judges' rankings along the view and attitude scales (Wolf, 1967).
The responses of students from the pilot study were analysed by employing the Guttman scale analysis procedure (Wolf, 1967). The Guttman scale analysis procedure provides a means of evaluating the unidimensionality of a set of items (Edwards & Kilpatrick, 1948, 99). Hence, the first procedure of the analysis was to compare the position of the items ranked by the judges and the students, and statements were deleted, when differences occurred in the position of the statements. The position of all statements in all view and attitude scales were

also compared from country to country, items were deleted when a difference appeared. The third procedure employed was the deletion of items because of problems with content and translation.
The coefficients of reproducibility obtained from the Guttman scale analysis were calculated. The coefficients were calculated from the total sets of items and were below 0.90 which was the lower acceptable limit for Guttman scale analysis (Guttman, 1947, 452). However, the coefficients of reproducibility were increased to the 0.90 level, considered by Guttman to be acceptable, by recalculating the coefficients of reproducibility on the final sets of view and attitude statements.
Therefore, the view and attitude items employed in 1964, 1978 and 1996 were considered to be consistent with the designers' theoretical model of a unidimensional scale of statements and it was possible to claim that the items selected formed unidimensional scales, and that the scale scores would be meaningful. Edwards (1957, 176) argued that:
Table 1. Attitude scales and number of items employed on different occasions
Occasions**Scale FIMS SIMS EMSViews abt Math Teaching (viewmath) 11 6 11Views about Schl and Schl Learning(viewsch)11 * 11
Attitudes to Maths as a Process (mathpro) 8 * 8Att about the Facility of Learn Math(mathdiff)7 7 7Attitudes to Plce of Maths in Soc (mathinso)8 8 8Attitudes to Schl and Schl Learng (schlearn)11 9 11Attitudes to Control of Environmt (contrenv)9 6 9Total 65 36 65*scale excluded from SIMS**FIMS - 1964, SIMS - 1978, EMS- 1996.
... if the responses of subjects to the statements were in accord with our theoretical model of a unidimensional scale of statements, we would have confidence in interpreting scores of subjects based upon the statements as also falling along the same unidimensional continuum.Keeves (1966, 108) also reported that " efforts were made to ensure that the statements finally selected formed a unidimensional scale". In addition, Morgensten and Keeves (1994, 392) contended that "efforts were made to ensure that the statements finally selected logically formed a unidimensional scale". Therefore, the sets of items were considered to lie along unidimensional scales.
Opinion QuestionnaireThe 1964 Australian and the 1996 Ethiopian Opinion Questionnaires contained 65 view and attitude statements. These 65 view and attitude statements were subdivided into seven scales (see Table 1). The first two scales were descriptive in nature, one measuring students’ views about the teaching methods applied by their mathematics teachers, and the other measuring their perception of the climate of the school in terms of its authoritarian or open nature. Whereas, the other five scales were measuring the attitudes of students towards mathematics and schooling. Only 36 of the 65 items were used in the 1978 Opinion Questionnaire (see Table 1). These 36 items which were common for the three occasions were taken into account for comparison purposes. On all three occasions students were requested to respond to items by indicating whether they agreed with the statement, disagreed with the statement, or could not decide whether they agreed or disagreed with the statement.
Rating Scale AnalysisRating scale analysis was chosen from among the different Rasch models to employ in the analyses of the students' responses to these view and attitude statements. The rating scale procedure was selected because, rating scale procedures are generally used with attitude questionnaires where the responses are either bipolar or unipolar (Wolf, 1994). The item responses involved in this study were considered to form a bipolar scale. The rating scale procedure also " assumes a single underlying dimension for the variable and seeks to scale the item responses in such a way that interval scale data are obtained for the variable formed" (Wolf, 1994, 4926). The use of interval scale data in further analyses has many advantages.
Procedure used for EquatingThe concurrent equating procedure which is the strongest and most robust of the current methods of equating several test forms that differ in their threshold levels (Morrison & Fitzpatrick, 1992; Mohandas, 1996) was used in calibrating and equating the attitude scales between 1964, 1978 and 1996.
Treatment of Omits and Non-responsesStudents in these analyses tended to omit only one or two items in a scale, and Anderson (1994) has argued that if a student omitted only
one item, or less than 20 per cent of the items in a scale, then an omission would seem to show uncertainty in responding and it could be said that assigning a neutral response provided appropriate compensation for the missing data. Under these circumstances, the missing data or the omitted responses were recoded as undecided.
Meanwhile, if a student failed to provide responses to at least 80 per
cent of the items in a scale, Anderson (1994) has recommended the exclusion of that student from further analysis. Consequently, all students in the Queensland 1964 sample were excluded from analysis for the Views about Mathematics Teaching and Views about School and School Learning scales, because the students in this sub-sample failed to provide responses for more than 80 per cent of the items in the two scales, as a consequence of being directed by their school authorities not to answer these questions which could be considered to involve criticism of their schools and their teachers.
Statistical Tests EmployedEffect size and t-test values were employed for the comparison of differences between students' views and attitudes towards school and mathematics over time.
Effect sizeThe magnitude of the difference between the scale scores of different groups is assessed by the effect size. The effect size is defined as the estimate of the degree to which the phenomenon being studied exists in the population (Hair, Anderson, Tatham & Black, 1995, 1). For comparison purposes effect sizes are calculated in a standardized form. Thus, mean differences are stated in terms of standard deviations, so that an effect size of 0.50 indicates that the mean difference is one-half of a standard deviation. Hair, Anderson, Tatham and Black (1995) argue that an effect size is a standardized measure of group differences, typically expressed as the differences in group means divided by their combined standard deviation. In this study the effect size is used to examine the differences between FIMS, SIMS and EMS in views and attitudes towards school and mathematics. The following formula was employed to calculate the effect size.Effect size =where1 is the mean of group one,2 is the mean of group two,sd1 is the standard deviation of group one, and sd2 is the standard deviation of group two.
The t -testThe t-test assesses the statistical significance of the difference between two independent sample means for a single dependent variable (Hair, Anderson, Tatham & Black, 1995, 261). In this study to determine whether the FIMS, SIMS or EMS students' views and attitudes towards school and mathematics were the same or different a t statistic was calculated. The t statistic is the ratio of the difference between the sample means to its standard error. The standard error is an estimate of the difference between means to be expected because of sampling error. Hair, Anderson, Tatham and Black (1995), claim that by forming the ratio of the actual difference between the means to the difference expected due to sampling error, the amount of the actual impact of the

treatment that is due to random sampling error is quantified. The following formula was employed in calculating thet test.
t test= where1 is the mean of group one,
2 is the mean of group two,se1 is the standard error of group one, and se2 is the standard error of group two.
The absolute values of the t statistic that exceeded the critical value of the t statistic to the rejection of the null hypothesis of no difference between the two groups that were compared.
Sample Design and Calculation of Standard ErrorsThe samples employed in this study were selected using a two stage stratified sampling design procedure, involving stratification by state, and a random sample of schools from each state at the first stage. The schools were selected at random with probability proportional to the size of the school (pps), and then an equal-sized cluster sample of students were selected at random within schools at the second stage.
The simple random sample standard errors are inappropriate and underestimate to a marked extent the size of the errors of sampling. The WesVarPC (Brick, Broene, James and Severynse, 1996) computer program enables the appropriate standard errors to be calculated using the jackknife procedure. Chant and Dalgleish (1992) argued that the basic idea behind the jackknife procedure is that sample statistics are computed using all the data and then by dividing the data into sets, computations are made for each of the reduced part of the data (sub-samples) obtained leaving out one of the sets. Brick, Broene, James and Severynse (1996, 130-31) argued that the jackknife procedure can be employed when explicit stratification has not been used to select the sample although systematic sampling may have been used. In addition, the WesVarPC computer program provides values for the design effect of the samples for mean values and differences between means for particular variables. Therefore, in this study the WesVarPC 2.02 (Brick, Broene, James & Severynse, 1996) computer program was employed to calculated the jackknife standard errors and the design effects for the sampling designs employed.
Item AnalysisIn this study, it was also considered important to undertake detailed item analyses to examine the most appropriate selection of items for calibrating the attitude scales for the Year 8 students. The attitude and view data of FIMS and EMS were formed into seven scales, while for SIMS the data were formed into five scales (see Table 1). These five scales were a subset of the seven

scales. Therefore, five scales were investigated for all three occasions, and the other two scales were investigated only for the two occasions of FIMS and EMS.
Classical Item AnalysisIn order to obtain information about some of the properties of the attitude and view scale items, the QUEST computer program (Adams and Khoo, 1993) was used to undertake a classical item analysis. The point-biserial correlation coefficients were calculated as part of the classical item analysis. This statistic signifies the discriminating power of an item as it separates the more favourable from the less favourable responses to some latent attribute (Wood,1985). The advantages of the point-biserial correlation is that it provides the degree of relationship between the item responses and the scale. A high point-biserial coefficient shows a strong link between the item and the scale, while, a low coefficient, that is, a value close to zero or negative, indicates that an item does not have much in common with the other items in the scale. In Table 2 the point-biserial correlations for all data collected on the three occasions, analyzed in
a single analysis, are presented for the seven scales. The point-biserial correlations for the scales fell in the following ranges: Views about Mathematics Teaching from 0.19 to 0.57, Views about School and School Learning from 0.19 to 0.33, Attitudes towards School and School Learning, from 0.27 to 0.65, Attitudes towards Control of the Environment from 0.29 to 0.49, Attitudes towards Mathematics as a Process from 0.24 to 0.58, Attitudes about Facility of Learning Mathematics from 0.45 to 0.55, and Attitudes about the Place of Mathematics in Society from 0.39 to 0.53 (see Table 2). The results indicated that the items had a clear relationship to the batch of which they were part.
Rasch AnalysisThe next step was to examine the results of the Rasch analysis. In order to examine whether or not the items fitted the scales. It was important to evaluate both the item and person fit statistics. The results of these analyses are presented below.
Table 2 Point-biserials of the attitude items with their respective scales
Views about Mathematics TeachingViews about School and School Learning*Attitudes towardsMathe-matics as a Process*Attitudes about the Facility of Learning Mathe-
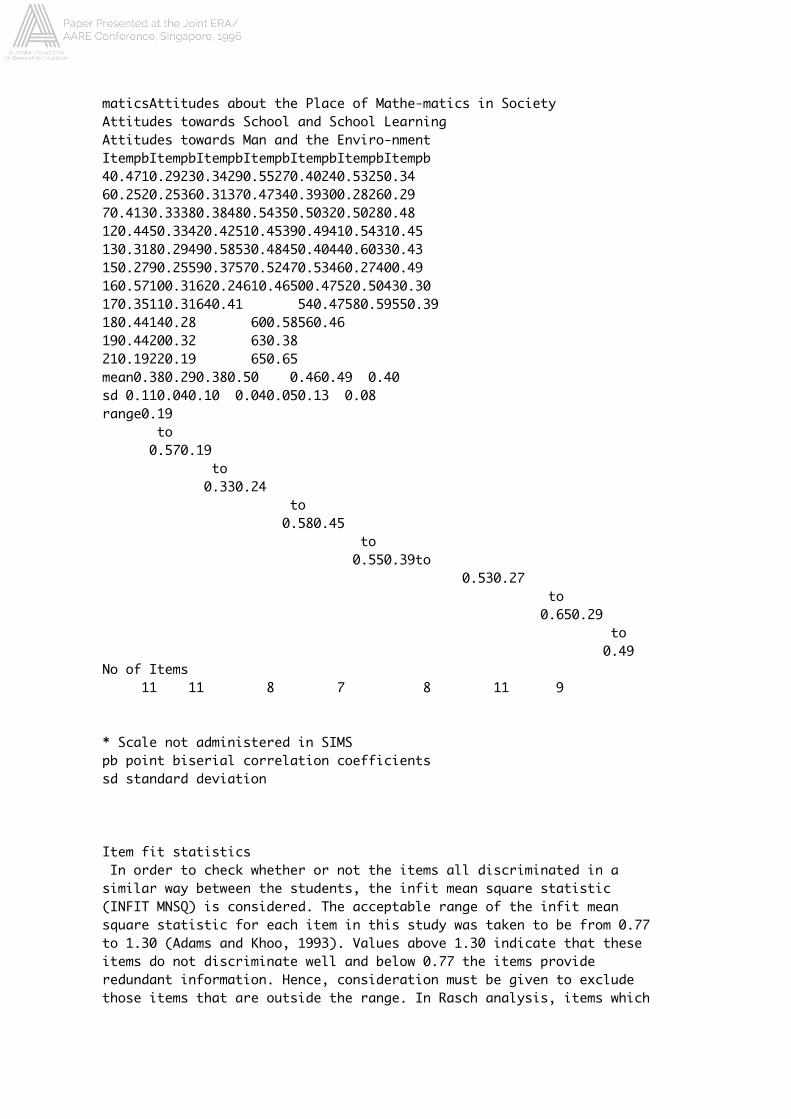
maticsAttitudes about the Place of Mathe-matics in SocietyAttitudes towards School and School LearningAttitudes towards Man and the Enviro-nmentItempbItempbItempbItempbItempbItempbItempb40.4710.29230.34290.55270.40240.53250.3460.2520.25360.31370.47340.39300.28260.2970.4130.33380.38480.54350.50320.50280.48120.4450.33420.42510.45390.49410.54310.45130.3180.29490.58530.48450.40440.60330.43150.2790.25590.37570.52470.53460.27400.49160.57100.31620.24610.46500.47520.50430.30170.35110.31640.41 540.47580.59550.39180.44140.28 600.58560.46190.44200.32 630.38210.19220.19 650.65mean0.380.290.380.50 0.460.49 0.40sd 0.110.040.10 0.040.050.13 0.08range0.19 to 0.570.19 to 0.330.24 to 0.580.45 to 0.550.39to 0.530.27 to 0.650.29 to 0.49No of Items 11 11 8 7 8 11 9
* Scale not administered in SIMSpb point biserial correlation coefficientssd standard deviation
Item fit statistics In order to check whether or not the items all discriminated in a similar way between the students, the infit mean square statistic (INFIT MNSQ) is considered. The acceptable range of the infit mean square statistic for each item in this study was taken to be from 0.77 to 1.30 (Adams and Khoo, 1993). Values above 1.30 indicate that these items do not discriminate well and below 0.77 the items provide redundant information. Hence, consideration must be given to exclude those items that are outside the range. In Rasch analysis, items which
are outside of the acceptable range must be deleted from the analysis (Rentz and Bashaw, 1975; Wright and Stone, 1979: Kolen and Whitney, 1981; Smith and Kramer, 1992). In Table 3 the INFIT MNSQ for all data collected on the three occasions, analyzed in a single analysis, are presented for the seven scales. The results of the initial analysis show that 60 out of 65 items had infit mean square coefficients within the acceptable range. Only five items had coefficients that were outside the acceptable range. Therefore, the five misfitting items were deleted from the final analysis (see Table 3). The five deleted items were located on two of the scales. Item 49 was
*INFIT MEAN SQUARE TABLE 3 insert HERE*
in the Attitudes towards Mathematics as a Process scale, while all the other four items, were from the scale concerned with Attitudes toward School and School Learning.
The infit mean square indices from the final analysis revealed that Views about School and School Learning, Attitudes towards Mathematics as a Process, Attitudes about the Facility of Learning Mathematics and Attitudes about the Place of Mathematics in Society scales fitted well the Rasch model (see Table 3). Since the infit mean square indices from the final analysis of the items in these scales ranged between 0.86 and 1.14, they fitted well the Rasch model, whereas the infit mean square indices for the other three scales ranged from 0.79 to 1.25 (see Table 3). The lower limit 0.79 was near to the lower cutting point 0.77 and the higher limit 1.25 was near to the upper limit 1.30. Hence, these three scales fitted less well when compared with the four good fitting scales.
Item ThresholdThe item threshold statistic shows the difficulty level of an item in a test (Masters, 1988). Moreover, Adams and Khoo (1993) have stated that the item threshold is the ability level that is required for an individual to have a 50 per cent chance of responding favourably to an item. It should be noted that in Rasch scaling a conjoint analysis is always involved, since it is the level of attitude of a person relative to the response level of an item that is under consideration. Anderson (1994) contended that the advantages of persons and items being located jointly on the same scale were, important for measuring attitudinal changes over time.
Thus, a large positive threshold value on an attitude scale shows the relative higher level of attitude of a student who would respond favourably to an item. Large negative threshold values indicate that a low level of attitude is required to respond favourably to an item.
Moreover, large positive threshold values show high level items and
high negative threshold values show low level items on a scale. The threshold value for the average of the threshold levels of the items in a scale is fixed to be zero, and all items are centred around this fixed point, in order to locate the scale on a number line with equal intervals. Therefore, one method of investigating whether or not the items fit the Rasch model is to examine the threshold values of an item. In unipolar and bipolar scales the number of threshold values of an item employed depends on the number of response categories of the item (see Table 9.4). In these data, there are three responses 'agree', 'undecided' and 'disagree'. Therefore, the threshold levels of an item indicate the attitude level of students to transit from one level to the next. For example in Table 9.4, in the Views about Mathematics Teaching scale the thresholds of Item 4 are -0.94 and -0.41 to transit from 'disagree' to 'undecided' and from 'undecided' to 'agree' respectively. However, the combined threshold of the item is the mean of these two threshold values. Meanwhile, the item threshold mean of all the items in each scale is set to zero in order to locate the scale. There were six items (Items 21, 23, 27, 44, 52 and 58) that had very high threshold values (see Table 4). Of these items, Items 21 and 52 had the highest threshold values of 1.16 and 1.03 respectively. This means that the items were high level items on the attitude scale and only those students with higher levels of attitude could be expected to respond favourably to these items. Hence, these items served to discriminate between those students with a relatively high level of attitude from those with a lower level of attitude.
There were five items (Items 9, 15, 24, 32 and 55) with large negative threshold values. Items 15 and 24 had the largest negative threshold values of -1.18 and -0.94 respectively. All the other items could be said to have had average threshold values and would be answered favourably by the students with average levels of attitude. The threshold values indicated that the items had an adequate range for the assessment of different levels of attitude.
Case estimatesThe other way of investigating the fit of the scales to data is to examine the estimates for each case. The case estimates express the attitude level of each student on the relevant scale. In order to identify whether the cases fit the scale or not it is important to examine the fit t statistic. In this study, the general guideline used for interpreting t as a sign of misfit is if t>5 (Wright and Stone, 1979, 169). That is, if the case estimate value of a person has a t value >5, that person does not fit the scale and is deleted from the analysis. However, in this analysis no person was deleted, because the t values for all cases were less than 5. The case estimates also revealed that the items and the cases fitted the scales. Hence, the seven attitude scales constructed after the deletion of five non-fitting items conformed to the Rasch model.
In summary, the results of the infit mean squares, difficulty levels
and point biserials revealed that 60 of the 65 view and attitude statements fitted the Rasch model which formed the seven view and attitude scales. In addition,
**INSERT THRESHOLD VALUES TABLE HERE**
the evidence indicated that for all cases, except where there was a zero score or a perfect score, the responses of the students sampled fitted the Rasch model.
The calibration of the view and attitude data permit scales to be
constructed that extends across the three groups, namely EMS, FIMS and SIMS students on the seven view and attitude scales. The fixed point of each scale was set at 500 with one logit, the natural metric of the scale, being set at 100 units. The difficulty level of the items in each scale was zero (0.00) (see Table 4). Therefore, the fixed point of the scale, namely 500 was taken as the mean of the items in each scale. The seven view and attitude scales constructed in this way for all samples of Year 8 students in FIMS, SIMS and EMS are presented in Figures 1 with 100 scale units being equivalent to one logit.
1. Changes of Students' Attitudes toward School and Mathematics over timeFor the comparison of the changes of students' attitudes towards school and mathematics over time, the case means and standard deviations of the samples for each occasion, effect sizes, t-test values, the jackknife standard errors and the design effects were calculated.
Treatment of Zero and Perfect ScoresThe QUEST computer program by default does not process cases with perfect and zero scores, because both groups do not provide information about the test. Cases with perfect scores are those cases who provided favourable responses for all the view and attitude statements, while cases with zero scores are those cases who provided unfavourable responses for all the view and attitude statements. Hence, in order to include those cases with perfect and zero scores in the calculation of the mean and standard deviation for each scale, the values of perfect and zero scores were calculated by extrapolation from the logit table produced by the Computer program. The SPSS 6.1. (Norusis & SPSS Inc, 1990) computer program was used to calculated the case estimate mean scores and standard deviations.
The comparison were between the samples of students who participated in EMS, FIMS and SIMS. These comparisons of students' attitudes on the seven view and attitude scales are presented below.

Figure 1. The View and Attitude Scales of all Students in EMS, FIMS and SIMSFixed Point - 500.Metric - 100 = 1 logit.Values in the brackets are in logits.d= differences in views and attitudes between occasions.
1. 1. Comparison of EMS, FIMS and SIMS in Views about Mathematics Teaching scaleOne of the seven scales used in the comparison of students' views and attitudes towards mathematics and schooling was the students' Views about Mathematics Teaching scale. The scale was developed to measure the views of students about the procedures used by their mathematics teachers' in the teaching of mathematics. The scale ranged from a method that emphasized problem-solving to the one that emphasized rote-learning. In order to examine the EMS, FIMS and SIMS students' Views about Mathematics Teaching the case mean estimate scores and standard deviations of the three groups of students were compared. The effect size, the jackknife standard error, the design effects and the t-values were employed to identify the significance level of the results of the comparisons.
When the case estimate mean scores of the 1964 Australian students are
compared with those of 1978 students, on the Views about Mathematics Teaching scale, the 1964 students' mean score was marginally higher than that for the 1978 students (see Table 5 and Figures 1 and 2). This difference was 0.03. This result indicated that the 1964 students had viewed mathematics teaching as emphasizing slighlty more on problem-solving methods rather than rote-learning. Rosier (1980) analysed the same scale by state and found similar results. However, this difference between FIMS and SIMS students' views over the 14 year period time was very small. The effect size was 0.04 which is too small to be considered meaningful, and the difference was not statistically significant, because the t-value was 0.6. The design effect (DEFF) of the FIMS and SIMS samples were 23.7 and 2.3 respectively. The design effect for the 1964 Australian study is extremely large. This is a consequence of the very different styles of mathematics teaching in different schools in different parts of Australia at that time and a large intra-class correlation coefficient for students within schools for this scale. Since the design effect assesses the extent to which school groups differed and was dependent on the intra-class correlation (DEFF = 1+r(m - 1), where m is the average school group size and r is the intra-class correlation) it was to be expected that DEFF would be large, if r were large and positive.
However, when the case mean scores for the three occasions are compared
on the same scale the mean score of the Ethiopian students was higher than the Australian students in FIMS and SIMS (see Table 5, Figures 1 and 2). The difference between Ethiopian and 1964 Australian students was 0.66, while the difference between Ethiopian and 1978 Australian students was 0.69. The differences between the Ethiopian and two Australian groups were in each excess of half a logit. This shows that the EMS students viewed mathematics teaching as emphasizing more problem-solving methods rather than rote-learning than did their Australian peers. The effect sizes between FIMS and EMS, and SIMS and EMS were 1.1 and 0.9 respectively (see Table 5) and the differences were statistically significant at p>0.01 level, because their t-test values were 11.6 and 15.7 respectively. The design effect of the EMS sample was 3.8.
Table 5. Comparisons of weighted mean, standard deviation, Jackknife standard error, design effect, sample size, effect size, t-values and significance levels of the views and attitudes of students on the three occasions
The findings can be summarised as follows.1.The Ethiopian students had more positive views about mathematics teaching than the 1964 and 1978 Australian students.2.There was no significant difference between the FIMS and SIMS students on the Views about Mathematics Teaching scale.
Figure 2 Comparison of the weighted mean scores of FIMS, SIMS and EMS Students' on the seven views and attitude scales
1. 2. Comparison of EMS and FIMS in Views about School and School Learning scaleThe second analysis was on Views about School and School Learning. The scale indicates the views of the students about the teaching-learning process in their respective schools. The items in this scale were not administered in 1978. Therefore, the comparison was between the EMS and
FIMS students. The mean scores of the FIMS students was 0.05, while, the EMS students was 0.03 (see Table 5, Figures 1 and 2). This shows that the FIMS students mean scores was marginally higher than for the Ethiopian students. The difference mean score was 0.02 (see Table 5, Figures 1 and 2). The effect size was 0.05 and the t-test value was 0.9, while the design effects were 4.2 and 2.6 for FIMS and EMS respectively. These results showed that the FIMS students had only slightly more positive views about their schools and school learning than the Ethiopian students. However, this difference was not
statistically significant. Hence, the summary of the finding was that:1. there was no statistically significant differences between the Australian and Ethiopian students in their views about their schools and school learning.
1. 3. Comparison of EMS and FIMS in Attitudes towards Mathematics as a Process scaleThe third analysis was about the attitudes of students towards mathematics as a process. Only the FIMS and Ethiopian students responded to this scale. Consequently, the comparison was between FIMS and EMS. The estimated mean scores for the students in the two countries was negative. Both groups of students viewed mathematics as a subject that was fixed, and given once and forever (see Table 5, Figures 1 and 2). However, when the two groups were compared, the Australian students viewed mathematics more as a subject that was developing, growing and changing.
Husén (1967) reported that among the 12 countries which participated in the FIMS, those students from the countries that had introduced new mathematics viewed mathematics as more of an open and changing system. Australia was one of the countries that had introduced new mathematics into some of its schools in the 1960s (Owen, et al. 1983; Clements, 1989). Hence, at the time of testing some Australian students had experienced changes in their mathematics curricula, whereas, there was no change in the mathematics curriculum since the introduction of new mathematics in Ethiopia in the 1970s. Therefore, the Ethiopian students had not experienced a change of curriculum in mathematics education. This might be the reason why the Australian students expressed more favourable attitudes towards mathematics as a process than the Ethiopian students. The other reason might be that the teaching methods employed by Ethiopian teachers, even though new mathematics had been introduced 25 years earlier, mathematics is still being taught in a highly formal way.
The case mean score difference between the two groups was 0.17. The case mean score of the Australian students was higher by 0.17 than the Ethiopian students. The difference was statistically significant at p>0.01 level because the effect size and the t-test values were 0.3 and 5.7 respectively. The design effects of the FIMS and EMS samples were 4.2 and 2.5 respectively. Therefore, the main finding on Attitude towards Mathematics as a Process scale may be stated as follows.The Australian students had a more favourable attitude towards mathematics as a process than the Ethiopian students.
1. 4. Comparison of EMS, FIMS and SIMS in Attitudes about the Facility of Learning Mathematics scaleThe estimated mean scores for both groups of Australian students with respect to attitudes concerning the ease of learning mathematics were
higher than for the Ethiopian students (see Table 5, Figures 1 and 2). The difference between the FIMS and EMS students was 0.31, the effect size and t-test values were 0.3 and 4.3 respectively. Therefore, the
difference was statistically significant at p> 0.01 level. The difference between the SIMS and EMS students was 0.45 and the effect size and t-test values were 0.4 and 6.4 respectively. Hence, the difference between the means for EMS and SIMS was significant at p> 0.01 level. This difference showed that Australian students perceived mathematics as a subject that most students could learn, while the Ethiopian students perceived mathematics as more difficult and a subject to be studied only by the intellectual elites. The design effects of the FIMS, SIMS and EMS samples were 4.0, 2.0 and 4.2 respectively.
When FIMS and SIMS students were compared on their attitudes about the facility of learning mathematics, the SIMS students' mean score was higher than for the FIMS students. The SIMS students' mean score was higher by 0.14 of a logit. The effect size was 0.1 and the t-test value was 3.7, so the difference was statistically significant at p> 0.01 level. This difference indicated that the SIMS students had more favourable attitudes about the facility of learning mathematics than had the FIMS students. The finding was similar to the finding presented by Rosier (1980).
This study reveals that the attitudes of the Australian students towards the facility of learning mathematics increased over time. Hence, the findings are summarised as follows.1.SIMS students had more favourable attitudes towards the facility of learning mathematics than the FIMS and Ethiopian Students. 2.Ethiopian students were found to have less favourable attitudes about the facility of learning mathematics than did the Australian students although their mean scores were relatively high.3.Students' attitudes about the facility of learning mathematics in Australia had changed significantly over time, towards seeing mathematics more as a subject that could be learned by all students.
1. 5. Comparison of EMS, FIMS and SIMS in Attitudes towards the Place of Mathematics in Society scaleThe results with respect to the students' attitudes towards the place of mathematics in society showed that the Ethiopian students had the highest mean score as compared with the 1964 and 1978 Australian students (see Table 5, Figures 1 and 2). The differences were 0.25 and 0.27 respectively. The effect sizes were small (0.26 and 0.25 ) and the t-test values were 4.5 and 5.0 respectively. The design effects of the FIMS, SIMS and EMS samples were 5.6, 1.9 and 2.4. Hence, both differences were significant at the p>0.01 level. This indicates that the Ethiopian students believed that mathematics had an important and
vital role in the society, while the Australian students believed that the role of mathematics in society was of lesser value. Mathematics had a higher place in Ethiopian society than other subjects taught in schools. It was a compulsory subject in all levels of education. Mathematics was also a compulsory subject for entry to higher educational institutions. Tilahun (1994, 44) indicated the importance of mathematics as follows:Each candidate for ESLCE is awarded a certificate which lists the subjects on which a grade D or better was obtained. . . . The Grade Point Average (G. P. A.) of candidates is calculated from his/her best five subjects results including English and Mathematics and is used in selection for entry to higher education.In addition, most employers required mathematics when they wanted to recruit workers. Therefore, this might have helped Ethiopian students to develop more favourable attitudes towards the place of mathematics in society. Meanwhile, when the mean score of the 1964 Australian students was compared with that of the 1978 students, the 1964 students
had a higher mean scores than the SIMS students. Rosier (1980) also reported similar results. This shows that the role of mathematics in Australian society was considered to be decreasing. However, the decline was not statistically significant. The effect size was 0.02 and the t-test value was 0.6. Therefore, the decrease was 0.02 of a logit over 14 years and was too small to be considered significant.
The summary of the findings may be stated as follows.1.The Ethiopian students had more favourable attitudes about the place of mathematics in society than both groups of Australian students.2.There was no significant difference between the 1964 and 1978 Australian students in their attitudes towards the place of mathematics in society.
1. 6. Comparison of EMS, FIMS and SIMS in Attitudes towards School and School Learning scaleIn this attitude scale, the mean score of the Ethiopian students was much higher than the two Australian groups of students. The differences were 1.34 for FIMS and 1.68 for SIMS students respectively (see Table 5, Figures 1 and 2). The effect sizes were 1.0 and 1.4 respectively, while the t-test values were 18.5 and 24.6 respectively and the design effects of the three samples were 3.0, 3.3 and 2.8 respectively. This shows that the Ethiopian students' liking of school was much higher than for the Australian groups. The participation rates of students in primary, junior and senior secondary schools in Ethiopia in 1987 were 34, 20 and 10 per cent (Ministry of Education, 1987) respectively. In a country where 66 per cent of the school-aged children are out of school, it is not surprising that those students who had the chance to attend school liked their school much more. Meanwhile, this finding was consistent with findings reported by Walker (1976), who reported that students from developing countries expressed more favourable attitudes

towards school and school learning.
On the other hand, when the two Australian groups were compared the mean score of the FIMS students was noticeably higher than that of the SIMS students. The mean score difference was 0.34. The effect size was 0.3 and the t-test was 6.8. The difference was significant at the p> 0.01 level. The result confirms the findings of Rosier (1980). This result reveals that the attitudes of students towards school and school learning had decreased over time, inspite of the massive input of financial resources into Australian schools between 1964 and 1978. The decrease was 0.34 logit on the scale, which is the largest when compared with the other scale mean differences over time. Hence, it might be of interest to find out the reasons for this decrease.
The summary of the findings are presented below.1.The Ethiopian students had more favourable attitudes towards school and school learning than both groups of Australian students.2.The 1964 Australian students had more favourable attitudes towards school and school learning than did the 1978 students.3.The attitude of students towards school and school learning in Australia had decreased over time.
1. 7. Comparison of EMS, FIMS and SIMS in Attitudes towards Control of the Environment scaleThe FIMS students mean score was marginally higher than the SIMS and EMS students' on the Attitudes towards Control of the Environment scale (see Table 5, Figures 1 and 2). Their differences between FIMS and SIMS, FIMS and EMS students were 0.49 and 0.04 respectively and the effect sizes were 0.6 and 0,1 and the t-values were 19.8 and 1.0 respectively. The design effects of FIMS, SIMS and EMS samples were
2.6, 1.7 and 2.0 respectively. Hence, the differences between FIMS and EMS students mean scores were not statistically significant, while, the difference between the FIMS and SIMS students mean scores was significant at the p>0.01 level. This shows that the attitude of Australian students towards person's ability to control his/her physical and social environment had decreased over time. This finding was consistent with that of Rosier's (1980).
When the mean scores of the SIMS and EMS students were compared, the EMS mean was higher than the SIMS by 0.45 a logit and the effect size was 0.5, the t-value also was 11.1, and the difference was statistically significant at the 0.01 level.
The summary of the findings are as follows.1. The 1964 Australian students had more favourable Attitudes towards Control of the Environment than the SIMS students.2. There was no significant difference between the FIMS and EMS

students on Attitudes towards Control of the Environment scale.3. The Ethiopian students showed more favourable Attitudes towards Control of the Environment than the SIMS students.4. The Australian students' Attitudes towards Control of the Environment had declined markedly over time.
ConclusionThe data on the views and attitudes of the EMS, FIMS and SIMS students were equated using the Quest computer program, and the analysis of the concurrent equating showed that 60 of the 65 items fitted the Rasch model. From the results of the Rasch model analysis the FIMS, SIMS and EMS students' views and attitudes on the seven scales were compared. The common scales developed for the seven views and attitudes scales indicated differences between the groups in their views and attitudes.
In conclusion, the main findings of the comparison among the EMS, FIMS and SIMS on the seven attitude scales are: 1.Ethiopian students expressed more favourable views and attitudes than the two Australian groups of students on the following three scales- Views about Mathematics Teaching;- Attitudes towards the Place of Mathematics in Society; and- Attitudes towards School and School Learning; 2.There was no significant difference between the FIMS and SIMS students on the Views about Mathematics Teaching scale.3.FIMS students had more favourable attitudes toward mathematics as a process than the Ethiopian students.4.There were no significant differences between the FIMS and EMS students in their views about school and school learning and in their attitudes towards control of the environment.5.SIMS students had more favourable attitudes about the facility of learning mathematics than the FIMS and the Ethiopian students.6.Ethiopian students showed less favourable attitudes about the facility of learning mathematics than the Australian students.7.When compared with the SIMS students, the FIMS students had more favourable attitudes towards school and school learning and control of the environment than the SIMS students.8.The attitudes of Australian students towards the facility of learning mathematics had increased over time.9.The attitudes towards school and school learning and control of the environment had declined over time.
The result of the students in EMS, FIMS and SIMS indicated that the attitudes of Australian students about the facility of learning mathematics had increased over time, whereas, attitudes towards school and school learning and attitudes towards control of the environment
scales, had declined over time. Further analyses were employed to examine different age group and different year levels in different types of schools. However, these analyses did not change the pattern of

results already presented. It seems important generally for educators, and in particular for curriculum designers and teachers to know the reasons for the changes, and to develop strategies to improve the attitudes of students on these attitude scales. The results of the third IEA study and the information available on students' attitudes is eagerly awaited. The views and the attitudes of the Ethiopian students towards mathematics teaching, the place of mathematics in society and attitudes towards school and school learning were more favourable than those of the Australian students. However, their attitudes towards mathematics as a process and facility of learning mathematics were low. This should be of concern to curriculum developers in Ethiopia.
ReferencesAdams, R. J. & Khoo, S.T. (1993). Quest- The interactive test analysis system. Hawthorn, Victoria: ACER.Anderson, L. W. (1994). Attitude Measures. In T. P. Husén, T. N. (Ed.), The International Encyclopedia of Education, (second ed., Vol. 1, pp. 380-390). Pergamon: Elsevier Science Ltd.Brick, J. M., Broene, P., James, P. & Severynse, J. (1996). A user's guide to WesVarPC. (Version 2.0). Boulevard: Westat, Inc. Chant, D & Dalgleish, L. I. (1992). A SAS macro for jackknifing the results of discriminant analyses. Multivariate Behaviural Research, 27 (3), 323-333.Clements, M. A. (1989). Mathematics for the minority: Some historical perspectives of school mathematics in Victoria. Geelong: Victoria: Deakin University.Edwards, A. L. (1957). Techniques of attitude scale construction. Appleton-Century-Crofts, Inc., New York.Edwards, A. L. & Kilpatrick, F. P. (1948). Scale analysis and the measurement of social attitudes. Psychometrika 19 (2), 99-114.Endalekachew W. Mariam (1990). Factors that affect students' academic performance in some selected senior secondary schools in Addis Ababa. Unpublished Thesis submitted for the degree Bachelor of Arts, Addis Ababa University, Addis Ababa.Fraser, B. J. (1979). Evaluation of science-based curriculum. In H. J. Walberg (Ed.), Educational Environments & Effects: Evaluation, Policy, & Productivity, Berkeley: McCutchan.Guttman, L. (1947). On Festinger's evaluation of scale analysis. Psychological Bulletin, 44, 451-465.Hair, J. F., Anderson, R. E., Tatham, R. L. & Black W. C. (1995).Multivariate data analysis with readings, (fourth ed.). PRENTICE HALL, Englewood Cliffs.Hambleton, R. K. & Cook, L. L. (1977). Latent triat models and their use in the analysis of educational test data. Journal of Educational Measurement, 14 (2), 75-96.Helfers, M. (1986). Children's attitudes to mathematics. Rhombus, 14(17-23).Husén, T. (1967). International Study of Achievement in mathematics. (Vol. 1 & 2). Stockholm: Almquist & Wiksell.
Keevs, J. P. (1966). Students attitude concerning Mathematics, Unpdblished Master of Education thesis, School of Education, University of Melbourne. Kolen, M. J. & Whitney, D.R. (1981, ). Comparison of four procedures for equating the tests of general educational development. Paper presented at the Paper presented at the annual meeting of thee American Educational Research Association, Los Angeles, California.Masters, G. N. (1988). Measurement models for ordered response categories. In R. L. a. J.Rost (Ed.), Latent trait and latent class
models, New York: Plenum.Milne, L. (1992, ). Bridging mathematics students: Attitudes, autonomous learning behaviours, & problem solving. Paper presented at the Proceedings of the fifteenth annual conference Mathematics Education Research Group of Australasia (MERGA), UNWS Conference Centre , Richmond.Ministry of Education (1987). Educational Movement for the last 13-Revolutionary Years. Ministry of Education, Addis Ababa.Mohandas, R. (1996). Test equating, problems and solutions. Unpublished Dissertation submitted for the degree of Master of Education., The Flinders University of South Australia, Adelaide.Morgenstern, C & Keeves, J. P. (1994). Attitudes toward Schooling, Comparative Studies in. In: Husén T and Postlethwaite T N (ed.) The International encyclopedia of education, (2nd ed.) Volume 1. Oxford: Pergamon Press.Morrison, C. A. & Fitzpatrick, S. J. (1992). Direct and indirect equating:A comparison of four methods using the Rasch model. Research Bulletin 91-3. Measurement and Evaluation Center: The University of Texas at Austin.Owen, J. M., Dowsey, J. & Hurworth, R. (1983). A review of recent research in science & mathematics education with particular reference to Australia. Melbourne College of Advanced Education: Centre for Program Evaluation.Peaker, G. F. (1975). An emperical study of education in twenty-one countries: A technical report. Almqvist & Wiksell International, Stockholm, Sweden.Rentz, R. R, & Bashaw, W. L. ( 1975). Equating Reading tests with the Rasch model, Vol. I Final Report. . Athens, Georgia: Educational Research Laboratory, College of Education, University of Georgia.Rosier, M. J. (1980). Changes in Secondary School Mathematics in Australia. Hawthorn: The Australian Council for Research.Smith, M. R., & Kramer G. A. (1992). A comparison of two methods of test equating in the Rasch model. Educational and Psychological Measurement, 52(4), 835- 846.Norusis, M. J. & SPSS Inc (1993). SPSS for windows: Base system user's guide: Release 6.0. SPSS Inc, Chicago.Tadesse Getaneh (1993). In school factors affecting the attitudes of students towards learning in selected senior secondary schools in eastern shewa region. Unpublished Thesis submitted for the degree
Bachelor of Arts, Addis Ababa University, Addis Ababa.Tilahun Mengesha Afrassa. (1994). National examinations in Ethiopia and South Australia: A comparative study. Unpublished Dissertation submitted for the degree of Master of Education., The Flinders University of South Australia, Adelaide.Walker, D. A. (1976). The IEA six subject survey: An emperical study of education in twenty-one countries. Stockholm: Almqvist and Wiksell.Weiss, D. J. Y. & Yoes, M. E. ( (1991).). Item response theory. In In R. K. Hambleton & J. N. Zaal (Ed.), Advances in Educational and Psychological Testing: Theory and Applications, Boston: Kluwer Academic Publishers.Wolf, R. M. (1994). Rating scales. In: Husén T & Postlethwaite T N (Ed.), The international encyclopedia of education,, (second ed., Vol. 8, pp. 4923-4930). Oxford: Elsevier Science.Wolf, R. M (1967). Construction of descriptive and attitude scales. In: Husén T (ed.) International Study of Achievement in Mathematics: A comparison of twelve countries, volume 1. ALMQVIST & WIKSELL, Stockholdm.Wood, R. (1985). Item analysis. In :Postlethwaite T N & Husén T (Ed.), The International encyclopedia of education, . Oxford: Pergamon Press.Wright, B. D. & Stone, H. S. (1979). Best test design. Chicago: MESA.
* The 1994 Australian data are not yet available for analysis. However, data were collected from a sample of Grade 8 students in Addis Ababa in Ethiopia in 1996, and these data have replaced the 1994 Australian data in this paper.** I would like to express my deepfelt thanks to my supervisor Professor John P Keeves for his guidance and assistance in the writing of this paper. I would also like to thank the participating schools, teachers and students in Australia and in Ethiopia whose co-operation made the study possible.*** This research was supported by The Flinders University of South Australia Overseas Postgraduate Research Scholarship and the Flinders University Research Scholarship.