Embed Size (px)
Citation preview
Progress in Nuclear Magnetic Resonance Spectroscopy 56 (2010) 78–93
Contents lists available at ScienceDirect
Progress in Nuclear Magnetic Resonance Spectroscopy
journal homepage: www.elsevier .com/ locate/pnmrs
Studies of nano-structured liquids in confined geometries and at surfaces
J. Beau W. Webber *
Institute of Petroleum Engineering, Heriot-Watt University, Edinburgh EH14 4AS, UKSchool of Physical Sciences, University of Kent, Canterbury, Kent CT2 7NH, UK
a r t i c l e i n f o a b s t r a c t
Article history:Received 12 December 2008Accepted 12 September 2009Available online 24 September 2009
Keywords:LiquidsWaterIceConfined geometryPoresNMR relaxationNeutron scatteringCryoporometry
0079-6565/$ - see front matter � 2009 Elsevier B.V. Adoi:10.1016/j.pnmrs.2009.09.001
* Address: Lab-Tools Ltd., Canterbury Enterprise HuE-mail address: [email protected]: http://www.Lab-Tools.com
� 2009 Elsevier B.V. All rights reserved.
Contents
1. Introduction . . . . . . . . . . . . . . . . . . . . . . . . . . . . . . . . . . . . . . . . . . . . . . . . . . . . . . . . . . . . . . . . . . . . . . . . . . . . . . . . . . . . . . . . . . . . . . . . . . . . . . . . . . 79
1.1. Samples . . . . . . . . . . . . . . . . . . . . . . . . . . . . . . . . . . . . . . . . . . . . . . . . . . . . . . . . . . . . . . . . . . . . . . . . . . . . . . . . . . . . . . . . . . . . . . . . . . . . . . . . 791.2. Methods . . . . . . . . . . . . . . . . . . . . . . . . . . . . . . . . . . . . . . . . . . . . . . . . . . . . . . . . . . . . . . . . . . . . . . . . . . . . . . . . . . . . . . . . . . . . . . . . . . . . . . . . 792. The thermodynamics of liquids in nano-pores. . . . . . . . . . . . . . . . . . . . . . . . . . . . . . . . . . . . . . . . . . . . . . . . . . . . . . . . . . . . . . . . . . . . . . . . . . . . . . . 79
2.1. The geometry term in the Gibbs–Thomson equation . . . . . . . . . . . . . . . . . . . . . . . . . . . . . . . . . . . . . . . . . . . . . . . . . . . . . . . . . . . . . . . . . . . . 802.2. Second order (linearity) terms in the Gibbs–Thomson equation . . . . . . . . . . . . . . . . . . . . . . . . . . . . . . . . . . . . . . . . . . . . . . . . . . . . . . . . . . . 803. The application of NMR relaxation, diffusion and cryoporometry techniques to the study of the properties of liquids in pores . . . . . . . . . . . . . 814. NMR cryoporometry: experimental . . . . . . . . . . . . . . . . . . . . . . . . . . . . . . . . . . . . . . . . . . . . . . . . . . . . . . . . . . . . . . . . . . . . . . . . . . . . . . . . . . . . . . . 82
4.1. NMR cryoporometry: experimental calibration of kGT for the melting transition . . . . . . . . . . . . . . . . . . . . . . . . . . . . . . . . . . . . . . . . . . . . . . 824.2. NMR cryoporometry: experimental effect of measuring time on the measured melting transition . . . . . . . . . . . . . . . . . . . . . . . . . . . . . . . 834.3. NMR cryoporometry: experimental calibration of kGT for the freezing transition . . . . . . . . . . . . . . . . . . . . . . . . . . . . . . . . . . . . . . . . . . . . . 834.4. Effects of interface geometries on freezing/melting behaviour: experimental . . . . . . . . . . . . . . . . . . . . . . . . . . . . . . . . . . . . . . . . . . . . . . . . 84
5. Water/ice at an interface: plastic ice . . . . . . . . . . . . . . . . . . . . . . . . . . . . . . . . . . . . . . . . . . . . . . . . . . . . . . . . . . . . . . . . . . . . . . . . . . . . . . . . . . . . . . 85
5.1. Water/ice at a silica interface . . . . . . . . . . . . . . . . . . . . . . . . . . . . . . . . . . . . . . . . . . . . . . . . . . . . . . . . . . . . . . . . . . . . . . . . . . . . . . . . . . . . . . . 855.1.1. Structure, as determined by neutron diffraction cryoporometry, using a global analysis, with a fully-filled sample . . . . . . . . . . 855.1.2. Dynamics, as determined by NMR transverse relaxation, for plastic ice in a fully-filled sample . . . . . . . . . . . . . . . . . . . . . . . . . . 86
5.2. Water/ice at a vapour interface . . . . . . . . . . . . . . . . . . . . . . . . . . . . . . . . . . . . . . . . . . . . . . . . . . . . . . . . . . . . . . . . . . . . . . . . . . . . . . . . . . . . . 87
5.2.1. Dynamics, as determined by NMR transverse relaxation, for plastic ice in a partially-filled sample . . . . . . . . . . . . . . . . . . . . . . . 885.2.2. Structure, as determined by neutron diffraction cryoporometry, using a global analysis, with a partially-filled sample . . . . . . . 885.2.3. Structure, as determined be neutron diffraction, using a peak analysis, with a partially-filled sample . . . . . . . . . . . . . . . . . . . . . 895.2.4. Structure, as determined by neutron diffraction, using a radial domain analysis . . . . . . . . . . . . . . . . . . . . . . . . . . . . . . . . . . . . . . 906. Applications and consequences . . . . . . . . . . . . . . . . . . . . . . . . . . . . . . . . . . . . . . . . . . . . . . . . . . . . . . . . . . . . . . . . . . . . . . . . . . . . . . . . . . . . . . . . . . . 90
6.1. Relevance to NMR cryoporometry in short T2 materials: meteorite example . . . . . . . . . . . . . . . . . . . . . . . . . . . . . . . . . . . . . . . . . . . . . . . . . 906.2. Relevance to macroscopic snow-packs in the environment . . . . . . . . . . . . . . . . . . . . . . . . . . . . . . . . . . . . . . . . . . . . . . . . . . . . . . . . . . . . . . . 91 References . . . . . . . . . . . . . . . . . . . . . . . . . . . . . . . . . . . . . . . . . . . . . . . . . . . . . . . . . . . . . . . . . . . . . . . . . . . . . . . . . . . . . . . . . . . . . . . . . . . . . . . . . . . 91ll rights reserved.
b, University of Kent, Canterbury, Kent. CT2 7NJ, UK. Tel.: +44 (0) 1227 82 4675.
J. Beau W. Webber / Progress in Nuclear Magnetic Resonance Spectroscopy 56 (2010) 78–93 79
1. Introduction
This is a progress report on elucidating the behaviour of liquids,in particular water, in confined geometry on the nano- to meso-scale, and at interfaces. There are important measurements stillto make, conclusions still to be drawn, and above all leaps ofunderstanding still to be made. However, a number of importantfeatures in the behaviour of these systems have recently becomeclearer.
Nano-structuring of liquids and their crystals changes theirGibbs free energy, and hence their dynamics. This may most read-ily be probed by monitoring the alteration of phase changes as afunction of temperature, together with changes in other parame-ters, particularly the confinement diameter. Such studies may beperformed by monitoring the change in the pressure (at constanttemperature) of the liquid in its own vapour (Kelvin equation), orby monitoring the change in the freezing/melting temperature(at constant pressure) of a crystal in its own liquid (Gibbs–Thom-son equation).
In the latter case the melting and freezing temperatures of liq-uids are modified by the changes in the volumetric Gibbs free en-ergy due to nanostructuring; this is related to the surface energy ofthe curved interface between the crystal and its own liquid. This isthus dependent on the geometry of the interface between the crys-tal and its liquid. There is still discussion on this point as to the ex-act geometric constants and functional forms that are applicablefor different confining geometries. Experimental evidence is pre-sented for the cases of cylindrical pores (SBA-15), and for poresthat on average are spherical (sol–gel). However, reconciling thiscomparative data with melting/freezing temperatures in each ofthese systems still pose a number of questions.
It is well known that bulk brittle ice has a hexagonal structure,while brittle ice that forms in pores may be cubic in structure [1,2],Figs. 10 and 11. Adjacent surfaces appear to further alter thedynamics and structure of confined liquids and their crystals, lead-ing in the case of a water/ice system to a state of enhanced rota-tional motion (plastic ice) just below the confined freezing/melting transitions. This plastic ice layer appears to form at boththe ice–silica interface and the ice–vapour surface, and reversiblytransforms to brittle ice at lower temperatures. There is good evi-dence to suggest that the plastic ice at a silica interface transformsto cubic ice, while the plastic ice at vapour surfaces transforms tohexagonal ice. That this plastic ice may correspond to a layer at thecrystal surface is suggested by the presence of only amorphous icein confined systems with small dimensions (<�3 nm diameter),whereas systems with larger dimensions (�10 nm) contain brittlecubic ice and also some hexagonal ice (if a vapour interface is pres-ent); even larger systems (>�30 nm) contain predominately hex-agonal ice. It is conjectured that this layer of plastic ice at vapoursurfaces may be present at the myriad of such interfaces in macro-scopic systems, such as snow-packs, glaciers and icebergs, and maybe an explanation for the need for plastic terms in the macroscopicdynamical models of these systems [3].
These results also point the way forward for a wide-range ofcryoporometric metrology studies of systems that are ‘difficult’for NMR, such as high iron content clays and rocks, as well as agedconcrete. Results are presented for cryoporometric measurementson meteorite samples with a significant metallic content, exhibit-ing T�2 relaxation times down to 2.5 ls.
1.1. Samples
The nano-structuring of liquids greatly modifies their physicalproperties. Confining liquids in materials with pores, in order tostudy these properties, has a long history. Because of the large sur-
face area within these pores, placing liquids in pores also forms anexcellent method of studying the properties of liquids near sur-faces (which have been shown to behave differently from the restof the liquid in the pore). There are many informative studies ofliquids in zeolites, sol–gel silicas and in the regular templated sil-icas such as MCM-41, MCM-48. However, the newer templated sil-icas, such as SBA-15 and SPS-1, have expanded the range of sizesavailable from regular templated silicas, and studies in these havebeen particularly informative, their narrow pore size distributionsenabling a precise probing of liquid properties as a function of dis-tance from the pore surface.
1.2. Methods
One method of studying these systems that has been shown tobe of great importance involves measuring the phase-change prop-erties of liquids in nano- to meso-pores over a wide temperaturerange: this reveals a wide range of phase change behaviour in suchliquids compared with that in the bulk liquid. Most importantlythese phase changes give us useful probes into the physics that iscontrolling the dynamics in the confined geometry. NMR relaxa-tion studies provide a further method of probing the dynamics,as does quasi-elastic neutron scattering (QENS), while neutron dif-fraction, small angle neutron scattering (SANS), NMR cryoporome-try (NMR-C) and neutron diffraction cryoporometry (NDC) are alsopowerful tools for probing the structure.
2. The thermodynamics of liquids in nano-pores
J.W. Gibbs, J. Thomson, W. Thomson (later Lord Kelvin) and J.J.Thomson employed thermodynamics, generalised dynamics andexperimentation to develop a set of equations describing the ef-fects that a range of variables, including geometry, have on basicproperties of matter such as vapour pressure and melting point[4–9]. In particular there are important behaviours that are closelyrelated to the capillary effect, that reflect the change in bulk freeenergy caused by the curvature of an interfacial surface under ten-sion [10,11].
For these systems the constant temperature variant of the Gibbsequations is the Kelvin equation, which describes the change in va-pour pressure with radius of curvature, for a small isolated dropletof liquid in its own vapour:
RT lnPv
P0¼ �2c
VM
Rk; ð1Þ
where R is the gas constant, T the absolute temperature, P0 theambient pressure, Pv the vapour pressure c is the liquid surface ten-sion at temperature T, VM is the molar volume of the liquid and Rk isthe Kelvin radius.
Eq. (1) can also be applied to the model of a right cylindricalvoid containing a hemispherical interface between a wetting liquidand its own vapour [9], where the presence of a confining geome-try requires an additional cos(/) term to be incorporated into theKelvin equation to accommodate the interaction between theabsorbate and the pore walls:
RT lnPv
P0¼ �2c
VM
Rkcos /; ð2Þ
where / is the contact angle between the liquid and vapour at thepore wall.
Eq. (2) describes the evaporation branch of the absorption iso-therms [12,13,11], since condensation is believed to occur initiallyas monolayers (i.e. with cylindrical geometry in cylindrical pores),but evaporation is believed to occur at a hemispherical interfacethat travels along the pore as it empties.
0–10–20
2
1
0D
C
B
A
Temperature {oC}
Mel
ted
volu
me
{ml.g
–1}
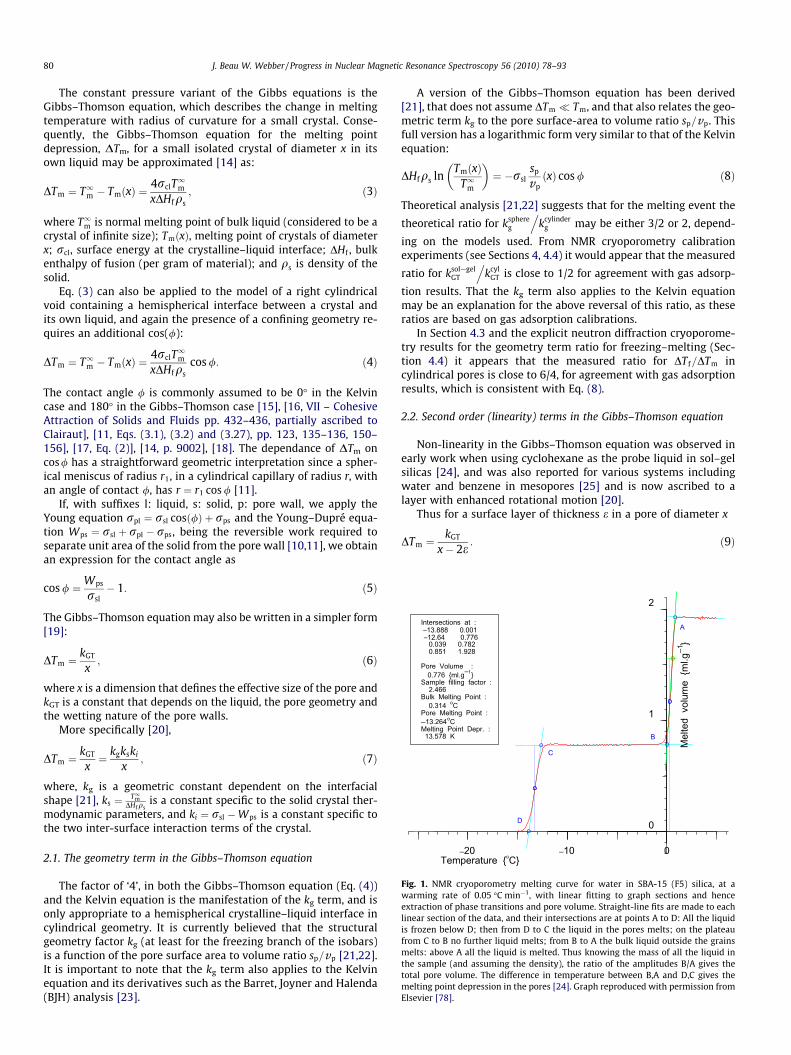
Intersections at : –13.888 0.001 –12.64 0.776
0.039 0.782 0.851 1.928
Pore Volume : 0.776 {ml.g–1} Sample filling factor : 2.466 Bulk Melting Point : 0.314 oC Pore Melting Point : –13.264 oC Melting Point Depr. : 13.578 K
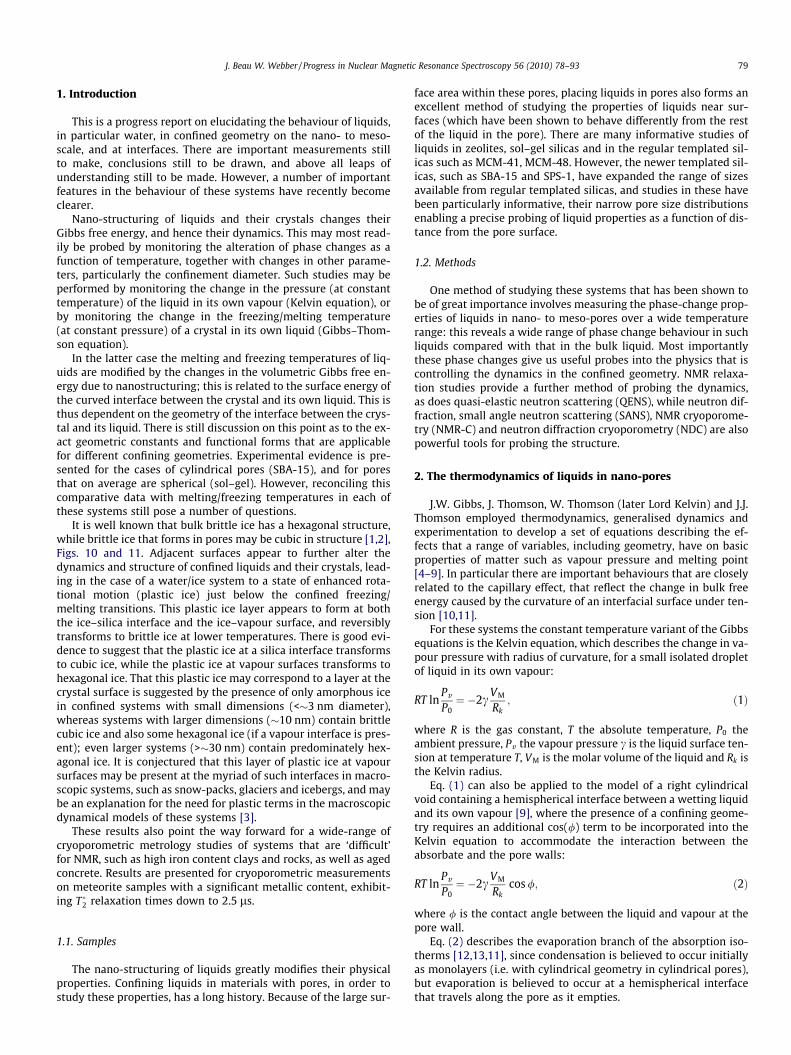
Fig. 1. NMR cryoporometry melting curve for water in SBA-15 (F5) silica, at awarming rate of 0.05 �C min�1, with linear fitting to graph sections and henceextraction of phase transitions and pore volume. Straight-line fits are made to eachlinear section of the data, and their intersections are at points A to D: All the liquidis frozen below D; then from D to C the liquid in the pores melts; on the plateaufrom C to B no further liquid melts; from B to A the bulk liquid outside the grainsmelts: above A all the liquid is melted. Thus knowing the mass of all the liquid inthe sample (and assuming the density), the ratio of the amplitudes B/A gives thetotal pore volume. The difference in temperature between B,A and D,C gives themelting point depression in the pores [24]. Graph reproduced with permission fromElsevier [78].
80 J. Beau W. Webber / Progress in Nuclear Magnetic Resonance Spectroscopy 56 (2010) 78–93
The constant pressure variant of the Gibbs equations is theGibbs–Thomson equation, which describes the change in meltingtemperature with radius of curvature for a small crystal. Conse-quently, the Gibbs–Thomson equation for the melting pointdepression, DTm, for a small isolated crystal of diameter x in itsown liquid may be approximated [14] as:
DTm ¼ T1m � TmðxÞ ¼4rclT
1m
xDHfqs; ð3Þ
where T1m is normal melting point of bulk liquid (considered to be acrystal of infinite size); TmðxÞ, melting point of crystals of diameterx; rcl, surface energy at the crystalline–liquid interface; DHf , bulkenthalpy of fusion (per gram of material); and qs is density of thesolid.
Eq. (3) can also be applied to the model of a right cylindricalvoid containing a hemispherical interface between a crystal andits own liquid, and again the presence of a confining geometry re-quires an additional cos(/):
DTm ¼ T1m � TmðxÞ ¼4rclT
1m
xDHfqscos /: ð4Þ
The contact angle / is commonly assumed to be 0� in the Kelvincase and 180� in the Gibbs–Thomson case [15], [16, VII – CohesiveAttraction of Solids and Fluids pp. 432–436, partially ascribed toClairaut], [11, Eqs. (3.1), (3.2) and (3.27), pp. 123, 135–136, 150–156], [17, Eq. (2)], [14, p. 9002], [18]. The dependance of DTm oncos/ has a straightforward geometric interpretation since a spher-ical meniscus of radius r1, in a cylindrical capillary of radius r, withan angle of contact /, has r ¼ r1 cos / [11].
If, with suffixes l: liquid, s: solid, p: pore wall, we apply theYoung equation rpl ¼ rsl cosð/Þ þ rps and the Young–Dupré equa-tion Wps ¼ rsl þ rpl � rps, being the reversible work required toseparate unit area of the solid from the pore wall [10,11], we obtainan expression for the contact angle as
cos / ¼Wps
rsl� 1: ð5Þ
The Gibbs–Thomson equation may also be written in a simpler form[19]:
DTm ¼kGT
x; ð6Þ
where x is a dimension that defines the effective size of the pore andkGT is a constant that depends on the liquid, the pore geometry andthe wetting nature of the pore walls.
More specifically [20],
DTm ¼kGT
x¼ kgkski
x; ð7Þ
where, kg is a geometric constant dependent on the interfacialshape [21], ks ¼ T1m
DHf qsis a constant specific to the solid crystal ther-
modynamic parameters, and ki ¼ rsl �Wps is a constant specific tothe two inter-surface interaction terms of the crystal.
2.1. The geometry term in the Gibbs–Thomson equation
The factor of ‘4’, in both the Gibbs–Thomson equation (Eq. (4))and the Kelvin equation is the manifestation of the kg term, and isonly appropriate to a hemispherical crystalline–liquid interface incylindrical geometry. It is currently believed that the structuralgeometry factor kg (at least for the freezing branch of the isobars)is a function of the pore surface area to volume ratio sp=vp [21,22].It is important to note that the kg term also applies to the Kelvinequation and its derivatives such as the Barret, Joyner and Halenda(BJH) analysis [23].
A version of the Gibbs–Thomson equation has been derived[21], that does not assume DTm � Tm, and that also relates the geo-metric term kg to the pore surface-area to volume ratio sp=vp. Thisfull version has a logarithmic form very similar to that of the Kelvinequation:
DHfqs lnTmðxÞ
T1m
� �¼ �rsl
sp
vpðxÞ cos / ð8Þ
Theoretical analysis [21,22] suggests that for the melting event the
theoretical ratio for ksphereg
.kcylinder
g may be either 3/2 or 2, depend-
ing on the models used. From NMR cryoporometry calibrationexperiments (see Sections 4, 4.4) it would appear that the measured
ratio for ksol—gelGT
.kcyl
GT is close to 1/2 for agreement with gas adsorp-
tion results. That the kg term also applies to the Kelvin equationmay be an explanation for the above reversal of this ratio, as theseratios are based on gas adsorption calibrations.
In Section 4.3 and the explicit neutron diffraction cryoporome-try results for the geometry term ratio for freezing–melting (Sec-tion 4.4) it appears that the measured ratio for DT f=DTm incylindrical pores is close to 6/4, for agreement with gas adsorptionresults, which is consistent with Eq. (8).
2.2. Second order (linearity) terms in the Gibbs–Thomson equation
Non-linearity in the Gibbs–Thomson equation was observed inearly work when using cyclohexane as the probe liquid in sol–gelsilicas [24], and was also reported for various systems includingwater and benzene in mesopores [25] and is now ascribed to alayer with enhanced rotational motion [20].
Thus for a surface layer of thickness e in a pore of diameter x
DTm ¼kGT
x� 2e: ð9Þ
20
{K}
Unilever A + Unilever B
Merck (Aldrich) Aldrich
* Davsil (Aldrich) Sigma
J. Beau W. Webber / Progress in Nuclear Magnetic Resonance Spectroscopy 56 (2010) 78–93 81
However, the main problem with such a simple description is thatin some systems such as cyclohexane the value for e appears to de-pend on the time 2s at which the magnetization decay is sampled[24], such that, for s > sc, e) 0. The explanation for this appearsto again reside with the properties of the layer with enhanced rota-tional motion; experimental results are discussed in Section 4.2,and further results for the properties of the layer are discussed inSection 5.
60
50
40
30
20
Sol–Gel, MCM–41 + SBA–15 melting–point depressions
ΔTm
{K}
+ MCM–41
o SBA–15
0.40.30.20.10
10
0
1/x {nm–1}
ΔT m
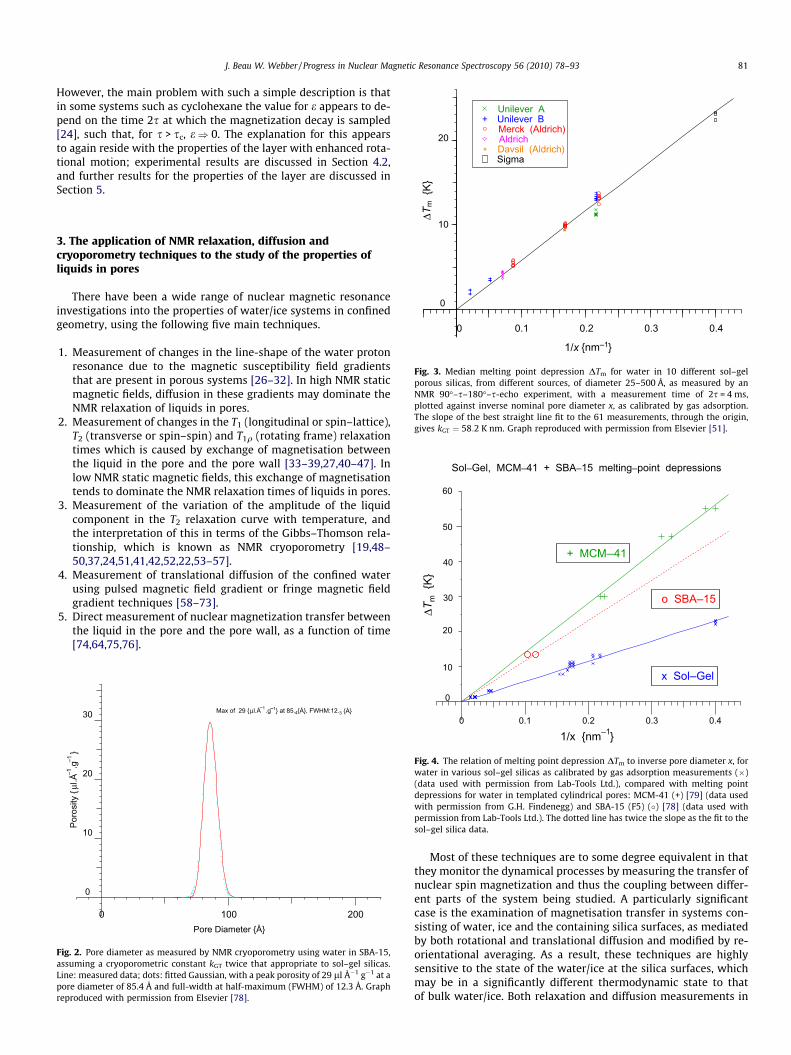
Fig. 3. Median melting point depression DTm for water in 10 different sol–gelporous silicas, from different sources, of diameter 25–500 Å, as measured by anNMR 90�–s–180�–s-echo experiment, with a measurement time of 2s = 4 ms,plotted against inverse nominal pore diameter x, as calibrated by gas adsorption.The slope of the best straight line fit to the 61 measurements, through the origin,gives kGT ¼ 58:2 K nm. Graph reproduced with permission from Elsevier [51].
3. The application of NMR relaxation, diffusion andcryoporometry techniques to the study of the properties ofliquids in pores
There have been a wide range of nuclear magnetic resonanceinvestigations into the properties of water/ice systems in confinedgeometry, using the following five main techniques.
1. Measurement of changes in the line-shape of the water protonresonance due to the magnetic susceptibility field gradientsthat are present in porous systems [26–32]. In high NMR staticmagnetic fields, diffusion in these gradients may dominate theNMR relaxation of liquids in pores.
2. Measurement of changes in the T1 (longitudinal or spin–lattice),T2 (transverse or spin–spin) and T1q (rotating frame) relaxationtimes which is caused by exchange of magnetisation betweenthe liquid in the pore and the pore wall [33–39,27,40–47]. Inlow NMR static magnetic fields, this exchange of magnetisationtends to dominate the NMR relaxation times of liquids in pores.
3. Measurement of the variation of the amplitude of the liquidcomponent in the T2 relaxation curve with temperature, andthe interpretation of this in terms of the Gibbs–Thomson rela-tionship, which is known as NMR cryoporometry [19,48–50,37,24,51,41,42,52,22,53–57].
4. Measurement of translational diffusion of the confined waterusing pulsed magnetic field gradient or fringe magnetic fieldgradient techniques [58–73].
5. Direct measurement of nuclear magnetization transfer betweenthe liquid in the pore and the pore wall, as a function of time[74,64,75,76].
2001000
30
20
10
0
Pore Diameter {Å}
Poro
sity
{μl.Å
–1.g
–1}
Max of 29 {μl.Å–1 .g–1} at 85.4{Å}, FWHM: 12.3 {Å}
Fig. 2. Pore diameter as measured by NMR cryoporometry using water in SBA-15,assuming a cryoporometric constant kGT twice that appropriate to sol–gel silicas.Line: measured data; dots: fitted Gaussian, with a peak porosity of 29 ll Å�1 g�1 at apore diameter of 85.4 Å and full-width at half-maximum (FWHM) of 12.3 Å. Graphreproduced with permission from Elsevier [78].
0.40.30.20.10
10
0
1/x {nm–1}
x Sol–Gel
Fig. 4. The relation of melting point depression DTm to inverse pore diameter x, forwater in various sol–gel silicas as calibrated by gas adsorption measurements (�)(data used with permission from Lab-Tools Ltd.), compared with melting pointdepressions for water in templated cylindrical pores: MCM-41 (+) [79] (data usedwith permission from G.H. Findenegg) and SBA-15 (F5) (�) [78] (data used withpermission from Lab-Tools Ltd.). The dotted line has twice the slope as the fit to thesol–gel silica data.
Most of these techniques are to some degree equivalent in thatthey monitor the dynamical processes by measuring the transfer ofnuclear spin magnetization and thus the coupling between differ-ent parts of the system being studied. A particularly significantcase is the examination of magnetisation transfer in systems con-sisting of water, ice and the containing silica surfaces, as mediatedby both rotational and translational diffusion and modified by re-orientational averaging. As a result, these techniques are highlysensitive to the state of the water/ice at the silica surfaces, whichmay be in a significantly different thermodynamic state to thatof bulk water/ice. Both relaxation and diffusion measurements in
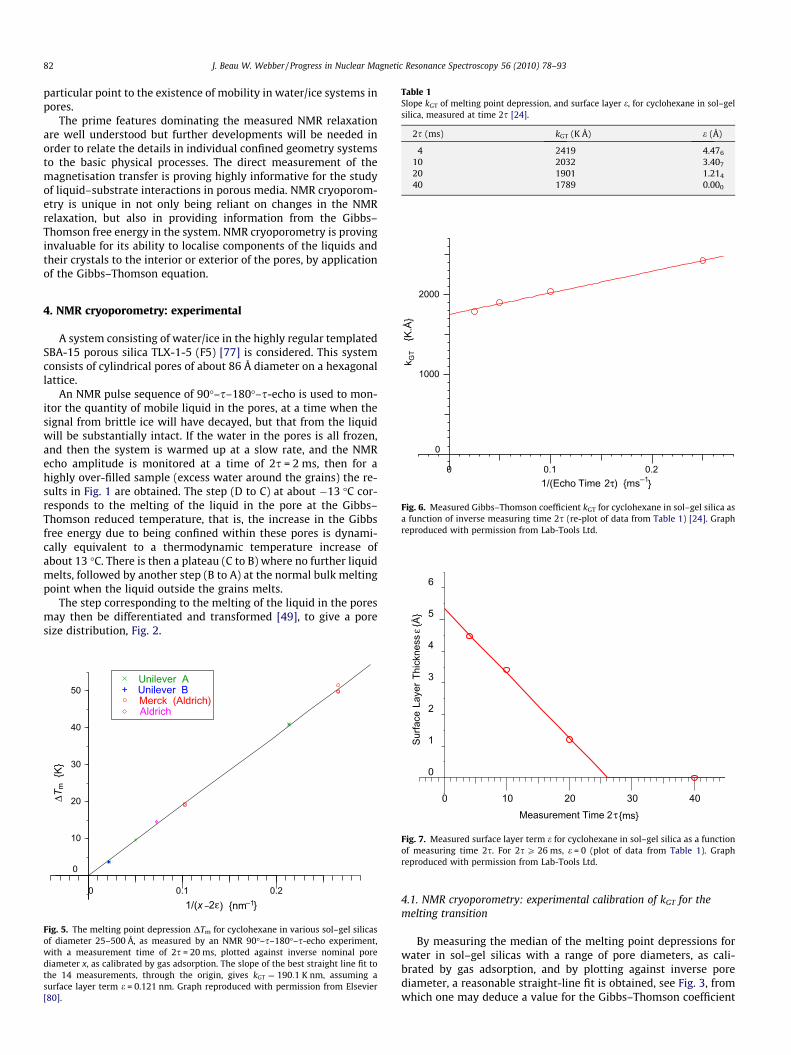
Table 1Slope kGT of melting point depression, and surface layer e, for cyclohexane in sol–gelsilica, measured at time 2s [24].
2s (ms) kGT (K Å) e (Å)
4 2419 4.476
10 2032 3.407
20 1901 1.214
40 1789 0.000
82 J. Beau W. Webber / Progress in Nuclear Magnetic Resonance Spectroscopy 56 (2010) 78–93
particular point to the existence of mobility in water/ice systems inpores.
The prime features dominating the measured NMR relaxationare well understood but further developments will be needed inorder to relate the details in individual confined geometry systemsto the basic physical processes. The direct measurement of themagnetisation transfer is proving highly informative for the studyof liquid–substrate interactions in porous media. NMR cryoporom-etry is unique in not only being reliant on changes in the NMRrelaxation, but also in providing information from the Gibbs–Thomson free energy in the system. NMR cryoporometry is provinginvaluable for its ability to localise components of the liquids andtheir crystals to the interior or exterior of the pores, by applicationof the Gibbs–Thomson equation.
0.20.10
2000
1000
0
1/(Echo Time 2τ) {ms–1}
k GT
{K.
Å}
Fig. 6. Measured Gibbs–Thomson coefficient kGT for cyclohexane in sol–gel silica asa function of inverse measuring time 2s (re-plot of data from Table 1) [24]. Graphreproduced with permission from Lab-Tools Ltd.
6
5
s ε {
Å}
4. NMR cryoporometry: experimental
A system consisting of water/ice in the highly regular templatedSBA-15 porous silica TLX-1-5 (F5) [77] is considered. This systemconsists of cylindrical pores of about 86 Å diameter on a hexagonallattice.
An NMR pulse sequence of 90�–s–180�–s-echo is used to mon-itor the quantity of mobile liquid in the pores, at a time when thesignal from brittle ice will have decayed, but that from the liquidwill be substantially intact. If the water in the pores is all frozen,and then the system is warmed up at a slow rate, and the NMRecho amplitude is monitored at a time of 2s = 2 ms, then for ahighly over-filled sample (excess water around the grains) the re-sults in Fig. 1 are obtained. The step (D to C) at about �13 �C cor-responds to the melting of the liquid in the pore at the Gibbs–Thomson reduced temperature, that is, the increase in the Gibbsfree energy due to being confined within these pores is dynami-cally equivalent to a thermodynamic temperature increase ofabout 13 �C. There is then a plateau (C to B) where no further liquidmelts, followed by another step (B to A) at the normal bulk meltingpoint when the liquid outside the grains melts.
The step corresponding to the melting of the liquid in the poresmay then be differentiated and transformed [49], to give a poresize distribution, Fig. 2.
0.20.10
50
40
30
20
10
0
1/(x –2ε) {nm }
ΔT m
{K}
Unilever A + Unilever B
Merck (Aldrich) Aldrich
–1
Fig. 5. The melting point depression DTm for cyclohexane in various sol–gel silicasof diameter 25–500 Å, as measured by an NMR 90�–s–180�–s-echo experiment,with a measurement time of 2s = 20 ms, plotted against inverse nominal porediameter x, as calibrated by gas adsorption. The slope of the best straight line fit tothe 14 measurements, through the origin, gives kGT ¼ 190:1 K nm, assuming asurface layer term e = 0.121 nm. Graph reproduced with permission from Elsevier[80].
403020100
4
3
2
1
0
Measurement Time 2τ {ms}
Surfa
ce L
ayer
Thi
ckne
s
Fig. 7. Measured surface layer term e for cyclohexane in sol–gel silica as a functionof measuring time 2s. For 2s P 26 ms, e = 0 (plot of data from Table 1). Graphreproduced with permission from Lab-Tools Ltd.
4.1. NMR cryoporometry: experimental calibration of kGT for themelting transition
By measuring the median of the melting point depressions forwater in sol–gel silicas with a range of pore diameters, as cali-brated by gas adsorption, and by plotting against inverse porediameter, a reasonable straight-line fit is obtained, see Fig. 3, fromwhich one may deduce a value for the Gibbs–Thomson coefficient
0
1
0
Temperature {C}
Mel
ted
volu
me
{ml.g
}
1st Ramp: Supercooling
2nd
Ram
p: W
arm
ing
3rd
Ram
p: C
oolin
g
4th
Ram
p: W
arm
ing
4th
Ram
p: W
arm
ing
–1
–10–20
Fig. 8. Multi-ramp NMR cryoporometry measurements on water in 10 nm nominalpore diameter sol–gel silica, probing the freezing event as well as the meltingevents [82]. Graph reproduced with permission from Elsevier [83].
0–10–20
1
0.5
0
Temperature {C}
Mel
ted
volu
me
{ml.g
–1}
Fig. 9. Multi-ramp NMR cryoporometry measurements on water in SBA-15 silica,probing the freezing event as well as the melting events [82]. Graph reproducedwith permission from Lab-Tools Ltd.
J. Beau W. Webber / Progress in Nuclear Magnetic Resonance Spectroscopy 56 (2010) 78–93 83
ksol—gelGT for water of about 58.2 K nm (for the geometry applicable to
sol–gel silicas).To obtain a correct value for kGT for a brittle-ice to water tran-
sition by NMR one must measure at a Free-Induction-Decay (FID)or echo sampling time in excess of 1 ms. For the work relating toFig. 3, times of 4–20 ms were used and were shown to give equiv-alent results. The reason that measurements at shorter times givediverging results has recently become clear, and is discussed inSection 5, where evidence that water near an interface may entera state with enhanced rotational motion is considered.
More recent work has returned significantly different results forkGT when measuring in templated silicas with cylindrical pores.This is expected, from the different values for the geometric termkg. However, it is important to obtain experimental values for kg,and Fig. 4 shows a fit to data for three MCM-41 type silicas (+)[79], where the melting point depression is plotted against inversepore diameter as measured by N2 gas adsorption using both Kruk–Jaroniec–Sayari (KJS) and density functional theory (DFT) analyses,and also a melting point depression for SBA-15 silica [78]. Themelting point depression for SBA-15 data was measured with thesame apparatus as shown in Fig. 2, the pore diameter being mea-sured by N2 gas adsorption Frenkel-Halsey-Hill (FHH) analysis[78]. The best-fit straight line through the origin gives kcyl
GT for wateras about 140 K nm.
The melting points for a number of the sol–gel silicas used forFig. 3 were re-measured on the same apparatus as for the SBA-15data, using a 2s acquisition time of between 2 ms and 10 ms(mostly 4 ms). For nearly all the silicas N2 gas adsorption diameterswere measured using Coulter SA 3100 instruments, and for manyof the samples measurements were made on two separate instru-ments; measured values were not obtained for two of the silicas,and manufacturers’ supplied pore diameters were used. Thedesorption BJH pore incremental volumes vs. pore diameter werepeak fitted, and the medians of the desorption BJH pore cumulativevolumes vs. pore diameter were also measured; both values wereused to plot the measured melting point depressions (x) (Webberand Strange, unpublished work). The best-fit straight line throughthe origin gave ksol—gel
GT for water of about 58.0 K nm, which is in rea-sonable agreement with Fig. 3. Given the scatter for both thesedata sets there appears to be little advantage in considering a sur-face layer: the minima in the N2ðeÞ errors of the best-fits are fairlyshallow.
In earlier work with only an estimate of kcylGT from the single SBA-
15 sample [78] it was suggested that kcylGT
.ksol—gel
GT was about 2. Fig. 4suggests that kcyl
GT
.ksol—gel
GT � 2:43. This is significantly different fromany theoretical value, but this may be due to the different analysesthat have been applied to the N2 gas adsorption data, or may indi-cate the need for more consistent melting point data that have allbeen measured on the same NMR cryoporometric instrument.
4.2. NMR cryoporometry: experimental effect of measuring time on themeasured melting transition
The presence of rotational motion is well known in solid cyclo-hexane, which has a plastic phase between the brittle and liquidphases, and similar plots for multiple pore diameter silicas, as afunction of pore diameter, for cyclohexane, such as Fig. 5, areshown to require a surface layer term e to be included in theGibbs–Thomson equation (i.e. to obtain a straight line in plots suchas Fig. 5) as discussed in Section 2.2. The constants required forthese fits (Table 1) show that the measured surface layer thicknesse is s dependent [24] (see Fig. 6).
Fig. 7 indicates that for cyclohexane, for measurements with2s P 26 ms the mvalue of the pore diameter derived from Eq. (9)will be independent of s, consistent with the standard minimumvalue of s = 20 ms, used for many years in cryoporometric mea-
surements on cyclohexane. Fig. 7 implies that for the first 5.4 Åthere is something different about the properties of cyclohexanewithin pores. This variation is now believed to be due to a surfacelayer with enhanced rotational motion, whose thickness dependson temperature, as discussed in Section 5.
4.3. NMR cryoporometry: experimental calibration of kGT for thefreezing transition
NMR cryoporometry conventionally uses the equilibrium melt-ing transition, as for many liquids in pore systems on a simple cool-ing the liquid will enter a non-equilibrium super-cooled state,
84 J. Beau W. Webber / Progress in Nuclear Magnetic Resonance Spectroscopy 56 (2010) 78–93
before finally freezing at a temperature that does not correctly en-code the Gibbs–Thomson coefficient.
Recently a multi-ramp measurement technique to also observean equilibrium freezing transition such as is shown in Figs. 8, 9 hasbeen reported independently by Petrov and Furo [81] and Webberet al. [82,83].
The sample is initially cooled through the supercooling eventuntil all the liquid is frozen, then it is warmed until the liquid inthe pores is melted, but with the liquid around the grains remain-ing frozen. During a subsequent cooling ramp, the ice around thegrains serves to initiate freezing inside pores at the true Gibbs–Thomson equilibrium freezing point. A final warming ramp againmelts the liquid in pores and then finally the liquid around thegrains. The latter event serves as a reference temperature for thebulk melting point, helping remove zeroth order instrumentationoffsets.
This freezing event is at a lower temperature than the meltingevent; this may be due to the geometry of the freezing meniscus
40
30
20
10
0
240250
260270
280290
0
Temperature {K}
Inte
nsity
AB
CD
E
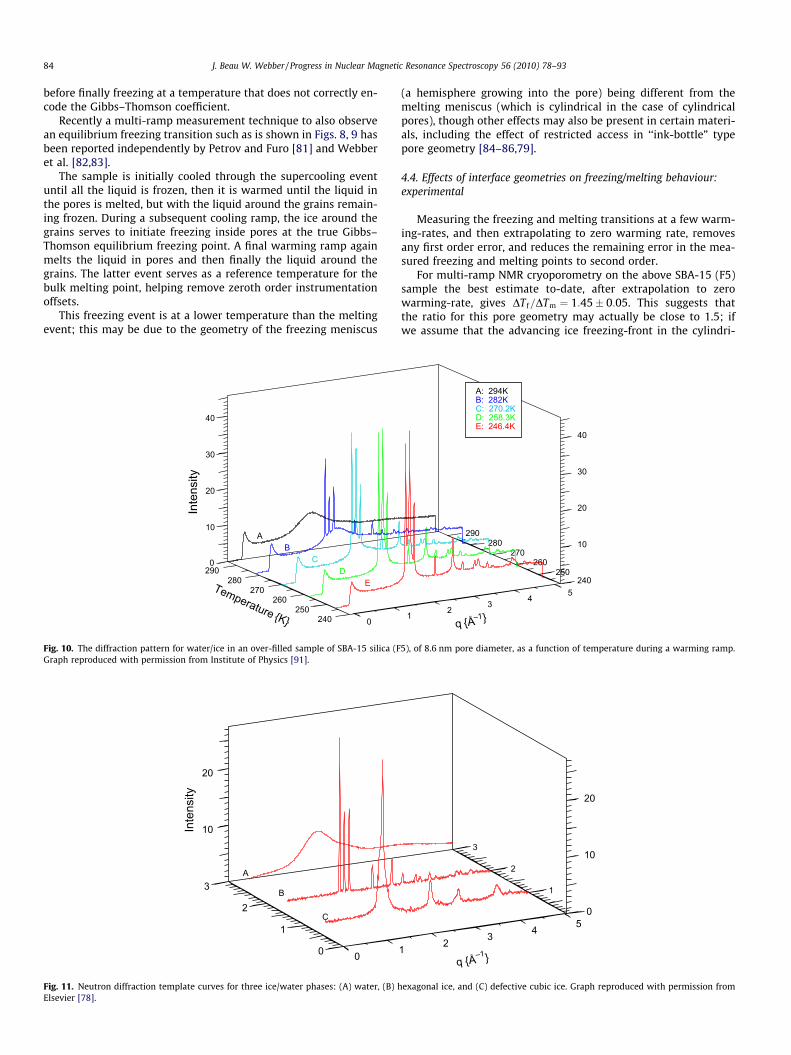
Fig. 10. The diffraction pattern for water/ice in an over-filled sample of SBA-15 silica (FGraph reproduced with permission from Institute of Physics [91].
20
10
0
1
2
3
0
Inte
nsity
A
B
C
Fig. 11. Neutron diffraction template curves for three ice/water phases: (A) water, (B) hElsevier [78].
(a hemisphere growing into the pore) being different from themelting meniscus (which is cylindrical in the case of cylindricalpores), though other effects may also be present in certain materi-als, including the effect of restricted access in ‘‘ink-bottle” typepore geometry [84–86,79].
4.4. Effects of interface geometries on freezing/melting behaviour:experimental
Measuring the freezing and melting transitions at a few warm-ing-rates, and then extrapolating to zero warming rate, removesany first order error, and reduces the remaining error in the mea-sured freezing and melting points to second order.
For multi-ramp NMR cryoporometry on the above SBA-15 (F5)sample the best estimate to-date, after extrapolation to zerowarming-rate, gives DT f=DTm ¼ 1:45� 0:05. This suggests thatthe ratio for this pore geometry may actually be close to 1.5; ifwe assume that the advancing ice freezing-front in the cylindri-
40
30
20
10
240250
260270
280290
1 23 4
5
q {Å–1}
A: 294K B: 282K C: 270.2K D: 258.3K E: 246.4K
5), of 8.6 nm pore diameter, as a function of temperature during a warming ramp.
20
10
0
1
2
3
1 2 3 4 5
q {Å–1}
exagonal ice, and (C) defective cubic ice. Graph reproduced with permission from
0–50–100
1
0.5
0
Cubic Ice
Hexagonal Ice
Plastic Ice
Water
Temperature {C}Fr
actio
n
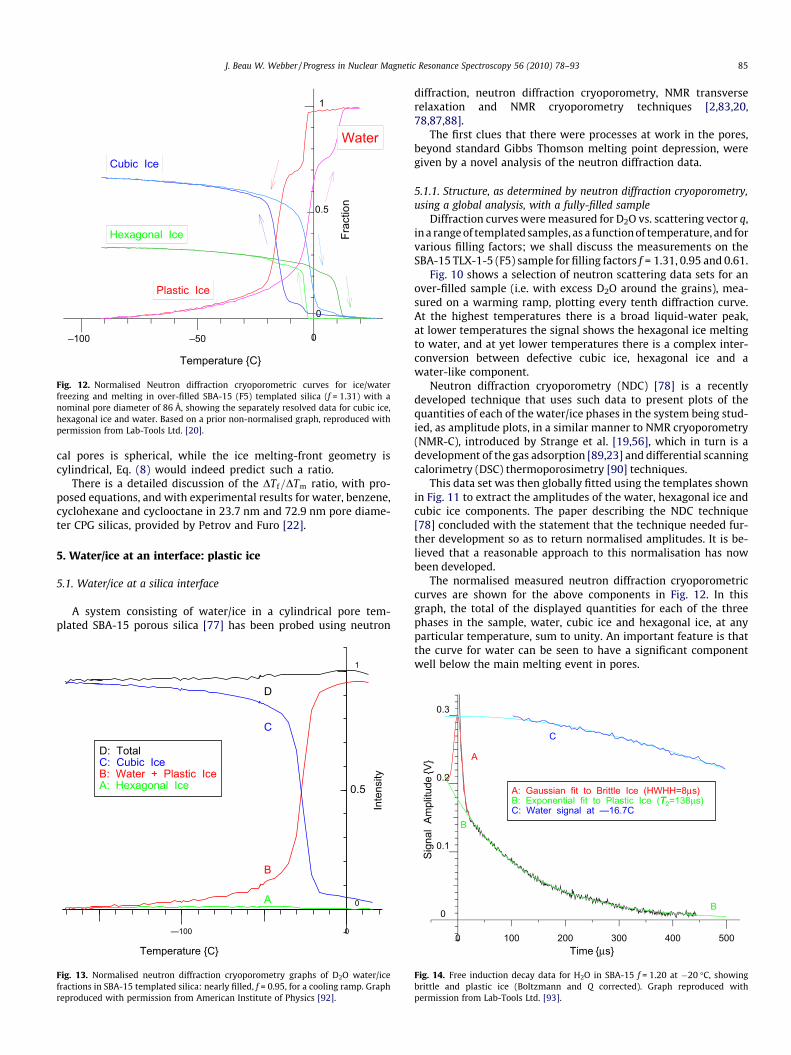
Fig. 12. Normalised Neutron diffraction cryoporometric curves for ice/waterfreezing and melting in over-filled SBA-15 (F5) templated silica (f = 1.31) with anominal pore diameter of 86 Å, showing the separately resolved data for cubic ice,hexagonal ice and water. Based on a prior non-normalised graph, reproduced withpermission from Lab-Tools Ltd. [20].
J. Beau W. Webber / Progress in Nuclear Magnetic Resonance Spectroscopy 56 (2010) 78–93 85
cal pores is spherical, while the ice melting-front geometry iscylindrical, Eq. (8) would indeed predict such a ratio.
There is a detailed discussion of the DT f=DTm ratio, with pro-posed equations, and with experimental results for water, benzene,cyclohexane and cyclooctane in 23.7 nm and 72.9 nm pore diame-ter CPG silicas, provided by Petrov and Furo [22].
5. Water/ice at an interface: plastic ice
5.1. Water/ice at a silica interface
A system consisting of water/ice in a cylindrical pore tem-plated SBA-15 porous silica [77] has been probed using neutron
0–100
1
0.5
0
Temperature {C}
Inte
nsity
D
C
B
A
D: TotalC: Cubic IceB: Water + Plastic IceA: Hexagonal Ice
Fig. 13. Normalised neutron diffraction cryoporometry graphs of D2O water/icefractions in SBA-15 templated silica: nearly filled, f = 0.95, for a cooling ramp. Graphreproduced with permission from American Institute of Physics [92].
diffraction, neutron diffraction cryoporometry, NMR transverserelaxation and NMR cryoporometry techniques [2,83,20,78,87,88].
The first clues that there were processes at work in the pores,beyond standard Gibbs Thomson melting point depression, weregiven by a novel analysis of the neutron diffraction data.
5.1.1. Structure, as determined by neutron diffraction cryoporometry,using a global analysis, with a fully-filled sample
Diffraction curves were measured for D2O vs. scattering vector q,in a range of templated samples, as a function of temperature, and forvarious filling factors; we shall discuss the measurements on theSBA-15 TLX-1-5 (F5) sample for filling factors f = 1.31, 0.95 and 0.61.
Fig. 10 shows a selection of neutron scattering data sets for anover-filled sample (i.e. with excess D2O around the grains), mea-sured on a warming ramp, plotting every tenth diffraction curve.At the highest temperatures there is a broad liquid-water peak,at lower temperatures the signal shows the hexagonal ice meltingto water, and at yet lower temperatures there is a complex inter-conversion between defective cubic ice, hexagonal ice and awater-like component.
Neutron diffraction cryoporometry (NDC) [78] is a recentlydeveloped technique that uses such data to present plots of thequantities of each of the water/ice phases in the system being stud-ied, as amplitude plots, in a similar manner to NMR cryoporometry(NMR-C), introduced by Strange et al. [19,56], which in turn is adevelopment of the gas adsorption [89,23] and differential scanningcalorimetry (DSC) thermoporosimetry [90] techniques.
This data set was then globally fitted using the templates shownin Fig. 11 to extract the amplitudes of the water, hexagonal ice andcubic ice components. The paper describing the NDC technique[78] concluded with the statement that the technique needed fur-ther development so as to return normalised amplitudes. It is be-lieved that a reasonable approach to this normalisation has nowbeen developed.
The normalised measured neutron diffraction cryoporometriccurves are shown for the above components in Fig. 12. In thisgraph, the total of the displayed quantities for each of the threephases in the sample, water, cubic ice and hexagonal ice, at anyparticular temperature, sum to unity. An important feature is thatthe curve for water can be seen to have a significant componentwell below the main melting event in pores.
5004003002001000
0.3
0.2
0.1
0
Time {μs}
Sign
alAm
plitu
de{V
}
A: Gaussian fit to Brittle Ice (HWHH=8μs)B: Exponential fit to Plastic Ice (T2TT =138μs)C: Water signal at –16.7C
A
B
B
C
Fig. 14. Free induction decay data for H2O in SBA-15 f = 1.20 at �20 �C, showingbrittle and plastic ice (Boltzmann and Q corrected). Graph reproduced withpermission from Lab-Tools Ltd. [93].
86 J. Beau W. Webber / Progress in Nuclear Magnetic Resonance Spectroscopy 56 (2010) 78–93
The hexagonal ice can be seen to mainly melt at temperaturesappropriate to bulk D2O ice (allowing for instrumental effects),indicating that it is external to the pores, while the cubic ice meltsat a lowered temperature appropriate to the Gibbs–Thomson melt-ing point reduction in these pores. Thus the ice forming in thesepores is mainly cubic, in accordance with previous studies onsol–gel silicas with pores <30 nm diameter. However, a further10% of the hexagonal ice is also seen to form at a reduced temper-ature, indicating that some of the ice in the pores of the SBA-15incorporates a hexagonal component.
The data clearly also shows a disordered component, that is bestmatched by the water template. However, a study of the actual dif-fraction data shows a difference from the bulk water curves. Thiscomponent exists below the normal Gibbs–Thomson depressedtemperature for D2O water in these pores, extending a further50–80 K, down to around or below 200 K.
As the temperature is further lowered, the amount of the disor-dered component decreases, converting primarily to further cubicice, but some clearly also converts to hexagonal ice. As the temper-ature is again increased, the crystalline ices reversibly transformback to the disordered component, indicating a surprising equilib-rium between the phases. The dynamics of this disordered compo-nent was then investigated by NMR relaxation; this will bediscussed in the next section.
Fig. 12 is a complex graph, and further features will be discussedlater in Section 5.2.2. Fig. 13 shows a normalised graph for the phasefractions for the SBA-15 pores nearly filled with D2O (f = 0.95). In thisgraph, the total of the displayed quantities for each of the threephases in the sample, water, cubic ice and hexagonal ice, at any par-ticular temperature, again sum to unity. A very significant feature ofthis graph is that nearly all the water in the pores converts to cubicice, with only 1% hexagonal ice. It has been known for some time thatthe water in pores less than about 30 nm in diameter tends to formcubic ice, but these fractional plots are very enlightening: this datawill be discussed further in the section on partial filling.
6655443
0.010.01
0.02
0.1
0.2
1
2
10 0C –50C –100C
1000/T {K–1}
T 2TT{m
s}
0C
Cooling
WarmingActivation Enthalpy :810 kJ.mole–1
EnthalpyEnthalpy
Activation Enthalpy :4.6 kJ.mole–1
EnthalpyEnthalpy
x CPMG data
o FID data (T2TT * deconvolved)
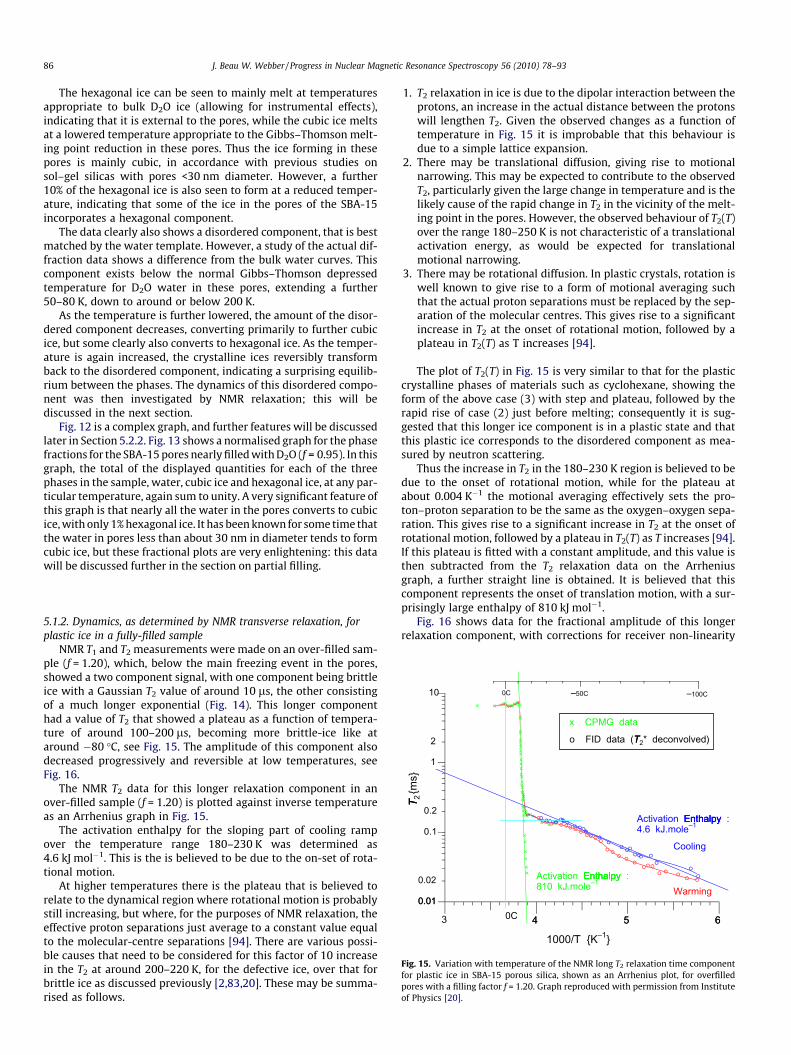
Fig. 15. Variation with temperature of the NMR long T2 relaxation time componentfor plastic ice in SBA-15 porous silica, shown as an Arrhenius plot, for overfilledpores with a filling factor f = 1.20. Graph reproduced with permission from Instituteof Physics [20].
5.1.2. Dynamics, as determined by NMR transverse relaxation, forplastic ice in a fully-filled sample
NMR T1 and T2 measurements were made on an over-filled sam-ple (f = 1.20), which, below the main freezing event in the pores,showed a two component signal, with one component being brittleice with a Gaussian T2 value of around 10 ls, the other consistingof a much longer exponential (Fig. 14). This longer componenthad a value of T2 that showed a plateau as a function of tempera-ture of around 100–200 ls, becoming more brittle-ice like ataround �80 �C, see Fig. 15. The amplitude of this component alsodecreased progressively and reversible at low temperatures, seeFig. 16.
The NMR T2 data for this longer relaxation component in anover-filled sample (f = 1.20) is plotted against inverse temperatureas an Arrhenius graph in Fig. 15.
The activation enthalpy for the sloping part of cooling rampover the temperature range 180–230 K was determined as4.6 kJ mol�1. This is the is believed to be due to the on-set of rota-tional motion.
At higher temperatures there is the plateau that is believed torelate to the dynamical region where rotational motion is probablystill increasing, but where, for the purposes of NMR relaxation, theeffective proton separations just average to a constant value equalto the molecular-centre separations [94]. There are various possi-ble causes that need to be considered for this factor of 10 increasein the T2 at around 200–220 K, for the defective ice, over that forbrittle ice as discussed previously [2,83,20]. These may be summa-rised as follows.
1. T2 relaxation in ice is due to the dipolar interaction between theprotons, an increase in the actual distance between the protonswill lengthen T2. Given the observed changes as a function oftemperature in Fig. 15 it is improbable that this behaviour isdue to a simple lattice expansion.
2. There may be translational diffusion, giving rise to motionalnarrowing. This may be expected to contribute to the observedT2, particularly given the large change in temperature and is thelikely cause of the rapid change in T2 in the vicinity of the melt-ing point in the pores. However, the observed behaviour of T2(T)over the range 180–250 K is not characteristic of a translationalactivation energy, as would be expected for translationalmotional narrowing.
3. There may be rotational diffusion. In plastic crystals, rotation iswell known to give rise to a form of motional averaging suchthat the actual proton separations must be replaced by the sep-aration of the molecular centres. This gives rise to a significantincrease in T2 at the onset of rotational motion, followed by aplateau in T2(T) as T increases [94].
The plot of T2(T) in Fig. 15 is very similar to that for the plasticcrystalline phases of materials such as cyclohexane, showing theform of the above case (3) with step and plateau, followed by therapid rise of case (2) just before melting; consequently it is sug-gested that this longer ice component is in a plastic state and thatthis plastic ice corresponds to the disordered component as mea-sured by neutron scattering.
Thus the increase in T2 in the 180–230 K region is believed to bedue to the onset of rotational motion, while for the plateau atabout 0.004 K�1 the motional averaging effectively sets the pro-ton–proton separation to be the same as the oxygen–oxygen sepa-ration. This gives rise to a significant increase in T2 at the onset ofrotational motion, followed by a plateau in T2(T) as T increases [94].If this plateau is fitted with a constant amplitude, and this value isthen subtracted from the T2 relaxation data on the Arrheniusgraph, a further straight line is obtained. It is believed that thiscomponent represents the onset of translation motion, with a sur-prisingly large enthalpy of 810 kJ mol�1.
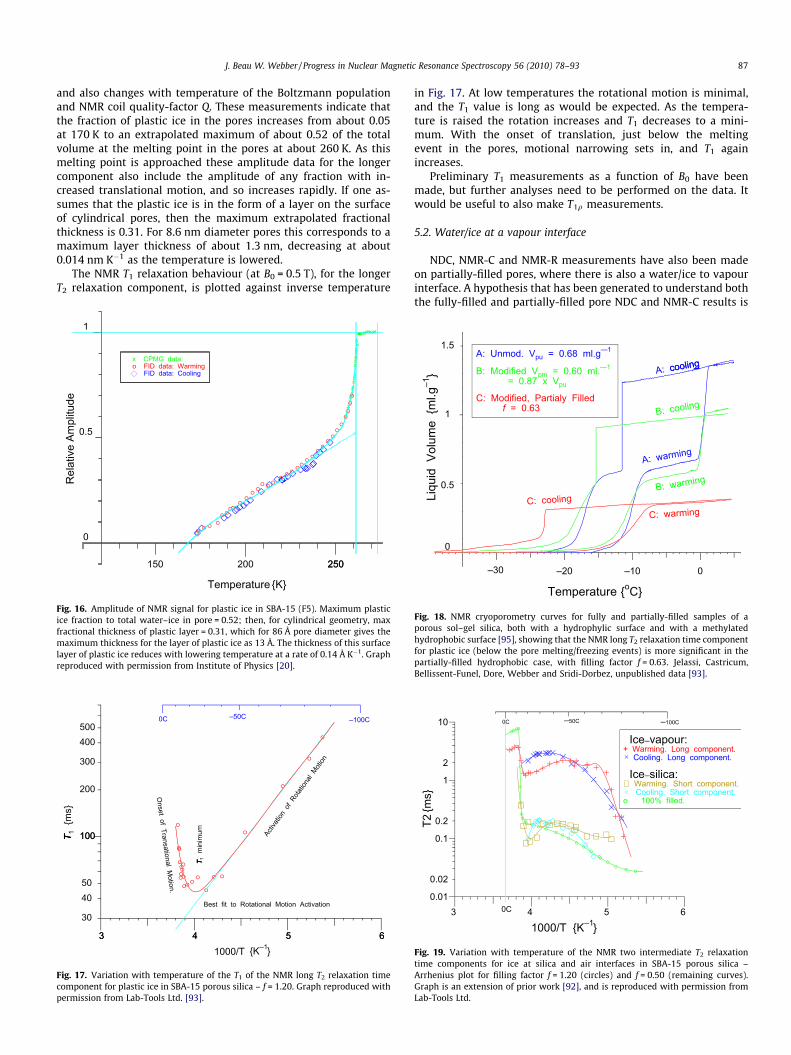
Fig. 16 shows data for the fractional amplitude of this longerrelaxation component, with corrections for receiver non-linearity
J. Beau W. Webber / Progress in Nuclear Magnetic Resonance Spectroscopy 56 (2010) 78–93 87
and also changes with temperature of the Boltzmann populationand NMR coil quality-factor Q. These measurements indicate thatthe fraction of plastic ice in the pores increases from about 0.05at 170 K to an extrapolated maximum of about 0.52 of the totalvolume at the melting point in the pores at about 260 K. As thismelting point is approached these amplitude data for the longercomponent also include the amplitude of any fraction with in-creased translational motion, and so increases rapidly. If one as-sumes that the plastic ice is in the form of a layer on the surfaceof cylindrical pores, then the maximum extrapolated fractionalthickness is 0.31. For 8.6 nm diameter pores this corresponds to amaximum layer thickness of about 1.3 nm, decreasing at about0.014 nm K�1 as the temperature is lowered.
The NMR T1 relaxation behaviour (at B0 = 0.5 T), for the longerT2 relaxation component, is plotted against inverse temperature
250200150
1
0.5
0
Temperature
250
{K}
Rel
ativ
e Am
plitu
de
x CPMG data:o FID data: Warming
FID data: Cooling
Fig. 16. Amplitude of NMR signal for plastic ice in SBA-15 (F5). Maximum plasticice fraction to total water–ice in pore = 0.52; then, for cylindrical geometry, maxfractional thickness of plastic layer = 0.31, which for 86 Å pore diameter gives themaximum thickness for the layer of plastic ice as 13 Å. The thickness of this surfacelayer of plastic ice reduces with lowering temperature at a rate of 0.14 Å K�1. Graphreproduced with permission from Institute of Physics [20].
66554433
30
4050
100100
200
300
400500
0C –50C –100C
1000/T {K–1}
T 1TT{m
s}
T 1TTm
inim
um
Onset
ofTransational
Motion.
Activ
ation
ofRota
tiona
l Motion
Best fit to Rotational Motion Activation
Fig. 17. Variation with temperature of the T1 of the NMR long T2 relaxation timecomponent for plastic ice in SBA-15 porous silica – f = 1.20. Graph reproduced withpermission from Lab-Tools Ltd. [93].
in Fig. 17. At low temperatures the rotational motion is minimal,and the T1 value is long as would be expected. As the tempera-ture is raised the rotation increases and T1 decreases to a mini-mum. With the onset of translation, just below the meltingevent in the pores, motional narrowing sets in, and T1 againincreases.
Preliminary T1 measurements as a function of B0 have beenmade, but further analyses need to be performed on the data. Itwould be useful to also make T1q measurements.
5.2. Water/ice at a vapour interface
NDC, NMR-C and NMR-R measurements have also been madeon partially-filled pores, where there is also a water/ice to vapourinterface. A hypothesis that has been generated to understand boththe fully-filled and partially-filled pore NDC and NMR-C results is
0–10–20–30
1.5
1
0.5
0
Temperature {oC}
Liqu
idVo
lum
e{m
l.g–1
}
A: Unmod. Vpu = 0.68 ml.g–1
B: Modified Vpm = 0.60 ml.–1
= 0.87 x Vpu
C: Modified, Partialy Filledf = 0.63
A: coolingcooling
A: warming
B: cooling
warming
C: cooling
C: warming
Fig. 18. NMR cryoporometry curves for fully and partially-filled samples of aporous sol–gel silica, both with a hydrophylic surface and with a methylatedhydrophobic surface [95], showing that the NMR long T2 relaxation time componentfor plastic ice (below the pore melting/freezing events) is more significant in thepartially-filled hydrophobic case, with filling factor f = 0.63. Jelassi, Castricum,Bellissent-Funel, Dore, Webber and Sridi-Dorbez, unpublished data [93].
65430.01
0.02
0.1
0.2
1
2
10 0C –50C –100C
1000/T {K–1}
T2{m
s}
0C
Ice–vapour:+ Warming. Long component.
Cooling. Long component.
Ice–silica:Warming. Short component.Cooling. Short component.
o 100% filled.
Fig. 19. Variation with temperature of the NMR two intermediate T2 relaxationtime components for ice at silica and air interfaces in SBA-15 porous silica –Arrhenius plot for filling factor f = 1.20 (circles) and f = 0.50 (remaining curves).Graph is an extension of prior work [92], and is reproduced with permission fromLab-Tools Ltd.
–100
1
0.5
0
Temperature {C}
Inte
nsity
Cubic Ice
Hexagonal Ice
Plastic Ice
Water
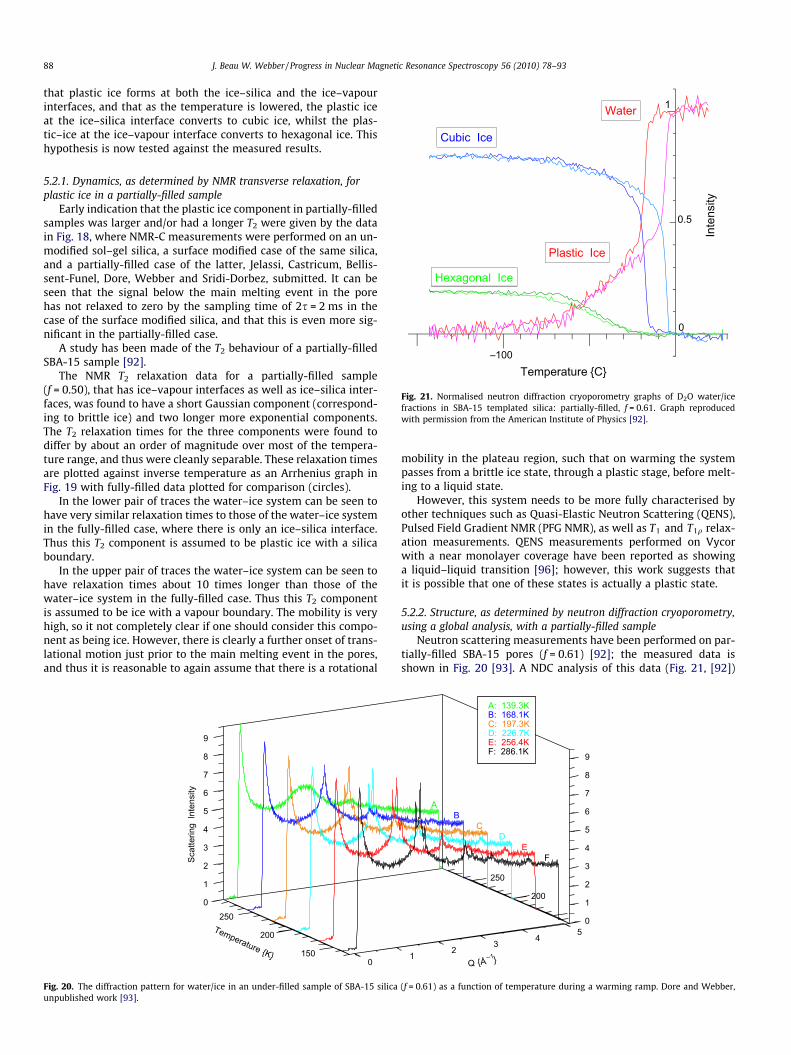
Fig. 21. Normalised neutron diffraction cryoporometry graphs of D2O water/icefractions in SBA-15 templated silica: partially-filled, f = 0.61. Graph reproducedwith permission from the American Institute of Physics [92].
88 J. Beau W. Webber / Progress in Nuclear Magnetic Resonance Spectroscopy 56 (2010) 78–93
that plastic ice forms at both the ice–silica and the ice–vapourinterfaces, and that as the temperature is lowered, the plastic iceat the ice–silica interface converts to cubic ice, whilst the plas-tic–ice at the ice–vapour interface converts to hexagonal ice. Thishypothesis is now tested against the measured results.
5.2.1. Dynamics, as determined by NMR transverse relaxation, forplastic ice in a partially-filled sample
Early indication that the plastic ice component in partially-filledsamples was larger and/or had a longer T2 were given by the datain Fig. 18, where NMR-C measurements were performed on an un-modified sol–gel silica, a surface modified case of the same silica,and a partially-filled case of the latter, Jelassi, Castricum, Bellis-sent-Funel, Dore, Webber and Sridi-Dorbez, submitted. It can beseen that the signal below the main melting event in the porehas not relaxed to zero by the sampling time of 2s = 2 ms in thecase of the surface modified silica, and that this is even more sig-nificant in the partially-filled case.
A study has been made of the T2 behaviour of a partially-filledSBA-15 sample [92].
The NMR T2 relaxation data for a partially-filled sample(f = 0.50), that has ice–vapour interfaces as well as ice–silica inter-faces, was found to have a short Gaussian component (correspond-ing to brittle ice) and two longer more exponential components.The T2 relaxation times for the three components were found todiffer by about an order of magnitude over most of the tempera-ture range, and thus were cleanly separable. These relaxation timesare plotted against inverse temperature as an Arrhenius graph inFig. 19 with fully-filled data plotted for comparison (circles).
In the lower pair of traces the water–ice system can be seen tohave very similar relaxation times to those of the water–ice systemin the fully-filled case, where there is only an ice–silica interface.Thus this T2 component is assumed to be plastic ice with a silicaboundary.
In the upper pair of traces the water–ice system can be seen tohave relaxation times about 10 times longer than those of thewater–ice system in the fully-filled case. Thus this T2 componentis assumed to be ice with a vapour boundary. The mobility is veryhigh, so it not completely clear if one should consider this compo-nent as being ice. However, there is clearly a further onset of trans-lational motion just prior to the main melting event in the pores,and thus it is reasonable to again assume that there is a rotational
9
8
7
6
5
4
3
2
1
0250
200
1500
Temperature {K}
Scat
terin
g In
tens
ity
Fig. 20. The diffraction pattern for water/ice in an under-filled sample of SBA-15 silicaunpublished work [93].
mobility in the plateau region, such that on warming the systempasses from a brittle ice state, through a plastic stage, before melt-ing to a liquid state.
However, this system needs to be more fully characterised byother techniques such as Quasi-Elastic Neutron Scattering (QENS),Pulsed Field Gradient NMR (PFG NMR), as well as T1 and T1q relax-ation measurements. QENS measurements performed on Vycorwith a near monolayer coverage have been reported as showinga liquid–liquid transition [96]; however, this work suggests thatit is possible that one of these states is actually a plastic state.
5.2.2. Structure, as determined by neutron diffraction cryoporometry,using a global analysis, with a partially-filled sample
Neutron scattering measurements have been performed on par-tially-filled SBA-15 pores (f = 0.61) [92]; the measured data isshown in Fig. 20 [93]. A NDC analysis of this data (Fig. 21, [92])
9
8
7
6
5
4
3
2
1
0
250
200
12
34
5
Q {Å–1}
A: 139.3K B: 168.1K C: 197.3K D: 226.7K E: 256.4K F: 286.1K
AB
CD
EF
(f = 0.61) as a function of temperature during a warming ramp. Dore and Webber,
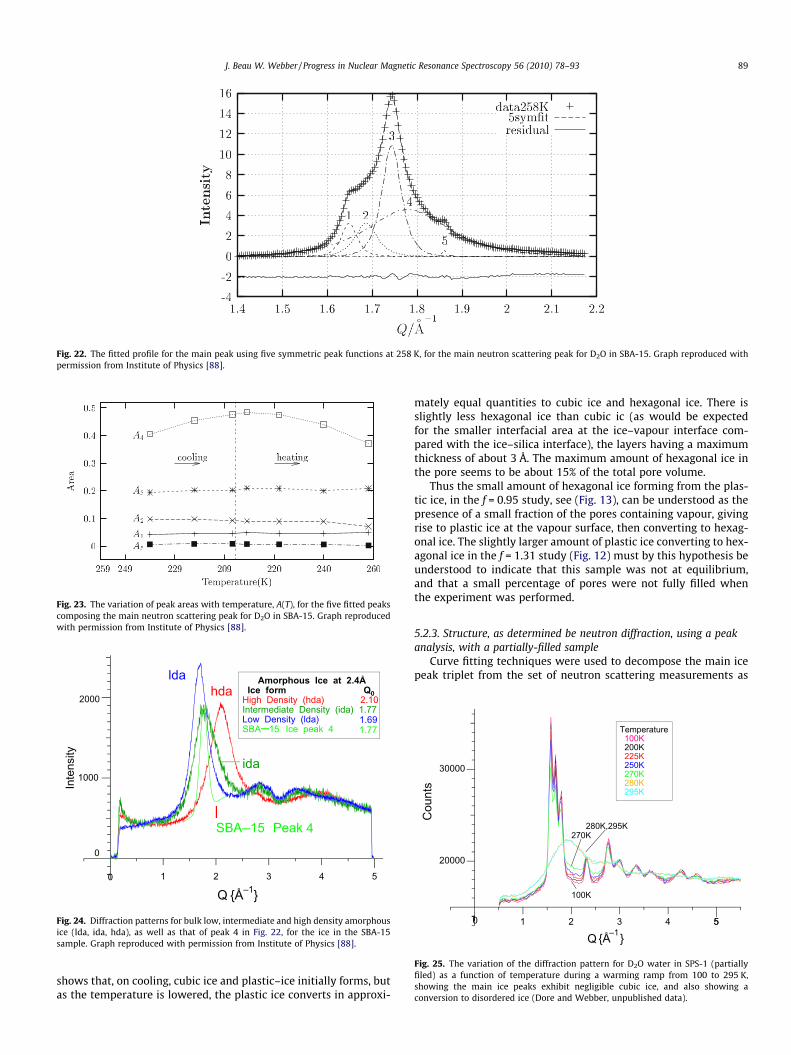
Fig. 22. The fitted profile for the main peak using five symmetric peak functions at 258 K, for the main neutron scattering peak for D2O in SBA-15. Graph reproduced withpermission from Institute of Physics [88].
Fig. 23. The variation of peak areas with temperature, A(T), for the five fitted peakscomposing the main neutron scattering peak for D2O in SBA-15. Graph reproducedwith permission from Institute of Physics [88].
543210
2000
1000
0
Q {Å–1}
Inte
nsity
lda
ida
hda
SBA–15 Peak 4
Amorphous Ice at 2.4ÅIce form Q0
High Density (hda) 2.10Intermediate Density (ida) 1.77Low Density (lda) 1.69SBA–15 Ice peak 4 1.77
Fig. 24. Diffraction patterns for bulk low, intermediate and high density amorphousice (lda, ida, hda), as well as that of peak 4 in Fig. 22, for the ice in the SBA-15sample. Graph reproduced with permission from Institute of Physics [88].
5543210
30000
20000
Q {Å–1}
Cou
nts
270K280K,295K
100K
Temperature100K200K225K250K270K280K295K
Fig. 25. The variation of the diffraction pattern for D2O water in SPS-1 (partiallyfiled) as a function of temperature during a warming ramp from 100 to 295 K,showing the main ice peaks exhibit negligible cubic ice, and also showing aconversion to disordered ice (Dore and Webber, unpublished data).
J. Beau W. Webber / Progress in Nuclear Magnetic Resonance Spectroscopy 56 (2010) 78–93 89
shows that, on cooling, cubic ice and plastic–ice initially forms, butas the temperature is lowered, the plastic ice converts in approxi-
mately equal quantities to cubic ice and hexagonal ice. There isslightly less hexagonal ice than cubic ic (as would be expectedfor the smaller interfacial area at the ice–vapour interface com-pared with the ice–silica interface), the layers having a maximumthickness of about 3 Å. The maximum amount of hexagonal ice inthe pore seems to be about 15% of the total pore volume.
Thus the small amount of hexagonal ice forming from the plas-tic ice, in the f = 0.95 study, see (Fig. 13), can be understood as thepresence of a small fraction of the pores containing vapour, givingrise to plastic ice at the vapour surface, then converting to hexag-onal ice. The slightly larger amount of plastic ice converting to hex-agonal ice in the f = 1.31 study (Fig. 12) must by this hypothesis beunderstood to indicate that this sample was not at equilibrium,and that a small percentage of pores were not fully filled whenthe experiment was performed.
5.2.3. Structure, as determined be neutron diffraction, using a peakanalysis, with a partially-filled sample
Curve fitting techniques were used to decompose the main icepeak triplet from the set of neutron scattering measurements as
90 J. Beau W. Webber / Progress in Nuclear Magnetic Resonance Spectroscopy 56 (2010) 78–93
per Fig. 13, i.e. on a ‘nearly filled’ sample [88]; these indicate that,following the removal of any residual hexagonal ice scatteringpeaks, the remaining cubic peak be represented not as three peaksbut as five, as shown in Fig. 22.
An analysis of the variation with temperature of the peak areasof the five fitted peaks plotted in Fig. 22 reveals that only one of thefive (the broad component peak 4), has a significant amplitude var-iation, as shown in Fig. 23, increasing at low temperature andreversibly decreasing as the temperature is again raised. It is worthnoting that bulk amorphous ice may be prepared with a range ofdensities [97–101] and Fig. 24 shows a set of diffraction data fromlow, intermediate and high density amorphous ice (lda, ida, hda)with Q0 values ranging from 1.69 to 2.10 Å�1 [102]. It is clear thatthe peak 4 in Fig. 22, with a Q0 value of 1.768 Å�1, is well matchedin peak position by an intermediate density amorphous ice, but notin peak width.
Thus a tentative conclusion is that the disordered plastic icecomponent at a silica interface at least partially converts to anintermediate density amorphous ice, represented by fitted peak 4of the cubic ice pattern in Fig. 22, as the temperature is lowered,and then reversibly transforms back to the disordered form asthe temperature is again raised. Further evidence for this conclu-sion is provided in the next section.
1100
1
0
Radiu
d(r)
a
b
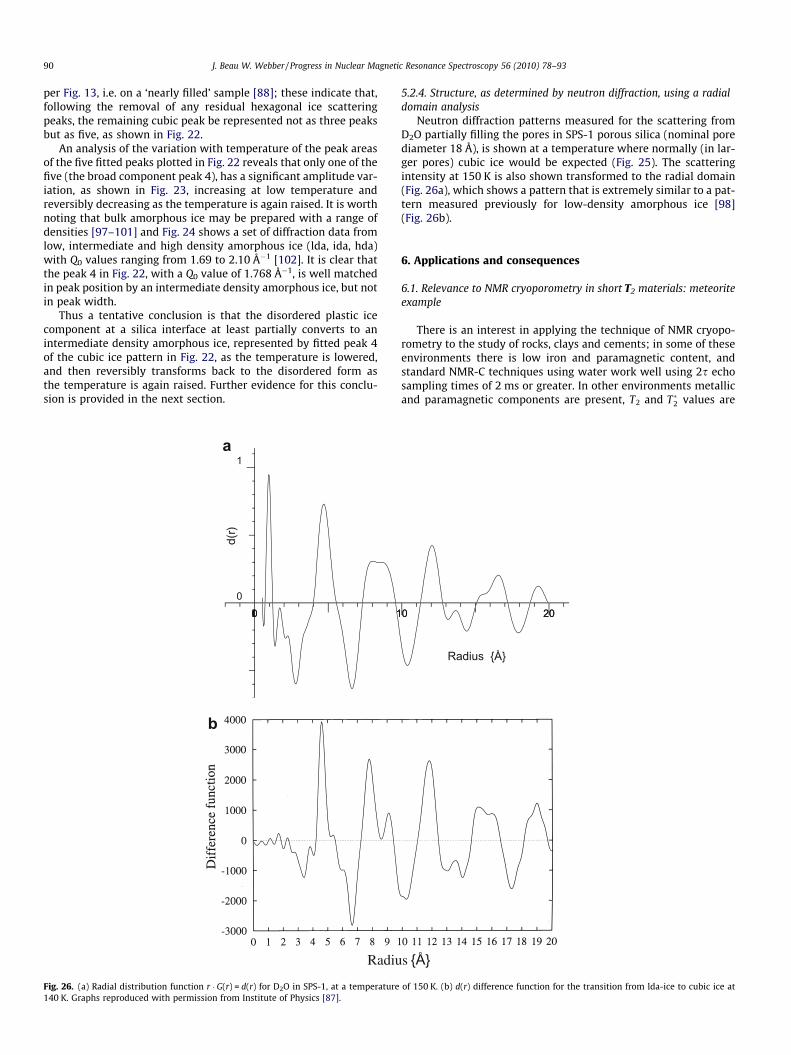
Fig. 26. (a) Radial distribution function r G(r) = d(r) for D2O in SPS-1, at a temperature140 K. Graphs reproduced with permission from Institute of Physics [87].
5.2.4. Structure, as determined by neutron diffraction, using a radialdomain analysis
Neutron diffraction patterns measured for the scattering fromD2O partially filling the pores in SPS-1 porous silica (nominal porediameter 18 Å), is shown at a temperature where normally (in lar-ger pores) cubic ice would be expected (Fig. 25). The scatteringintensity at 150 K is also shown transformed to the radial domain(Fig. 26a), which shows a pattern that is extremely similar to a pat-tern measured previously for low-density amorphous ice [98](Fig. 26b).
6. Applications and consequences
6.1. Relevance to NMR cryoporometry in short T2 materials: meteoriteexample
There is an interest in applying the technique of NMR cryopo-rometry to the study of rocks, clays and cements; in some of theseenvironments there is low iron and paramagnetic content, andstandard NMR-C techniques using water work well using 2s echosampling times of 2 ms or greater. In other environments metallicand paramagnetic components are present, T2 and T�2 values are
202000
Radius {Å}
s {Å}
of 150 K. (b) d(r) difference function for the transition from lda-ice to cubic ice at
(a)
(b)
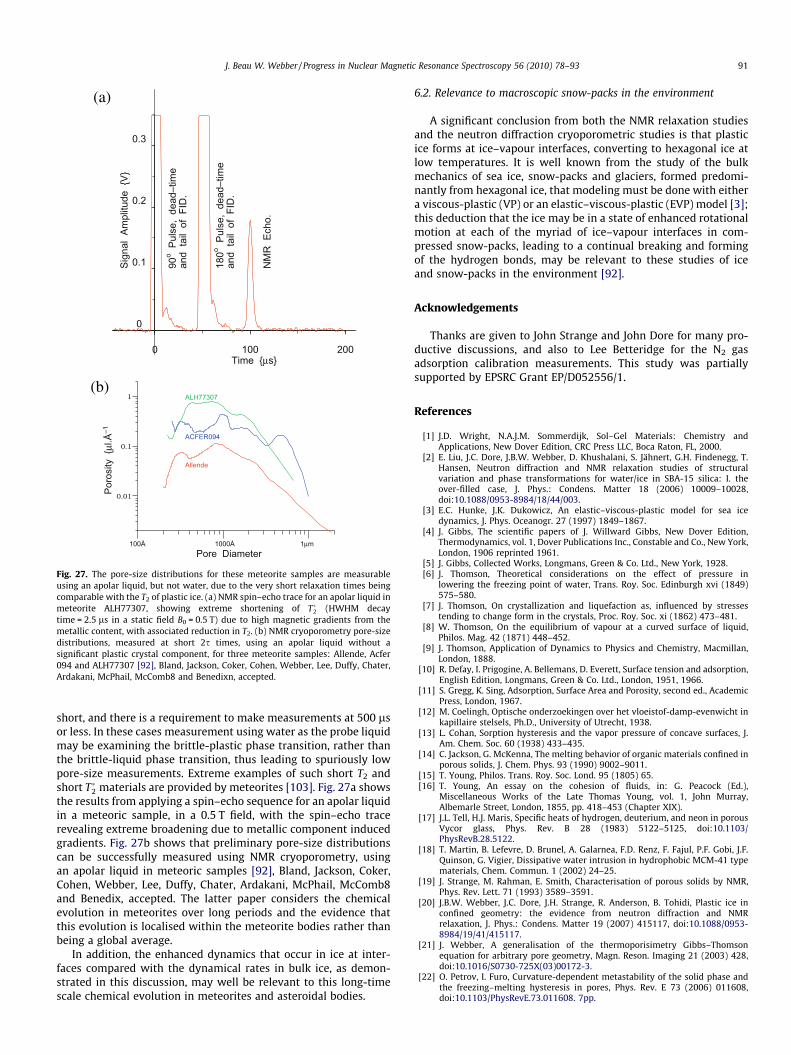
Fig. 27. The pore-size distributions for these meteorite samples are measurableusing an apolar liquid, but not water, due to the very short relaxation times beingcomparable with the T2 of plastic ice. (a) NMR spin–echo trace for an apolar liquid inmeteorite ALH77307, showing extreme shortening of T�2 (HWHM decaytime = 2.5 ls in a static field B0 = 0.5 T) due to high magnetic gradients from themetallic content, with associated reduction in T2. (b) NMR cryoporometry pore-sizedistributions, measured at short 2s times, using an apolar liquid without asignificant plastic crystal component, for three meteorite samples: Allende, Acfer094 and ALH77307 [92], Bland, Jackson, Coker, Cohen, Webber, Lee, Duffy, Chater,Ardakani, McPhail, McComb8 and Benedixn, accepted.
J. Beau W. Webber / Progress in Nuclear Magnetic Resonance Spectroscopy 56 (2010) 78–93 91
short, and there is a requirement to make measurements at 500 lsor less. In these cases measurement using water as the probe liquidmay be examining the brittle-plastic phase transition, rather thanthe brittle-liquid phase transition, thus leading to spuriously lowpore-size measurements. Extreme examples of such short T2 andshort T�2 materials are provided by meteorites [103]. Fig. 27a showsthe results from applying a spin–echo sequence for an apolar liquidin a meteoric sample, in a 0.5 T field, with the spin–echo tracerevealing extreme broadening due to metallic component inducedgradients. Fig. 27b shows that preliminary pore-size distributionscan be successfully measured using NMR cryoporometry, usingan apolar liquid in meteoric samples [92], Bland, Jackson, Coker,Cohen, Webber, Lee, Duffy, Chater, Ardakani, McPhail, McComb8and Benedix, accepted. The latter paper considers the chemicalevolution in meteorites over long periods and the evidence thatthis evolution is localised within the meteorite bodies rather thanbeing a global average.
In addition, the enhanced dynamics that occur in ice at inter-faces compared with the dynamical rates in bulk ice, as demon-strated in this discussion, may well be relevant to this long-timescale chemical evolution in meteorites and asteroidal bodies.
6.2. Relevance to macroscopic snow-packs in the environment
A significant conclusion from both the NMR relaxation studiesand the neutron diffraction cryoporometric studies is that plasticice forms at ice–vapour interfaces, converting to hexagonal ice atlow temperatures. It is well known from the study of the bulkmechanics of sea ice, snow-packs and glaciers, formed predomi-nantly from hexagonal ice, that modeling must be done with eithera viscous-plastic (VP) or an elastic–viscous-plastic (EVP) model [3];this deduction that the ice may be in a state of enhanced rotationalmotion at each of the myriad of ice–vapour interfaces in com-pressed snow-packs, leading to a continual breaking and formingof the hydrogen bonds, may be relevant to these studies of iceand snow-packs in the environment [92].
Acknowledgements
Thanks are given to John Strange and John Dore for many pro-ductive discussions, and also to Lee Betteridge for the N2 gasadsorption calibration measurements. This study was partiallysupported by EPSRC Grant EP/D052556/1.
References
[1] J.D. Wright, N.A.J.M. Sommerdijk, Sol–Gel Materials: Chemistry andApplications, New Dover Edition, CRC Press LLC, Boca Raton, FL, 2000.
[2] E. Liu, J.C. Dore, J.B.W. Webber, D. Khushalani, S. Jähnert, G.H. Findenegg, T.Hansen, Neutron diffraction and NMR relaxation studies of structuralvariation and phase transformations for water/ice in SBA-15 silica: I. theover-filled case, J. Phys.: Condens. Matter 18 (2006) 10009–10028,doi:10.1088/0953-8984/18/44/003.
[3] E.C. Hunke, J.K. Dukowicz, An elastic–viscous-plastic model for sea icedynamics, J. Phys. Oceanogr. 27 (1997) 1849–1867.
[4] J. Gibbs, The scientific papers of J. Willward Gibbs, New Dover Edition,Thermodynamics, vol. 1, Dover Publications Inc., Constable and Co., New York,London, 1906 reprinted 1961.
[5] J. Gibbs, Collected Works, Longmans, Green & Co. Ltd., New York, 1928.[6] J. Thomson, Theoretical considerations on the effect of pressure in
lowering the freezing point of water, Trans. Roy. Soc. Edinburgh xvi (1849)575–580.
[7] J. Thomson, On crystallization and liquefaction as, influenced by stressestending to change form in the crystals, Proc. Roy. Soc. xi (1862) 473–481.
[8] W. Thomson, On the equilibrium of vapour at a curved surface of liquid,Philos. Mag. 42 (1871) 448–452.
[9] J. Thomson, Application of Dynamics to Physics and Chemistry, Macmillan,London, 1888.
[10] R. Defay, I. Prigogine, A. Bellemans, D. Everett, Surface tension and adsorption,English Edition, Longmans, Green & Co. Ltd., London, 1951, 1966.
[11] S. Gregg, K. Sing, Adsorption, Surface Area and Porosity, second ed., AcademicPress, London, 1967.
[12] M. Coelingh, Optische onderzoekingen over het vloeistof-damp-evenwicht inkapillaire stelsels, Ph.D., University of Utrecht, 1938.
[13] L. Cohan, Sorption hysteresis and the vapor pressure of concave surfaces, J.Am. Chem. Soc. 60 (1938) 433–435.
[14] C. Jackson, G. McKenna, The melting behavior of organic materials confined inporous solids, J. Chem. Phys. 93 (1990) 9002–9011.
[15] T. Young, Philos. Trans. Roy. Soc. Lond. 95 (1805) 65.[16] T. Young, An essay on the cohesion of fluids, in: G. Peacock (Ed.),
Miscellaneous Works of the Late Thomas Young, vol. 1, John Murray,Albemarle Street, London, 1855, pp. 418–453 (Chapter XIX).
[17] J.L. Tell, H.J. Maris, Specific heats of hydrogen, deuterium, and neon in porousVycor glass, Phys. Rev. B 28 (1983) 5122–5125, doi:10.1103/PhysRevB.28.5122.
[18] T. Martin, B. Lefevre, D. Brunel, A. Galarnea, F.D. Renz, F. Fajul, P.F. Gobi, J.F.Quinson, G. Vigier, Dissipative water intrusion in hydrophobic MCM-41 typematerials, Chem. Commun. 1 (2002) 24–25.
[19] J. Strange, M. Rahman, E. Smith, Characterisation of porous solids by NMR,Phys. Rev. Lett. 71 (1993) 3589–3591.
[20] J.B.W. Webber, J.C. Dore, J.H. Strange, R. Anderson, B. Tohidi, Plastic ice inconfined geometry: the evidence from neutron diffraction and NMRrelaxation, J. Phys.: Condens. Matter 19 (2007) 415117, doi:10.1088/0953-8984/19/41/415117.
[21] J. Webber, A generalisation of the thermoporisimetry Gibbs–Thomsonequation for arbitrary pore geometry, Magn. Reson. Imaging 21 (2003) 428,doi:10.1016/S0730-725X(03)00172-3.
[22] O. Petrov, I. Furo, Curvature-dependent metastability of the solid phase andthe freezing–melting hysteresis in pores, Phys. Rev. E 73 (2006) 011608,doi:10.1103/PhysRevE.73.011608. 7pp.
92 J. Beau W. Webber / Progress in Nuclear Magnetic Resonance Spectroscopy 56 (2010) 78–93
[23] E. Barret, L. Joyner, P. Halenda, The determination of pore volume and areadistributions in porous substances. I. Computations from nitrogen isotherms,J. Am. Chem. Soc. 73 (1951) 373–380.
[24] J. Webber, The characterisation of porous media, Ph.D. Thesis, Department ofPhysics, University of Kent at Canterbury, UK, 2000. Available from: <http://www.kent.ac.uk/physical-sciences/publications/theses/jbww.html>.
[25] E.W. Hansen, R. Schmidt, M. Stocker, Pore structure characterization ofporous silica by 1H NMR using water, benzene, and cyclohexane as probemolecules, J. Phys. Chem-US 100 (1996) 11396–11401.
[26] S. Bahceli, A. Al-Kaisi, K. Krynicki, J. Strange, The effects of pore and particlegeometry on NMR diffusion measurements in adsorbed liquids, in: F.Rodriguez-Reinoso, J. Rouquerol, K. Sing, K. Unger (Eds.), Characterisation ofPorous Solids II, Studies in Surface Science and Catalysis, vol. 62, Elsevier,Amsterdam, 1991, pp. 293–300.
[27] S. Allen, M. Mallett, J. Strange, Morphology of porous media studied bynuclear magnetic resonance line shapes and spin–echo decays, J. Chem. Phys.114 (2001) 3258–3264.
[28] N. Lisitza, Y. Song, Manipulation of the diffusion eigenmodes in porous media,Phys. Rev. B 65 (2002) 172406, doi:10.1103/PhysRevB.65.172406.
[29] R.C. Wilson, M.D. Huerlimann, Relationship between susceptibility inducedfield inhomogeneities, restricted diffusion, and relaxation in sedimentaryrocks, J. Magn. Reson. 183 (2006) 1–12, doi:10.1016/j.jmr.2006.07.006.
[30] J.-F. Kuntz, P. Palmas, V. Level, D. Canet, Restricted diffusion and exchange ofwater in porous media: average structure determination and size distributionresolved from the effect of local field gradients on the proton NMR spectrum,J. Magn. Reson. 191 (2008) 239–247, doi:10.1016/j.jmr.2007.12.020.
[31] E.E. Sigmund, H. Cho, P. Chen, S. Byrnes, Y.Q. Song, X.E. Guo, T.R. Brown,Diffusion-based MR methods for bone structure and evolution, Magn. Reson.Med. 59 (2008) 28–39, doi:10.1002/mrm.21281.
[32] K.E. Washburn, C.D. Eccles, P.T. Callaghan, The dependence on magnetic fieldstrength of correlated internal gradient relaxation time distributions inheterogeneous materials, J. Magn. Reson. 194 (2008) 33–40, doi:10.1016/j.jmr.2008.05.025.
[33] K. Brownstein, C. Tarr, Spin–lattice relaxation in a system governed bydiffusion, J. Magn. Resn. 26 (1977) 17–24.
[34] W. Halperin, S. Bhattacharja, F. d’Orazio, Relaxation and dynamic propertiesof water in partly filled porous media using NMR techniques, Magn. Reson.Imaging 9 (1991) 733–737.
[35] J. Strange, S. Allen, P. Stephenson, N. Matveeva, Phase equilibria of absorbedliquids and the structure of porous media, Magn. Reson. Imaging 14 (1996)963–965, doi:10.1016/S0730-725X(96)00196-8.
[36] S. Stapf, R. Kimmich, R.-O. Seitter, Field-cycling NMR relaxometry of liquidsconfined in porous glass: evidence for Levy-walks, Magn. Reson. Imaging 14(1996) 841–846.
[37] S. Allen, P. Stephenson, J. Strange, Internal surfaces of porous media studiedby nuclear magnetic resonance cryoporometry, J. Chem. Phys. 108 (1998)8195–8198, doi:10.1063/1.476175.
[38] H. Booth, J. Strange, Microdynamics and phase equilibria in organicnanocrystals, Magn. Reson. Imaging 16 (1998) 501–504, doi:10.1016/S0730-725X(98)00066-6.
[39] H. Booth, J. Strange, Organic nanocrystals: an NMR study of cyclohexane inporous silica, Mol. Phys. 93 (1998) 263–269, doi:10.1080/002689798169267.
[40] P. Levitz, J.-P. Korb, D. Petit, Slow dynamics of embedded fluid in mesoscopicconfining systems as probed by NMR relaxometry, Eur. Phys. J. E 12 (2003)29–33.
[41] J. Strange, J. Mitchell, J. Webber, Pore surface exploration by NMR, Magn.Reson. Imaging 21 (2003) 221–226, doi:10.1016/S0730-725X(03)00128-0.
[42] S. Alnaimi, J. Mitchell, J. Strange, J. Webber, Binary liquid mixtures in poroussolids, J. Chem. Phys. 120 (2004) 2075–2077, doi:10.1063/1.1643730.
[43] P. Sebastiao, D. Sousa, A. Ribeiro, M. Vilfan, G. Lahajnar, J. Seliger, S. Zumer,Field-cycling NMR relaxometry of a liquid crystal above T–Ni in mesoscopicconfinement, Phys. Rev. E 72 (2005) 061702, doi:10.1103/PhysRevE.72.061702.
[44] H. Jaffel, J.-P. Korb, J.-P. Ndobo-Epoy, J.-P. Guicquero, V. Morin, Multi-scaleapproach continuously relating the microstructure and the macroscopicmechanical properties of plaster pastes during their settings, J. Phys. Chem.110 (2006) 18401–18407, doi:10.1021/jp062832a.
[45] J.-P. Korb, Surface diffusion of liquids in disordered nanopores and materials:a field cycling relaxometry approach, in: W.C. Conner, J. Fraissard (Eds.), FluidTransport in Nanoporous Materials, Nato Science Series, vol. 219, Series II:Mathematics, Physics and Chemistry, 2006, pp. 415–437, Conference of theNATO-Advanced-Study-Institute on Fluid Transport in Nanoporous Materials,La Colle sur Loup, France, June 16–28, 2003.
[46] P.J. McDonald, J. Mitchell, M. Mulheron, P.S. Aptaker, J.-P. Korb, L. Monteilhet,Two-dimensional correlation relaxometry studies of cement pastesperformed using a new one-sided NMR magnet, Cement Concrete Res. 37(2007) 303–309, doi:10.1016/j.cemconres.2006.01.013.
[47] W. Schoenfelder, H.-R. Glaeser, I. Mitreiter, F. Stallmach, Two-dimensionalNMR relaxometry study of pore space characteristics of carbonate rocks froma Permian aquifer, J. Appl. Geophys. 65 (2008) 21–29, doi:10.1016/j.jappgeo.2008.03.005.
[48] K. Overloop, L. van Gerven, Freezing phenomena in adsorbed water as studiedby NMR, J. Magn. Reson. 101 (1993) 179–187, doi:10.1006/jmra.1993.1028.
[49] S. Alnaimi, J. Strange, E. Smith, The characterisation of porous solids by NMR,Magn. Reson. Imaging 12 (1994) 257–259.
[50] E. Hansen, M. Stocker, R. Schmidt, Low-temperature phase transition of waterconfined in mesopores probed by NMR: Influence on pore size distribution, J.Phys. Chem. US 100 (1996) 2195–2200.
[51] J. Webber, J. Strange, J. Dore, An evaluation of NMR cryoporometry, densitymeasurement and neutron scattering methods of pore characterisation,Magn. Reson. Imaging 19 (2001) 395–399, doi:10.1016/S0730-725X(01)00255-7.
[52] J. Mitchell, S. Stark, J. Strange, Probing surface interactions by combining NMRcryoporometry and NMR relaxometry, J. Phys. D 38 (2005) 1950–1958,doi:10.1088/0022-3727/38/12/015.
[53] J.-D. Jeon, S.-Y. Kwak, Ionic cluster size distributions of swollen nafion/sulfated beta-cyclodextrin membranes characterized by nuclear magneticresonance cryoporometry, J. Phys. Chem. 111 (2007) 9437–9443,doi:10.1021/jp070980a.
[54] A. Khokhlov, R. Valiullin, J. Kaerger, F. Steinbach, A. Feldhoff, Freezing andmelting transitions of liquids in mesopores with ink-bottle geometry, New J.Phys. 9 (2007) 272, doi:10.1088/1367-2630/9/8/272.
[55] D. Vargas-Florencia, I. Furo, R.W. Corkery, Pore morphology andinterconnectivity in a mesoporous/macroporous polyhedral silica foammaterial, Langmuir 24 (2008) 4827–4832. doi:10.1021/la702318y.
[56] J. Mitchell, J.B.W. Webber, J. Strange, Nuclear magnetic resonancecryoporometry, Phys. Rep. 461 (2008) 1–36, doi:10.1016/j.physrep.2008.02.001.
[57] O.V. Petrov, I. Furo, NMR cryoporometry: principles, applications andpotential, Prog. Nucl. Magn. Reson. Spectrosc. 54 (2009) 97–122,doi:10.1016/j.pnmrs.2008.06.001.
[58] A. Mitzithras, F. Coveney, J. Strange, NMR-studies of the diffusion ofcyclohexane in porous silica, J. Mol. Liq. 54 (1992) 273–281.
[59] S. Codd, P. Callaghan, Spin–echo analysis of restricted diffusion undergeneralized gradient waveforms: planar, cylindrical, and spherical poreswith wall relaxivity, J. Magn. Reson. 137 (1999) 358–372.
[60] F. Stallmach, J. Kärger, The potentials of pulsed field gradient NMR forinvestigation of porous media, Adsorption 5 (1999) 117–133.
[61] H. Paoli, A. Methivier, H. Jobic, C. Krause, H. Pfeifer, F. Stallmach, J. Kärger,Comparative QENS and PFG NMR diffusion studies of water in zeolite NaCaA,Micropor. Mesopor. Mater. 55 (2002) 147–158.
[62] R. Kimmich, Strange kinetics, porous media, and NMR, Chem. Phys. 284(2002) 253–285, doi:10.1016/S0301-0104(02)00552-9.
[63] P. Callaghan, S. Godefroy, B. Ryland, Diffusion-relaxation correlation in simplepore structures, J. Magn. Reson. 162 (2003) 320–327.
[64] R. Valiullin, I. Furo, V. Skirda, P. Kortunov, NMR magnetization transfer as atool for characterization of nanoporous materials, Magn. Reson. Imaging 21(2003) 299–303, Proceedings of the Sixth International Conference on theRecent Advances in Magnetic Resonance Applications to Porous Media, Ulm,Germany, September 8–12, 2002. doi:10.1016/S0730-725X(03)00158-9.
[65] J. Petkovic, H. Huinink, L. Pel, K. Kopinga, Diffusion in porous buildingmaterials with high internal magnetic field gradients, J. Magn. Reson. 167(2004) 97–106, doi:10.1016/j.jmr.2003.11.007.
[66] M. Flaum, G. Hirasaki, C. Flaum, C. Straley, Measuring pore connectivity bypulsed field gradient diffusion editing with hydrocarbon gases, Magn. Reson.Imaging 23 (2005) 337–339, Proceedings of the Seventh InternationalConference on Magnetic Resonance in Porous Media (MRPM7), Palaiseau,France, July 4–8, 2004. doi:10.1016/j.mri.2005.01.002.
[67] G. Farrher, I. Ardelean, R. Kimmich, Probing four orders of magnitude of thediffusion time in porous silica glass with unconventional NMR techniques, J.Magn. Reson. 182 (2006) 215–220, doi:10.1016/j.jmr.2006.06.032.
[68] H. Jobic, W. Schmidt, C. Krause, J. Kärger, PFG NMR and QENS diffusion studyof n-alkane homologues in MFI-type zeolites, Micropor. Mesopor. Mater. 90(2006) 299–306, doi:10.1016/j.micromeso.2005.10.020.
[69] I. Ardelean, G. Farrhera, R. Kimmich, Effective diffusion in partially fillednanoscopic and microscopic pores, J. Optoelectron. Adv. 9 (2007) 655–660,International Conference on Advanced Spectroscopies on Biomedical andNanostructured Systems, Cluj Napoca, Romania, September 3–6, 2006.
[70] J.-F. Kuntz, P. Palmas, D. Canet, Diffusive diffraction measurements in porousmedia: Effect of structural disorder and internal magnetic field gradients, J.Magn. Reson. 188 (2007) 322–329, doi:10.1016/j.jmr.2007.08.009.
[71] G. Farrher, I. Ardelean, R. Kimmich, Time-dependent molecular diffusion inpartially filled porous glasses with heterogeneous structure, Appl. Magn.Reson. 34 (2008) 85–99, Proceedings of the 22nd Conference on Radio andMicrowave Spectroscopy (RAMIS 2007), Bedlewo, Poland, APR 22–25, 2007.doi:10.1007/s00723-008-0096-6.
[72] O. Geier, R.Q. Snurr, F. Stallmach, J. Kärger, Boundary effects of moleculardiffusion in nanoporous materials: a pulsed field gradient nuclear magneticresonance study, J. Chem. Phys. 120 (2004) 367–373, doi:10.1063/1.1629276.
[73] D. Majolino, C. Corsaro, V. Crupi, V. Venuti, U. Wanderlingh, Water diffusionin nanoporous glass: an NMR study at different hydration levels, J. Phys.Chem. B 112 (2008) 3927–3930, doi:10.1021/jp711433d.
[74] J.C. Gore, A.W. Anderson, M.D. Does, D.F. Gochberg, J.M. Joers, R.P. Kennan,E.C. Parsons, M. Schachter, The relationship of problems in biomedical MRI tothe study of porous media, Magn. Reson. Imaging 19 (2001) 295–300,doi:10.1016/S0730-725X(01)00239-9.
[75] J. Mitchell, J. Strange, An NMR investigation of naphthalene nanostructures,Mol. Phys. 102 (2004) 1997–2005, doi:10.1080/00268970412331292795.
[76] L. Monteilhet, J.P. Korb, J. Mitchell, P.J. McDonald, Observation of exchange ofmicropore water in cement pastes by two-dimensional T-2–T-2 nuclear
J. Beau W. Webber / Progress in Nuclear Magnetic Resonance Spectroscopy 56 (2010) 78–93 93
magnetic resonance relaxometry, Phys. Rev. E 74. doi:10.1103/PhysRevE.74.061404.
[77] A. Schreiber, I. Ketelsen, G. Findenegg, Melting and freezing of water inordered mesoporous silica materials, Phys. Chem. Chem. Phys. 3 (2001)1185–1195.
[78] J.B.W. Webber, J.C. Dore, Neutron diffraction cryoporometry – a measurementtechnique for studying mesoporous materials and the phases of containedliquids and their crystalline forms, Nucl. Instrum. Meth. A 586 (2008) 356–366, doi:10.1016/j.nima.2007.12.004.
[79] S. Jaehnert, F.V. Chavez, G.E. Schaumann, A. Schreiber, M. Schoenhoff, G.H.Findenegg, Melting and freezing of water in cylindrical silica nanopores, Phys.Chem. Chem. Phys. 10 (2008) 6039–6051, doi:10.1039/b809438c.
[80] J. Dore, B. Webber, J. Strange, H. Farman, M. Descamps, L. Carpentier, Phasetransformations for cyclohexane in mesoporous silicas, Physica A 333 (2004)10–16, doi:10.1016/j.physa.2003.09.043.
[81] O. Petrov, I. Furo, Curvature-dependent metastability of the solid phase andthe freezing–melting hysteresis in pores, Phys. Rev. E 73 (2006) 011608.
[82] J.B.W. Webber, R. Anderson, J.H. Strange, B. Tohidi, Clathrate formation anddissociation in vapour/water/ice/hydrate systems in SBA-15, Sol–gel and CPGporous media, as probed by NMR relaxation, novel protocol NMRcryoporometry, Neutron Scattering and ab initio QM-MD simulation, in:Proceedings of the Eighth International Meeting on Recent Advances in MRApplications to Porous Media, Bologna, Italy, from 10th to 14th September,2006, 2006.
[83] J.B.W. Webber, R. Anderson, J.H. Strange, B. Tohidi, Clathrate formation anddissociation in vapour/water/ice/hydrate systems in SBA-15, sol–gel and CPGporous media, as probed by NMR relaxation, novel protocol NMRcryoporometry, neutron scattering and ab initio quantum-mechanicalmolecular dynamics simulation, Magn. Reson. Imaging 25 (2007) 533–536,doi:10.1016/j.mri.2006.11.022.
[84] G. Mason, Determination of the pore-size distributions and pore-spaceinterconnectivity of Vycor porous glass from adsorption–desorptionhysteresis capillary condensation isotherms, Proc. Roy. Soc. Lond. A 415(1988) 453–486.
[85] H. Christenson, Confinement effects on freezing and melting, J. Phys.:Condens. Matter 13 (2001) R95–R133.
[86] V.M. Gun’ko, V.V. Turov, V.I. Zarko, E.V. Goncharuk, I.I. Gerashchenko, A.A.Turova, I.F. Mironyuk, R. Leboda, J. Skubiszewska-Zieba, W. Janusz,Comparative characterization of polymethylsiloxane hydrogel and silylatedfumed silica and silica gel, J. Colloid Interface Sci. 308 (2007) 142–156,doi:10.1016/j.jcis.2006.12.053.
[87] J. Seyed-Yazdi, H. Farman, J. Dore, J.B.W. Webber, G. Findenegg, T. Hansen,Structural characterization of water and ice in mesoporous SBA-15 silicas: II.The ‘almost-filled’ case for 86 Å pore diameter, J. Phys.: Condens. Matter 20(2008) 205107, doi:10.1088/0953-8984/20/20/205107.
[88] J. Seyed-Yazdi, H. Farman, J. Dore, J.B.W. Webber, G. Findenegg, Structuralcharacterization of water and ice in mesoporous SBA-15 silicas: III. The triplet
profile for 86 Å pore diameter, J. Phys.: Condens. Matter 20 (2008) 205108,doi:10.1088/0953-8984/20/20/205108.
[89] S. Brunauer, P. Emmett, E. Teller, Adsorption of gases in multimolecularlayers, J. Am. Chem. Soc. 60 (1938) 309–319.
[90] M. Brun, A. Lallemand, J. Quinson, C. Eyraud, A new method for thesimultaneous determination of the size and the shape of pores: thethermoporometry, Thermochim. Acta 21 (1977) 59–88.
[91] B. Webber, J. Dore, Structural and dynamic studies of water in mesoporoussilicas using neutron scattering and nuclear magnetic resonance, J. Phys.:Condens. Matter 16 (2004) S5449–S5470, doi:10.1088/0953-8984/16/45/009.
[92] J.B.W. Webber, J.H. Strange, P.A. Bland, R. Anderson, B. Tohidi, Dynamics atsurfaces: probing the dynamics of polar and a-polar liquids at silica andvapour surfaces, Am. Inst. Phys. (AIP) Conf. Proc. Ser. 1081 (2008) 51–54,doi:10.1063/1.3058545.
[93] J.B.W. Webber, J.H. Strange, P.A. Bland, R. Anderson, B. Tohidi, Dynamics atsurfaces: probing the dynamics of polar and a-polar liquids at silica andvapour surfaces, in: Proceedings of the Ninth International Meeting on RecentAdvances in MR Applications to Porous Media, from 13th to 17th July, 2008,2008.
[94] J. Chezeau, J. Strange, Diffusion in molecular-crystals, Phys. Rep. 53 (1979) 1–92.
[95] A. Sah, H.L. Castricum, A. Bliek, D.H.A. Blank, J.E. ten Elshof, Hydrophobicmodification of gamma-alumina membranes with organochlorosilanes, J.Membrane Sci. 243 (2004) 125–132.
[96] J. Zanotti, M. Bellissent-Funel, S. Chen, Experimental evidence of a liquid–liquid transition in interfacial water, Europhys. Lett. 71 (2005) 91–7.
[97] M.R. Chowdhury, J.C. Dore, J.T. Wenzel, The structural characteristics ofamorphous D2O ice by neutron-diffraction, J. Non-Cryst. Solids 53 (1982)247–265.
[98] D. Blakey, Structural studies of vapour-deposited amorphous-ice and argon/amorphous-ice systems by neutron diffraction, Ph.D. Thesis, University ofKent at Canterbury, UK, 1994.
[99] T. Loerting, C. Salzmann, I. Kohl, E. Mayer, A. Hallbrucker, A second distinctstructural state of high-density amorphous ice at 77 K and 1 bar, Phys. Chem.Chem. Phys. 3 (2001) 5355–5357.
[100] J.L. Finney, A. Hallbrucker, I. Kohl, A.K. Soper, D.T. Bowron, Structures of highand low density amorphous ice by neutron diffraction, Phys. Rev. Lett. 88(2002) 225503.
[101] J.L. Finney, D.T. Bowron, A.K. Soper, T. Loerting, E. Mayer, A. Hallbrucker,Structure of a new dense amorphous ice, Phys. Rev. Lett. 89 (2002) 205503.
[102] M.M. Koza, T. Hansen, R.P. May, H. Schober, Link between the diversity,heterogeneity and kinetic properties of amorphous ice structures, J. Non-Cryst. Solids 352 (2006) 4988–4993.
[103] P.A. Bland, O. Alard, G.K. Benedix, A.T. Kearsley, O.N. Menzies, L. Watt, N.W.Rogers, Volatile fractionation in the early solar system and chondrule/matrix complementarity, Proc. Natl. Acad. Sci. USA 102 (2005) 13755–13760.