Embed Size (px)
Citation preview
IOSR Journal of Applied Physics (IOSR-JAP)
e-ISSN: 2278-4861.Volume 7, Issue 5 Ver. I (Sep. - Oct. 2015), PP 12-24
www.iosrjournals
DOI: 10.9790/4861-07511224 www.iosrjournals.org 12 | Page
Studies of Total Electron Content variations at low-latitude
stations within the Equatorial Ionization Anomaly zone
L.G. Olatunbosun1 and E.A. Ariyibi
2
1Department of Science Technology, Federal Polytechnic, Ado-Ekiti, Nigeria
2Department of Physics and Engineering Physics, ObafemiAwolowo University, Ile-Ife, Nigeria
Abstract: The total electron content (TEC) is an important parameter to monitor for possible space weather
impacts. The radio waves that pass through the earth’s ionosphere travel more slowly than their free space
velocity due to group path delay of the ionosphere. This group path delay is directly proportional to the TEC of
the ionosphere. Using dual frequency GPS receiver at low latitude stations of Ile-Ife (7.52oN, 4.28
oE), Addis
Ababa (9.04oN, 38.77
oE) and Bangalore (13.03
oE, 77.57
oE), all located within 0 - 15
oN of the equatorial
anomaly region, the measurement of ionospheric TEC for 2012 has been carried out. The data from the three
stations were used to study the diurnal, monthly and seasonal variations of TEC. The diurnal variations
maximize between 10:00 – 16:00UT, 08:00 – 14:00UT and 06:00 – 12:00UT for Ile-Ife, Addis Ababa and
Bangalore stations respectively. The diurnal variations showed wave-like pertubation during disturbed and
quiet periods at Bangalore and Addis Ababa stations. The monthly average TEC variations showed that the
month of March recorded the highest TEC value of ~59TECu at about 16:00UT in Ile-Ife station, while TEC at
Addis Ababa and Bangalore maximize in October with ~72TECu and 65TECu at about 11:00UT and 09:00UT
respectively. Seasonal variations showed that TEC maximizes during the equinoctial months and least in
summer, over the three stations. Geomagnetic storms enhance TEC variations in the three stations.
Keywords:EIA, GPS, Ionosphere, Low-latitude, TEC
I. Introduction The atmosphere is influenced by the dynamic and violet sun in various ways. The sun’s suface
occationally erupts, sending a large part of the solar atmosphere (solar wind) streaming away at high speed.
These events are called coronal mass ejections (CMEs). CME that enters the earth’s magnetic field may cause
geomagnetic storms which usually occur in conjunction with ionospheric storms. The ionosphere, the earth’s
upper atmosphere, is partially ionized by the solar radiation such as extreme ultra violate (EUV) and x-ray
radiations.
At low-latitudes, during the day, one of the most prominent features in the ionosphere is the equatorial
ionization anomaly (EIA). This feature is distinguished by higher plasma density on both sides of the equator,
rather than that at the equator itself. The equatorial anomaly is formed as a consequence of E x B upward plasma
drifts associated with an eastward E-field and a northward horizontal B-field. The lifted plasma then diffuses
downward along the geomagnetic field lines due to the gravitational force and the plasma pressure gradient, and
this results in ionization enhancements on both sides of the magnetic equator (±15o in the latitude)
[1].
In the measurement of the magnitude of ionization in the ionosphere, TEC is used. The TEC is the
number of electrons present along a path between a radio transmitter and receiver. Radio waves are affected by
the presence of electrons. The more electrons in the path of the radio wave, the more the radio signal will be
affected. For ground to satellite communication and satellite navigation, TEC is a good parameter to monitor for
possible space weather impacts. The TEC in the ionosphere is modified by changing EUV radiation,
geomagnetic storms and the atmospheric waves that propagate up from the lower atmosphere. The propagation
of radio waves is affected by the ionosphere. The velocity of radio waves changes when the signal passes
through the electrons in the ionosphere. The total delay suffered by a radio wave propagating through the
ionosphere depends on the frequency of the radio wave and the TEC between the transmitter and the receiver.
The change in the path and velocity of radio waves in the ionosphere has a big impact on the accuracy of
satellite navigation systems such as GPS/GNSS. Neglecting changes in the ionospheric TEC can introduce tens
of meters of error in the position calculations.
Ariyibi, et al. [2]
studied the diurnal variation of TEC over Ile-Ife using GPS data. They observed that
diurnal TEC is enhanced as a result of geomagnetic storm. The effect of geomagnetic storm over Ile-Ife was also
studied by Ariyibi et al.[3]
. They concluded that the value of TEC varies widely from low TEC value before
dawn to a very high value during the daytime. Chauhan, et al.[4]
studied diurnal and seasonal variation of TEC at
Agra in India and observed that the mean TEC varies from pre-dawn minimum to an afternoon maximum and
then decreases. The low values were observed in winter while high values were observed in equinox and
summer months, and there was an absence of winter anomaly. The variability of TEC over the West African
Studies of Total Electron Content variations at low-latitude stations within the Equatorial ....
DOI: 10.9790/4861-07511224 www.iosrjournals.org 13 | Page
equatorial region was reported by Bolaji, et al.[5]
and results showed that the value and diurnal range variation is
consistently lower in the June solstice than in other seasons during both high and low solar activities.
Bhattacharya [6]
also reported that in India, TEC is depleted at the equator and enhanced at regions located 15o
South and North of the magnetic equator and this raises the TEC gradient.
The study in this paper is related to the TEC variations in 2012 for three stations located within 0 – 15o
N of EIA zone. The ionization in this zone is known to be high compared to relatively moderate levels of
electron content in the mid-latitudes. The study therefore sets out to investigate the day-to-day, month-to-month,
seasonal and annual variations in TEC at these stations and how the variability can affect users of satellite based
navigation systems at low latitudes.
II. Material And Methods Total electron content (TEC) are obtained from GPS data measured byNovAtel GSV400B GPS
SCINDA receivers situated at ObafemiAwolowo University, Ile-Ife, Nigeria (Geomagnetic cords: Lat 7.52oN
and Long 4.28oE); Addis Ababa University, Addis Ababa, Ethiopia (Geomagnetic cords: Lat 9.04
oN , Long
38.77oE) and Indian Institute of Science, Bangalore, India (Geomagnetic cords: Lat13.03
oE, Long 77.57
oE).
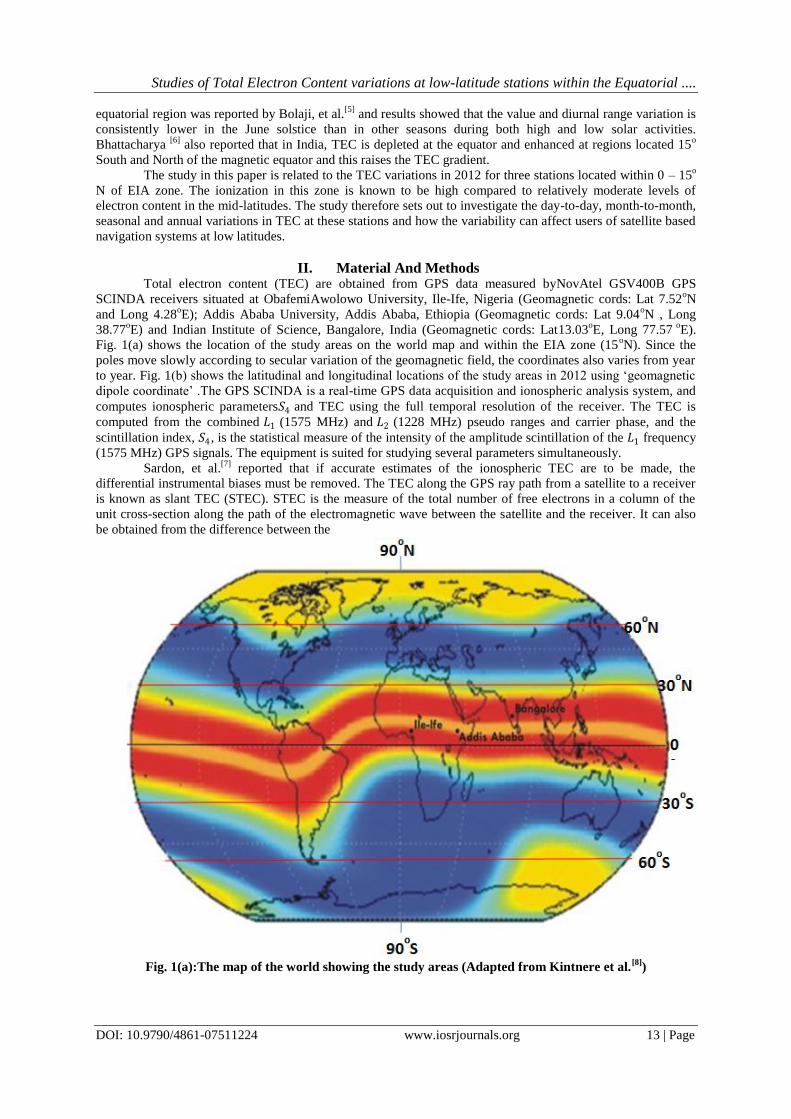
Fig. 1(a) shows the location of the study areas on the world map and within the EIA zone (15oN). Since the
poles move slowly according to secular variation of the geomagnetic field, the coordinates also varies from year
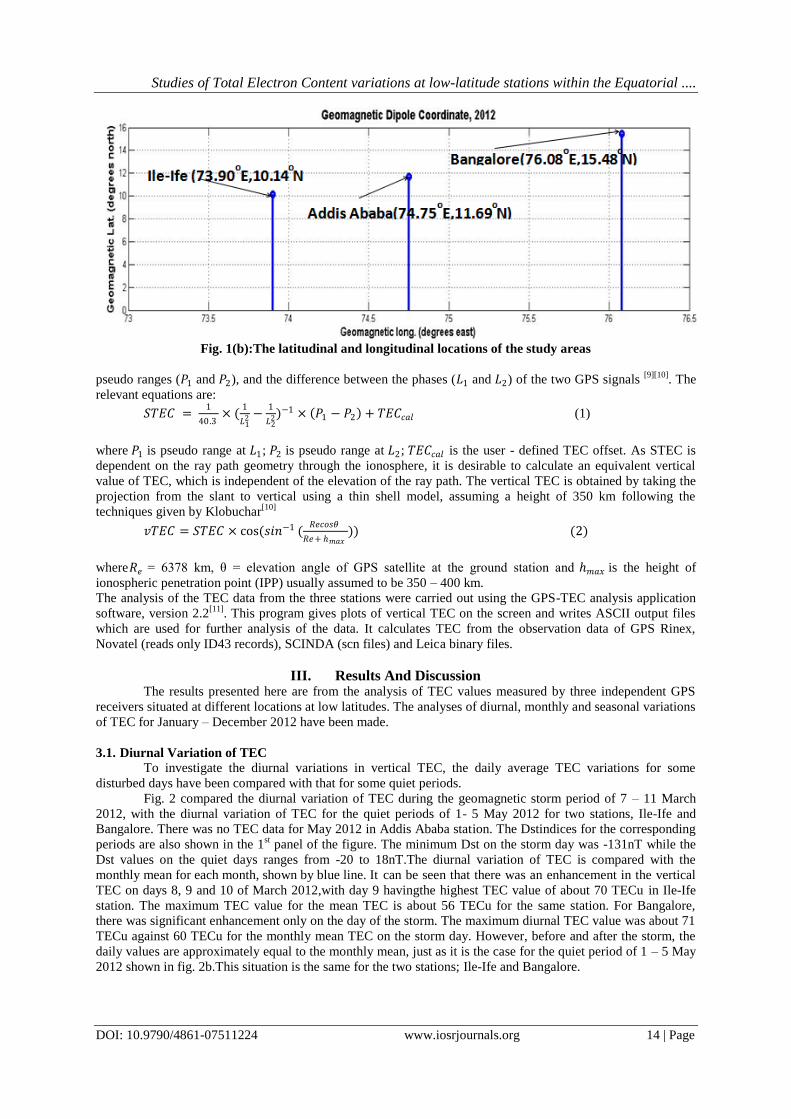
to year. Fig. 1(b) shows the latitudinal and longitudinal locations of the study areas in 2012 using ‘geomagnetic
dipole coordinate’ .The GPS SCINDA is a real-time GPS data acquisition and ionospheric analysis system, and
computes ionospheric parameters𝑆4 and TEC using the full temporal resolution of the receiver. The TEC is
computed from the combined 𝐿1 (1575 MHz) and 𝐿2 (1228 MHz) pseudo ranges and carrier phase, and the
scintillation index, 𝑆4, is the statistical measure of the intensity of the amplitude scintillation of the 𝐿1 frequency
(1575 MHz) GPS signals. The equipment is suited for studying several parameters simultaneously.
Sardon, et al.[7]
reported that if accurate estimates of the ionospheric TEC are to be made, the
differential instrumental biases must be removed. The TEC along the GPS ray path from a satellite to a receiver
is known as slant TEC (STEC). STEC is the measure of the total number of free electrons in a column of the
unit cross-section along the path of the electromagnetic wave between the satellite and the receiver. It can also
be obtained from the difference between the
Fig. 1(a):The map of the world showing the study areas (Adapted from Kintnere et al.
[8])
Studies of Total Electron Content variations at low-latitude stations within the Equatorial ....
DOI: 10.9790/4861-07511224 www.iosrjournals.org 14 | Page
Fig. 1(b):The latitudinal and longitudinal locations of the study areas
pseudo ranges (𝑃1 and 𝑃2), and the difference between the phases (𝐿1 and 𝐿2) of the two GPS signals [9][10]
. The
relevant equations are:
𝑆𝑇𝐸𝐶 = 1
40.3 × (
1
𝐿12 −
1
𝐿22)−1 × 𝑃1 − 𝑃2 + 𝑇𝐸𝐶𝑐𝑎𝑙 (1)
where 𝑃1 is pseudo range at 𝐿1; 𝑃2 is pseudo range at 𝐿2; 𝑇𝐸𝐶𝑐𝑎𝑙 is the user - defined TEC offset. As STEC is
dependent on the ray path geometry through the ionosphere, it is desirable to calculate an equivalent vertical
value of TEC, which is independent of the elevation of the ray path. The vertical TEC is obtained by taking the
projection from the slant to vertical using a thin shell model, assuming a height of 350 km following the
techniques given by Klobuchar[10]
𝑣𝑇𝐸𝐶 = 𝑆𝑇𝐸𝐶 × cos(𝑠𝑖𝑛−1 (𝑅𝑒𝑐𝑜𝑠𝜃
𝑅𝑒+ ℎ𝑚𝑎𝑥)) (2)
where𝑅𝑒 = 6378 km, θ = elevation angle of GPS satellite at the ground station and ℎ𝑚𝑎𝑥 is the height of
ionospheric penetration point (IPP) usually assumed to be 350 – 400 km.
The analysis of the TEC data from the three stations were carried out using the GPS-TEC analysis application
software, version 2.2[11]
. This program gives plots of vertical TEC on the screen and writes ASCII output files
which are used for further analysis of the data. It calculates TEC from the observation data of GPS Rinex,
Novatel (reads only ID43 records), SCINDA (scn files) and Leica binary files.
III. Results And Discussion The results presented here are from the analysis of TEC values measured by three independent GPS
receivers situated at different locations at low latitudes. The analyses of diurnal, monthly and seasonal variations
of TEC for January – December 2012 have been made.
3.1. Diurnal Variation of TEC
To investigate the diurnal variations in vertical TEC, the daily average TEC variations for some
disturbed days have been compared with that for some quiet periods.
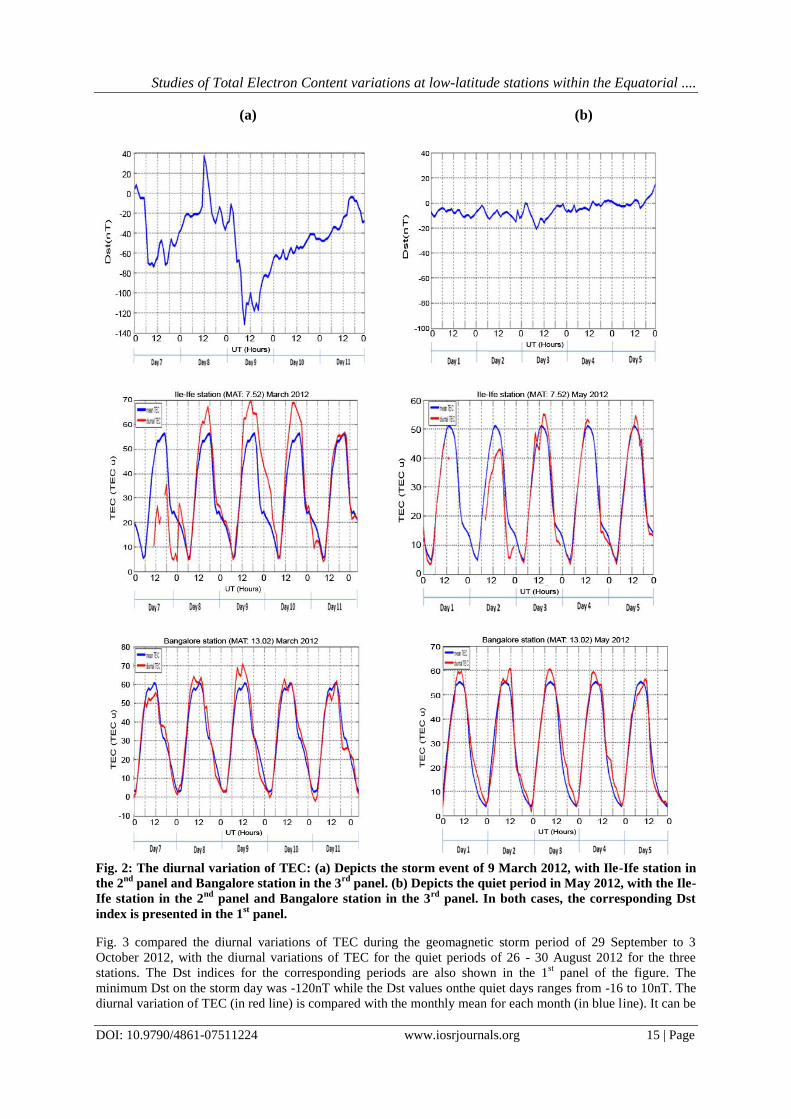
Fig. 2 compared the diurnal variation of TEC during the geomagnetic storm period of 7 – 11 March
2012, with the diurnal variation of TEC for the quiet periods of 1- 5 May 2012 for two stations, Ile-Ife and
Bangalore. There was no TEC data for May 2012 in Addis Ababa station. The Dstindices for the corresponding
periods are also shown in the 1st panel of the figure. The minimum Dst on the storm day was -131nT while the
Dst values on the quiet days ranges from -20 to 18nT.The diurnal variation of TEC is compared with the
monthly mean for each month, shown by blue line. It can be seen that there was an enhancement in the vertical
TEC on days 8, 9 and 10 of March 2012,with day 9 havingthe highest TEC value of about 70 TECu in Ile-Ife
station. The maximum TEC value for the mean TEC is about 56 TECu for the same station. For Bangalore,
there was significant enhancement only on the day of the storm. The maximum diurnal TEC value was about 71
TECu against 60 TECu for the monthly mean TEC on the storm day. However, before and after the storm, the
daily values are approximately equal to the monthly mean, just as it is the case for the quiet period of 1 – 5 May
2012 shown in fig. 2b.This situation is the same for the two stations; Ile-Ife and Bangalore.
Studies of Total Electron Content variations at low-latitude stations within the Equatorial ....
DOI: 10.9790/4861-07511224 www.iosrjournals.org 15 | Page
(a) (b)
Fig. 2: The diurnal variation of TEC: (a) Depicts the storm event of 9 March 2012, with Ile-Ife station in
the 2nd
panel and Bangalore station in the 3rd
panel. (b) Depicts the quiet period in May 2012, with the Ile-
Ife station in the 2nd
panel and Bangalore station in the 3rd
panel. In both cases, the corresponding Dst
index is presented in the 1st panel.
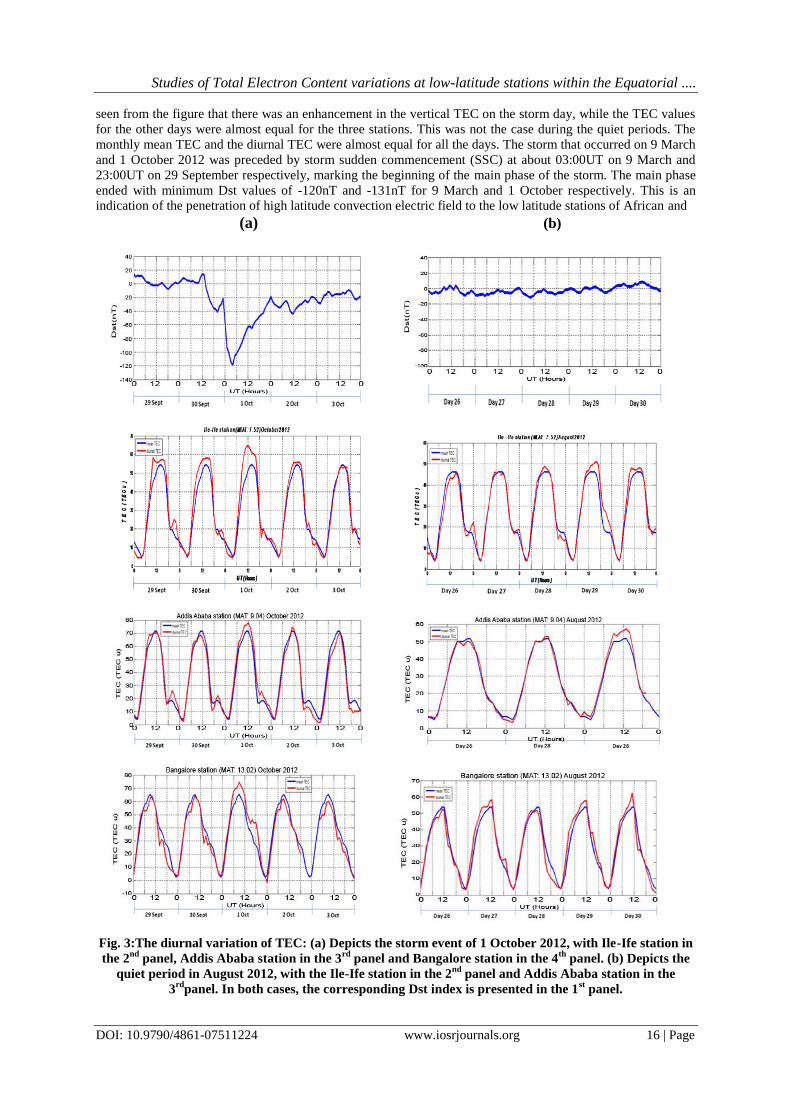
Fig. 3 compared the diurnal variations of TEC during the geomagnetic storm period of 29 September to 3
October 2012, with the diurnal variations of TEC for the quiet periods of 26 - 30 August 2012 for the three
stations. The Dst indices for the corresponding periods are also shown in the 1st panel of the figure. The
minimum Dst on the storm day was -120nT while the Dst values onthe quiet days ranges from -16 to 10nT. The
diurnal variation of TEC (in red line) is compared with the monthly mean for each month (in blue line). It can be
Studies of Total Electron Content variations at low-latitude stations within the Equatorial ....
DOI: 10.9790/4861-07511224 www.iosrjournals.org 16 | Page
seen from the figure that there was an enhancement in the vertical TEC on the storm day, while the TEC values
for the other days were almost equal for the three stations. This was not the case during the quiet periods. The
monthly mean TEC and the diurnal TEC were almost equal for all the days. The storm that occurred on 9 March
and 1 October 2012 was preceded by storm sudden commencement (SSC) at about 03:00UT on 9 March and
23:00UT on 29 September respectively, marking the beginning of the main phase of the storm. The main phase
ended with minimum Dst values of -120nT and -131nT for 9 March and 1 October respectively. This is an
indication of the penetration of high latitude convection electric field to the low latitude stations of African and
(a) (b)
Fig. 3:The diurnal variation of TEC: (a) Depicts the storm event of 1 October 2012, with Ile-Ife station in
the 2nd
panel, Addis Ababa station in the 3rd
panel and Bangalore station in the 4th
panel. (b) Depicts the
quiet period in August 2012, with the Ile-Ife station in the 2nd
panel and Addis Ababa station in the
3rd
panel. In both cases, the corresponding Dst index is presented in the 1st panel.
Studies of Total Electron Content variations at low-latitude stations within the Equatorial ....
DOI: 10.9790/4861-07511224 www.iosrjournals.org 17 | Page
Indian sectors. As it was reported by Basu et al.[12]
and Forster and Jakowski[13]
of a significant enhancement of
ring current during the main phase of a storm, the investigation of diurnal variation of TEC revealed an
enhancement in TEC during geomagnetic storms. Also, comparing the three stations, two in Africa and one in
India, it revealed that the enhancement in TEC during storms was more at Addis Ababa and least at Ile-Ife. This
suggests that TEC variations do not depend solely on the sector.
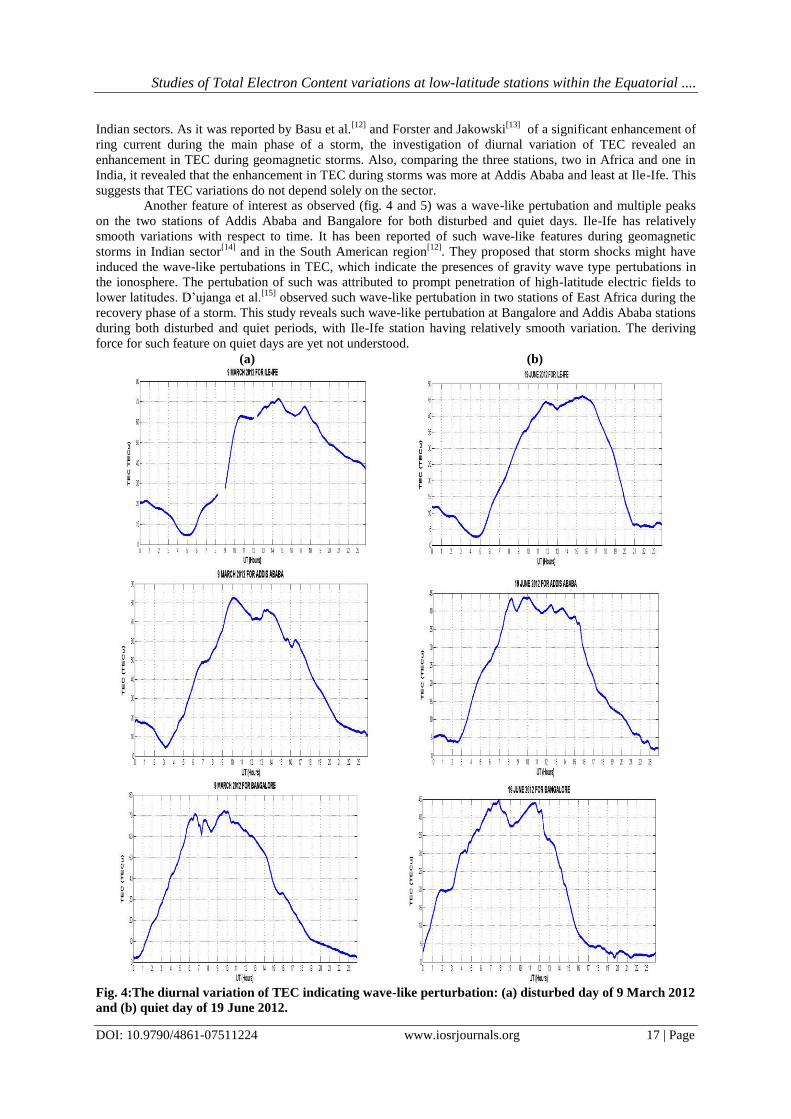
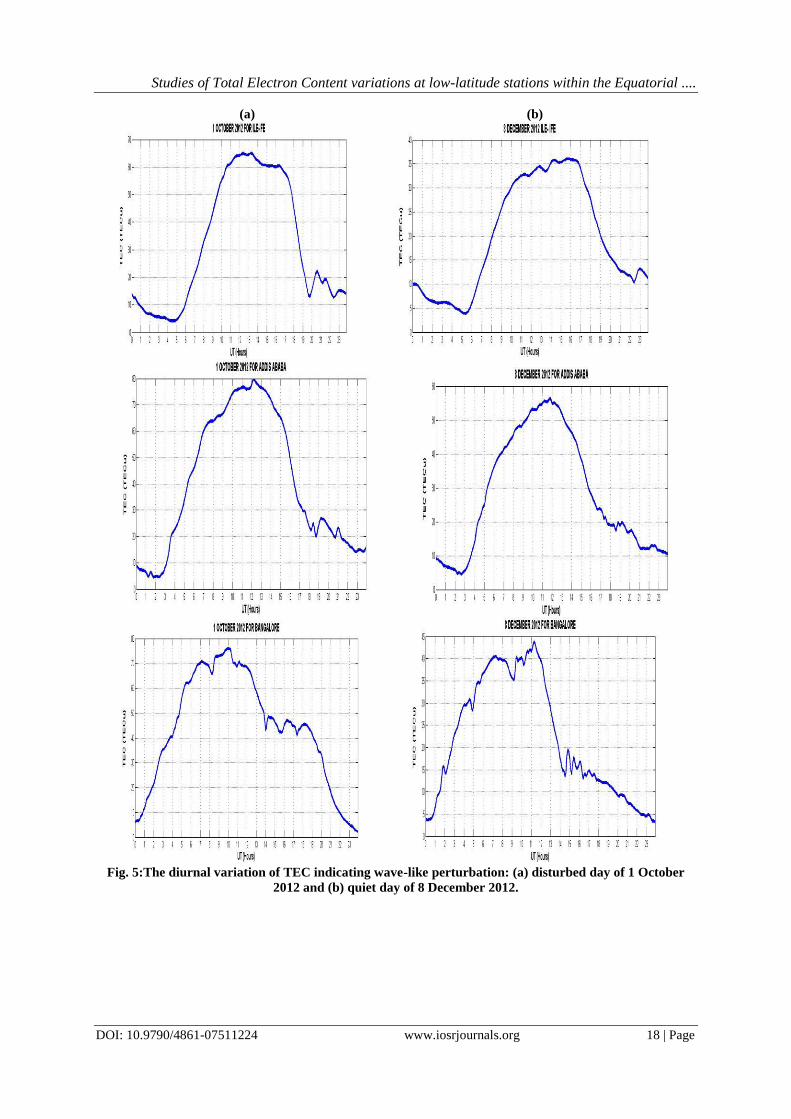
Another feature of interest as observed (fig. 4 and 5) was a wave-like pertubation and multiple peaks
on the two stations of Addis Ababa and Bangalore for both disturbed and quiet days. Ile-Ife has relatively
smooth variations with respect to time. It has been reported of such wave-like features during geomagnetic
storms in Indian sector[14]
and in the South American region[12]
. They proposed that storm shocks might have
induced the wave-like pertubations in TEC, which indicate the presences of gravity wave type pertubations in
the ionosphere. The pertubation of such was attributed to prompt penetration of high-latitude electric fields to
lower latitudes. D’ujanga et al.[15]
observed such wave-like pertubation in two stations of East Africa during the
recovery phase of a storm. This study reveals such wave-like pertubation at Bangalore and Addis Ababa stations
during both disturbed and quiet periods, with Ile-Ife station having relatively smooth variation. The deriving
force for such feature on quiet days are yet not understood.
(a) (b)
Fig. 4:The diurnal variation of TEC indicating wave-like perturbation: (a) disturbed day of 9 March 2012
and (b) quiet day of 19 June 2012.
Studies of Total Electron Content variations at low-latitude stations within the Equatorial ....
DOI: 10.9790/4861-07511224 www.iosrjournals.org 18 | Page
(a) (b)
Fig. 5:The diurnal variation of TEC indicating wave-like perturbation: (a) disturbed day of 1 October
2012 and (b) quiet day of 8 December 2012.
Studies of Total Electron Content variations at low-latitude stations within the Equatorial ....
DOI: 10.9790/4861-07511224 www.iosrjournals.org 19 | Page
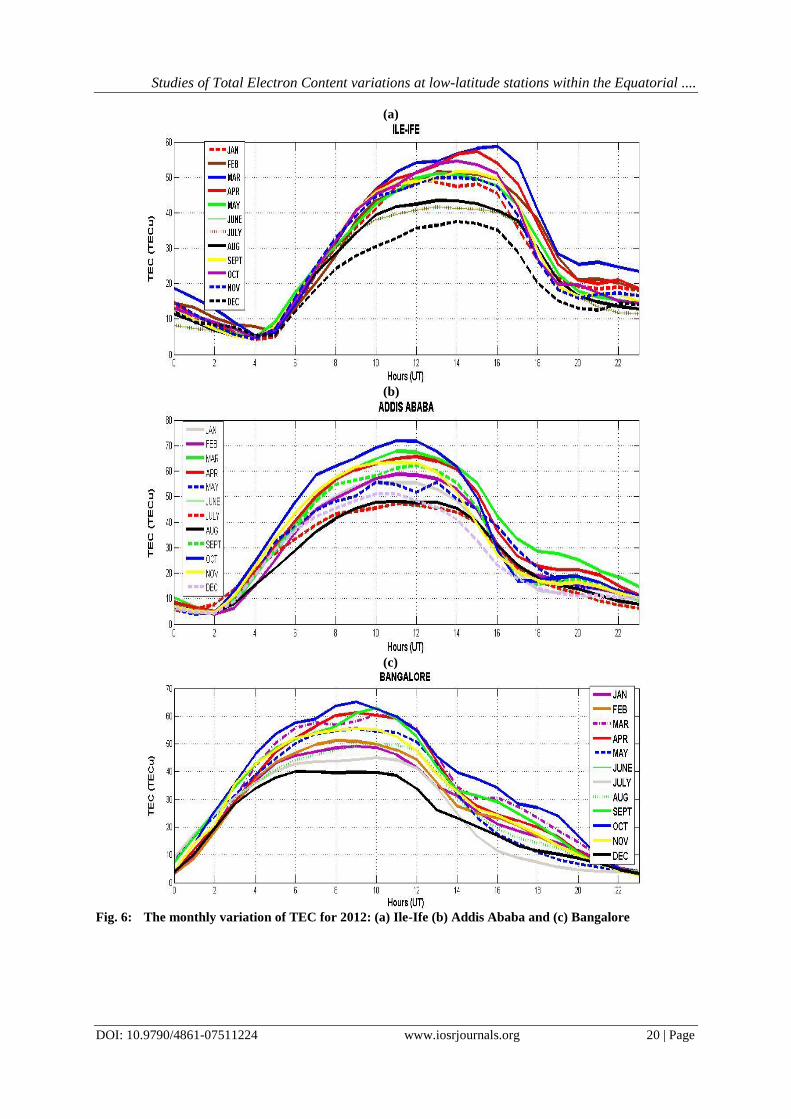
3.2Monthly variation of TEC
Themonthly variation in TEC as shown in figure 6 in the three stations revealed the three segments
expected of low-latitude stations: the build-up region, afternoon plateau and decay region. In Ile-Ife station, the
month of March recorded the highest peak TEC of ~59TECu at about 16:00UT, followed by April with
maximum TEC value of ~57TECu at about 15:00UT. The month of December recorded the least peak TEC of
~37TECu at about 14:00UT. In Addis Ababa station, the month of October recorded the highest peak TEC of
~71TECu at about 11:00UT, followed by March and April, with Peak TEC of ~68 and 67TECu respectively at
about 11:00UT. The least peak TEC of ~48TECu at about 12:00UT was observed in August and July. In
Bangalore station, the month of October recorded the highest peak TEC of ~65TECu at about 09:00UT,
followed by September and April with TEC values of ~62TECu and 60TECu respectively. December recorded
the lowest peak TEC of ~40TECu during the afternoon maximum.
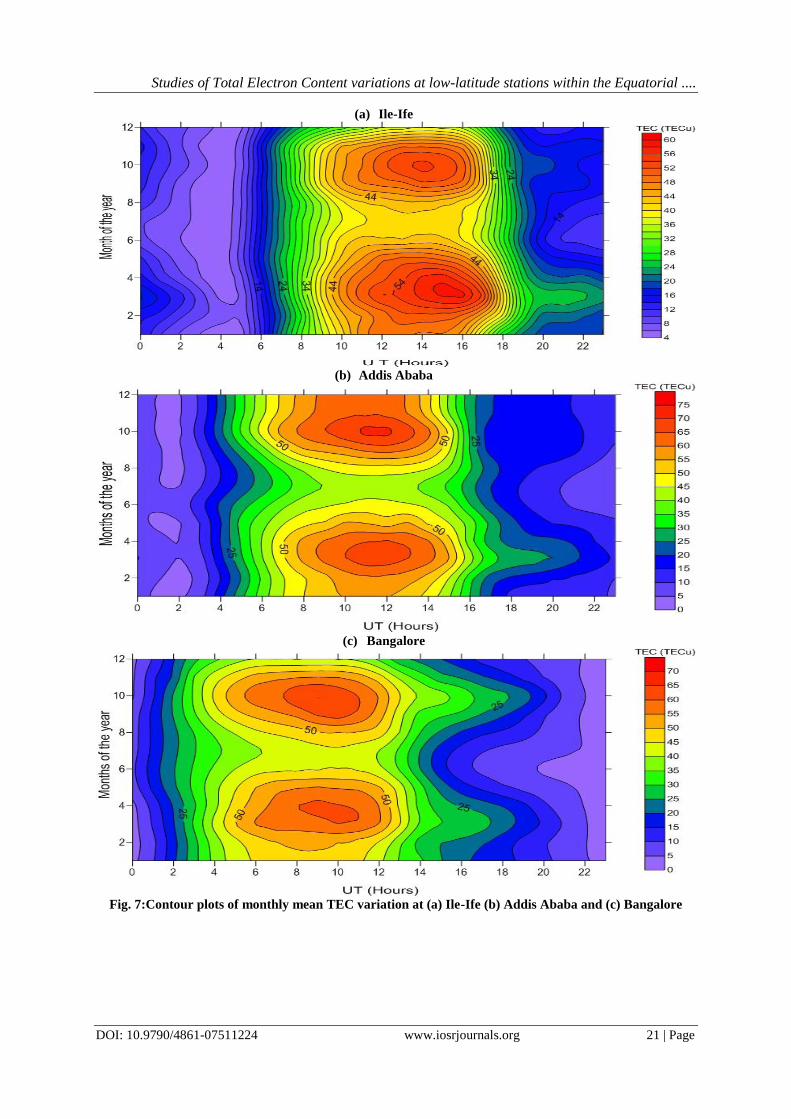
The variation of the monthly mean TEC for the above mentioned period of 12 months for the three
stations are as shown in the contour plots of figs. 7. The features mentioned above are reflected very well in
these figures. The minimum mean TEC was registered from 20:00 – 07:00UT, except in the months of March
and April where the periods of 20:00 – 23:00UT recorded moderate mean TEC values in Ile-Ife station. The
afternoon maximum was attained between the hours of 10:00 and 17:00UT. The months of June, July and
August recorded moderate mean TEC values ranging from 41 – 43 TECu during the afternoon maximum
(depicted in yellow colour in the diagram). The highest mean TEC values was recorded in the months of March,
April, September and October,with values ranging from 51 -59 TECu. For Addis Ababa station, the afternoon
maximum was attained between 10:00 and 14:00UT. In the months of June, July and August, the afternoon
maximum recorded moderate mean TEC value, ranging from 42 – 47 TECu. The maximum mean TEC value for
the afternoon maximum was attained in the months of March, April and October, with the value of ~71 TECu
recorded in the month of October at about 11:00UT. In Bangalore station, the afternoon maximum was attained
during 06:00 – 12:00UT and the minimum during night and early morning (16:00 – 02:00UT). The months of
June, July and August recorded moderate mean TEC value during the afternoon maximum, as depicted in green
colour. The maximum mean TEC during the afternoon maximum was recorded in the months of March, April,
September and October 2012, with highest value of 65 TECu recorded in October at about 09:00UT.
In general, the variations in monthly mean TEC varied from month-to-month over all stations. The
afternoon maximum was attained earlier at Bangalore, followed by Addis Ababa and then at Ile-Ife station.
Addis Ababa station recorded the maximum mean TEC during the afternoon maximum over all the months,
followed by Bangalore station and least at Ile-Ife station.
The day-to-day or month-to-month variability in TEC, which has also been observed by some
authors[1][16]
,may be due to the changes in the activity of the sun itself and to the associated changes in the
intensity of the incoming radiations and the zenith angle at which they are incident on the Earth’s atmosphere.
EEJ strength, Earth’s magnetic field and the dynamics of the neutral wind are also some factors which may be
responsible for this variability Rama Rao et al.[1]
. The results of variation in mean TEC over the low-latitude
stations considered in this work showed that the variation in mean TEC is dependent on season, latitude and
local time of occurrence.
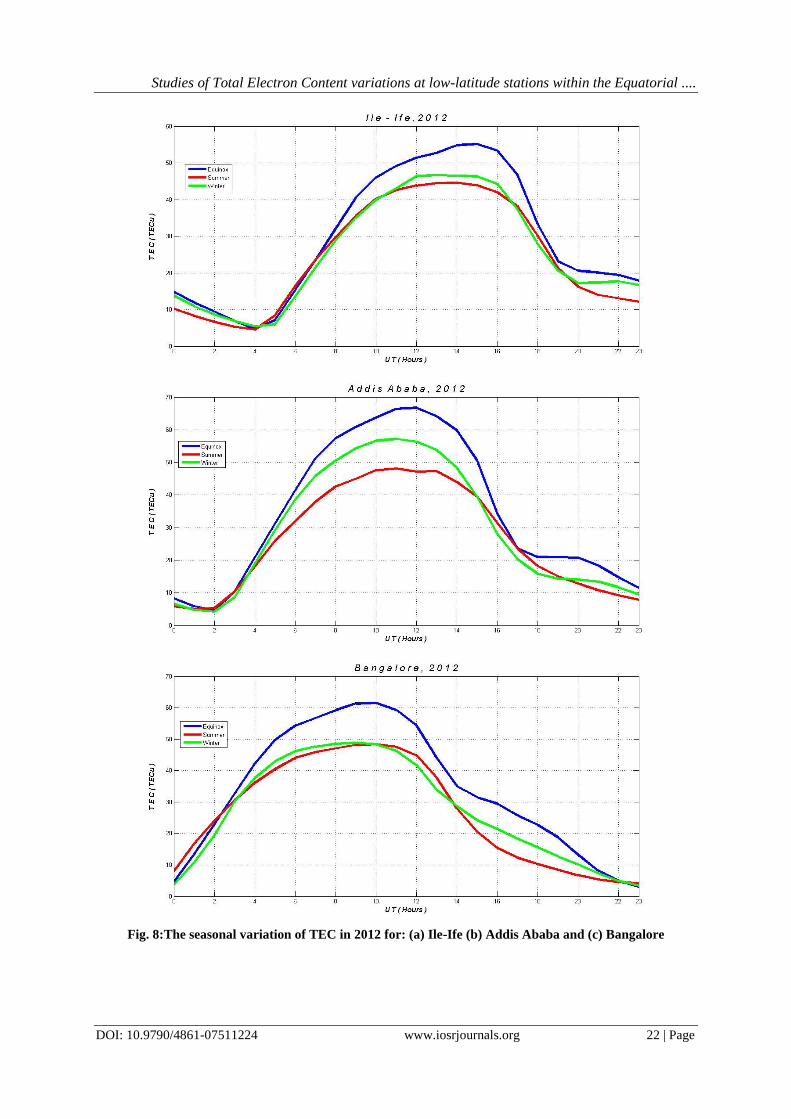
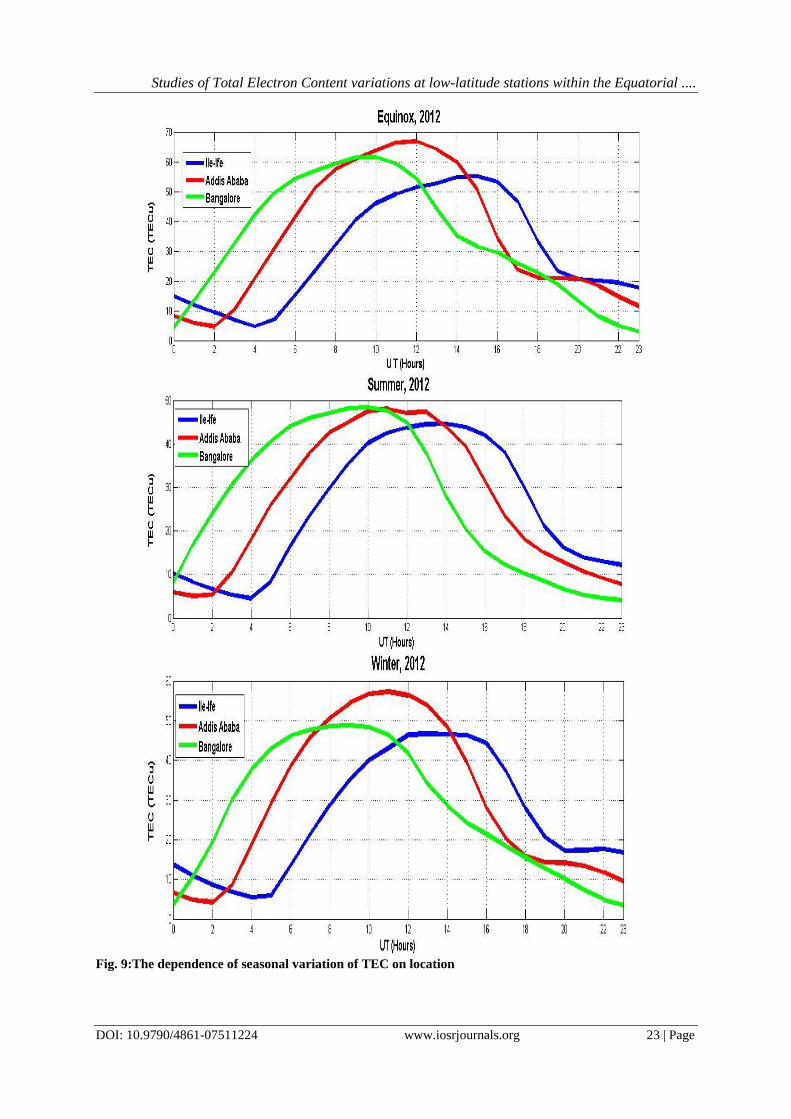
3.3Seasonal variation of TEC
Figs. 8 and 9 showed the seasonal variation of TEC in the three stations and the dependence of seasonal
variation of TEC on locations respectively.The TEC variations attained maximum during the afternoon with
equinoctial months (March, April, September and October) recording the highest TEC amplitude of ~68, 61 and
56TECu for Addis Ababa, Bangalore and Ile-Ife stations respectively. This was followed by the TEC amplitudes
in winter (November, December, January and February), recording ~58, 50 and 47TECu for Addis Ababa,
Bangalore and Ile-Ife respectively. Summer months (May, June, July and August) recorded the least TEC
amplitudes of ~49TECu for Addis Ababa and Bangalore, while that for Ile-Ife was ~44TECu. In general, the
morning rise to peak in the afternoon and then fall in TEC was sharp during the equinoctial months. Also, the
production of O/N2 was faster in winter than in summer. These could be explained using thermospheric neutral
composition. Thermospheric neutral composition has a direct control on the seasonal variation of TEC. Rishbeth
and Setty[17]
suggested that the seasonal changes result from changes in ratio of the concentration of atomic
oxygen and molecular nitrogen in the F-region. During the daytime, the equator is hotter than the pole, therefore
meridional wind flows towards the pole from the equator. This flow of meridional wind changes the neutral
composition and O/N2 decreases at equatorial and low latitude stations. The decrease is maxima in equinoctial
months. At 350 km altitude (F2-layer), N2 dissociation is the major process which removes ambient electrons.
Hence, the decrease in O/N2 ratio will result in higher electron density and therefore in equinox, TEC will be
highest.
Studies of Total Electron Content variations at low-latitude stations within the Equatorial ....
DOI: 10.9790/4861-07511224 www.iosrjournals.org 20 | Page
(a)
(b)
(c)
Fig. 6: The monthly variation of TEC for 2012: (a) Ile-Ife (b) Addis Ababa and (c) Bangalore
Studies of Total Electron Content variations at low-latitude stations within the Equatorial ....
DOI: 10.9790/4861-07511224 www.iosrjournals.org 21 | Page
(a) Ile-Ife
(b) Addis Ababa
(c) Bangalore
Fig. 7:Contour plots of monthly mean TEC variation at (a) Ile-Ife (b) Addis Ababa and (c) Bangalore
Studies of Total Electron Content variations at low-latitude stations within the Equatorial ....
DOI: 10.9790/4861-07511224 www.iosrjournals.org 22 | Page
Fig. 8:The seasonal variation of TEC in 2012 for: (a) Ile-Ife (b) Addis Ababa and (c) Bangalore
Studies of Total Electron Content variations at low-latitude stations within the Equatorial ....
DOI: 10.9790/4861-07511224 www.iosrjournals.org 23 | Page
Fig. 9:The dependence of seasonal variation of TEC on location
Studies of Total Electron Content variations at low-latitude stations within the Equatorial ....
DOI: 10.9790/4861-07511224 www.iosrjournals.org 24 | Page
IV. Conclusion The diurnal, monthly and seasonal variations of TEC from the three stations of Ile-Ife (7.52
oN,
4.28oE), Addis Ababa (9.04
oN, 38.77
oE) and Bangalore (13.03
oE, 77.57
oE), all located at the northern crest of
equatorial ionization anomaly region have been studied for the period of January – December 2012. There was
considerably TEC variations in the three stations, especially during geomagnetic storms. The diurnal variations
reached maximum values between 10:00 – 16:00UT, 08:00 – 14:00UT and 06:00 - 12:00UT for Ile-Ife, Addis
Ababa and Bangalore stations respectively. The diurnal variations at Bangalore and Addis Ababa exhibited
wave-like pertubations during both disturbed and quiet periods, with greater effect at Bangalore station. The
cause of the wave-like pertubations during quiet periods are not yet understood.The monthly variations showed
that TEC maximizes during the equinoxial months over all the stations, followed by winter months. The
observations showed that geomagnetic storms enhances the TEC and in comparison, Addis Ababa had higher
TEC values, followed by Bangalore and least in Ile-Ife station. The observed TEC variations in the three stations
suggest that space weather effects are likely to be felt more at Addis Ababa and least at Ile- Ife.
Acknowledgements The authors are grateful to Scripps Orbit and Permanent Array Center (SOPAC) for the GPS data for
Addis Ababa and Bangalore stations. We are also grateful to GopiSeemala of Institute for Scientific Research,
Boston College, USA for making GPS-TEC application analysis software available for TEC analyses. We thank
and acknowledge the World Data Center, Kyoto, Japan, for providing the magnetic data which was employed in
classifying geomagnetic events.
References [1]. Rama Rao, P. V. S., Gopi Krishna, S., Niranjan, K., & Prasad, D. S. V. V. D., Temporal and spatial variations in TEC using
simultaneous measurements from the Indian GPS network of receivers during the low solar activity period of 2004–2005, Ann.
Geophys., 24, 3279–3292, http://www.ann-geophys.net/24/3279/2006/, 2006. [2]. Ariyibi, E.A., Doherty, P., Coster, A.J. and E.O. Joshua, E.O., Diurnal variation of ionospheric TEC and S4 index, during the period
of low geomagnetic activity at Ile-Ife, Nigeria, Arab. J. Sci. Eng., 2013a.
[3]. Ariyibi, E.A., E.O. Joshua, and B.A. Rabiu, Studies of Ionospheric Variations During Geomagnetic activities at the Low-Latitude
Station, Ile-Ife, Nigeria, ActaGeophysica,61(1), 2013b, 223 – 239, Doi: 10.2478/s11600-012-0039-3
[4]. Chuahan, V., Singh, O. P. &Birbal, S., Diurnal and Seasonal variation of GPS – TEC during a low solar activity period as observed
at a low latitude station Agra, Indian J. Radio Space Phys., 40, 26. 2011. [5]. Bolaji, O. S., Adeniyi, J. O., Radicella, S. M. & Doherty, P. H., Variability of Total Electron Content over an equatorial West
African station during low solar activity, Radio sci. (USA), 47, doi: 10.1029/211RS004812, 2012.
[6]. Bhattacharya, S., Purohit, P. S. &Gwal, A. K., Ionospheric time delay variations in the equatorial anomaly during low solar activity using GPS, Indian J. Radio space Phys, 38, 226, 2009.
[7]. Sardon, E., Rius, A. &Zarraoa,N., Estimation of the transmitter and receiver differential biases and the ionospheric total electron
content from Global Positioning System observations, Radio Sci.,29,1994, 577–586. [8]. Kintner, P. M., Humphreys, T. &Hinks, J., GNSS and Ionospheric Scintillation: How to survive the next solar maximum,
InsideGNSS, 22 -30, 2009. Retrieved from www.insidegnss.com
[9]. Yizengaw, E., Essex, E. A. &Birsa, R., The Southern Hemisphere and equatorial region ionization response for a 22 September 1999 severe magnetic storm. Ann. Geophys. 22, 2004, 2765–2773.
[10]. Klobuchar, J., Design and characteristics of the GPS ionospheric time-delay algorithm for single frequency users, in: Proceedings of
PLANS’86 – Position Location and Navigation Symposium, Las Vegas, Nevada, 280–286, 4 –7, 1986. [11]. Gopi, S., Rinex GPS-TEC program, version 1.45. Boston College, 2010.
[12]. Basu, S., Basu, S., Rich, F..J., Groves, K.M., MacKenzie, E., Coker, C., Sahai, Y., Fagundes, P.R., Guedes, F.B, Response of the
equatorial ionosphere at dusk to penetration electric fields during intense magnetic storms. J. Geophys. Res. 112, 2007, A08308.
[13]. Forster, M., and N. Jakowski (2000). Geomagnetic storm effects on the topside ionosphere and plasmasphere: A compact tutorial
and new results, Surv. Geophys., 21, 47 – 87. [14]. Rama Rao, P.V.S., Gopi Krishna, S., Vara Prasad, J., Prasad, S.N.V.S., Prasad, D.S.V.V.D., Niranjan, K, Geomagnetic storm
effects on GPS based navigation, Ann. Geophys. 27, 2009, 2101–2110
[15]. D’ujanga, F.M., Mubiru, J.J., Twinamasiko, B.F., Basalirwa, C., Ssenyonga, T.J. (2012). Total electron content variations in equatorial anomaly region. Adv. Space Res., http://dx.doi.org/10.1016/j.asr.2012.05.005.
[16]. Tyagi, T.R, Electron Content and its Variation over Lindau, J Atmos Sol-Terr. Phys (UK), 36, 1974, 475-487
[17]. Rishbeth, H., Setty, C.S.G.K, The F-layer at sunrise. J. Atmos. Terr.Phys. 20, 1961, 263.