Embed Size (px)
Citation preview
748 STEPHEN A. KUBY, THEODORE A. MAHOWALD, AND ERNST A. NOLTMANN Biochemistry
Studies on Adenosine Triphosphate Transphosphorylases. IV. Enzyme-Substrate Interactions*
STEPHEN A. KUBY, THEODORE A. MAHOWALD,t AND ERNST A. NOLTMANN
From the Institute for Enzyme Research, University of Wisconsin, Madison 5 , Wisconsin Received March 13, 1962
Equilibrium binding measurements with ATP-creatine transphosphorylase and ATP- AMP transphosphorylase (myokinase) have been made at pH 7.9, 3", and an ionic strength of approximately 0.2. The order of binding affinity, according to the intrinsic association constants, has been determined to be: for ATP-creatine transphosphorylase,
and for myokinase,
ADP3- 2 {MgATPz-\ > AMP*- > Mgz+, where MgADP- was not measured for ATP4- myokinase. substrates.
For both enzymes two binding sites have been assigned for the nucleotide
Efforts to evaluate quantitatively the kinetic mechanisms of the ATP-transphosphorylase-cata- lyzed reactions are limited by an uncertainty re- garding the nature of the interactions between the protein catalyst and the many and diverse metal- complex and ionic species of the adenine nucleo- tides that may exist in solution (Kuby and Noltmann, 1962). A detailed kinetic analysis of these catalyzed reactions would be greatly assisted if the intrinsic association constants for the pro- tein-substrate equilibria could be determined.
The present report will concern itself, in particu- lar, with studies on the equilibrium binding of the substrates and magnesium to two ATP-trans- phosphorylases, ATP-AMP transphosphorylase (myokinase) and ATP-creatine transphosphoryl- ase. Preliminary reports have been presented (Kuby and Mahowald, 1958,1959).
EXPERIMENTAL PROCEDURES
of both these enzymes (after removal of the buffer salts and ashing of the protein) was never more than several hundredths of a mole per mole of protein.
The following enzymes used for analytical purposes were prepared according to the proce- dures listed: Crystalline glucose-6-phosphate de- hydrogenase (Noltmann et al., 1961), crystalline hexokinase (Darrow and Colowick, 1962; Maho- wald et d., 1962b), crystalline adenylic acid deaminase (Lee, 1957). Pyruvate kinase and lactic dehydrogenase were commercial prepara- tions (Sigma).
2. PREPARATION AND PURIFICATION OF SUB-
ATP. Commercial samples of the crystalline disodium salt contained on an average 1 to 2% ADP (earlier samples as much as 3 to 4%) and an equivalent amount of inorganic phosphate, traces of AMP, and significant amounts of divalent cations. These contaminations had
STRATES.
I. Materials seriously interfered with preliminary measure- menta of the ATP binding to ATP-creatine trans-
'* ENZYME PREPARAT1oNS.-ATP-Cr trans- phosphorylase (Kuby and Mahowald, 1958). phosphorylase' and myokinase were prepared ATP was therefore purified by the anion exchange and crystallized three times by the procedures procedure of Cohn (1957) with the use of Dowex-1 described (Kuby et aZ., 1954, Noda and KubY, ( ~ 1 - 1 ( 2 w o o me&). Before -, the resin was 1957a) with slight modification of the crystaka- exhaustively and several times tion stem (Mahowald et al., 196213). After ex- haustive dialysis a t 3" aga&t 0.15' M KC1-0.01 M Tris a t p H 7.9 (preparation of the buffer is described below), the "divalent cation" content
*This work was supported in part by grants No. G 4546, G 12448, and G 19470 from the National Science Foundation.
t Postdoctoral Fellow of the National Cancer Insti- tute (CF-7291), United States Public Health Service, 1957 to 1960; present address: Scripps Clinic and Research Foundation, La Jolla, Calif.
The abbreviations wed are: ATP, adenosine tri- phosphate; ADP, adenosine diphosphate; AMP, adenosine 5'-monophosphate; Cr, creatine; Cr-P, creatine phosphate; Tris, tris(hydroxymethy1)- aminomethane; EDTA, ethylenediamine tetra- acetate. A subscript zero is used to denote the sum total of all the ionic and complex species of the respective compound; a subscript t is used to denote the sum of the unbound and bound fractions of a species, which in turn are denoted by a subscript f or b respectively.
Vol. 1, No. 5, September, 1962 STUDIES ON A T P TRANSPHOSPHORYLASES IV. 749
through HC1-Hz0-NaOH-H20-HC1 in order to re- move heavy metal contaminants present (e.g., Lewis and Straub, 1960), until the wash water yielded minimal EDTA titers. The ATP frac- tion was collected in a cold room, precipitated as the barium compound from cold aqueous ethanol, and reprecipitated from the same solvent to re- place all cations by BaZ+. Samples were con- verted to the sodium salt by batch treatment on a Buchner funnel with the cation exchanger Dowex 50 (Na+) (200-400 mesh, exhaustively washed and cycled). The Dowex treatment was con- tinued until EDTA titration for Ba2+ was nega- tive. The filtrate was lyophilized, the dry powder was redissolved, and the sodium compound was crystallized from aqueous ethanol (Berger, 1956). After two to three crystallizations, the product contained only traces (less than 0.2 molar %) of inorganic phosphate and less than 0.25 molar % of ADP. The crystallized samples were stored a t -10" over silica gel or Drierite and used within 3 to 6 months.
ADP: Commercial samples were contami- nated with small amounts of inorganic phosphate, AMP, ATP, and divalent cations. The com- pound was therefore purified in an analogous fashion to that described above for ATP. Since conditions for crystallization could not be found, contamination by AMP and inorganic phosphate could not be reduced to less than 0.4 to 0.5 molar %. The samples were lyophilized as the neu- tralized sodium compound and stored as a dry powder a t -10" and used within a period of 5 months.
AMP: Commercial samples (Sigma) of the free acid were recrystallized (Berger, 1957) after a prior treatment with Dowex 50 (H+) to remove traces of divalent cations. After two crystalliza- tions, only negligible traces of ADP and ATP could be detected enzymically and inorganic phos- phate was absent. The crystalline free acid was stored a t -10" and appeared to be stable for a t least 1 year.
Creatine monohydrate was obtained from East- man (white label).
Creatine phosphate was synthesized and crystal- lized (Ennor and Stocken, 1957), and analyses of several preparations were similar to that described (Noda et d., 1954b), with negligible inorganic P. To remove traces of divalent cations (presumably Baz+), aqueous solutions of the sample (5 to 10% by weight) were treated by batches with Dowex 50 (Na+) as described above for the nucleotides, the resin was removed by filtration, and the pro- cedure was repeated twice. From the final filtrate, adjusted to pH 7.4, the compound was recrystal- lized by the addition of three-timedistilled 95% ethanol. After drying (Ennor and Stocken, 1957) the product, analyzed as the hexahydrate, was a t least 99.6% pure and was stored as described above for the nucleotides a t -10"; these samples were used within 3 months after preparation.
3. OTHER REAGENTs.-Triehydroxymethyla-
minomethane ("Sigma 121") was recrystallized twice from aqueous ethanol.
Analytical grade KC1, meeting the ACS speci- fications, was recrystallized a number of times from aqueous ethanol.
Versene (disodium ethylenediamine tetra- acetate - 2H20) was obtained from Fisher Reagent Chemicals and purified and standardized as de- scribed (Welcher, 1957; Lewis and Melnick, 1960). Eriochrome Black T was purchased from the National Aniline Division (Superchrome Black TS). Ethanolamine (Eastman "white label") was redistilled before use.
For most of the work 0.010 M Tris-0.150 M KC1 buffer was employed with the p H adjusted to 7.9 at 5" by addition of HC1, the latter diluted from twice-distilled constant-boiling HC1. Un- der these conditions, an apparent pK of 8.7 a t 5" and 8.1 a t 25" was found for Tris, which may be compared with the pK values for the thermo- dynamic acid dissociation constants measured by Bates and Hetzer (1961) as 8.6774 and 8.0746 a t 5 and 25" respectively. (At pH 7.9 and 5", about 14% of the buffer is in the form of the free base, and preliminary titrations had indicated that under those conditions the binding of Mg to only 1.4 X M Tris [free base] can be neglected!) The distilled water used for preparation of all the buffers was saturated with gaseous nitrogen to minimize poasible changes in the oxidation state of the reactive SH groups of the two proteins (Mahowald et al., 1962a,b; Noltmann et al., 1962), which might influence the binding picture.
Samples of the substrates or MgClz (Ana1ytic.i Reagent) or both were dissolved in the buffer and the p H was readjusted, if necessary, to 7.9 a t 5". The proteins had been previously dialyzed ex- haustively against the same buffer. In studies on the binding of ADP by myokinase, residual trace contaminations by Mg and Ca, introduced in some cases with the high concentrations of the KC1 of the buffer, were sufficient to permit a very slow catalysis to take place. Therefore, the solutions were titrated before the run with versene, and an excess of versene (compared to the divalent metal contaminations) was added as a precaution.
Where the ionic strength contrjbution by the compounds studied (in particular MgClZ) was significant compared to that of the buffer (0.16), the binding experiments were made (a) with the ionic strength kept a t 0.16 by subtracting KC1 or (b) with the ionic strength allowed to increase. In both casea, small changes in the ionic strength did not appear to affect, within the experimental error, the binding patterns of the two proteins studied.
p H measurements were made with either a Beckman Model G or a Radiometer TIT-la pH meter.
I I . Analytical Procedures A. DETERMINATION OF MAGNEsm.-The
Schwarzenbach EDTA titrimetric method with
750 STEPHEN A. KUBY, THEODORE A. MAHOWALD, AND ERNST A. NOLTMANN Biochemistry
Eriochrome Black T as a visual indicator a t pH 10 (reviewed by Welcher, 1957, and Flaschka, 1959) was adapted for the present uses. The basic procedure has been carefully examined by Lewis and Melnick (1960) with respect to precision and accuracy (1 to 2 parts per thousand), and their recommendations, especially in regard to the selection of the end-point, were followed except that ethanolamine (Sobel and Hanok, 1951) was used as the buffer. The total initial volumes to be titrated ranged from 1.1 to 22 ml, with the standard EDTA molarities ranging from 0.01 to 0.1 M depending upon the amount of Mg to be titrated and the sensitivity desired.
Visual titrations to the blue end-point (the end- point was always compared with a “dummy” sample containing the dye a t the proper end-point) were conducted in open beakers with magnetic stirring.2 The titrant was introduced via a calibrated agla-type syringe3 driven by a 25-mm micrometer graduated to 0.01 nun on the vernier with further estimation possible. The deliveries of the syringes used were approximately 0.02 ml per mm with a total capacity of about 0.5 ml.
Sobel and Hanok (1951)) in titrations of Mg and Ca in blood plasma, and Hughes and Klotz (1956a), in titratiom of Zn in the presence of serum al- bumin, had found no interference by the protein present in their respective EDTA titrations; in fact, Hughes and Klotz (1956a) reported a sharpening of the end-point by the protein, which facilitated the titrations. In the present work, generally only a slight sharpening of the end- point in the presence of protein could be observed.
To check the system and to correct for a very slight interference with the titration, which was observed in those few cases where Mg had to be titrated in the presence of a large excess of nucleo- tide, internal standards (by addition of known amounts of Mg to the titration system) were run periodically. If necessary, the Mg of the sample (after ashing) was precipitated as MgNH4P0, (Vogel, 1951; Kolthoff and Sandell, 1948) and dissolved in an excess of a standard EDTA solu- tion, and the excess EDTA was back-titrated a t pH 10 with standard MgC12 (Welcher, 1957).
B. TIDES.
DETERMINATION OF THE ADENINE NUCLEO-
1. Spectrophotometric determination. (a) In the absence of protein: The nucleotides
were determined from their absorbancy a t 259 mp a t pH 7, with the use of a molar absorbancy index of 1.54 x lo4 M - 1 cm -1 (Bock et al,, 1956). A t this wave length and pH, differences between AMP, ADP, and ATP were negligible. Dilutions for the measurements were usually made with 0.05 M phosphate, pH 7.0, to adjust the pH, and
*The end-point, after minor modification of the titration volumes, could also be determined con- veniently with the aid of a Beckman B spectro- photometer.
3 Burroughs Wellcome 8z Co., London, England.
for the blank cuvette the Tris-KC1 buffer was diluted in identical fashion.
(b) In the presence of the proteins: The con- centrations of nucleotide and protein were deter- mined by measurements of the absorbancy a t two wave lengths and substitution into equations (1) and (2) for pH 7.0 (0.05 M phosphate): Concentration of nucleotide in the presence of ATP-Cr transphosphorylase, c C A = (0.704 X OD259 mr - 0.368 x OD280 me) X
moles of adenine- nucleotide per liter (1)
In the presence of myokinase, c V A = (0.701 X OD259 me - 0.286 X OD279 mp) X
moles of adenine-
These equations were obtained with use of the absorbancy indices a t pH 7.0, 0.05 M phosphate for the two proteins which had been redetermined
nucleotide per liter (2)
6 , p 0 mr to be C C ~ * O m r = 0.8& mlmg-l cm-l and F~; - -
1.9] for ATP-Cr transphosphorylase (cf. also Noda et al., 1954a), and eMZi9 m@ = 0.573 ml mg-I
cm-1 and = 2.4& for myokinase (cf. also
Noda and Kuby, 1957b; Callaghan and Weber, 1959). The equations were checked withmixtures of known composition of the two proteins and various nucleotides, and up to an absorbancy of 1.0 (1-cm light path) were found to be directly additive, within the experimental error, for the sum of the individual absorbancies.
The absorbancy measurements in the ultra- violet were made with a modified Beckman DUR equipped with a Leeds and Northrup Speedomax Recorder, a Beckman DU with photomultiplier attachment, or a Gary Model 11. The selection of the instrument depended upon the absorbancy range to be covered and the spectral purity de- sired. This procedure was repeatedly checked as described under 2, and spectrophotometric meas- urements were not used a t very high concentra- tions of ATP.
2. Enzymic determinations in protein-free samples.
(a) AMP was determined with adenylic deamin- ase according to the procedure of Kalckar (1947).
(b) ADP was determined either by coupling the ADP - phosphoenolpyruvate transphosphorylase system with lactic dehydrogenase and measuring DPNH a t 340 mp or by coupling the myokinase reaction with the hexokinase-Zwischenferment system and measuring the TPNH formed a t 340 mP-
(c) ATP was determined with the hexokinase- Zwischenferment system and calculated from the TPNH formed.
3. Titrimetric determination of phosphate after acid hydrolysis of ATP. At high concentra- tions of ATP a greater precision than that ob- tained under 1 and 2 was required, but leas sensi- tivity could be afforded. Thua, the highly pre-
6M279 mr
Vol. 1 , No. 5, September, 1962 STUDIES ON ATP TRANSPHOSPHORYLASES IV. 751
cise EDTA titration, as described by Welcher (1957) or Flaschka (1959) for inorganic phosphate, was adapted for the special conditions. After wet acid digestion of the sample containing the ATP and evaporation of the acid, the liberated phos- phate was precipitated as MgNH4P04 (Vogel, 1951; Kolthoff and Sandell, 19483. The precipi- tate was thoroughly washed with 2% ”,OH and finally dissolved by the addition of 2 N HC1 or in some cases standard EDTA directly. A known aliquot of EDTA standard solution (0.01 or 0.1 M) was added to a slight excess, the pH was adjusted to 10, and the excess EDTA was back- titrated with a standard MgC12 solution (0.01 or 0.1 M) against Eriochrome Black T as an indica- tor, as described above. Each pmole phosphate titrated corresponded originally to one third of a pmole ATP present, and the high precision per- mitted binding measurements, where the other two procedures described could not yield signifi- cant differences a t relatively high ATP concentra- tions. The presence of 3 P atoms per mole of ATP made this indirect titration procedure more suitable for ATP than for ADP or AMP. It is evident that contamination of the nucleotide by inorganic phosphate would introduce serious errors into this determination. This necessitated laborious purifications of the commercial sub- strates to reduce the inorganic phosphate to a trace level, as has been described in the “Mate- rials” section.
C . DETERMINATION OF THE NON-NUCLEOTIDE SUBSTRATES.
1. Creatine. For the high concentrations of creatine employed in the binding studies, colori- metric procedures (Peters, 1942; Ennor and Stocken, 1948) lacked the required precision. Since creatine contains 3 N atoms per mole f32.05%), elementary analysis of nitrogen by the Kjeldahl procedure of Hiller et al. (1948) per- mitted a precision of the creatine determination in protein-free samples of 0.1 to 0.2%. Contamina- tion by extraneous NH, was avoided by satura- tion of all the distilled water used for preparation of the buffers and dialysis fluids with gaseous nitrogen (see above) and borate (0.01 M) buffer substituted for Tris. Since creatine in solution might slowly decompose into creatinine, periodic checks for creatinine were made by the Jaff6 reaction (Peters, 1942) on the equilibrium dialysis samples as well as on the original creatine solu- tions.
2. Creatine phosphate. Creatine phosphate was measured colorimetrically either by the acid molybdate-labile phosphate method (Kuby et al., 1954), by the determination of creatine (Ennor and Stocken, 1948) after acid hydrolysis, or after conversion to creatinine by the Jaff6 reaction (Peters, 1942). A t high concentrations, Cr-P was determined, analogously to creatine, by ele- mentary analysis of nitrogen (19.90% N calcu- lated for the anhydrous free acid).
D. DETERMINATION OF PROTEIN. 1. The biuret procedure (Gornall et a/. , 1949’1
was calibrated by dry weight determinations, corrected for ash, of samples which had been ex- haustively dialyzed versus 0.01 M KC1 and then against distilled water, all dialysis fluids saturated with gaseous nitrogen. For a 10.0-ml total vol- ume, the biuret factors obtained for a 1-cm light path a t 540 mp were 32.5 for ATP-Cr transphos- phorylase and 31.2 for myokinase, in mg per ab- sorbancy unit. Coincident with these determin- ations elementary nitrogen analyses for the two proteins were carried out (Mahowald et al., 1962a; Noltmann et aZ., .1962).
Protein could be measured in the presence of the nucleotides without interference. Tris buffer can give a very small contribution to the color develop- ment, which was corrected for by addition of the same amount of Tris buffer to a control blank cuvette. Magnesium, however, interfered greatly [Mg(OH), precipitates in the biuret reagent] and was removed from the sample by precipitation of the protein with 10% trichloroacetic acid. The precipitated protein was washed once with 10% trichloroacetic acid and the precipitate was dis- solved in the proper amount of biuret reagent.
2. Spectrophotometric determinations of the proteins were made in the absence of the nucleo- tides with use of the specific extinction coefficients a t one wave length (see above), or in the presence of the nucleotides a t two wave lengths and with the use of equations (3) and (4):
Concentration of ATP-Cr transphosphorylase in t.,e presence of adenine-nucleotide, CC = (1.22 X OD280 mp -
1.182 X OD259 mp) mg per ml (3)
Concentration of myokinase in the presence of adenine nucleotide, CX = (1.89 X OD z i p m p -
0.343 X OD269 mp) mg per ml (4)
A t high nucleotide concentrations compared to the protein, the spectrophotometric results were checked with the biuret procedure. The spectro- photometric protein determination proved to be approximately ten times as sensitive as the biuret procedure but somewhat less accurate.
I I I . Experimental Procedures for Equilibrium Binding Measurements
A. EQUILIBRIUM DIALYsIs.-In general, the procedure of Klotz (Hughes and Klotz, 1956b) was followed with a few minor changes in experimental detail. Several lots of Nojax seamless Visking cellophane casing (thin-wall, 18/32 in. inflated diameter) were analyzed for their trace copper content (F. D. Snell et al., 1959) and those with the lowest amount of Cu were selected for use. Attempts to purify the cellophane tubing by extraction in hot solutions proved unsatisfactory since they led to uncontrollable changes in
Biochemistry 752 STEPHEN A. KUBY, THEODORE A. MAHOWALD, AND ERNST A. NOLTMANN
strength and porosity of the bags. It was found sufficient to wash the tubing exhaustively a t room temperature first with distilled water followed by 0.01 M EDTA, pH 8.0, then again with distilled water, and finally with the Tris-KC1 buffer used for the runs. The high salt concentration of the buffer as well as the EDTA facilitated removal of the trace contaminants by divalent metals, and, after one week of washing, metal contaminations of the wash fluids appeared to be negligible, and, moreover, the physical properties of the tubing appeared to be qualitatively unaltered. The cellophane casings were then stored under the buffer to be used and equilibrated at least one day a t 3” before the run was started.
The dialyses were performed in weighing bottles (25 x 50 mm) with ground glass stoppers (24/12 T), which were found very convenient to control total volume changes by means of weight deter- minations. For the dialysis, 25 or 30 cm long strips of the cellophane tubing, washed and equilibrated as described above, were knotted a t one end (three overlapping knots), excess liquid was squeezed out, and an aliquot was pipetted to the bottom of the bag with care to avoid wetting of the bag walls; the pipette was guided by a microfunnel inserted into the open end of the bag. After removal of the funnel, the open end of the bag was knotted close to the liquid surface, excess tubing was cut off and retained to correct (by difference) for the length of tubing used, and the bag was inserted into the weighing bottle. Usually a 3-ml volume was employed inside the bag (con- taining the protein) and 6 ml liquid outside, and in general these volumes were the minimum to permit analyses of the accuracy desired. The vessels were then stoppered and placed into a shaking rack (capacity 20 bottles) constructed to hold the stoppers firmly in the bottles. The rack was shaken gently in a cold room (3’) for the duration of the experiment.
The time to reach equilibrium averaged 24 (16 to 48) hours and the approach to equilibrium was periodically tested whenever the conditions and concentrations were altered. In some cases, a Pyrex glass bead (acid washed) was inserted inside the bag to facilitate mixing. Further checks were performed by experiments in which the equilibrium dialysis was started with initial concentrations inside and outside of the bag which approximated the equilibrium distributions of previous runs. The shorter time then required to reach equilibrium (6 to 12 hours) minimized errors due to decomposition of the substrates themselves; these runs and “dilution experi- ments” as described by Katz and Klotz (1953) provided evidence for the reversibility of the binding.
Any possible volume changes inside the bag were calculated by measurement of the initial and the final protein concentrations and outside the bag simply by weight differences. Control dialy- ses without protein but with otherwise identical
composition of the liquids were run simultaneously with each set of bags containing protein. Correc- tions for binding by the bag (cf. Hughes and Klotz, 1956b) were in general extremely small or negligible if well-washed tubing was used.
Analyses of the substrates arid Mg were made for both the control and the sample runs, on both the inside and the outside fluids. The amount of substrate bound to the protein (or of Mg, if present) was calculated (Hughes and Klotz, 1956b) from the average values obtained from the inside and outside analyses for substrate or Mg and from the outside analyses and total pro- tein. These values generally agreed very well within the experimental error. In those cases where disagreement was found, this could usually be attributed to experimental failures and those samples were accordingly discarded.
B. SEDIMENTATION GRADIENT PROCEDURE.- The technique used was essentially that of Chanutin et al. (1942) as applied by Velick (Velick et al., 1953; Hayes and Velick, 1954). The sedi- mentation runs were conducted in the rotor J of a Spinco Model E Ultracentrifuge a t maximum speed (56,100 rpm). Since complete separation of protein and unbound substrate could not be achieved within several hours of centrifugation for myokinase, the extrapolation procedure of Chanutin et al. (1942) was employed with a slight modification.
After 1 4 hours of centrifugation at 56,100 rpm and 3” (the time required to establish the gradient depended upon the concentration ranges of protein and substrate employed and which of the two proteins was under study), the rotor was allowed to decelerate under “slow brake” or, after an initial application of “slow brake,” was allowed to coast to rest with the brake disengaged en- tirely. After transfer of the rotor to the cold room, known aliquots were removed from each tube with a supported Luer-Lock syringe equipped with a glass needle and a three-way stopcock system. The needle had a bent tip as described by Velick et al. (1953). Aliquots from a t least four layers along the long axis of the tube, includ- ing the bottom layer, were analyzed. In general, 6.2 ml total volume was centrifuged per tube, and, where smaller volumes were used, the tube was filled by overlaying with paraffin oil (Heavy White Mineral Oil, USP, Standard Oil) to prevent collapsing of the tube during centrifugation (Velick et al., 1953). Buffer, 0.1 ml, was placed outside the tube into each compartment of the rotor to act as a “cushion” during acceleration. As pointed out (Velick et al., 1953), the centrif-
ugation in an angle rotor does not run ideally towards the bottom of the tube. This may result in some error in estimation of rfa (see below for definitions) from the slope of an Ao.r versus PO plot (Ao, , = Ao,, + ,’,Po), since the bottom layer over-weights the slope of the curve. To correct for this possible error, both the calculated mean values for Po and Ao,t from the average of all
Vol. 1, No. 5, September, 1962 STUDIES ON ATP TRANSPHOSPHORYLASES IV. 753
measured values in the tube and from the initial concentrations were included in the statistical plots. By variation of the centrifugation time, the gradient was adjusted so that a t least two and preferably three out of the minimum four points lay to the left of the mean values. Therefore, the plot tended to weight the extrapolated intercept more than the slope. From the extrapolated in- tercept (Ao, , ) , the value for the unbound substrate a t zero protein concentration was obtained, and the value of F f A , the average number of moles of substrate bound per mole of protein, was calcu- lated in a straightforward manner from the con- servation equation (Ao, , = Ao., + Ao,,).
To correct for some free sedimentation of the nucleotides, which might occur during centrifuga- tion for prolonged periods of time, the nucleotide concentrations for each arbitrary layer from the control tubes (without protein) were measured, and the deviations which were calculated from the initial concentrations were applied as a cor- rection for each respective layer of the sample tube (with protein). Analogous measurements for MgClz without protein revealed that the difference in concentrations of the metal between the upper quarter and the lower quarter never amounted to more than 1% for the highest con- centration employed and the longest periods of centrifugation.
Molecular weights of 8.1 x 10⁴ for ATP-Cr transphosphorylase (Noda et d., 1954a; Nolt- mann et al., 1962) and 2.13 x lo4 for myokinase (Mahowald et al., 1962a) were used for calculation of the average number of moles bound per mole of total protein.
The selection of pH 7.9, a temperature of 3 O , and an ionic strength of at least 0.16 was a compromise for the study and comparison of both the proteins and was guided by the following considerations:
1. Theoretical titration curves constructed from the amino acid analyses of the two proteins (Mahowald et al., 1962a; Noltmann et al., 1962) indicated at p H 7.9 net charges of approximately -5 for ATP-Cr transphosphorylase and +4 for myokinase. Although these values cannot be taken as absolute, since they are subject to electro- static influences, they nevertheless provide a good index of the possible magnitude of the Donnan ionic asymmetric distributions. Calcu- lation of the theoretical osmotic pressure as a function of the salt concentration, protein con- centration, and pH (Hober, 1945) favored pH 7.9 as a compromise pH to study both proteins, and revealed that, at a salt concentration of a t least 0.15 M, errors due to the theoretical Donnan osmotic pressure at this pH and in the preaence of 50 mg ATP-Cr transphosphorylase protein per ml would not be greater than 3T0. In contrast, at pH 9 the errors could be considerably larger for ATP-Cr transphosphorylase.
For reasons of stability of both the sub- strates and the proteins, a temperature close to 0' and a slightly alkaline pH was employed.
2.
Preliminary binding measurementa had indicated that the binding coefficients in general had pK values less than 5, 80 that relatively high protein concentrations had to be employed. Final con- centrations studied ranged from 1 to 7% for ATP-Cr transphosphorylase and up to 3% for myokinase. To adjust the ionic strength and to reduce the Donnan corrections, as discussed above, the neutral 1 : 1 electrolyte KC1 was selected.
THEORY AND CALCULATIONS
Each of the adenine nucleotides studied here is presumed to exist in solution, and especially in the presence of Mg, in the form of a large number of ionic and complex species (Bock, 1960; Kuby and Noltmann, 1962), each of which could be considered to be in equilibrium with the protein. The concentrations of many of these species, however, are very small under the conditions selected for study, 90 that their contribution to the binding picture could be neglected. The most important species of ATP at pH 7.9 are ATP4- and MgATP2- and to a lesser degree KATP3- and HATP3-, and, similarly, the analogous species for ADP and AMP. To what degree the results could be affected by neglecting all the other spe- cies and other possible sources of error will be discussed later. For the present, only the domi- nant species are considered. The following bind- ing equations (see Klotz, 1953: Hughes and Klotz, 1956b; Scatchard et al., 1950; Edsall and Wyman, 1958) are applicable to the present work.
Case ( a ) .--For n equivalent and noninteracting sites on a protein, neglecting electrostatic effects, i.e., n independent sites of a single type capable of binding species A:
i = O
(5) where F A is the average number of moles of A bound (Ab) per mole of total protein ( P o ) ; n is the maximum number of moles of species A bound per mole of total protein; A, is the concen- tration of unbound A; and KA is the intrinsic association constant.
Case (b).-If two species, A and B, may be bound competitively at the same sites of the pro- tein,
2 i(PAiBj)
5 (PAiBj) 1948) (6) , i + J > n (Klotz et al., i - 1 j = O
?'A =
i = O j = O
and
754 STEPHEN A. KUBY, THEODORE A. MAHOWALD, AND EHNST A. NOLTMANN Biochemistry
and similarly for competition by several species
n ( A 1) KA ? I A = ____
(Scatchard et d., 1950) (8) 1 + KA(A/) + Ks(B1) + Kc(C/) + . . .
If ATP'- and MgATP2- are considered the only species of ATP which are significantly bound to the protein, and if their binding is competitive at the Same n sites, then, following case ( b ) : I ' m ' - =
and ? ' M ~ A T I O =
~ K M , A ~ I . J (MgATP2-) I
1 + KAT^ (ATP'-)/ + KM.ATP (MgATP'-)/ - __
(10) If
r ' A + B = T'.&TP'- + r'MgAT1'2- = p'measurnl, (11)
then r'A+E =
n [KAT[,' (A1'P4 -) / + K M ~ A T I , ~ (MgATP' -1 11 1 + K ~ T ~ ~ - ( A T P ~ - ) / + KY~ATPZ (MgATPT,
(12) or
r'A+ B = n - ~ ' A + B ,
Ka(ATP'-)j + KE(MgATP' ) I
(13)
where KA = KAT,"- and Kg = K M K A T P z . A plot of the left-hand side of equation (13) versus r ' A + B should be linear for the postulates and for the assumptions made with both x- and y- intercepts yielding an identical value of n and a theoretical slope of 1.0.
The equation may be rearranged to read:
F ' A + B __ - - (ATP'- + MgATPZ-)/
(ATP'-)/ t (KA (ATP4- + MgATP"),
(ATP"), KA + (ATP4- + MgATPz-),
which is of the form
(15)
and which is similar to the Scatchard rearrange- ment of the equation given for case (a), viz.
".' = nK.* - f'~K.4 (Scatchard et al., 1950). (16) A ,
For a series of determinations, if the mole fraction of the unbound species (which is not eaual to the initial concentration before the
ATP4 - start of the run) (ATP4- + MgATP2-
) could be held constant, MgATPZ- (ATP'- + MgATP2- then @(K;,B) Gill be held constant and a plot of
versus F',+B will yield
@ ( K A , B ) as the slope, n@(KA.B) as the ordinate in- tercept, and n as the abscissa intercept.
If KA (for ATP4 -) can be evaluated from experi- ments without Mg, i.e. where MgATP2- is 0, then Ke (for MgATPz:) may be evaluated from the @ ( K A , B ) values. In the special case where KA = KB = K, @ ( K A , B ) equals K, and regardless of the mole fractions
~ ' A + B
(ATP4- + MgATP2-)/
ATP4- + MgATP2-),
@ ( K A , B ) will be invariant and identical to KA. A value of KB could be arrived at very simply for this special case.
In the case where KB >> KA, as the mole ('gATP2-), increases, n@(&,B) in- fraction of At"
creases. Or for the converse case, where KB << KA, n@(KA,B) decreases with an increase in (MgATP' -) f
A/" In principle, (ATP4-), or (MgATPZ-), can be
evaluated from measurements of total unbound ATP [(ATP),.,] and the total unbound Mg (Mg,.,) (when Mg has been added to the system). To calculate the species, the following approxi- mate conservation equations have been employed for pH 7.9 and 3 O in the presence of KC1:
For ATP, in the absence of Mg, (ATP)o,/ G (ATP4-)/ + (HATP'-)/ + (KATPa-),
(17)
or
(ATP)o,/ E (ATP4-)/ (1 + E + Ks(K+)) . K7
(18)
(Definitions of the acid dissociation and complex stability constants are given in Table I.) For ATP, with Mg added, (ATP),,/ ZE (ATP4-)/ + (MgATP*-)/ +
(HATP3-) J + (KATPS-) I ; (19)
(Mg1a.f (Mg2+)/ + (MgATP2-)/ (20)
[where, e.g., such magnesium complexes as MgHATP-, Mg(ATP)+-, and Mg2ATP have been neglected at the p H and the range of concentra- tions of Mg, and ATPu employed; a discussion
Vol. 1, No. 5, September, 1962 STUDIES ON ATP TRANSPHOSPHORYLASES IV. 755
TABLE I STABILITY CONSTANTS OF THE VARIOUS IONIC AND COMPLEX SUBSTRATE SPECIES SELECTED' FOR 3' AND
Ll 10.2
Formation (Stability) Constant Selected
Species (moleslliter) - 1
MgATPZ- KATP3-
HATP3-
MgADP- KADPZ- HADPZ- MgCr-P KCr-P- HCr-P- MgAMP KAMP - HAMP-
(Ki) 2 x loab (K5) 4
106.9
1 x 10³~
106.7 2
9 0.3 104.5 20 0.7 106.5
.The values for the stability constants selected here are based upon the data of Burton (1959). O'Sullivan and Perrin (1961), Melchior (1954), and Smith and Alberty (1956a,b); see also Smith (1955) for electrophoretic mobility measurements a t 0 '. b Estimated from a value of 7 X 10⁴, selected for 30' and p 0.1 (Kuby and Noltmann, 1962), with a A H of 5 kcal per mole (Burton, 1959) (to yield therefore 3 X lo4 M-' a t 3' for K1) and corrected to a fi of 0.2 by applying an ionic strength contribution of approximately 30 yo (Burton, 1959). Estimated from a value of 3 X 10³ (Kuby and Noltmann, 1962) selected for 30' and p = 0.1 with a AH of 6 kcal per mole (Burton, 1959) and an ionic strength contribu- tion of about 207, (Burton, 1959) and rounding off to one significant figure.
of errors involved in these approximations is given later]. After rearrangement in terms of (ATP4-), the equation (with magnesium present) may be written as
and
and (MgATP'-)/ = K1(Mgz +)/(ATP'-)/. (23)
Similar equations can be set up for ADP, AMP, and Cr-P, considering only the equivalent species, as for ATP.
The numerical values for the stability constants of the various ionic and complex species of the substrates involved have been the subject of
much investigation, and a wide range of values have been reported (Bock, 1960). The reasons for selecting the particular metal stability con- stants employed here (Table I) have been re- viewed elsewhere (Kuby and Noltmann, 1962) for 30". Except for the acid dissociation constants, they have been converted to 3" and 0.2 ionic strength with the aid of AH of 5 kcal per mole for the ATP species (Burton, 1959), 6 kcal per mole for the ADP species (Burton, 1959), and 6 kcal per mole for AMP and Cr-P species, assuming the values that Smith (Smith, 1955: Smith and Alberty, 1956a) found for MgHPO, and KHPOd-. A value of 300 cal or less for A H (Alberty et al., 1951) was assumed to apply for all acid dissocia- tion constants.
RESULTS
The data obtained with ATP-Cr transphos- phorylase and its substrates by the equilibrium dialysis technique and by the sedimentation procedure are described in Figures 1 and 2 re- spectively. Figure 3 depicts the results obtained with myokinase and its substrates by the sedi- mentation method.
In the preaence of added magnesium, the bind- ing of the nucleotides to ATP-Cr transphosphoryl- ase appears to be a function of the total un- bound magnesium concentration, i.e., (Mg)o.,. The effects are described in terms of competitive binding of the dominant Mg chelate versus the major unchelated species in solution. As men- tioned above, for ATP the mole fractions of
determine the effect
on the slope [@(KAIB)] and on the ordinate inter- cept [n@(Kd.B)] of the Scatchard-type plot. As will be noted in Figures 1A and 1B for ATP-Cr transphosphorylase and ATP or ADP, respec- tively, the mole fractions of these unbound species -in contrast to the total initial concentrations, eg., of ATP,'- or of MgATPt2---could not be held absolutely constant. To demonstrate the effect, in Figures 1A and 123 a few sets of data with narrowed ranges were selected from a large body of data (refer to legends of the figure%), but a quantitative analysis is better made with the lower sets of curves in Figures 1C and lD, which include all the data obtained in the presence of
Qualitatively, it is evident from Figure 1A that
(MgATPZ-)' increases, the ordi- as the value for
nate intercept increases, with little change (after consideration of the experimental error or the range in mole fraction values) in the value of n (Le., the abscissa intercept). For ATP and Mg, most of the data were gathered in the range of
0.8 to 0.95 for the mole fraction ~ - ~ . For ADP, the smaller metal complex stability constant for MgADP- (Table I) did not permit
('gATP2-)/ and _____ A," A,"
Mg.
A,"
(MgATP' -) A ),I
756 STEPHEN A. KUBY, THEODORE A. MAHOWALD, AND ERNST A. N O L T M A " Biochemistry
1 3.6
-1 -1 - 1 -1
rA 01 rA+,, rA OT rA+B
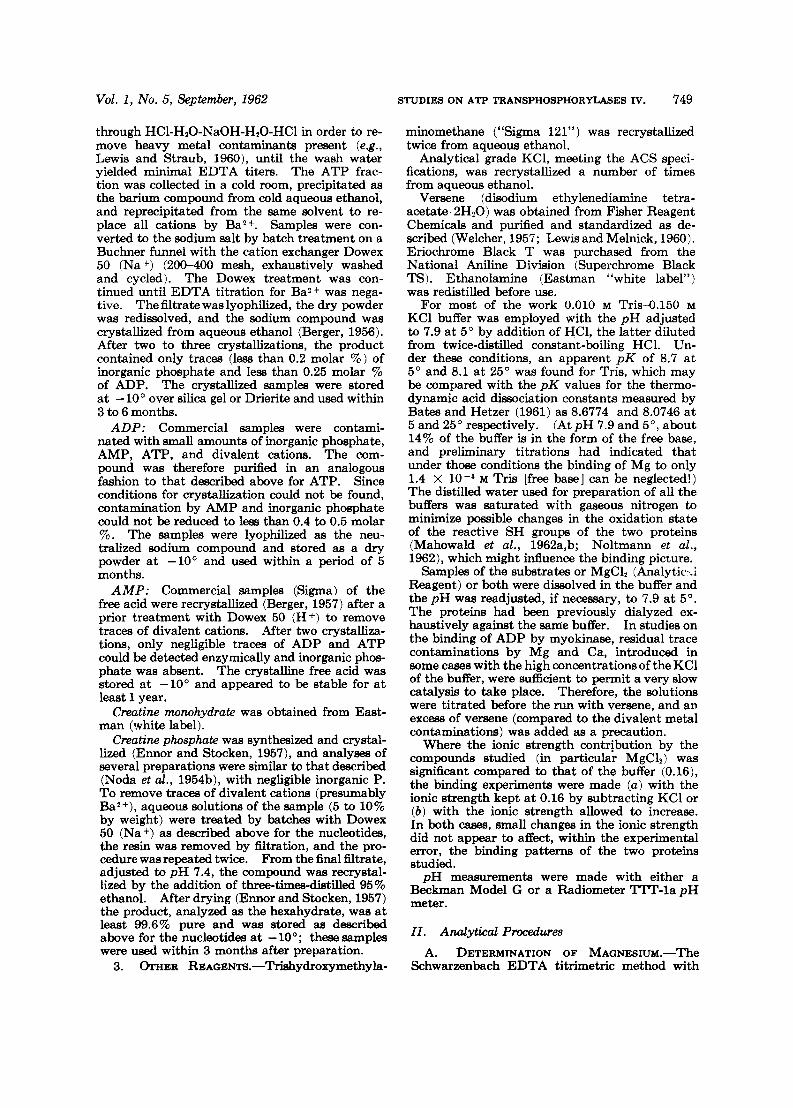
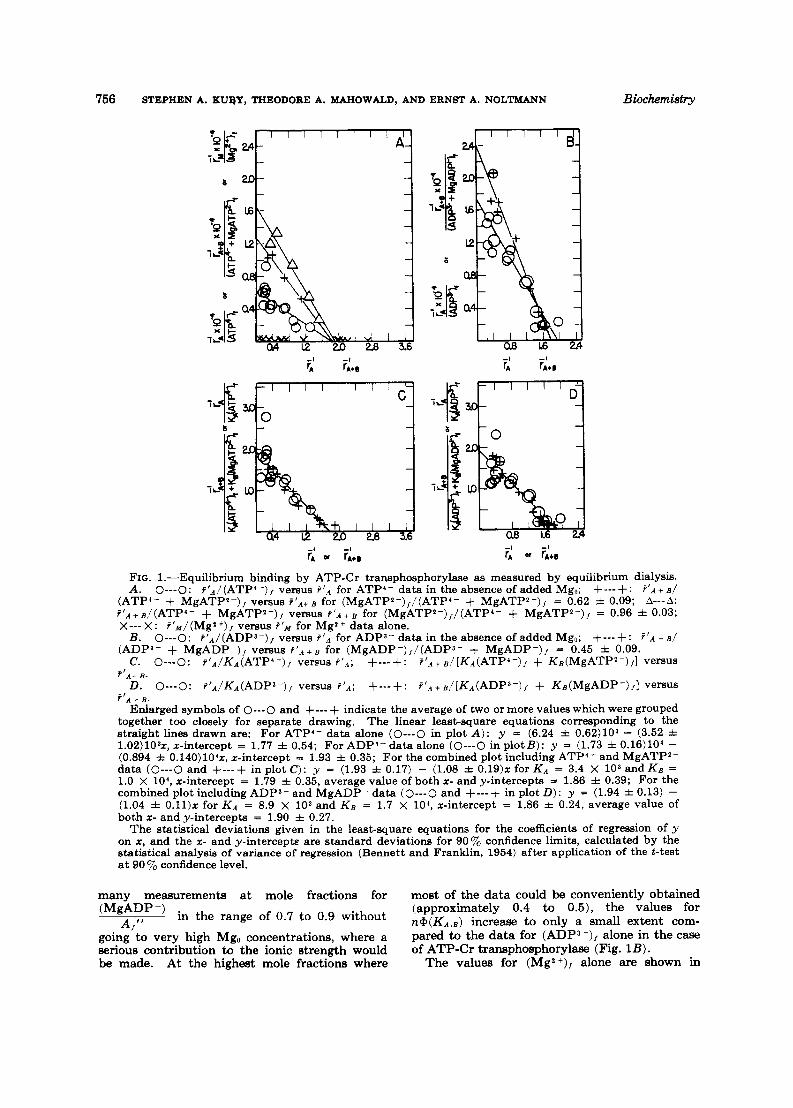
FIG. 1.-Equilibrium binding by ATP-Cr transphosphorylase as measured by equilibrium dialysis. A. 0---0: ?'n/(ATP4-), versus ? I A for ATP4- data in the absence of added Mgo; +---+: ? ' A C E /
(ATP4- + MgATP2-)/ versus ? ' " + E for (MgATP*-),/(ATP4- + MgATPZ-), = 0.62 f 0.09; A---A: I 'A+R/(ATPI- + MgATP*-)/ versus ? ' A + B for (MgATPS-)//(ATPd- + MgATP*-)/ = 0.96 f 0.03; X- - -X : ?'.w/(Mg*+)/ versus ?'M for Mg2+ data alone.
B. 0-0: ?'"/(ADPs-)/ versus ?'A for ADPJ- data in the absence of added Mgo; +---+: ? ' A + E / (ADP3- + MgADP-)/ versus ? ' A + S for (MgADP-),/(ADPS- + MgADP-)/ = 0.45 f 0.09.
C. 0---0: F ' " / & ( A T P ~ - ) ~ versus ? l A ; +---+: ?'. ,+B/[K.4(ATP4-)/ + KB(MgATP2-)j] versus
D. 0-0: ?'.,/KA(ADP3-)/ versus +---+: ? ' A + B/[KA(ADP3-)f + KB(MgADP-)/] versus
Enlarged symbols of 0-0 and +--- + indicate the average of two or more values which were grouped together too closely for separate drawing. The linear least-square equations corresponding to the straight linea drawn are: For ATP'- data alone (0-0 in plot A) : y = (6.24 f 0.62)103 - (3.52 f 1.O2)1Osx, x-intercept = 1.77 f 0.54; For ADPJ- data alone (0-0 in plotB): y = (1.73 f 0.16)104 - (0.894 f O.140)1O4x, x-intercept = 1.93 f 0.35; For the combined plot including ATP4- and MgATP2- data (0-0 and +---+ in plot C): y = (1.93 f 0.17) - (1.08 f 0.19)~ for K A = 3.4 X l o 3 and K B = 1.0 X lo4, x-intercept = 1.79 f 0.35, average value of both x- and y-intercepts = 1.86 f 0.39; For the combined plot including ADPs- and MgADP- data (0-0 and +---+ in plot D): y = (1.94 f 0.13) - (1.04 f 0.11)~ for K A = 8.9 X lo3 and KB = 1.7 x 101, x-intercept = 1.86 f 0.24, average value of both x- and y-intercepts = 1.90 f 0.27.
The statistical deviations given in the least-square equations for the coefficients of regreasion of y on x , and the x - and y-intercepts are standard deviations for 90% confidence limits, calculated by the statistical analysis of variance of regreasion (Bennett and Franklin, 1954) after application of the t-test at 90 yo confidence level.
?'A+ B .
?'A + B .
many measurements at mole fractions for most of the data could be conveniently obtained (approximately 0.4 to 0.5), the values for
pard to the data for (ADP3-)/ alone in the case of ATP-Cr transphosphorylase (Fig. 1B).
The values for (Mgz+)/ alone are shown in
going to very high Mgo concentrations, where a serious contribution to the ionic strength would be made. At the highest mole fractions where
Vol. 1, No. 5, September, 1962 STUDIES ON ATP TRANSPHOSPHORYLASES IV. 767
t 1 - 2 9
b/"h x o
L 0
L 0
-I -I
h or E
2.0
1.0
0.0
3.0
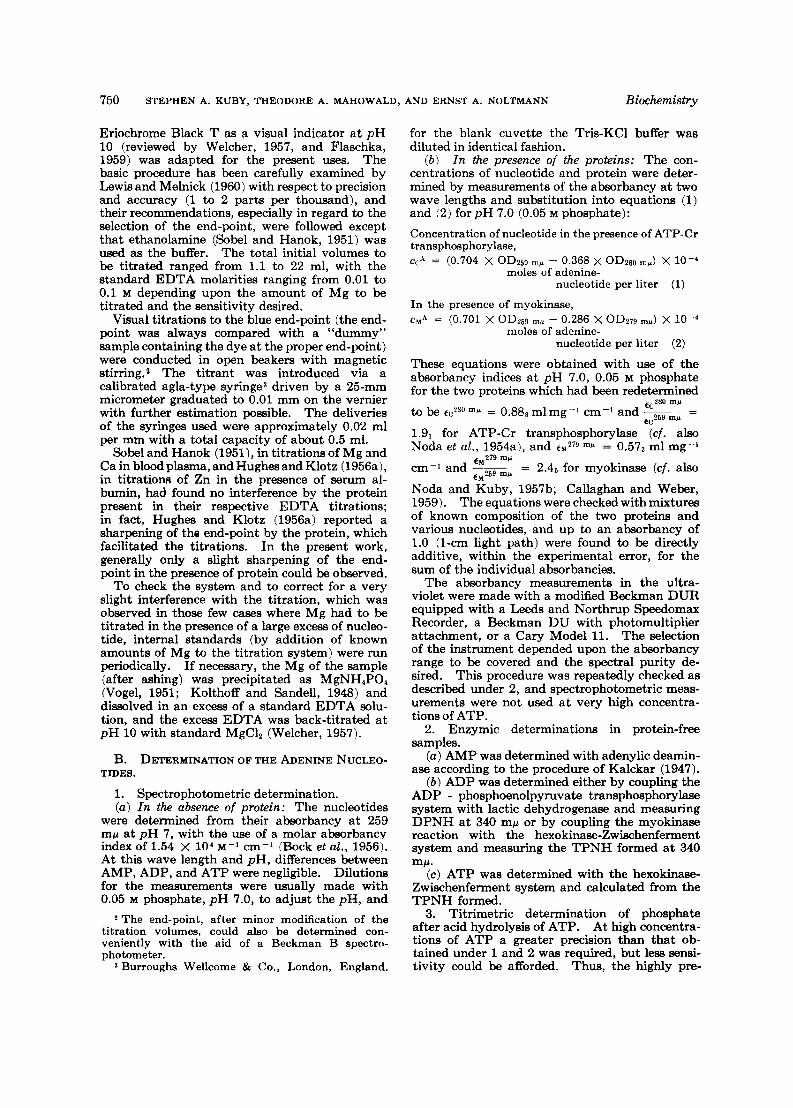
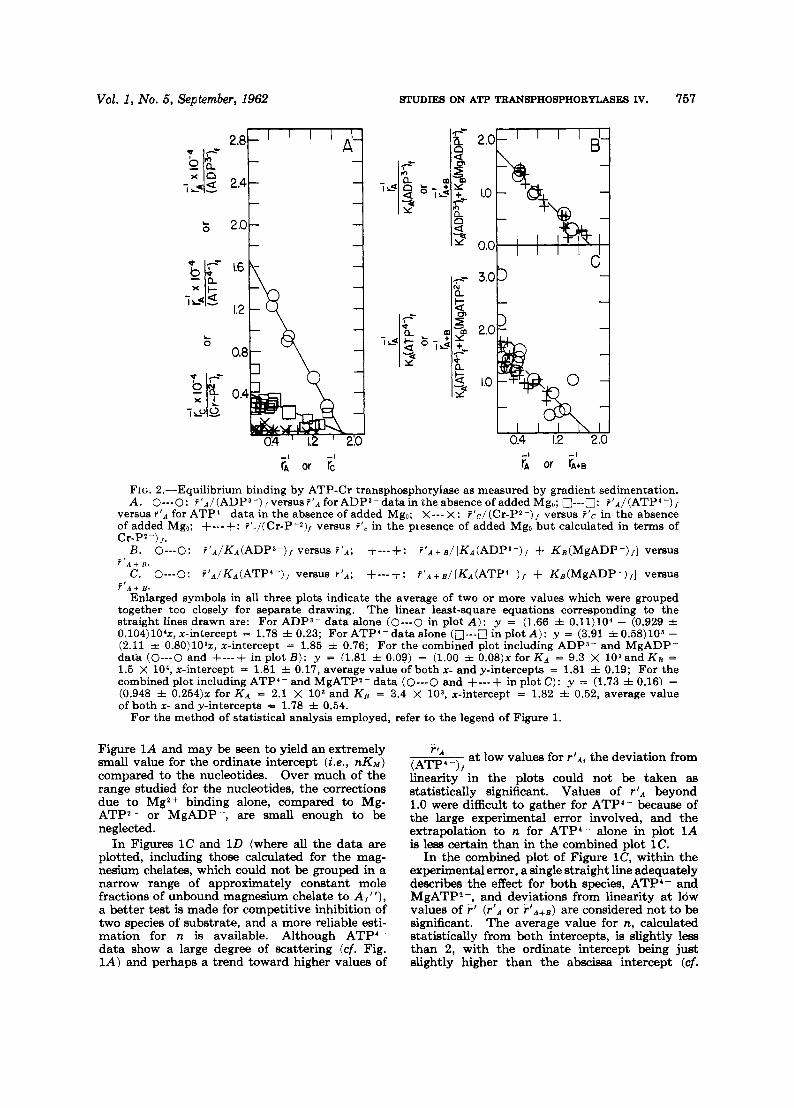
FIG. Z.-Equilibrium binding by ATP-Cr transphosphorylase as measured by gradient sedimentation. A. 0-0: f 'A/(ADP3-) ,versusf '~ forADP3-datain the absence of added Mgo; o---o: P'A/(ATP'-),
versus % I A for ATP'- data in the absence of added Mgo; X--- X : f'c/(Cr-P*-), versus f ' c in the absence of added Mg,; +-.-+: f'</(Cr-P-*), versus F', in the piesence of added Mg, but calculated in terms of Cr-P2-) ,.
B. O---O: f 'a/Ka(ADP3-)/ versus ! ' A ; + - - - + E ~ ' A + B / [ K A ( A D P ~ - ) / + KB(M~ADP-) , ] versus
C. O---O: ~ ' A / K A ( A T P ~ - ) , versus F ' A ; +---+: ~ ' A + B / [ K A ( A T P ~ - ) , f KB(M~ADP-) , ] versus f ' A + R .
? ' A + B . Enlarged symbols in all three plots indicate the average of two or more values which were grouped
together too closely for separate drawing. The linear least-square equations corresponding to the straight lines drawn are: For ADPs- data alone (0-0 in plot A): y = (1.66 f 0.11)104 - (0.929 f 0.104)104x, x-intercept = 1.78 f 0.23; For ATP4- data alone (n---n in plot A): y = (3.91 f 0.58)103 - (2.11 f 0.80)103x, x-intercept = 1.85 f 0.76; For the combined plot including ADPs- and MgADP- d a k (0---0 and +---+ in plot B): y = (1.81 f 0.09) - (1.00 =k 0 . 0 8 ) ~ for K A = 9.3 X 10³and K B = 1.5 x 10⁴, x-intercept = 1.81 f 0.17, average value of both x- and y-intercepts = 1.81 f. 0.19; For the combined plot including ATP4- and MgATP2- data (0-0 and +---+ in plot C): y = (1.73 f 0.16) - (0.948 f 0.254)~ for K A = 2.1 X lo3 and K B = 3.4 X lo3, x-intercept = 1.82 f 0.52, average value of both x- and y-intercepts = 1.78 f 0.54.
For the method of statistical analysis employed, refer to the legend of Figure 1.
Figure 1A and may be seen to yield an extremely small value for the ordinate intercept (Le., ~ K M ) compared to the nucleotides. Over much of the range studied for the nucleotides, the correctione due to Mg2+ binding alone, compared to Mg- ATP?- or MgADP-, are small enough to be neglected.
In Figures 1C and 1D (where all the data are plotted, including those calculated for the mag- nesium chelates, which could not be grouped in a narrow range of approximately constant mole fractions of unbound magneaium chelate to A,"), a better test is made for competitive inhibition of two species of substrate, and a more reliable esti- mation for n is available. Although ATP4- data show a large degree of scattering (cf. Fig. IA) and perhaps a trend toward higher values of
a t low values for P A , the deviation from r ' A
(ATP4-) t linearity' in the plots could not be taken as statistically significant. Values of r ' A beyond 1.0 were difficult to gather for ATP4- because of the large experimental error involved, and the extrapolation to n for ATP4- alone in plot 1A is less certain than in the combined plot 1C.
In the combined plot of Figure lC, within the experimental error, a single straight line adequately describes the effect for both species, ATP4- and MgATP2-, and deviations from linearity at low values of F' (F'" or F'A+B) are considered not to be significant. The average value for n, calculated statistically from both intercepts, is slightly less than 2, with the ordinate intercept being just slightly higher than the abscissa intercept (cf.
758 STEPHEN A. KUBY, THEODORE A. MAHOWALD, AND ERNST A. NOLTMANN Biochemistry
2 01- -i
I2
0 8
0 4
08 16 24 3 2
2 0 24m 2 0 ! I C 1
-1 12 - ! 0 4
0 8 I6 2 4
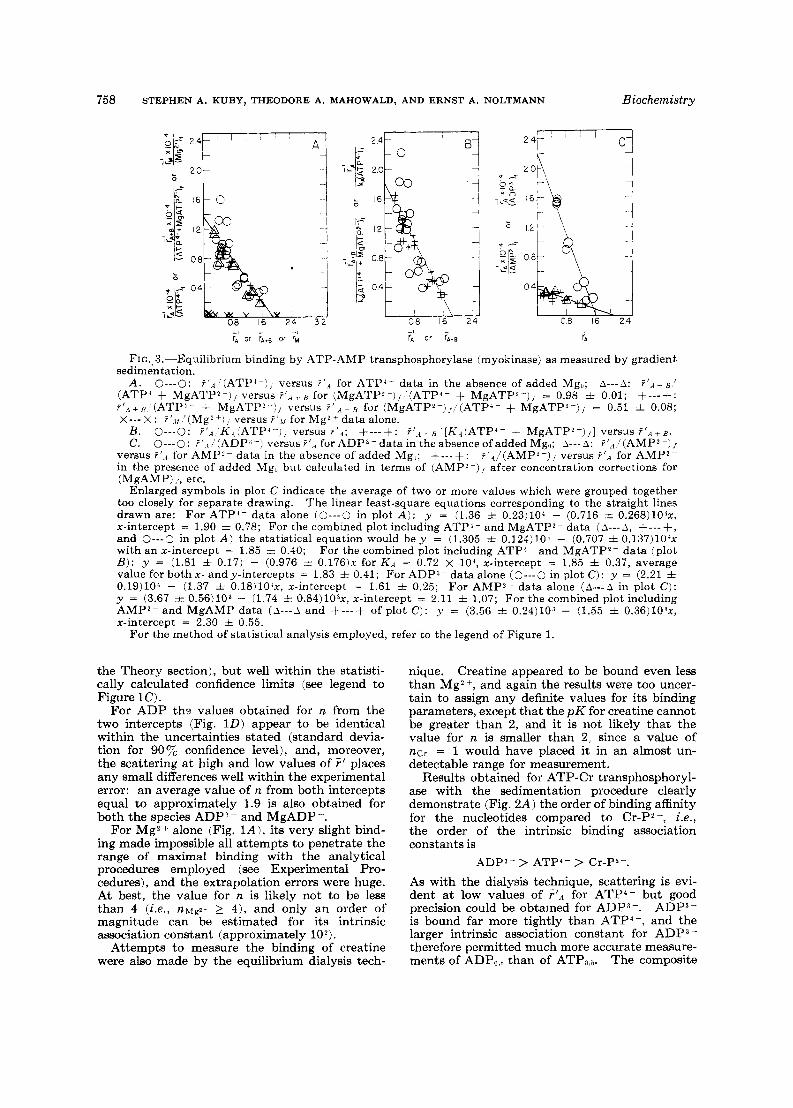
FIG.. 3.-Equilibrium binding by ATP-AMP transphosphorylase (myokinase) as measured by gradient sedimentation.
A . 0-0: '(ATPA-)f versus P I A for ATP'- data in the absence of added Mgo; A-- -A: P ' A + B ! (ATP' + MgATP2-), versus r'.., for (MgATPZ-)j ' (ATP4- + MgATP'-)/ = 0.98 + 0.01; +---+: ?'.4+,?, '(ATP4- + MgATP' -1, versus for (MgATPZ-),'(ATP'- + MgATPQ--)j = 0.51 f 0.08; X - - - X : ?'.ll ' ( M ~ * + ' I , versus ? ' , l for Mg*+ data alone.
B. 0-0: ? I A 'K.,(ATP'--j, versus ? ' . l ; +---+: ?'.,t B '[Ka(ATP'- + MgATP*-)j] versus ? ' A + B . C. 0-0: ?'.,l(ADP(j-) versus?',* forADP3-data in theabsenceofadded Mgi,; A-- -A: ?',r.'(AMP*-)/
versus ?'.4 for AMP?- data in the absence of added Mg,; +---+: ?'.l/(AMP2-), versus ?'A for AMPz- in the presence of added Mgu but calculated in terms of (AMPZ-), after concentration corrections for (MgAMP) ,., etc.
Enlarged symbols in plot C indicate the average of two or more values which were grouped together too closely for separate drawing. The linear least-square equations corresponding to the straight lines drawn are: For ATPI- data alone (0---0 in plot A ) : y = (1.36 f 0.23)104 - (0.716 f O.268)1O4x, x-intercept = 1.90 zt 0.78; For the combined plot including ATP1- and MgATP2- data ( A - - - A , +--- +, and 0-0 in plot A ) the statistical equation would b e y = (1.305 f 0.124)10' - (0.707 i O.137)1O4x with an x-intercept = 1.85 i 0.40; For the combined plot including ATP4- and MgATP2- data (plot B ) : y = (1.81 f 0.17) - (0.976 f 0 . 1 7 6 ) ~ for K A = 0.72 X lo', x-intercept = 1.85 i 0.37, average value for both x - and y-intercepts = 1.83 f 0.41; For ADP3- data alone (0---0 in plot C ) : y = (2.21 f 0.19)lO' - (1.37 f 0.18)10'x, x-intercept = 1.61 f 0.25; For AMP'- data alone ( & - - A in plot C ) : y = (3.67 f 0.56)103 - (1.74 f O.84)1O3x, x-intercept = 2.11 * 1.07; For the combined plot including AMPZ- and MgAMP data ( . i - - - A and f---+ of plot C): y = (3.56 f 0.24)103 - (1.55 + O.36)1O3x, x-intercept = 2.30 f 0.55.
For the method of stat.istica1 analysis employed, refer to the legend of Figure 1.
the Theory section), but well within the statisti- cally calculated confidence limits (see legend to Figure 1 C) .
For ADP thz values obtained for n from the two intercepts (Fig. 1D) appear to be identical within the uncertainties stated (standard devia- tion for 90% confidence level), and, moreover, the scattering a t high and low values of F' places any small differences well within the experimental error: an average value of n from both intercepts equal to approximately 1.9 is also obtained for both the species ADP3 - and MgADP -.
For Mg2+ alone (Fig. lAj, its very slight bind- ing made impossible all attempts to penetrate the range of maximal binding with the analytical procedures employed (see Experimental Pro- cedures), and the extrapolation errors were huge. At best, the value for n is likely not to be less than 4 ( i .e . , n M g z + 2 4), and only an order of magnitude can be estimated for its intrinsic association constant (approximately lo2).
Attempts to measure the binding of creatine were also made by the equilibrium dialysis tech-
nique. Creatine appeared to be bound even less than Mg2 +, and again the results were too uncer- tain to assign any definite values for its binding parameters, except that the p K for creatine cannot be greater than 2, and it is not likely that the value for n is smaller than 2, since a value of ncr = 1 would have placed it in an almost un- detectable range for measurement.
Results obtained for ATP-Cr transphosphoryl- ase with the sedimentation procedure clearly demonstrate (Fig. 2A) the order of binding affinity for the nucleotides compared to Cr-P2-, Le. , the order of the intrinsic binding association constants is
ADP3- > ATP4- > Cr-P2-.
As with the dialysis technique, scattering is evi- dent at low values of F r A for ATP4- but good precision could be obtained for ADP3-. ADP3- is bound far more tightly than ATP", and the larger intrinsic association constant for ADP - therefore permitted much more accurate measure- ments of ADPa,D than of ATPo,*. The composite
Vol. 1, No. 5, September, 1962 STUDIES ON ATP TRANSPHOSPHORYLASES IV. 759
plots in Figures 2B and 2C, which are drawn statistically (see legends to figures), yielded aver- age values of slightly less than 2 for both nucleo- tides and their magnesium chelates.
In Figure 2A a nonlinear trend for ATP4- might be evident to the eye at low values of rIA (cf. also Fig. lA) , and the data might be fitted in terms of two intrinsic binding constants (see pp. 612 ff. and 648 ff. in Edsall and Wyman, 1958) rather than the one constant as is deter- mined. The scattering of the points and the experimental error do not allow a statistical dis- tinction between these two types of plots and, therefore, the simplest case was assumed for the least square plotting.
Binding measurements of Cr-P?-, which is also bound only slightly but stronger than Mg2 - or Cr*, placa the value for ncr-p at least greater than or equal to 2; and again because of the small intrinsic association constant for Cr-P? - only the upper and lower limits of a pK between 2 and 3 can be taken as reliable. In addition, because of the extremely small metal complex stability con- stant for MgCr-P and the slight binding, the eff2ct of Mg on the binding was difficult to ascer- tain. The fraction of (MgCr-P)i of the total unbound (Cr-P), could not be increased to more than about 20%, and the values could therefore be calculated only in terms of binding of Cr-P2-, after correction for MgCr-P (see Fig. 2A, lowest ploti, and a reliable plot for Kzlgcr p was thus not possible to obtain.
In the case of myokinase, some aspects were similar to those of ATP-Cr transphosphorylase, but quantitatively, some points were distinctly different. From Figure 3A it is evident that the Mg*+ binding is extremely small (probably even slighter than that for ATP-Cr transphosphorylase) with a pK of 2 or less. The value for n\fgz+ could not be determined with confidence but likely is in the vicinity of 3 to 8, with a greater probability of 4 or larger.
The influence of added Mg, on the binding of ATP to myokinase is interesting in that, within the experimental error, approximately the same
values are obtained for (MgATPj- + ATP4-), versus a t several mole fractions of
F l A t f J
(MgATP*-)' __ ~ (see Fig. 3A) , placing the intrinsic A/
association constant for MgATP* - approximately equal to that for ATP4- (see Theory section).
Although there is scattering at low values of F'* or r I A + A in the combined plot (Fig. 3 B ) , the least square line reveals practically no differences in n obtained a t both intercepts, both intercepts being identical within the statistical deviations, and an average value of 1.8 is calculated for n.
For AMP (Fig. 3C) the small value for the metal complex stability constant (see Table 1 for MgAMP) again made it difficult to penetrate a
(MgAMP), range where the mole fractions of -~ A j "
were greater than 0.3, and a reliable estimate for MgAMP could not be made. Thus the values in Figure 3C were calculated only in terms of AMP' -, corrected for MgAMP concentrations. There is a trend, however, which suggests that, if the data are calculated in terms of Z(MgAMP + AMP' -) (. the intrinsic association constant for MgAMP is likely to be slightly smaller than that for AMP? -.
The extent of binding of ADP?- (Fig. 3C) is somewhat greater than for ATP4- (or MgATP2-) and clearly much greater than for AMP2-. The extrapolated value of ~ A I , P ~ is only about 1.6 (see legend for calculated standard deviation a t 90Tc confidence level) and. accordingly, it might also be possible to fit the data to the equation for two distinct sets of binding sites (with n = 1 for each set: see Edsall and Wyman, 1958). But because of the limited number of experimental points in the critical range at relatively high values for I' approaching the x-intercept, a more com- plicated nonlinear plot to distinguish the two con- stants did not appear to be justified. Consider- ing the type of experimental approach and attend- ant errors, a value of 1.6 is not so far removed from the integer 2 to be taken as significantly different, and whether there are two different nonequivalent myokinase binding sites for ADP3 - or two equiva- lent and independent sites cannot be answered with any degree of certainty from the data pres- ently available for myokinase.
Obviously, no direct measurement of the intrin- sic association constant for MgADP - to myoki- nase can be made, since the addition of magnesium will immediately result in an initiation of the myokinase-catalyzed reaction, which will proceed until a chemical equilibrium is reached between all the nucleotide substrates. It might be guessed that, in view of the results obtained with ATP (or AMP), the intrinsic constant for MgADP - is approximately the same as that for ADP3-.
It is apparent that, within the experimental error, which can be quite large for estimates of small intrinsic association constants, the simple theory presented adequately describes the equilib- rium binding for the nucleotide substrates in terms of competitive binding of the two species present in the highest concentration (in the pres- ence of Mg) under the conditions employed for measurement (pH 7.9, 3", and p
A summary of all the derived constants for equilibrium binding to ATP-Cr transphosphoryl- ase is presented in Table TI, obtained by the two methods described here as well by a third, very approximate method described elsewhere (Maho- wald et al., 1962b). Table I11 summarizes the derived constants for myokinase obtained with the sedimentation method. These calculated intrinsic constants are expressed as dissociation constants (the reciprocal of association constants) in order to facilitate a comparison with kinetically derived constants discussed elsewhere (Kuby and Noltmann, 1962; Noda, 1962).
0.2).
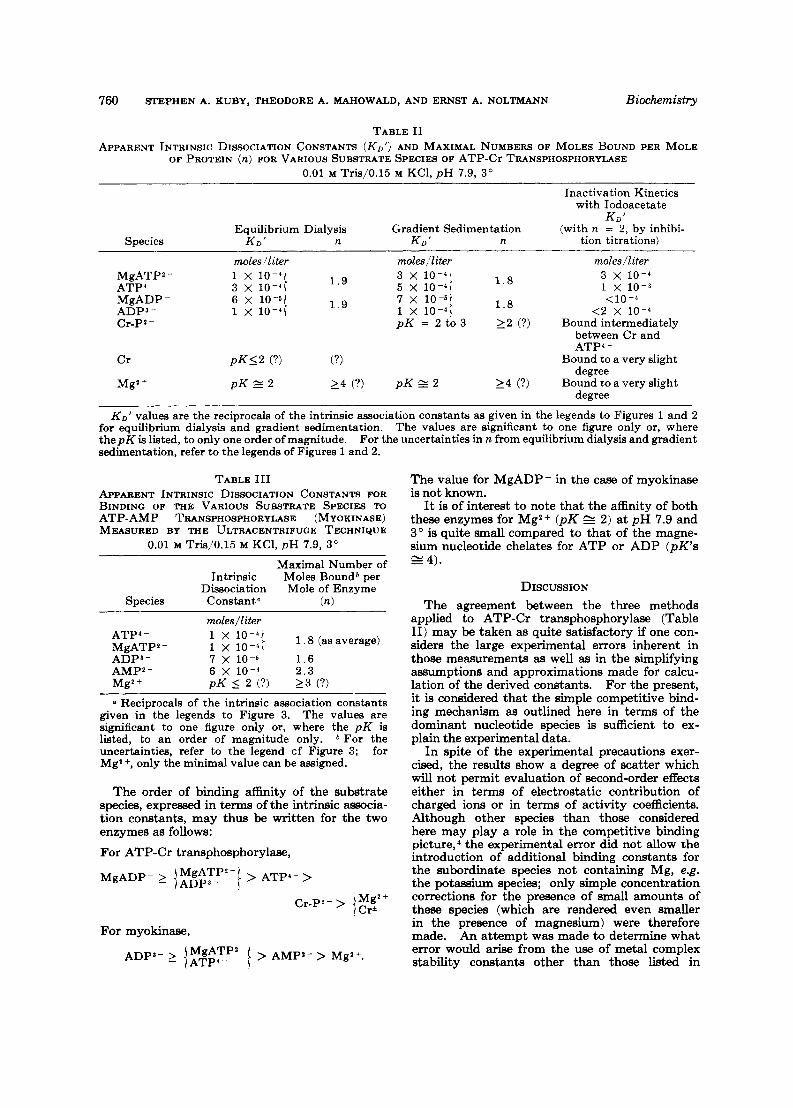
760 STEPHEN A. KUBY, THEODORE A. MAHOWALD, AND ERNST A. NOLTMANN Biochemistry
TABLE I1
OF PROTEIN (n) FOR VARIOUS SUBSTRATE SPECIES OF ATP-Cr TRANSPHOSPHORYLASE 0.01 M Tris/O.l5 M KC1, p H 7.9, 3'
APPARENT INTRINSIC DISSOCIATION CONSTANTS (Kn') AND MAXIMAL NUMBERS OF MOLES BOUND PER MOLE
Inactivation Kinetics with Iodoacetate
K n ' Equilibrium Dialysis Gradient Sedimentation (with n = 2 , by inhibi-
Species KD' n KD' n tion titrations)
MgATP2- ATP4 - MgADP- ADP3- Cr-Pt -
Cr
Mgz +
moleslliter
1 . 9
1 . 9
1 x 10⁻⁴( 3 x 10⁻⁴F
1 x 1 0 - 4 1
6 X 10-51
p K s 2 2 4 (9
moles/l iter molesll iter 3 x 10⁻⁴ 1 x 10⁻³
3 x 10⁻⁴) 5 x 10⁻⁴C
1 x 10⁻⁴, 1°-'t 1.8 <2 x 10⁻⁴
1 . 8 c10-4
p K = 2 to 3 2 2 (?) Bound intermediately between Cr and ATP4 -
Bound to a very slight degree
p K g 2 2 4 (?) Bound to a very slight degree
Ko' values are the reciprocals of the intrinsic association constants as given in the legends to Figures 1 and 2 The values are significant to one figure only or, where
For the uncertainties in n from equilibrium dialysis and gradient for equilibrium dialysis and gradient sedimentation. t hepK is listed, to only one order of magnitude. sedimentation, refer to the legends of Figures 1 and 2.
TABLE I11
BINDING OF THE VARIOUS SUBSTRATE SPECIES TO ATP-AMP TRANSPHOSPHORYLASE (MYOKINASE)
0.01 M Tris/O.l5 M KCl, p H 7.9, 3'
APPARENT INTRINSIC DISSOCIATION CONSTANTS FOR
MEASURED BY THE ULTRACENTRIFUGE TECHNIQUE
Maximal Number of Intrinsic Moles Boundb per
Dissociation Mole of Enzyme Species Constanto (n)
moles / I iter
lo-'' 1 . 8 (asaverage) ATP4 - MgATPZ - 1 x io-4F
ADP3- 7 x 10⁻⁶ 1 . 6 AMPP- 6 x 2 . 3 Mgl+ pK 5 2 (?) 2 3 (?)
a Reciprocals of the intrinsic association constants given in the legends to Figure 3. The values are significant to one figure only or, where the pK is listed, to an order of magnitude only. * F o r the uncertainties, refer to the legend cf Figure 3; for Mg* +, only the minimal value can be assigned.
The order of binding affinity of the substrate species, expressed in terms of the intrinsic associa- tion constants, may thus be written for the two enzymes as follows:
For ATP-Cr transphosphorylase,
For myokinase,
ADPJ-
The value for MgADP- in the case of myokinase is not known.
It is of interest to note that the affinity of both these enzymes for Mgz+ (pK 2) at pH 7.9 and 3' is quite small compared to that of the magne- sium nucleotide chelates for ATP or ADP (pK's = 4). N
DISCUSSION The agreement between the three methods
applied to ATP-Cr transphosphorylase (Table 11) may be taken as quite satisfactory if one con- siders the large experimental errors inherent in those measurements as well as in the simplifying assumptions and approximations made for calcu- lation of the derived constants. For the present, it is considered that the simple competitive bind- ing mechanism as outlined here in terms of the dominant nucleotide species is sufficient to ex- plain the experimental data.
In spite of the experimental precautions exer- cised, the results show a degree of scatter which will not permit evaluation of second-order effects either in terms of electrostatic contribution of charged ions or in terms of activity coefficients. Although other species than those considered here may play a role in the competitive binding picture,' the experimental error did not allow the introduction of additional binding constants for the subordinate species not containing Mg, e.g. the potassium species; only simple concentration corrections for the presence of small amounts of these species (which are rendered even smaller in the presence of magnesium) were therefore made. An attempt was made to determine what error would arise from the use of metal complex stability constants other than those listed in
Vol. 1, No. 5, September, 1962
Table I. For example, a twofold increase in the stability values selected, in general, would affect the intrinsic binding coefficients for MgATP2 - by less than 20% and slightly more for MgADP - under these experimental conditions, and would thus only alter the second figure. In view of these uncertainties, the data in Tables I1 and 111 are presented only with a significance of one figure. The possible contributions of H +, K +, C1-, and Tris+ to the binding picture remain to be estab- lished.
The binding data are of great usefulness in a comparison with kinetically derived constants. The data presented here are sufficiently accurate to provide restraint.s, on the one hand, and con- firmation, on the other hand, for several plausible kinetic mechanisms which may be proposed. For example, any kinetic mechanism which postu- lates that an enzyme-magnesium intermediate has an intrinsic dissociation constant smaller or equal to that of the magnesium chelates of the nucleo- tides (Morrison et al., 1961), must now be con- sidered highly unlikely. Recently, Morrison et al. (1961) and Nihei et al. (1961) both postulated a steady-state kinetic mechanism for the ATP-Cr transphosphorylase catalyzed reaction where all the equilibria were adjusted rapidly except for a single rate-determining step involving a ternary complex which contained magnesium. However, the approach, the assumptions made, and the type of calculations and approximations em- ployed, differed radically between these two groups. A quantitative discussion of their re- sults has been given by Kuby and Noltmann (1962), and the kinetically derived constants presented there are in qualitative agreement with the binding constants presented here in Table 11. Similarly, Noda's latest values for the myokin- ase reaction (Noda, 1962), recalculated from the kinetic data of Callaghan and Weber (1959) and Noda (1958), approximate the binding data (Table 111) for this enzyme.
Finally, the binding data indicate that a value of n E 2 may be taken as significant for the nucleotides and their magnesium chelates for both ATP-Cr transphosphorylase and myokinase. Within the experimental limitations, i t appears that for ATP-Cr transphosphorylase the binding sites are equivalent with little interaction, whereas for myokinase this point is in doubt. Inhibition titration of both enzymes with dinitrofiuoroben-
At the completion of the work, a digital computer analysis (see Kuby and Noltmann, 1962) had indicated tha t the approximate conservation equations used here for ATP,, ADP,,, and Mgr, (see Theory section) could introduce small calculation errors due to neg- lecting certain magnesium nucleotide species, e .g . Mg(ATP\,"-, MgiATP, MgHATP - , etc. But in- cluding these terms does not materially alter the final derived constants as presented here, provided that the neglected species d c not ha\ e intrinsic association binding constants t o the prljtein more than one crder of magnitude larger than the binding constant values given for MgATP2- and MgADP-.
STUDIES ON ATP TRANSPHOSPHORYLASES IV. 761
zene and iodoacetate had indicated an inhibitor equivalence point of 2, which could be assigned to two reactive SH groups in each of the enzymes (Mahowald et al., 1962b), but these titration data by themselves did not permit an unambiguous answer as to the number of catalytically active sites. The kinetics of inhibition by iodoacetate had also indicated for ATP-Cr transphosphorylase that these two SH groups reacted identically (Mahowald et al., 1962b; Watts et al., 1961), and together with the binding data now suggest that one SH group is present in each of two active sites, although this condition cannot as yet be taken as proved.
ACKNOWLEDGMENT
The authors express their gratitude to Professor H. A. Lardy for his support and continued interest in the problem.
REFERENCES Alberty, R. A., Smith, R. M., and Bock, R. M.
(1951), J . Biol. Chem. 193, 425. Bates, R. G., and Hetzer, H. B. (1961), J . Phys.
Chem. 65, 667. Bennett, C. A., and Franklin, N. L. (1954), Statis-
tical Analysis in Chemistry and the Chemical Industry, New York, John Wiley & Sons, Inc.
Berger, L. (1956), Biochim. et Biophys. Acta 20, 23. Berger, L. (1957), in Methods in Enzymology, vol.
111, Colowick, S. P., and Kaplan, N. O., editors, New York, Academic Press, p. 866.
Bock, R. M. (1960), in The Enzymes, vol. 2, Boyer, P. D., Lardy, H. A., and Myrback, K., editors, New York, Academic Press, p. 3.
Bock, R. M., Ling, N. S., Morell, S. A., and Lipton, S. H. (1956), Arch. Biochem. Biophys. 62, 253.
Burton, K . (1959), Biochem. J . 71, 388. Callaghan, 0. H., and Weber, G. (1959), Biochem. J .
7*3, 473. Chanutin, A., Ludewig, S., and Masket, A. V.
11942), J . Biol. Chem. 147, 737. Cohn, W. E. (1957), in Methods in Enzymology,
vol. 111, Colowick, S. P., and Kaplan, N. O., editors, New York, Academic Press, p. 867.
Darrow, R. A,, and Colowick, S. P. (19621, in Meth- ods in Enzymology, vol. 17, Colowick, S. P., and Kaplan, N . O., editors, New York, Academic Press, p. 226.
Edsall, J. T., and Wyman, J . (1958), Biophysical Chemistry, vol. I , New York, Academic Press, chap. 11.
Ennor, A. H., and Stocken, L. A. (1948), Biochem. J . 43, i90.
Ennor, A. H., and Stocken, L. A. (1957), Biochem. Prep. ,5, 9.
Flaschka, H. A. 11959), EDTA Titrations, New York, Pergamon Preqs.
Gornall, A. G., Bnrdawill, C. J., and David, M. M. (1949), J . Biol. Chem. 177, 751.
Hayes, J. E., Jr., and Velick, S. F. (1954), J . Biol. Chem. 207, 225.
FIiller, A., Plazin, J., and Van Slyke, D. D. (1948), J . Hiol. Chem. 176, 1401.
HBber, R . (1945), Physical Chemistry of Cells and Tissues, Philadelphia, The Blakiston Co., chap. 5.
762 STEPHEN A. RUBY, THEODORE A. MAHOWALD, AND ERNST A. NOLTMANN Biochemistry
Hughes, T. R., and Klotz, I. M. (1956a), J . A m . Chem. SOC. 78, 2109.
Hughes, T. R., and Klotz, I. M. (1956b), in Methods of Biochemical Analysis, vol. 3, Glick, D., editor, New York, Interscience Publishers, Inc., p. 265.
Kalckar, H. M. (1947), J . Biol. Chem. 167, 445. Batz, S., and Klotz, I. M. (1953), Arch. Biochem.
Biophys. 44, 351. Klotz, I. M. (1953), in The Proteins, vol. I, Neurath,
H., and Bailey, K., editors, New York, Academic Press, p. 727.
Klotz, I. M., Triwush, H., and Walker, F. M. (1948), J . A m . Chem. SOC. 70, 2935.
Kolthoff, I. M., and Sandell, E. B. (1948), A Text- book of Quantitative Inorganic Analysis, New York, The Macmillan Co.
Kuby, S. A,, and Mahowald, T. A. (1958), Fed. Proc. 17, 258.
Kuby, S. A., and Mahowald, T. A. (1959), Fed. Proc. 18, 267.
Kuby, S. A., Noda, L., and Lardy, H. A. (1954), J . Biol. Chem. 209, 191.
Kuby, S. A,, and Noltmann, E. A. (1962‘1, in The Enzymes, vol. VI, Boyer, P. D., Lardy, H. A., and Myrback, K., editors, New York, Academic Press, p. 515.
Lee, Y. P. (19573, J . Biol. Chem. 227, 987. Lewis, L. L., and Melnick, L. M. (1960), Anal.
Lewis, L. L., and Straub, W. A. (1960), Anal. Chem.
Mahowald, T. A., Noltmann, E. A., and Kuby, S. A.
Mahowald, T. A., Noltmann, E. A., and Kubv, S. A.
Melchior, N. C. (1954), J . Biol. Chem. 208, 615. Morrison, J. F., O’Sullivan, W. J., and Ogston, A. G.
Nihei, T., Noda, L., and Morales, M. F. (1961),
Chem. 32, 38.
32, 96.
(1962a), J . Biol. Chem. 237, 1138.
(1962b), J . Biol. Chem. 237, 1535.
(1961), Biochim. et Biophys. Acta 52, 82.
J . Btol. Chem. 236, 3202.
Noda, L. (1958), J . Biol. Chem. 232, 237. Noda, L. (1962), in The Enzymes, vol. VI, Boyer,
P. D., Lardy, H. A., and Myrback, K., editors, New York, Academic Press, p. 139.
Noda, L., Kuby, S. A., and Lardy, H. A. (1954a), J . Biol. Chem. 209, 203.
Noda, L., Kuby, S. A., and Lardy, H. A. (1954b), J. Biol. Chem. 210, 83.
Noda, L., and Kuby, S. A. (1957a), J . Biol. Chem. 226, 541.
Noda, L., and Xuby, S. A. 11957b), J . Biol. Chem. 226, 551.
Noltmann, E. A., Gubler, C. J., and Kuby, S. A. (1961), J . Biol. Chem. 236, 1225.
Noltmann, E. A., Mahowald, T. A., and Kuby, S. A. (1962), J . Biol. Chem. 237, 1146.
O’Sullivan, W. J., and Perrin, D. D. (1961), Biochim. et Biophys. Acta 52, 612.
Peters, J, H. (1942), J . Biol. Chem. 146, 179. Scatchard, G., Scheinberg, I. H., and Armstrong,
S. H. (1950), J . A m . Chem. SOC. 72, 535, 540. Smith, R. M. (1955), Thesis, University of Wis-
consin. Smith, R. M., and Alberty, R. A. (1956a), J. A m .
Chem. SOC. 78, 2376. Smith, R. M., and Alberty, R. A. (1956b), J . Phys.
Chem. 60, 180. Snell, F. D., Snell, C. T., and Snell, C. A. (1959),
Colorimetric Methods of Analysis, vol. IIA, Princeton, N. J., D. Van Nostrand Co., Inc.
Sobel, A. F., and Hanok, A. (1951), Proc. SOC. Exp. Biol. Med. 77, 737.
Velick, S. F., Hayes, J. E., and Harting, J. (1953), J . 6iol . Chem. 203, 527.
Vogel, A. I. (1951), Textbook of Inorganic Analysis, New York, Longmans, Green and Co.
Watts, D. C., Rabin, B. R., and Crook, E. M. (1961), Biochim. et Riophys. Acta 48, 380.
Welcher, F. J. (1957), The Analytical Uses of Ethyl- enediamine Tetraacetic Acid, Princeton, N. J., D. Van Nostrand Co., Inc.


![Increased Rate of Adenosine Triphosphate …...(CANCER RESEARCH 55, 4352-4360, October 1, 1995] Increased Rate of Adenosine Triphosphate-dependent Etoposide (VP-16) Efflux in a Murine](https://img.pdfslide.net/doc/110x75/5e7e8d68c5d0407f2447f2a9/increased-rate-of-adenosine-triphosphate-cancer-research-55-4352-4360-october.jpg)