Embed Size (px)
Citation preview
Final Report
Study on Assessment of Future Demand
for Skill Sets in Bihar
Indian Institute of Public Administration New Delhi
P.K.Chaubey Sant Lal Arora Project Director Consultant
Contents
Page No. Chapter I: Introduction…………………………………………….………….……..1-8
1.1 Introduction………………………………………………………………………1
1.2 Objectives…………………………………………………………….......3
1.3 Methodology…………………………………………………..3
1.4 Chapter Scheme…………………………………………………………….7
Chapter II: Procedure Alongwith the Computations Steps for Various Estimates of Skilled
Persons in Bihar from 2005 to 2025……9-21 2.1 Introduction…………………………………………………………..9
2.2 Industry-wise Economy Demand for Vocational Education and
Training………………………………………………..………9
2.3 Estimating Social Requirement for Persons with Vocational Education and Training ……………………………………..……19
2.4 Estimating the Number of Persons with Vocational Training to be trained by ITIs and
ITCs in Bihar …………………….….. 20
2.5 Identification of New trades having Employment Potential in the
State………………………………………………………….20
Chapter III: Skill Development and Training in India ………………………………………………………………………………….22-48
3.1 Introduction………………………………………………..…22
3.2 Demographic Dividend………………………………………………………....23
3.3 Existing Vocational Training
System………………………………………………………………........29
3.4 Dimensions of the Need for Vocational Training…
…………………………………………………………………………........33
3.5 Prioritization of Skill Building and Vocational Training…
………………………………………………………………………34
3.6 The quantitative aspect of the Skill Shortages…
…………………………………………35
3.7 The Qualitative aspect of Deficiencies…
………………………………………………37
3.8 Efficiency and Organization of ITIs ……………………………………….....40
3.9 Eleventh Five Year Plan Strategies…………………….….42
Chapter IV: Resources of Bihar State……………………………49-83
4.1 Introduction…………………………………………………49
4.2 Agriculture and Animal Husbandry……….………………………………50
4.3 Natural Resources………..………………………………………………..55
4.4 Population…………………………………………………………........59
4.5 Education………………………………………………….........63
4.6 Employment Scenario……….…………………………………….68
4.7 Health…………………………...........70
4.8 Economy of Bihar………………………………………72
4.9 Industry in Bihar…………………………………………..76
4.10 Infrastructural Development ……….…………………………………........81
Chapter V: Status of Vocational Education and Training in Bihar …………….……84-113
5.1 Introduction………………………………………………………….84
5.2 Population by Monthly per Capita Consumer Expenditure (MPCE)
…………………………………………………………......85
5.3 Literacy and Educational Level in the Population…………………………...88
5.4 Current Attendance in Educational Institutions
…………………………………….......92
5.5 Vocational Education and Training……………………………………101
Chapter VI: Estimating the Demand of persons with vocational education and training in
Bihar…………..114-151
6.1 Introduction………………………………………………….114 6.2 Demand of persons with vocational education and training within
state………………....115
6.3 Comparison of two methods………………………………………....134
6.4 Demand of persons who have passed ITIs/ITCs within the
state……………………........135
6.5 Demand for persons from Bihar with vocational skills from outside
…………………………………………………………………………136
6.6 Projected Estimates of shortages and surpluses of ITI/ITC trained 145
Chapter VII: Estimating the Societal requirement of Vocational Education and Training in
Bihar………………………….…………….152-179
7.1 Introduction………………152
7.2 Societal Requirement of Vocational Education and Training ……….154
7.3 Estimates of the Persons with Non-formal Training ……………….160
7.4 Comparison of Demand and Requirement of Vocationally Trained 160
Chapter VIII: Identification of skill sets in Bihar 180-210 8.1 Introduction…………………180
8.2 Methodology for Identification of Skill-sets
Trades)……………………………………………………………………………181
8.3 Sectors having concentration of skill-sets (trades) in
Future……………………………………………………………………..183
8.4 Views of experts regarding the future demand of Vocational Skills in Selected
Sectors…………………………………………191
8.5 Existing and New Trades for the state ……………….....199
Chapter IX: Summary and Conclusions………..…………………………………211-234
9.1 Skill Development and Training in India……………………211
9.2 The Study……………………………………212
9.3 Objectives……………………214
9.4 Methodology………………………………214
9.5 Status of Vocational Education and Training in Bihar …………………218
9.6 Estimating the Demand of persons with vocational training in Bihar ………….222
9.7 Estimating the requirement of Vocational Education and Training in
Bihar………………..………………228
9.8 Identification of Trades in Bihar…………….……………………………………231
Tables
Page No.
Chapter II: ….......9-21
Table 2.1 Codes used for Classifying Technical
Education……………………………………………………………………………..11
Chapter III: ……………………........22-48
Table 3.1: Projected Population by Broad Age-groups and Dependency Ratio in
India…………………………………………………………....24
Table 3.2: Details of Industrial training Institutes and Industrial Training Centers
…………………………………………………………………30
Table 3.3: Projected Employment in Agriculture, Industry, and
Services………………………………………………………………36
Table 3.4: Share of employment of different sectors till 2022………………………………………………………………………….36
Table 3.5: Requirement of persons till 2022—Select sectors……………………………………………………………………………37
Chapter IV:
………………………………………………………………………………………………………
………………………....49-83
Table 4.1: Production of Selected Crops in
Bihar…………………………………………………………………………………………
….……50
Table 4.2: Classification of Land in Bihar
……………………………………………………………………………………………..52
Table 4.3: Average Yield of Principal Crops in Bihar (in Kg Hectares)
…………………………………………………………………………...53
Table 4.4: Production of animal husbandry in Bihar…………………………………………
Table4.5: Irrigation Potential in Bihar
…………………………………………………………………………….…….57
Table 4.6: Production of selected minerals in Bihar …………..........58
Table 4.7: Various features of population of Bihar and all India
……………………………………………………………………………..…….60
Table 4.8: Projected Population by Broad Age-groups and Dependency Ratio in
Bihar…………………………………………………….……..61
Table 4.9: The literacy rate of Bihar and India
…………………………………………………..…….63
Table 4.10: Gross Enrolment Ratio (GER) in Bihar
…………………………………………………..…….64
Table 4.11: Dropout Rate in Bihar ------------------------------65
Table 4.12:- Industrial Training Institutes (ITIs) and Industrial Training Centres (ITCs) in
Bihar…………………………………………….......66
Table 4.13:- Growth of Actual Intake in ITIs/ITCs of Bihar by duration of course
…………………………………………………………….…..66
Table 4.14: Sanctioned Intake and Actual Intake of Vocational courses in institutes run by
Other Departments for the years 2008 and 2009… …………….……67
Table 4.15 Industry-wise Employment Growth during 1993-94 to 2004-05… ……….79
Table 4.16: Birth rate, Death rate and Infant Mortality Rate (IMR) in Bihar and India in
2007……………………………………………………71
Table 4.17: Sector-wise, Industry-wise GSDP (Rs. Lakhs) at 1999-2000 prices for the
years 1999-2000, 2004-05 and 2009-10 and their growth rates-Bihar state --------73
Table 4.18: Percentage distribution of GSDP by Industry at constant (1999-2000) prices…
…………………………………………………........74
Table 4.19: Number of Establishment and Workers in non-farm activities in Bihar and
India in 2005……………………………………….……76
Table 4.20: Share of Establishment and Workers in non-farm activities in Bihar in 2005
…………………………………………………….……77
Table 4.21: Number of Workers per Establishment in Bihar in 2005
………………………………………………………………………….........78
Table 4.22: Production and Distribution of Electricity in Bihar
……………………………………………………………………………….….....82
Table 4.23: Households availing banking services in Bihar in 2001… …………….......83
Chapter V: ………………………………………………………………………….84-113
Table 5.1: Per 1000 Distribution of Population by MPCE (Rs.) Class during 2004-05
………………………………………………………….....86
Table 52: Number of Households with no Literate Member of Age 15 years and above Per
1000 Households among all Members for Each MPCE Class during 2004- 05… …….89
Table 5.3: Per 1000 Distribution of Persons of 15 years and above by General Educational
Level for Bihar State………………………………..91
Table 5.4: Per 1000 Distribution of Age 5-29 years by Level of Current Attendance… .94
Table 5.5: Dropout Rate at Middle level for the Age-group 5-29 years …………96
Table 5.6: Current Attendance Rates (Per 1000) in Educational Institutions Per 1000
Persons of Different Age Groups…………………………98
Table 5.7: Per 1000 Distribution of Persons of Age 5-29 Years Who were Currently Not
Attending Any Educational Institution by Status and Broad Reason for Non-
Attendance… …………………………………99
Table 5.8: Per 1000 Distribution of Persons of Age 15-29 Years by Status of Vocational
Training Received or Being Received………………..103
Table 5.9: Number Per 1000 Persons of Different Age Groups Who Received Formal
Vocational Training……………………………………..104
Table 5.10: Number Per 1000 Persons of Different Broad Usual Principal Activity Status
in the Age -Group 15-29 Who Received Formal Vocational Training… ……........105
Table 5.11: Per 1000 Distribution of Persons of Age 5-29 Years by Status of Vocational
Training Received or being Received………………...107
Table 5.12: Per 1000 Distribution of Persons of Age 5-29 years Who Received Formal
Vocational Training by Institution of Training ………..110
Chapter VI: …………………………………………………………………114-151
Table 6.1: Sector-wise Industry-wise GSDP (Rs. Lakhs) at 1999-2000 Prices for the years
1999-2000, 2004-05 and 2009-10 and their Growth Rates-Bihar State -------117
Table 6.2: Sector-wise/Industry-wise Targeted Growth Rates of GSDP at 1999-2000 Prices
for the Period 2007-12 (Eleventh Plan)-Bihar State..118
Table 6.3: Industry-wise Actual and Proposed Growth Rates of GSDP at 1999-2000 Prices
for the Period 2005-25 in Bihar State……………….119
Table 6.4: Employment Elasticity of Employment (With Tech. Skills. 1994-2005)
…………………………………………………………………121
Table 6.5: Actual & Proposed Employment Elasticity of Employment (Tech.) w.r.t. SGDP
during 2005 to 2025…………………………..……...122
Table 6.6: Estimating the Projected Growth Rates of Employment (Technical)
……………………………………………………………………...123
Table 6.7: Estimating the Employment of Technical Manpower (in numbers)
……………………………….………………………………….......125
Table 6.8: Distribution of Employment Tech. (in 000s) by Levels of Skills in 2010, 2015
2020 and 2025…………………………………………..127
Table 6.9: Employment Elasticity of Total Employment w.r.t. GSDP during 1993 to
2004…………………………………………………………..128
Table 6.10: Actual & Proposed Employment Elasticity of Total Employment w.r.t. GSDP
during 2005 to 2025……………………………………130
Table 6.11: Estimating the Projected Growth Rates of
Employment………………………………………..131
Table 6.12: Estimating the Employment (in numbers) in 2010, 2015 2020 and
2025…………………………………………………………………133
Table 6.13: Estimating the Employment of Technical Manpower (with segregation and
different levels) (in 000s)……………………………….....135
Table 6.14: Estimating Future Demand for Vocational Employment in '000s
………………………………………………..……………………….137
Table 6.15 Net migration in Bihar state
…………………………………………………………………………………..……………
…………........139
Table 6.16 Distribution (per 1000) of out migrants by reason for out migration
………………………………………………………………...........139
Table 6.17 Migrants in other states whose place of last residence was Bihar (duration 0-9
years)……………………………………………………141
Table 6.18 Percentage Distribution of Migrant labour from Bihar by level of
Education……………………………………………………..............142
Table 6.19: Labour Outflows from India by destination 2004-
2009…………………………………………………………………………………...143
Table 6.20: State-wise Figures of Workers Granted Emigration Clearance/ECNR
Endorsement during the years 2004-2009……………………….144
Table 6.21 Additional Demand of ITIs/trained (in 000s) …………………..…147
Table 6.22: Projected Additional Demand of Shortages and Surpluses of ITIs/ITCs trained
on yearly ……………………………………………...148
Chapter VII: ………………………………………………………………………152-179
Table 7.1: State-wise Percentage of Employment in Agriculture and Allied sector and
Percentage of Persons in the age-group 15-29 years who Received/Receiving
Vocational Training in the year 2005 ………...155
Table 7.2: Percentage of Persons (in the age group 15-29 years) who require vocational
training from all departments ………………………..157
Table 7.3: Distribution of persons who would require training (in age-group 15-29 years)
by sectors………..………………………………...158
Table 7.4: Distribution of persons who would require training (in age-group 15-29 years)
by type of institution (in 000s)……………………..160
Table 7.5: Comparison of Future Demand and Requirement of Persons with Vocational
Training (in 000s)…………………………..161
Chapter …………………………………………………......180-210
Table 8.1: Skill sets in Demand in select sectors (illustrative) .184
Table 8.2: Demand for Vocationally Trained persons (in 000s) from 2005 to 2025 in
Different Industries in the State…………………..……186
Table 8.3: Increase in Demand for Vocationally Trained persons (in 000s) from 2005 to
2025 in Different Industries in the State…………..187
Table 8.4: Industry- wise Percentage Distribution of Persons with Vocational Trades in
Bihar during 2005……….………………………..189
Table 8.5 Growth Sector-wise Distribution of Existing Trades in ITIs/ITCs by Duration
of the Course ……………………………………200
Table 8.6: Growth Sector-wise Existing Trades in Other Departments by Duration of the
Course……………………………………………….203
Table 8.7: Growth Sector-wise Trades of one to two year Duration which may be
Introduced in Bihar……………………………………….....204
Table 8.8: Growth Sector-wise Trades of 3 months and 6 months Duration which may be
Introduced in Bihar……………………………...….205
Chapter X…………………………………………..........211-234
Table 9.1: Increase in Demand for Vocationally Trained persons (in 000s) from 2005 to
2025 in Different Industries in the State….233
Charts
Chapter ……………………………………………….…9-21
Chart II.1 Demand from Bihar… …………………………………...10
Chart II.2 technical Education ………………………………………10
Chart II.3 Estimation of Demand ……………………12
Chapter III: ……………………………………………………………….22-48
Chart III.1: Age Pyramid of India in 2001 ………………….....25
Chart III.2: Age Pyramid of India in 2006 ……………….…26
Chart III.3: Age Pyramid of India in 2011 ……………….…26
Chart III.4: Age Pyramid of India in 2016 ……………….…26
Chart III.5: Age Pyramid of India in 2021 ……………….…27
Chart III.6: Age Pyramid of India in 2026 …………….…27 Chart III.7: Diverse picture (Dependency ratio, %) …………………...28
Chart III.8 Stark Differences …………………………………………..29
Chapter IV: ……………………………………………..49-83
Chart IV.1: Age Pyramid of Bihar in 2001 ………….62
Chart IV.2: Age Pyramid of Bihar in 2006 ………….62
Chart IV.3: Age Pyramid of Bihar in 2011--------------.62
Chart IV.4: Age Pyramid of Bihar in 2016 ………….62
Chart IV.5: Age Pyramid of Bihar in 2021 ………….62
Chart IV.6: Age Pyramid of Bihar in 2026 ………….62
Chapter V:. ……………………………………84-113
Chart V.1: MPCE below Rs 410 (Rural) and below Rs 580 (Urban) ----.86
Chart V.2: Mean of MPCE …………………………………………...88
Chart V.3: Median of MPCE …………………………………………88
Chart V.4: Has to Supplement hh. Income …………………….......99

Chart V.5: Education not necessary …………100
Chart V.6: Has to attend domestic Chores ………………..100
Chapter VI: ……………………………………………..…...114-151
Chart VI.1 Additional Demand and Supply of ITIs/ITCs in Bihar ....149
Chart VI.2 Shortages and Surpluses of ITC/ITC passed (in 000s) in Bihar… 150
PREFACE
For last half a century human capital has been recognized as a critical factor
in economic growth and productivity. However, in developing country,
emphasis has been laid on physical capital as it was woefully inadequate in terms of physical infrastructure as well as machinery and equipment. It is
well recognized that there is a man behind the machine. So he has to be
well trained. Over time it was also recognized that much of production,
would shift towards services where too well-trained manpower would be needed. So, we need a labour force which is equipped with hard skills as
well as soft skills.
Eleventh Five Year Plan 2007-2012, while emphazing an inclusive strategy,
did recognize the importance of move towards knowledge economy and laid
emphasis on advancement of skills, including those which are beyond manual skills. It therefore launched a Skill Development Mission to be
completed within time frame of five to eight years, with a National Council, a Coordination Board and a Development Corporation. It also proposed
actions by State Governments and involvement of private sector.
In this background, the Department of Labour Resources, Government of Bihar, commissioned the Indian Institute of Public Administration to carry out a study on Assessment of Demand for Manpower with Vocational Skills
from Domestic/National and Oversees Market by 2025” with a view to chart
out its supply response to meet the challenge of emerging demand.
In the course of study we interacted with so many people from across avocations that it is difficult to name everybody and every contribution. Yet the team is beholden to Shri Vyas Ji, the Principal Secretary, who not nly
entrusted this important study to the IIPA but guided the team at various stages with his views on the subject. We would like to especially thank Shri
Sanjay Kumar, Assistant Director, Employment and Training, who was our
nodal resource person in Patna. We would also like to place on record the
help rendered by Shri Jitendra Kumar Sinha, Additional Director and Shri
Nirbhay Kumar, Deputy Director, Directorate of Statistics and Evolution, Shri
S. N. Prasad, Deputy Director (Dept. of Secondary Education) and Shri
Prabhakar, Office Assistant (Para Medical/Para Dental Examination Committee, Department of Health).
The Department of Labour Resources was kind enough to organize a workshop on May 5, 2011 in collaboration with the UNDP at AN Sinha
Institute of Social Science at Patna. We owe our special gratitude to the
Minister Shri Janardan Singh Sigriwal who sat through the complete
presentation and made valuable observations. We are also grateful to Dr. K.
N. Pathak, Joint Advisor, LEM, Planning Commission, who went through the
draft and organized on interactive session at the Planning Commission.
Dr. Sant Lal Arora, a consultant in the project, was a solid rock throughout the study. His endeavours to incorporate whatever was worth at every
stage are commendable. Shri S. K. Sengupta was also a Consultant for a
brief while and gave valuable insinght. Shri Swarup Santra, appointed a
Research Officer, could not continue for long but prepared a solid
background. Shri Safayat Karim, another Research Officer, to carry forward
the data work with sincerety. Ms. Bhawana Bhatt, Research Officer for a brief while, collected material from different agencies and brought quality
inputs from it is in Delhi. They all deserve my thanks. However, at the final
stages, it was writing effort on the part of Ms. Seema Girdhar that the
Report has taken an admirable shape. I wish to thank her from my heart.
However, weakness that still remain in the report are my monopoly.
P.K. Chabuey
(Project Director)
Chapter I
Introduction
1.1 Introduction
The prevailing employment strategy emphasizes the need for high growth as
a necessary condition for increase in employment. But high growth requires
adequate, qualified manpower with appropriate skills. Importance of skilled
manpower is further increased with the increasing pace of globalization which has
intensified the race of competitiveness among the producers world over to deliver
the goods at cheaper prices.
Recent data has shown that our education system and vocational training
programmes have not been able to provide the adequate size of skilled manpower.
As per the NSSO survey conducted in the year 2004-05, among the persons of age
15-29 years, only two per cent are reported to have received formal vocational
training and another 8 per cent, to have received non-formal vocational training
(NSSO, 2006). This indicates that very few young persons with formal vocational
training enter the workforce. This proportion of trained youth is one of the lowest
in the world (Govt. of India, Planning Commission, 2006).
It is not necessary that high growth with better skilled manpower would
always generate higher growth in employment. In India, during the recent past,
growth in organized sector, high as it was, has been jobless (Chaubey, P.K. 2005;
Arora and Saxena, 2003). So we may have to identify an appropriate combination
of sub-sectors from the unorganized sector where potential of employment growth
is higher than that of organized sector. It is important, therefore, that unorganized
sector gets the qualified manpower with appropriate skills. But most of the skills
this sector gets are traditional in nature viz. weaving, cutting, tailoring,
construction activities, and motor vehicle driving, etc, which are acquired through
non-formal training.
In India different types of institutions/schools running under different departments
which impart the formal vocational training are:
1. Industrial Training Institutes (ITIs)
2. Industrial Training Centres (ITCs)
3. Schools offering vocational courses (Secondary, Higher Secondary level)
4. Tailoring, embroidery and stitch craft institutes
5. Recognized motor driving schools
6. Institutes run by companies/corporations
They together had played a major role in providing training to the youths (NSSO,
2006).
Industrial Training Institutes have been set up by the respective State
Governments under Craftsman Training Progrramme of Government of India.
These Institutes aim at meeting twin objectives of creating skilled manpower to
enhance the employability of the youth and meet the industry demand for skill sets.
Students are imparted long term and short term vocational training in various
trades, presuming that it would enhance their employability, build their capabilities
for self-employment avenues and supply quality skill sets to the industry.
But in India, in most cases, the lack of demand orientation in vocational
training and skill development projects often resulted in unemployment, while at
the same time a large number of activities could not grow because of lack of
appropriate skilled manpower (Gupta, 2006). Keeping these facts in view, it is very
important to assess the demand for these skill sets for the future in different states.
For this a demand-oriented approach to vocational training needs to be adopted
giving due weight to general development activities in those states.
Bihar state is one of the most backward states in the matter of vocational
training. As compared to 2 per cent for the country as a whole only 0.2 per cent of
persons in 15-29 years age group have received the formal vocational training in
the state during the year 2004-05 (NSSO, 2006). However, now the state
government has realized the importance of vocational training and given high
priority in its Eleventh Five Year Plan (Govt. of Bihar, Planning Department,
2006).
At the request of Labour Department, Government of Bihar, IIPA has
conducted this study on ―Assessing the Demand for Skill Sets in
Domestic/National and Overseas Markets by the Year 2025 in Bihar State‖.
Following paragraphs state the objectives of the study, discuss methodology
adopted in the study and outline cauterization scheme.
1.2 Objectives
1. To estimate the industry-wise economy demand of persons with Vocational
Education and Training in Bihar by the years 2009-10, 2014-15, 2019-20
and 2024-25.
2. To estimate the demand of persons with Vocational Training from ITIs/ITCs
of Bihar by the years 2009-10, 2014-15, 2019-20 and 2024-25.
3. Identification of new trades (Skill-sets) having employment potential in
which training should be imparted/arranged by the different departments of
the state.
1.3 Methodology
Manpower demand is derived demand. Since most of the manpower demand
is likely to be locally generated in an area, for knowing the demand of a particular
manpower group in an area, it is important that the planner is knowing about the
resources of that area and the kinds of products that industries need to produce.
The resources of the area include natural resources, human resources and
infrastructure resources. It is also important to know about the amount of
investments, likely to be made in the sector in which that manpower group can get
the employment.
The challenge before India is to develop a vocational education and training
system that will enable employers to find the skilled labour inputs they need. At
the same time currently unskilled workers must also be empowered to develop
skills in a trade and become upwardly mobile participants in the economy (FICCI,
―Skill Development in India‖, 2009).
One may argue that demand for a given skill arises when a person is
interested in the skill and can afford to bear the cost of that skill. But if a person is
poor and illiterate who neither has the money to bear the cost of receiving the skill
nor he knows the benefit of the skill, then there would be no demand for that skill.
The situation in Bihar state is very much similar to that. As per the NSSO Survey
conducted in the year 2004-05, in rural areas of the state 52 per cent of the
population could spend only up to Rs. 410/- per month per person and in urban
areas 57 per cent of the population could spent less than Rs. 580/- per month per
person. In case of females in the age-group of 15-29 years, in rural areas, it was
intriguing to note, in that survey, that the predominant reason for not having
attended any educational institution was ‗education not considered necessary‘ in
the kind of occupation they are likely to be in.
Because of poverty there may not be any demand for vocational training by
the individuals but society demands to empower such unskilled workers to develop
skills and make them upwardly mobile participants in the society. This means that
in addition to the economy demand of vocationally trained persons we should also
have some estimates of ‗society demand‘ - which we have called the requirement
of vocationally trained persons.
Here our concern is in vocational training, not in high level skills provided
in professional colleges (viz. engineering colleges, medical colleges, agriculture
colleges, polytechnics and other professional colleges). Our concern of vocational
training here is to provide skills to make them employable whenever the
opportunity exists in the state or outside the state and earn income which can meet
the basic needs of their families. A large number of the unskilled laborers who are
going every year from Bihar to other developed states should go with skills so that
they can have a better bargaining power.
Realizing this, the Eleventh Five Year Plan of India has set up a Skill
Development Mission (SDM) consisting of an agglomeration of programmes and
appropriate structures aimed at enhancing training opportunities four-fold. New
entrants to the labour force in the non-agricultural sector should increase from the
existing 2.5 million to 10 million per year in the country, and they need to be
trained.
In Bihar state, it is observed that drop out rate is very high in schools due to
which work participation rate is very high among the age group of 15-29 years. In
the age-group of 5-19 years, about 45 per cent were attending the school at primary
level, but due to higher dropout rate (i.e. 54.2 per cent) it reduces to 22 per cent at
middle level. High dropout rate and low infrastructure of formal vocational
training in the state compels a large proportion of persons in the age-group of 15-
29 to join the work force without any skill training. In the year 2004-05, only 0.3
per cent was receiving formal vocational training, 0.2 per cent reported to have
received formal vocational training and another 2.3 per cent reported to have
received non-formal vocational training. This means that more than 97 per cent of
the persons in this age-group had neither received nor receiving any vocational
training (whether formal or non-formal). One may argue that some of the persons
who are not engaged in vocational education and training they may be engaged in
higher technical skills viz. professional degrees in engineering, medicine and
agriculture etc or diploma/certificate in vocational education &training equal to
graduate level. But their number is less than those engaged in vocational education
and training (below graduate level). Conceding that a number of them may be
engaged in non-vocational pursuits, we may still hold that a large percentage still
needs to undergo some vocational training.
Recommended employment strategy of Eleventh Five Year Plan emphasizes
the need for high growth in the country. High growth is also expected to require
skilled manpower. Not only this, in the process of liberalization in our country,
youth without any vocational training can easily be exploited and involved in
destructive activities. Bihar is already suffering from naxalite activities which,
many analysts feel, partly owe to twin whammy of unemployment and poverty.
Keeping in view the high poverty and surplus labour in the state as discussed
above, the economy demand of persons to be trained as well as society requirement
of the persons who should be trained in vocational skills have been estimated.
However demand estimates for skilled personnel has been matched with the flow
of supply of persons being trained in different vocations by the institutes
(ITIs/ITCs) in Bihar. Gap between these two if any, has given surplus or shortage
of ITI/ITC trained persons in the state. After estimating the total number of persons
demanded by economy/society to be trained, trades have been identified which will
have more demand in the market. Vocational training and skill development cannot
tackle the problem of unemployment, unless the products these people are capable
of turning out satisfy the demand pattern of market. Thus different skill-sets/trades
have been identified by keeping in view the market demand pattern of the state.
1.4 Chapter Scheme
Besides this chapter the report consists of eight more chapters. Second chapter has
discussed about the procedure along with the computation steps for various
estimates of skilled persons in Bihar for the years 2005, 2010, 2015, 2020 and
2025. Next chapter is on ‗Skill Development and Training in India‘. It has
discussed about the existing vocational training system in the country, quantitative
and qualitative aspects of skill deficiencies and the strategy of Eleventh Five Year
Plan. Fourth chapter is about the resources of Bihar State. It has discussed about
the natural resources, human resources and infrastructural resources of the state.
Fifth chapter is about the status of vocational education and training in the state of
Bihar in comparison to that of India as whole and other major states. It is based on
the NSSO survey on ―Status of Education and Vocational Training in India‖
conducted in the year 2004-05. Next chapter has discussed about the demand of
vocational education and training in Bihar. There are many institutes/schools,
under the aegis of different departments, which impart the vocational training in
the state. Among all these institutes, Industrial Training Institutes/Industrial
Training Centers under the Ministry of Labor Resources have played the major
role in imparting the vocational training to the youths of the state. So the total
demand of ITI/ITC trained persons in the state in the years 2010, 2015, 2020 and
2025 has been estimated separately. Seventh chapter has discussed about the
requirement of vocational education and training in Bihar. The requirement has
also been estimated separately for (a) Industrial Training Institutes/Industrial
Training Centers under the Ministry of Labor and (b) other Departments in the
state. Chapter eighth has discussed about the new trades which have demand and
employment potential and should be included in the state. Last chapter of this
report gives the summary and conclusions of the report.
Chapter II
Procedure Along with the Computation Steps for Estimates of
Skilled Persons in Bihar from 2005 To 2025
2.1 Introduction
This study is based on the analysis of secondary data. Therefore, type of the
methodology used is subject to the availability of secondary data from the different
departments of the State and the Center as well as other agencies. Keeping in view
the objectives of the study and availability of data four exercises given below have
been attempted.
These four exercises are:
1. Estimating the industry-wise economy demand of persons with vocational
education and training in the state in the years 2010, 2015, 2020 and 2025.
2. Estimating the total number of persons required by to be trained in
vocational education and training in the years 2010, 2015, 2020 and 2025.
3. Distributing the economy demand and society requirement of persons with
vocational education and training in ITIs/ITCs and in institutions supported
by other Departments of the state in the years 2010, 2015, 2020 and 2025.
4. Identification of new trades having employment potential in the state.
2.2 Industry-wise Economy Demand for Vocational Education and Training
Economy demand has two components – (A) demand from within the states
and (B) demand from outside the state (Chart II.1). Component ‗A‘ itself has been
approached through two methods. In the first method, industry-wise elasticity of
employment (with technical skills) wr.t. GSDP during the period 1993-94 to 2004-
05 has been used whereas in the second method industry-wise elasticity of
employment w.r.t. GSDP during that period has been used (Chart II.2).
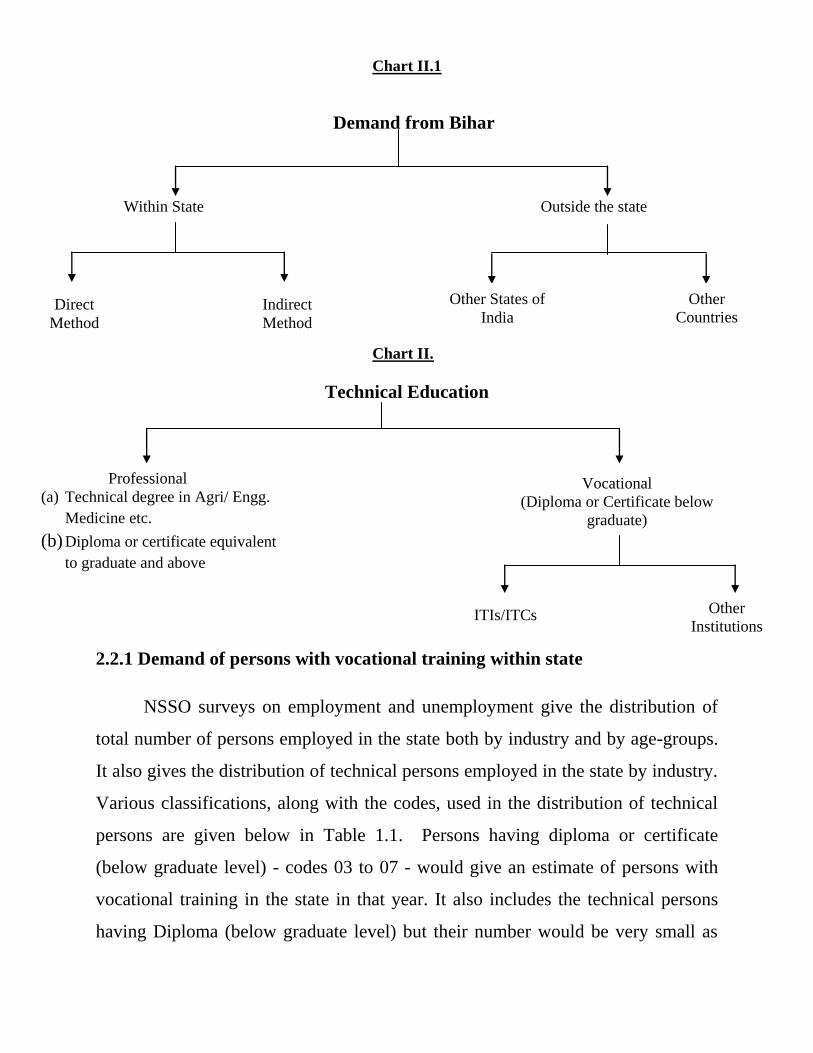
Chart II.1
Demand from Bihar
Within State Outside the state
Chart II.2
Technical Education
2.2.1 Demand of persons with vocational training within state
NSSO surveys on employment and unemployment give the distribution of
total number of persons employed in the state both by industry and by age-groups.
It also gives the distribution of technical persons employed in the state by industry.
Various classifications, along with the codes, used in the distribution of technical
persons are given below in Table 1.1. Persons having diploma or certificate
(below graduate level) - codes 03 to 07 - would give an estimate of persons with
vocational training in the state in that year. It also includes the technical persons
having Diploma (below graduate level) but their number would be very small as
Direct
Method
Indirect
Method
Other States of
India
Other
Countries
Professional
(a) Technical degree in Agri/ Engg.
Medicine etc.
(b) Diploma or certificate equivalent
to graduate and above
Vocational
(Diploma or Certificate below
graduate)
ITIs/ITCs
Other
Institutions
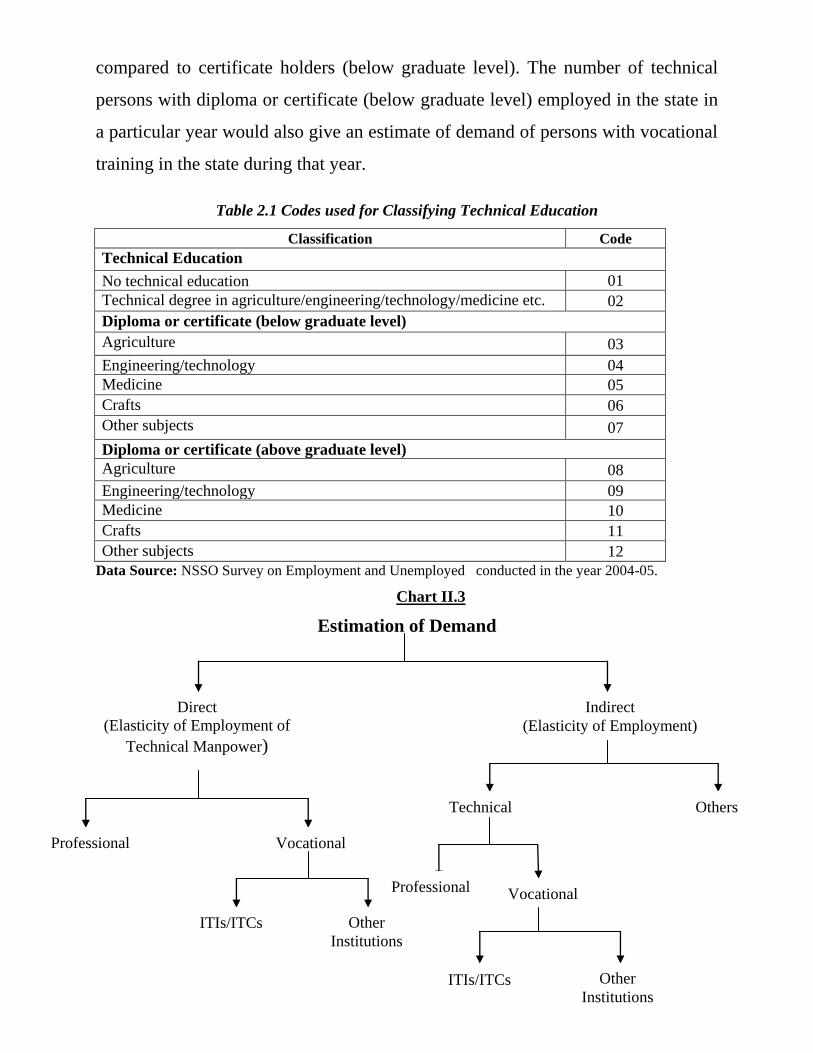
compared to certificate holders (below graduate level). The number of technical
persons with diploma or certificate (below graduate level) employed in the state in
a particular year would also give an estimate of demand of persons with vocational
training in the state during that year.
Table 2.1 Codes used for Classifying Technical Education
Classification Code
Technical Education
No technical education 01
Technical degree in agriculture/engineering/technology/medicine etc. 02
Diploma or certificate (below graduate level)
Agriculture 03
Engineering/technology 04
Medicine 05
Crafts 06
Other subjects 07
Diploma or certificate (above graduate level)
Agriculture 08
Engineering/technology 09
Medicine 10
Crafts 11
Other subjects 12
Data Source: NSSO Survey on Employment and Unemployed conducted in the year 2004-05.
Chart II.3
Estimation of Demand
Direct
(Elasticity of Employment of
Technical Manpower)
Indirect
(Elasticity of Employment)
Technical
Professional Vocational
ITIs/ITCs Other
Institutions
Others
Professional Vocational
ITIs/ITCs Other
Institutions
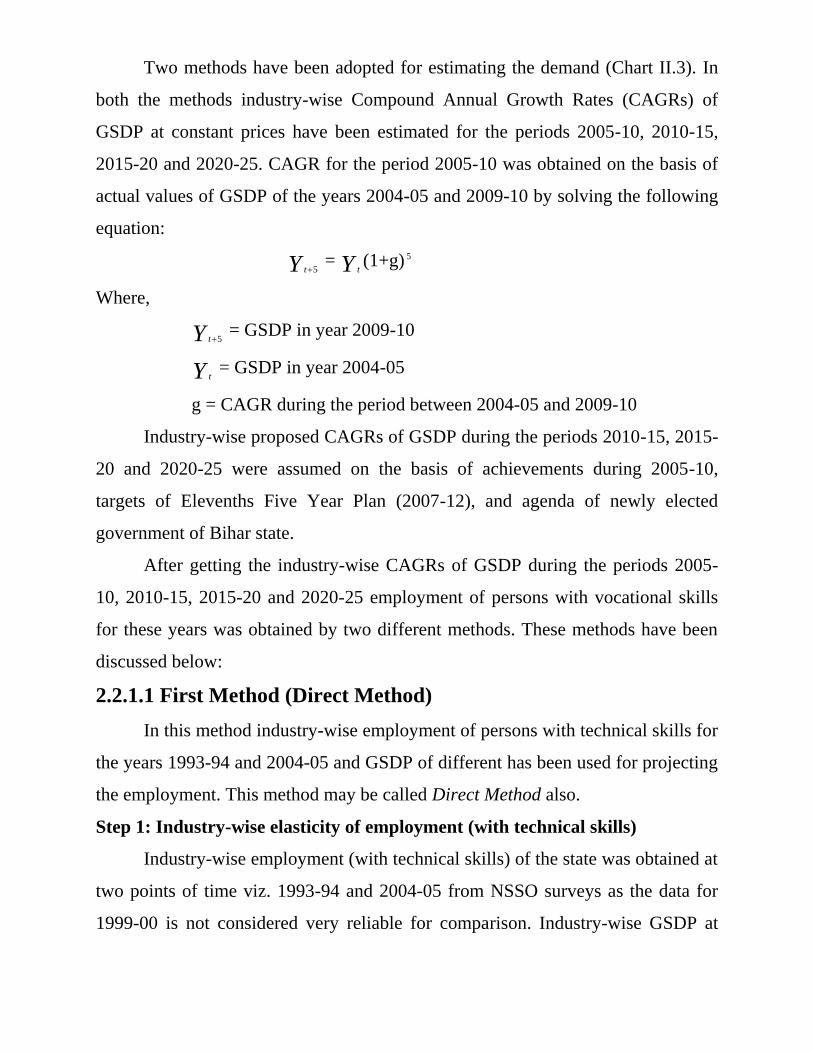
Two methods have been adopted for estimating the demand (Chart II.3). In
both the methods industry-wise Compound Annual Growth Rates (CAGRs) of
GSDP at constant prices have been estimated for the periods 2005-10, 2010-15,
2015-20 and 2020-25. CAGR for the period 2005-10 was obtained on the basis of
actual values of GSDP of the years 2004-05 and 2009-10 by solving the following
equation:
Y t 5 = Y t
(1+g) 5
Where,
Y t 5 = GSDP in year 2009-10
Y t = GSDP in year 2004-05
g = CAGR during the period between 2004-05 and 2009-10
Industry-wise proposed CAGRs of GSDP during the periods 2010-15, 2015-
20 and 2020-25 were assumed on the basis of achievements during 2005-10,
targets of Elevenths Five Year Plan (2007-12), and agenda of newly elected
government of Bihar state.
After getting the industry-wise CAGRs of GSDP during the periods 2005-
10, 2010-15, 2015-20 and 2020-25 employment of persons with vocational skills
for these years was obtained by two different methods. These methods have been
discussed below:
2.2.1.1 First Method (Direct Method)
In this method industry-wise employment of persons with technical skills for
the years 1993-94 and 2004-05 and GSDP of different has been used for projecting
the employment. This method may be called Direct Method also.
Step 1: Industry-wise elasticity of employment (with technical skills)
Industry-wise employment (with technical skills) of the state was obtained at
two points of time viz. 1993-94 and 2004-05 from NSSO surveys as the data for
1999-00 is not considered very reliable for comparison. Industry-wise GSDP at
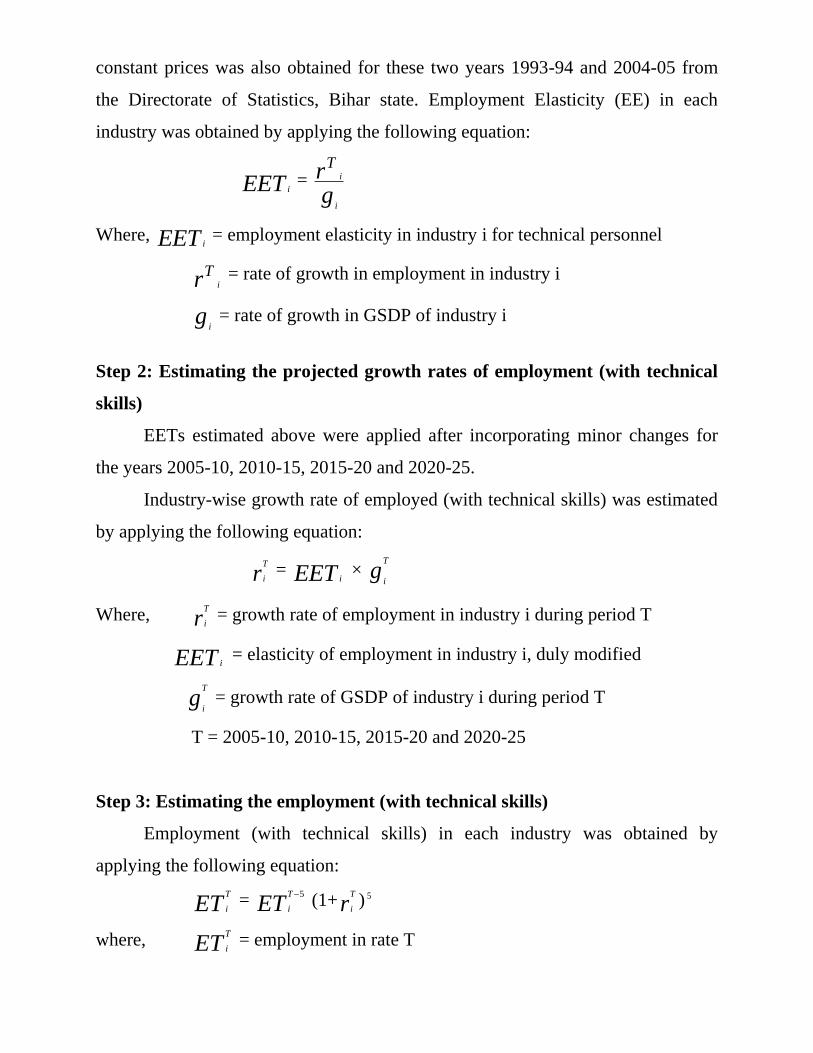
constant prices was also obtained for these two years 1993-94 and 2004-05 from
the Directorate of Statistics, Bihar state. Employment Elasticity (EE) in each
industry was obtained by applying the following equation:
EET i =
gr
i
i
T
Where, EET i = employment elasticity in industry i for technical personnel
Tr i = rate of growth in employment in industry i
gi = rate of growth in GSDP of industry i
Step 2: Estimating the projected growth rates of employment (with technical
skills)
EETs estimated above were applied after incorporating minor changes for
the years 2005-10, 2010-15, 2015-20 and 2020-25.
Industry-wise growth rate of employed (with technical skills) was estimated
by applying the following equation:
rT
i = EET i
× gT
i
Where, rT
i = growth rate of employment in industry i during period T
EET i = elasticity of employment in industry i, duly modified
gT
i = growth rate of GSDP of industry i during period T
T = 2005-10, 2010-15, 2015-20 and 2020-25
Step 3: Estimating the employment (with technical skills)
Employment (with technical skills) in each industry was obtained by
applying the following equation:
ETT
i = ET
T
i
5 (1+r
T
i) 5
where, ETT
i = employment in rate T
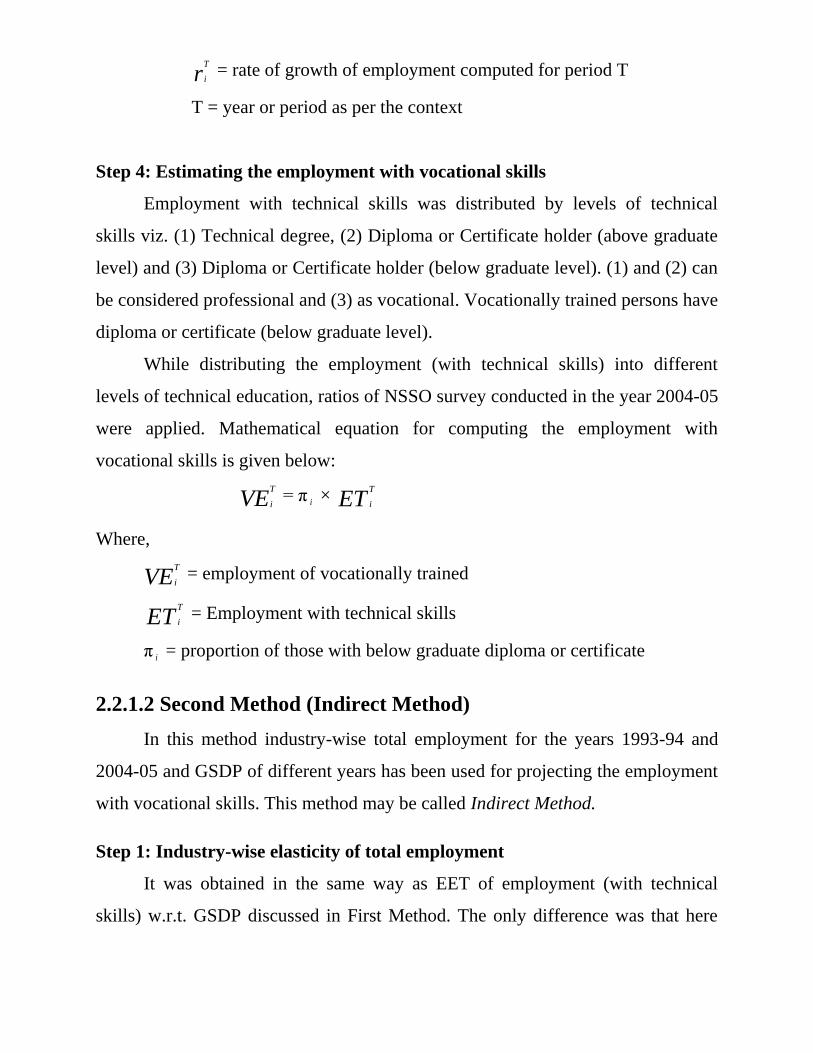
rT
i = rate of growth of employment computed for period T
T = year or period as per the context
Step 4: Estimating the employment with vocational skills
Employment with technical skills was distributed by levels of technical
skills viz. (1) Technical degree, (2) Diploma or Certificate holder (above graduate
level) and (3) Diploma or Certificate holder (below graduate level). (1) and (2) can
be considered professional and (3) as vocational. Vocationally trained persons have
diploma or certificate (below graduate level).
While distributing the employment (with technical skills) into different
levels of technical education, ratios of NSSO survey conducted in the year 2004-05
were applied. Mathematical equation for computing the employment with
vocational skills is given below:
VET
i = π i × ET
T
i
Where,
VET
i = employment of vocationally trained
ETT
i = Employment with technical skills
π i = proportion of those with below graduate diploma or certificate
2.2.1.2 Second Method (Indirect Method)
In this method industry-wise total employment for the years 1993-94 and
2004-05 and GSDP of different years has been used for projecting the employment
with vocational skills. This method may be called Indirect Method.
Step 1: Industry-wise elasticity of total employment
It was obtained in the same way as EET of employment (with technical
skills) w.r.t. GSDP discussed in First Method. The only difference was that here
industry-wise total employment was taken instead of employment (with technical
skills).
Industry-wise total employment of the state was obtained at two points of
time viz. 1993-94 and 2004-05 from NSSO surveys. Industry-wise GSDP at
constant prices was also obtained for these two years from the Directorate of
Statistics, Bihar state. Employment Elasticity (EE) in each industry was obtained
by applying the following equation:
TEEi =
i
i
g
r
Where,
TEEi = Total employment elasticity in industry i
r i = rate of growth in total employment in industry i
gi = rate of growth in GSDP of industry i
Step 2: Projected growth rates of total employment
Method of obtaining these growth rates was also same as in First Method.
The difference is that here we get the CAGRs of total employment instead of
employment (with technical skills).
EEs estimated above were applied after incorporating minor changes for the
years 2005-10, 2010-15, 2015-20 and 2020-25.
Industry-wise growth rate of employed was estimated by solving the
following equation:
rT
i = TEEi
* × g
T
i
Where,
rT
i = growth rate of total employment in industry during period T
TEEi
* = elasticity of total employment in industry I duly modified
gT
i = growth rate GSDP of industry I during the period T
T = 2005-10, 2010-15, 2015-20 and 2020-25
Step 3: Estimating the total employment
Method of estimating the total employed is also same as in First Method.
The difference is that here we will get the total employment instead of employment
(with technical skills).
Total employment in each industry was obtained by applying the following
equation:
TET
i = TE
T
i
5 (1+r
T
i) 5
where,
TET
i = Total employment of industry i and year T
rT
i = rate of growth of total employment computed for period T
T = year or period as per the context
Step 4: Estimating the employment with vocational
Total employment estimated for each year was distributed into employment
with technical skills and employment with no technical skills. In the year 2005 as
per NSSO Survey persons with technical skills was about one per cent to total
employment in the country. It was assumed that this percentage would increase to
two per cent in the year 2025. Mathematical equation for computing the
employment with technical skills is as under:
SET
i = α TS × TE
T
i
Where,
SET
i = employment of persons with technical skills in the year T
α TS = proportion of those with technical skills to total employment
TET
i = Total employment in year T
Further, employment with technical skills was distributed by levels of
technical skills viz. Technical degree, Diploma or certificate holder (above
graduate level) and Diploma or certificate holder (below graduate level).
Employment of persons having diploma or certificate (below graduate level) gives
the demand of vocationally trained person in the state. While distributing the total
employment into different levels of technical education, ratios of NSSO survey
conducted in the year 2004-05 were applied. Mathematical equation for computing
the employment with vocational skills is given below:
VET
i = β i × SE
T
i
where,
VET
i = employment of vocationally trained in year T
β i = proportion of those with below graduate diploma or certificate
SET
i = employment of persons with vocational skills in the year T
2.2.2 Demand of Persons with Vocational Training outside the State
There are two major sources which give estimates of the incidence of
migrations from Bihar. The first is the Population Census conducted after every ten
years and the other is the periodic (quinquemial) survey conducted by NSSO.
Extent of migration from Bihar to other states, along with the background (i.e. age,
qualification and sex etc.) of migrants and reasons of migrations was obtained from
these two sources. Besides these two official sources, there are a number of studies
on ―Migration from Bihar state‖.
It is observed from the Population Census data and other studies that a large
number of migrants from Bihar to other states are unskilled. If some of these
unskilled workers are provided some skills in the state, they can get higher wages
in the other states and can have a better bargaining power. This would also increase
the demand of skilled labour from the state.
Skilled workers have also a great scope of employment in other countries,
particularly the countries where old dependency ratio is very high. In the year
2001, about 43 percent of total population of the state was in the age-group of
below 15 years (Census of India, 2001). A high proportion of this population has
entered in the working population by now. Bihar can reap demographic dividend
if its manpower is managed and utilized properly. Once they are trained, they can
have a great scope of employment in other countries. Ministry of External Affairs
and the Ministry of Overseas Affairs provide data on International Migration from
India to different countries.
Before estimating the demand of persons with vocational training outside the
state, estimates of net out-migration from the state for employment purpose was
obtained from the sources mentioned above. These estimates of out-migration were
obtained separately for other states of India and for outside India. From the total
net out-migration share of vocationally trained persons was also obtained. Keeping
in view the large number of unskilled migration from Bihar to outside the state and
demographic dividend of Bihar, demand of persons with vocational training
outside the state was estimated.
2.3 Estimating Social Requirement for Persons with Vocational Education
and Training
There are different ways to look at the scene of how many people ought to
be trained. Here we have compared the present status of vocational training in
Bihar with that of other states because we find that the situation in Bihar is very
unsatisfactory as compared to other states. Keeping this fact in view we fixed up
some target year by which Bihar state would achieve the present status of some
state having some similarities to Bihar and is one of the highest producing students
through formal/non-formal vocational training. States having some similarities to
Bihar were identified by comparing the share of employment in agriculture and
allied activities in major states in the year 2004-05. However Bihar state being a
plain area state, major hilly states and desert states were not considered as model
state for Bihar.
This estimate would also give the number of persons to be trained by all the
departments/institutes of the state.
2.4 Estimating the number of persons with vocational training to be trained
by ITIs and ITCs in Bihar
Above two sections (i.e. Section 2.2 and 2.3) give the estimates of students
demanded/required to be trained in all the institutes/departments of the state.
Keeping in view the past trend of the share of students who were admitted in
ITIs/ITCs to the total students admitted in all institutes/departments and the
policies of the state government, persons to be trained in ITIs/ITCs for the years
2010, 2015, 2020 and 2025 were obtained.
2.5 Identification of New trades having Employment Potential in the State
Eleventh Five Year Plan of India has identified 20 growth sectors having
high employment potential in the country. These sectors were modified for Bihar
state keeping in view the resources and infrastructure of the state.
Keeping in view the resources of Bihar state, it was observed where
employment could be generalized in future. It also gave an idea of the trades
specific to the growth sectors relevant for Bihar state. While doing this exercise the
study team have discussed the matter with officers of various departments of state
and centre. Reports published by various institutions and officials of the
institutions located at Delhi viz. FICCI, IGNOU, Planning Commission and
DGE&T also gave an idea about the new trades which can be introduced. It was
also found important to know about the trades of different duration which were
taught in ITIs/ITCs and other Departments of the state.
The trades in which vocational training is being provided in developed states
(viz. Gujarat, and Maharashtra) and the Modular Employable Skills (MES)
courses approved by National Council of Vocational Training (NCVT) but are not
covered in Bihar state were included in the list of trades identified above. However
before including these trades in the modified list it was ensured that these trades
should have employment potential in the state. Duration and minimum
qualification required for each trade were also suggested in the list wherever
possible. Scope of employment potential of new trades included in the list was
analyzed, keeping in view the market demand, infrastructure facilities and
resources of Bihar State.
Chapter III Skill Development and Training in India
3.1 Introduction Skill and knowledge are the driving forces of Economic Growth and Social
Development of any country. Skill building and training contributes significantly
for promoting the interests of individuals, enterprises, economy and society. Skill
building and training, a central pillar of decent work, is a means to empower
people, improve the quality and organization of work, enhance citizens‘
productivity, raise workers‘ incomes, promote job security and social equity and
help individuals become more employable in rapidly changing internal and
external labour markets. In fact they have become more important in the era of
globalization because countries with higher and better levels of skills adjust more
effectively to the challenges and opportunities of globalization (Government of
India, Planning Commission, 2008).
In the old economy, skill development was mainly considered as the
development of shop floor or manual skills. In the new economy the skill set can
range from professional, conceptual, managerial, and operational behavioral to
inter-personal skills and inter-domain skills. To deal with this level of complexity,
Government of India has given a very high priority to higher education in the
Eleventh Five Year Plan (Government of India, Planning Commission, 2008).
However, in this chapter we have discussed skill development in different trades at
the mass scale through ITIs, vocational schools and other institutions.
As discussed in the previous chapter, India‘s record in the area of skill
development has been very poor. One of the reasons for poor performance is the
total reliance upon a few training courses (i.e. just about 100 courses) of long
duration (i.e. 2 to 3 years) with no up gradation from time to time (Government of
India, Planning Commission, 2008).
Vocational training being a concurrent subject Central Government and the
State Governments both share responsibilities. At the national level, Director
General of Employment & Training (DGE&T), Ministry of Labour is the nodal
department for formulating policies, laying down standards, conducting trade
testing and certification, etc. in the field of vocational training. At the State level,
the State government departments are responsible for vocational training
programmes.
3.2 Demographic Dividend
The demographic dividend is a rise in the rate of economic growth due to a
rising share of working age people in a population. This usually occurs late in the
demographic transition when the fertility rate falls sufficiently and the youth
dependency rate declines. During this demographic window of opportunity, output
per capita rises. Low fertility initially leads to low youth dependency and a high
ratio of working age to total population. However as the relatively large working
age cohort grows older, population aging sets in.
3.2.1 Demographic Transition in India
In case of India due to demographic transition there has been continuous
increase in the working population of India and in recent years it has been noticed
that population has become more of an asset than a burden because India‘s
population comprise more of youth and their contribution has been increasing for
quite a few years.
In the ―population dividend‖ model, it is the dependency ratio (that is,
dependent population relative to the working-age population) rather than the
absolute increase (or decrease) in the size of the working-age population that is the
economically most relevant. If the dependency ratio declines, i.e. the working-age
population as a share of the total population increases, per-capita growth is likely
to accelerate. By the same token, a rising dependency ratio is likely to be a ―drag‖
on growth.
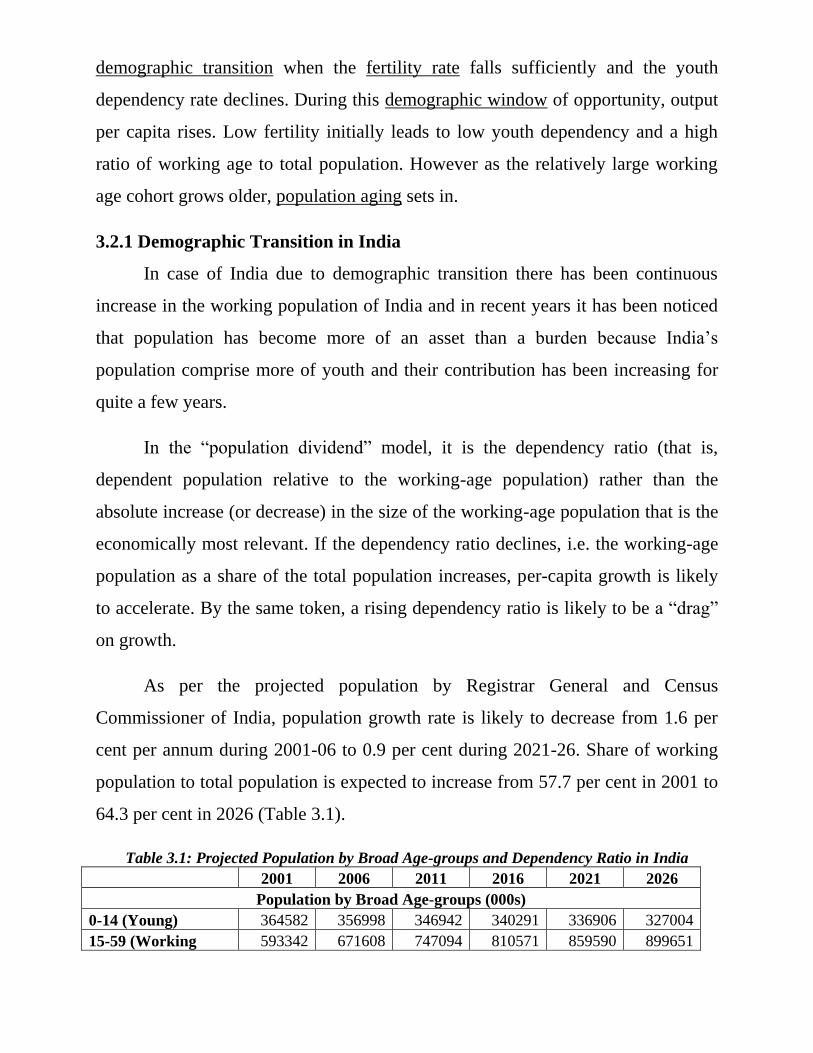
As per the projected population by Registrar General and Census
Commissioner of India, population growth rate is likely to decrease from 1.6 per
cent per annum during 2001-06 to 0.9 per cent during 2021-26. Share of working
population to total population is expected to increase from 57.7 per cent in 2001 to
64.3 per cent in 2026 (Table 3.1).
Table 3.1: Projected Population by Broad Age-groups and Dependency Ratio in India
2001 2006 2011 2016 2021 2026
Population by Broad Age-groups (000s)
0-14 (Young) 364582 356998 346942 340291 336906 327004
15-59 (Working 593342 671608 747094 810571 859590 899651
Age)
60+ (Old) 70686 83580 98470 118099 143244 173182
Total 1028610 1112186 1192506 1268961 1339740 1399837
CAGR (Over
previous year) 1.6 1.4 1.3 1.1 0.9
Median Age (Years) 22.5 23.9 25.5 27.4 29.3 31.4
Dependency Ratio
Young (0-14) 614 532 464 420 392 363
Old (0-60) 119 124 132 146 167 192
Total (Young & old) 734 656 596 566 559 556
Note: Young Dependency Ratio is the Population of Young per 1000 population in the 15-59
years. Similarly, old age dependency ratio is the population of old per 1000 population in the 15-
59 years.
Data Source: RG&CCI, State-wise population projection 2001-2026.
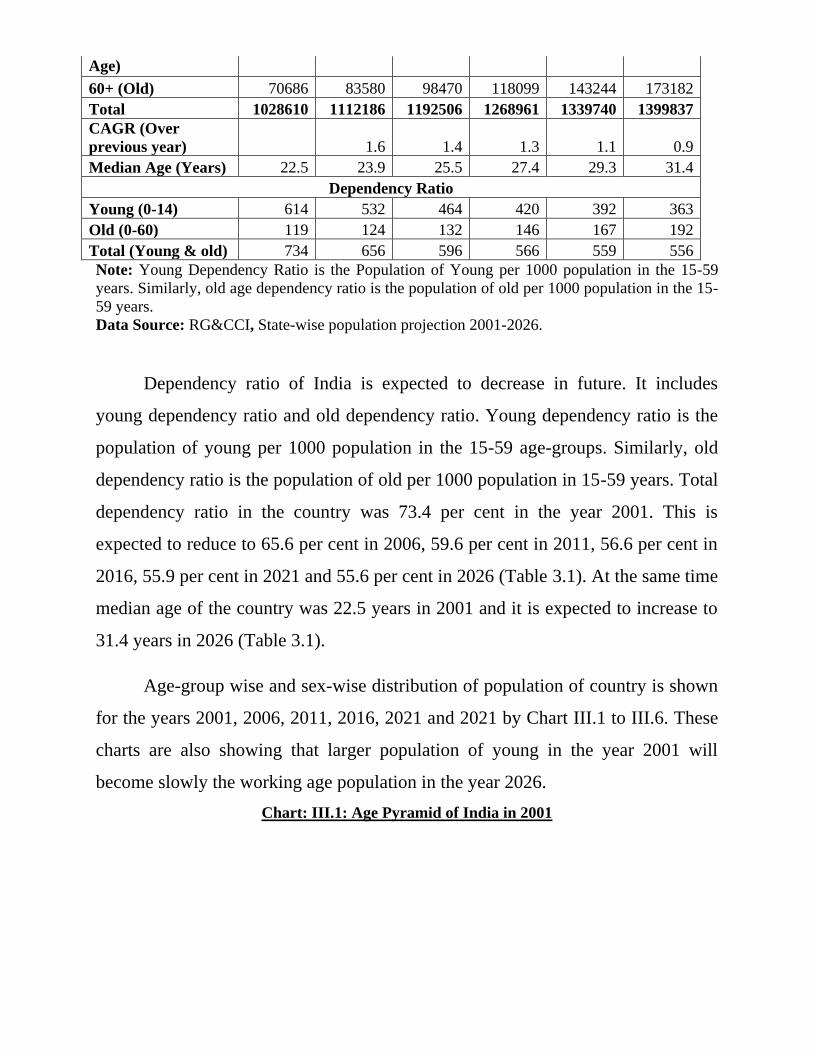
Dependency ratio of India is expected to decrease in future. It includes
young dependency ratio and old dependency ratio. Young dependency ratio is the
population of young per 1000 population in the 15-59 age-groups. Similarly, old
dependency ratio is the population of old per 1000 population in 15-59 years. Total
dependency ratio in the country was 73.4 per cent in the year 2001. This is
expected to reduce to 65.6 per cent in 2006, 59.6 per cent in 2011, 56.6 per cent in
2016, 55.9 per cent in 2021 and 55.6 per cent in 2026 (Table 3.1). At the same time
median age of the country was 22.5 years in 2001 and it is expected to increase to
31.4 years in 2026 (Table 3.1).
Age-group wise and sex-wise distribution of population of country is shown
for the years 2001, 2006, 2011, 2016, 2021 and 2021 by Chart III.1 to III.6. These
charts are also showing that larger population of young in the year 2001 will
become slowly the working age population in the year 2026.
Chart: III.1: Age Pyramid of India in 2001
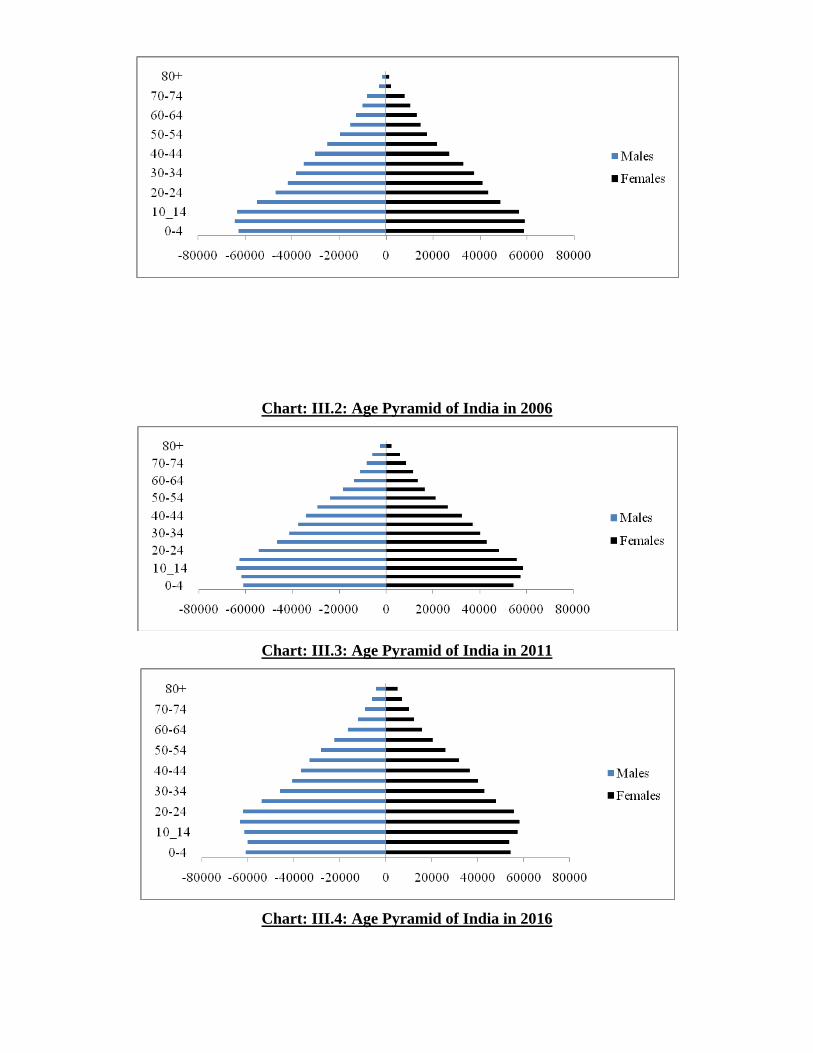
Chart: III.2: Age Pyramid of India in 2006
Chart: III.3: Age Pyramid of India in 2011
Chart: III.4: Age Pyramid of India in 2016
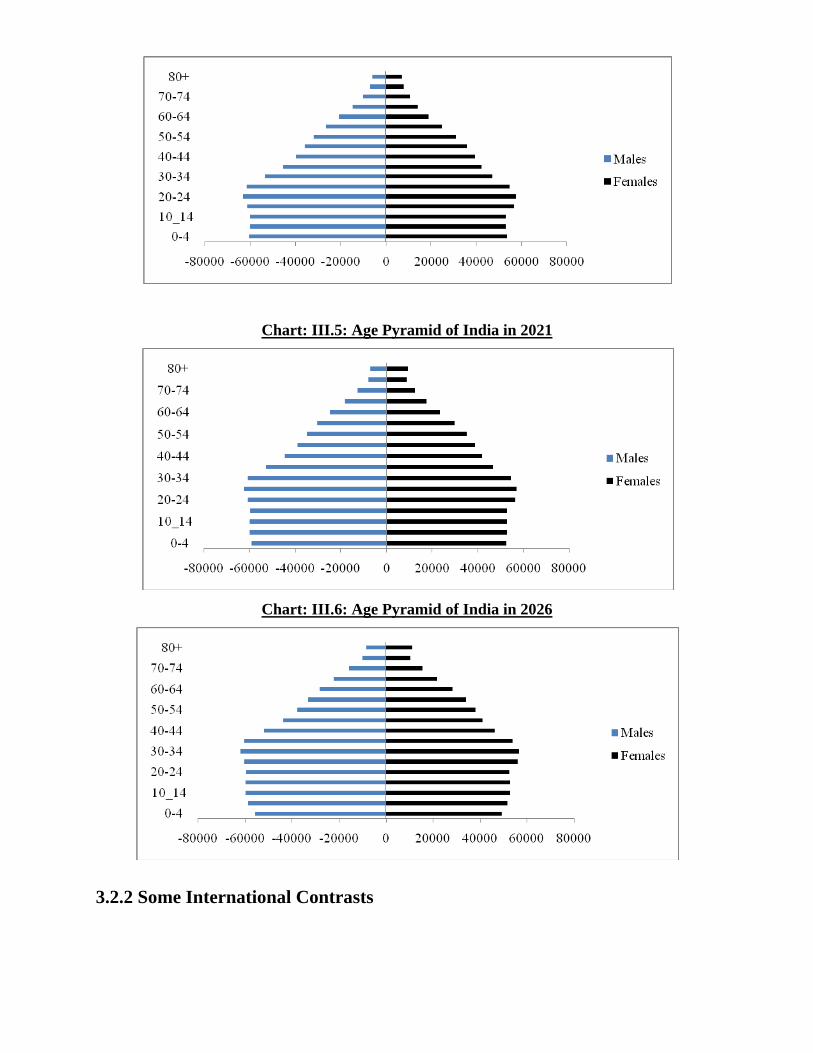
Chart: III.5: Age Pyramid of India in 2021
Chart: III.6: Age Pyramid of India in 2026
3.2.2 Some International Contrasts
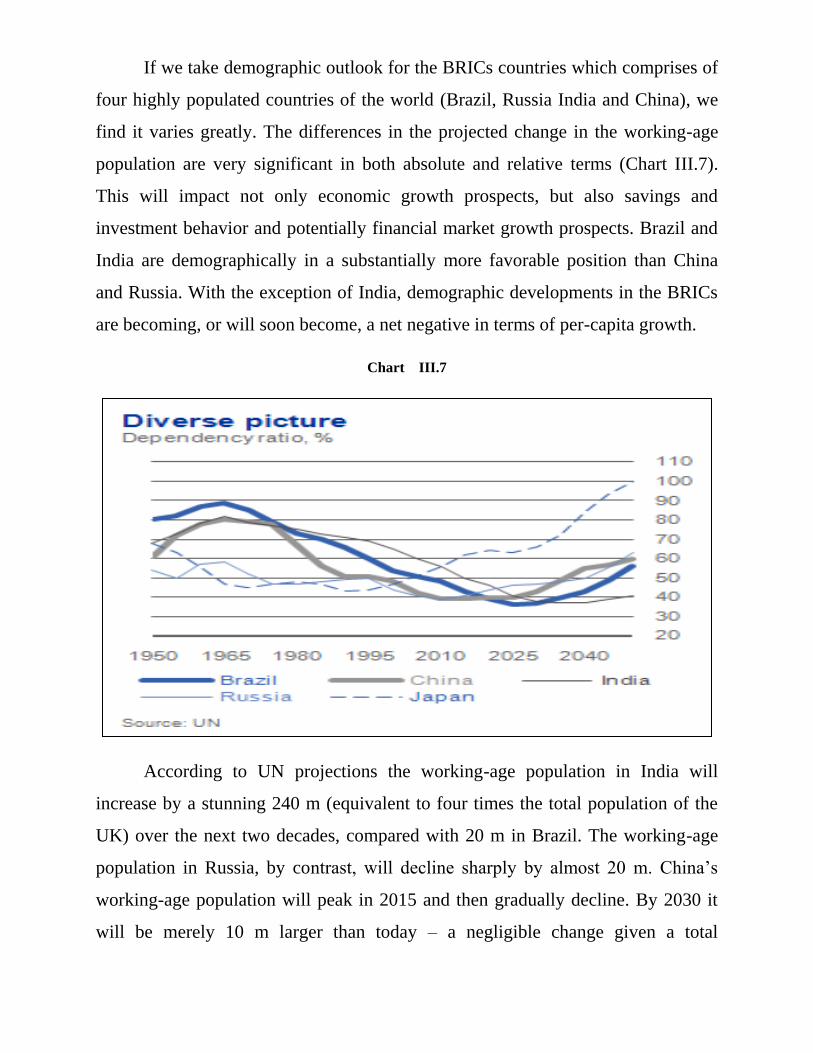
If we take demographic outlook for the BRICs countries which comprises of
four highly populated countries of the world (Brazil, Russia India and China), we
find it varies greatly. The differences in the projected change in the working-age
population are very significant in both absolute and relative terms (Chart III.7).
This will impact not only economic growth prospects, but also savings and
investment behavior and potentially financial market growth prospects. Brazil and
India are demographically in a substantially more favorable position than China
and Russia. With the exception of India, demographic developments in the BRICs
are becoming, or will soon become, a net negative in terms of per-capita growth.
Chart III.7
According to UN projections the working-age population in India will
increase by a stunning 240 m (equivalent to four times the total population of the
UK) over the next two decades, compared with 20 m in Brazil. The working-age
population in Russia, by contrast, will decline sharply by almost 20 m. China‘s
working-age population will peak in 2015 and then gradually decline. By 2030 it
will be merely 10 m larger than today – a negligible change given a total
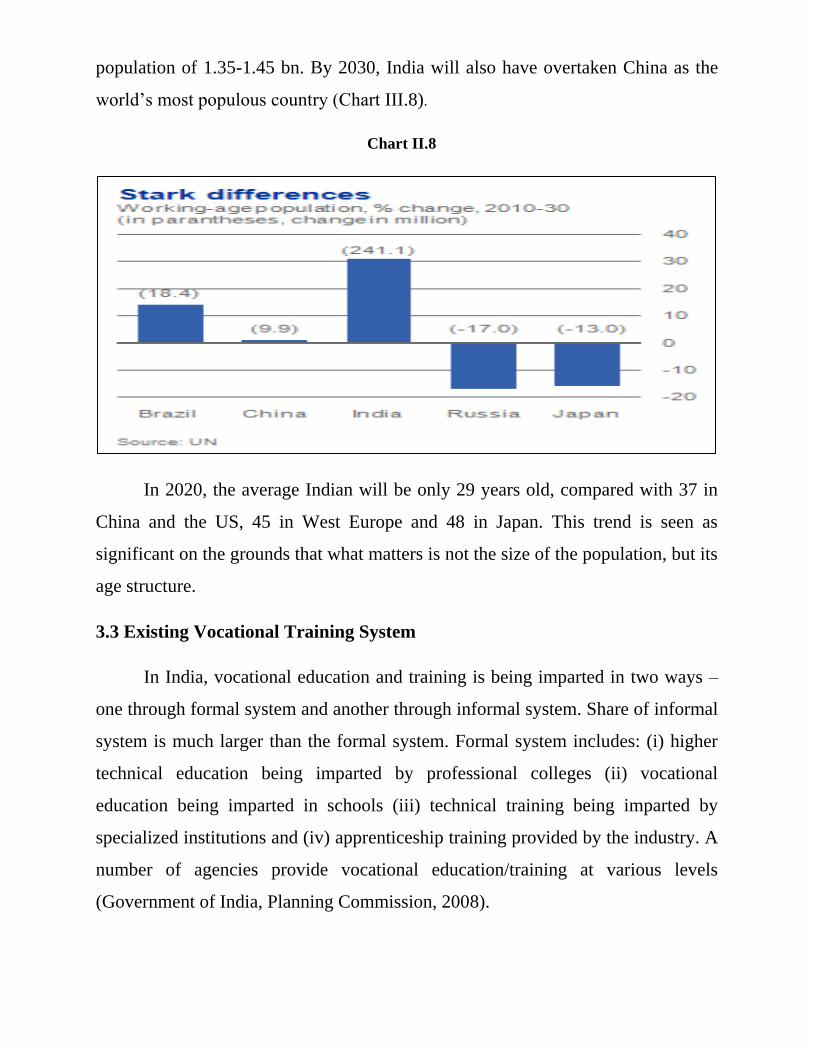
population of 1.35-1.45 bn. By 2030, India will also have overtaken China as the
world‘s most populous country (Chart III.8).
Chart II.8
In 2020, the average Indian will be only 29 years old, compared with 37 in
China and the US, 45 in West Europe and 48 in Japan. This trend is seen as
significant on the grounds that what matters is not the size of the population, but its
age structure.
3.3 Existing Vocational Training System
In India, vocational education and training is being imparted in two ways –
one through formal system and another through informal system. Share of informal
system is much larger than the formal system. Formal system includes: (i) higher
technical education being imparted by professional colleges (ii) vocational
education being imparted in schools (iii) technical training being imparted by
specialized institutions and (iv) apprenticeship training provided by the industry. A
number of agencies provide vocational education/training at various levels
(Government of India, Planning Commission, 2008).
Presently there are two advisory bodies in Ministry of Labour to help the
Central Government. One, National Council for Vocation Training (NCVT) which
is a tri-partite body headed by Union Minister for Labour and Employment. The
second is, Central Apprenticeship Council (CAC), which is again a tri-partite body
and advises the Central Government on different aspects of apprenticeship training
in the county. There are two parallel bodies at the State Government level also,
known as State Council for Vocational Training (SCVT) and State Apprenticeship
Council (SAC) with similar responsibilities.
Generally speaking vocational training is imparted through two major
schemes, one, Craftsman Training Scheme (CTS) and the other, Apprenticeship
Training Scheme (ATS).
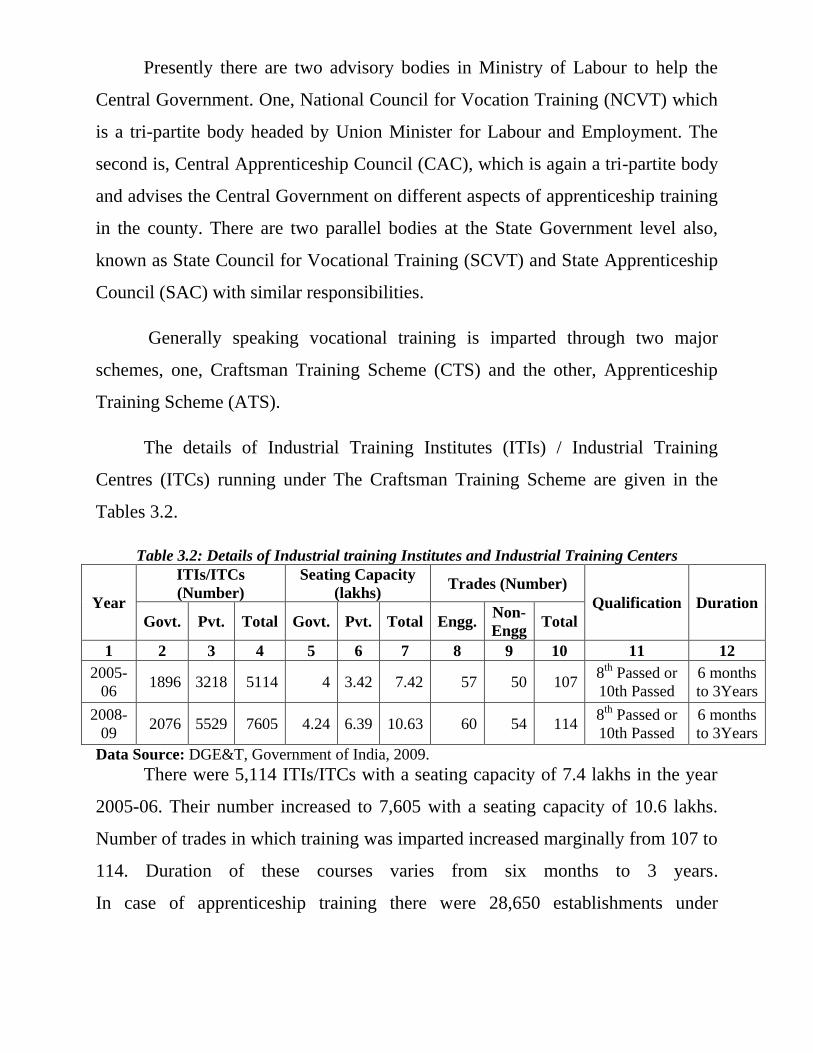
The details of Industrial Training Institutes (ITIs) / Industrial Training
Centres (ITCs) running under The Craftsman Training Scheme are given in the
Tables 3.2.
Table 3.2: Details of Industrial training Institutes and Industrial Training Centers
Year
ITIs/ITCs
(Number)
Seating Capacity
(lakhs) Trades (Number)
Qualification Duration
Govt. Pvt. Total Govt. Pvt. Total Engg. Non-
Engg Total
1 2 3 4 5 6 7 8 9 10 11 12
2005-
06 1896 3218 5114 4 3.42 7.42 57 50 107
8th
Passed or
10th Passed
6 months
to 3Years
2008-
09 2076 5529 7605 4.24 6.39 10.63 60 54 114
8th
Passed or
10th Passed
6 months
to 3Years
Data Source: DGE&T, Government of India, 2009.
There were 5,114 ITIs/ITCs with a seating capacity of 7.4 lakhs in the year
2005-06. Their number increased to 7,605 with a seating capacity of 10.6 lakhs.
Number of trades in which training was imparted increased marginally from 107 to
114. Duration of these courses varies from six months to 3 years.
In case of apprenticeship training there were 28,650 establishments under
apprenticeship training scheme in the country with a seating capacity of 2.5 lakhs
in the year 2005-06 (DGE&T, Government of India, 2009).
There are also specialized Advanced Training Institutes (ATIs) which impart
training to trainers, upgrade skills of in-service industrial workers, train supervisors
and middle management level in the industry, train Training Managers and Principals
of ITIs , and National and Regional Vocational Training Institutes for Women which
offer basic, advanced and instructor training courses for women. Both these institutes
are under DGE&T.
Existing 500 ITIs are being upgraded into Centers of Excellence (CoE) with the
World Bank assistance. In each of these ITIs, a Broad Based Basic Training course
would be provided to the trainees and then multi skilling courses would be offered in
the trades of their choice so that they are better employable. An Institute Management
Committee (IMC) is being constituted in each of the ITIs, which is to be headed by a
prominent industrialist of the area and all industrial guilds are supposed to be
represented in the IMC.
In order to offer employment opportunities to physically challenged persons, 20
Vocational Rehabilitation Centers (VRCs) are also being run in 19 States of the
country. Similarly, Coaching-cum-Guidance Centers (CGCs) for providing larger
employment opportunities to members of SCs and STs are run in 22 States of the
country. There is also one specialized institute, National Instructional Media Institute
(NIMI) for development of course curricula and instructional media packages in
different languages for the benefit of ITI trainees and instructors (DGE&T,
Government of India, 2009).
In addition to above, there are 16 other Ministries and Departments of
Government of India like Health and Family Welfare, Human Resource Development,
Information Technology, Small Scale Industries, Tourism, Urban Development,
Urban Employment and Poverty Alleviation, Agro Rural Industries, Agriculture,
Textiles, Heavy Industry and Public Enterprises, Food Processing Industries, Rural
Development, Tribal Affairs and Women and Child Development, which impart
vocational training. All these Ministries and Departments taken together train about
1.5 million persons every year (Gupta, S.P., 2006).
The critical appraisal of the present state of affairs would however indicate that
our base of skilled and particularly knowledge workers is rather narrow. One way of
looking at this problem is to make a general assessment as to how vocational
education and training (VET) has failed to make an impact in this country. In order to
make the existing vocational education system more efficient and effective more
initiatives will have to be taken by the Government.
There is also need for strengthening the certification system in vocational
training. Though Directorate General of Employment & Training has been
conducting trade tests and awarding National Trade Certificates and National
Apprenticeship Certificates which make these certificate holders employable within
the country and abroad, the set up is becoming unequal to the task in future as against
certification of one million at present, it will require to certify about 10 million
persons every year for which the infrastructure is awfully inadequate. It will,
therefore, be worthwhile to consider setting up a National Trade Testing, Certification
and Accreditation Authority to take care of the growing numbers for certification.
(DGE&T, Government of India, 2009).
At present, vocational education and training is regulated by both the All India
Council of Technical Education (AICTE) and the National Council for Vocational
Training. This has led to an element of duplication. The Task Force on skill
development and vocational education set up by Planning Commission,
Government of India has recommended that the NCVT should be the sole
regulatory authority for vocational training and that the AICTE‘s role should be
confined to institutions of higher learning that fall within its sphere, and
polytechnics.
3.4 Dimensions of the Need for Vocational Training
The mismatch between the quality of labour demanded and its availability
needs to be analyzed and quantified. This will ultimately require reorientation of
India‘s educational system, particularly existing vocational education and training
programmes, as well as enhancing their capabilities. It has been observed that
vocational training and skill development can be imparted better among persons
with basic education rather than to illiterates. Therefore the present drive for
literacy and basic education should continue along with more vocational education
and training programmes. As it had been stipulated in the Tenth Five Year Plan
that India will grow at 8 percent per annum and will rank as a developed country
by the year 2020 so, the capacity of the appropriate formal vocational education
training programmes needs to be expanded significantly.
Unemployment on the Daily Status basis in 1999-2000 was as high as 26.5
million (i.e. 7.4 percent of the total labour force), 10.8 million of whom were
educated (i.e. 41 percent of the unemployed). Compared to this large, unemployed
number of persons, the existing available training and skill development facilities
in formal training and institutions and agencies throughout India exist for around
one and a half million (Gupta, S.P., 2006).
Further, of the 104 to 114 million educated and employed workers, nearly 50 to 55
percent are self employed. Hence, special vocational training and entrepreneurship
development for the self employed need to be developed. Indeed, educated youth
are the primary source of future potential entrepreneurs. As to semi educated youth
(up to primary class), there have also been large number of unemployed or under –
employed and they need a different type of education and vocational training.
There is a vast area where formal and informal training is required particularly
where workforce engaged in low productivity and low earning jobs. The earnings
of this group in most cases are well below the norm for the decent living so to
discover new opportunities in these sectors suitable programs for vocational
training and skill development will be needed, some on part time basis so that the
enhanced training program will not cause disruption in their running sources of
earning. Here, again a different nature of skill development programme is required.
All this statistics gives a sense of the magnitude of need for large scale vocational
education and training programmes (Gupta .S.P., 2006).
3.5 Prioritization of Skill Building and Vocational Training
There is an urgent need to identify the priority areas in selected sections of
the labour force to render appropriate training and skill. The first priority should be
given to the new entrants (from class VIII, IX, X and XI) in the labour force. All
these entrants need gainful employment. The second priority group is the
incremental educated youth. With a high unemployment rate i.e. 12.1 among the
educated youth against the national average of 7.3 percent as per CDS in the year
1999-2000. In this group unemployment rate of female was as high as 22.5
percent. Third priority group should be all the other youth who are in the labour
force, whether illiterate or semi literate. The fourth priority should largely
comprise of underemployed working people.
Another aspect that should be covered under prioritization of skill
development is that vocational training should be given on recent trades. That
means the trades which are in demand or the skill which the market requires has
got the capacity to absorb those skill sets. Plumbing, air conditioning and
refrigeration, secretarial practice, beauty culture, auto fitter, mobile repairing etc.
are recent trades and there should be training in these skill sets.
3.6 The quantitative aspect of the Skill Shortages
The quantitative aspect of skill shortage is one of the areas of concern
because there is always mismatch between the availability of number of jobs and
the number of people available for particular job. The huge number of people
added to the workforce each year and their low preparedness to avail of the
emerging employment opportunities make the issue of skill development self
evident.
FICCI has estimated the demand of vocationally trained persons till 2022.
Details of which have been discussed below:
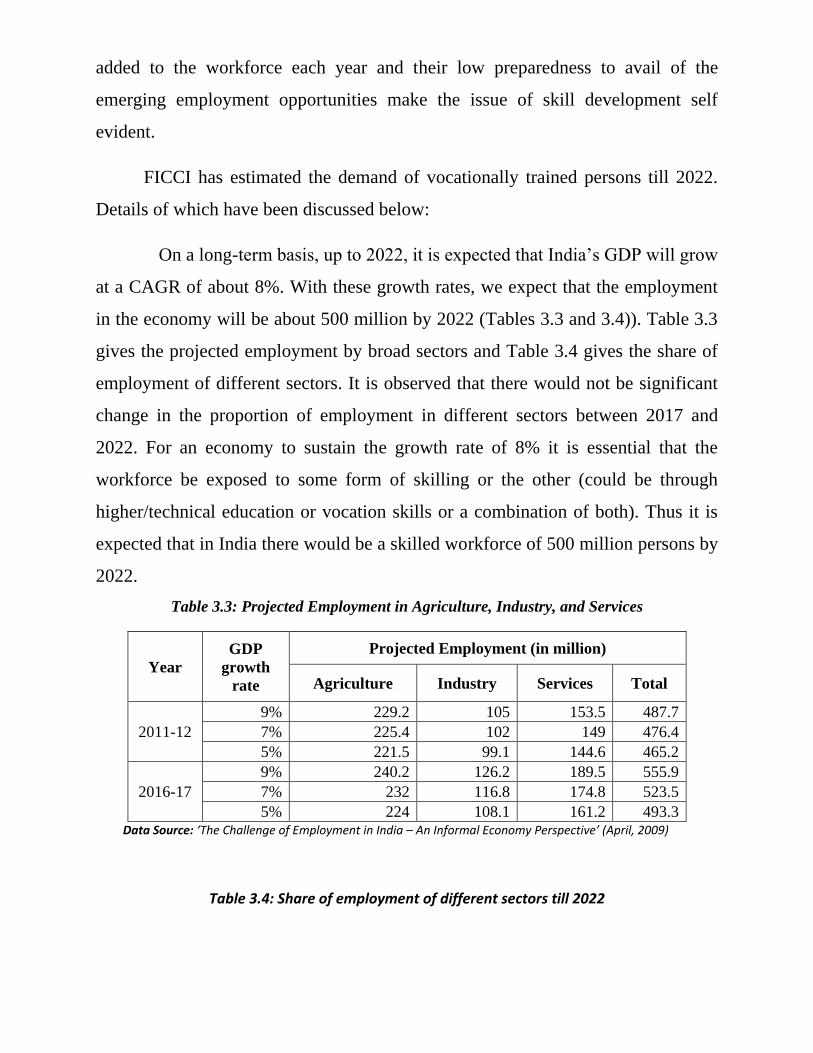
On a long-term basis, up to 2022, it is expected that India‘s GDP will grow
at a CAGR of about 8%. With these growth rates, we expect that the employment
in the economy will be about 500 million by 2022 (Tables 3.3 and 3.4)). Table 3.3
gives the projected employment by broad sectors and Table 3.4 gives the share of
employment of different sectors. It is observed that there would not be significant
change in the proportion of employment in different sectors between 2017 and
2022. For an economy to sustain the growth rate of 8% it is essential that the
workforce be exposed to some form of skilling or the other (could be through
higher/technical education or vocation skills or a combination of both). Thus it is
expected that in India there would be a skilled workforce of 500 million persons by
2022.
Table 3.3: Projected Employment in Agriculture, Industry, and Services
Year
GDP
growth
rate
Projected Employment (in million)
Agriculture Industry Services Total
2011-12
9% 229.2 105 153.5 487.7
7% 225.4 102 149 476.4
5% 221.5 99.1 144.6 465.2
2016-17
9% 240.2 126.2 189.5 555.9
7% 232 116.8 174.8 523.5
5% 224 108.1 161.2 493.3 Data Source: ‘The Challenge of Employment in India – An Informal Economy Perspective’ (April, 2009)
Table 3.4: Share of employment of different sectors till 2022
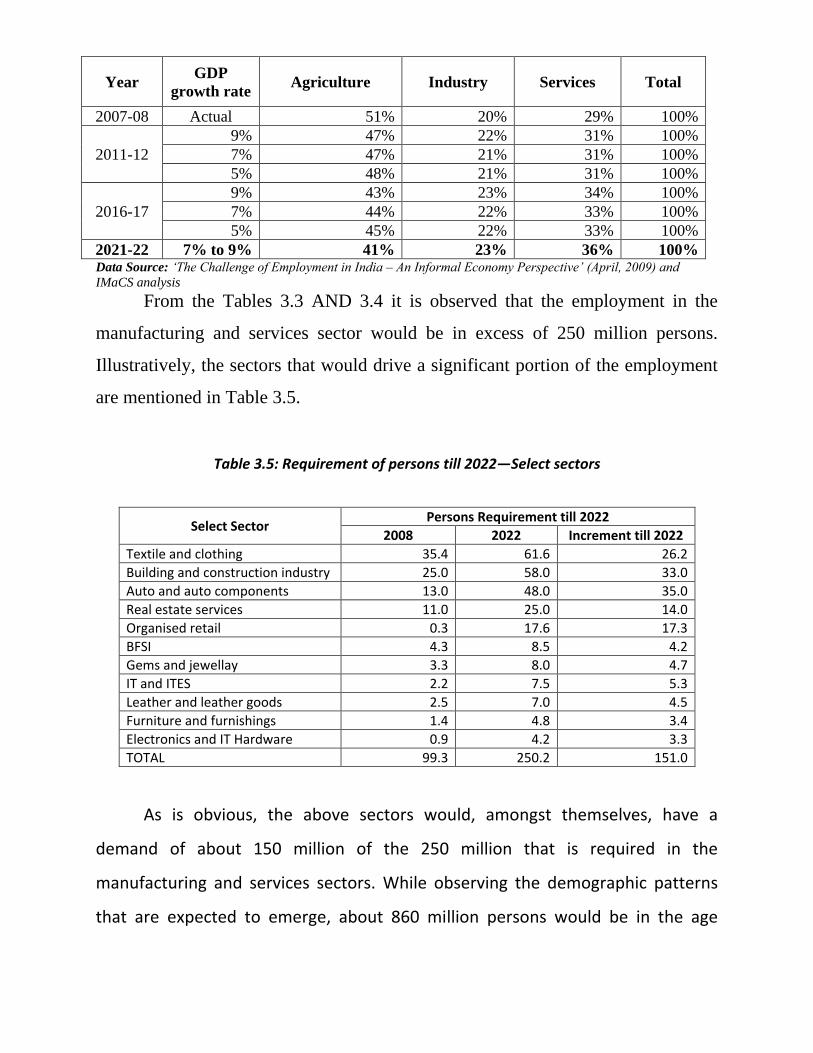
Year GDP
growth rate Agriculture Industry Services Total
2007-08 Actual 51% 20% 29% 100%
2011-12
9% 47% 22% 31% 100%
7% 47% 21% 31% 100%
5% 48% 21% 31% 100%
2016-17
9% 43% 23% 34% 100%
7% 44% 22% 33% 100%
5% 45% 22% 33% 100%
2021-22 7% to 9% 41% 23% 36% 100% Data Source: „The Challenge of Employment in India – An Informal Economy Perspective‟ (April, 2009) and
IMaCS analysis
From the Tables 3.3 AND 3.4 it is observed that the employment in the
manufacturing and services sector would be in excess of 250 million persons.
Illustratively, the sectors that would drive a significant portion of the employment
are mentioned in Table 3.5.
Table 3.5: Requirement of persons till 2022—Select sectors
Select Sector Persons Requirement till 2022
2008 2022 Increment till 2022
Textile and clothing 35.4 61.6 26.2
Building and construction industry 25.0 58.0 33.0
Auto and auto components 13.0 48.0 35.0
Real estate services 11.0 25.0 14.0
Organised retail 0.3 17.6 17.3
BFSI 4.3 8.5 4.2
Gems and jewellay 3.3 8.0 4.7
IT and ITES 2.2 7.5 5.3
Leather and leather goods 2.5 7.0 4.5
Furniture and furnishings 1.4 4.8 3.4
Electronics and IT Hardware 0.9 4.2 3.3
TOTAL 99.3 250.2 151.0
As is obvious, the above sectors would, amongst themselves, have a
demand of about 150 million of the 250 million that is required in the
manufacturing and services sectors. While observing the demographic patterns
that are expected to emerge, about 860 million persons would be in the age
group of 15 to 59 by 2022 (as compared to about 725 million currently).In other
words about 12 million persons are expected to join the workforce every year.
Thus with about 12 million persons expected to join the workforce every
year, and an existing skill development capacity of about 3.4 million, it is thus
required to enhance the skilling and technical education capacity to about 15
million (considering that even sections of the existing workforce would have to be
trained). It is expected that this 15 million would be the required skill
development capacity in vocational training in itself as a large portion of the
employment (as well as workforce input) would occur in the lower portions of the
skill pyramid.
3.7 The Qualitative aspect of Deficiencies
For quite some time now concern has been expressed about the mismatch
between the job market‘s requirements on the one hand and the inputs provided by
our education system in general on the other hand. This has become one of the
major areas of concern and our Prime Minister has also emphasized it. The quality
of technical education which is given in our country is not up to mark and it is not
fulfilling the market requirement. This is an area where the Prime Minister has
welcomed Chambers of Commerce and Industry (CII) to join hands with the
Government and create a public-private partnership model for designing and
implementing the scheme.
In vocational education training there are too much structural deficiencies.
The kind of courses which are provided through ITIs /ITCs are very traditional and
they are not absorbing the market demand. This is one of the reasons for the poor
performance of the vocational education training in India. It has also been observed
that the quality of vocational education training which is being provided is very
poor. There are not enough teachers available for the courses offered. The seating
capacity is also very less. There are not any arrangements of new courses. There is
not any proper placement cell. It has also been observed that there is a different fee
structure in different states. The general feeling is that the fee charged from the
trainees is much less than the cost of actual training but it is not so. Moreover
whatever fee is charged from the candidates, it goes to the Consolidated Fund of
the State and in the allocation of resources for vocational training, generally a very
low priority is accorded by the State Government as a result of which almost 90%
of resources go towards payment of salaries and only 10% are spent on the actual
training. The result is that the quality of training is not up to the mark. The effort,
therefore, should be made to increase the sources of revenue and try to plough
them back for improving the quality of training and meeting the requirement of
raw material for training purposes as well as up gradation of tools, equipments,
machinery and technology. Greater priority is accorded to create new institutions
by the State Governments, as compared to the upkeep of the existing institutions
which is not a good practice.
Training is a critical input for up-scaling the informal sector activities. This
is highlighted in various workshops. Issues such as extending training to workers
who are not necessarily educated and who are scattered over wide geographic
locales, without easy access to stipulated centres of training and not necessarily
able to pay for it, are required to be addressed.
It is difficult to address the issue of training in the conventional training
framework, given the broad band of activities in the informal economy. Most
studies suggest that there is very little training available for informal sector
activities, and whatever is available, is not necessarily relevant or effective. Some
characteristics of a successful approach to training have been identified. These
include: (1) the design of effective training programmes requires knowledge of
labour markets ; (2) the whole training approach should be demand-driven and job-
linked, so as to minimize skill mis-match ; (3) multi-skilling should be a part of
the training process ; (4) effort should be made to ensure that training is skill
oriented and cuts across occupational specificity ; (5) training, as a matter of
principle, should be of relatively short duration, if possible, it should be field based
and cost effective and there should be stakeholder participation in the design of
training schemes ; and (6) training for the informal sector work should not be
linked to degrees or diplomas ; the aim should be to identify effective users of
skills.
It has been argued by a number of economists, that India should use its
service sector more than its manufacturing sector to solve its unemployment
problem. At the same time our education system and society follow the lowest
common denominator in assigning young people to the service sector, a problem
which may continue for a couple of decades. Our focus therefore should be on the
manufacturing sector as well, as it is the basic engine of growth for the nation.
In order to enhance the training capacity, the State Governments should
persuade the ITIs and ITCs to run 2-3 shifts, wherever it is feasible. In fact, the
Apprenticeship Training System also needs expansion as well as modification because
in a country like India where there is a huge requirement of skilled workforce, there is
a need to increase the number of participating enterprises in the services sector and in
the un-organised sector as majority of the job opportunities are available in these
sectors.
3.8 Efficiency and Organization of ITIs
The Industrial Training form the backbone of the vocational training
structure in the states, yet the government institutes generally suffer from the
sluggishness and inadequacies in management and financial support processes. A
recent study by the ILO (International Labour Organization) shows that there are
problems of internal as well as external efficiencies with the ITI setup. The study
also shows that there is wide variation in the coverage, both in terms of area and
the trades. Regarding the private institutes (i.e. ITCs) the study says that, generally
the instructors are often not paid adequately, resulting in poor standard of training
offered.
One trend that has been noticed is the long term regular training programmes
is not a good trend. In case of women, their low enrolment and graduation is due to
sociological reason and because of non availability of hostels, proper transport
arrangements and security issues. Another trend which has been noticed is that
majority of unorganized sector establishments are in urban areas and serve mainly
urban needs, while the educated youth in the rural areas are without access to
adequate training opportunities. The original purpose of setting up these
institutions was to strengthen the urban industrialization process, not as skill
development agencies for the rural poor.
There is a need for decentralized decision making at the district levels and
for the coordination of training needs and ensuring commensurate response from
these institutions. The most important aspect which needs more attention is that
training facilities should be coupled by placement cells. It is necessary to give
them inherent strength and flexibility to meet the changing demands of the market
(Gupta, S.P., 2006).
It is necessary to develop a national portal which can keep the details of each
and every trainee passing from any ITI / ITC with his name, address, educational
qualification, technical qualification, telephone number, mobile number, etc. so
that any industry wanting to recruit persons with certain skills may access this
portal and select the best amongst them for his purpose. This data base will have to
be developed at the ITI level and then networked with the national portal so that
the information is updated regularly. The Directorate General of Employment &
Training has started the exercise but it needs to be done expeditiously so that it can
serve the growing needs of the industry and the skilled youth. In order to attract a
larger number of youth to the vocational training, it may be worthwhile to consider
change the name of ITIs / ITCs to ―Skill Development College‖ and carry out
massive publicity campaign to change the mind set of parents and young persons
and make them realize that going to a Skill Development College provides much
better career prospects than going to a general education stream.
3.9 Eleventh Five Year Plan Strategies
The eleventh five year plan is mainly emphasizing on creating a pool of
skilled personnel in appropriate numbers and skills in line with the requirements of
ultimate users such as industry, trade and services sector. In this way it will lead to
expansion of employment including shift of surplus labour from agriculture to non-
agriculture sector. So it was proposed to launch a major ―skill development
mission" during the Eleventh Five Year Plan with an outlay of Rs. 22800 crore
(Government of India, Planning Commission, 2008).
While imparting the training, emphasis would be given to twenty high
growth employment sectors identified by the Confederation of Indian Industries
(CII) and Federation of Indian Chambers of Commerce (FICCI). Details of these
growth sectors has been discussed in Chapter VIII on ―Identification of Trades for
Training‖. It is also proposed to increase the training facilities for the new entrants
to labour force from the existing 2.5 million per year to 10 million per year in non-
agriculture sectors.
3.9.1 Skill Development Mission (SDM)
I) Mission Goal
Government has launched a skill development mission in order to create a
pool of skilled personnel in a period of 5 to 8 years to meet the increasing demand
of the skilled workforce in domestic economy. The mission would also create a
surplus of skilled persons to meet the requirement of other aging economies in the
world.
The mission would ensure that our supply side responses are moving in the
same way as our demand. These responses should move in the same way as
demand not only in the present but the future also. For this the mission will involve
both public and private sectors in such a way that it is beneficial to both.
II) Mission objectives and functions:
Main objectives and functions of the mission are:
a) To identify skill deficits sector-wise as well as region-wise and then
meet their demand through planned action in a given time period.
b) To reposition and change the existing ITIs, polytechnics and VET in
school in a Public Private Partnership mode. Private Institutions
should be given functional as well as governance autonomy.
c) To establish a 'credible accreditation system and a ‗guidance
framework ' for all accrediting Agencies, set up by various ministries
and or by industry associations.
d) To establish a National skill inventory and another National database
for skill deficiency mapping on a national web portal for exchange of
information between employers and employment seekers.
e) To enlarge the 50000 Skill Development centers (SDCs) programme
eventually into a 'virtual skill development resource network ' for
web-based learning.
Apart from all these objectives and functions there should be an
establishment of trainee placement and tracking system for effective evaluation
and enable employment exchanges to function as career counseling centers.
III) Mission Strategies
Main strategies of the Mission are:
a) To encourage Ministries to expand existing public sector skill development
Infrastructure and its utilization by a factor of five which will increase the
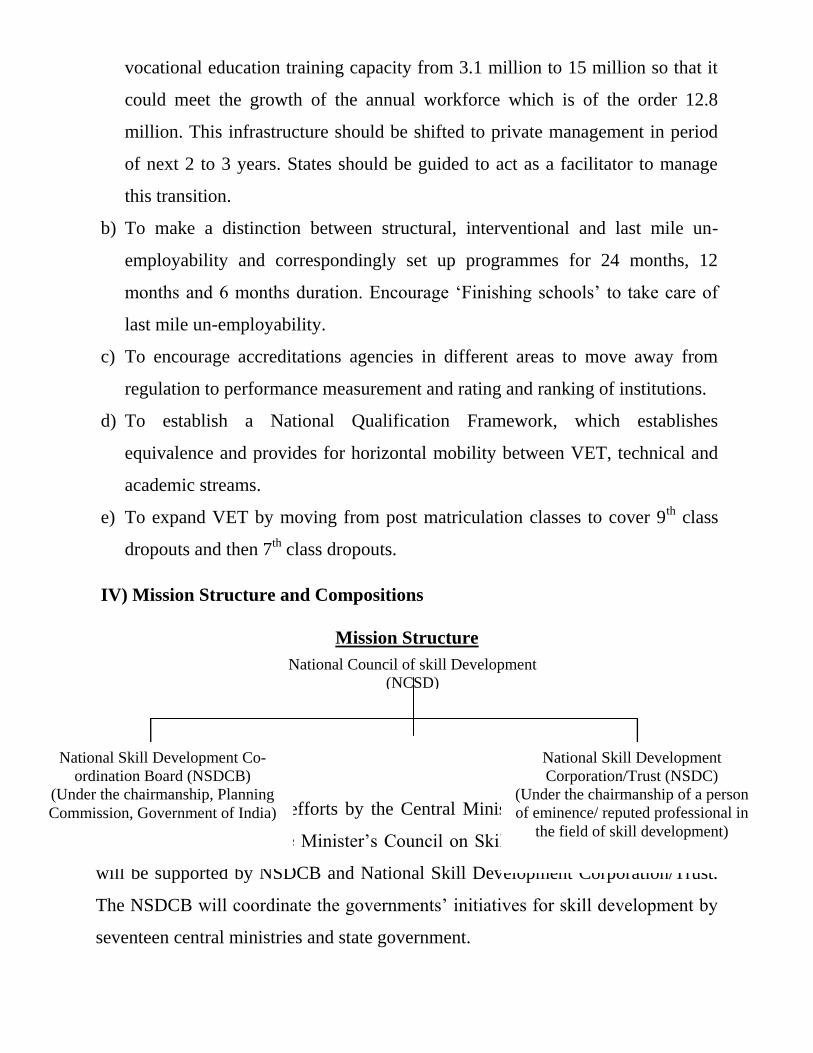
vocational education training capacity from 3.1 million to 15 million so that it
could meet the growth of the annual workforce which is of the order 12.8
million. This infrastructure should be shifted to private management in period
of next 2 to 3 years. States should be guided to act as a facilitator to manage
this transition.
b) To make a distinction between structural, interventional and last mile un-
employability and correspondingly set up programmes for 24 months, 12
months and 6 months duration. Encourage ‗Finishing schools‘ to take care of
last mile un-employability.
c) To encourage accreditations agencies in different areas to move away from
regulation to performance measurement and rating and ranking of institutions.
d) To establish a National Qualification Framework, which establishes
equivalence and provides for horizontal mobility between VET, technical and
academic streams.
e) To expand VET by moving from post matriculation classes to cover 9th
class
dropouts and then 7th class dropouts.
IV) Mission Structure and Compositions
Mission Structure
Skill development efforts by the Central Ministries will be reviewed from
time to time by the Prime Minister‘s Council on Skill Development. The council
will be supported by NSDCB and National Skill Development Corporation/Trust.
The NSDCB will coordinate the governments‘ initiatives for skill development by
seventeen central ministries and state government.
National Council of skill Development
(NCSD)
(Under the chairmanship of Prime Minister)
National Skill Development Co-
ordination Board (NSDCB)
(Under the chairmanship, Planning
Commission, Government of India)
National Skill Development
Corporation/Trust (NSDC)
(Under the chairmanship of a person
of eminence/ reputed professional in
the field of skill development)
National Skill Development Corporation/Trust would be set up to encourage
the private sector in this mission. In private sector, knowledgeable persons
especially representing the twenty high growth sectors will be involved in the
planning process.
3.9.2 Action plan for Government Initiatives
Over the years about 20 ministries have created an infrastructure for skill
development. There are 1896 ITIs (under state government), 9583 secondary
school (with VET stream) and 3218 ITCs (under private sector). Besides this,
Ministry of Rural Development, Ministry of Micro, Small and Medium
Enterprises, Ministry of Tourism & Culture, Ministry of Health & Family Planning
and several others have their own establishment. All this needs to be restructured
and reposition in collaboration with private enterprises. New capacities are also
being created by the different ministries under Public-Private Partnership (PPP)
mode.
I) ITI’s by the Ministry of Labour and Employment
Complete Up gradation of 500 ITI‘s by investing Rs. 2.0-3.5 crore in each
into institutions of excellence and up gradation of remaining 1396 ITI‘s in PPP
mode by providing interest for loan up to Rs. 2.5 crore each. It is also proposed to
set up 1000 new ITI‘s in underserved regions in PPP mode.
Beside this it is also proposed to set up 500 new ITIs in industrial
clusters/special Economic zone on a demand led basis, quadruple ITI capacity by
encouraging them to run two or more shifts, start intensive training programmes
for the facially and reforming the MOUs between states and private agencies to
transform the ITIs in PPP mode.
II) Vocational Education by the Ministry of HRD.
It is proposed to expand the vocational education in 9500 senior secondary
schools with an intake capacity of 1.0 million to 20000 schools with an intake
capacity of 2.5 million by encouraging public-private partnership in schools. Move
the vocational education progressively from 2-year stream, starting after class 10,
to a stream that captures 9th class drop outs and later on it should commence from
class 7, capturing 7th class drop outs. In these schools emphasis should be given to
soft skills which can help in getting employment viz. English language skills,
quantitative skills, computer literacy, spread sheet, word processing, computer
graphics, presentation skills, behavioral and interpersonal skills etc.
III) RUDSETIs (Rural Development Self Employment Training institute) by
Ministry of Rural Development.
It is proposed to set up 600 RUDSETIs, one in each district. State
government will provide land and Government will meet 75% of the capital cost
and the remaining 25% will be provided by the banks.
IV) Setting up a virtual Skill Development Resource Network Linking 50000
Skill Development Centers (SDCs) under the Ministries of Information
Technology, Small and Medium enterprises, Rural Development and Textile
These ministries have proposed to set up 50000 SDCs to train approximately
200 persons per centre per year. These SDCs will deliver training capsules of 8-12
week duration. Training material will be created by participating ministries,
enterprises, industry associations with the help of NASSCOM. Mentor Groups for
tutorial support in online interactive mode will be provided by industry
associations. At the end of the programmes there will be Employment Melas for
placement of unplaced trainees.
3.9.3 Private Sector
Ten high growth sectors of industries and ten high growth sectors of services
have been identified. These sectors will have the potentiality to provide
employment. The mission will involve the association of these 20 sectors to
identify and quantify skill deficiencies in their respective sectors and will prepare
the sectoral plan to meet their growing skill needs. Skill Development Corporation
Trust will make periodic as well as annual report of its plans and activities and put
them in public domain. It will also identify the areas where government support is
required.
3.9.4 Ministries of the Central Government having Skill Development
Programmes
Line ministries/departments will be responsible for the implementation of
the skill development programmes. They will modify the programmes in line with
the policies and strategies by the apex committee suggested by Skill Development
Mission.
3.9.5 State Governments
I) State Government will transform Employment Exchanges to act as Career
Counseling Centre.
II) State council of Vocational Training will be upgraded and strengthened.
III) The existing ITI‘s will be modernized and the effectiveness of the
ongoing programmes will also be enhanced
IV) There should be Personnel Policy to ensure accountability and
outcomes.
V) Draw up plan for strengthening existing infrastructure.
VI) Deligate powers to local management of institutes
VII) Revamp the institute‘s management committees to give more
autonomy in the management of institutes.
3.9.6 State Skill Development Mission
The state Governments may establish the state-level missions. The main
aim of State Skill Development Mission will be to gear up skill development
activities, in the mission mode.
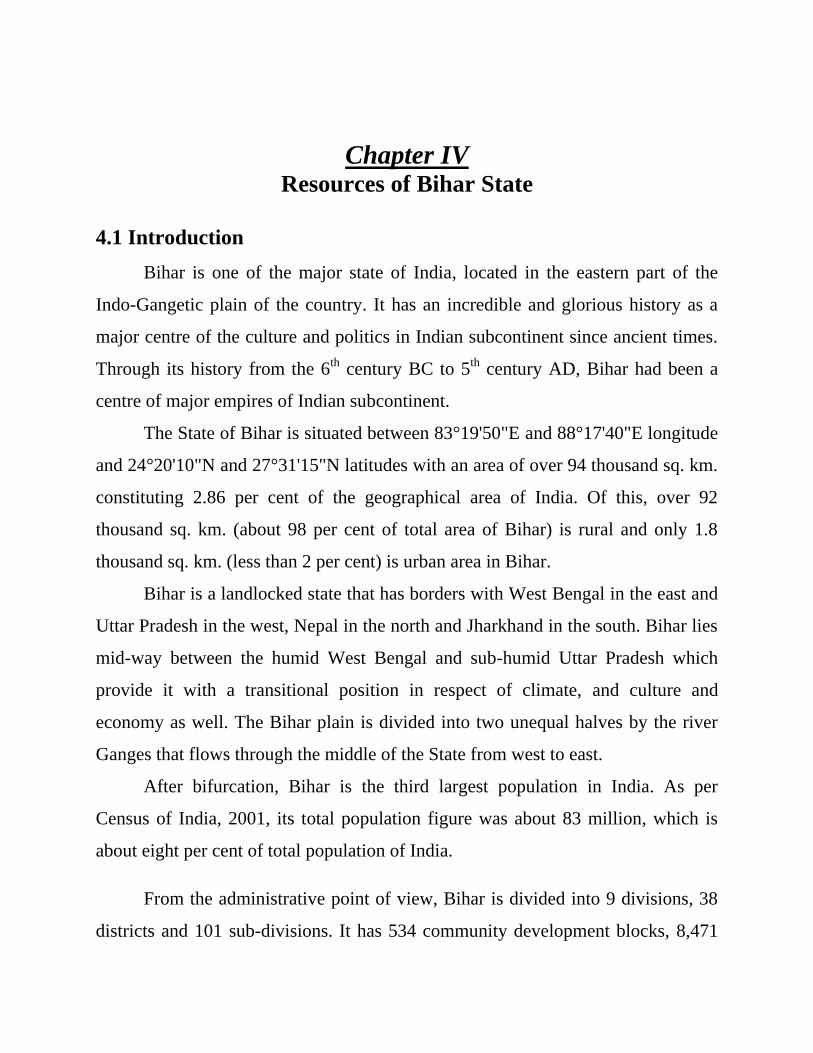
Chapter IV Resources of Bihar State
4.1 Introduction
Bihar is one of the major state of India, located in the eastern part of the
Indo-Gangetic plain of the country. It has an incredible and glorious history as a
major centre of the culture and politics in Indian subcontinent since ancient times.
Through its history from the 6th
century BC to 5th
century AD, Bihar had been a
centre of major empires of Indian subcontinent.
The State of Bihar is situated between 83°19'50"E and 88°17'40"E longitude
and 24°20'10"N and 27°31'15"N latitudes with an area of over 94 thousand sq. km.
constituting 2.86 per cent of the geographical area of India. Of this, over 92
thousand sq. km. (about 98 per cent of total area of Bihar) is rural and only 1.8
thousand sq. km. (less than 2 per cent) is urban area in Bihar.
Bihar is a landlocked state that has borders with West Bengal in the east and
Uttar Pradesh in the west, Nepal in the north and Jharkhand in the south. Bihar lies
mid-way between the humid West Bengal and sub-humid Uttar Pradesh which
provide it with a transitional position in respect of climate, and culture and
economy as well. The Bihar plain is divided into two unequal halves by the river
Ganges that flows through the middle of the State from west to east.
After bifurcation, Bihar is the third largest population in India. As per
Census of India, 2001, its total population figure was about 83 million, which is
about eight per cent of total population of India.
From the administrative point of view, Bihar is divided into 9 divisions, 38
districts and 101 sub-divisions. It has 534 community development blocks, 8,471
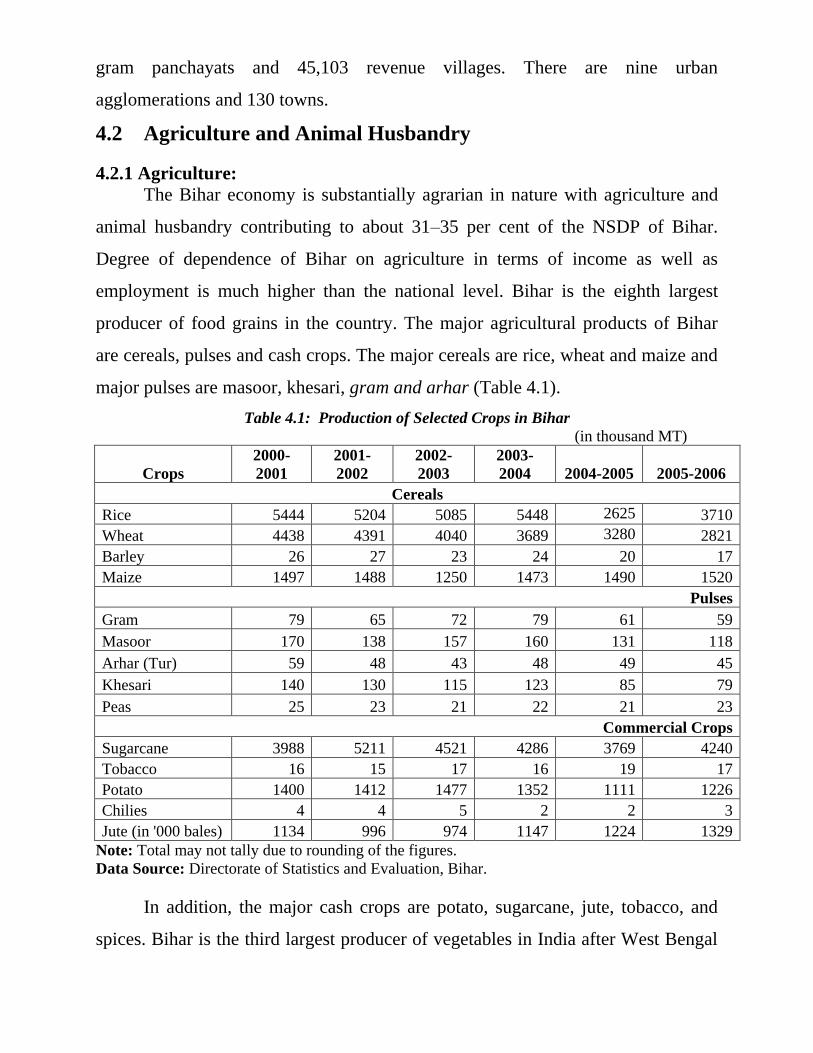
gram panchayats and 45,103 revenue villages. There are nine urban
agglomerations and 130 towns.
4.2 Agriculture and Animal Husbandry
4.2.1 Agriculture:
The Bihar economy is substantially agrarian in nature with agriculture and
animal husbandry contributing to about 31–35 per cent of the NSDP of Bihar.
Degree of dependence of Bihar on agriculture in terms of income as well as
employment is much higher than the national level. Bihar is the eighth largest
producer of food grains in the country. The major agricultural products of Bihar
are cereals, pulses and cash crops. The major cereals are rice, wheat and maize and
major pulses are masoor, khesari, gram and arhar (Table 4.1).
Table 4.1: Production of Selected Crops in Bihar
(in thousand MT)
Crops
2000-
2001
2001-
2002
2002-
2003
2003-
2004 2004-2005 2005-2006
Cereals
Rice 5444 5204 5085 5448 2625 3710
Wheat 4438 4391 4040 3689 3280 2821
Barley 26 27 23 24 20 17
Maize 1497 1488 1250 1473 1490 1520
Pulses
Gram 79 65 72 79 61 59
Masoor 170 138 157 160 131 118
Arhar (Tur) 59 48 43 48 49 45
Khesari 140 130 115 123 85 79
Peas 25 23 21 22 21 23
Commercial Crops
Sugarcane 3988 5211 4521 4286 3769 4240
Tobacco 16 15 17 16 19 17
Potato 1400 1412 1477 1352 1111 1226
Chilies 4 4 5 2 2 3
Jute (in '000 bales) 1134 996 974 1147 1224 1329
Note: Total may not tally due to rounding of the figures.
Data Source: Directorate of Statistics and Evaluation, Bihar.
In addition, the major cash crops are potato, sugarcane, jute, tobacco, and
spices. Bihar is the third largest producer of vegetables in India after West Bengal
and Uttar Pradesh. Bihar is the largest (Govt. of Bihar, Department of Industries,
―Bihar: A Land of Immense Opportunities for Food Processing Industry ‖)
producer of okra, second largest producer of cabbage -about 10 per cent of national
production in 2005 (Govt. of Bihar, Department of Industries, ―Fact Sheet‖, 2006),
third largest producer of potato (about 4 per cent), brinjal (about 14 per cent),
onion (about 18 per cent), bhindi (about 28 per cent) and cauliflower (about 20 per
cent), and significant producer of other vegetables within India.
Bihar is the fourth largest (Govt. of Bihar, Department of Industries, ―Bihar:
A Land of Immense Opportunities for Food Processing Industry‖) producer of
fruits with different varieties. Bihar is the largest (about 88 per cent of total
national production) (Govt. of Bihar, Department of Industries, ―Fact Sheet‖,
2006) producer of litchi, third largest producer of pineapple (about 9 per cent) and
fourth largest producer of mango (about 15 per cent) in India (Govt. of Bihar,
ILFS, ―Food Processing in Bihar, The road Ahead‖). The major fruit producing
districts mostly overlap with the vegetables producing ones. Muzaffarpur and
Vaishali lead in litchi and banana production. Darbhanga, Champaran (east &
west), Vaishali lead in mango production and Rohtas and Bhojpur lead in guava
production. A variety of spices are produced in Bihar. Chili accounts for about 48
per cent of the area under spices and 40 per cent of the total production, followed
by turmeric which occupies about 26 per cent of the area under spices and accounts
for 36 per cent of the production of spices in Bihar. Bihar is the only state
producing Makhana (gorgon nut) commercially.
The soil of Bihar is very fertile, which is revealed by the high share of net
sown area in the total geographical area (about 60 per cent) (Govt. of Bihar, ―Bihar
at a Glance, 2008‖, Directorate of Statistics and Evaluation, Patna) (Table 4.2).
Table 4.2: Classification of Land in Bihar
Details Area (in 000s
Hec.)
% to Geographical
Area
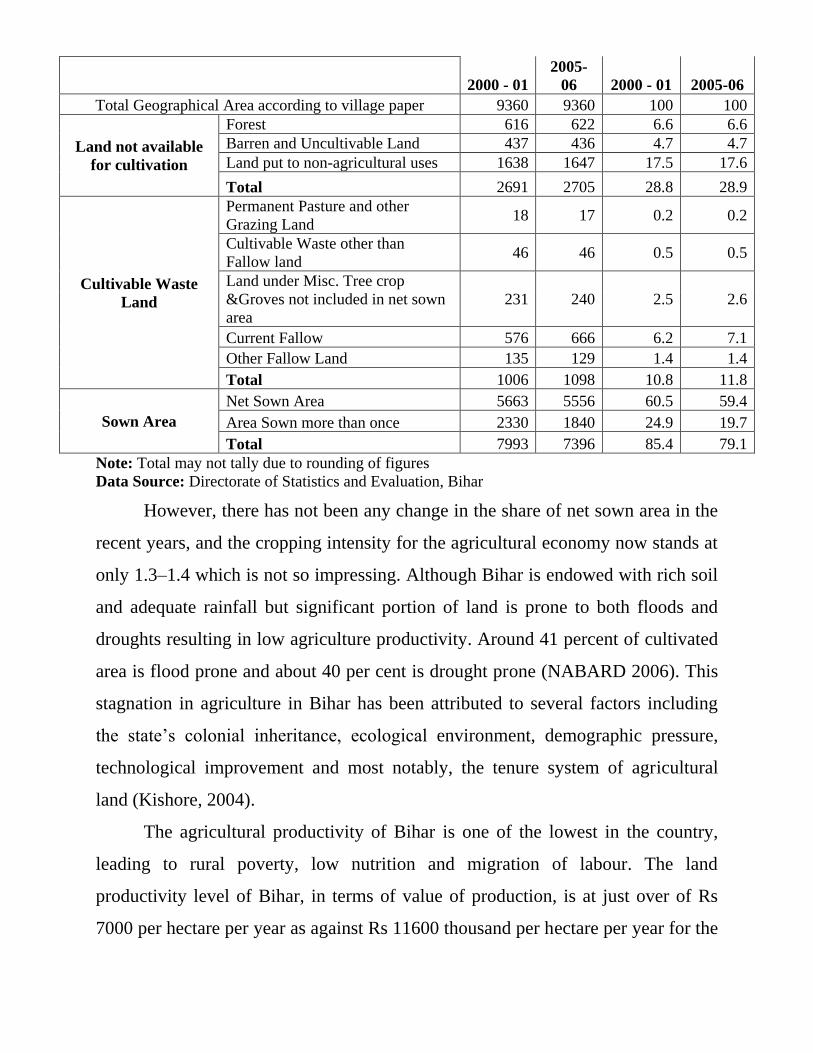
2000 - 01
2005-
06 2000 - 01 2005-06
Total Geographical Area according to village paper 9360 9360 100 100
Land not available
for cultivation
Forest 616 622 6.6 6.6
Barren and Uncultivable Land 437 436 4.7 4.7
Land put to non-agricultural uses 1638 1647 17.5 17.6
Total 2691 2705 28.8 28.9
Cultivable Waste
Land
Permanent Pasture and other
Grazing Land 18 17 0.2 0.2
Cultivable Waste other than
Fallow land 46 46 0.5 0.5
Land under Misc. Tree crop
&Groves not included in net sown
area
231 240 2.5 2.6
Current Fallow 576 666 6.2 7.1
Other Fallow Land 135 129 1.4 1.4
Total 1006 1098 10.8 11.8
Sown Area
Net Sown Area 5663 5556 60.5 59.4
Area Sown more than once 2330 1840 24.9 19.7
Total 7993 7396 85.4 79.1
Note: Total may not tally due to rounding of figures
Data Source: Directorate of Statistics and Evaluation, Bihar
However, there has not been any change in the share of net sown area in the
recent years, and the cropping intensity for the agricultural economy now stands at
only 1.3–1.4 which is not so impressing. Although Bihar is endowed with rich soil
and adequate rainfall but significant portion of land is prone to both floods and
droughts resulting in low agriculture productivity. Around 41 percent of cultivated
area is flood prone and about 40 per cent is drought prone (NABARD 2006). This
stagnation in agriculture in Bihar has been attributed to several factors including
the state‘s colonial inheritance, ecological environment, demographic pressure,
technological improvement and most notably, the tenure system of agricultural
land (Kishore, 2004).
The agricultural productivity of Bihar is one of the lowest in the country,
leading to rural poverty, low nutrition and migration of labour. The land
productivity level of Bihar, in terms of value of production, is at just over of Rs
7000 per hectare per year as against Rs 11600 thousand per hectare per year for the
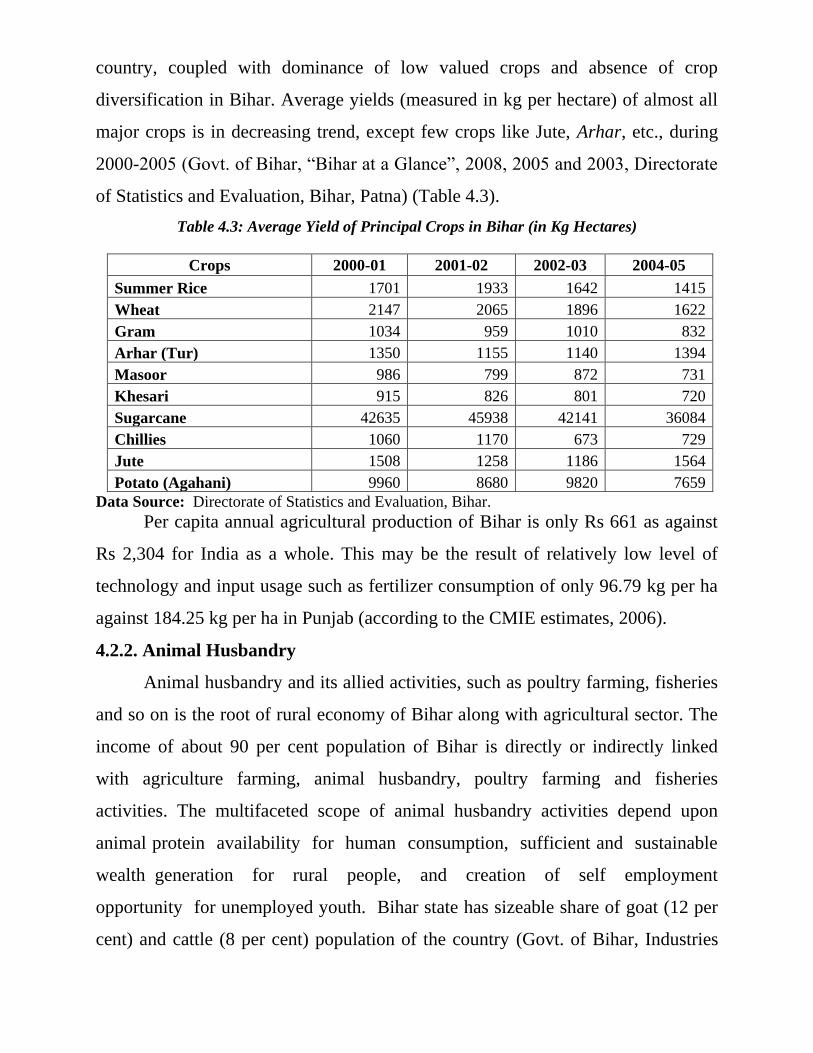
country, coupled with dominance of low valued crops and absence of crop
diversification in Bihar. Average yields (measured in kg per hectare) of almost all
major crops is in decreasing trend, except few crops like Jute, Arhar, etc., during
2000-2005 (Govt. of Bihar, ―Bihar at a Glance‖, 2008, 2005 and 2003, Directorate
of Statistics and Evaluation, Bihar, Patna) (Table 4.3).
Table 4.3: Average Yield of Principal Crops in Bihar (in Kg Hectares)
Data Source: Directorate of Statistics and Evaluation, Bihar.
Per capita annual agricultural production of Bihar is only Rs 661 as against
Rs 2,304 for India as a whole. This may be the result of relatively low level of
technology and input usage such as fertilizer consumption of only 96.79 kg per ha
against 184.25 kg per ha in Punjab (according to the CMIE estimates, 2006).
4.2.2. Animal Husbandry
Animal husbandry and its allied activities, such as poultry farming, fisheries
and so on is the root of rural economy of Bihar along with agricultural sector. The
income of about 90 per cent population of Bihar is directly or indirectly linked
with agriculture farming, animal husbandry, poultry farming and fisheries
activities. The multifaceted scope of animal husbandry activities depend upon
animal protein availability for human consumption, sufficient and sustainable
wealth generation for rural people, and creation of self employment
opportunity for unemployed youth. Bihar state has sizeable share of goat (12 per
cent) and cattle (8 per cent) population of the country (Govt. of Bihar, Industries
Crops 2000-01 2001-02 2002-03 2004-05
Summer Rice 1701 1933 1642 1415
Wheat 2147 2065 1896 1622
Gram 1034 959 1010 832
Arhar (Tur) 1350 1155 1140 1394
Masoor 986 799 872 731
Khesari 915 826 801 720
Sugarcane 42635 45938 42141 36084
Chillies 1060 1170 673 729
Jute 1508 1258 1186 1564
Potato (Agahani) 9960 8680 9820 7659
Department, ―A Presentation on Leather Industries in Bihar and Its potential‖). In
case of goats, Bihar state accounts for third rank in the country next only to West
Bengal and Rajasthan. Bihar ranks fourth in term of meat production in India after
Andhra, West Bengal and Uttar Pradesh. There is however no abattoir and no
processing facility within the state. Most of the animals are slaughtered in
municipal slaughter house and meat sold is fresh to cater to the local demand. It is
envisaged that modern slaughter house with processing facilities having backward
and forward linkage can contribute significantly to the growth of value added
product within this sector. The buffalo meat production in India is growing at an
Average Annual Growth Rate (AAGR) of 5 per cent and the outstripping of
demand vis-à-vis supply of lamb and mutton present a huge opportunity for Bihar
to tap its large livestock resources which will create job opportunity both for
skilled and unskilled worker.
In 2006-07, the state‘s annual meat production was 178 thousand MT.
Annually 0.7 to 1 million small and large animals are slaughtered in Bihar for the
purpose of meat. The production of eggs amounted to 9455 million eggs in Bihar
in 2006-2007 (Table 4.4). Poultry meat is the fastest growing animal protein in
India with an annual growth rate of 11 per cent during 1991–2003 and estimated to
increase further. Bihar produces about 55 lakh tons of milk. The technology being
used in milk processing capacity in Bihar is now decades old with no primary
processing or cooling facility at the farm or village level. Bihar is the largest
producer (about 50% of national production) of honey in India with total
production of about 3900 MT in 2002 and about one lakh families directly engaged
in honey production activities in Bihar (Govt. of Bihar , ―Fact Sheet‖, Department
of Industries, 2006). The productivity of honey production is almost thrice (about
60 kg per box) of national average.
Table 4.4: Production of animal husbandry in Bihar
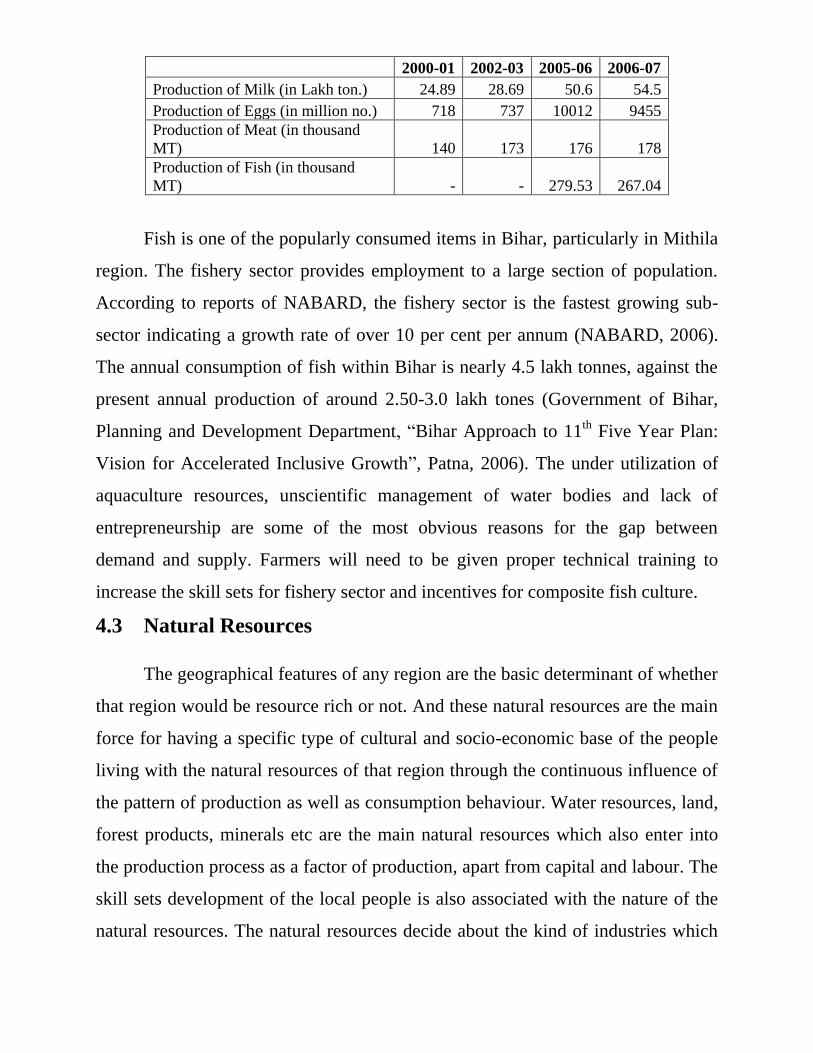
2000-01 2002-03 2005-06 2006-07
Production of Milk (in Lakh ton.) 24.89 28.69 50.6 54.5
Production of Eggs (in million no.) 718 737 10012 9455
Production of Meat (in thousand
MT) 140 173 176 178
Production of Fish (in thousand
MT) - - 279.53 267.04
Fish is one of the popularly consumed items in Bihar, particularly in Mithila
region. The fishery sector provides employment to a large section of population.
According to reports of NABARD, the fishery sector is the fastest growing sub-
sector indicating a growth rate of over 10 per cent per annum (NABARD, 2006).
The annual consumption of fish within Bihar is nearly 4.5 lakh tonnes, against the
present annual production of around 2.50-3.0 lakh tones (Government of Bihar,
Planning and Development Department, ―Bihar Approach to 11th
Five Year Plan:
Vision for Accelerated Inclusive Growth‖, Patna, 2006). The under utilization of
aquaculture resources, unscientific management of water bodies and lack of
entrepreneurship are some of the most obvious reasons for the gap between
demand and supply. Farmers will need to be given proper technical training to
increase the skill sets for fishery sector and incentives for composite fish culture.
4.3 Natural Resources
The geographical features of any region are the basic determinant of whether
that region would be resource rich or not. And these natural resources are the main
force for having a specific type of cultural and socio-economic base of the people
living with the natural resources of that region through the continuous influence of
the pattern of production as well as consumption behaviour. Water resources, land,
forest products, minerals etc are the main natural resources which also enter into
the production process as a factor of production, apart from capital and labour. The
skill sets development of the local people is also associated with the nature of the
natural resources. The natural resources decide about the kind of industries which
should come up in that region from both production as well as consumption point
of view. Therefore natural resources determine the derived demand for manpower
(skilled as well as unskilled) in that region.
Bihar is very rich in terms of natural resources. Although, it has
comparatively less proportion of forest and minerals as against national average
availability, Bihar has a vast area of fertile land, huge volume of water resources
and hard working manpower. To assess the demand for skill sets in Bihar, it is
necessary to give a look on the natural resources of Bihar.
4.3.1. Forest
Forest products are one of the major resources for the production as well as
direct consumption. Bihar lies in the tropical to sub-tropical region. Rainfall here is
the most significant factor in determining the nature of vegetation. Out of total
geographical area of Bihar, only 6.6 per cent is under the forest cover (see Table
3.2). The sub Himalayan foothill constitutes the belt of moist deciduous forests.
These consist of scrub, grass and reeds. Since the annual rainfall in this region is
more than 1600 mm, so it favours the luxuriant Sal forest in this area. Due to the
hot and dry summer, the deciduous forests also abound there, which consist of Sal,
Shisham, Cendrela Toona, Khair, and Semal, etc. This type of forest can be seen in
the eastern part of Bihar mainly in Saharsa and Purnia districts.
4.3.2. Soil
The Bihar plain consists of a thick alluvial layer of drift origin overlying in
most part of the state. The soil is mainly young loam rejuvenated every year by
constant deposition of silt, clay, and sand brought by different streams. This soil is
deficient in phosphoric acid, nitrogen, and humus, but potash and lime are usually
present in sufficient quantity. There are three major types of soil in Bihar:
Piedmont Swamp Soil - found in north western part of west Champaran district.
Terai Soil – found in northern part of the state along the border of Nepal. The

Gangetic Alluvium – the plain of Bihar is covered by Gangetic alluvium (both new
as well as old). Almost all the economic activities are directly or indirectly
dependent on soil. Thus soil is the backbone of agricultural and industrial
development.
4.3.3. Water
Bihar is abundantly endowed with water resources, both ground and surface
water. Besides high rainfall, it has considerable water supply from the rivers,
which flow through the entire territory of Bihar. The Ganges is the main river, and
it has so many tributaries originated in the Himalayas. Among these rivers, Saryu
(Ghaghra), Gandak, Budhi Gandak, Bagmati, Kamla-Balan, Kosi and
Mahananda are major ones. Some of the other rivers which flow through Bihar are
Sone, Kosi, Uttari Koyal, Punpun, Panchane and Karmnasha. All the above rivers
have their impact on the economy of Bihar. These rivers make the water available
for irrigation purpose (Table 4.5), provide a medium for water transport and
provide fishes for fishery industry.
Table 4.5: Irrigation Potential in Bihar
Surface Water 6.33 Million Hectares
Ground Water 4.85 Million Hectares
Total 11.19 Million Hectares
Data Source: Bihar at Making: A Presentation to Investment Commission, Ministry of
Industries and Government of Bihar.
Though Bihar is getting benefited from her abundant water resources, yet,
Bihar is suffering from the devastation by flood in rainy seasons in almost every
year. Out of 38 districts of Bihar, 29 districts are flood prone covering about 75
per cent of total geographical area of Bihar (Dr. M S Ahluwalia, Dy. Chairman,
Planning Commission, Govt. of Bihar ―Water Resources: A presentation by Water
Resources Department‖). The flood in Bihar destroys the agricultural products,
cattle, infrastructure, and so on, and shake the Bihar‘s economy in frequent years.
4.3.4. Minerals
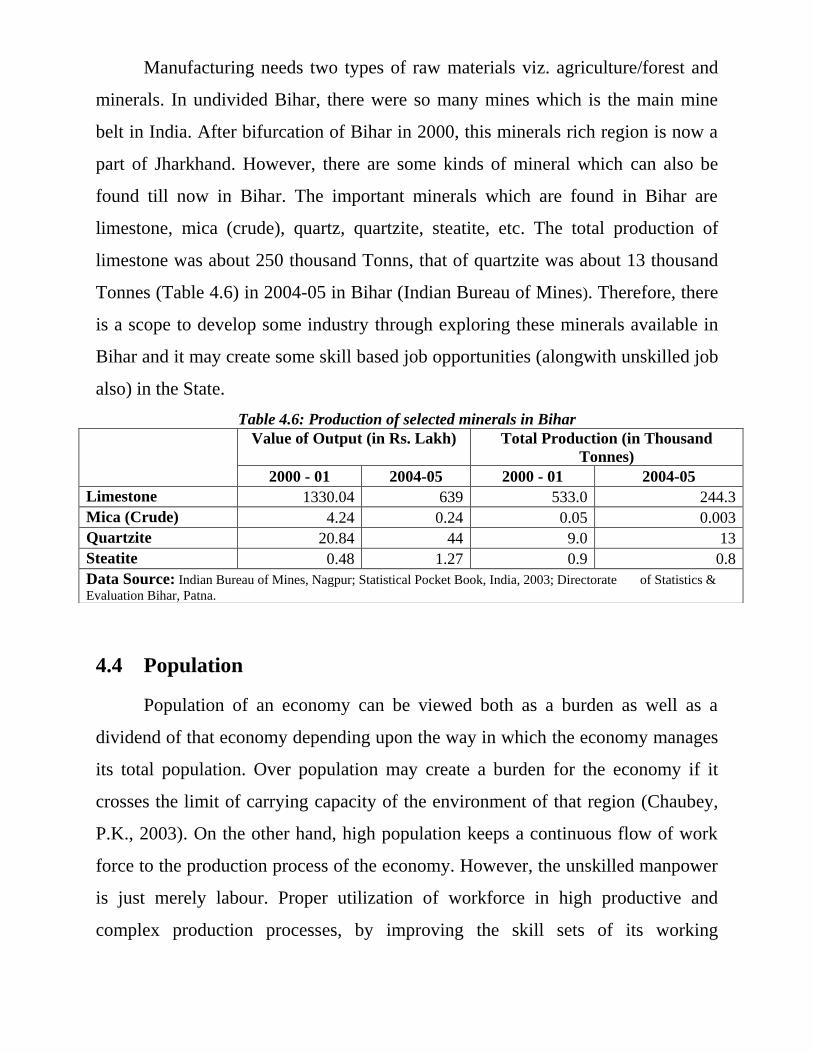
Manufacturing needs two types of raw materials viz. agriculture/forest and
minerals. In undivided Bihar, there were so many mines which is the main mine
belt in India. After bifurcation of Bihar in 2000, this minerals rich region is now a
part of Jharkhand. However, there are some kinds of mineral which can also be
found till now in Bihar. The important minerals which are found in Bihar are
limestone, mica (crude), quartz, quartzite, steatite, etc. The total production of
limestone was about 250 thousand Tonns, that of quartzite was about 13 thousand
Tonnes (Table 4.6) in 2004-05 in Bihar (Indian Bureau of Mines). Therefore, there
is a scope to develop some industry through exploring these minerals available in
Bihar and it may create some skill based job opportunities (alongwith unskilled job
also) in the State.
Table 4.6: Production of selected minerals in Bihar
4.4 Population
Population of an economy can be viewed both as a burden as well as a
dividend of that economy depending upon the way in which the economy manages
its total population. Over population may create a burden for the economy if it
crosses the limit of carrying capacity of the environment of that region (Chaubey,
P.K., 2003). On the other hand, high population keeps a continuous flow of work
force to the production process of the economy. However, the unskilled manpower
is just merely labour. Proper utilization of workforce in high productive and
complex production processes, by improving the skill sets of its working
Value of Output (in Rs. Lakh) Total Production (in Thousand
Tonnes)
2000 - 01 2004-05 2000 - 01 2004-05
Limestone 1330.04 639 533.0 244.3
Mica (Crude) 4.24 0.24 0.05 0.003
Quartzite 20.84 44 9.0 13
Steatite 0.48 1.27 0.9 0.8
Data Source: Indian Bureau of Mines, Nagpur; Statistical Pocket Book, India, 2003; Directorate of Statistics &
Evaluation Bihar, Patna.
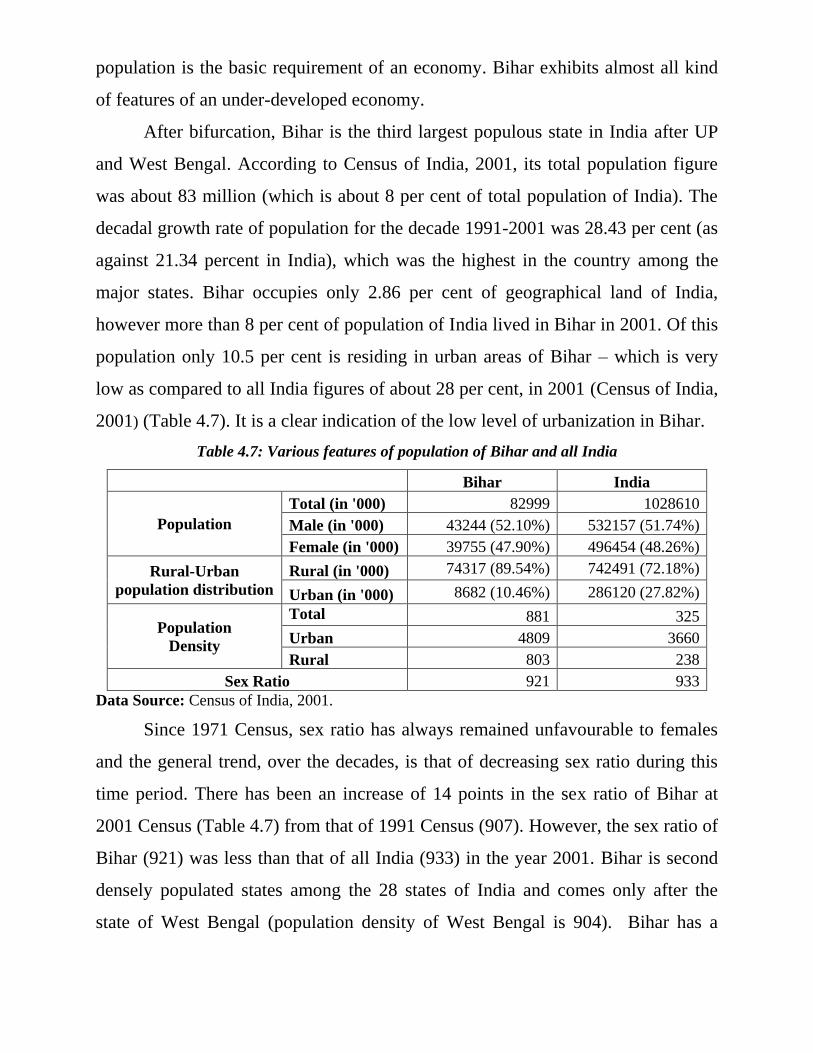
population is the basic requirement of an economy. Bihar exhibits almost all kind
of features of an under-developed economy.
After bifurcation, Bihar is the third largest populous state in India after UP
and West Bengal. According to Census of India, 2001, its total population figure
was about 83 million (which is about 8 per cent of total population of India). The
decadal growth rate of population for the decade 1991-2001 was 28.43 per cent (as
against 21.34 percent in India), which was the highest in the country among the
major states. Bihar occupies only 2.86 per cent of geographical land of India,
however more than 8 per cent of population of India lived in Bihar in 2001. Of this
population only 10.5 per cent is residing in urban areas of Bihar – which is very
low as compared to all India figures of about 28 per cent, in 2001 (Census of India,
2001) (Table 4.7). It is a clear indication of the low level of urbanization in Bihar.
Table 4.7: Various features of population of Bihar and all India
Bihar India
Population
Total (in '000) 82999 1028610
Male (in '000) 43244 (52.10%) 532157 (51.74%)
Female (in '000) 39755 (47.90%) 496454 (48.26%)
Rural-Urban
population distribution
Rural (in '000) 74317 (89.54%) 742491 (72.18%)
Urban (in '000) 8682 (10.46%) 286120 (27.82%)
Population
Density
Total 881 325
Urban 4809 3660
Rural 803 238
Sex Ratio 921 933
Data Source: Census of India, 2001.
Since 1971 Census, sex ratio has always remained unfavourable to females
and the general trend, over the decades, is that of decreasing sex ratio during this
time period. There has been an increase of 14 points in the sex ratio of Bihar at
2001 Census (Table 4.7) from that of 1991 Census (907). However, the sex ratio of
Bihar (921) was less than that of all India (933) in the year 2001. Bihar is second
densely populated states among the 28 states of India and comes only after the
state of West Bengal (population density of West Bengal is 904). Bihar has a
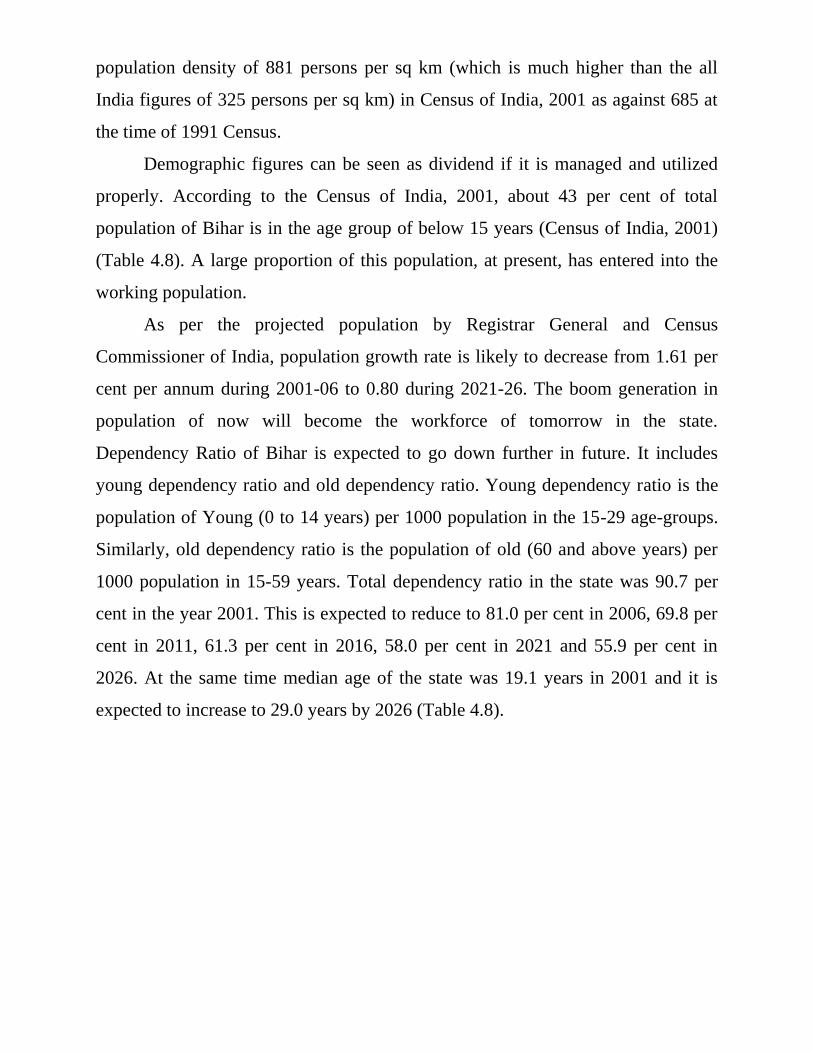
population density of 881 persons per sq km (which is much higher than the all
India figures of 325 persons per sq km) in Census of India, 2001 as against 685 at
the time of 1991 Census.
Demographic figures can be seen as dividend if it is managed and utilized
properly. According to the Census of India, 2001, about 43 per cent of total
population of Bihar is in the age group of below 15 years (Census of India, 2001)
(Table 4.8). A large proportion of this population, at present, has entered into the
working population.
As per the projected population by Registrar General and Census
Commissioner of India, population growth rate is likely to decrease from 1.61 per
cent per annum during 2001-06 to 0.80 during 2021-26. The boom generation in
population of now will become the workforce of tomorrow in the state.
Dependency Ratio of Bihar is expected to go down further in future. It includes
young dependency ratio and old dependency ratio. Young dependency ratio is the
population of Young (0 to 14 years) per 1000 population in the 15-29 age-groups.
Similarly, old dependency ratio is the population of old (60 and above years) per
1000 population in 15-59 years. Total dependency ratio in the state was 90.7 per
cent in the year 2001. This is expected to reduce to 81.0 per cent in 2006, 69.8 per
cent in 2011, 61.3 per cent in 2016, 58.0 per cent in 2021 and 55.9 per cent in
2026. At the same time median age of the state was 19.1 years in 2001 and it is
expected to increase to 29.0 years by 2026 (Table 4.8).
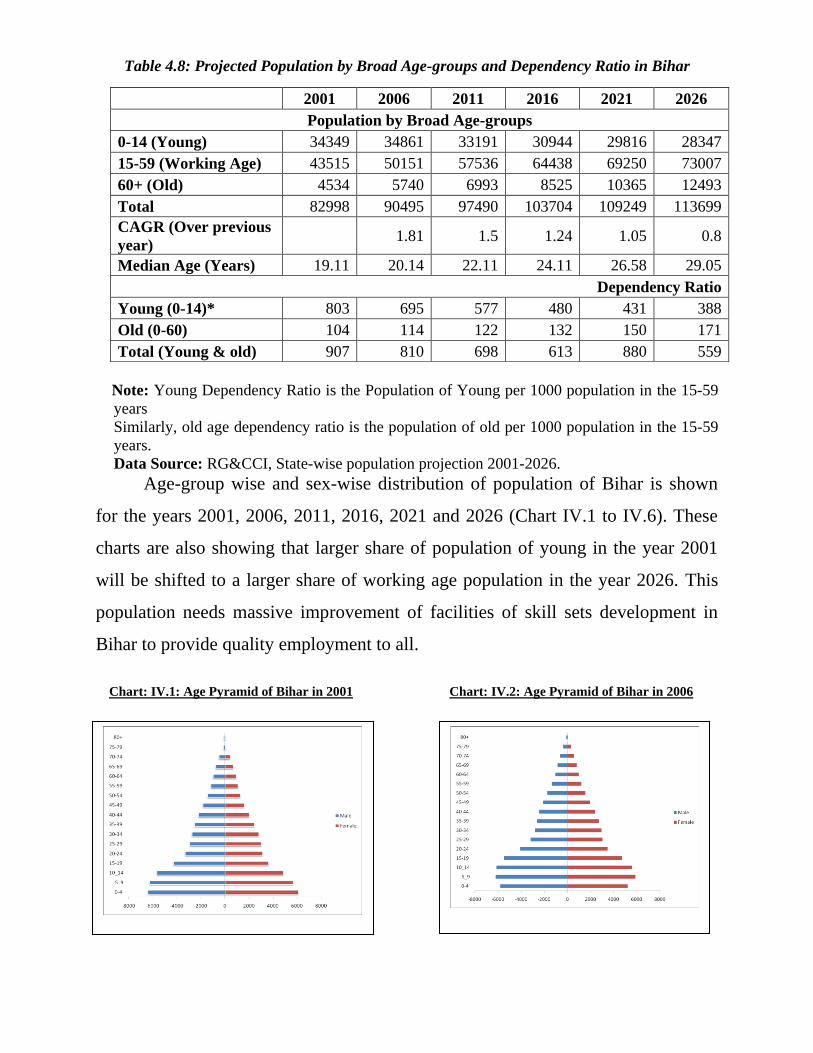
Table 4.8: Projected Population by Broad Age-groups and Dependency Ratio in Bihar
Note: Young Dependency Ratio is the Population of Young per 1000 population in the 15-59
years
Similarly, old age dependency ratio is the population of old per 1000 population in the 15-59
years.
Data Source: RG&CCI, State-wise population projection 2001-2026.
Age-group wise and sex-wise distribution of population of Bihar is shown
for the years 2001, 2006, 2011, 2016, 2021 and 2026 (Chart IV.1 to IV.6). These
charts are also showing that larger share of population of young in the year 2001
will be shifted to a larger share of working age population in the year 2026. This
population needs massive improvement of facilities of skill sets development in
Bihar to provide quality employment to all.
Chart: IV.1: Age Pyramid of Bihar in 2001 Chart: IV.2: Age Pyramid of Bihar in 2006
..
2001 2006 2011 2016 2021 2026
Population by Broad Age-groups
0-14 (Young) 34349 34861 33191 30944 29816 28347
15-59 (Working Age) 43515 50151 57536 64438 69250 73007
60+ (Old) 4534 5740 6993 8525 10365 12493
Total 82998 90495 97490 103704 109249 113699
CAGR (Over previous
year) 1.81 1.5 1.24 1.05 0.8
Median Age (Years) 19.11 20.14 22.11 24.11 26.58 29.05
Dependency Ratio
Young (0-14)* 803 695 577 480 431 388
Old (0-60) 104 114 122 132 150 171
Total (Young & old) 907 810 698 613 880 559
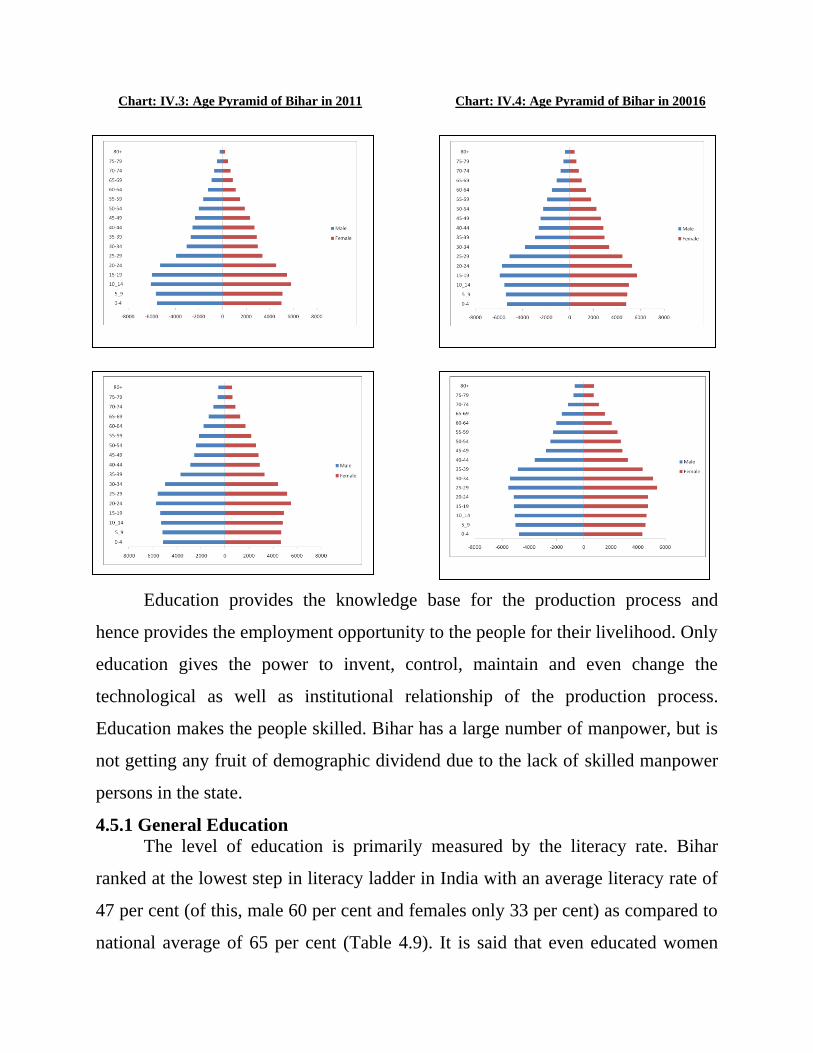
Chart: IV.3: Age Pyramid of Bihar in 2011 Chart: IV.4: Age Pyramid of Bihar in 20016
Chart: IV.5: Age Pyramid of Bihar in 2021 Chart: IV.6: Age Pyramid of Bihar in 2026
4.5 Education
Education provides the knowledge base for the production process and
hence provides the employment opportunity to the people for their livelihood. Only
education gives the power to invent, control, maintain and even change the
technological as well as institutional relationship of the production process.
Education makes the people skilled. Bihar has a large number of manpower, but is
not getting any fruit of demographic dividend due to the lack of skilled manpower
persons in the state.
4.5.1 General Education
The level of education is primarily measured by the literacy rate. Bihar
ranked at the lowest step in literacy ladder in India with an average literacy rate of
47 per cent (of this, male 60 per cent and females only 33 per cent) as compared to
national average of 65 per cent (Table 4.9). It is said that even educated women
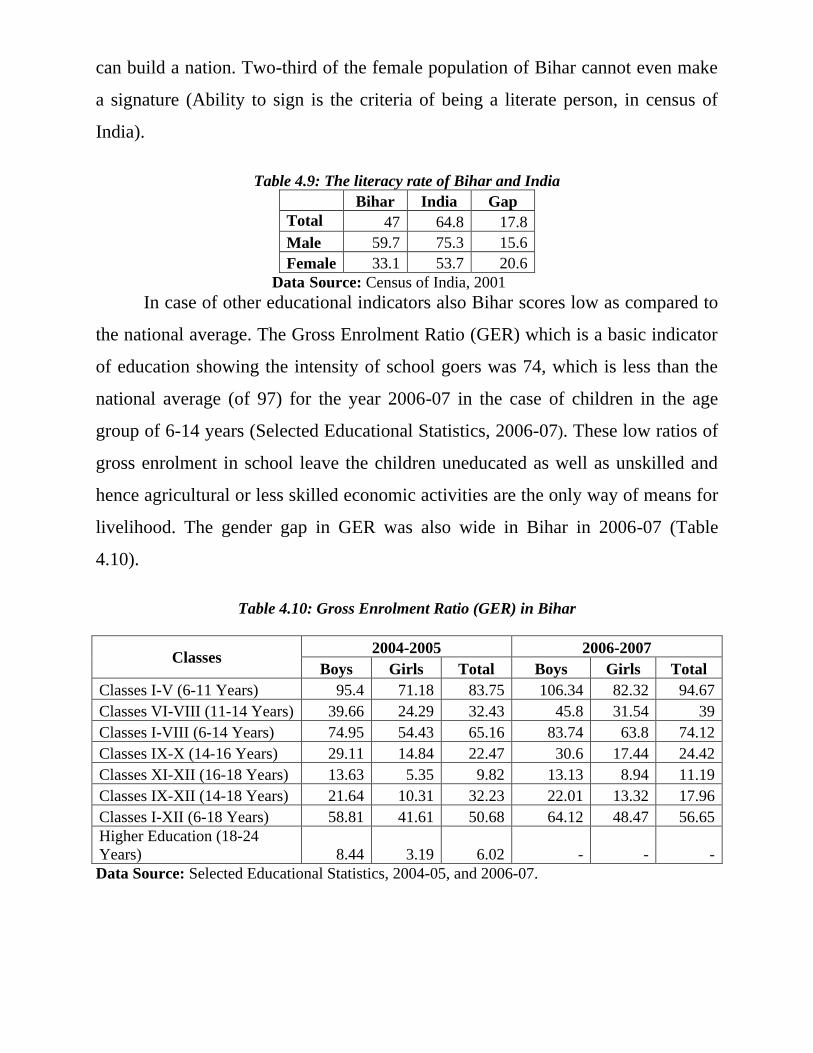
can build a nation. Two-third of the female population of Bihar cannot even make
a signature (Ability to sign is the criteria of being a literate person, in census of
India).
Table 4.9: The literacy rate of Bihar and India
Bihar India Gap
Total 47 64.8 17.8
Male 59.7 75.3 15.6
Female 33.1 53.7 20.6
Data Source: Census of India, 2001
In case of other educational indicators also Bihar scores low as compared to
the national average. The Gross Enrolment Ratio (GER) which is a basic indicator
of education showing the intensity of school goers was 74, which is less than the
national average (of 97) for the year 2006-07 in the case of children in the age
group of 6-14 years (Selected Educational Statistics, 2006-07). These low ratios of
gross enrolment in school leave the children uneducated as well as unskilled and
hence agricultural or less skilled economic activities are the only way of means for
livelihood. The gender gap in GER was also wide in Bihar in 2006-07 (Table
4.10).
Table 4.10: Gross Enrolment Ratio (GER) in Bihar
Classes 2004-2005 2006-2007
Boys Girls Total Boys Girls Total
Classes I-V (6-11 Years) 95.4 71.18 83.75 106.34 82.32 94.67
Classes VI-VIII (11-14 Years) 39.66 24.29 32.43 45.8 31.54 39
Classes I-VIII (6-14 Years) 74.95 54.43 65.16 83.74 63.8 74.12
Classes IX-X (14-16 Years) 29.11 14.84 22.47 30.6 17.44 24.42
Classes XI-XII (16-18 Years) 13.63 5.35 9.82 13.13 8.94 11.19
Classes IX-XII (14-18 Years) 21.64 10.31 32.23 22.01 13.32 17.96
Classes I-XII (6-18 Years) 58.81 41.61 50.68 64.12 48.47 56.65
Higher Education (18-24
Years) 8.44 3.19 6.02 - - -
Data Source: Selected Educational Statistics, 2004-05, and 2006-07.
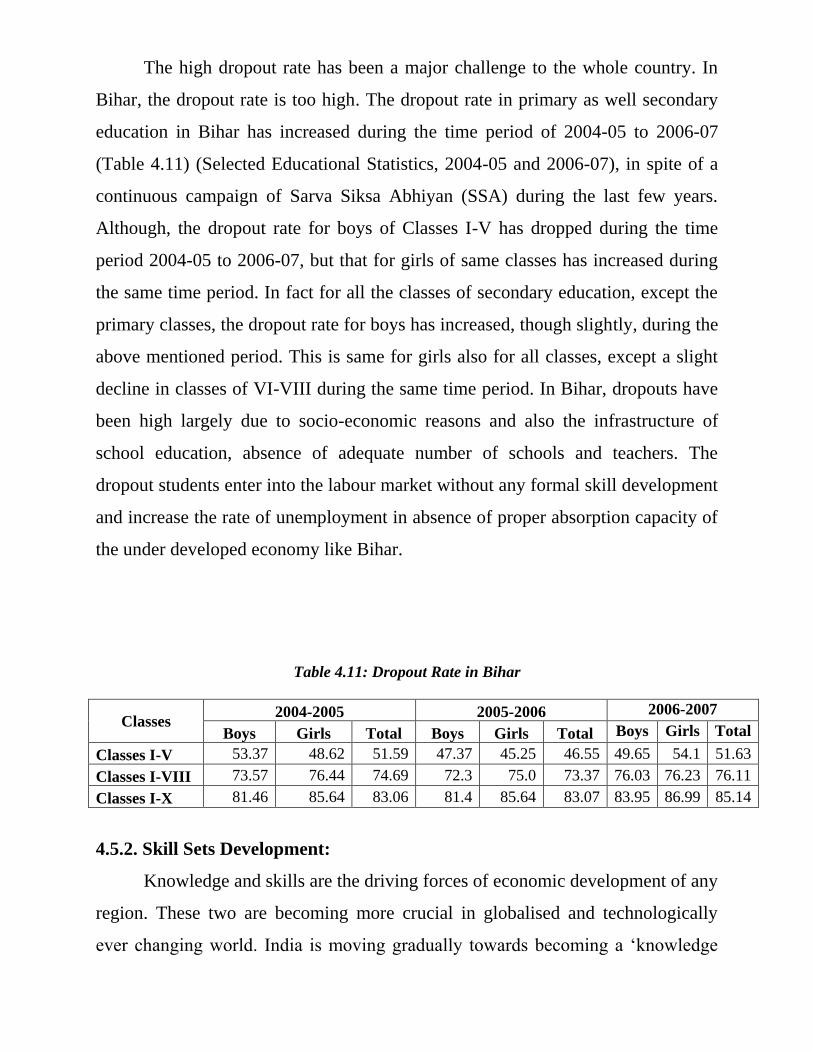
The high dropout rate has been a major challenge to the whole country. In
Bihar, the dropout rate is too high. The dropout rate in primary as well secondary
education in Bihar has increased during the time period of 2004-05 to 2006-07
(Table 4.11) (Selected Educational Statistics, 2004-05 and 2006-07), in spite of a
continuous campaign of Sarva Siksa Abhiyan (SSA) during the last few years.
Although, the dropout rate for boys of Classes I-V has dropped during the time
period 2004-05 to 2006-07, but that for girls of same classes has increased during
the same time period. In fact for all the classes of secondary education, except the
primary classes, the dropout rate for boys has increased, though slightly, during the
above mentioned period. This is same for girls also for all classes, except a slight
decline in classes of VI-VIII during the same time period. In Bihar, dropouts have
been high largely due to socio-economic reasons and also the infrastructure of
school education, absence of adequate number of schools and teachers. The
dropout students enter into the labour market without any formal skill development
and increase the rate of unemployment in absence of proper absorption capacity of
the under developed economy like Bihar.
Table 4.11: Dropout Rate in Bihar
Classes 2004-2005 2005-2006 2006-2007
Boys Girls Total Boys Girls Total Boys Girls Total
Classes I-V 53.37 48.62 51.59 47.37 45.25 46.55 49.65 54.1 51.63
Classes I-VIII 73.57 76.44 74.69 72.3 75.0 73.37 76.03 76.23 76.11
Classes I-X 81.46 85.64 83.06 81.4 85.64 83.07 83.95 86.99 85.14
4.5.2. Skill Sets Development:
Knowledge and skills are the driving forces of economic development of any
region. These two are becoming more crucial in globalised and technologically
ever changing world. India is moving gradually towards becoming a ‗knowledge
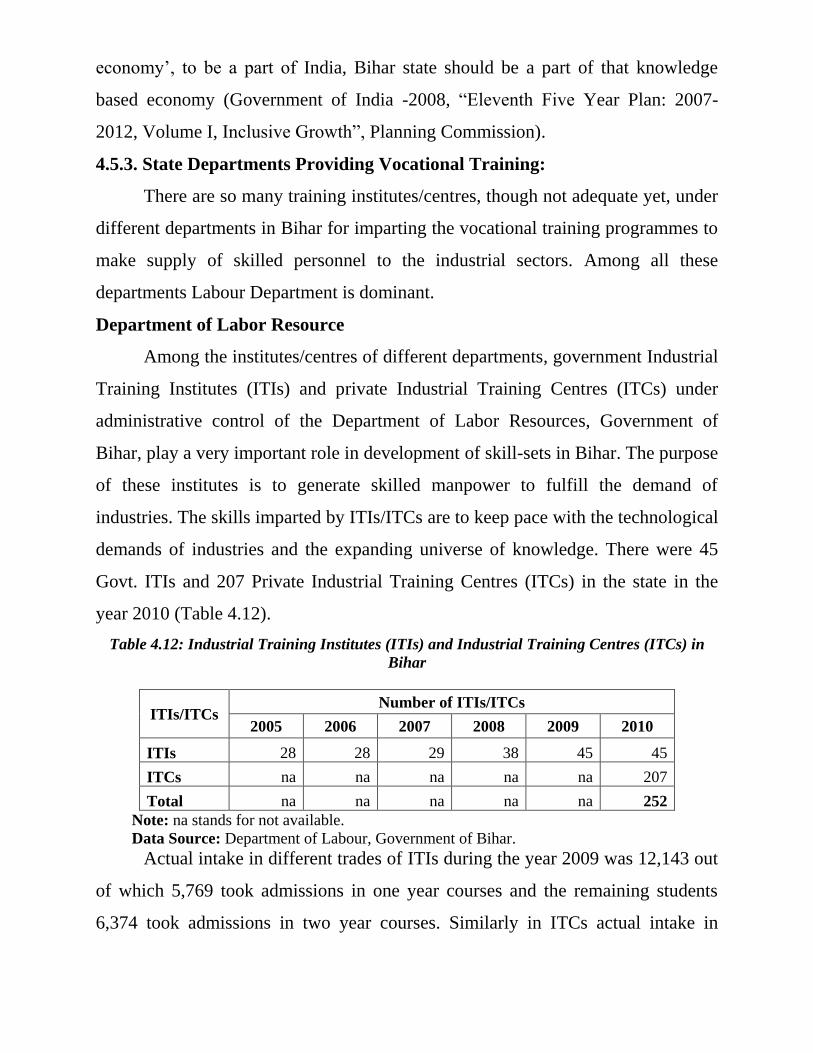
economy‘, to be a part of India, Bihar state should be a part of that knowledge
based economy (Government of India -2008, ―Eleventh Five Year Plan: 2007-
2012, Volume I, Inclusive Growth‖, Planning Commission).
4.5.3. State Departments Providing Vocational Training:
There are so many training institutes/centres, though not adequate yet, under
different departments in Bihar for imparting the vocational training programmes to
make supply of skilled personnel to the industrial sectors. Among all these
departments Labour Department is dominant.
Department of Labor Resource
Among the institutes/centres of different departments, government Industrial
Training Institutes (ITIs) and private Industrial Training Centres (ITCs) under
administrative control of the Department of Labor Resources, Government of
Bihar, play a very important role in development of skill-sets in Bihar. The purpose
of these institutes is to generate skilled manpower to fulfill the demand of
industries. The skills imparted by ITIs/ITCs are to keep pace with the technological
demands of industries and the expanding universe of knowledge. There were 45
Govt. ITIs and 207 Private Industrial Training Centres (ITCs) in the state in the
year 2010 (Table 4.12).
Table 4.12: Industrial Training Institutes (ITIs) and Industrial Training Centres (ITCs) in
Bihar
ITIs/ITCs Number of ITIs/ITCs
2005 2006 2007 2008 2009 2010
ITIs 28 28 29 38 45 45
ITCs na na na na na 207
Total na na na na na 252
Note: na stands for not available.
Data Source: Department of Labour, Government of Bihar.
Actual intake in different trades of ITIs during the year 2009 was 12,143 out
of which 5,769 took admissions in one year courses and the remaining students
6,374 took admissions in two year courses. Similarly in ITCs actual intake in
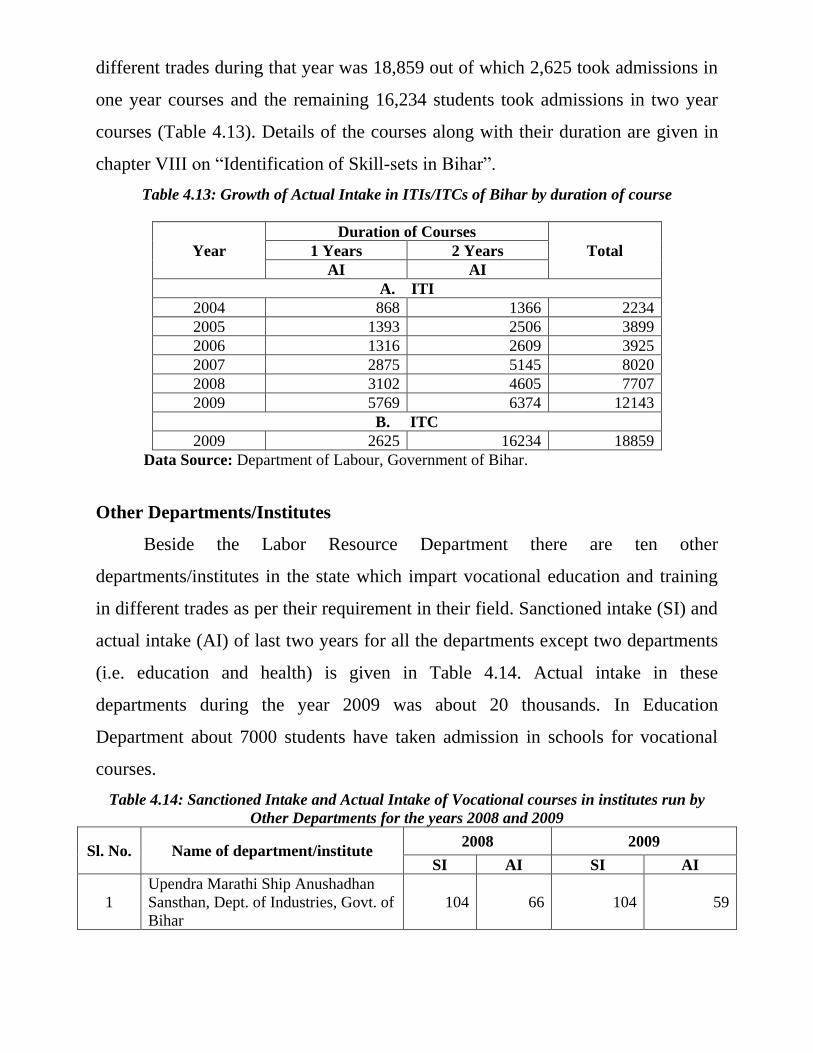
different trades during that year was 18,859 out of which 2,625 took admissions in
one year courses and the remaining 16,234 students took admissions in two year
courses (Table 4.13). Details of the courses along with their duration are given in
chapter VIII on ―Identification of Skill-sets in Bihar‖.
Table 4.13: Growth of Actual Intake in ITIs/ITCs of Bihar by duration of course
Year
Duration of Courses
Total 1 Years 2 Years
AI AI
A. ITI
2004 868 1366 2234
2005 1393 2506 3899
2006 1316 2609 3925
2007 2875 5145 8020
2008 3102 4605 7707
2009 5769 6374 12143
B. ITC
2009 2625 16234 18859
Data Source: Department of Labour, Government of Bihar.
Other Departments/Institutes
Beside the Labor Resource Department there are ten other
departments/institutes in the state which impart vocational education and training
in different trades as per their requirement in their field. Sanctioned intake (SI) and
actual intake (AI) of last two years for all the departments except two departments
(i.e. education and health) is given in Table 4.14. Actual intake in these
departments during the year 2009 was about 20 thousands. In Education
Department about 7000 students have taken admission in schools for vocational
courses.
Table 4.14: Sanctioned Intake and Actual Intake of Vocational courses in institutes run by
Other Departments for the years 2008 and 2009
Sl. No. Name of department/institute 2008 2009
SI AI SI AI
1
Upendra Marathi Ship Anushadhan
Sansthan, Dept. of Industries, Govt. of
Bihar
104 66 104 59
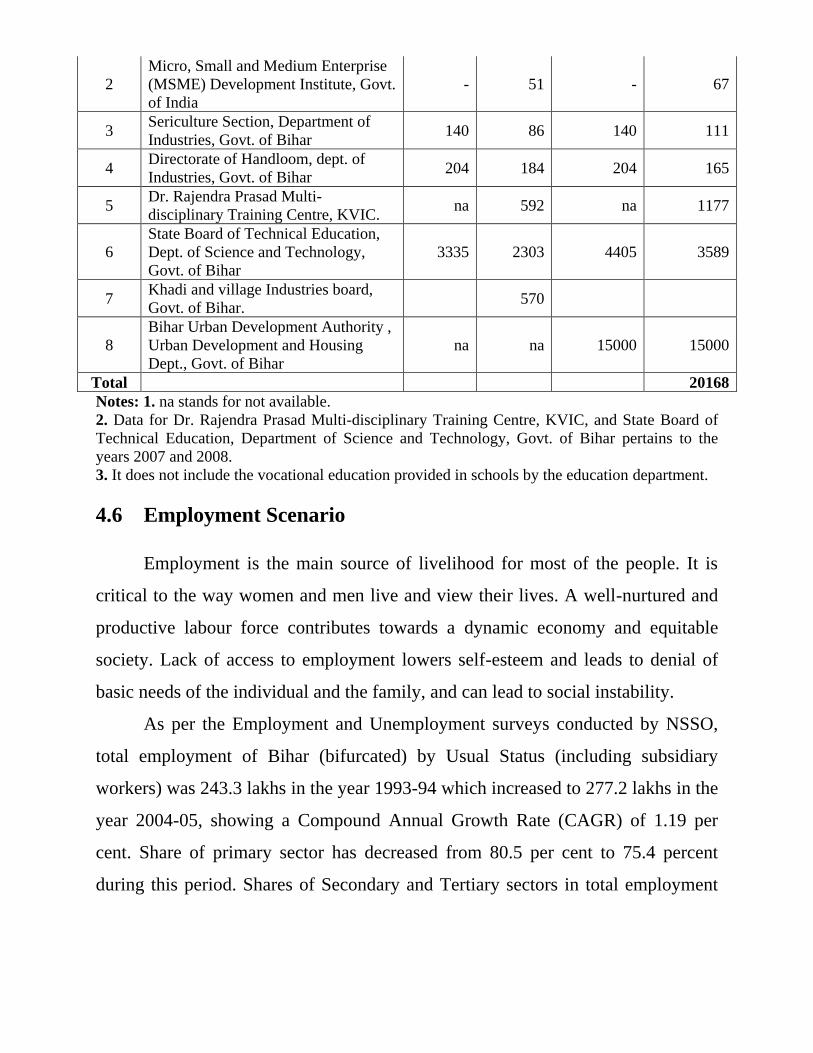
2
Micro, Small and Medium Enterprise
(MSME) Development Institute, Govt.
of India
- 51 - 67
3 Sericulture Section, Department of
Industries, Govt. of Bihar 140 86 140 111
4 Directorate of Handloom, dept. of
Industries, Govt. of Bihar 204 184 204 165
5 Dr. Rajendra Prasad Multi-
disciplinary Training Centre, KVIC. na 592 na 1177
6
State Board of Technical Education,
Dept. of Science and Technology,
Govt. of Bihar
3335 2303 4405 3589
7 Khadi and village Industries board,
Govt. of Bihar. 570
8
Bihar Urban Development Authority ,
Urban Development and Housing
Dept., Govt. of Bihar
na na 15000 15000
Total 20168
Notes: 1. na stands for not available.
2. Data for Dr. Rajendra Prasad Multi-disciplinary Training Centre, KVIC, and State Board of
Technical Education, Department of Science and Technology, Govt. of Bihar pertains to the
years 2007 and 2008.
3. It does not include the vocational education provided in schools by the education department.
4.6 Employment Scenario
Employment is the main source of livelihood for most of the people. It is
critical to the way women and men live and view their lives. A well-nurtured and
productive labour force contributes towards a dynamic economy and equitable
society. Lack of access to employment lowers self-esteem and leads to denial of
basic needs of the individual and the family, and can lead to social instability.
As per the Employment and Unemployment surveys conducted by NSSO,
total employment of Bihar (bifurcated) by Usual Status (including subsidiary
workers) was 243.3 lakhs in the year 1993-94 which increased to 277.2 lakhs in the
year 2004-05, showing a Compound Annual Growth Rate (CAGR) of 1.19 per
cent. Share of primary sector has decreased from 80.5 per cent to 75.4 percent
during this period. Shares of Secondary and Tertiary sectors in total employment
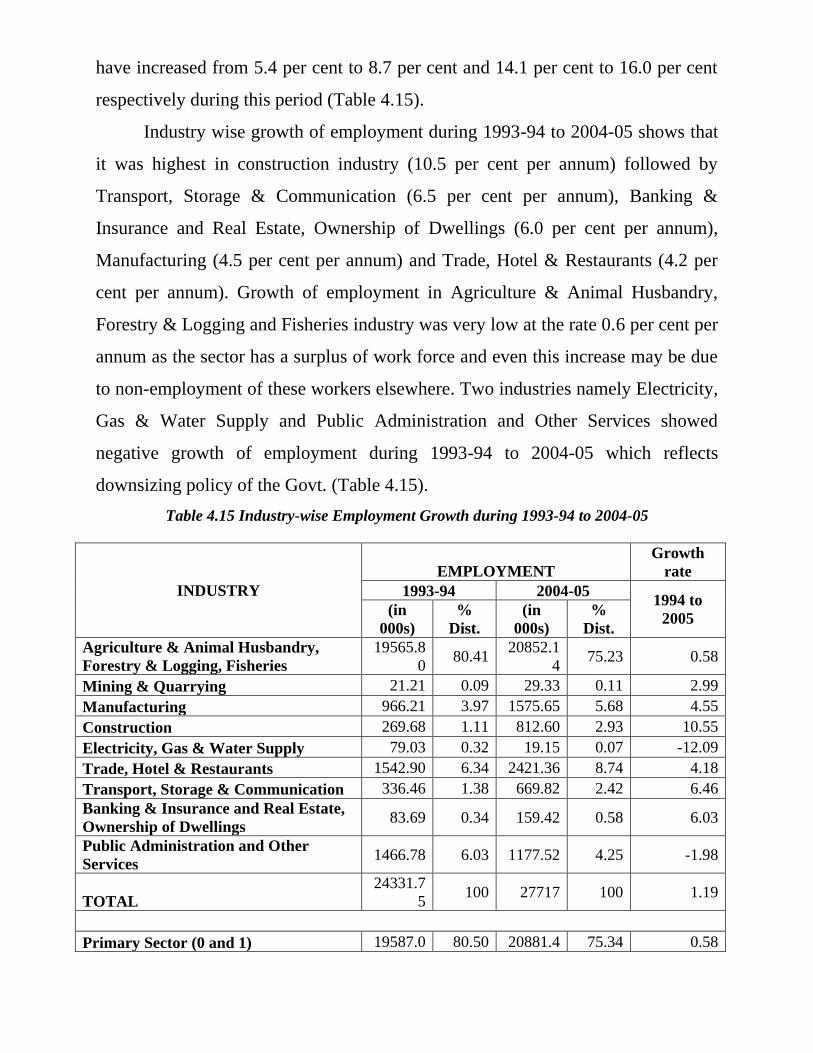
have increased from 5.4 per cent to 8.7 per cent and 14.1 per cent to 16.0 per cent
respectively during this period (Table 4.15).
Industry wise growth of employment during 1993-94 to 2004-05 shows that
it was highest in construction industry (10.5 per cent per annum) followed by
Transport, Storage & Communication (6.5 per cent per annum), Banking &
Insurance and Real Estate, Ownership of Dwellings (6.0 per cent per annum),
Manufacturing (4.5 per cent per annum) and Trade, Hotel & Restaurants (4.2 per
cent per annum). Growth of employment in Agriculture & Animal Husbandry,
Forestry & Logging and Fisheries industry was very low at the rate 0.6 per cent per
annum as the sector has a surplus of work force and even this increase may be due
to non-employment of these workers elsewhere. Two industries namely Electricity,
Gas & Water Supply and Public Administration and Other Services showed
negative growth of employment during 1993-94 to 2004-05 which reflects
downsizing policy of the Govt. (Table 4.15).
Table 4.15 Industry-wise Employment Growth during 1993-94 to 2004-05
INDUSTRY
EMPLOYMENT
Growth
rate
1993-94 2004-05 1994 to
2005 (in
000s)
%
Dist.
(in
000s)
%
Dist.
Agriculture & Animal Husbandry,
Forestry & Logging, Fisheries
19565.8
0 80.41
20852.1
4 75.23 0.58
Mining & Quarrying 21.21 0.09 29.33 0.11 2.99
Manufacturing 966.21 3.97 1575.65 5.68 4.55
Construction 269.68 1.11 812.60 2.93 10.55
Electricity, Gas & Water Supply 79.03 0.32 19.15 0.07 -12.09
Trade, Hotel & Restaurants 1542.90 6.34 2421.36 8.74 4.18
Transport, Storage & Communication 336.46 1.38 669.82 2.42 6.46
Banking & Insurance and Real Estate,
Ownership of Dwellings 83.69 0.34 159.42 0.58 6.03
Public Administration and Other
Services 1466.78 6.03 1177.52 4.25 -1.98
TOTAL
24331.7
5 100 27717 100 1.19
Primary Sector (0 and 1) 19587.0 80.50 20881.4 75.34 0.58
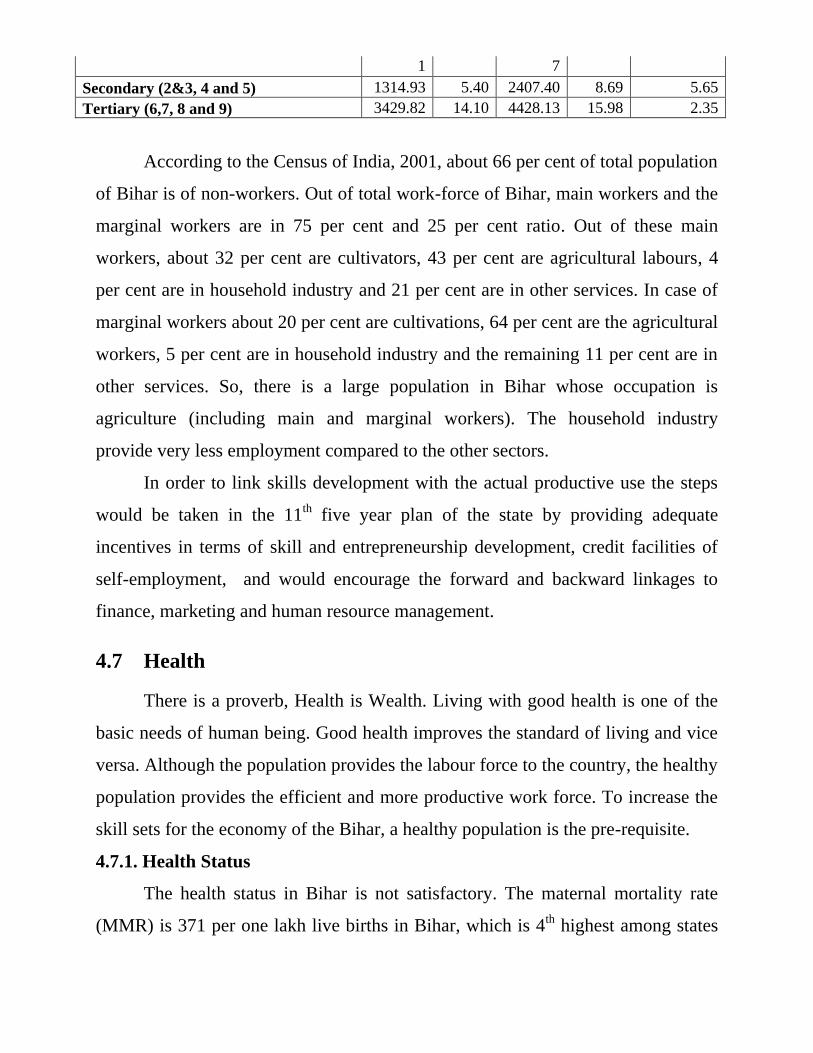
1 7
Secondary (2&3, 4 and 5) 1314.93 5.40 2407.40 8.69 5.65
Tertiary (6,7, 8 and 9) 3429.82 14.10 4428.13 15.98 2.35
According to the Census of India, 2001, about 66 per cent of total population
of Bihar is of non-workers. Out of total work-force of Bihar, main workers and the
marginal workers are in 75 per cent and 25 per cent ratio. Out of these main
workers, about 32 per cent are cultivators, 43 per cent are agricultural labours, 4
per cent are in household industry and 21 per cent are in other services. In case of
marginal workers about 20 per cent are cultivations, 64 per cent are the agricultural
workers, 5 per cent are in household industry and the remaining 11 per cent are in
other services. So, there is a large population in Bihar whose occupation is
agriculture (including main and marginal workers). The household industry
provide very less employment compared to the other sectors.
In order to link skills development with the actual productive use the steps
would be taken in the 11th
five year plan of the state by providing adequate
incentives in terms of skill and entrepreneurship development, credit facilities of
self-employment, and would encourage the forward and backward linkages to
finance, marketing and human resource management.
4.7 Health
There is a proverb, Health is Wealth. Living with good health is one of the
basic needs of human being. Good health improves the standard of living and vice
versa. Although the population provides the labour force to the country, the healthy
population provides the efficient and more productive work force. To increase the
skill sets for the economy of the Bihar, a healthy population is the pre-requisite.
4.7.1. Health Status
The health status in Bihar is not satisfactory. The maternal mortality rate
(MMR) is 371 per one lakh live births in Bihar, which is 4th
highest among states
in India. Full immunization has very low coverage in Bihar, with only 33 per cent
(National Family and Health Survey (NFHS)-III, 2005-06). Institutional deliveries
are undertaken only for 23 per cent of total deliveries, which is almost half of
national average of 41 per cent. More than 50 per cent of the girls are getting
married below the age of 18 years whereas national average is 28 per cent. Infant
mortality rate (IMR) in Bihar is higher at 58 per 1000 live births compared to
national average of 55 in 2007 (Table 4.16). The life expectancy at birth during the
year 2001-2005 in Bihar was 61.4 years which is much closer to the national
average of 63.2 years. Bihar is the only state where the life expectancy for female
is less than that of male. Although the death rate of Bihar is more or less similar to
that of all India average, but it is exhibiting higher birth rate than that of national
average (Govt. Of Bihar, ―Bihar at a Glance, 2007 and 2008, Directorate of
Statistics and Evaluation‖, Patna) (Table 4.16). The poor performance of health
indicators for Bihar is indirectly reflecting the overall backwardness of Bihar.
Table 4.16: Birth rate, Death rate and Infant Mortality Rate (IMR) in Bihar and India in
2007
Birth Rate Death Rate Infant Mortality Rate
Bihar India Bihar India Bihar India
Combined 29.4 23.1 7.5 7.4 58 55
Rural 30.2 24.7 7.6 4.0 59 61
Urban 22.9 18.6 6.2 6.0 44 37
Data Source: Directorate of Statistics and Evaluation, Bihar, Patna.
4.7.2. Health Service Delivery
The national criterion of one health sub-centre is for 5000 people but Bihar
has one sub-centre for 10,000 people. Moreover, Bihar has one Primary Health
Centre (PHC) for one lakh population whereas there should be one for every
30,000 population (Government of Bihar, Planning and Development Department,
―Bihar Approach to 11th
Five Year Plan: Vision for Accelerated Inclusive Growth,
Patna, 2006). There is a shortage of 7718 health sub-centres (required 16576 health
sub-centre), 135 block-level PHCs (total required 533). The percentage of PHCs
adequately equipped with equipments stands at only 6 per cent which is much
lower than the national average of 41 per cent. Out of 38 districts hospitals only 24
hospitals are currently functioning. Keeping this reality in mind, the State has to
work hard to build up the health infrastructure to meet the national norms.
According to an estimate of 11th
Plan, there is a shortage of more than 5500
female health workers and almost 9700 male health workers in Bihar. Moreover,
there is a shortfall of about 20 thousands Auxiliary Nurse Midwife (ANM). The
national norm is one ANM per 2500 population. As technically skilled people are
in short supply in Bihar, an effort of skill sets development has to be made in
health sector. The state has to boost up its capacity further to provide health
services at the grass-root level by appointing approximately 75 thousands
Accredited Social Health Activists (ASHA) under National Rural Health Mission
(NRHM) (Government of Bihar, Planning and Development Department, ―Bihar
Approach to 11th
Five Year Plan: Vision for Accelerated Inclusive Growth, Patna,
2006). Comprehensive Training Policy has to be drawn to administer all the
capacity building initiatives in Health sector. An attempt has to be made during the
11th
five year plan and thereafter to train more personnel to increase the skill sets
for health sector and to operate more vocational institutes, (for Nurses and other
Paramedicals including Laboratory Technicians) using Public Private-Partnership
(PPP) mechanism.
4.8 Economy of Bihar
Bihar remains one of the least developed states of India, with a per capita
annual income of Rs. 7,928 in 2007-08 which is less than one third of India‘s
average of Rs. 24,256 at constant price of 1999-2000. This divide has become
wider during 1993-94 to 2007-08, the so called period of liberalization. While the
state‘s per capita income was around 40 per cent of national figure in 1993-94, it
got reduced to only 32.68 per cent in 2007-08. Bihar ranks at the bottom of the 18
major States in India in terms of socio-economic development.
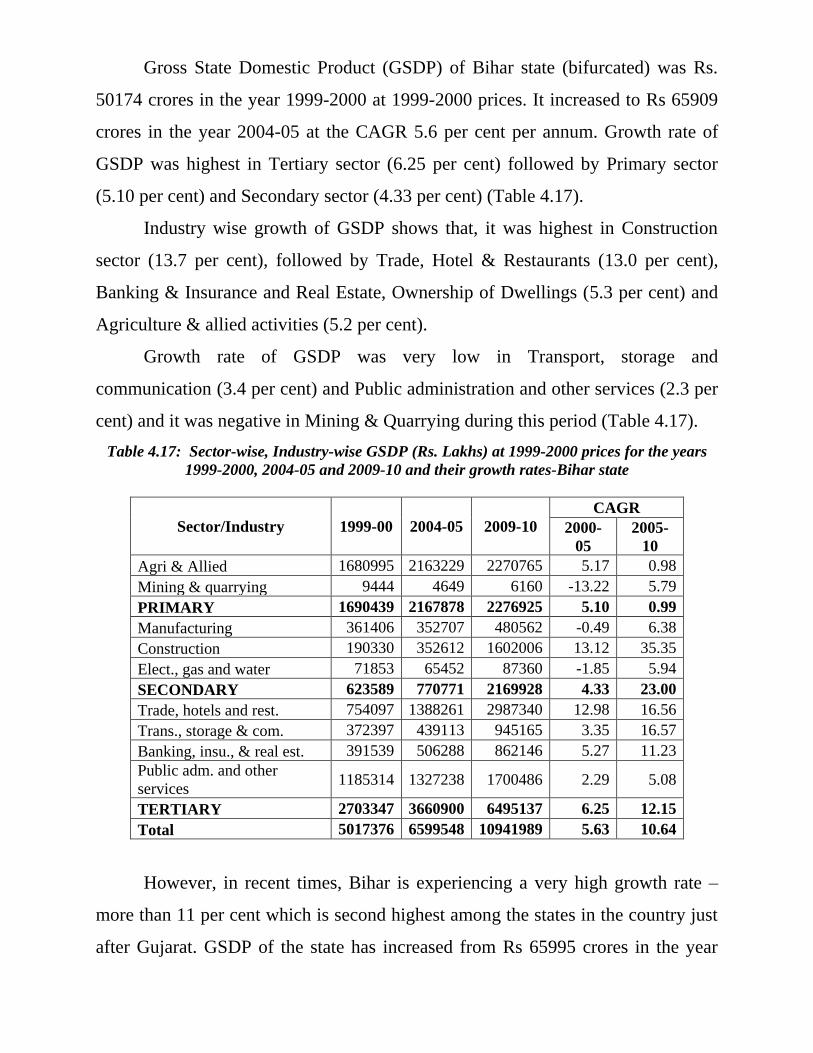
Gross State Domestic Product (GSDP) of Bihar state (bifurcated) was Rs.
50174 crores in the year 1999-2000 at 1999-2000 prices. It increased to Rs 65909
crores in the year 2004-05 at the CAGR 5.6 per cent per annum. Growth rate of
GSDP was highest in Tertiary sector (6.25 per cent) followed by Primary sector
(5.10 per cent) and Secondary sector (4.33 per cent) (Table 4.17).
Industry wise growth of GSDP shows that, it was highest in Construction
sector (13.7 per cent), followed by Trade, Hotel & Restaurants (13.0 per cent),
Banking & Insurance and Real Estate, Ownership of Dwellings (5.3 per cent) and
Agriculture & allied activities (5.2 per cent).
Growth rate of GSDP was very low in Transport, storage and
communication (3.4 per cent) and Public administration and other services (2.3 per
cent) and it was negative in Mining & Quarrying during this period (Table 4.17).
Table 4.17: Sector-wise, Industry-wise GSDP (Rs. Lakhs) at 1999-2000 prices for the years
1999-2000, 2004-05 and 2009-10 and their growth rates-Bihar state
Sector/Industry 1999-00 2004-05 2009-10
CAGR
2000-
05
2005-
10
Agri & Allied 1680995 2163229 2270765 5.17 0.98
Mining & quarrying 9444 4649 6160 -13.22 5.79
PRIMARY 1690439 2167878 2276925 5.10 0.99
Manufacturing 361406 352707 480562 -0.49 6.38
Construction 190330 352612 1602006 13.12 35.35
Elect., gas and water 71853 65452 87360 -1.85 5.94
SECONDARY 623589 770771 2169928 4.33 23.00
Trade, hotels and rest. 754097 1388261 2987340 12.98 16.56
Trans., storage & com. 372397 439113 945165 3.35 16.57
Banking, insu., & real est. 391539 506288 862146 5.27 11.23
Public adm. and other
services 1185314 1327238 1700486 2.29 5.08
TERTIARY 2703347 3660900 6495137 6.25 12.15
Total 5017376 6599548 10941989 5.63 10.64
However, in recent times, Bihar is experiencing a very high growth rate –
more than 11 per cent which is second highest among the states in the country just
after Gujarat. GSDP of the state has increased from Rs 65995 crores in the year
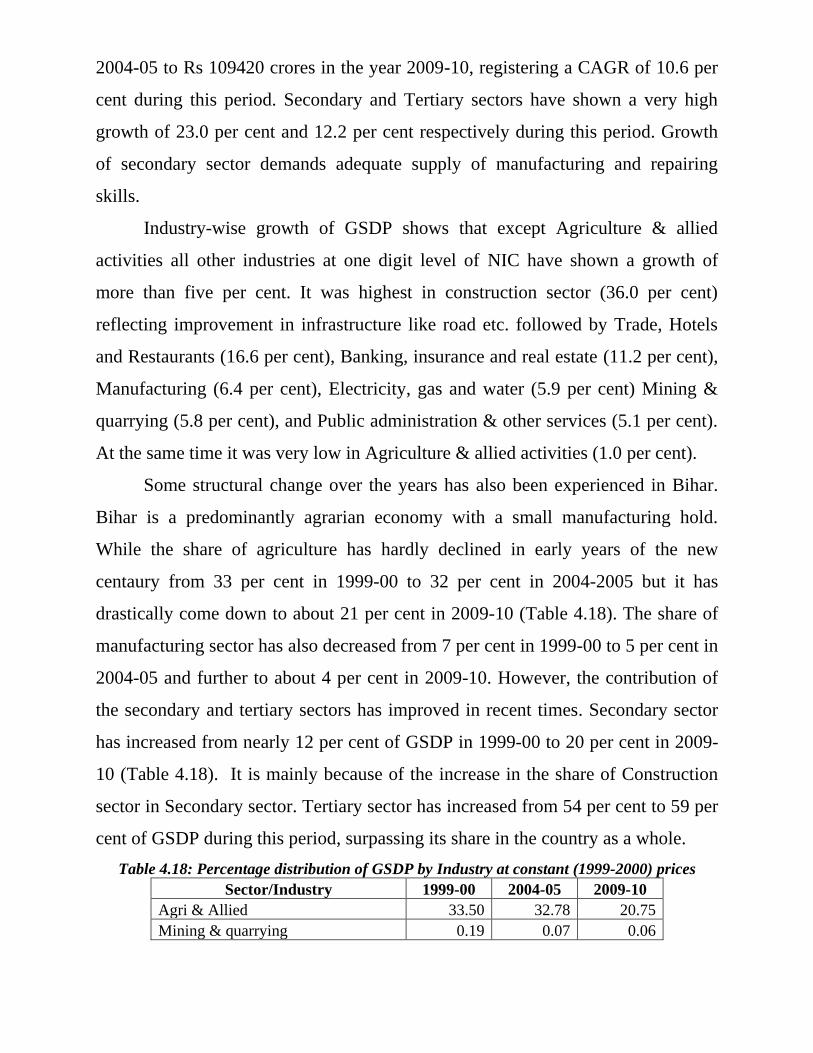
2004-05 to Rs 109420 crores in the year 2009-10, registering a CAGR of 10.6 per
cent during this period. Secondary and Tertiary sectors have shown a very high
growth of 23.0 per cent and 12.2 per cent respectively during this period. Growth
of secondary sector demands adequate supply of manufacturing and repairing
skills.
Industry-wise growth of GSDP shows that except Agriculture & allied
activities all other industries at one digit level of NIC have shown a growth of
more than five per cent. It was highest in construction sector (36.0 per cent)
reflecting improvement in infrastructure like road etc. followed by Trade, Hotels
and Restaurants (16.6 per cent), Banking, insurance and real estate (11.2 per cent),
Manufacturing (6.4 per cent), Electricity, gas and water (5.9 per cent) Mining &
quarrying (5.8 per cent), and Public administration & other services (5.1 per cent).
At the same time it was very low in Agriculture & allied activities (1.0 per cent).
Some structural change over the years has also been experienced in Bihar.
Bihar is a predominantly agrarian economy with a small manufacturing hold.
While the share of agriculture has hardly declined in early years of the new
centaury from 33 per cent in 1999-00 to 32 per cent in 2004-2005 but it has
drastically come down to about 21 per cent in 2009-10 (Table 4.18). The share of
manufacturing sector has also decreased from 7 per cent in 1999-00 to 5 per cent in
2004-05 and further to about 4 per cent in 2009-10. However, the contribution of
the secondary and tertiary sectors has improved in recent times. Secondary sector
has increased from nearly 12 per cent of GSDP in 1999-00 to 20 per cent in 2009-
10 (Table 4.18). It is mainly because of the increase in the share of Construction
sector in Secondary sector. Tertiary sector has increased from 54 per cent to 59 per
cent of GSDP during this period, surpassing its share in the country as a whole.
Table 4.18: Percentage distribution of GSDP by Industry at constant (1999-2000) prices
Sector/Industry 1999-00 2004-05 2009-10
Agri & Allied 33.50 32.78 20.75
Mining & quarrying 0.19 0.07 0.06
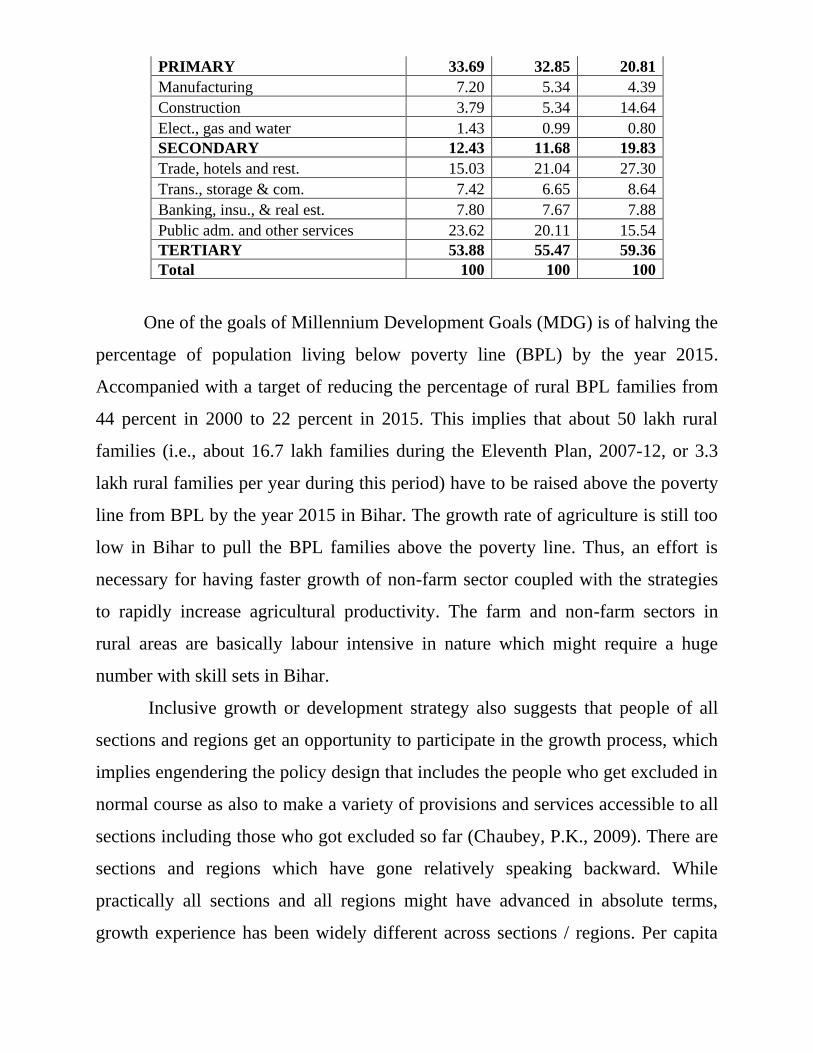
PRIMARY 33.69 32.85 20.81
Manufacturing 7.20 5.34 4.39
Construction 3.79 5.34 14.64
Elect., gas and water 1.43 0.99 0.80
SECONDARY 12.43 11.68 19.83
Trade, hotels and rest. 15.03 21.04 27.30
Trans., storage & com. 7.42 6.65 8.64
Banking, insu., & real est. 7.80 7.67 7.88
Public adm. and other services 23.62 20.11 15.54
TERTIARY 53.88 55.47 59.36
Total 100 100 100
One of the goals of Millennium Development Goals (MDG) is of halving the
percentage of population living below poverty line (BPL) by the year 2015.
Accompanied with a target of reducing the percentage of rural BPL families from
44 percent in 2000 to 22 percent in 2015. This implies that about 50 lakh rural
families (i.e., about 16.7 lakh families during the Eleventh Plan, 2007-12, or 3.3
lakh rural families per year during this period) have to be raised above the poverty
line from BPL by the year 2015 in Bihar. The growth rate of agriculture is still too
low in Bihar to pull the BPL families above the poverty line. Thus, an effort is
necessary for having faster growth of non-farm sector coupled with the strategies
to rapidly increase agricultural productivity. The farm and non-farm sectors in
rural areas are basically labour intensive in nature which might require a huge
number with skill sets in Bihar.
Inclusive growth or development strategy also suggests that people of all
sections and regions get an opportunity to participate in the growth process, which
implies engendering the policy design that includes the people who get excluded in
normal course as also to make a variety of provisions and services accessible to all
sections including those who got excluded so far (Chaubey, P.K., 2009). There are
sections and regions which have gone relatively speaking backward. While
practically all sections and all regions might have advanced in absolute terms,
growth experience has been widely different across sections / regions. Per capita
income of say Bihar, may be double in its own absolute terms, has steadily
declined from 1/3rd
to 1/5th
of that of richer state in the course of last eleven years
between 1993-94 and 2004-05. Likewise the share of poor persons within the states
of Bihar has increased much beyond the increase in their population share. The
rural-urban divide is as well on increase: with more than 50 per cent of GDP and a
little more than 25 per cent population in urban areas enjoying per capita income
2.8 times of their rural counterpart.
Although the state is almost at the lowest step of the economic development,
a process of rapid growth based on Bihar's incredible potential has been set in
action during the last few years in the State of Bihar.
4.9 Industry in Bihar
Industrial development of any under-developed economy is necessary when
its agricultural sector becomes stagnant. The population pressure on agricultural
land is very high in Bihar and in addition to that the productivity in agriculture
sector is very low compared to all India average. The industrial development with
agricultural reform can break the ice of the stagnant economy like Bihar through
the backward and forward linkages.
Importance of inclusive growth in industrial sector of Bihar has been
highlighted by interpreting the data of latest Economic Census conducted in the
year 2005. This census has covered all establishments of all economic activities
except agriculture proper viz. crop production and plantation. If we now compare
the position of Bihar with respect to India in terms of both number of
establishments and number of workers, we find that there were in India in 2004-05
around 4.2 core establishments–all tiny, small, medium, large and super large, with
around 10 crore workers - self employed or wage employed but on a regular basis
(Table 4.19).
Table 4.19: Number of Establishment and Workers in non-farm activities in Bihar and India
in 2005
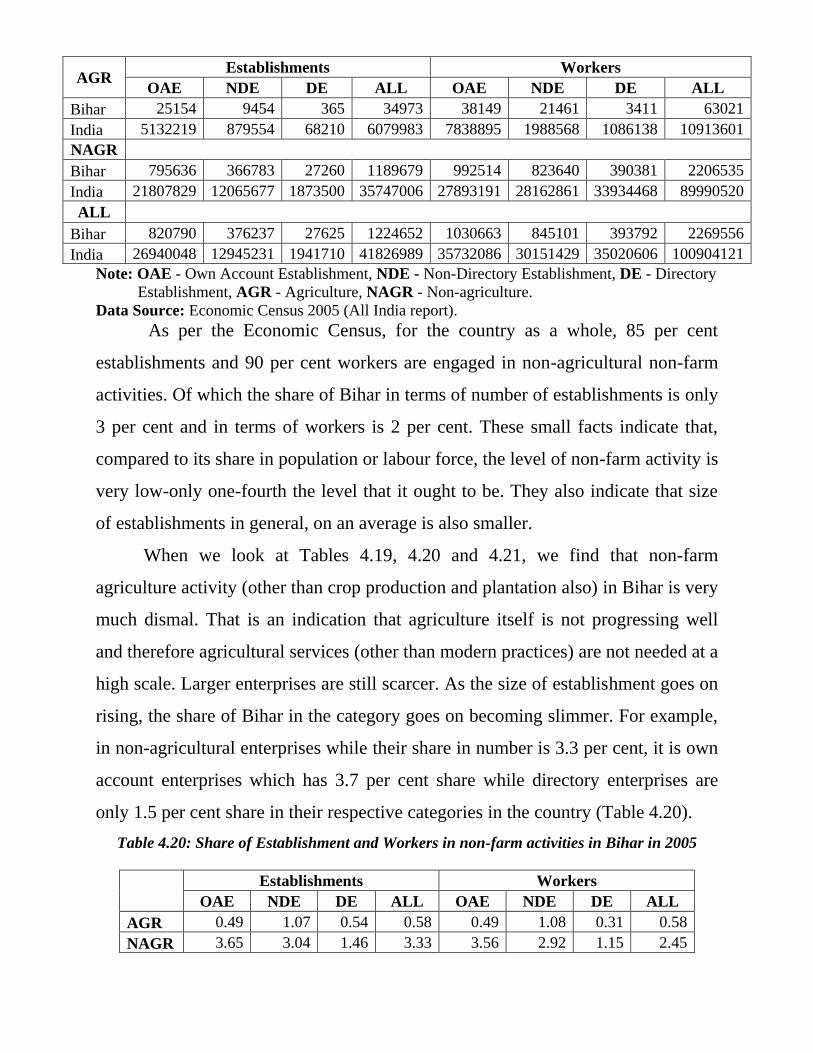
AGR Establishments Workers
OAE NDE DE ALL OAE NDE DE ALL
Bihar 25154 9454 365 34973 38149 21461 3411 63021
India 5132219 879554 68210 6079983 7838895 1988568 1086138 10913601
NAGR
Bihar 795636 366783 27260 1189679 992514 823640 390381 2206535
India 21807829 12065677 1873500 35747006 27893191 28162861 33934468 89990520
ALL
Bihar 820790 376237 27625 1224652 1030663 845101 393792 2269556
India 26940048 12945231 1941710 41826989 35732086 30151429 35020606 100904121
Note: OAE - Own Account Establishment, NDE - Non-Directory Establishment, DE - Directory
Establishment, AGR - Agriculture, NAGR - Non-agriculture.
Data Source: Economic Census 2005 (All India report).
As per the Economic Census, for the country as a whole, 85 per cent
establishments and 90 per cent workers are engaged in non-agricultural non-farm
activities. Of which the share of Bihar in terms of number of establishments is only
3 per cent and in terms of workers is 2 per cent. These small facts indicate that,
compared to its share in population or labour force, the level of non-farm activity is
very low-only one-fourth the level that it ought to be. They also indicate that size
of establishments in general, on an average is also smaller.
When we look at Tables 4.19, 4.20 and 4.21, we find that non-farm
agriculture activity (other than crop production and plantation also) in Bihar is very
much dismal. That is an indication that agriculture itself is not progressing well
and therefore agricultural services (other than modern practices) are not needed at a
high scale. Larger enterprises are still scarcer. As the size of establishment goes on
rising, the share of Bihar in the category goes on becoming slimmer. For example,
in non-agricultural enterprises while their share in number is 3.3 per cent, it is own
account enterprises which has 3.7 per cent share while directory enterprises are
only 1.5 per cent share in their respective categories in the country (Table 4.20).
Table 4.20: Share of Establishment and Workers in non-farm activities in Bihar in 2005
Establishments Workers
OAE NDE DE ALL OAE NDE DE ALL
AGR 0.49 1.07 0.54 0.58 0.49 1.08 0.31 0.58
NAGR 3.65 3.04 1.46 3.33 3.56 2.92 1.15 2.45
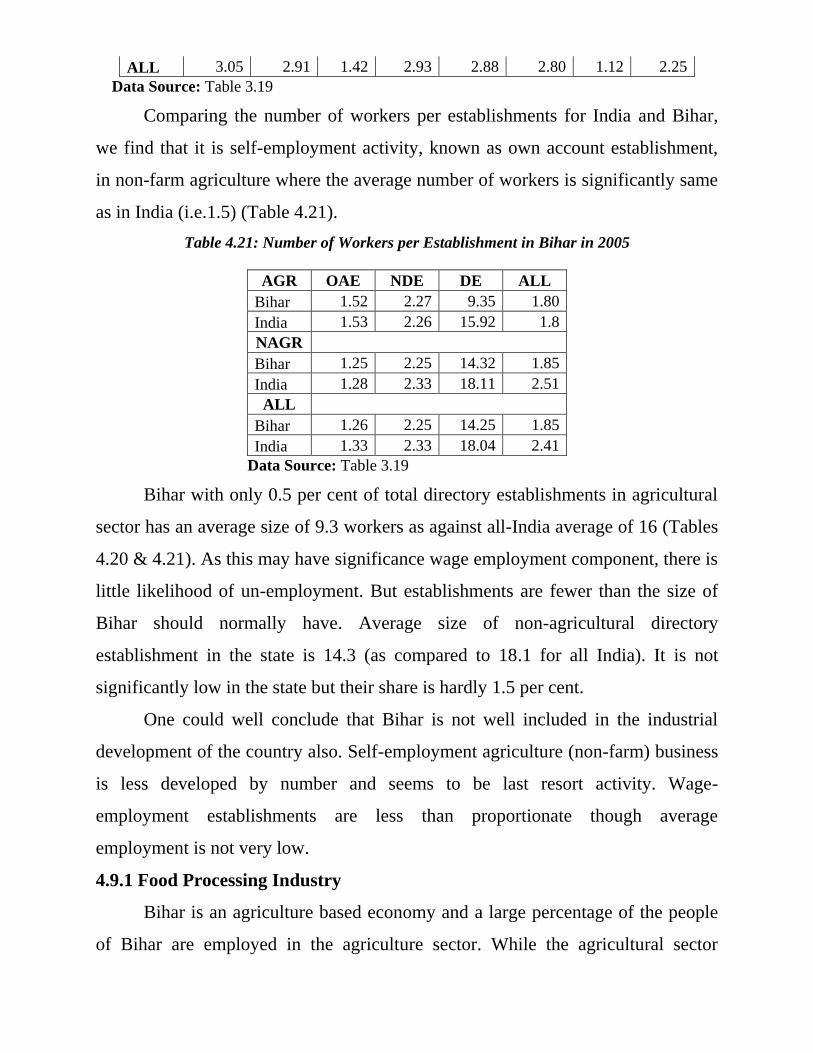
ALL 3.05 2.91 1.42 2.93 2.88 2.80 1.12 2.25
Data Source: Table 3.19
Comparing the number of workers per establishments for India and Bihar,
we find that it is self-employment activity, known as own account establishment,
in non-farm agriculture where the average number of workers is significantly same
as in India (i.e.1.5) (Table 4.21).
Table 4.21: Number of Workers per Establishment in Bihar in 2005
AGR OAE NDE DE ALL
Bihar 1.52 2.27 9.35 1.80
India 1.53 2.26 15.92 1.8
NAGR
Bihar 1.25 2.25 14.32 1.85
India 1.28 2.33 18.11 2.51
ALL
Bihar 1.26 2.25 14.25 1.85
India 1.33 2.33 18.04 2.41
Data Source: Table 3.19
Bihar with only 0.5 per cent of total directory establishments in agricultural
sector has an average size of 9.3 workers as against all-India average of 16 (Tables
4.20 & 4.21). As this may have significance wage employment component, there is
little likelihood of un-employment. But establishments are fewer than the size of
Bihar should normally have. Average size of non-agricultural directory
establishment in the state is 14.3 (as compared to 18.1 for all India). It is not
significantly low in the state but their share is hardly 1.5 per cent.
One could well conclude that Bihar is not well included in the industrial
development of the country also. Self-employment agriculture (non-farm) business
is less developed by number and seems to be last resort activity. Wage-
employment establishments are less than proportionate though average
employment is not very low.
4.9.1 Food Processing Industry
Bihar is an agriculture based economy and a large percentage of the people
of Bihar are employed in the agriculture sector. While the agricultural sector
became just stagnant, the agro-based industries can pull up the agricultural sector
through its backward linkages. There is a huge scope of food processing sector for
grains like, rice, maize, pulses and oilseeds; fruits like litchi, mango, banana,
makhana, amla; and vegetables like tomato, potato and chilly in Bihar. So, there is
a scope of up lifting the agro-based industries. And it can be done by the
improvement of skill sets, encouragement of entrepreneurship and sufficient credit
facilities.
4.9.2 Handloom Industry
Handloom industry in Bihar is one of the major employment generating
sectors, basically in rural area. Even as the sector has shown a gradual decline over
the years, it remains a significant component of the textile industry, providing
employment to over 50 thousand people in Bihar though accounted for merely 2
per cent of handloom units of the country (ILFS: ―Diagnostic Survey and Business
Plan for handloom Sector in Bihar,‖ Submitted to Department of Industries, Govt.
of Bihar, submitted by Infrastructure Leasing and Financial Services Limited).
More importantly, the sector remains a source of livelihood for the most
marginalized population of Bihar. In spite of various training institutions of Bihar,
state government has opened for the weavers viz. Weavers Training Centres at
Chakand, Kako, Obra, Jhingnagar, Puraini, Amarpur, Central Design Centre at
Rajendra Nagar, Polyster & Silk Vastra Training Cum Production Centre at
Bhagalpur, etc., most of weavers have not been able to take advantage of them. To
help them take advantage, the training institutes should be properly managed, well
equipped. Hiring ‗quality trainers‘ and development of infrastructure is needed, so
that they can produce skill sets for the handloom industry. However, it is said that
progress is slow because of severe lack of resources with state government
organizations, both in terms of physical and financial resources.
4.9.3 Leather Industry in Bihar
The leather and allied industries play a significant role in terms of providing
employment to the large number of artisans in India and also earning foreign
exchange through exports. However, the leather industry of Bihar has failed to
grab the opportunity to make a gain from it, although Bihar is known for very good
quality of cow hides, buffalo calf skins and goat skins – the basic raw material for
the leather industry. Though Bihar has considerable share of goat and cattle
population of the country the tanning industry of Bihar is functioning with a few
working tanneries in Muzaffarpur and another BATA tannery at Mokhamaghat,
therefore most of the raw material is drained to the tanneries hubs in Kolkata,
Kanpur and Chennai (Govt. of Bihar, Industries Department, ―A Presentation on
Leather Industries in Bihar and Its potential‖). There is a sufficient local demand
for footwear and other leather goods within Bihar. At present, a large quantity of
footwear is being brought into Bihar from places like Kanpur, Kolkata and Agra.
The leather tanning industry in Bihar consists of three important segments (a) units
established under Bihar Leather Development Corporation (BLDC) and its sister
concern viz. Bihar Finished Leather Ltd. (b) a few private tanneries working at
Muzaffarpur and (c) BATA tannery at Mokhamaghat (Govt. of Bihar, Industries
Department, ―Leather and Allied Industries in Bihar – An Overview and
Prospects‖). There are other artisanal units (including about 1000 household or
cottage footwear units) located in all urban and semi-urban centers, namely
Muzaffarpur, Bettiah, Danapur, Patna etc, employing about 50 thousand footwear
artisans in Bihar. Now these days, all these tanneries and footwear artisanal units
are suffering from the lack of necessary financial support for working capital needs
and skill up gradation. Although, Bihar has large number of footwear workers, but
most of them have migrated to centers like Kolkata, Mumbai etc due to the lack of
job opportunity in the leather industry in Bihar. However, there is enough scope to
develop leather and leather based industries in Bihar. Only the raw material can‘t
show the magic, Bihar needs an improvement of technical skill of the leather
workers. Only the skill sets development along with sufficient investment can
make Bihar‘s leather industry profitable.
4.10 Infrastructural Development
Sound Infrastructure is viewed as the basement of overall development of an
economy. Improved infrastructure creates a favorable environment for the
investment in industrial sector. To create gainful employment and to increase the
skill sets, it is necessary to create Bihar as another destination of investment in
India through the proper infrastructural facilities.
4.10.1. Transportation
Road connectivity which is one of the basic infrastructural requirements for
development is in miserable shape in Bihar. It is poorly developed and is in need of
major revamp. Bihar has 3734 km of national highways, about 4 thousand km of
state highways and about 8200 km of major district roads in 2009 (Govt. of Bihar,
Road Construction Department, ―Road Infrastructure: An Evolving
Transformation‖). As per 2001–02 data, road density per 1000 sq m is 80.7 km in
Bihar, which is higher than average road density for the country as whole (74.7
km) but lagging the states like Kerala (388.2 km), Orissa (169 km). However, a
World Bank estimate shows that roads do not still connect 70 per cent of inhabited
areas. Railways have a good network in Bihar and as per 2004–05 statistics,
railway line density per 1,000 sq m was 35.88 km as against 19.3 km for India as a
whole. Only two states WB & Punjab do better than Bihar (The states of West
Bengal (43.43 km) and Punjab (41.66 km) had higher railway line density than
Bihar)
4.10.2. Power generation
The rapid acceleration of power generation capacity should be an earnest
priority for the state government and a crucial pre-requisite to achieve its socio-
economic growth targets during the Eleventh Plan (2007-12). Power generation
and availability rates both are the lowest in Bihar compared to all India average.
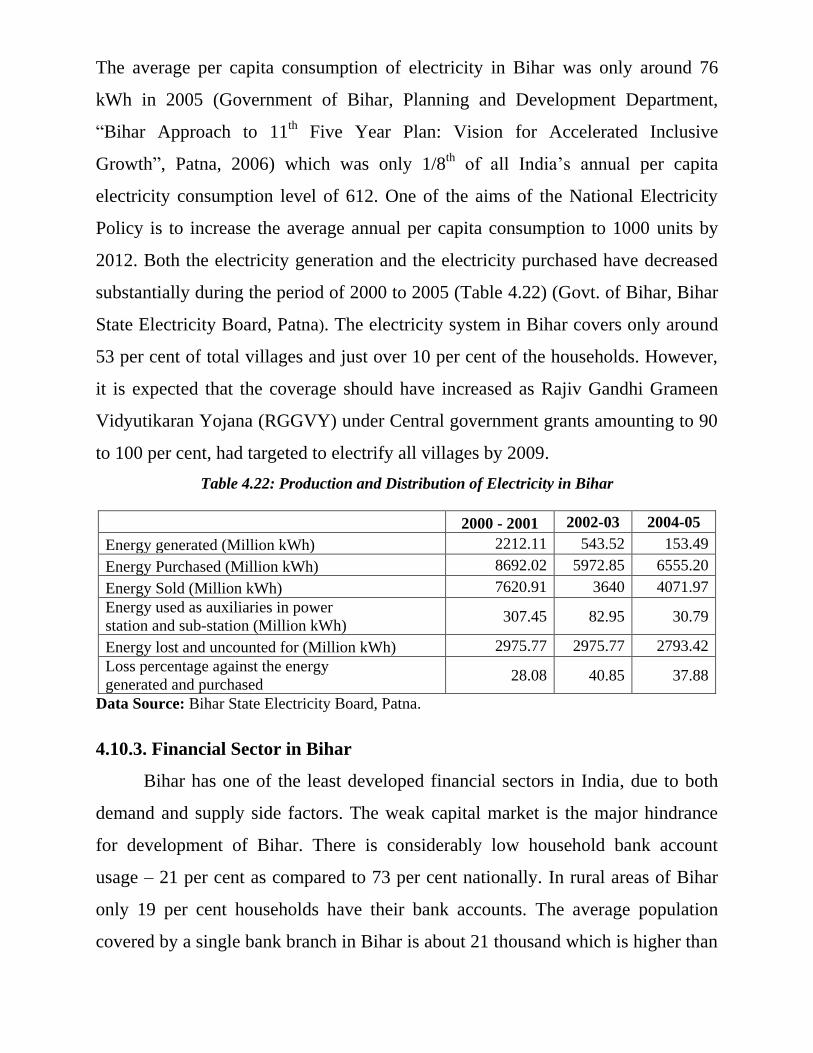
The average per capita consumption of electricity in Bihar was only around 76
kWh in 2005 (Government of Bihar, Planning and Development Department,
―Bihar Approach to 11th
Five Year Plan: Vision for Accelerated Inclusive
Growth‖, Patna, 2006) which was only 1/8th
of all India‘s annual per capita
electricity consumption level of 612. One of the aims of the National Electricity
Policy is to increase the average annual per capita consumption to 1000 units by
2012. Both the electricity generation and the electricity purchased have decreased
substantially during the period of 2000 to 2005 (Table 4.22) (Govt. of Bihar, Bihar
State Electricity Board, Patna). The electricity system in Bihar covers only around
53 per cent of total villages and just over 10 per cent of the households. However,
it is expected that the coverage should have increased as Rajiv Gandhi Grameen
Vidyutikaran Yojana (RGGVY) under Central government grants amounting to 90
to 100 per cent, had targeted to electrify all villages by 2009.
Table 4.22: Production and Distribution of Electricity in Bihar
2000 - 2001 2002-03 2004-05
Energy generated (Million kWh) 2212.11 543.52 153.49
Energy Purchased (Million kWh) 8692.02 5972.85 6555.20
Energy Sold (Million kWh) 7620.91 3640 4071.97
Energy used as auxiliaries in power
station and sub-station (Million kWh) 307.45 82.95 30.79
Energy lost and uncounted for (Million kWh) 2975.77 2975.77 2793.42
Loss percentage against the energy
generated and purchased 28.08 40.85 37.88
Data Source: Bihar State Electricity Board, Patna.
4.10.3. Financial Sector in Bihar
Bihar has one of the least developed financial sectors in India, due to both
demand and supply side factors. The weak capital market is the major hindrance
for development of Bihar. There is considerably low household bank account
usage – 21 per cent as compared to 73 per cent nationally. In rural areas of Bihar
only 19 per cent households have their bank accounts. The average population
covered by a single bank branch in Bihar is about 21 thousand which is higher than
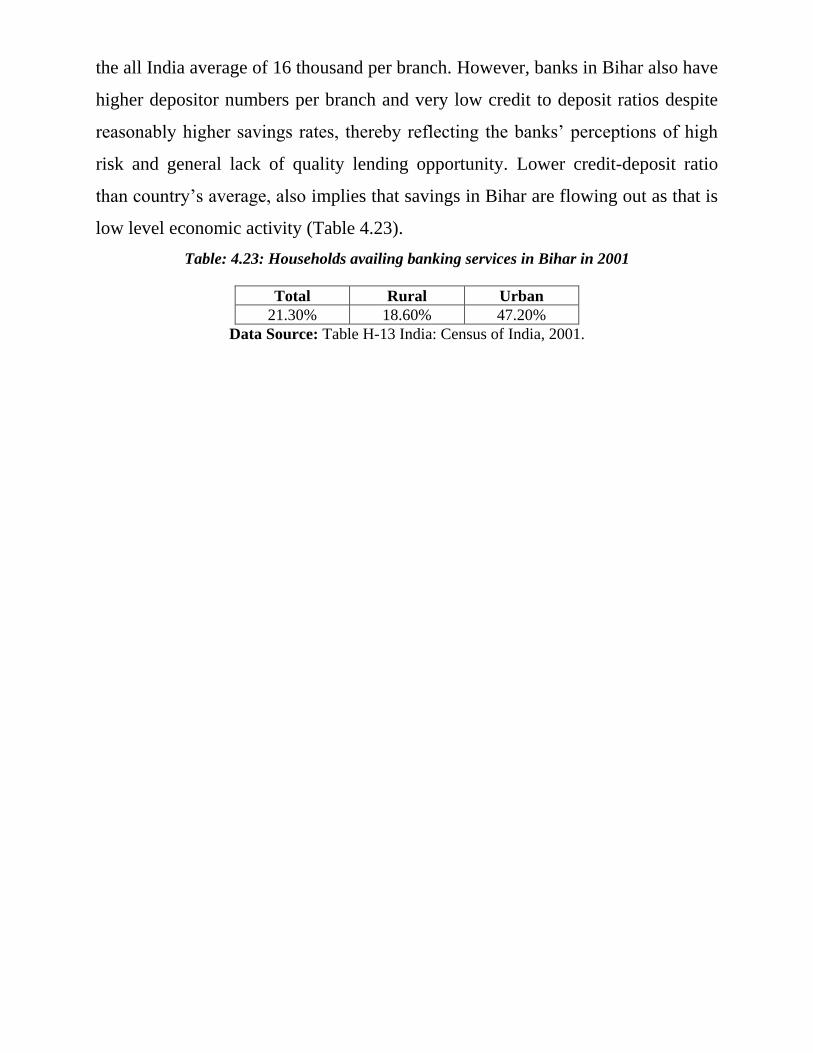
the all India average of 16 thousand per branch. However, banks in Bihar also have
higher depositor numbers per branch and very low credit to deposit ratios despite
reasonably higher savings rates, thereby reflecting the banks‘ perceptions of high
risk and general lack of quality lending opportunity. Lower credit-deposit ratio
than country‘s average, also implies that savings in Bihar are flowing out as that is
low level economic activity (Table 4.23).
Table: 4.23: Households availing banking services in Bihar in 2001
Total Rural Urban
21.30% 18.60% 47.20%
Data Source: Table H-13 India: Census of India, 2001.
Chapter V Status of Vocational Education and Training in Bihar
5.1 Introduction An all-India quinquennial survey of employment and unemployment in India
was carried out during the period from July, 2004 to June, 2005 as a part of the 61st
round of the National Sample Survey (NSS). In this survey, in addition to
employment and unemployment details, information on some general particulars of
the household members such as age, sex, level of general and technical education
attained, current attendance in educational institutions, etc. along with vocational
training received was also collected in the survey. Based on the data collected on
educational particulars of the individual members of the household members,
NSSO has published a report on ―Status of Education and Vocational Training in
India: 2004-05‖. This report has discussed mainly the status of education and
vocational training at all-India level. However some sections of the report have
discussed state-wise situation also.
Present chapter is based on the data collected by NSSO for the above survey
as a part of 61st round. Some of the Data Tables were generated from the unit level
data collected in this survey. This chapter has discussed about the status of
vocational education and training in Bihar. However wherever felt necessary,
comparison of the situation in Bihar has been made with that of all-India and other
states.
Besides the Introduction Section, this chapter has four more sections.
Second section has discussed about the distribution of population by monthly per
capita expenditure class. Third section has discussed about the literacy and
educational level in the population. Fourth section has discussed about the current
attendance in educational institutions and also by level of education, age-groups,
type of institution, and reasons for currently not attending the educational
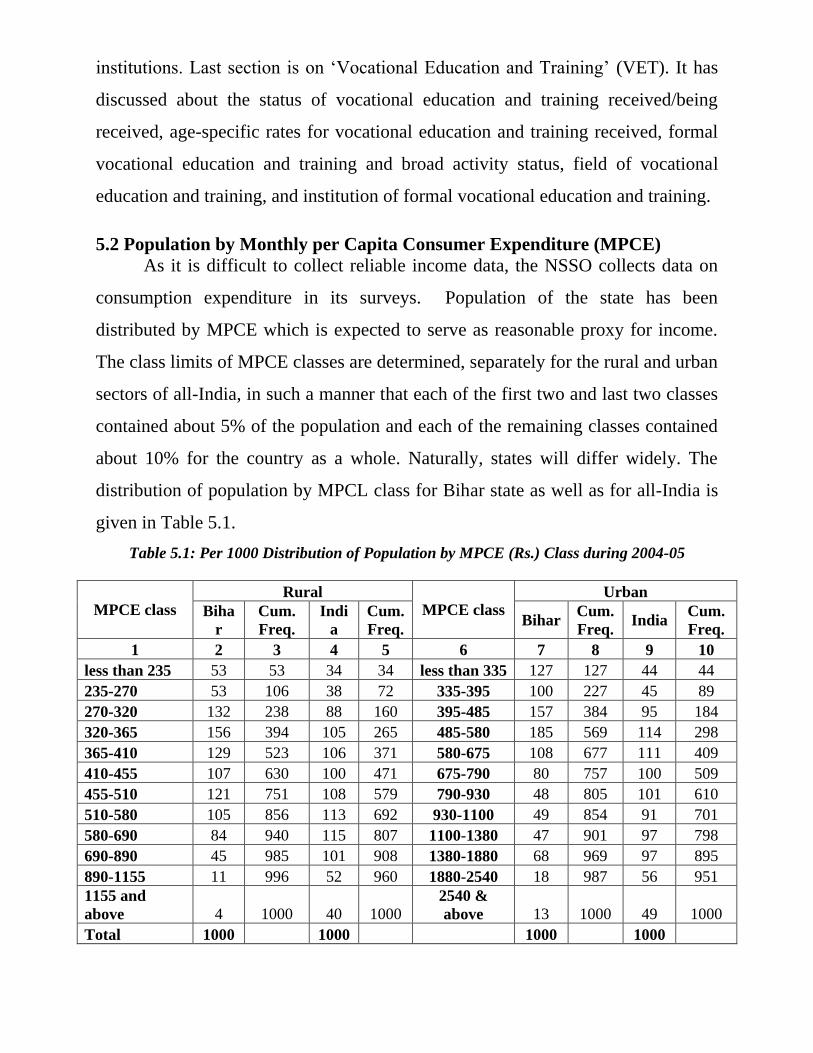
institutions. Last section is on ‗Vocational Education and Training‘ (VET). It has
discussed about the status of vocational education and training received/being
received, age-specific rates for vocational education and training received, formal
vocational education and training and broad activity status, field of vocational
education and training, and institution of formal vocational education and training.
5.2 Population by Monthly per Capita Consumer Expenditure (MPCE)
As it is difficult to collect reliable income data, the NSSO collects data on
consumption expenditure in its surveys. Population of the state has been
distributed by MPCE which is expected to serve as reasonable proxy for income.
The class limits of MPCE classes are determined, separately for the rural and urban
sectors of all-India, in such a manner that each of the first two and last two classes
contained about 5% of the population and each of the remaining classes contained
about 10% for the country as a whole. Naturally, states will differ widely. The
distribution of population by MPCL class for Bihar state as well as for all-India is
given in Table 5.1.
Table 5.1: Per 1000 Distribution of Population by MPCE (Rs.) Class during 2004-05
MPCE class
Rural
MPCE class
Urban
Biha
r
Cum.
Freq.
Indi
a
Cum.
Freq. Bihar
Cum.
Freq. India
Cum.
Freq.
1 2 3 4 5 6 7 8 9 10
less than 235 53 53 34 34 less than 335 127 127 44 44
235-270 53 106 38 72 335-395 100 227 45 89
270-320 132 238 88 160 395-485 157 384 95 184
320-365 156 394 105 265 485-580 185 569 114 298
365-410 129 523 106 371 580-675 108 677 111 409
410-455 107 630 100 471 675-790 80 757 100 509
455-510 121 751 108 579 790-930 48 805 101 610
510-580 105 856 113 692 930-1100 49 854 91 701
580-690 84 940 115 807 1100-1380 47 901 97 798
690-890 45 985 101 908 1380-1880 68 969 97 895
890-1155 11 996 52 960 1880-2540 18 987 56 951
1155 and
above 4 1000 40 1000
2540 &
above 13 1000 49 1000
Total 1000 1000 1000 1000
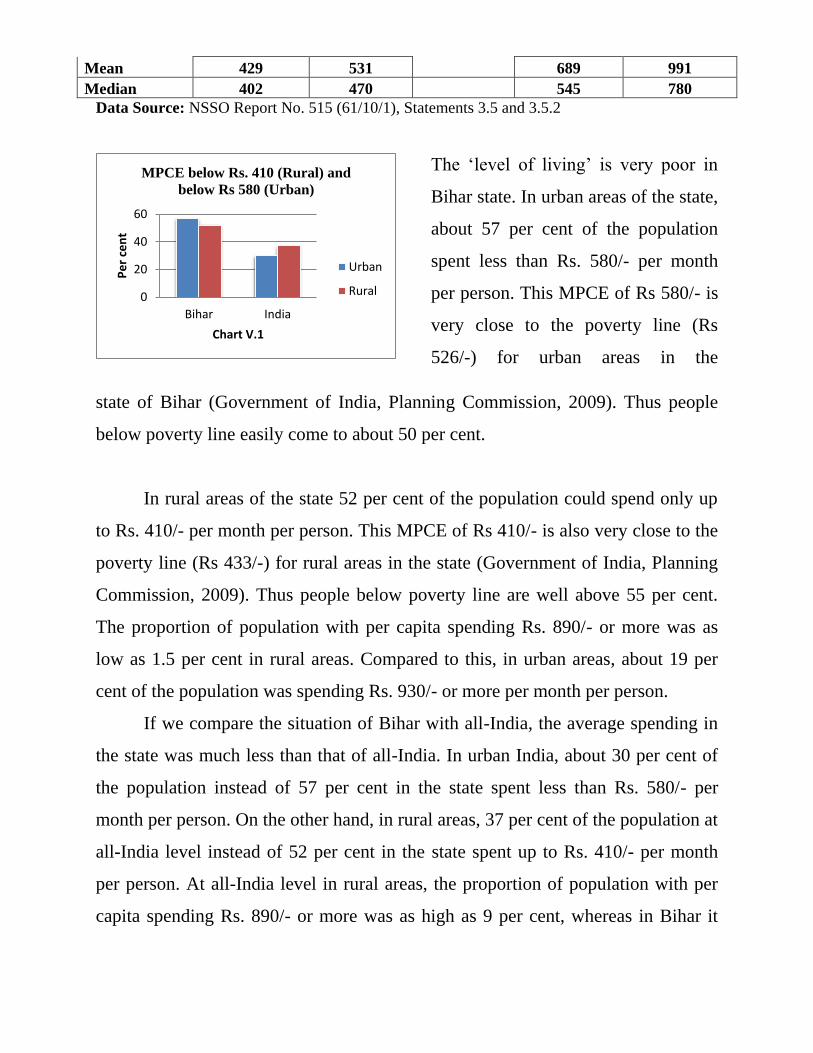
Mean 429 531 689 991
Median 402 470 545 780
Data Source: NSSO Report No. 515 (61/10/1), Statements 3.5 and 3.5.2
The ‗level of living‘ is very poor in
Bihar state. In urban areas of the state,
about 57 per cent of the population
spent less than Rs. 580/- per month
per person. This MPCE of Rs 580/- is
very close to the poverty line (Rs
526/-) for urban areas in the
state of Bihar (Government of India, Planning Commission, 2009). Thus people
below poverty line easily come to about 50 per cent.
In rural areas of the state 52 per cent of the population could spend only up
to Rs. 410/- per month per person. This MPCE of Rs 410/- is also very close to the
poverty line (Rs 433/-) for rural areas in the state (Government of India, Planning
Commission, 2009). Thus people below poverty line are well above 55 per cent.
The proportion of population with per capita spending Rs. 890/- or more was as
low as 1.5 per cent in rural areas. Compared to this, in urban areas, about 19 per
cent of the population was spending Rs. 930/- or more per month per person.
If we compare the situation of Bihar with all-India, the average spending in
the state was much less than that of all-India. In urban India, about 30 per cent of
the population instead of 57 per cent in the state spent less than Rs. 580/- per
month per person. On the other hand, in rural areas, 37 per cent of the population at
all-India level instead of 52 per cent in the state spent up to Rs. 410/- per month
per person. At all-India level in rural areas, the proportion of population with per
capita spending Rs. 890/- or more was as high as 9 per cent, whereas in Bihar it
0
20
40
60
Bihar India
Pe
r ce
nt
Chart V.1
MPCE below Rs. 410 (Rural) and
below Rs 580 (Urban)
Urban
Rural
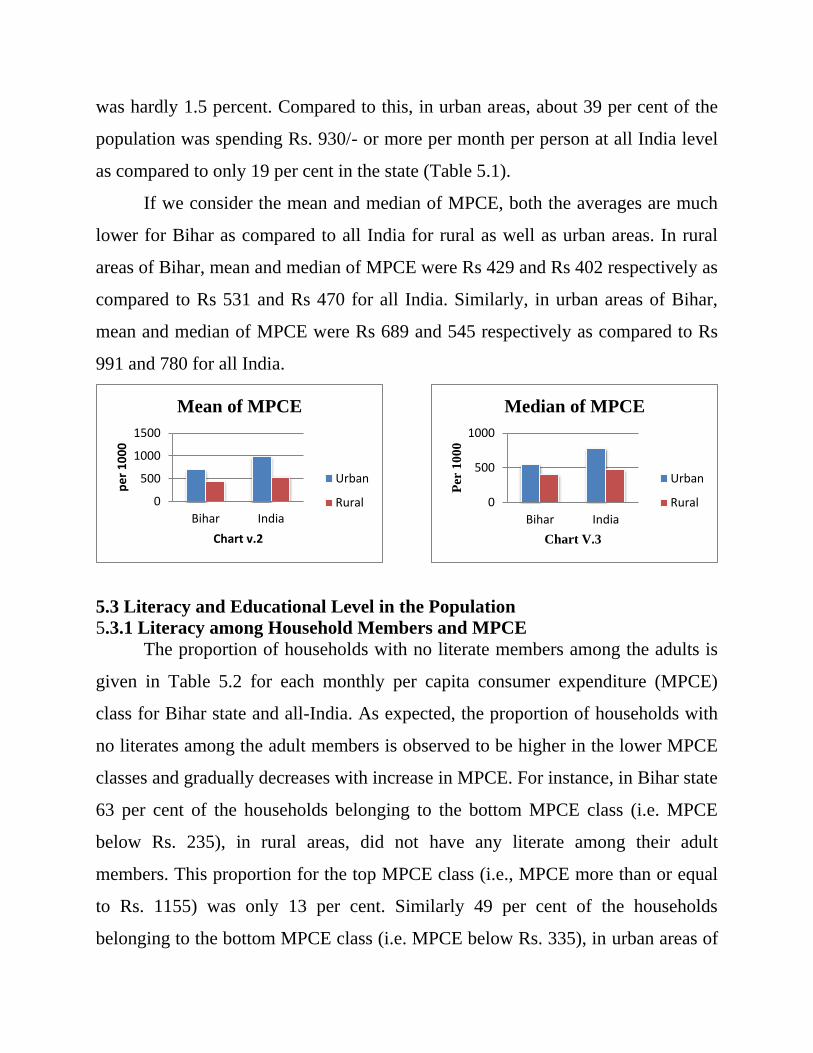
was hardly 1.5 percent. Compared to this, in urban areas, about 39 per cent of the
population was spending Rs. 930/- or more per month per person at all India level
as compared to only 19 per cent in the state (Table 5.1).
If we consider the mean and median of MPCE, both the averages are much
lower for Bihar as compared to all India for rural as well as urban areas. In rural
areas of Bihar, mean and median of MPCE were Rs 429 and Rs 402 respectively as
compared to Rs 531 and Rs 470 for all India. Similarly, in urban areas of Bihar,
mean and median of MPCE were Rs 689 and 545 respectively as compared to Rs
991 and 780 for all India.
5.3 Literacy and Educational Level in the Population
5.3.1 Literacy among Household Members and MPCE
The proportion of households with no literate members among the adults is
given in Table 5.2 for each monthly per capita consumer expenditure (MPCE)
class for Bihar state and all-India. As expected, the proportion of households with
no literates among the adult members is observed to be higher in the lower MPCE
classes and gradually decreases with increase in MPCE. For instance, in Bihar state
63 per cent of the households belonging to the bottom MPCE class (i.e. MPCE
below Rs. 235), in rural areas, did not have any literate among their adult
members. This proportion for the top MPCE class (i.e., MPCE more than or equal
to Rs. 1155) was only 13 per cent. Similarly 49 per cent of the households
belonging to the bottom MPCE class (i.e. MPCE below Rs. 335), in urban areas of
0
500
1000
1500
Bihar India
pe
r 1
00
0
Chart v.2
Mean of MPCE
Urban
Rural 0
500
1000
Bihar India
Per
10
00
Chart V.3
Median of MPCE
Urban
Rural
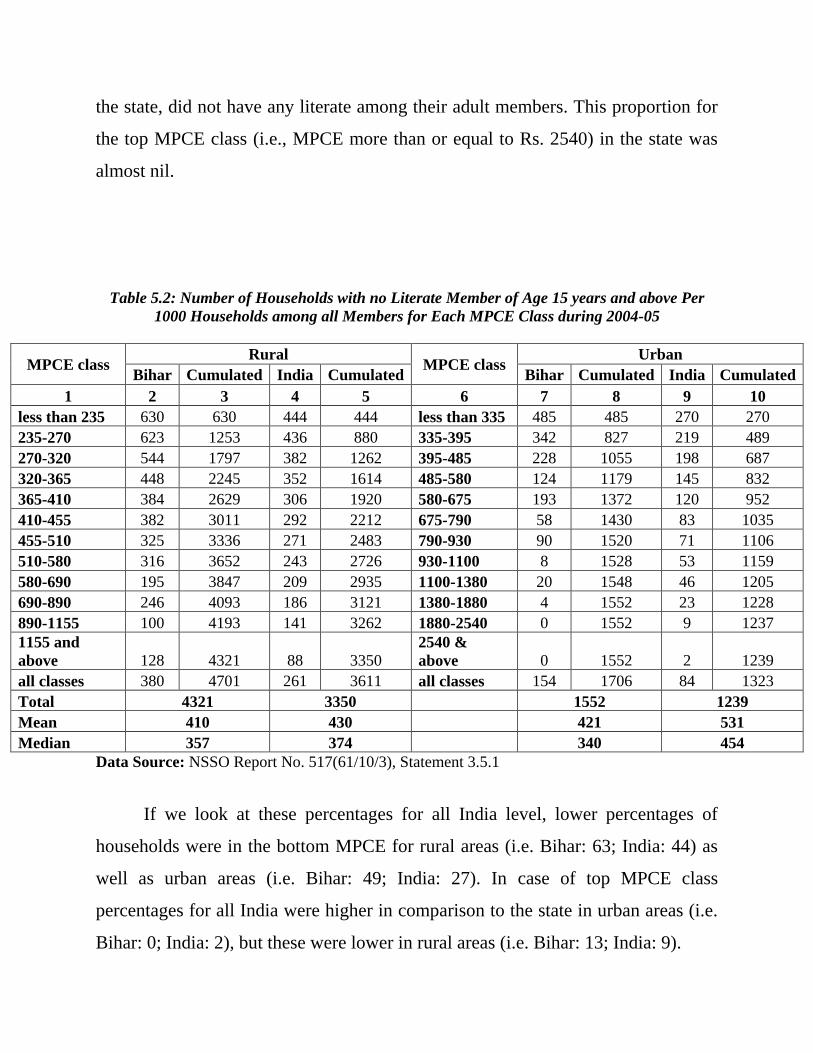
the state, did not have any literate among their adult members. This proportion for
the top MPCE class (i.e., MPCE more than or equal to Rs. 2540) in the state was
almost nil.
Table 5.2: Number of Households with no Literate Member of Age 15 years and above Per
1000 Households among all Members for Each MPCE Class during 2004-05
MPCE class Rural
MPCE class Urban
Bihar Cumulated India Cumulated Bihar Cumulated India Cumulated
1 2 3 4 5 6 7 8 9 10
less than 235 630 630 444 444 less than 335 485 485 270 270
235-270 623 1253 436 880 335-395 342 827 219 489
270-320 544 1797 382 1262 395-485 228 1055 198 687
320-365 448 2245 352 1614 485-580 124 1179 145 832
365-410 384 2629 306 1920 580-675 193 1372 120 952
410-455 382 3011 292 2212 675-790 58 1430 83 1035
455-510 325 3336 271 2483 790-930 90 1520 71 1106
510-580 316 3652 243 2726 930-1100 8 1528 53 1159
580-690 195 3847 209 2935 1100-1380 20 1548 46 1205
690-890 246 4093 186 3121 1380-1880 4 1552 23 1228
890-1155 100 4193 141 3262 1880-2540 0 1552 9 1237
1155 and
above 128 4321 88 3350
2540 &
above 0 1552 2 1239
all classes 380 4701 261 3611 all classes 154 1706 84 1323
Total 4321 3350 1552 1239
Mean 410 430 421 531
Median 357 374 340 454
Data Source: NSSO Report No. 517(61/10/3), Statement 3.5.1
If we look at these percentages for all India level, lower percentages of
households were in the bottom MPCE for rural areas (i.e. Bihar: 63; India: 44) as
well as urban areas (i.e. Bihar: 49; India: 27). In case of top MPCE class
percentages for all India were higher in comparison to the state in urban areas (i.e.
Bihar: 0; India: 2), but these were lower in rural areas (i.e. Bihar: 13; India: 9).
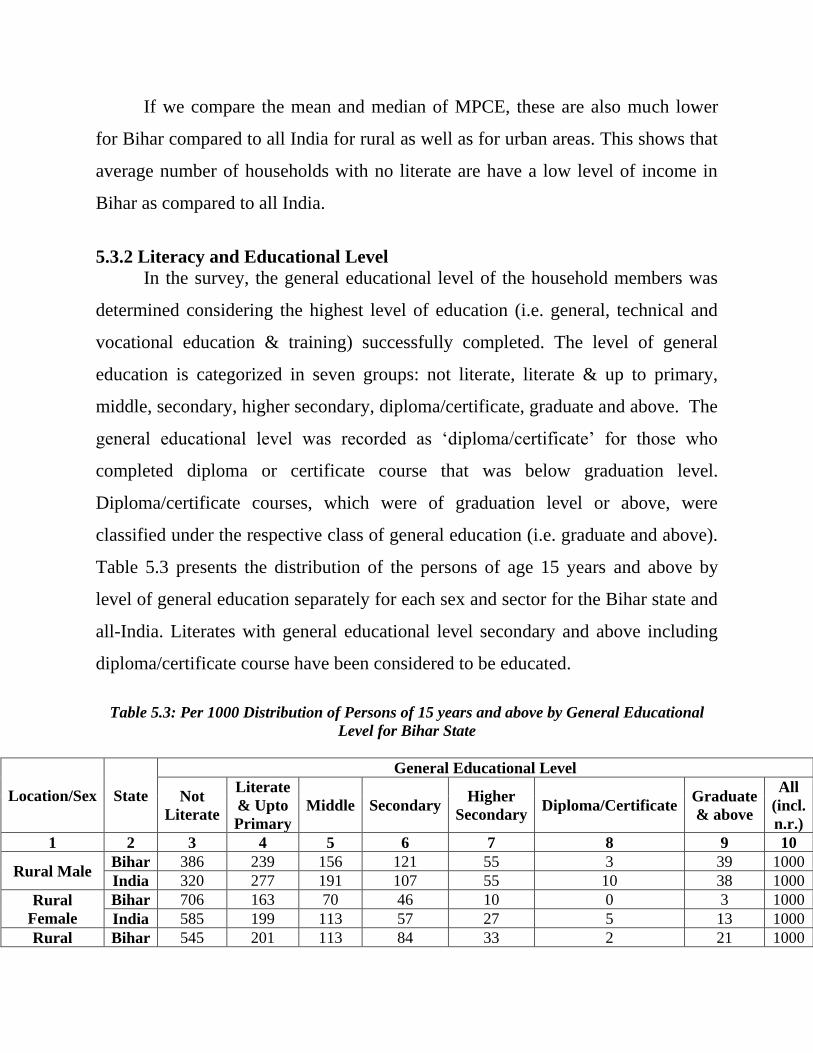
If we compare the mean and median of MPCE, these are also much lower
for Bihar compared to all India for rural as well as for urban areas. This shows that
average number of households with no literate are have a low level of income in
Bihar as compared to all India.
5.3.2 Literacy and Educational Level
In the survey, the general educational level of the household members was
determined considering the highest level of education (i.e. general, technical and
vocational education & training) successfully completed. The level of general
education is categorized in seven groups: not literate, literate & up to primary,
middle, secondary, higher secondary, diploma/certificate, graduate and above. The
general educational level was recorded as ‗diploma/certificate‘ for those who
completed diploma or certificate course that was below graduation level.
Diploma/certificate courses, which were of graduation level or above, were
classified under the respective class of general education (i.e. graduate and above).
Table 5.3 presents the distribution of the persons of age 15 years and above by
level of general education separately for each sex and sector for the Bihar state and
all-India. Literates with general educational level secondary and above including
diploma/certificate course have been considered to be educated.
Table 5.3: Per 1000 Distribution of Persons of 15 years and above by General Educational
Level for Bihar State
Location/Sex State
General Educational Level
Not
Literate
Literate
& Upto
Primary
Middle Secondary Higher
Secondary Diploma/Certificate
Graduate
& above
All
(incl.
n.r.)
1 2 3 4 5 6 7 8 9 10
Rural Male Bihar 386 239 156 121 55 3 39 1000
India 320 277 191 107 55 10 38 1000
Rural
Female
Bihar 706 163 70 46 10 0 3 1000
India 585 199 113 57 27 5 13 1000
Rural Bihar 545 201 113 84 33 2 21 1000
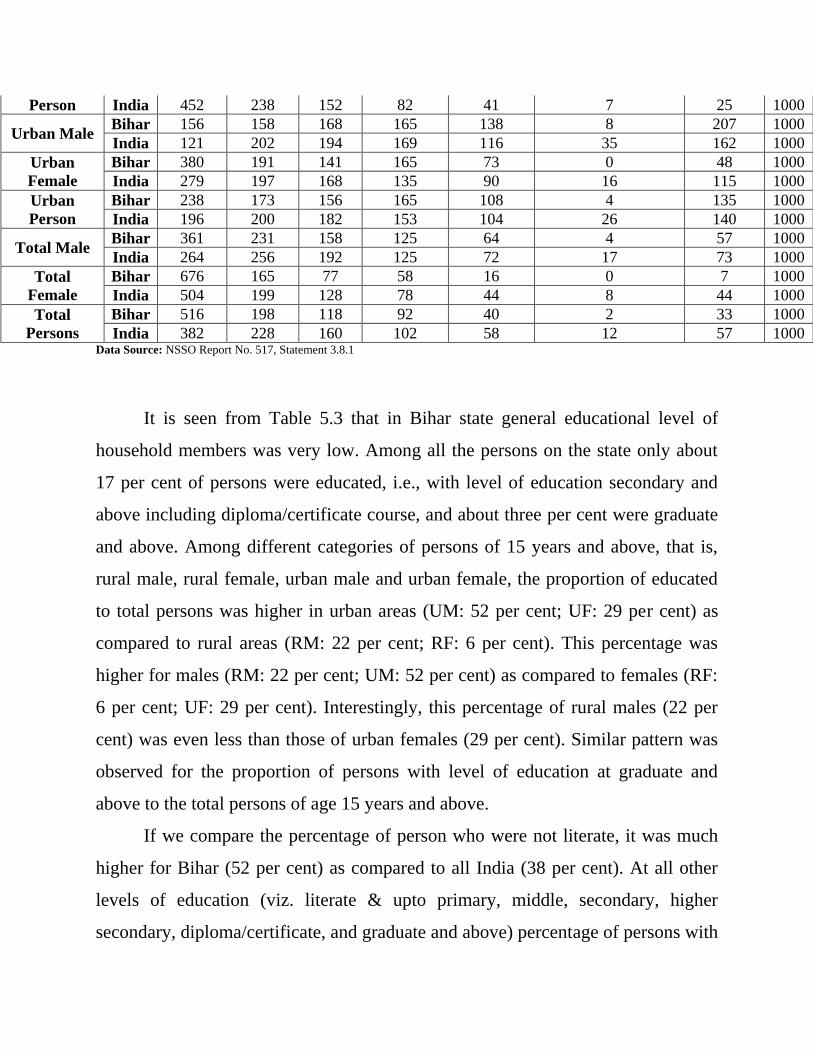
Person India 452 238 152 82 41 7 25 1000
Urban Male Bihar 156 158 168 165 138 8 207 1000
India 121 202 194 169 116 35 162 1000
Urban
Female
Bihar 380 191 141 165 73 0 48 1000
India 279 197 168 135 90 16 115 1000
Urban
Person
Bihar 238 173 156 165 108 4 135 1000
India 196 200 182 153 104 26 140 1000
Total Male Bihar 361 231 158 125 64 4 57 1000
India 264 256 192 125 72 17 73 1000
Total
Female
Bihar 676 165 77 58 16 0 7 1000
India 504 199 128 78 44 8 44 1000
Total
Persons
Bihar 516 198 118 92 40 2 33 1000
India 382 228 160 102 58 12 57 1000 Data Source: NSSO Report No. 517, Statement 3.8.1
It is seen from Table 5.3 that in Bihar state general educational level of
household members was very low. Among all the persons on the state only about
17 per cent of persons were educated, i.e., with level of education secondary and
above including diploma/certificate course, and about three per cent were graduate
and above. Among different categories of persons of 15 years and above, that is,
rural male, rural female, urban male and urban female, the proportion of educated
to total persons was higher in urban areas (UM: 52 per cent; UF: 29 per cent) as
compared to rural areas (RM: 22 per cent; RF: 6 per cent). This percentage was
higher for males (RM: 22 per cent; UM: 52 per cent) as compared to females (RF:
6 per cent; UF: 29 per cent). Interestingly, this percentage of rural males (22 per
cent) was even less than those of urban females (29 per cent). Similar pattern was
observed for the proportion of persons with level of education at graduate and
above to the total persons of age 15 years and above.
If we compare the percentage of person who were not literate, it was much
higher for Bihar (52 per cent) as compared to all India (38 per cent). At all other
levels of education (viz. literate & upto primary, middle, secondary, higher
secondary, diploma/certificate, and graduate and above) percentage of persons with
different educational levels to total persons in the state was much low in
comparison to all India.
If we compare general educational level of Bihar state with other 15 major
states of India its rank is very poor. In case of ―not literate‖ and
―Diploma/Certificate below graduate level‖ its rank was 15. This means in all other
states percentage of ―not literate‖ to total persons was lower in comparison to
Bihar (because not literate is not a good indicator) but percentage of persons with
―Diploma/Certificate below graduate level‖ was higher in comparison to Bihar
(because diploma/certificate below graduate level is a better indicator). In case of
―higher secondary‖ and ―graduate and above‖ its rank was 14. In other words for
these two levels of education percentage of persons was lower in the state in
comparison to 13 other states but it was higher in comparison to only one state.
Similarly in case of ―literate & up to primary‖, ―middle‖ and ―secondary‖ its rank
was 13, 12 and 8 respectively.
5.4 Current Attendance in Educational Institutions
5.4.1 Current Attendance and level of Education
The current attendance status refers to whether a person was attending any
educational institution on the date of survey and the information was collected for
each individual of age-group 5-29 years from the respondent household. It may
differ from the formal attendance status ascertained from or reported by
educational institutions. Persons were classified as attending or not attending; if
not attending, it was ascertained whether one ever attended or never attended.
Those who were attending were again classified according to the level of
attendance: below-primary, primary, middle and secondary & above.
Table 5.4 presents the distribution of persons of age 5-29 years by level of
current attendance separately of each sex and sector for Bihar state and all-India. It
is found that in Bihar state about 45 per cent of the people in the age-group 5-29
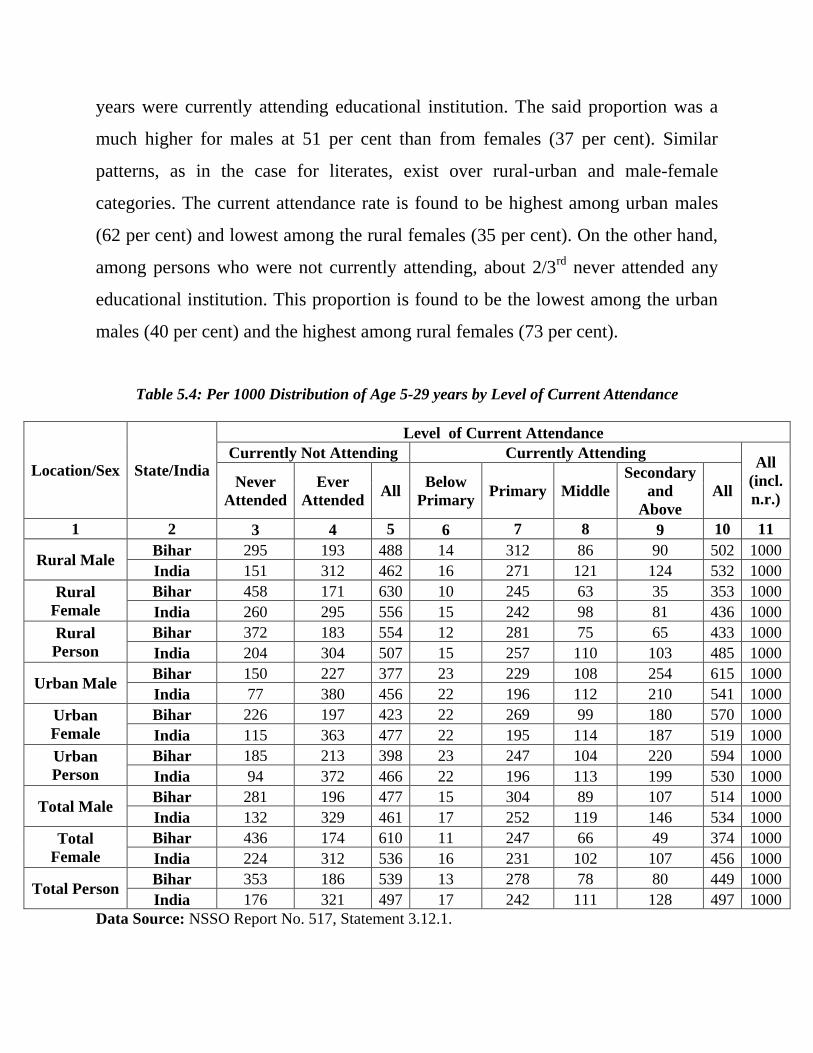
years were currently attending educational institution. The said proportion was a
much higher for males at 51 per cent than from females (37 per cent). Similar
patterns, as in the case for literates, exist over rural-urban and male-female
categories. The current attendance rate is found to be highest among urban males
(62 per cent) and lowest among the rural females (35 per cent). On the other hand,
among persons who were not currently attending, about 2/3rd
never attended any
educational institution. This proportion is found to be the lowest among the urban
males (40 per cent) and the highest among rural females (73 per cent).
Table 5.4: Per 1000 Distribution of Age 5-29 years by Level of Current Attendance
Location/Sex State/India
Level of Current Attendance
Currently Not Attending Currently Attending All
(incl.
n.r.) Never
Attended
Ever
Attended All
Below
Primary Primary Middle
Secondary
and
Above
All
1 2 3 4 5 6 7 8 9 10 11
Rural Male Bihar 295 193 488 14 312 86 90 502 1000
India 151 312 462 16 271 121 124 532 1000
Rural
Female
Bihar 458 171 630 10 245 63 35 353 1000
India 260 295 556 15 242 98 81 436 1000
Rural
Person
Bihar 372 183 554 12 281 75 65 433 1000
India 204 304 507 15 257 110 103 485 1000
Urban Male Bihar 150 227 377 23 229 108 254 615 1000
India 77 380 456 22 196 112 210 541 1000
Urban
Female
Bihar 226 197 423 22 269 99 180 570 1000
India 115 363 477 22 195 114 187 519 1000
Urban
Person
Bihar 185 213 398 23 247 104 220 594 1000
India 94 372 466 22 196 113 199 530 1000
Total Male Bihar 281 196 477 15 304 89 107 514 1000
India 132 329 461 17 252 119 146 534 1000
Total
Female
Bihar 436 174 610 11 247 66 49 374 1000
India 224 312 536 16 231 102 107 456 1000
Total Person Bihar 353 186 539 13 278 78 80 449 1000
India 176 321 497 17 242 111 128 497 1000
Data Source: NSSO Report No. 517, Statement 3.12.1.
Percentage of persons who were currently attending the educational
institutions is lower in Bihar (45 percent) as compared to all-India average (50 per
cent). If we compare the current attendance status of Bihar state with other major
states of India its performance was very poor and its rank was 14 in 15 major
states. Further, among persons who were not currently attending, percentage of
persons who never attended any educational institution was higher in Bihar (66 per
cent) as compared to all-India average (35 Per cent).
The distribution of currently attending persons by level of education reveals,
to some extent, the drop-out rate at different levels of education. After successfully
completing a particular level of education (say, L 1 ), in the next level (say, L 2 )
some individuals either do not enroll their names or even after enrolling do not
successfully complete that level. The number of persons who either do not enroll in
the next level (L 2 ) or do not successfully complete after enrolling in this level has
been termed, as drop-outs at level L 2 . Although these dropouts include the persons
who could not complete the level L 2 because of their death but their number would
be very small. The ratio of drop-outs at level L 2 and the persons successfully
completing level L 1 is defined as the drop-out rate at level L 2 . As per this
definition, one can measure the drop-out rate from the number of persons attending
in two consecutive levels of education. Though drop-out rates can be calculated at
all the levels of general education, for inter-level comparability, number of years in
different levels should be the same. Moreover, we assume the data in Table 5.4,
represent a cohort of currently attending persons across board levels of education
as on the mid-point (January 01, 2005) of the survey period and further assume a
steady-state distribution of persons across each individual level. Under these
conditions, the drop-out rate at ‗middle‘ level only has been calculated here since
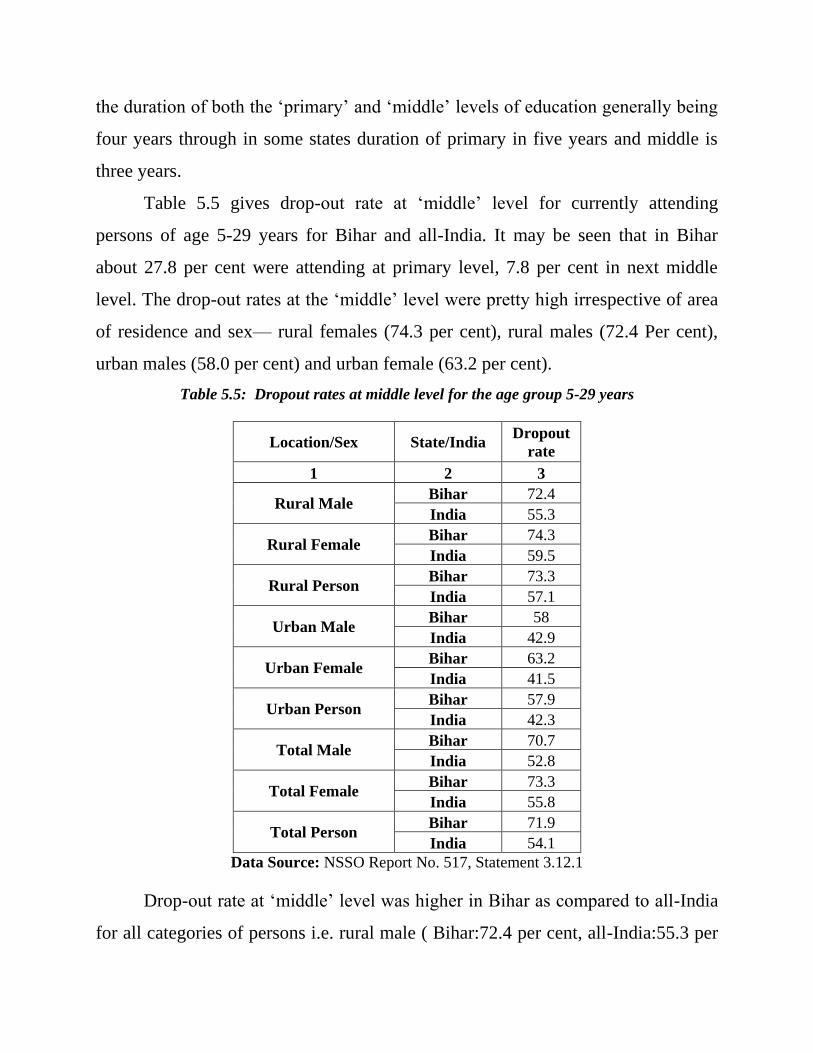
the duration of both the ‗primary‘ and ‗middle‘ levels of education generally being
four years through in some states duration of primary in five years and middle is
three years.
Table 5.5 gives drop-out rate at ‗middle‘ level for currently attending
persons of age 5-29 years for Bihar and all-India. It may be seen that in Bihar
about 27.8 per cent were attending at primary level, 7.8 per cent in next middle
level. The drop-out rates at the ‗middle‘ level were pretty high irrespective of area
of residence and sex— rural females (74.3 per cent), rural males (72.4 Per cent),
urban males (58.0 per cent) and urban female (63.2 per cent).
Table 5.5: Dropout rates at middle level for the age group 5-29 years
Location/Sex State/India Dropout
rate
1 2 3
Rural Male Bihar 72.4
India 55.3
Rural Female Bihar 74.3
India 59.5
Rural Person Bihar 73.3
India 57.1
Urban Male Bihar 58
India 42.9
Urban Female Bihar 63.2
India 41.5
Urban Person Bihar 57.9
India 42.3
Total Male Bihar 70.7
India 52.8
Total Female Bihar 73.3
India 55.8
Total Person Bihar 71.9
India 54.1
Data Source: NSSO Report No. 517, Statement 3.12.1
Drop-out rate at ‗middle‘ level was higher in Bihar as compared to all-India
for all categories of persons i.e. rural male ( Bihar:72.4 per cent, all-India:55.3 per
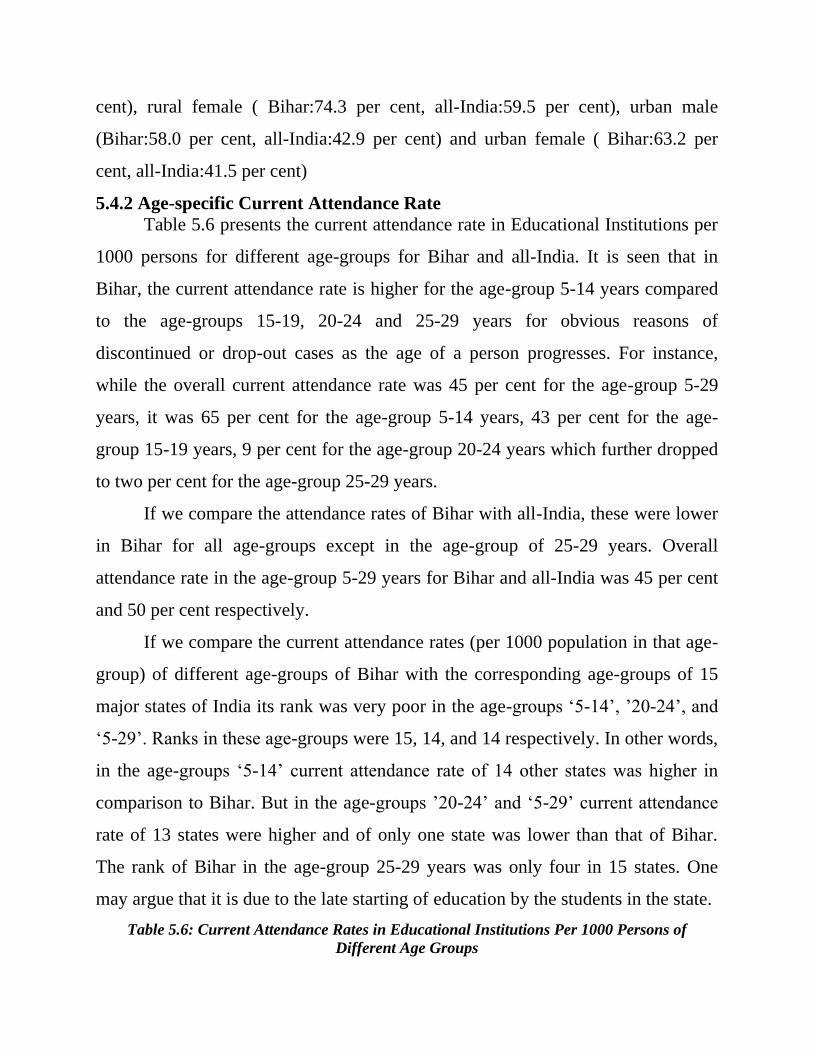
cent), rural female ( Bihar:74.3 per cent, all-India:59.5 per cent), urban male
(Bihar:58.0 per cent, all-India:42.9 per cent) and urban female ( Bihar:63.2 per
cent, all-India:41.5 per cent)
5.4.2 Age-specific Current Attendance Rate
Table 5.6 presents the current attendance rate in Educational Institutions per
1000 persons for different age-groups for Bihar and all-India. It is seen that in
Bihar, the current attendance rate is higher for the age-group 5-14 years compared
to the age-groups 15-19, 20-24 and 25-29 years for obvious reasons of
discontinued or drop-out cases as the age of a person progresses. For instance,
while the overall current attendance rate was 45 per cent for the age-group 5-29
years, it was 65 per cent for the age-group 5-14 years, 43 per cent for the age-
group 15-19 years, 9 per cent for the age-group 20-24 years which further dropped
to two per cent for the age-group 25-29 years.
If we compare the attendance rates of Bihar with all-India, these were lower
in Bihar for all age-groups except in the age-group of 25-29 years. Overall
attendance rate in the age-group 5-29 years for Bihar and all-India was 45 per cent
and 50 per cent respectively.
If we compare the current attendance rates (per 1000 population in that age-
group) of different age-groups of Bihar with the corresponding age-groups of 15
major states of India its rank was very poor in the age-groups ‗5-14‘, ‘20-24‘, and
‗5-29‘. Ranks in these age-groups were 15, 14, and 14 respectively. In other words,
in the age-groups ‗5-14‘ current attendance rate of 14 other states was higher in
comparison to Bihar. But in the age-groups ‘20-24‘ and ‗5-29‘ current attendance
rate of 13 states were higher and of only one state was lower than that of Bihar.
The rank of Bihar in the age-group 25-29 years was only four in 15 states. One
may argue that it is due to the late starting of education by the students in the state.
Table 5.6: Current Attendance Rates in Educational Institutions Per 1000 Persons of
Different Age Groups
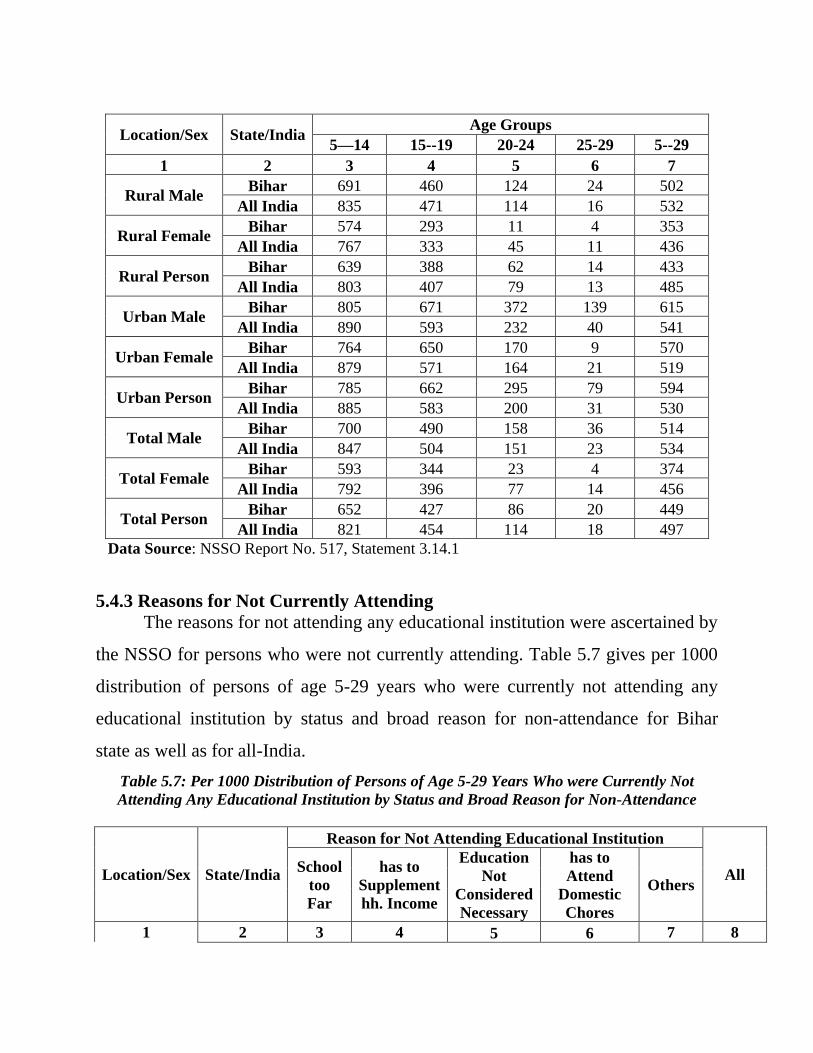
Location/Sex State/India Age Groups
5—14 15--19 20-24 25-29 5--29
1 2 3 4 5 6 7
Rural Male Bihar 691 460 124 24 502
All India 835 471 114 16 532
Rural Female Bihar 574 293 11 4 353
All India 767 333 45 11 436
Rural Person Bihar 639 388 62 14 433
All India 803 407 79 13 485
Urban Male Bihar 805 671 372 139 615
All India 890 593 232 40 541
Urban Female Bihar 764 650 170 9 570
All India 879 571 164 21 519
Urban Person Bihar 785 662 295 79 594
All India 885 583 200 31 530
Total Male Bihar 700 490 158 36 514
All India 847 504 151 23 534
Total Female Bihar 593 344 23 4 374
All India 792 396 77 14 456
Total Person Bihar 652 427 86 20 449
All India 821 454 114 18 497
Data Source: NSSO Report No. 517, Statement 3.14.1
5.4.3 Reasons for Not Currently Attending
The reasons for not attending any educational institution were ascertained by
the NSSO for persons who were not currently attending. Table 5.7 gives per 1000
distribution of persons of age 5-29 years who were currently not attending any
educational institution by status and broad reason for non-attendance for Bihar
state as well as for all-India.
Table 5.7: Per 1000 Distribution of Persons of Age 5-29 Years Who were Currently Not
Attending Any Educational Institution by Status and Broad Reason for Non-Attendance
Location/Sex State/India
Reason for Not Attending Educational Institution
All School
too
Far
has to
Supplement
hh. Income
Education
Not
Considered
Necessary
has to
Attend
Domestic
Chores
Others
1 2 3 4 5 6 7 8
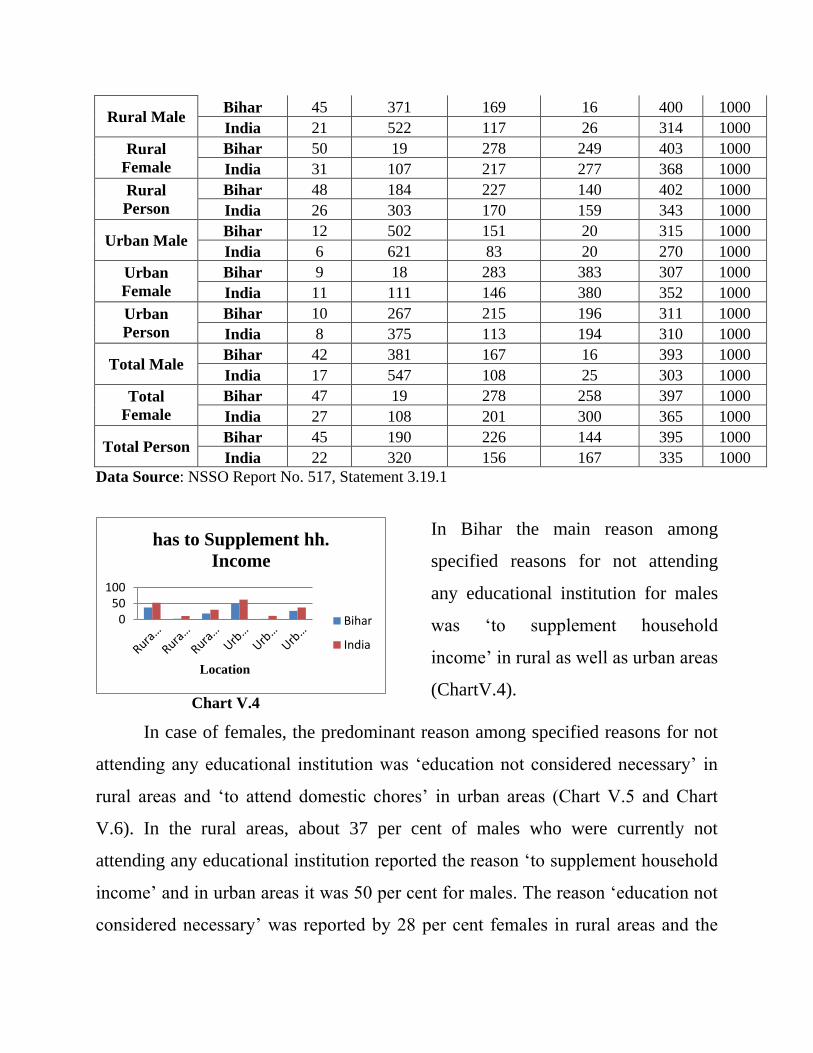
Rural Male Bihar 45 371 169 16 400 1000
India 21 522 117 26 314 1000
Rural
Female
Bihar 50 19 278 249 403 1000
India 31 107 217 277 368 1000
Rural
Person
Bihar 48 184 227 140 402 1000
India 26 303 170 159 343 1000
Urban Male Bihar 12 502 151 20 315 1000
India 6 621 83 20 270 1000
Urban
Female
Bihar 9 18 283 383 307 1000
India 11 111 146 380 352 1000
Urban
Person
Bihar 10 267 215 196 311 1000
India 8 375 113 194 310 1000
Total Male Bihar 42 381 167 16 393 1000
India 17 547 108 25 303 1000
Total
Female
Bihar 47 19 278 258 397 1000
India 27 108 201 300 365 1000
Total Person Bihar 45 190 226 144 395 1000
India 22 320 156 167 335 1000
Data Source: NSSO Report No. 517, Statement 3.19.1
Chart V.4
In Bihar the main reason among
specified reasons for not attending
any educational institution for males
was ‗to supplement household
income‘ in rural as well as urban areas
(ChartV.4).
In case of females, the predominant reason among specified reasons for not
attending any educational institution was ‗education not considered necessary‘ in
rural areas and ‗to attend domestic chores‘ in urban areas (Chart V.5 and Chart
V.6). In the rural areas, about 37 per cent of males who were currently not
attending any educational institution reported the reason ‗to supplement household
income‘ and in urban areas it was 50 per cent for males. The reason ‗education not
considered necessary‘ was reported by 28 per cent females in rural areas and the
050
100
Location
has to Supplement hh.
Income
Bihar
India
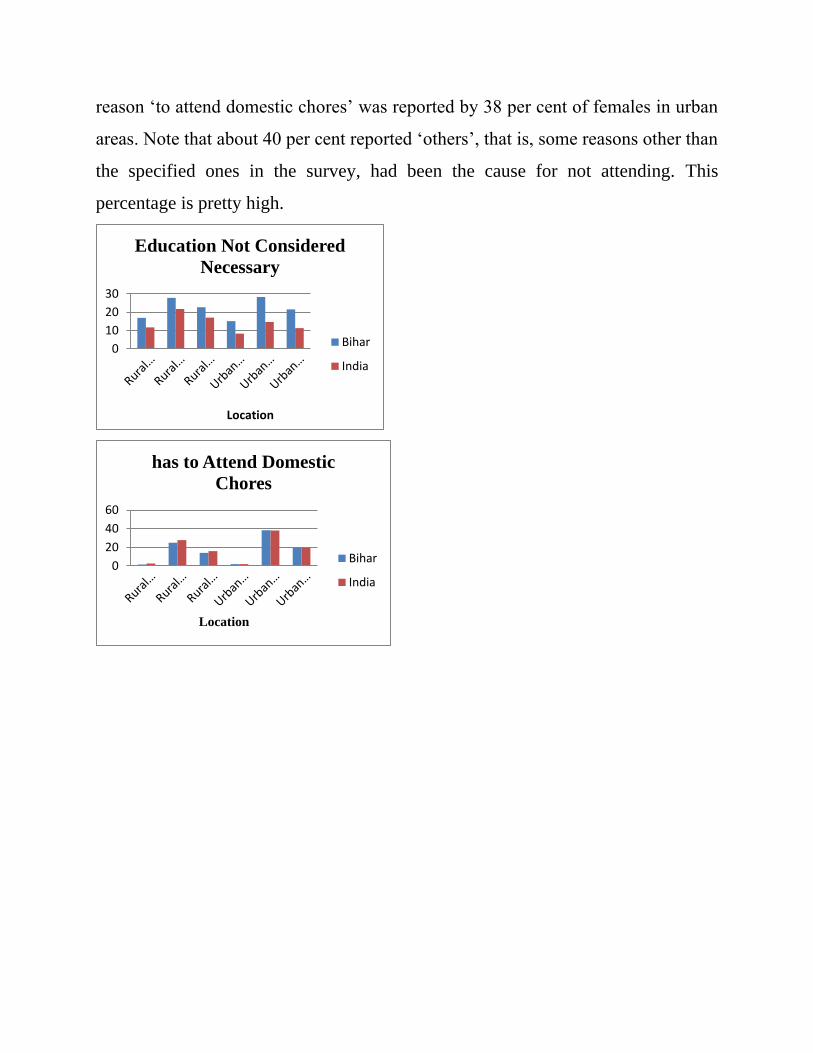
reason ‗to attend domestic chores‘ was reported by 38 per cent of females in urban
areas. Note that about 40 per cent reported ‗others‘, that is, some reasons other than
the specified ones in the survey, had been the cause for not attending. This
percentage is pretty high.
0
10
20
30
Location
Education Not Considered
Necessary
Bihar
India
0
20
40
60
Location
has to Attend Domestic
Chores
Bihar
India
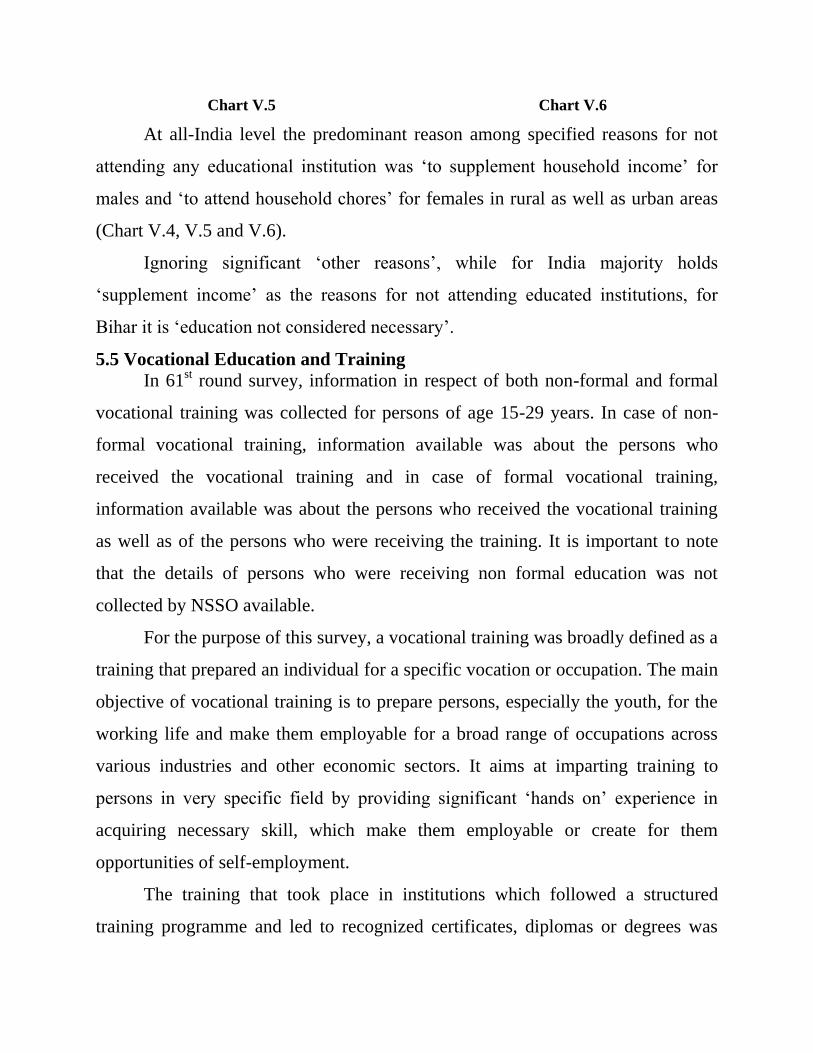
Chart V.5 Chart V.6
At all-India level the predominant reason among specified reasons for not
attending any educational institution was ‗to supplement household income‘ for
males and ‗to attend household chores‘ for females in rural as well as urban areas
(Chart V.4, V.5 and V.6).
Ignoring significant ‗other reasons‘, while for India majority holds
‗supplement income‘ as the reasons for not attending educated institutions, for
Bihar it is ‗education not considered necessary‘.
5.5 Vocational Education and Training
In 61st round survey, information in respect of both non-formal and formal
vocational training was collected for persons of age 15-29 years. In case of non-
formal vocational training, information available was about the persons who
received the vocational training and in case of formal vocational training,
information available was about the persons who received the vocational training
as well as of the persons who were receiving the training. It is important to note
that the details of persons who were receiving non formal education was not
collected by NSSO available.
For the purpose of this survey, a vocational training was broadly defined as a
training that prepared an individual for a specific vocation or occupation. The main
objective of vocational training is to prepare persons, especially the youth, for the
working life and make them employable for a broad range of occupations across
various industries and other economic sectors. It aims at imparting training to
persons in very specific field by providing significant ‗hands on‘ experience in
acquiring necessary skill, which make them employable or create for them
opportunities of self-employment.
The training that took place in institutions which followed a structured
training programme and led to recognized certificates, diplomas or degrees was
treated as formal vocational training. When the expertise in a vocation or trade was
acquired from family members which enabled one to carry out the trade or
occupation of one‘s ancestors over generations, or from any other ‗non-formal‘
sources, vocational training was considered as ‗non-formal‘ vocational training.
5.5.1 Status of Vocational Training Received/being Received
Table 5.8 presents the distribution of persons of age 15-29 years by status of
vocational training received/being received, separately for each sex and sector at
Bihar and all-India level. In Bihar state, of the persons of age 15-29 years, (i) only
0.3 per cent reported formal vocational training as on the date of survey, (ii) 0.2
per cent reported to have received formal vocational training and (iii) another 1.3
per cent reported to have received non-formal vocational training. If we assume
that another one per cent of the persons were receiving the non-formal vocational
training then we can say that only 3 per cent of the persons in this age group were
either receiving or have received any vocational training (formal or non-formal).
This is a very low percentage. The proportion of the persons who received/being
received the vocational training was further lower in the case of females than in the
case of males in both the rural and urban areas. Moreover, as expected, the
proportion of such persons was higher in the urban areas than that of rural areas.
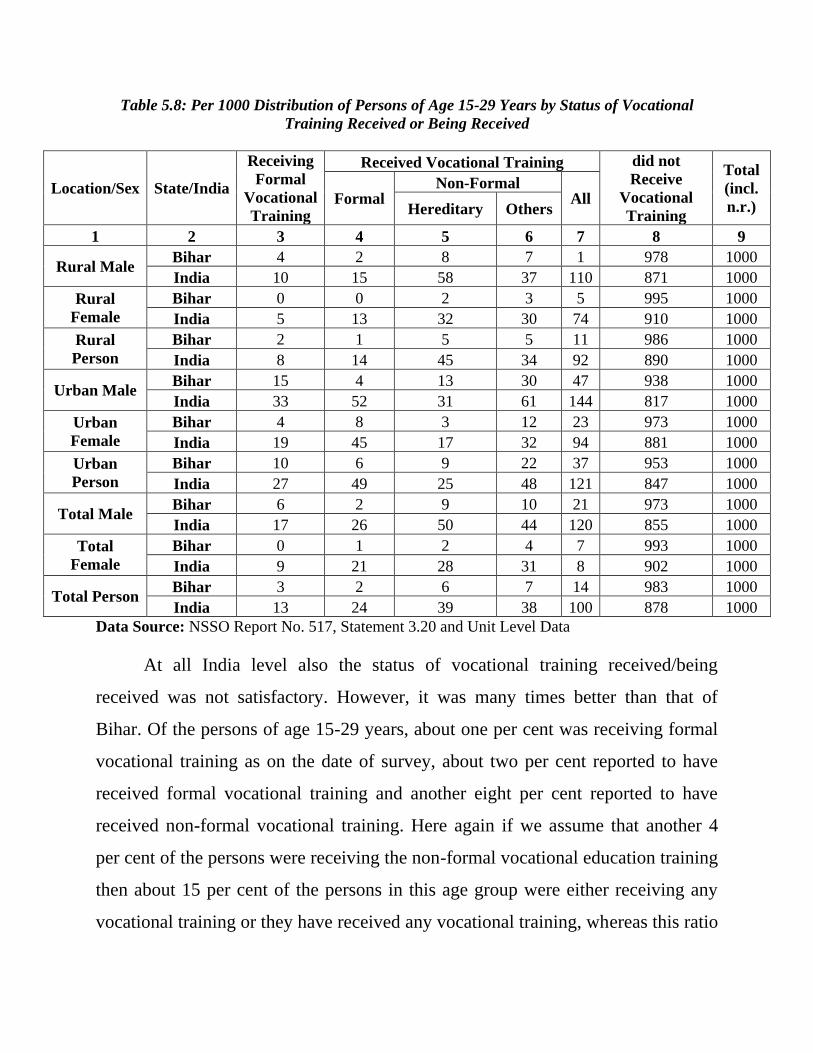
Table 5.8: Per 1000 Distribution of Persons of Age 15-29 Years by Status of Vocational
Training Received or Being Received
Location/Sex State/India
Receiving
Formal
Vocational
Training
Received Vocational Training did not
Receive
Vocational
Training
Total
(incl.
n.r.) Formal
Non-Formal All
Hereditary Others
1 2 3 4 5 6 7 8 9
Rural Male Bihar 4 2 8 7 1 978 1000
India 10 15 58 37 110 871 1000
Rural
Female
Bihar 0 0 2 3 5 995 1000
India 5 13 32 30 74 910 1000
Rural
Person
Bihar 2 1 5 5 11 986 1000
India 8 14 45 34 92 890 1000
Urban Male Bihar 15 4 13 30 47 938 1000
India 33 52 31 61 144 817 1000
Urban
Female
Bihar 4 8 3 12 23 973 1000
India 19 45 17 32 94 881 1000
Urban
Person
Bihar 10 6 9 22 37 953 1000
India 27 49 25 48 121 847 1000
Total Male Bihar 6 2 9 10 21 973 1000
India 17 26 50 44 120 855 1000
Total
Female
Bihar 0 1 2 4 7 993 1000
India 9 21 28 31 8 902 1000
Total Person Bihar 3 2 6 7 14 983 1000
India 13 24 39 38 100 878 1000
Data Source: NSSO Report No. 517, Statement 3.20 and Unit Level Data
At all India level also the status of vocational training received/being
received was not satisfactory. However, it was many times better than that of
Bihar. Of the persons of age 15-29 years, about one per cent was receiving formal
vocational training as on the date of survey, about two per cent reported to have
received formal vocational training and another eight per cent reported to have
received non-formal vocational training. Here again if we assume that another 4
per cent of the persons were receiving the non-formal vocational education training
then about 15 per cent of the persons in this age group were either receiving any
vocational training or they have received any vocational training, whereas this ratio
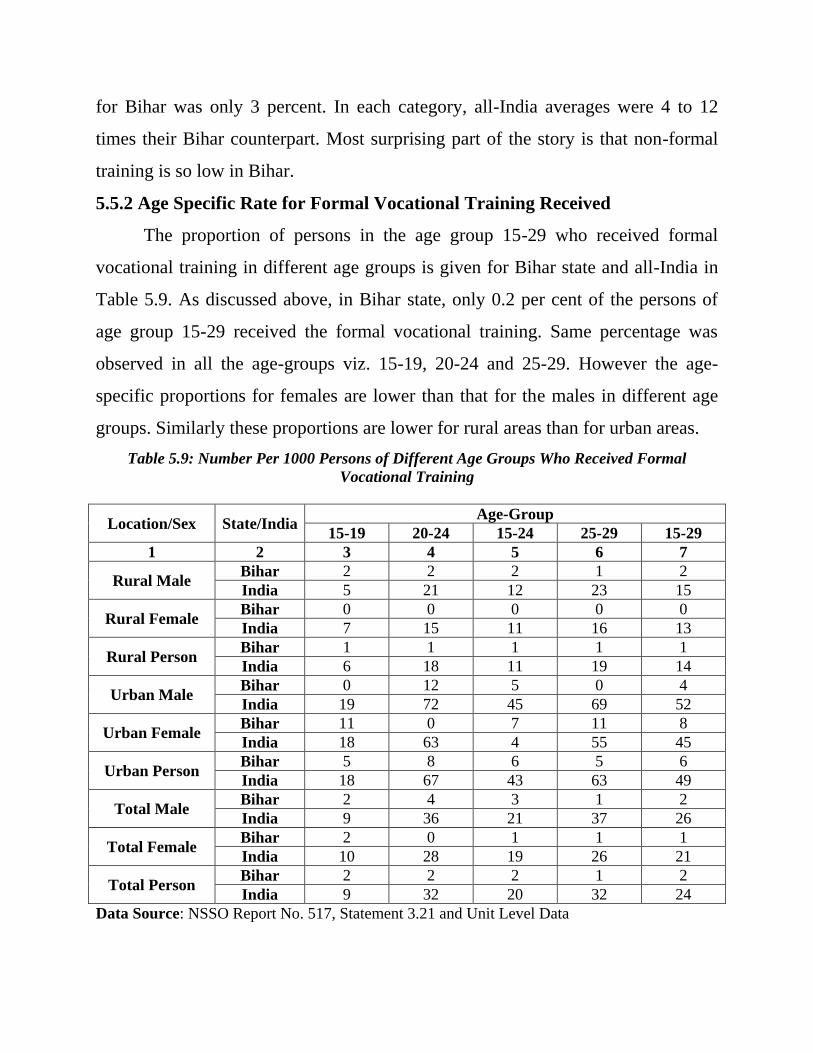
for Bihar was only 3 percent. In each category, all-India averages were 4 to 12
times their Bihar counterpart. Most surprising part of the story is that non-formal
training is so low in Bihar.
5.5.2 Age Specific Rate for Formal Vocational Training Received
The proportion of persons in the age group 15-29 who received formal
vocational training in different age groups is given for Bihar state and all-India in
Table 5.9. As discussed above, in Bihar state, only 0.2 per cent of the persons of
age group 15-29 received the formal vocational training. Same percentage was
observed in all the age-groups viz. 15-19, 20-24 and 25-29. However the age-
specific proportions for females are lower than that for the males in different age
groups. Similarly these proportions are lower for rural areas than for urban areas.
Table 5.9: Number Per 1000 Persons of Different Age Groups Who Received Formal
Vocational Training
Location/Sex State/India Age-Group
15-19 20-24 15-24 25-29 15-29
1 2 3 4 5 6 7
Rural Male Bihar 2 2 2 1 2
India 5 21 12 23 15
Rural Female Bihar 0 0 0 0 0
India 7 15 11 16 13
Rural Person Bihar 1 1 1 1 1
India 6 18 11 19 14
Urban Male Bihar 0 12 5 0 4
India 19 72 45 69 52
Urban Female Bihar 11 0 7 11 8
India 18 63 4 55 45
Urban Person Bihar 5 8 6 5 6
India 18 67 43 63 49
Total Male Bihar 2 4 3 1 2
India 9 36 21 37 26
Total Female Bihar 2 0 1 1 1
India 10 28 19 26 21
Total Person Bihar 2 2 2 1 2
India 9 32 20 32 24
Data Source: NSSO Report No. 517, Statement 3.21 and Unit Level Data
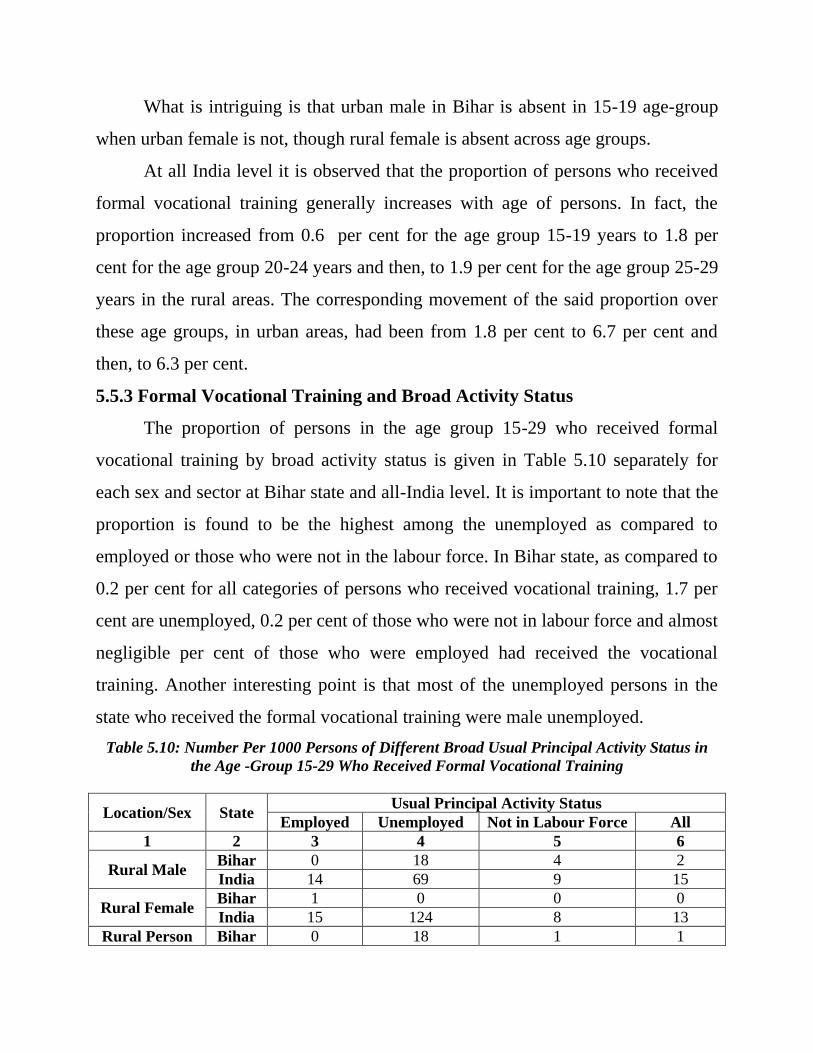
What is intriguing is that urban male in Bihar is absent in 15-19 age-group
when urban female is not, though rural female is absent across age groups.
At all India level it is observed that the proportion of persons who received
formal vocational training generally increases with age of persons. In fact, the
proportion increased from 0.6 per cent for the age group 15-19 years to 1.8 per
cent for the age group 20-24 years and then, to 1.9 per cent for the age group 25-29
years in the rural areas. The corresponding movement of the said proportion over
these age groups, in urban areas, had been from 1.8 per cent to 6.7 per cent and
then, to 6.3 per cent.
5.5.3 Formal Vocational Training and Broad Activity Status
The proportion of persons in the age group 15-29 who received formal
vocational training by broad activity status is given in Table 5.10 separately for
each sex and sector at Bihar state and all-India level. It is important to note that the
proportion is found to be the highest among the unemployed as compared to
employed or those who were not in the labour force. In Bihar state, as compared to
0.2 per cent for all categories of persons who received vocational training, 1.7 per
cent are unemployed, 0.2 per cent of those who were not in labour force and almost
negligible per cent of those who were employed had received the vocational
training. Another interesting point is that most of the unemployed persons in the
state who received the formal vocational training were male unemployed.
Table 5.10: Number Per 1000 Persons of Different Broad Usual Principal Activity Status in
the Age -Group 15-29 Who Received Formal Vocational Training
Location/Sex State Usual Principal Activity Status
Employed Unemployed Not in Labour Force All
1 2 3 4 5 6
Rural Male Bihar 0 18 4 2
India 14 69 9 15
Rural Female Bihar 1 0 0 0
India 15 124 8 13
Rural Person Bihar 0 18 1 1
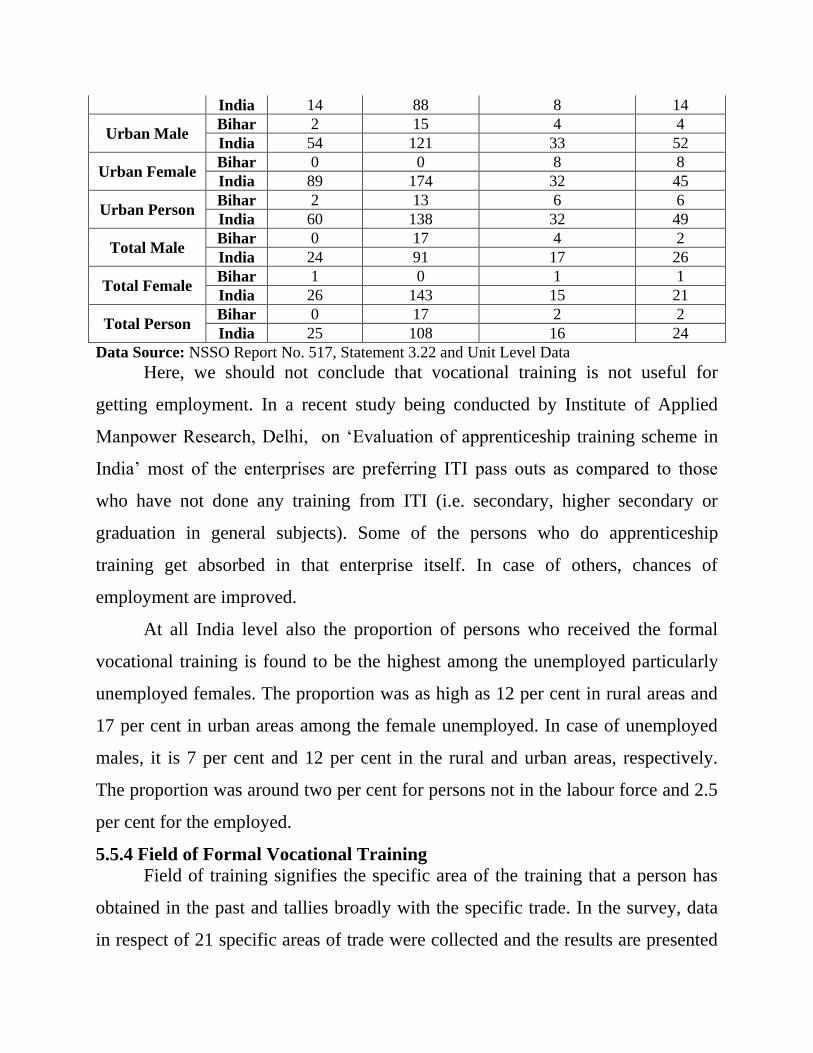
India 14 88 8 14
Urban Male Bihar 2 15 4 4
India 54 121 33 52
Urban Female Bihar 0 0 8 8
India 89 174 32 45
Urban Person Bihar 2 13 6 6
India 60 138 32 49
Total Male Bihar 0 17 4 2
India 24 91 17 26
Total Female Bihar 1 0 1 1
India 26 143 15 21
Total Person Bihar 0 17 2 2
India 25 108 16 24
Data Source: NSSO Report No. 517, Statement 3.22 and Unit Level Data
Here, we should not conclude that vocational training is not useful for
getting employment. In a recent study being conducted by Institute of Applied
Manpower Research, Delhi, on ‗Evaluation of apprenticeship training scheme in
India‘ most of the enterprises are preferring ITI pass outs as compared to those
who have not done any training from ITI (i.e. secondary, higher secondary or
graduation in general subjects). Some of the persons who do apprenticeship
training get absorbed in that enterprise itself. In case of others, chances of
employment are improved.
At all India level also the proportion of persons who received the formal
vocational training is found to be the highest among the unemployed particularly
unemployed females. The proportion was as high as 12 per cent in rural areas and
17 per cent in urban areas among the female unemployed. In case of unemployed
males, it is 7 per cent and 12 per cent in the rural and urban areas, respectively.
The proportion was around two per cent for persons not in the labour force and 2.5
per cent for the employed.
5.5.4 Field of Formal Vocational Training
Field of training signifies the specific area of the training that a person has
obtained in the past and tallies broadly with the specific trade. In the survey, data
in respect of 21 specific areas of trade were collected and the results are presented
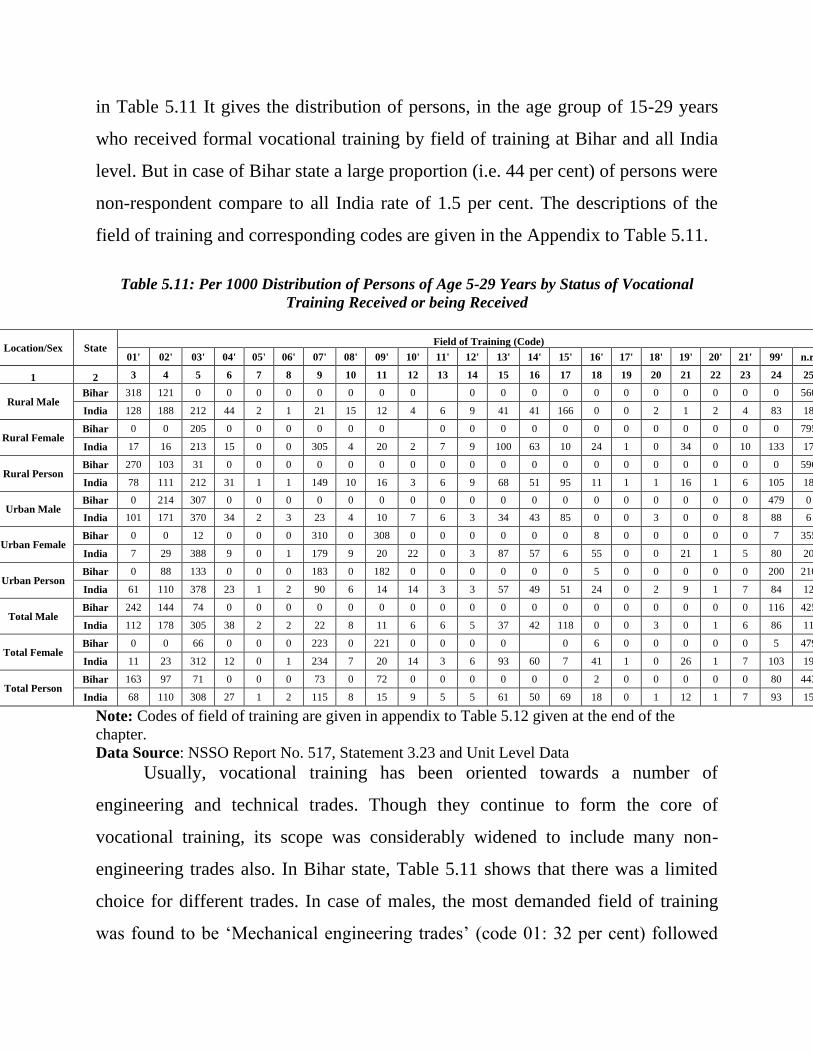
in Table 5.11 It gives the distribution of persons, in the age group of 15-29 years
who received formal vocational training by field of training at Bihar and all India
level. But in case of Bihar state a large proportion (i.e. 44 per cent) of persons were
non-respondent compare to all India rate of 1.5 per cent. The descriptions of the
field of training and corresponding codes are given in the Appendix to Table 5.11.
Table 5.11: Per 1000 Distribution of Persons of Age 5-29 Years by Status of Vocational
Training Received or being Received
Location/Sex State Field of Training (Code)
01' 02' 03' 04' 05' 06' 07' 08' 09' 10' 11' 12' 13' 14' 15' 16' 17' 18' 19' 20' 21' 99' n.r. All
1 2 3 4 5 6 7 8 9 10 11 12 13 14 15 16 17 18 19 20 21 22 23 24 25 26
Rural Male Bihar 318 121 0 0 0 0 0 0 0 0 0 0 0 0 0 0 0 0 0 0 0 560 1000
India 128 188 212 44 2 1 21 15 12 4 6 9 41 41 166 0 0 2 1 2 4 83 18 1000
Rural Female Bihar 0 0 205 0 0 0 0 0 0 0 0 0 0 0 0 0 0 0 0 0 0 795 1000
India 17 16 213 15 0 0 305 4 20 2 7 9 100 63 10 24 1 0 34 0 10 133 17 1000
Rural Person Bihar 270 103 31 0 0 0 0 0 0 0 0 0 0 0 0 0 0 0 0 0 0 0 596 1000
India 78 111 212 31 1 1 149 10 16 3 6 9 68 51 95 11 1 1 16 1 6 105 18 1000
Urban Male Bihar 0 214 307 0 0 0 0 0 0 0 0 0 0 0 0 0 0 0 0 0 0 479 0 1000
India 101 171 370 34 2 3 23 4 10 7 6 3 34 43 85 0 0 3 0 0 8 88 6 1000
Urban Female Bihar 0 0 12 0 0 0 310 0 308 0 0 0 0 0 0 8 0 0 0 0 0 7 355 1000
India 7 29 388 9 0 1 179 9 20 22 0 3 87 57 6 55 0 0 21 1 5 80 20 1000
Urban Person Bihar 0 88 133 0 0 0 183 0 182 0 0 0 0 0 0 5 0 0 0 0 0 200 210 1000
India 61 110 378 23 1 2 90 6 14 14 3 3 57 49 51 24 0 2 9 1 7 84 12 1000
Total Male Bihar 242 144 74 0 0 0 0 0 0 0 0 0 0 0 0 0 0 0 0 0 0 116 425 1000
India 112 178 305 38 2 2 22 8 11 6 6 5 37 42 118 0 0 3 0 1 6 86 11 1000
Total Female Bihar 0 0 66 0 0 0 223 0 221 0 0 0 0 0 6 0 0 0 0 0 5 479 1000
India 11 23 312 12 0 1 234 7 20 14 3 6 93 60 7 41 1 0 26 1 7 103 19 1000
Total Person Bihar 163 97 71 0 0 0 73 0 72 0 0 0 0 0 0 2 0 0 0 0 0 80 443 1000
India 68 110 308 27 1 2 115 8 15 9 5 5 61 50 69 18 0 1 12 1 7 93 15 1000
Note: Codes of field of training are given in appendix to Table 5.12 given at the end of the
chapter.
Data Source: NSSO Report No. 517, Statement 3.23 and Unit Level Data
Usually, vocational training has been oriented towards a number of
engineering and technical trades. Though they continue to form the core of
vocational training, its scope was considerably widened to include many non-
engineering trades also. In Bihar state, Table 5.11 shows that there was a limited
choice for different trades. In case of males, the most demanded field of training
was found to be ‗Mechanical engineering trades‘ (code 01: 32 per cent) followed
by ‗Electrical and electronic engineering trades‘ (code 02: 12 per cent) in the rural
areas; and ‗Computer trades‘ (code 03: 31 per cent) followed by ‗Electrical and
electronic engineering trades‘ (code 02: 21 per cent) in the urban areas. Among
rural female youths, the demand was a little different. About 21 per cent of them,
in the rural areas, the highest proportion among all fields had formal vocational
training in the field of ‗Computer trades‘. Among the urban female youths, the
most important choices in terms of proportions were: ‗Textile related trades‘ and
‗Artisan/Craftsman/Handicraft and cottage based production trades‘. Each of these
two trades had a share of about 31 per cent of total urban females in this age-group.
At all India level for obvious reasons the choice for different trades was
larger in comparison to Bihar. In India, it is observed that for males, the most
demanded field of training was found to be ‗Computer trades‘ (code 03: 21 per
cent) followed by ‗Textile related trades‘ (code 07: 15 per cent), ‗Electrical and
electronic engineering trades‘ (code 02: 11 per cent), ‗driving and motor mechanic
work‘ (code 15: 10 per cent) and ‗Mechanical engineering trades‘ (code 01: 8 per
cent) in the rural areas; and ‗Computer trades‘ (code 03: 38 per cent) followed by
‗Electrical and electronic engineering trades‘ (code 02: 11 per cent) and
‗Mechanical engineering trades‘ (code 01: 6 per cent) in the urban areas. As in case
of Bihar, at all India level also among rural female youths, the demand was a little
different. About 31 per cent of them, in the rural areas, the highest proportion
among all fields had formal vocational training in the field of ‗Textile related
trades‘. This was followed by the ‗Computer trades‘ (code 03: 21 per cent) and
‗Health and paramedical related trades‘ (code 13: 10 per cent). Among the urban
female youths, the most important choices in terms of proportions were:
‗Computer trades‘ (code 03: 39 per cent), Textile related trades‘ (code 07: 18 per
cent) and ‗Health and paramedical related trades‘ (code 13: 9 per cent).
5.5.5 Institution of Formal Vocational Training
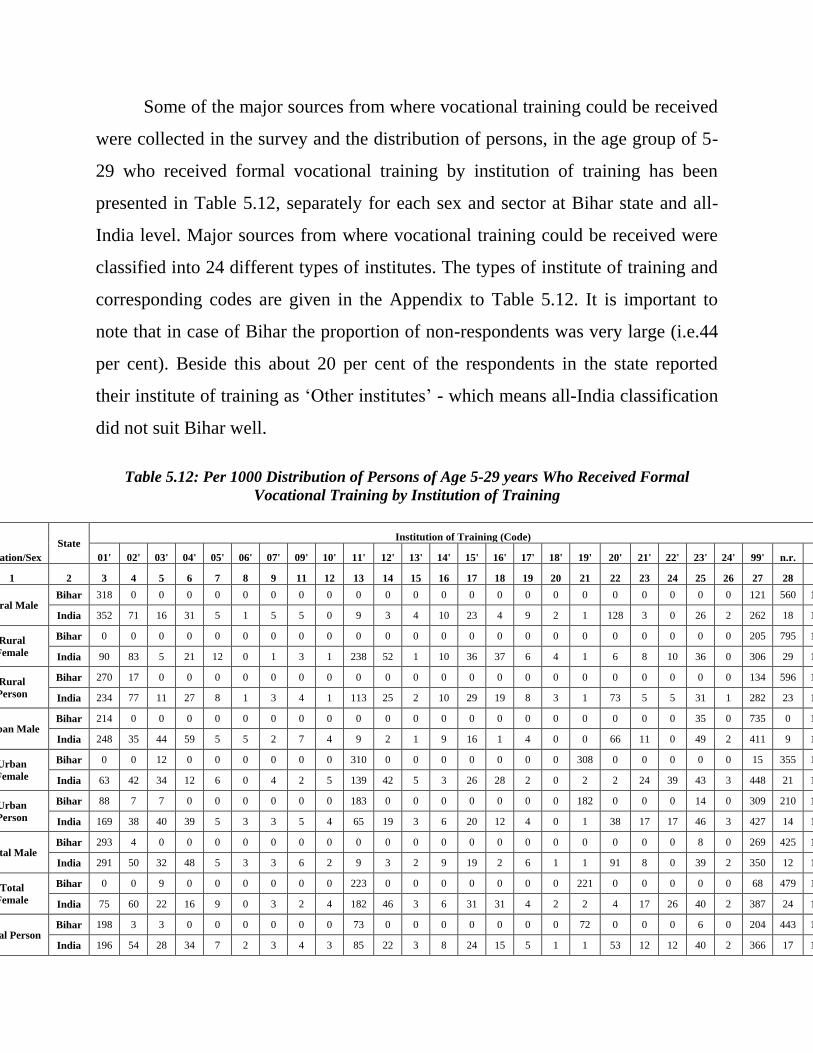
Some of the major sources from where vocational training could be received
were collected in the survey and the distribution of persons, in the age group of 5-
29 who received formal vocational training by institution of training has been
presented in Table 5.12, separately for each sex and sector at Bihar state and all-
India level. Major sources from where vocational training could be received were
classified into 24 different types of institutes. The types of institute of training and
corresponding codes are given in the Appendix to Table 5.12. It is important to
note that in case of Bihar the proportion of non-respondents was very large (i.e.44
per cent). Beside this about 20 per cent of the respondents in the state reported
their institute of training as ‗Other institutes‘ - which means all-India classification
did not suit Bihar well.
Table 5.12: Per 1000 Distribution of Persons of Age 5-29 years Who Received Formal
Vocational Training by Institution of Training
Location/Sex
State Institution of Training (Code)
01' 02' 03' 04' 05' 06' 07' 09' 10' 11' 12' 13' 14' 15' 16' 17' 18' 19' 20' 21' 22' 23' 24' 99' n.r. All
1 2 3 4 5 6 7 8 9 11 12 13 14 15 16 17 18 19 20 21 22 23 24 25 26 27 28 29
Rural Male Bihar 318 0 0 0 0 0 0 0 0 0 0 0 0 0 0 0 0 0 0 0 0 0 0 121 560 1000
India 352 71 16 31 5 1 5 5 0 9 3 4 10 23 4 9 2 1 128 3 0 26 2 262 18 1000
Rural
Female
Bihar 0 0 0 0 0 0 0 0 0 0 0 0 0 0 0 0 0 0 0 0 0 0 0 205 795 1000
India 90 83 5 21 12 0 1 3 1 238 52 1 10 36 37 6 4 1 6 8 10 36 0 306 29 1000
Rural
Person
Bihar 270 17 0 0 0 0 0 0 0 0 0 0 0 0 0 0 0 0 0 0 0 0 0 134 596 1000
India 234 77 11 27 8 1 3 4 1 113 25 2 10 29 19 8 3 1 73 5 5 31 1 282 23 1000
Urban Male Bihar 214 0 0 0 0 0 0 0 0 0 0 0 0 0 0 0 0 0 0 0 0 35 0 735 0 1000
India 248 35 44 59 5 5 2 7 4 9 2 1 9 16 1 4 0 0 66 11 0 49 2 411 9 1000
Urban
Female
Bihar 0 0 12 0 0 0 0 0 0 310 0 0 0 0 0 0 0 308 0 0 0 0 0 15 355 1000
India 63 42 34 12 6 0 4 2 5 139 42 5 3 26 28 2 0 2 2 24 39 43 3 448 21 1000
Urban
Person
Bihar 88 7 7 0 0 0 0 0 0 183 0 0 0 0 0 0 0 182 0 0 0 14 0 309 210 1000
India 169 38 40 39 5 3 3 5 4 65 19 3 6 20 12 4 0 1 38 17 17 46 3 427 14 1000
Total Male Bihar 293 4 0 0 0 0 0 0 0 0 0 0 0 0 0 0 0 0 0 0 0 8 0 269 425 1000
India 291 50 32 48 5 3 3 6 2 9 3 2 9 19 2 6 1 1 91 8 0 39 2 350 12 1000
Total
Female
Bihar 0 0 9 0 0 0 0 0 0 223 0 0 0 0 0 0 0 221 0 0 0 0 0 68 479 1000
India 75 60 22 16 9 0 3 2 4 182 46 3 6 31 31 4 2 2 4 17 26 40 2 387 24 1000
Total Person Bihar 198 3 3 0 0 0 0 0 0 73 0 0 0 0 0 0 0 72 0 0 0 6 0 204 443 1000
India 196 54 28 34 7 2 3 4 3 85 22 3 8 24 15 5 1 1 53 12 12 40 2 366 17 1000
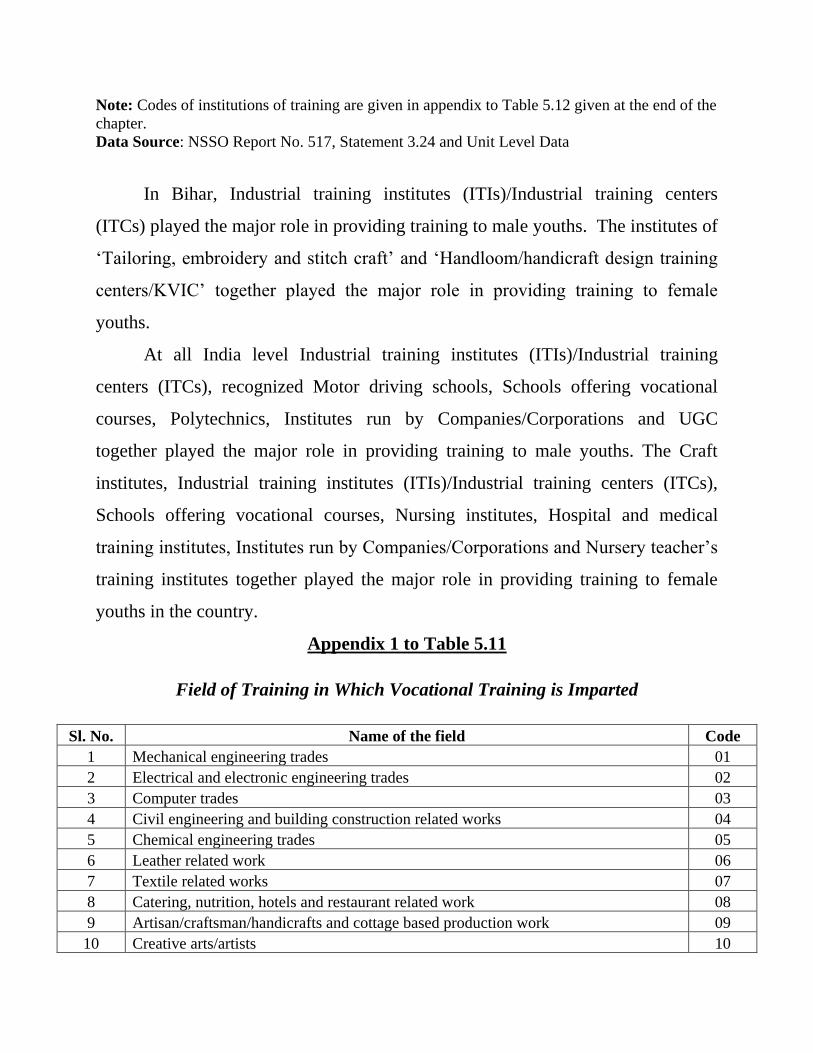
Note: Codes of institutions of training are given in appendix to Table 5.12 given at the end of the
chapter.
Data Source: NSSO Report No. 517, Statement 3.24 and Unit Level Data
In Bihar, Industrial training institutes (ITIs)/Industrial training centers
(ITCs) played the major role in providing training to male youths. The institutes of
‗Tailoring, embroidery and stitch craft‘ and ‗Handloom/handicraft design training
centers/KVIC‘ together played the major role in providing training to female
youths.
At all India level Industrial training institutes (ITIs)/Industrial training
centers (ITCs), recognized Motor driving schools, Schools offering vocational
courses, Polytechnics, Institutes run by Companies/Corporations and UGC
together played the major role in providing training to male youths. The Craft
institutes, Industrial training institutes (ITIs)/Industrial training centers (ITCs),
Schools offering vocational courses, Nursing institutes, Hospital and medical
training institutes, Institutes run by Companies/Corporations and Nursery teacher‘s
training institutes together played the major role in providing training to female
youths in the country.
Appendix 1 to Table 5.11
Field of Training in Which Vocational Training is Imparted
Sl. No. Name of the field Code
1 Mechanical engineering trades 01
2 Electrical and electronic engineering trades 02
3 Computer trades 03
4 Civil engineering and building construction related works 04
5 Chemical engineering trades 05
6 Leather related work 06
7 Textile related works 07
8 Catering, nutrition, hotels and restaurant related work 08
9 Artisan/craftsman/handicrafts and cottage based production work 09
10 Creative arts/artists 10
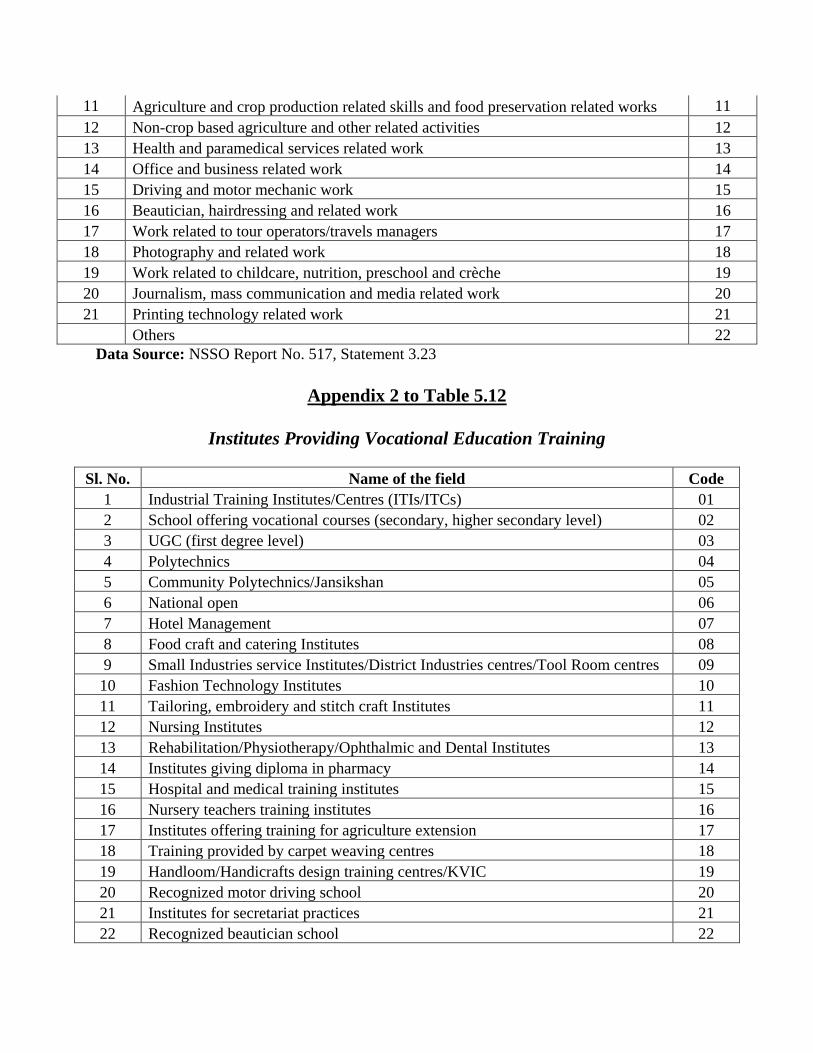
11 Agriculture and crop production related skills and food preservation related works 11
12 Non-crop based agriculture and other related activities 12
13 Health and paramedical services related work 13
14 Office and business related work 14
15 Driving and motor mechanic work 15
16 Beautician, hairdressing and related work 16
17 Work related to tour operators/travels managers 17
18 Photography and related work 18
19 Work related to childcare, nutrition, preschool and crèche 19
20 Journalism, mass communication and media related work 20
21 Printing technology related work 21
Others 22
Data Source: NSSO Report No. 517, Statement 3.23
Appendix 2 to Table 5.12
Institutes Providing Vocational Education Training
Sl. No. Name of the field Code
1 Industrial Training Institutes/Centres (ITIs/ITCs) 01
2 School offering vocational courses (secondary, higher secondary level) 02
3 UGC (first degree level) 03
4 Polytechnics 04
5 Community Polytechnics/Jansikshan 05
6 National open 06
7 Hotel Management 07
8 Food craft and catering Institutes 08
9 Small Industries service Institutes/District Industries centres/Tool Room centres 09
10 Fashion Technology Institutes 10
11 Tailoring, embroidery and stitch craft Institutes 11
12 Nursing Institutes 12
13 Rehabilitation/Physiotherapy/Ophthalmic and Dental Institutes 13
14 Institutes giving diploma in pharmacy 14
15 Hospital and medical training institutes 15
16 Nursery teachers training institutes 16
17 Institutes offering training for agriculture extension 17
18 Training provided by carpet weaving centres 18
19 Handloom/Handicrafts design training centres/KVIC 19
20 Recognized motor driving school 20
21 Institutes for secretariat practices 21
22 Recognized beautician school 22
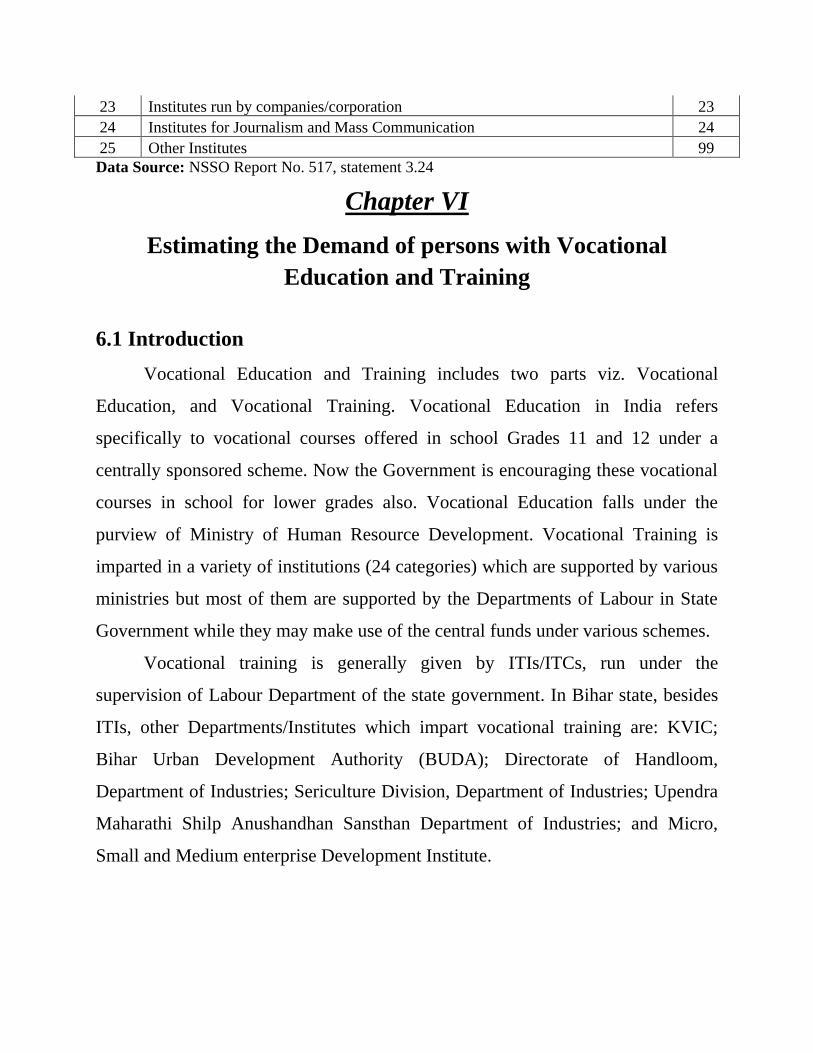
23 Institutes run by companies/corporation 23
24 Institutes for Journalism and Mass Communication 24
25 Other Institutes 99
Data Source: NSSO Report No. 517, statement 3.24
Chapter VI
Estimating the Demand of persons with Vocational
Education and Training
6.1 Introduction
Vocational Education and Training includes two parts viz. Vocational
Education, and Vocational Training. Vocational Education in India refers
specifically to vocational courses offered in school Grades 11 and 12 under a
centrally sponsored scheme. Now the Government is encouraging these vocational
courses in school for lower grades also. Vocational Education falls under the
purview of Ministry of Human Resource Development. Vocational Training is
imparted in a variety of institutions (24 categories) which are supported by various
ministries but most of them are supported by the Departments of Labour in State
Government while they may make use of the central funds under various schemes.
Vocational training is generally given by ITIs/ITCs, run under the
supervision of Labour Department of the state government. In Bihar state, besides
ITIs, other Departments/Institutes which impart vocational training are: KVIC;
Bihar Urban Development Authority (BUDA); Directorate of Handloom,
Department of Industries; Sericulture Division, Department of Industries; Upendra
Maharathi Shilp Anushandhan Sansthan Department of Industries; and Micro,
Small and Medium enterprise Development Institute.
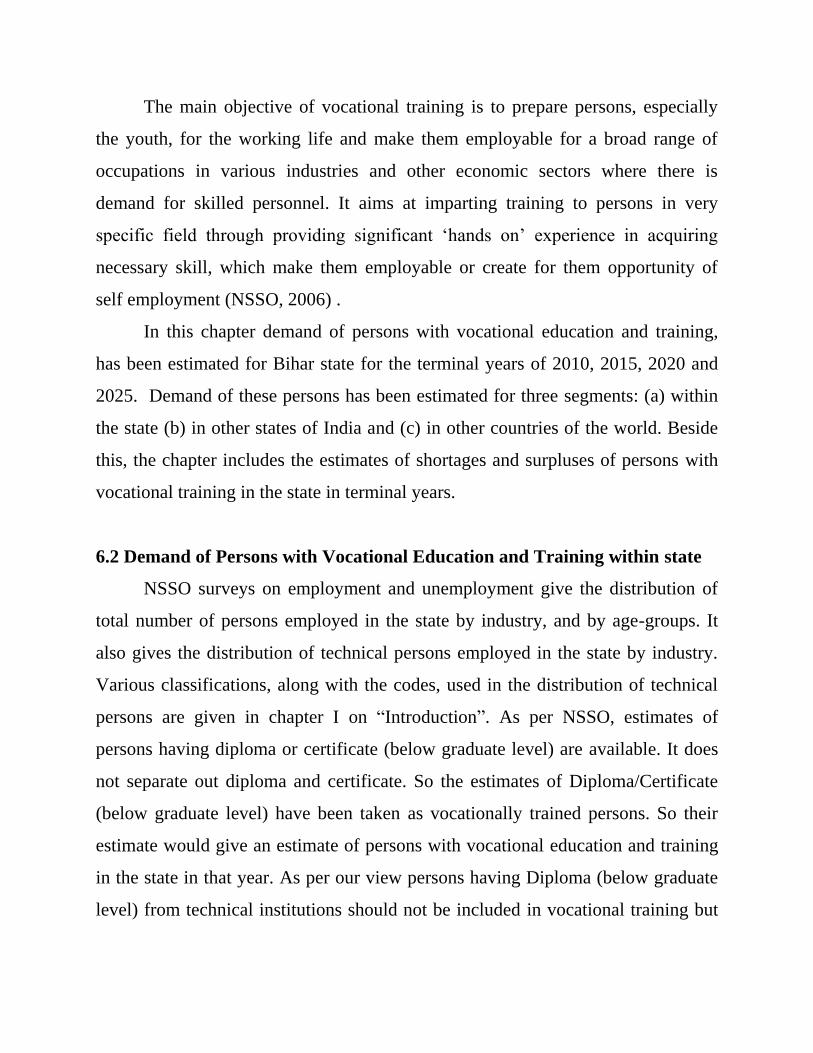
The main objective of vocational training is to prepare persons, especially
the youth, for the working life and make them employable for a broad range of
occupations in various industries and other economic sectors where there is
demand for skilled personnel. It aims at imparting training to persons in very
specific field through providing significant ‗hands on‘ experience in acquiring
necessary skill, which make them employable or create for them opportunity of
self employment (NSSO, 2006) .
In this chapter demand of persons with vocational education and training,
has been estimated for Bihar state for the terminal years of 2010, 2015, 2020 and
2025. Demand of these persons has been estimated for three segments: (a) within
the state (b) in other states of India and (c) in other countries of the world. Beside
this, the chapter includes the estimates of shortages and surpluses of persons with
vocational training in the state in terminal years.
6.2 Demand of Persons with Vocational Education and Training within state
NSSO surveys on employment and unemployment give the distribution of
total number of persons employed in the state by industry, and by age-groups. It
also gives the distribution of technical persons employed in the state by industry.
Various classifications, along with the codes, used in the distribution of technical
persons are given in chapter I on ―Introduction‖. As per NSSO, estimates of
persons having diploma or certificate (below graduate level) are available. It does
not separate out diploma and certificate. So the estimates of Diploma/Certificate
(below graduate level) have been taken as vocationally trained persons. So their
estimate would give an estimate of persons with vocational education and training
in the state in that year. As per our view persons having Diploma (below graduate
level) from technical institutions should not be included in vocational training but
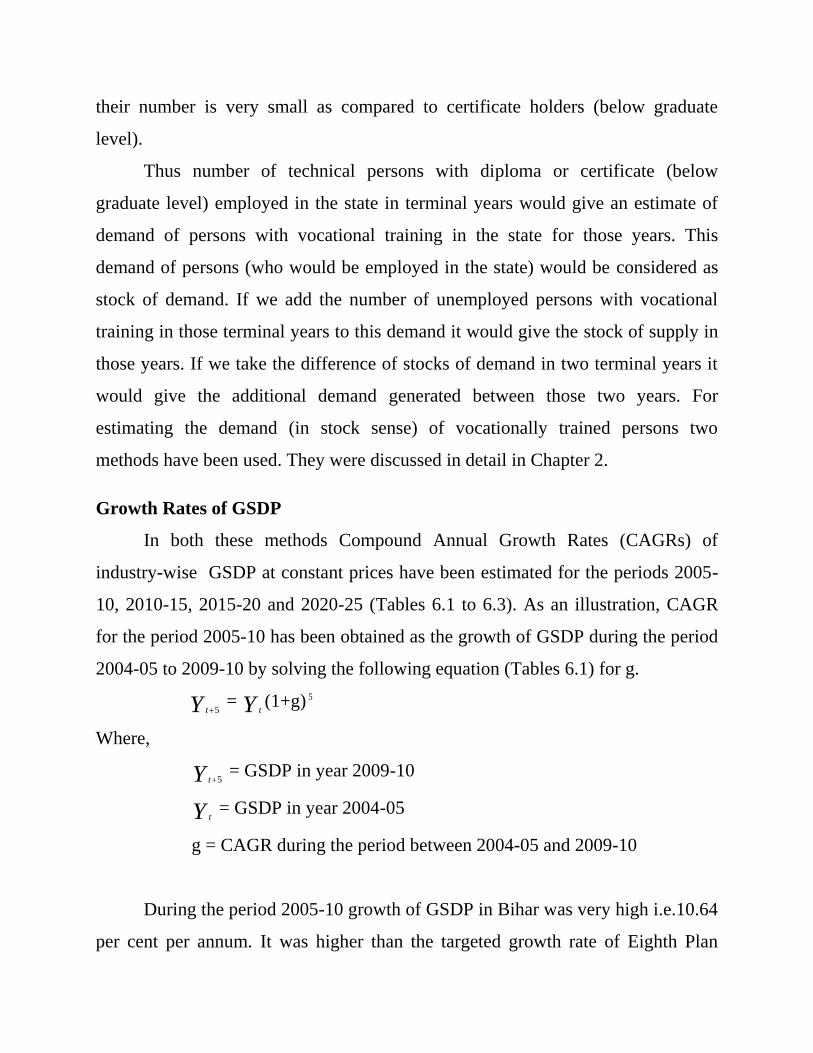
their number is very small as compared to certificate holders (below graduate
level).
Thus number of technical persons with diploma or certificate (below
graduate level) employed in the state in terminal years would give an estimate of
demand of persons with vocational training in the state for those years. This
demand of persons (who would be employed in the state) would be considered as
stock of demand. If we add the number of unemployed persons with vocational
training in those terminal years to this demand it would give the stock of supply in
those years. If we take the difference of stocks of demand in two terminal years it
would give the additional demand generated between those two years. For
estimating the demand (in stock sense) of vocationally trained persons two
methods have been used. They were discussed in detail in Chapter 2.
Growth Rates of GSDP
In both these methods Compound Annual Growth Rates (CAGRs) of
industry-wise GSDP at constant prices have been estimated for the periods 2005-
10, 2010-15, 2015-20 and 2020-25 (Tables 6.1 to 6.3). As an illustration, CAGR
for the period 2005-10 has been obtained as the growth of GSDP during the period
2004-05 to 2009-10 by solving the following equation (Tables 6.1) for g.
Y t 5 = Y t
(1+g) 5
Where,
Y t 5 = GSDP in year 2009-10
Y t = GSDP in year 2004-05
g = CAGR during the period between 2004-05 and 2009-10
During the period 2005-10 growth of GSDP in Bihar was very high i.e.10.64
per cent per annum. It was higher than the targeted growth rate of Eighth Plan
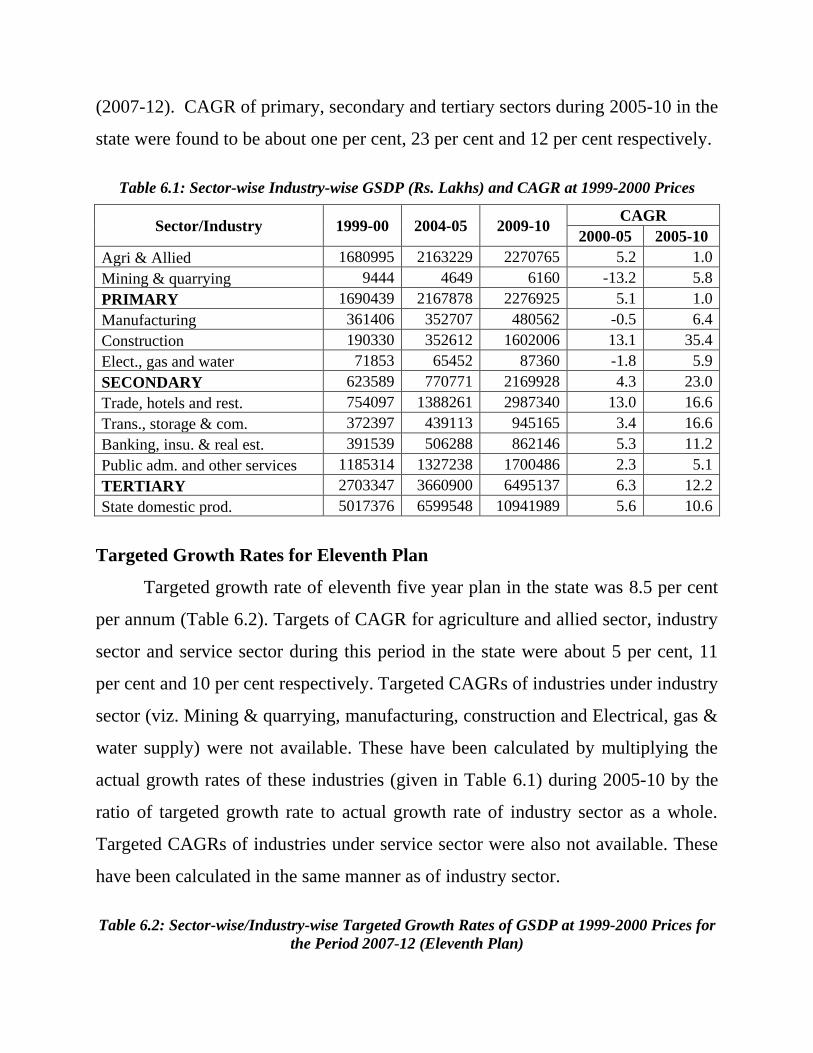
(2007-12). CAGR of primary, secondary and tertiary sectors during 2005-10 in the
state were found to be about one per cent, 23 per cent and 12 per cent respectively.
Table 6.1: Sector-wise Industry-wise GSDP (Rs. Lakhs) and CAGR at 1999-2000 Prices
Sector/Industry 1999-00 2004-05 2009-10 CAGR
2000-05 2005-10
Agri & Allied 1680995 2163229 2270765 5.2 1.0
Mining & quarrying 9444 4649 6160 -13.2 5.8
PRIMARY 1690439 2167878 2276925 5.1 1.0
Manufacturing 361406 352707 480562 -0.5 6.4
Construction 190330 352612 1602006 13.1 35.4
Elect., gas and water 71853 65452 87360 -1.8 5.9
SECONDARY 623589 770771 2169928 4.3 23.0
Trade, hotels and rest. 754097 1388261 2987340 13.0 16.6
Trans., storage & com. 372397 439113 945165 3.4 16.6
Banking, insu. & real est. 391539 506288 862146 5.3 11.2
Public adm. and other services 1185314 1327238 1700486 2.3 5.1
TERTIARY 2703347 3660900 6495137 6.3 12.2
State domestic prod. 5017376 6599548 10941989 5.6 10.6
Targeted Growth Rates for Eleventh Plan
Targeted growth rate of eleventh five year plan in the state was 8.5 per cent
per annum (Table 6.2). Targets of CAGR for agriculture and allied sector, industry
sector and service sector during this period in the state were about 5 per cent, 11
per cent and 10 per cent respectively. Targeted CAGRs of industries under industry
sector (viz. Mining & quarrying, manufacturing, construction and Electrical, gas &
water supply) were not available. These have been calculated by multiplying the
actual growth rates of these industries (given in Table 6.1) during 2005-10 by the
ratio of targeted growth rate to actual growth rate of industry sector as a whole.
Targeted CAGRs of industries under service sector were also not available. These
have been calculated in the same manner as of industry sector.
Table 6.2: Sector-wise/Industry-wise Targeted Growth Rates of GSDP at 1999-2000 Prices for
the Period 2007-12 (Eleventh Plan)
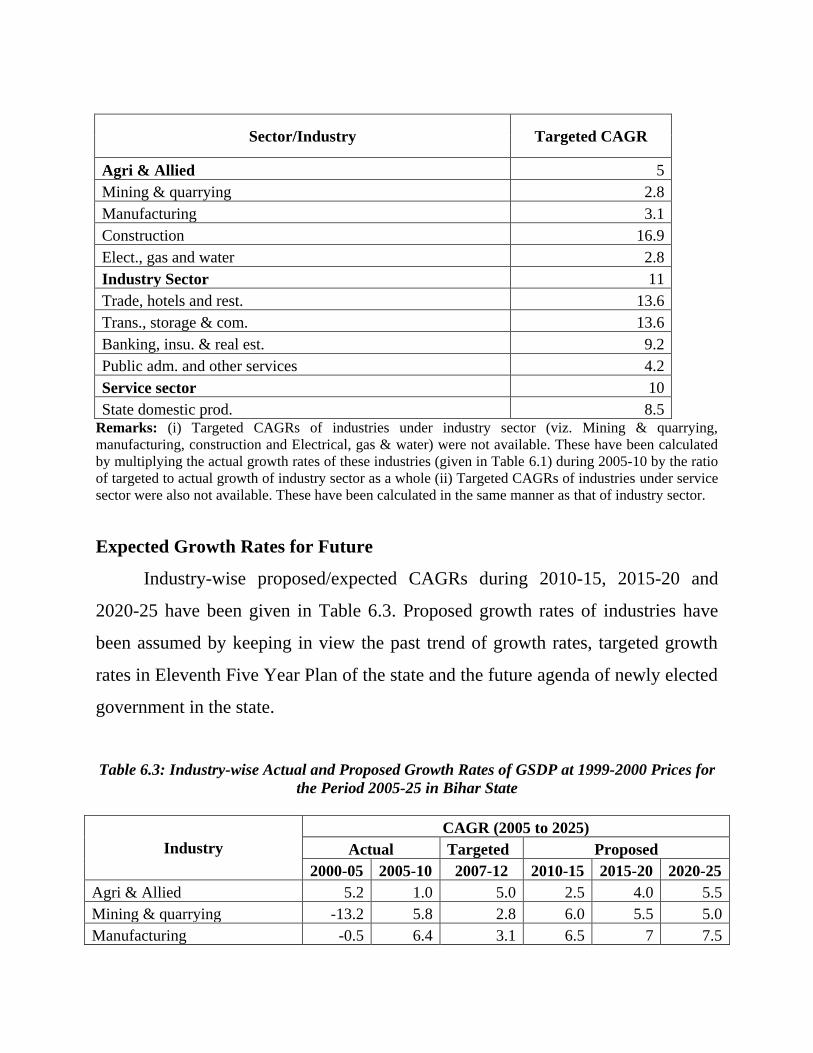
Sector/Industry Targeted CAGR
Agri & Allied 5
Mining & quarrying 2.8
Manufacturing 3.1
Construction 16.9
Elect., gas and water 2.8
Industry Sector 11
Trade, hotels and rest. 13.6
Trans., storage & com. 13.6
Banking, insu. & real est. 9.2
Public adm. and other services 4.2
Service sector 10
State domestic prod. 8.5 Remarks: (i) Targeted CAGRs of industries under industry sector (viz. Mining & quarrying,
manufacturing, construction and Electrical, gas & water) were not available. These have been calculated
by multiplying the actual growth rates of these industries (given in Table 6.1) during 2005-10 by the ratio
of targeted to actual growth of industry sector as a whole (ii) Targeted CAGRs of industries under service
sector were also not available. These have been calculated in the same manner as that of industry sector.
Expected Growth Rates for Future
Industry-wise proposed/expected CAGRs during 2010-15, 2015-20 and
2020-25 have been given in Table 6.3. Proposed growth rates of industries have
been assumed by keeping in view the past trend of growth rates, targeted growth
rates in Eleventh Five Year Plan of the state and the future agenda of newly elected
government in the state.
Table 6.3: Industry-wise Actual and Proposed Growth Rates of GSDP at 1999-2000 Prices for
the Period 2005-25 in Bihar State
Industry
CAGR (2005 to 2025)
Actual Targeted Proposed
2000-05 2005-10 2007-12 2010-15 2015-20 2020-25
Agri & Allied 5.2 1.0 5.0 2.5 4.0 5.5
Mining & quarrying -13.2 5.8 2.8 6.0 5.5 5.0
Manufacturing -0.5 6.4 3.1 6.5 7 7.5
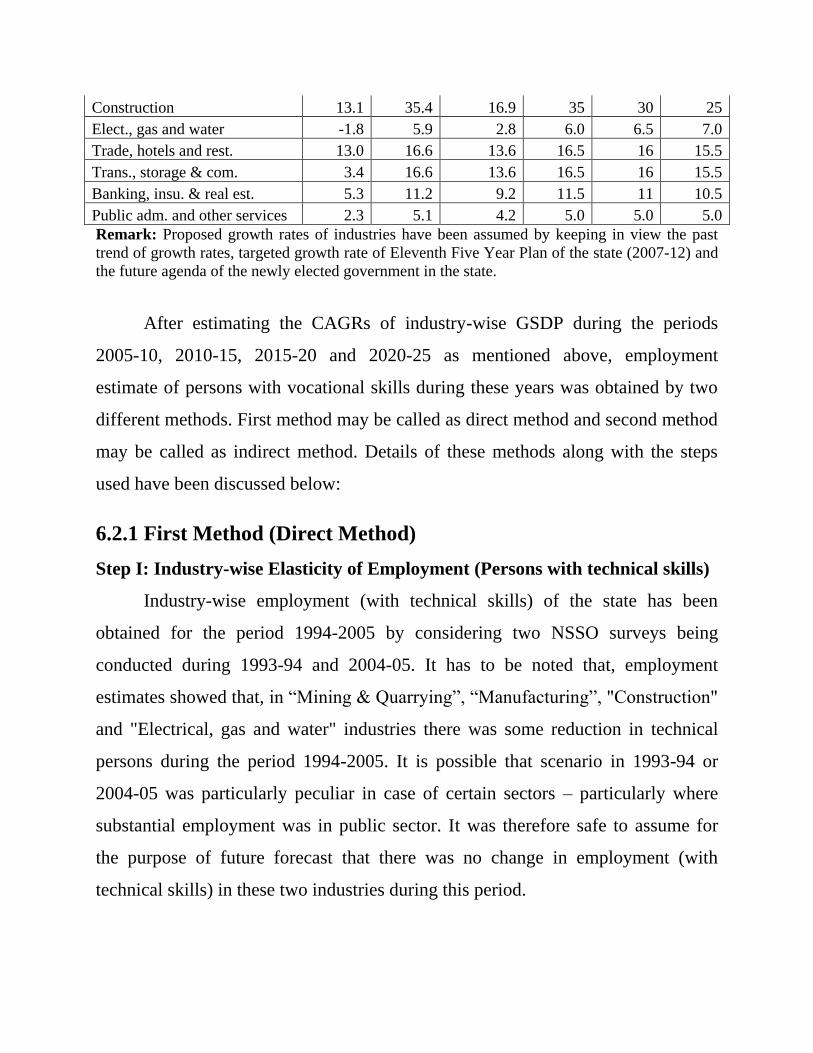
Construction 13.1 35.4 16.9 35 30 25
Elect., gas and water -1.8 5.9 2.8 6.0 6.5 7.0
Trade, hotels and rest. 13.0 16.6 13.6 16.5 16 15.5
Trans., storage & com. 3.4 16.6 13.6 16.5 16 15.5
Banking, insu. & real est. 5.3 11.2 9.2 11.5 11 10.5
Public adm. and other services 2.3 5.1 4.2 5.0 5.0 5.0
Remark: Proposed growth rates of industries have been assumed by keeping in view the past
trend of growth rates, targeted growth rate of Eleventh Five Year Plan of the state (2007-12) and
the future agenda of the newly elected government in the state.
After estimating the CAGRs of industry-wise GSDP during the periods
2005-10, 2010-15, 2015-20 and 2020-25 as mentioned above, employment
estimate of persons with vocational skills during these years was obtained by two
different methods. First method may be called as direct method and second method
may be called as indirect method. Details of these methods along with the steps
used have been discussed below:
6.2.1 First Method (Direct Method)
Step I: Industry-wise Elasticity of Employment (Persons with technical skills)
Industry-wise employment (with technical skills) of the state has been
obtained for the period 1994-2005 by considering two NSSO surveys being
conducted during 1993-94 and 2004-05. It has to be noted that, employment
estimates showed that, in ―Mining & Quarrying‖, ―Manufacturing‖, "Construction"
and "Electrical, gas and water" industries there was some reduction in technical
persons during the period 1994-2005. It is possible that scenario in 1993-94 or
2004-05 was particularly peculiar in case of certain sectors – particularly where
substantial employment was in public sector. It was therefore safe to assume for
the purpose of future forecast that there was no change in employment (with
technical skills) in these two industries during this period.
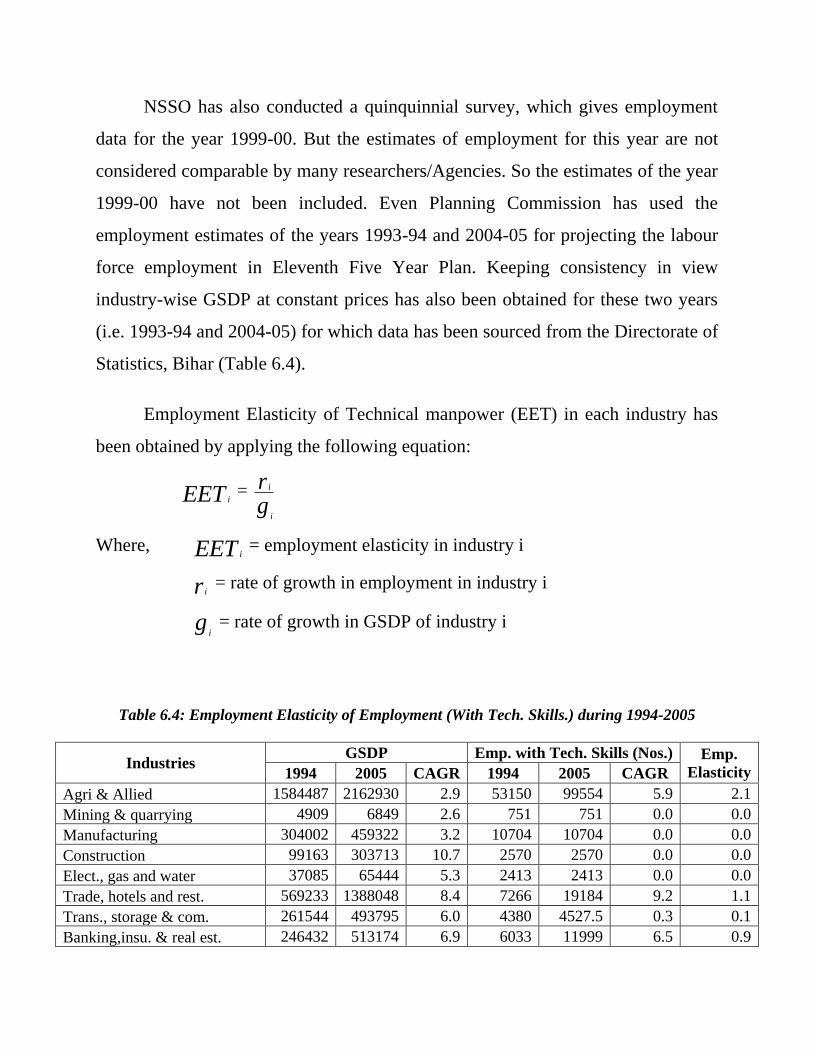
NSSO has also conducted a quinquinnial survey, which gives employment
data for the year 1999-00. But the estimates of employment for this year are not
considered comparable by many researchers/Agencies. So the estimates of the year
1999-00 have not been included. Even Planning Commission has used the
employment estimates of the years 1993-94 and 2004-05 for projecting the labour
force employment in Eleventh Five Year Plan. Keeping consistency in view
industry-wise GSDP at constant prices has also been obtained for these two years
(i.e. 1993-94 and 2004-05) for which data has been sourced from the Directorate of
Statistics, Bihar (Table 6.4).
Employment Elasticity of Technical manpower (EET) in each industry has
been obtained by applying the following equation:
EET i =
gr
i
i
Where, EET i = employment elasticity in industry i
r i = rate of growth in employment in industry i
gi = rate of growth in GSDP of industry i
Table 6.4: Employment Elasticity of Employment (With Tech. Skills.) during 1994-2005
Industries GSDP Emp. with Tech. Skills (Nos.) Emp.
Elasticity 1994 2005 CAGR 1994 2005 CAGR
Agri & Allied 1584487 2162930 2.9 53150 99554 5.9 2.1
Mining & quarrying 4909 6849 2.6 751 751 0.0 0.0
Manufacturing 304002 459322 3.2 10704 10704 0.0 0.0
Construction 99163 303713 10.7 2570 2570 0.0 0.0
Elect., gas and water 37085 65444 5.3 2413 2413 0.0 0.0
Trade, hotels and rest. 569233 1388048 8.4 7266 19184 9.2 1.1
Trans., storage & com. 261544 493795 6.0 4380 4527.5 0.3 0.1
Banking,insu. & real est. 246432 513174 6.9 6033 11999 6.5 0.9
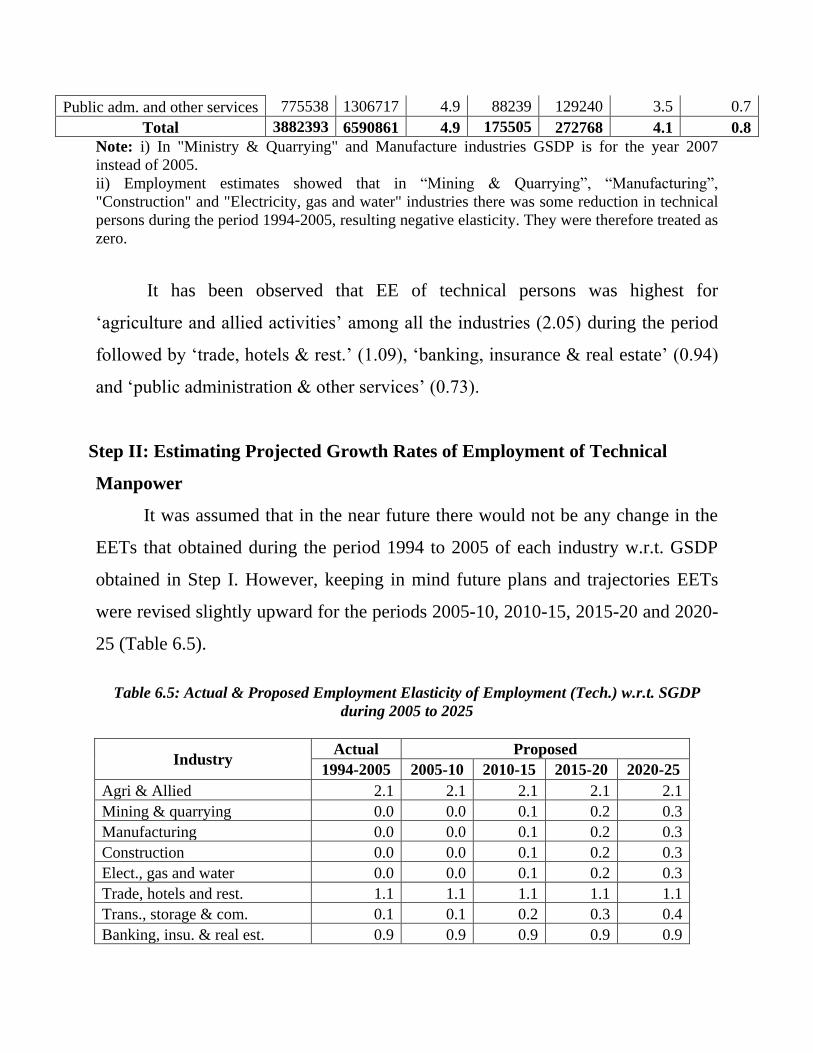
Public adm. and other services 775538 1306717 4.9 88239 129240 3.5 0.7
Total 3882393 6590861 4.9 175505 272768 4.1 0.8
Note: i) In "Ministry & Quarrying" and Manufacture industries GSDP is for the year 2007
instead of 2005.
ii) Employment estimates showed that in ―Mining & Quarrying‖, ―Manufacturing‖,
"Construction" and "Electricity, gas and water" industries there was some reduction in technical
persons during the period 1994-2005, resulting negative elasticity. They were therefore treated as
zero.
It has been observed that EE of technical persons was highest for
‗agriculture and allied activities‘ among all the industries (2.05) during the period
followed by ‗trade, hotels & rest.‘ (1.09), ‗banking, insurance & real estate‘ (0.94)
and ‗public administration & other services‘ (0.73).
Step II: Estimating Projected Growth Rates of Employment of Technical
Manpower
It was assumed that in the near future there would not be any change in the
EETs that obtained during the period 1994 to 2005 of each industry w.r.t. GSDP
obtained in Step I. However, keeping in mind future plans and trajectories EETs
were revised slightly upward for the periods 2005-10, 2010-15, 2015-20 and 2020-
25 (Table 6.5).
Table 6.5: Actual & Proposed Employment Elasticity of Employment (Tech.) w.r.t. SGDP
during 2005 to 2025
Industry Actual Proposed
1994-2005 2005-10 2010-15 2015-20 2020-25
Agri & Allied 2.1 2.1 2.1 2.1 2.1
Mining & quarrying 0.0 0.0 0.1 0.2 0.3
Manufacturing 0.0 0.0 0.1 0.2 0.3
Construction 0.0 0.0 0.1 0.2 0.3
Elect., gas and water 0.0 0.0 0.1 0.2 0.3
Trade, hotels and rest. 1.1 1.1 1.1 1.1 1.1
Trans., storage & com. 0.1 0.1 0.2 0.3 0.4
Banking, insu. & real est. 0.9 0.9 0.9 0.9 0.9
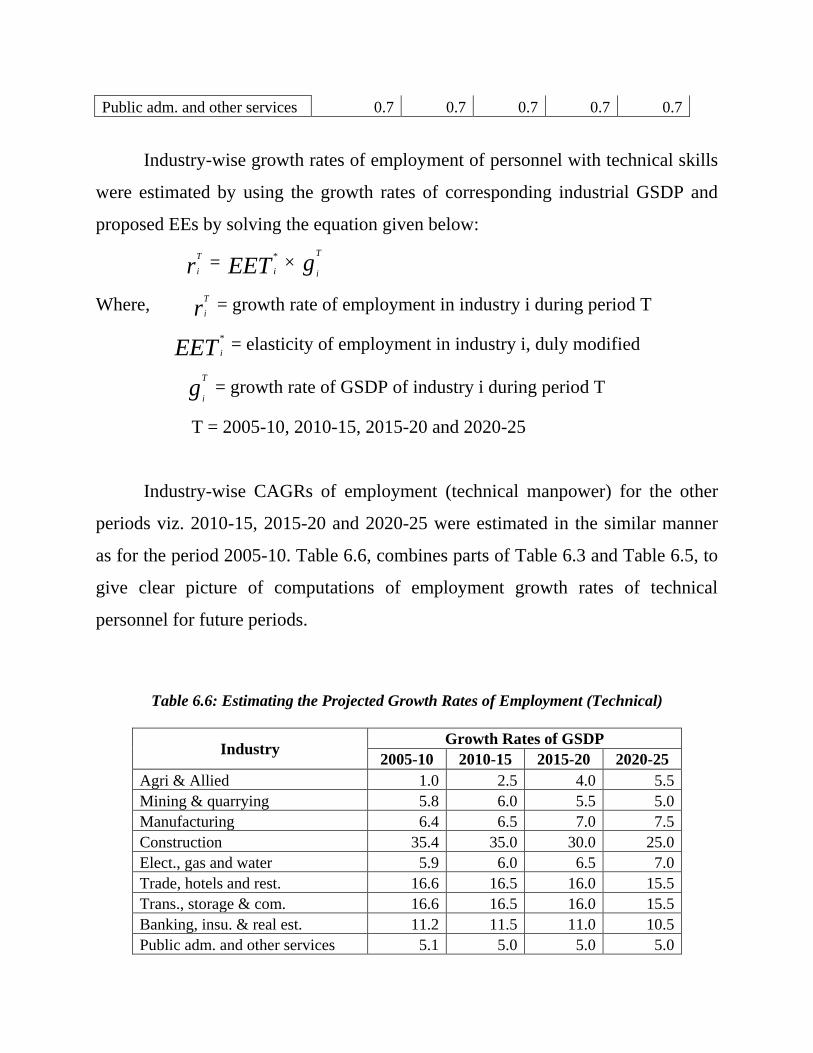
Public adm. and other services 0.7 0.7 0.7 0.7 0.7
Industry-wise growth rates of employment of personnel with technical skills
were estimated by using the growth rates of corresponding industrial GSDP and
proposed EEs by solving the equation given below:
rT
i = EET i
* × g
T
i
Where, rT
i = growth rate of employment in industry i during period T
EET i
* = elasticity of employment in industry i, duly modified
gT
i = growth rate of GSDP of industry i during period T
T = 2005-10, 2010-15, 2015-20 and 2020-25
Industry-wise CAGRs of employment (technical manpower) for the other
periods viz. 2010-15, 2015-20 and 2020-25 were estimated in the similar manner
as for the period 2005-10. Table 6.6, combines parts of Table 6.3 and Table 6.5, to
give clear picture of computations of employment growth rates of technical
personnel for future periods.
Table 6.6: Estimating the Projected Growth Rates of Employment (Technical)
Industry Growth Rates of GSDP
2005-10 2010-15 2015-20 2020-25
Agri & Allied 1.0 2.5 4.0 5.5
Mining & quarrying 5.8 6.0 5.5 5.0
Manufacturing 6.4 6.5 7.0 7.5
Construction 35.4 35.0 30.0 25.0
Elect., gas and water 5.9 6.0 6.5 7.0
Trade, hotels and rest. 16.6 16.5 16.0 15.5
Trans., storage & com. 16.6 16.5 16.0 15.5
Banking, insu. & real est. 11.2 11.5 11.0 10.5
Public adm. and other services 5.1 5.0 5.0 5.0
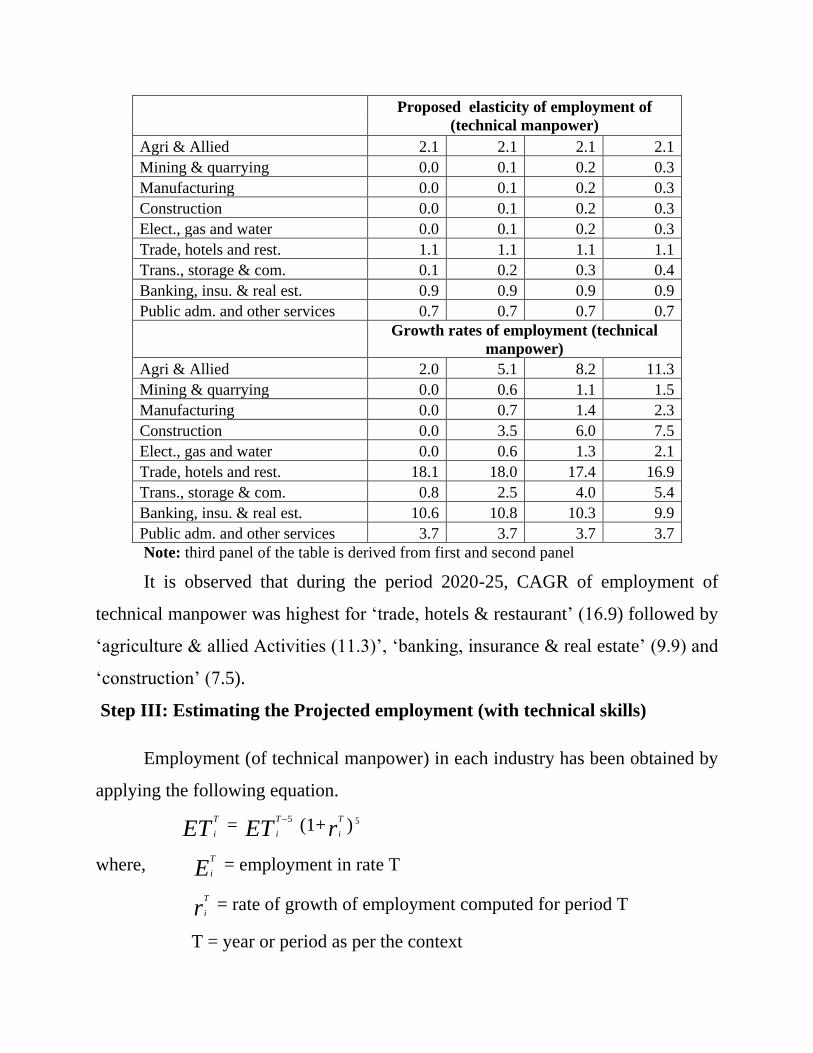
Proposed elasticity of employment of
(technical manpower)
Agri & Allied 2.1 2.1 2.1 2.1
Mining & quarrying 0.0 0.1 0.2 0.3
Manufacturing 0.0 0.1 0.2 0.3
Construction 0.0 0.1 0.2 0.3
Elect., gas and water 0.0 0.1 0.2 0.3
Trade, hotels and rest. 1.1 1.1 1.1 1.1
Trans., storage & com. 0.1 0.2 0.3 0.4
Banking, insu. & real est. 0.9 0.9 0.9 0.9
Public adm. and other services 0.7 0.7 0.7 0.7
Growth rates of employment (technical
manpower)
Agri & Allied 2.0 5.1 8.2 11.3
Mining & quarrying 0.0 0.6 1.1 1.5
Manufacturing 0.0 0.7 1.4 2.3
Construction 0.0 3.5 6.0 7.5
Elect., gas and water 0.0 0.6 1.3 2.1
Trade, hotels and rest. 18.1 18.0 17.4 16.9
Trans., storage & com. 0.8 2.5 4.0 5.4
Banking, insu. & real est. 10.6 10.8 10.3 9.9
Public adm. and other services 3.7 3.7 3.7 3.7
Note: third panel of the table is derived from first and second panel
It is observed that during the period 2020-25, CAGR of employment of
technical manpower was highest for ‗trade, hotels & restaurant‘ (16.9) followed by
‗agriculture & allied Activities (11.3)‘, ‗banking, insurance & real estate‘ (9.9) and
‗construction‘ (7.5).
Step III: Estimating the Projected employment (with technical skills)
Employment (of technical manpower) in each industry has been obtained by
applying the following equation.
ETT
i = ET
T
i
5 (1+r
T
i) 5
where, ET
i = employment in rate T
rT
i = rate of growth of employment computed for period T
T = year or period as per the context
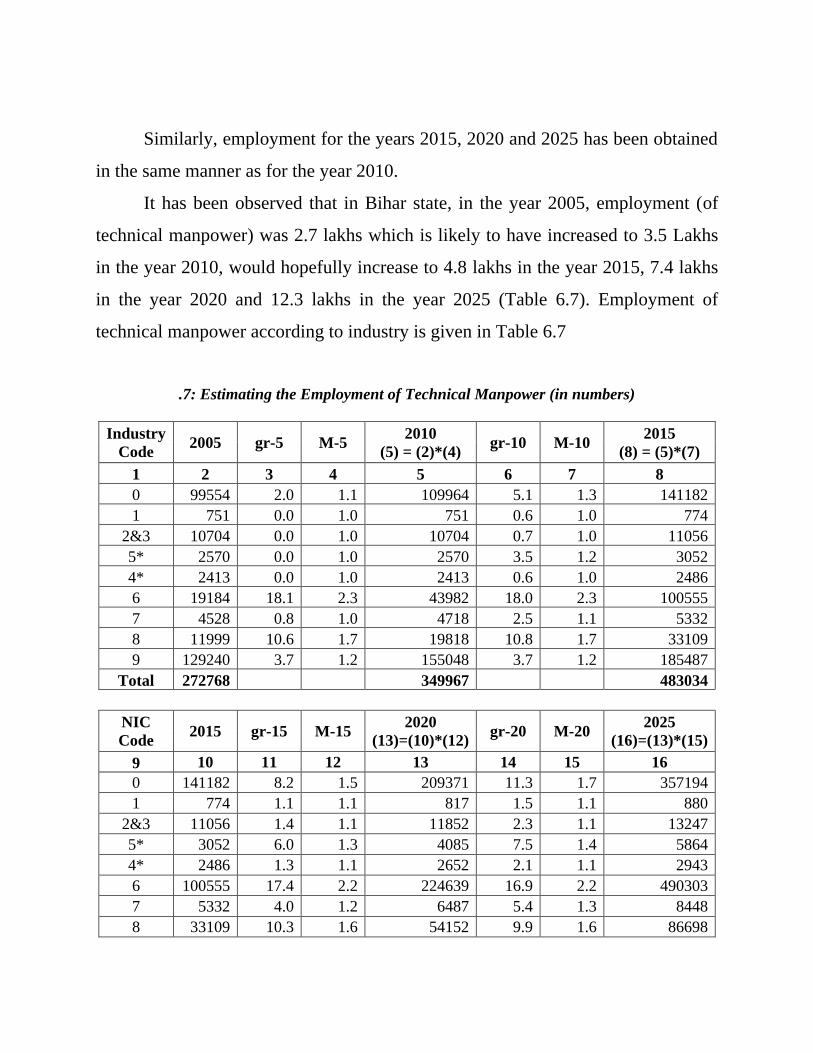
Similarly, employment for the years 2015, 2020 and 2025 has been obtained
in the same manner as for the year 2010.
It has been observed that in Bihar state, in the year 2005, employment (of
technical manpower) was 2.7 lakhs which is likely to have increased to 3.5 Lakhs
in the year 2010, would hopefully increase to 4.8 lakhs in the year 2015, 7.4 lakhs
in the year 2020 and 12.3 lakhs in the year 2025 (Table 6.7). Employment of
technical manpower according to industry is given in Table 6.7
.7: Estimating the Employment of Technical Manpower (in numbers)
Industry
Code 2005 gr-5 M-5
2010
(5) = (2)*(4) gr-10 M-10
2015
(8) = (5)*(7)
1 2 3 4 5 6 7 8
0 99554 2.0 1.1 109964 5.1 1.3 141182
1 751 0.0 1.0 751 0.6 1.0 774
2&3 10704 0.0 1.0 10704 0.7 1.0 11056
5* 2570 0.0 1.0 2570 3.5 1.2 3052
4* 2413 0.0 1.0 2413 0.6 1.0 2486
6 19184 18.1 2.3 43982 18.0 2.3 100555
7 4528 0.8 1.0 4718 2.5 1.1 5332
8 11999 10.6 1.7 19818 10.8 1.7 33109
9 129240 3.7 1.2 155048 3.7 1.2 185487
Total 272768 349967 483034
NIC
Code 2015 gr-15 M-15
2020
(13)=(10)*(12) gr-20 M-20
2025
(16)=(13)*(15)
9 10 11 12 13 14 15 16
0 141182 8.2 1.5 209371 11.3 1.7 357194
1 774 1.1 1.1 817 1.5 1.1 880
2&3 11056 1.4 1.1 11852 2.3 1.1 13247
5* 3052 6.0 1.3 4085 7.5 1.4 5864
4* 2486 1.3 1.1 2652 2.1 1.1 2943
6 100555 17.4 2.2 224639 16.9 2.2 490303
7 5332 4.0 1.2 6487 5.4 1.3 8448
8 33109 10.3 1.6 54152 9.9 1.6 86698
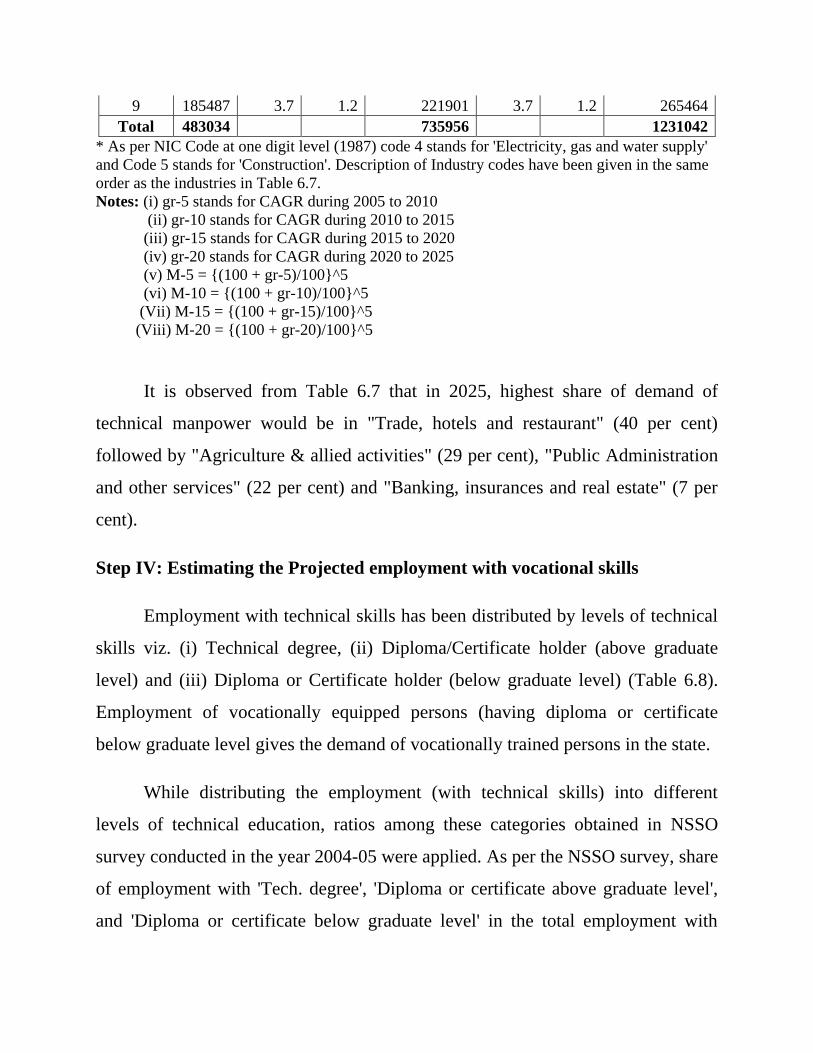
9 185487 3.7 1.2 221901 3.7 1.2 265464
Total 483034 735956 1231042
* As per NIC Code at one digit level (1987) code 4 stands for 'Electricity, gas and water supply'
and Code 5 stands for 'Construction'. Description of Industry codes have been given in the same
order as the industries in Table 6.7.
Notes: (i) gr-5 stands for CAGR during 2005 to 2010
(ii) gr-10 stands for CAGR during 2010 to 2015
(iii) gr-15 stands for CAGR during 2015 to 2020
(iv) gr-20 stands for CAGR during 2020 to 2025
(v) M-5 = {(100 + gr-5)/100}^5
(vi) M-10 = {(100 + gr-10)/100}^5
(Vii) M-15 = {(100 + gr-15)/100}^5
(Viii) M-20 = {(100 + gr-20)/100}^5
It is observed from Table 6.7 that in 2025, highest share of demand of
technical manpower would be in "Trade, hotels and restaurant" (40 per cent)
followed by "Agriculture & allied activities" (29 per cent), "Public Administration
and other services" (22 per cent) and "Banking, insurances and real estate" (7 per
cent).
Step IV: Estimating the Projected employment with vocational skills
Employment with technical skills has been distributed by levels of technical
skills viz. (i) Technical degree, (ii) Diploma/Certificate holder (above graduate
level) and (iii) Diploma or Certificate holder (below graduate level) (Table 6.8).
Employment of vocationally equipped persons (having diploma or certificate
below graduate level gives the demand of vocationally trained persons in the state.
While distributing the employment (with technical skills) into different
levels of technical education, ratios among these categories obtained in NSSO
survey conducted in the year 2004-05 were applied. As per the NSSO survey, share
of employment with 'Tech. degree', 'Diploma or certificate above graduate level',
and 'Diploma or certificate below graduate level' in the total employment with
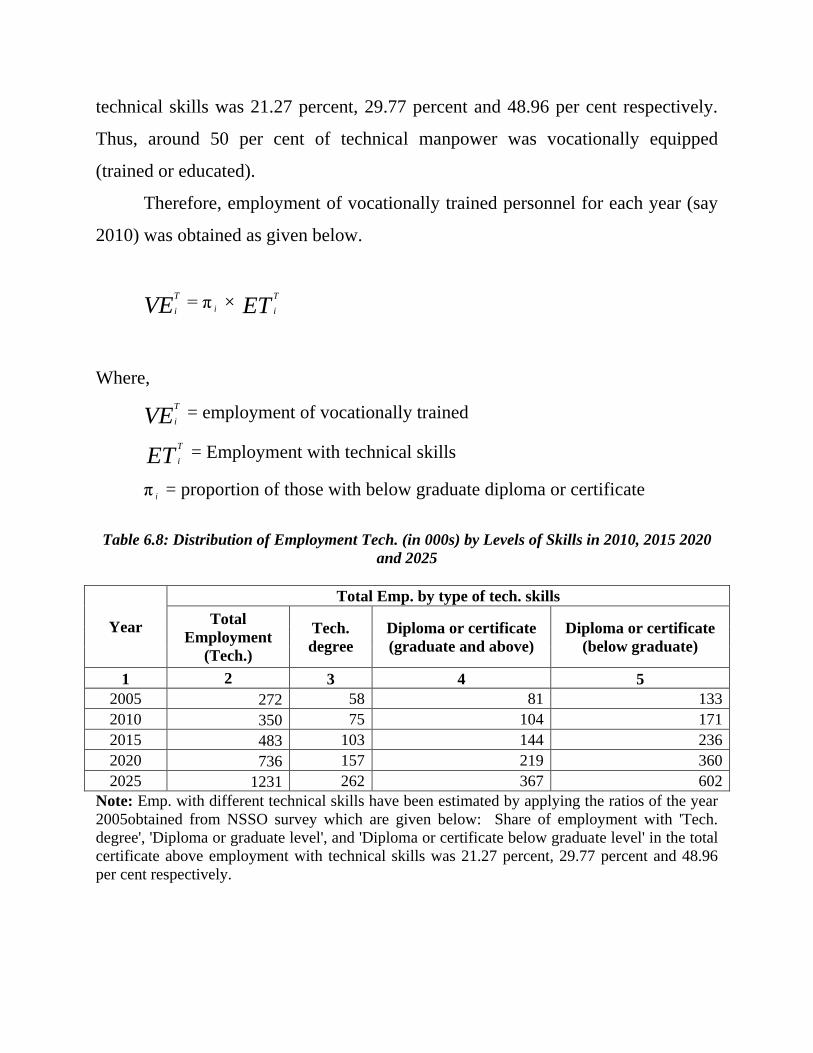
technical skills was 21.27 percent, 29.77 percent and 48.96 per cent respectively.
Thus, around 50 per cent of technical manpower was vocationally equipped
(trained or educated).
Therefore, employment of vocationally trained personnel for each year (say
2010) was obtained as given below.
VET
i = π i × ET
T
i
Where,
VET
i = employment of vocationally trained
ETT
i = Employment with technical skills
π i = proportion of those with below graduate diploma or certificate
Table 6.8: Distribution of Employment Tech. (in 000s) by Levels of Skills in 2010, 2015 2020
and 2025
Year
Total Emp. by type of tech. skills
Total
Employment
(Tech.)
Tech.
degree
Diploma or certificate
(graduate and above)
Diploma or certificate
(below graduate)
1 2 3 4 5
2005 272 58 81 133
2010 350 75 104 171
2015 483 103 144 236
2020 736 157 219 360
2025 1231 262 367 602
Note: Emp. with different technical skills have been estimated by applying the ratios of the year
2005obtained from NSSO survey which are given below: Share of employment with 'Tech.
degree', 'Diploma or graduate level', and 'Diploma or certificate below graduate level' in the total
certificate above employment with technical skills was 21.27 percent, 29.77 percent and 48.96
per cent respectively.
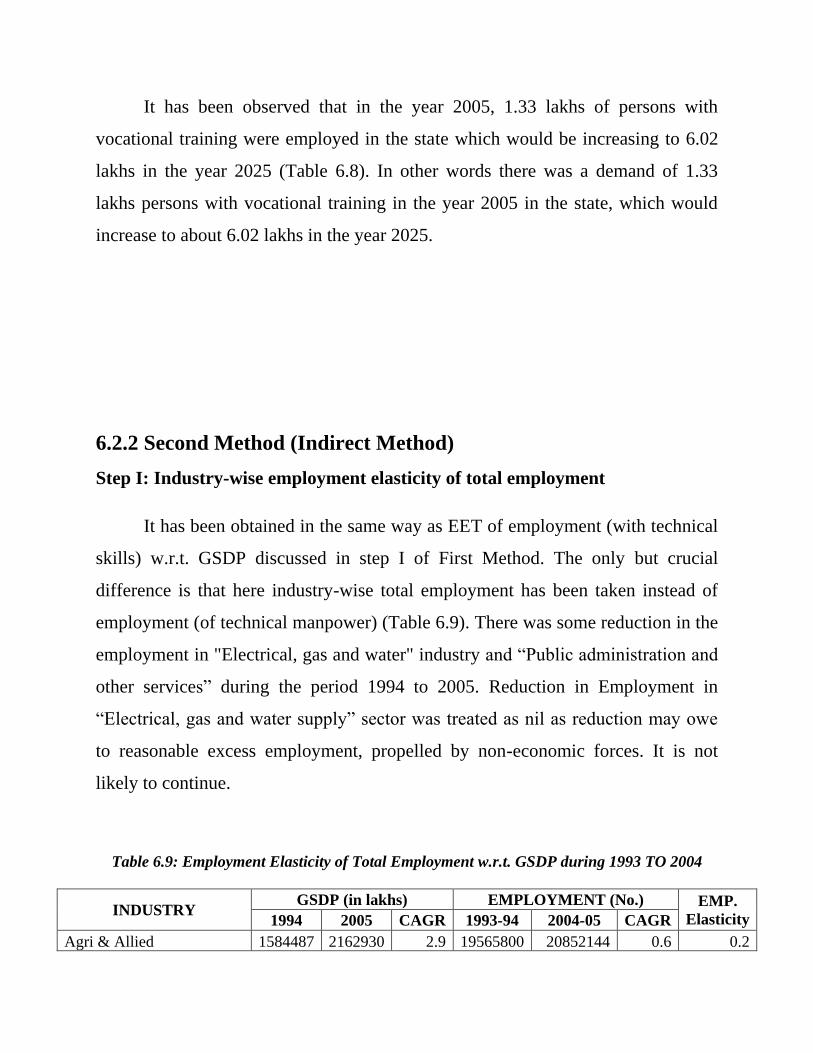
It has been observed that in the year 2005, 1.33 lakhs of persons with
vocational training were employed in the state which would be increasing to 6.02
lakhs in the year 2025 (Table 6.8). In other words there was a demand of 1.33
lakhs persons with vocational training in the year 2005 in the state, which would
increase to about 6.02 lakhs in the year 2025.
6.2.2 Second Method (Indirect Method)
Step I: Industry-wise employment elasticity of total employment
It has been obtained in the same way as EET of employment (with technical
skills) w.r.t. GSDP discussed in step I of First Method. The only but crucial
difference is that here industry-wise total employment has been taken instead of
employment (of technical manpower) (Table 6.9). There was some reduction in the
employment in "Electrical, gas and water" industry and ―Public administration and
other services‖ during the period 1994 to 2005. Reduction in Employment in
―Electrical, gas and water supply‖ sector was treated as nil as reduction may owe
to reasonable excess employment, propelled by non-economic forces. It is not
likely to continue.
Table 6.9: Employment Elasticity of Total Employment w.r.t. GSDP during 1993 TO 2004
INDUSTRY GSDP (in lakhs) EMPLOYMENT (No.) EMP.
Elasticity 1994 2005 CAGR 1993-94 2004-05 CAGR
Agri & Allied 1584487 2162930 2.9 19565800 20852144 0.6 0.2
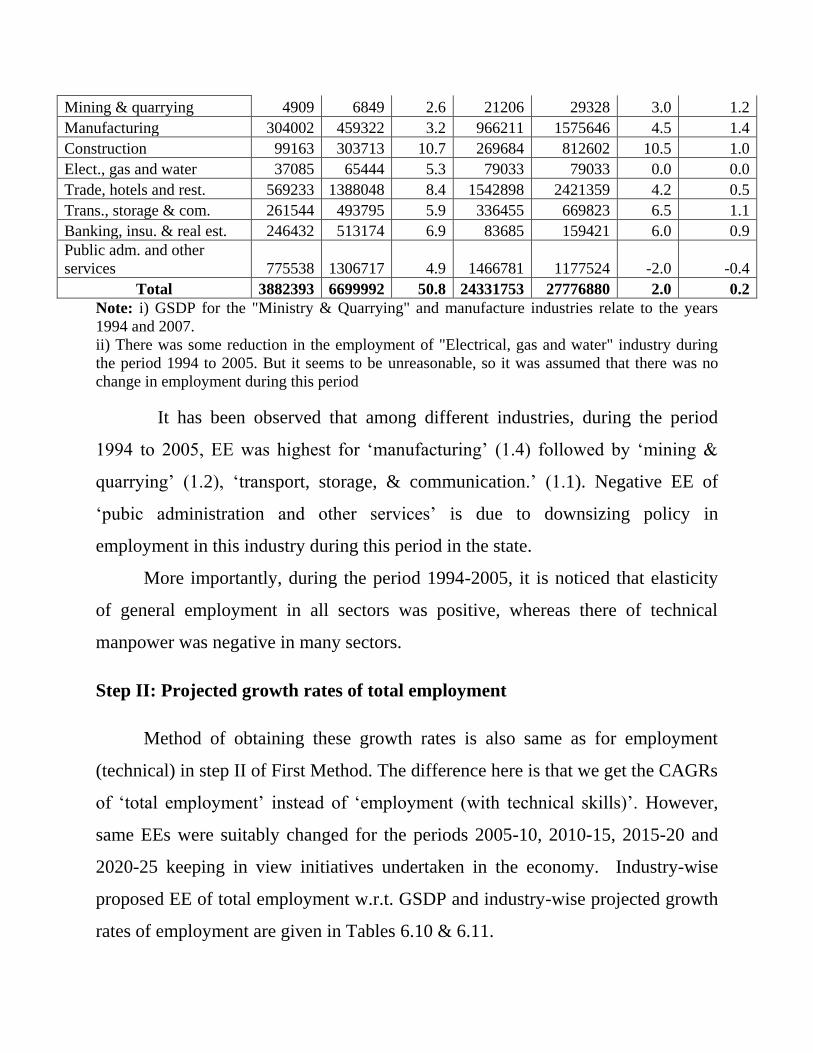
Mining & quarrying 4909 6849 2.6 21206 29328 3.0 1.2
Manufacturing 304002 459322 3.2 966211 1575646 4.5 1.4
Construction 99163 303713 10.7 269684 812602 10.5 1.0
Elect., gas and water 37085 65444 5.3 79033 79033 0.0 0.0
Trade, hotels and rest. 569233 1388048 8.4 1542898 2421359 4.2 0.5
Trans., storage & com. 261544 493795 5.9 336455 669823 6.5 1.1
Banking, insu. & real est. 246432 513174 6.9 83685 159421 6.0 0.9
Public adm. and other
services 775538 1306717 4.9 1466781 1177524 -2.0 -0.4
Total 3882393 6699992 50.8 24331753 27776880 2.0 0.2
Note: i) GSDP for the "Ministry & Quarrying" and manufacture industries relate to the years
1994 and 2007.
ii) There was some reduction in the employment of "Electrical, gas and water" industry during
the period 1994 to 2005. But it seems to be unreasonable, so it was assumed that there was no
change in employment during this period
It has been observed that among different industries, during the period
1994 to 2005, EE was highest for ‗manufacturing‘ (1.4) followed by ‗mining &
quarrying‘ (1.2), ‗transport, storage, & communication.‘ (1.1). Negative EE of
‗pubic administration and other services‘ is due to downsizing policy in
employment in this industry during this period in the state.
More importantly, during the period 1994-2005, it is noticed that elasticity
of general employment in all sectors was positive, whereas there of technical
manpower was negative in many sectors.
Step II: Projected growth rates of total employment
Method of obtaining these growth rates is also same as for employment
(technical) in step II of First Method. The difference here is that we get the CAGRs
of ‗total employment‘ instead of ‗employment (with technical skills)‘. However,
same EEs were suitably changed for the periods 2005-10, 2010-15, 2015-20 and
2020-25 keeping in view initiatives undertaken in the economy. Industry-wise
proposed EE of total employment w.r.t. GSDP and industry-wise projected growth
rates of employment are given in Tables 6.10 & 6.11.
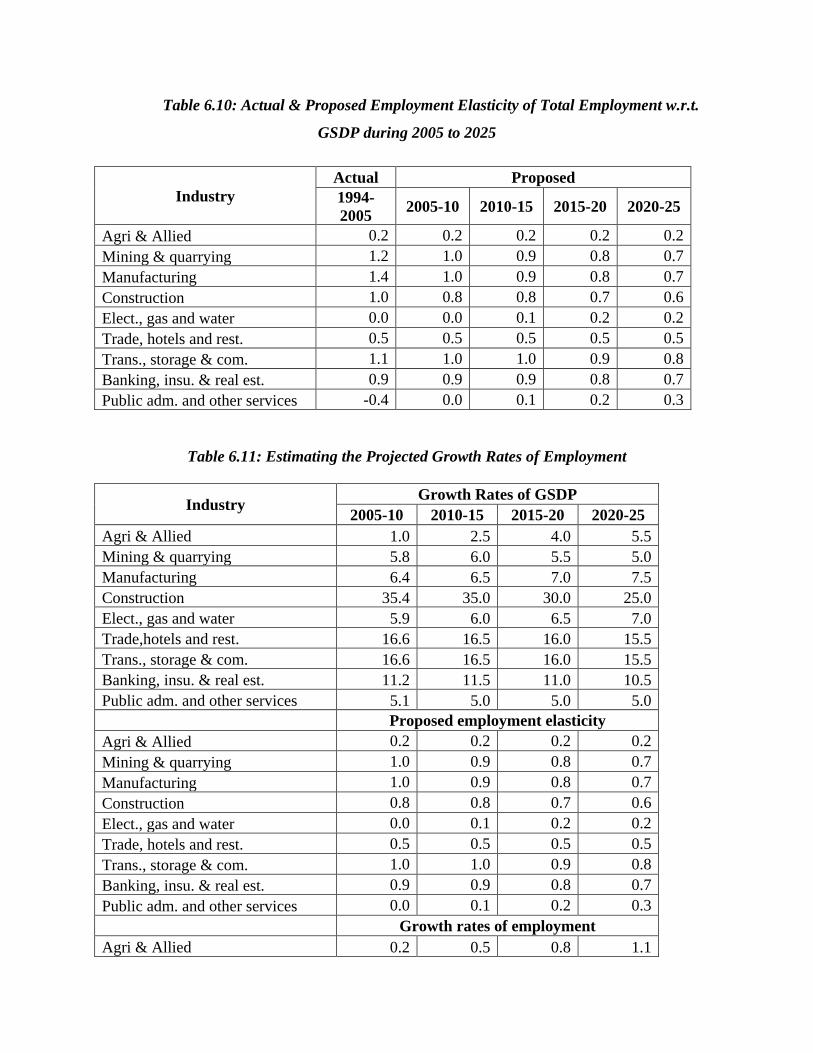
Table 6.10: Actual & Proposed Employment Elasticity of Total Employment w.r.t.
GSDP during 2005 to 2025
Industry
Actual Proposed
1994-
2005 2005-10 2010-15 2015-20 2020-25
Agri & Allied 0.2 0.2 0.2 0.2 0.2
Mining & quarrying 1.2 1.0 0.9 0.8 0.7
Manufacturing 1.4 1.0 0.9 0.8 0.7
Construction 1.0 0.8 0.8 0.7 0.6
Elect., gas and water 0.0 0.0 0.1 0.2 0.2
Trade, hotels and rest. 0.5 0.5 0.5 0.5 0.5
Trans., storage & com. 1.1 1.0 1.0 0.9 0.8
Banking, insu. & real est. 0.9 0.9 0.9 0.8 0.7
Public adm. and other services -0.4 0.0 0.1 0.2 0.3
Table 6.11: Estimating the Projected Growth Rates of Employment
Industry Growth Rates of GSDP
2005-10 2010-15 2015-20 2020-25
Agri & Allied 1.0 2.5 4.0 5.5
Mining & quarrying 5.8 6.0 5.5 5.0
Manufacturing 6.4 6.5 7.0 7.5
Construction 35.4 35.0 30.0 25.0
Elect., gas and water 5.9 6.0 6.5 7.0
Trade,hotels and rest. 16.6 16.5 16.0 15.5
Trans., storage & com. 16.6 16.5 16.0 15.5
Banking, insu. & real est. 11.2 11.5 11.0 10.5
Public adm. and other services 5.1 5.0 5.0 5.0
Proposed employment elasticity
Agri & Allied 0.2 0.2 0.2 0.2
Mining & quarrying 1.0 0.9 0.8 0.7
Manufacturing 1.0 0.9 0.8 0.7
Construction 0.8 0.8 0.7 0.6
Elect., gas and water 0.0 0.1 0.2 0.2
Trade, hotels and rest. 0.5 0.5 0.5 0.5
Trans., storage & com. 1.0 1.0 0.9 0.8
Banking, insu. & real est. 0.9 0.9 0.8 0.7
Public adm. and other services 0.0 0.1 0.2 0.3
Growth rates of employment
Agri & Allied 0.2 0.5 0.8 1.1
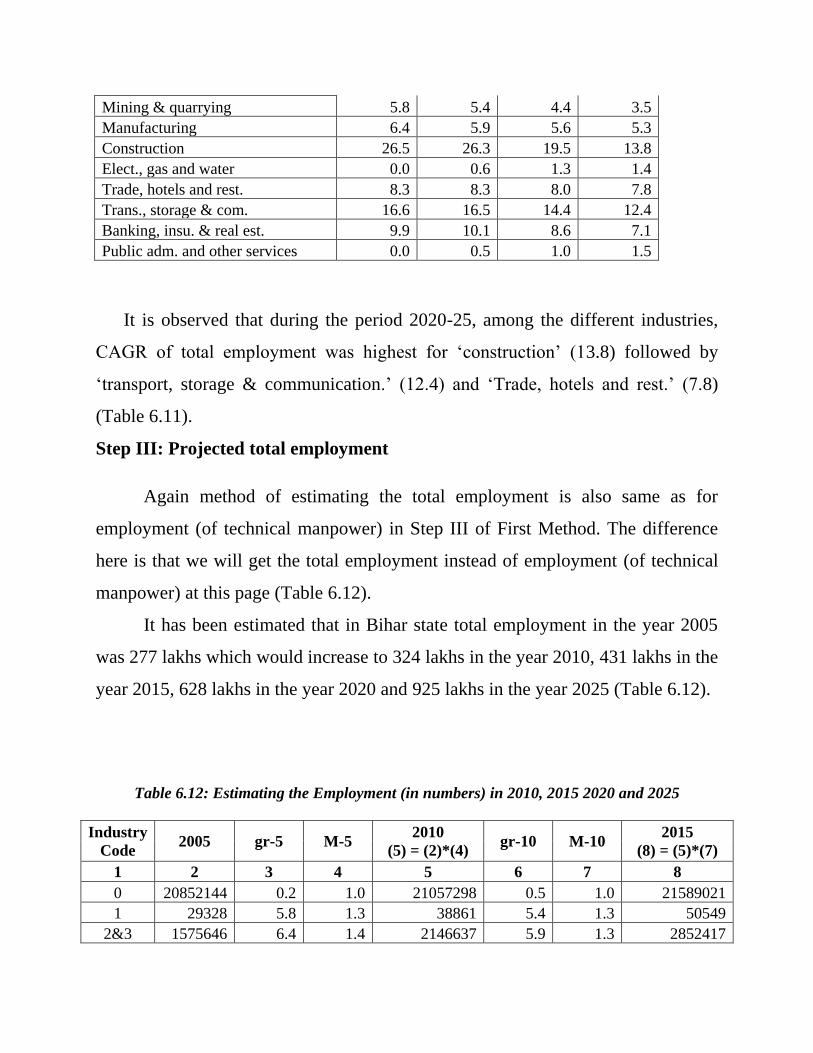
Mining & quarrying 5.8 5.4 4.4 3.5
Manufacturing 6.4 5.9 5.6 5.3
Construction 26.5 26.3 19.5 13.8
Elect., gas and water 0.0 0.6 1.3 1.4
Trade, hotels and rest. 8.3 8.3 8.0 7.8
Trans., storage & com. 16.6 16.5 14.4 12.4
Banking, insu. & real est. 9.9 10.1 8.6 7.1
Public adm. and other services 0.0 0.5 1.0 1.5
It is observed that during the period 2020-25, among the different industries,
CAGR of total employment was highest for ‗construction‘ (13.8) followed by
‗transport, storage & communication.‘ (12.4) and ‗Trade, hotels and rest.‘ (7.8)
(Table 6.11).
Step III: Projected total employment
Again method of estimating the total employment is also same as for
employment (of technical manpower) in Step III of First Method. The difference
here is that we will get the total employment instead of employment (of technical
manpower) at this page (Table 6.12).
It has been estimated that in Bihar state total employment in the year 2005
was 277 lakhs which would increase to 324 lakhs in the year 2010, 431 lakhs in the
year 2015, 628 lakhs in the year 2020 and 925 lakhs in the year 2025 (Table 6.12).
Table 6.12: Estimating the Employment (in numbers) in 2010, 2015 2020 and 2025
Industry
Code 2005 gr-5 M-5
2010
(5) = (2)*(4) gr-10 M-10
2015
(8) = (5)*(7)
1 2 3 4 5 6 7 8
0 20852144 0.2 1.0 21057298 0.5 1.0 21589021
1 29328 5.8 1.3 38861 5.4 1.3 50549
2&3 1575646 6.4 1.4 2146637 5.9 1.3 2852417
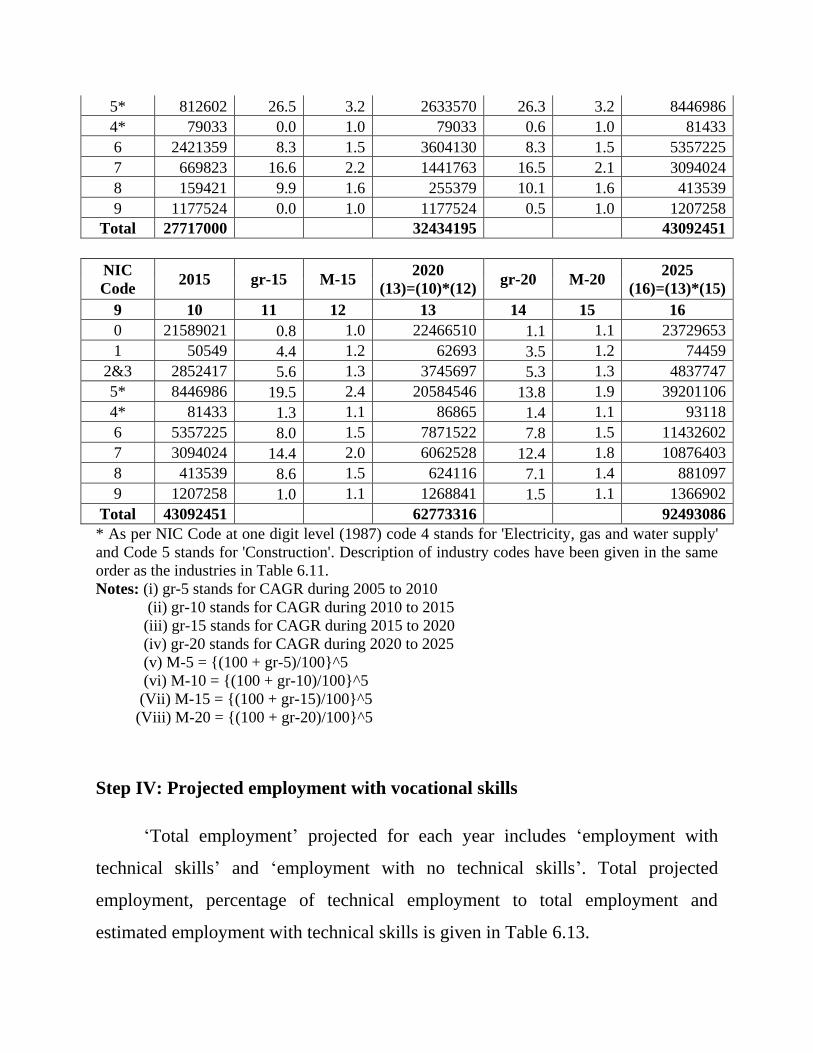
5* 812602 26.5 3.2 2633570 26.3 3.2 8446986
4* 79033 0.0 1.0 79033 0.6 1.0 81433
6 2421359 8.3 1.5 3604130 8.3 1.5 5357225
7 669823 16.6 2.2 1441763 16.5 2.1 3094024
8 159421 9.9 1.6 255379 10.1 1.6 413539
9 1177524 0.0 1.0 1177524 0.5 1.0 1207258
Total 27717000 32434195 43092451
NIC
Code 2015 gr-15 M-15
2020
(13)=(10)*(12) gr-20 M-20
2025
(16)=(13)*(15)
9 10 11 12 13 14 15 16
0 21589021 0.8 1.0 22466510 1.1 1.1 23729653
1 50549 4.4 1.2 62693 3.5 1.2 74459
2&3 2852417 5.6 1.3 3745697 5.3 1.3 4837747
5* 8446986 19.5 2.4 20584546 13.8 1.9 39201106
4* 81433 1.3 1.1 86865 1.4 1.1 93118
6 5357225 8.0 1.5 7871522 7.8 1.5 11432602
7 3094024 14.4 2.0 6062528 12.4 1.8 10876403
8 413539 8.6 1.5 624116 7.1 1.4 881097
9 1207258 1.0 1.1 1268841 1.5 1.1 1366902
Total 43092451 62773316 92493086
* As per NIC Code at one digit level (1987) code 4 stands for 'Electricity, gas and water supply'
and Code 5 stands for 'Construction'. Description of industry codes have been given in the same
order as the industries in Table 6.11.
Notes: (i) gr-5 stands for CAGR during 2005 to 2010
(ii) gr-10 stands for CAGR during 2010 to 2015
(iii) gr-15 stands for CAGR during 2015 to 2020
(iv) gr-20 stands for CAGR during 2020 to 2025
(v) M-5 = {(100 + gr-5)/100}^5
(vi) M-10 = {(100 + gr-10)/100}^5
(Vii) M-15 = {(100 + gr-15)/100}^5
(Viii) M-20 = {(100 + gr-20)/100}^5
Step IV: Projected employment with vocational skills
‗Total employment‘ projected for each year includes ‗employment with
technical skills‘ and ‗employment with no technical skills‘. Total projected
employment, percentage of technical employment to total employment and
estimated employment with technical skills is given in Table 6.13.
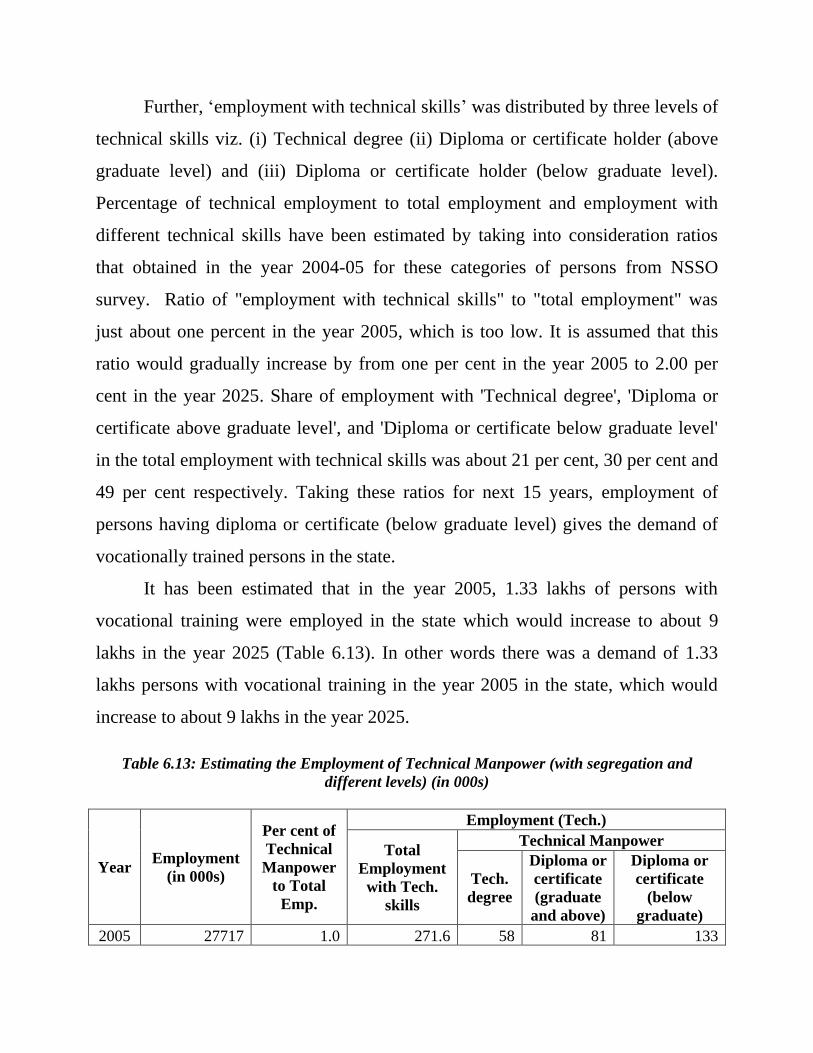
Further, ‗employment with technical skills‘ was distributed by three levels of
technical skills viz. (i) Technical degree (ii) Diploma or certificate holder (above
graduate level) and (iii) Diploma or certificate holder (below graduate level).
Percentage of technical employment to total employment and employment with
different technical skills have been estimated by taking into consideration ratios
that obtained in the year 2004-05 for these categories of persons from NSSO
survey. Ratio of "employment with technical skills" to "total employment" was
just about one percent in the year 2005, which is too low. It is assumed that this
ratio would gradually increase by from one per cent in the year 2005 to 2.00 per
cent in the year 2025. Share of employment with 'Technical degree', 'Diploma or
certificate above graduate level', and 'Diploma or certificate below graduate level'
in the total employment with technical skills was about 21 per cent, 30 per cent and
49 per cent respectively. Taking these ratios for next 15 years, employment of
persons having diploma or certificate (below graduate level) gives the demand of
vocationally trained persons in the state.
It has been estimated that in the year 2005, 1.33 lakhs of persons with
vocational training were employed in the state which would increase to about 9
lakhs in the year 2025 (Table 6.13). In other words there was a demand of 1.33
lakhs persons with vocational training in the year 2005 in the state, which would
increase to about 9 lakhs in the year 2025.
Table 6.13: Estimating the Employment of Technical Manpower (with segregation and
different levels) (in 000s)
Year Employment
(in 000s)
Per cent of
Technical
Manpower
to Total
Emp.
Employment (Tech.)
Total
Employment
with Tech.
skills
Technical Manpower
Tech.
degree
Diploma or
certificate
(graduate
and above)
Diploma or
certificate
(below
graduate)
2005 27717 1.0 271.6 58 81 133
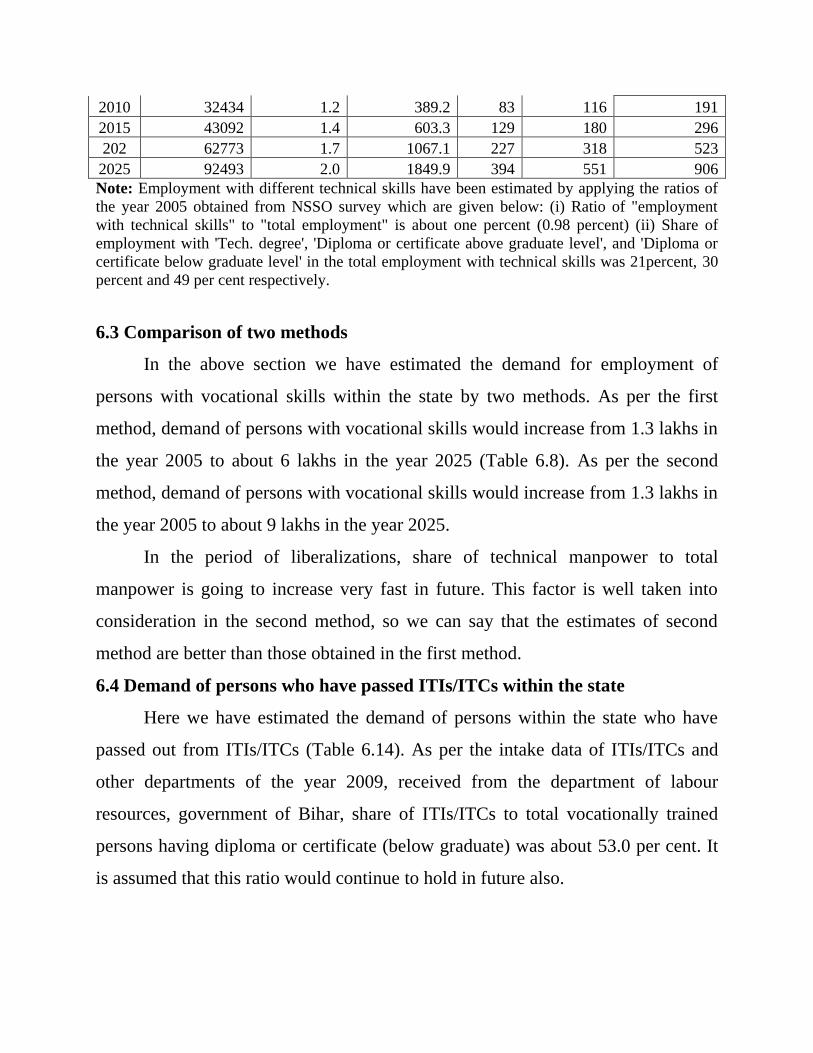
2010 32434 1.2 389.2 83 116 191
2015 43092 1.4 603.3 129 180 296
202 62773 1.7 1067.1 227 318 523
2025 92493 2.0 1849.9 394 551 906
Note: Employment with different technical skills have been estimated by applying the ratios of
the year 2005 obtained from NSSO survey which are given below: (i) Ratio of "employment
with technical skills" to "total employment" is about one percent (0.98 percent) (ii) Share of
employment with 'Tech. degree', 'Diploma or certificate above graduate level', and 'Diploma or
certificate below graduate level' in the total employment with technical skills was 21percent, 30
percent and 49 per cent respectively.
6.3 Comparison of two methods
In the above section we have estimated the demand for employment of
persons with vocational skills within the state by two methods. As per the first
method, demand of persons with vocational skills would increase from 1.3 lakhs in
the year 2005 to about 6 lakhs in the year 2025 (Table 6.8). As per the second
method, demand of persons with vocational skills would increase from 1.3 lakhs in
the year 2005 to about 9 lakhs in the year 2025.
In the period of liberalizations, share of technical manpower to total
manpower is going to increase very fast in future. This factor is well taken into
consideration in the second method, so we can say that the estimates of second
method are better than those obtained in the first method.
6.4 Demand of persons who have passed ITIs/ITCs within the state
Here we have estimated the demand of persons within the state who have
passed out from ITIs/ITCs (Table 6.14). As per the intake data of ITIs/ITCs and
other departments of the year 2009, received from the department of labour
resources, government of Bihar, share of ITIs/ITCs to total vocationally trained
persons having diploma or certificate (below graduate) was about 53.0 per cent. It
is assumed that this ratio would continue to hold in future also.
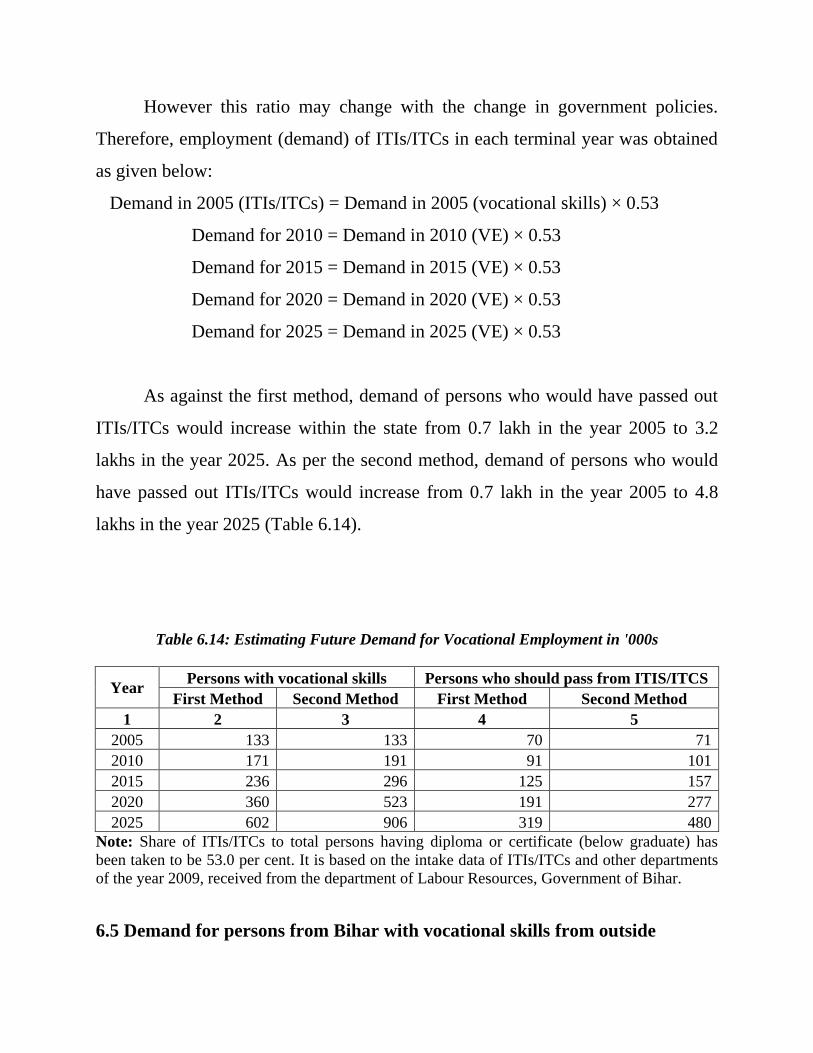
However this ratio may change with the change in government policies.
Therefore, employment (demand) of ITIs/ITCs in each terminal year was obtained
as given below:
Demand in 2005 (ITIs/ITCs) = Demand in 2005 (vocational skills) × 0.53
Demand for 2010 = Demand in 2010 (VE) × 0.53
Demand for 2015 = Demand in 2015 (VE) × 0.53
Demand for 2020 = Demand in 2020 (VE) × 0.53
Demand for 2025 = Demand in 2025 (VE) × 0.53
As against the first method, demand of persons who would have passed out
ITIs/ITCs would increase within the state from 0.7 lakh in the year 2005 to 3.2
lakhs in the year 2025. As per the second method, demand of persons who would
have passed out ITIs/ITCs would increase from 0.7 lakh in the year 2005 to 4.8
lakhs in the year 2025 (Table 6.14).
Table 6.14: Estimating Future Demand for Vocational Employment in '000s
Year Persons with vocational skills Persons who should pass from ITIS/ITCS
First Method Second Method First Method Second Method
1 2 3 4 5
2005 133 133 70 71
2010 171 191 91 101
2015 236 296 125 157
2020 360 523 191 277
2025 602 906 319 480
Note: Share of ITIs/ITCs to total persons having diploma or certificate (below graduate) has
been taken to be 53.0 per cent. It is based on the intake data of ITIs/ITCs and other departments
of the year 2009, received from the department of Labour Resources, Government of Bihar.
6.5 Demand for persons from Bihar with vocational skills from outside
Skilled workers have a great scope of employment in other states of India. A
recent study of Bihari migrant labourers by IIPA (IIPA, 2010) has estimated that
around 45 to 50 lakhs Bihari migrant labourers are working in other states of India.
A large number of migrants from Bihar to other states are unskilled. If some of
these unskilled workers are provided some skills in the home state, they can get
higher wages in the other states and can have a better bargaining power. This
would increase the demand of skilled labour with vocational skills. Their
remittances to home state would hopefully trigger economic activity backyard or at
least improve living conditions of family members left behind. Multiplier would
rejuvenate economic activity in the state.
Skilled workers have a great scope of employment in other countries also,
particularly in the countries where dependency ratio is very high. In the year 2001,
about 43 percent of total population of the state was in the age-group of below 15
years (Census of India, 2001). A high proportion of this population has entered in
the working population by now. Another advantage is that with increasing
participation of female work force in the state, dependency ratio is going to
decrease significantly in future. It would increase per capita income of the state
which may have a direct bearing on the individuals demand for vocational training.
Once they are trained, they can have a great scope of employment in other
countries and this way Bihar‘s share in total outmigration from India to other
countries can increase.
There are two major sources which give estimates of the incidence of
migrations from Bihar. The first is the Population Census conducted every tenth
years and the other is the periodic survey conducted by NSSO. Data for estimating
the extent of migration from Bihar to other states, along with the background (i.e.
age, qualification and sex etc.) of migrants and reasons of migrations would be
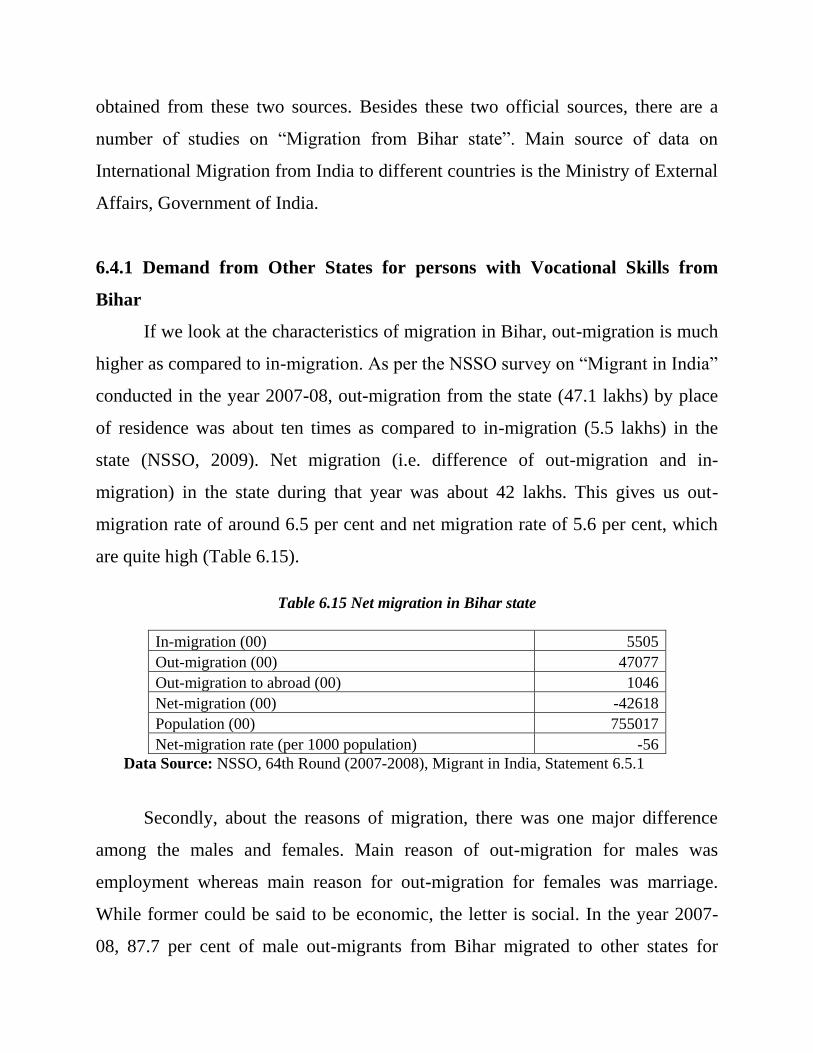
obtained from these two sources. Besides these two official sources, there are a
number of studies on ―Migration from Bihar state‖. Main source of data on
International Migration from India to different countries is the Ministry of External
Affairs, Government of India.
6.4.1 Demand from Other States for persons with Vocational Skills from
Bihar
If we look at the characteristics of migration in Bihar, out-migration is much
higher as compared to in-migration. As per the NSSO survey on ―Migrant in India‖
conducted in the year 2007-08, out-migration from the state (47.1 lakhs) by place
of residence was about ten times as compared to in-migration (5.5 lakhs) in the
state (NSSO, 2009). Net migration (i.e. difference of out-migration and in-
migration) in the state during that year was about 42 lakhs. This gives us out-
migration rate of around 6.5 per cent and net migration rate of 5.6 per cent, which
are quite high (Table 6.15).
Table 6.15 Net migration in Bihar state
In-migration (00) 5505
Out-migration (00) 47077
Out-migration to abroad (00) 1046
Net-migration (00) -42618
Population (00) 755017
Net-migration rate (per 1000 population) -56
Data Source: NSSO, 64th Round (2007-2008), Migrant in India, Statement 6.5.1
Secondly, about the reasons of migration, there was one major difference
among the males and females. Main reason of out-migration for males was
employment whereas main reason for out-migration for females was marriage.
While former could be said to be economic, the letter is social. In the year 2007-
08, 87.7 per cent of male out-migrants from Bihar migrated to other states for
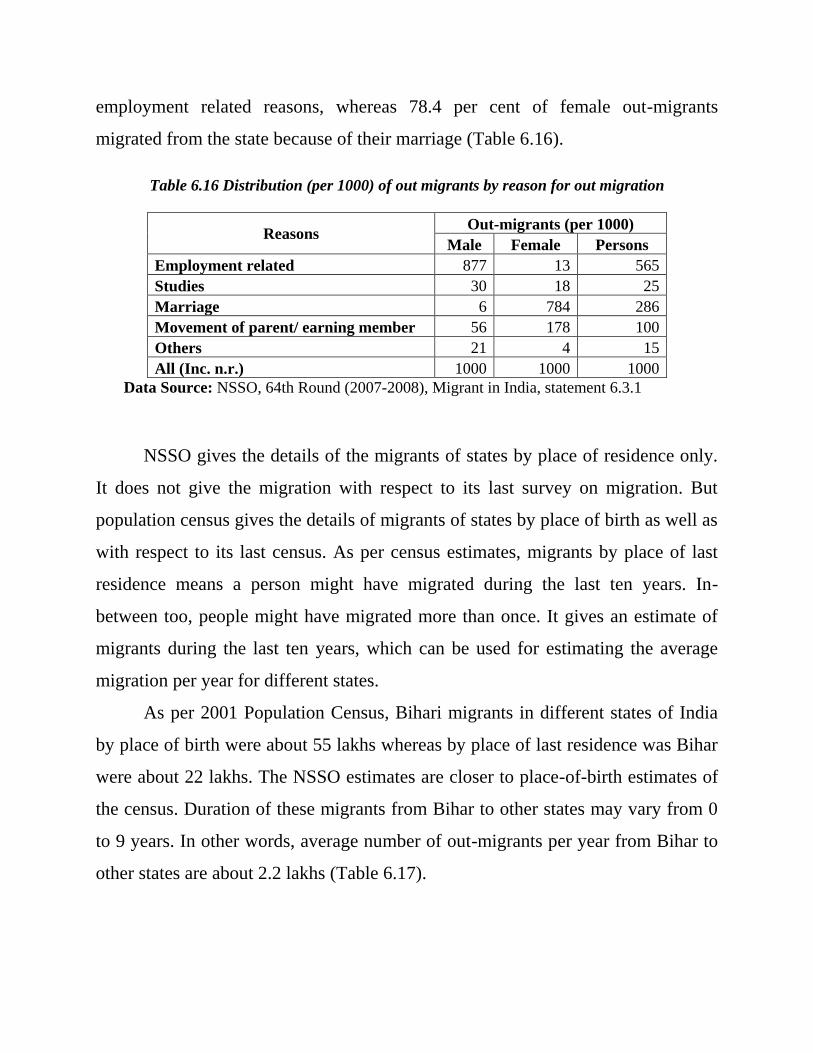
employment related reasons, whereas 78.4 per cent of female out-migrants
migrated from the state because of their marriage (Table 6.16).
Table 6.16 Distribution (per 1000) of out migrants by reason for out migration
Reasons Out-migrants (per 1000)
Male Female Persons
Employment related 877 13 565
Studies 30 18 25
Marriage 6 784 286
Movement of parent/ earning member 56 178 100
Others 21 4 15
All (Inc. n.r.) 1000 1000 1000
Data Source: NSSO, 64th Round (2007-2008), Migrant in India, statement 6.3.1
NSSO gives the details of the migrants of states by place of residence only.
It does not give the migration with respect to its last survey on migration. But
population census gives the details of migrants of states by place of birth as well as
with respect to its last census. As per census estimates, migrants by place of last
residence means a person might have migrated during the last ten years. In-
between too, people might have migrated more than once. It gives an estimate of
migrants during the last ten years, which can be used for estimating the average
migration per year for different states.
As per 2001 Population Census, Bihari migrants in different states of India
by place of birth were about 55 lakhs whereas by place of last residence was Bihar
were about 22 lakhs. The NSSO estimates are closer to place-of-birth estimates of
the census. Duration of these migrants from Bihar to other states may vary from 0
to 9 years. In other words, average number of out-migrants per year from Bihar to
other states are about 2.2 lakhs (Table 6.17).
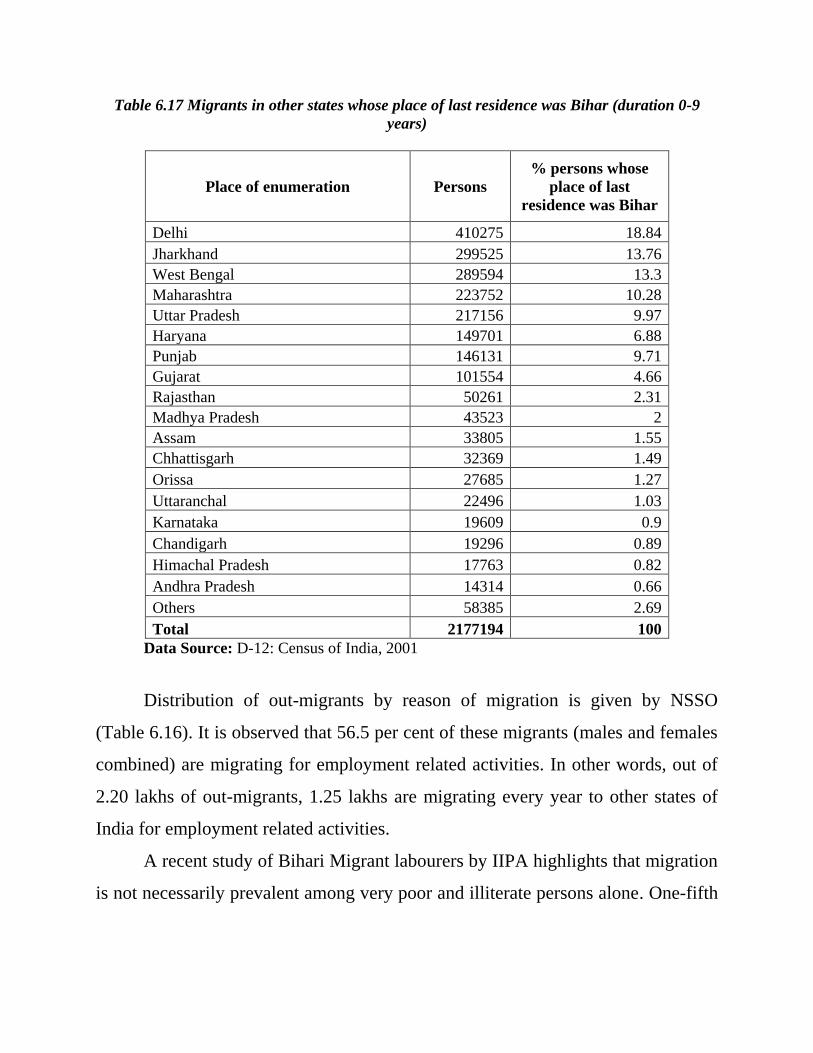
Table 6.17 Migrants in other states whose place of last residence was Bihar (duration 0-9
years)
Place of enumeration Persons
% persons whose
place of last
residence was Bihar
Delhi 410275 18.84
Jharkhand 299525 13.76
West Bengal 289594 13.3
Maharashtra 223752 10.28
Uttar Pradesh 217156 9.97
Haryana 149701 6.88
Punjab 146131 9.71
Gujarat 101554 4.66
Rajasthan 50261 2.31
Madhya Pradesh 43523 2
Assam 33805 1.55
Chhattisgarh 32369 1.49
Orissa 27685 1.27
Uttaranchal 22496 1.03
Karnataka 19609 0.9
Chandigarh 19296 0.89
Himachal Pradesh 17763 0.82
Andhra Pradesh 14314 0.66
Others 58385 2.69
Total 2177194 100
Data Source: D-12: Census of India, 2001
Distribution of out-migrants by reason of migration is given by NSSO
(Table 6.16). It is observed that 56.5 per cent of these migrants (males and females
combined) are migrating for employment related activities. In other words, out of
2.20 lakhs of out-migrants, 1.25 lakhs are migrating every year to other states of
India for employment related activities.
A recent study of Bihari Migrant labourers by IIPA highlights that migration
is not necessarily prevalent among very poor and illiterate persons alone. One-fifth
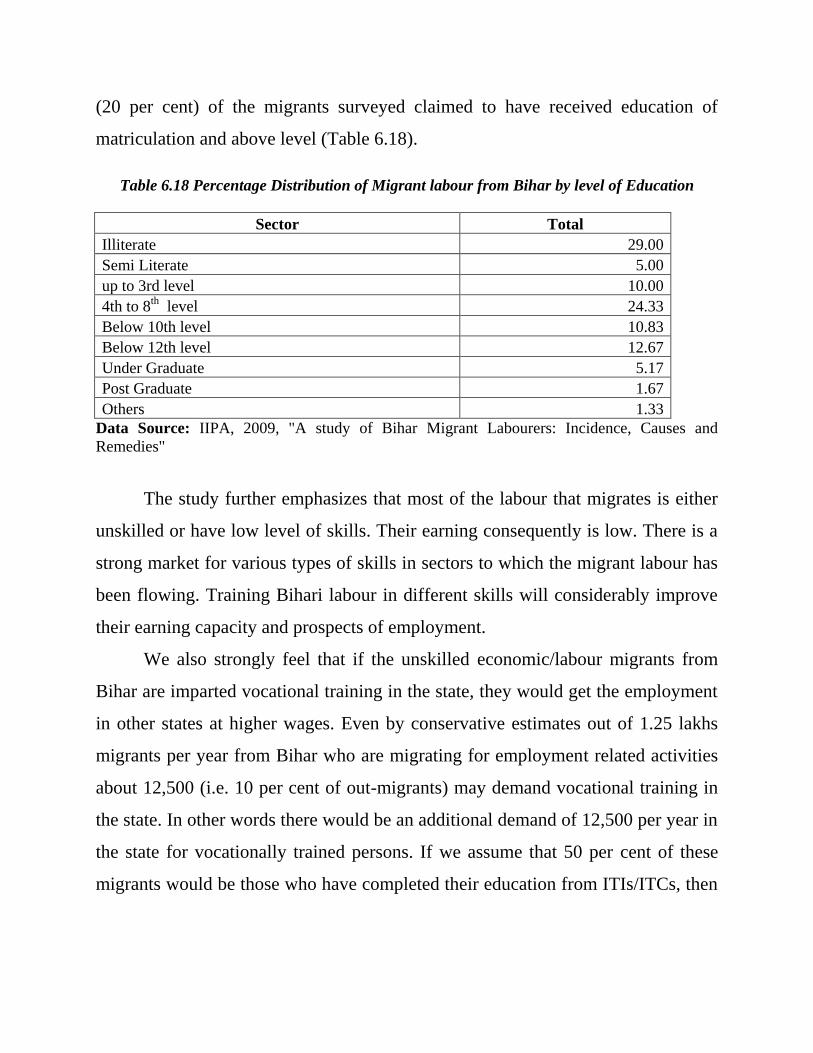
(20 per cent) of the migrants surveyed claimed to have received education of
matriculation and above level (Table 6.18).
Table 6.18 Percentage Distribution of Migrant labour from Bihar by level of Education
Sector Total
Illiterate 29.00
Semi Literate 5.00
up to 3rd level 10.00
4th to 8th
level 24.33
Below 10th level 10.83
Below 12th level 12.67
Under Graduate 5.17
Post Graduate 1.67
Others 1.33
Data Source: IIPA, 2009, "A study of Bihar Migrant Labourers: Incidence, Causes and
Remedies"
The study further emphasizes that most of the labour that migrates is either
unskilled or have low level of skills. Their earning consequently is low. There is a
strong market for various types of skills in sectors to which the migrant labour has
been flowing. Training Bihari labour in different skills will considerably improve
their earning capacity and prospects of employment.
We also strongly feel that if the unskilled economic/labour migrants from
Bihar are imparted vocational training in the state, they would get the employment
in other states at higher wages. Even by conservative estimates out of 1.25 lakhs
migrants per year from Bihar who are migrating for employment related activities
about 12,500 (i.e. 10 per cent of out-migrants) may demand vocational training in
the state. In other words there would be an additional demand of 12,500 per year in
the state for vocationally trained persons. If we assume that 50 per cent of these
migrants would be those who have completed their education from ITIs/ITCs, then
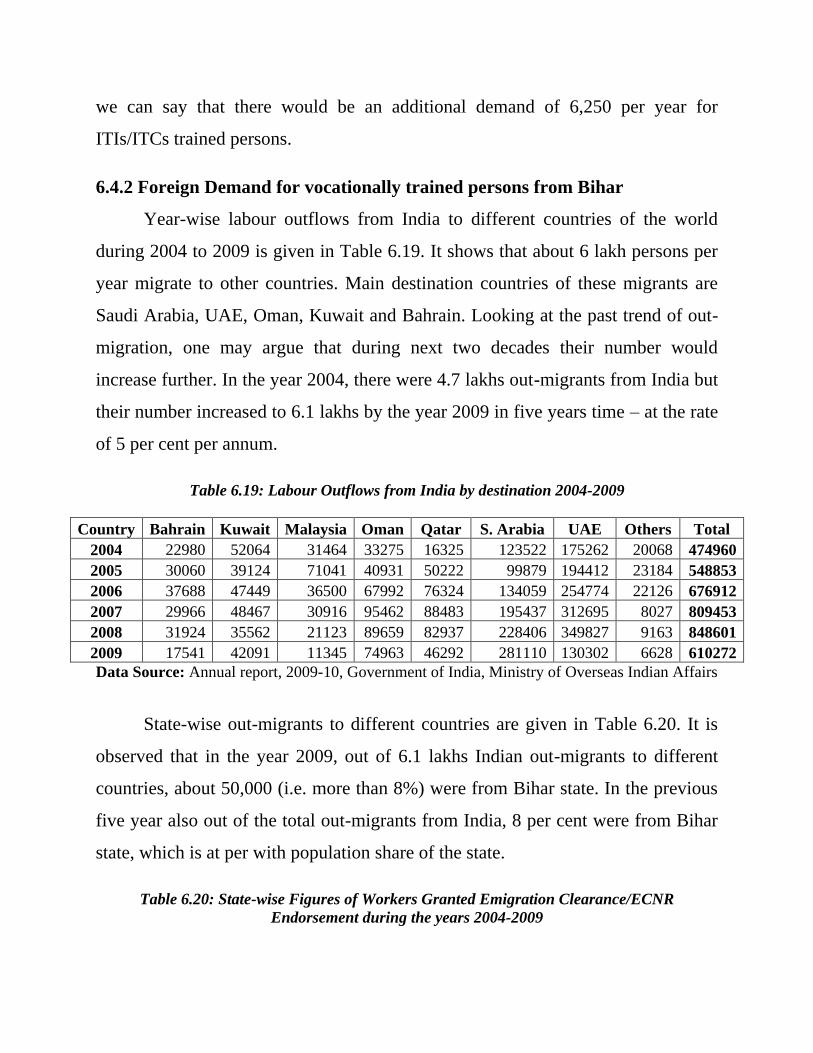
we can say that there would be an additional demand of 6,250 per year for
ITIs/ITCs trained persons.
6.4.2 Foreign Demand for vocationally trained persons from Bihar
Year-wise labour outflows from India to different countries of the world
during 2004 to 2009 is given in Table 6.19. It shows that about 6 lakh persons per
year migrate to other countries. Main destination countries of these migrants are
Saudi Arabia, UAE, Oman, Kuwait and Bahrain. Looking at the past trend of out-
migration, one may argue that during next two decades their number would
increase further. In the year 2004, there were 4.7 lakhs out-migrants from India but
their number increased to 6.1 lakhs by the year 2009 in five years time – at the rate
of 5 per cent per annum.
Table 6.19: Labour Outflows from India by destination 2004-2009
Country Bahrain Kuwait Malaysia Oman Qatar S. Arabia UAE Others Total
2004 22980 52064 31464 33275 16325 123522 175262 20068 474960
2005 30060 39124 71041 40931 50222 99879 194412 23184 548853
2006 37688 47449 36500 67992 76324 134059 254774 22126 676912
2007 29966 48467 30916 95462 88483 195437 312695 8027 809453
2008 31924 35562 21123 89659 82937 228406 349827 9163 848601
2009 17541 42091 11345 74963 46292 281110 130302 6628 610272
Data Source: Annual report, 2009-10, Government of India, Ministry of Overseas Indian Affairs
State-wise out-migrants to different countries are given in Table 6.20. It is
observed that in the year 2009, out of 6.1 lakhs Indian out-migrants to different
countries, about 50,000 (i.e. more than 8%) were from Bihar state. In the previous
five year also out of the total out-migrants from India, 8 per cent were from Bihar
state, which is at per with population share of the state.
Table 6.20: State-wise Figures of Workers Granted Emigration Clearance/ECNR
Endorsement during the years 2004-2009
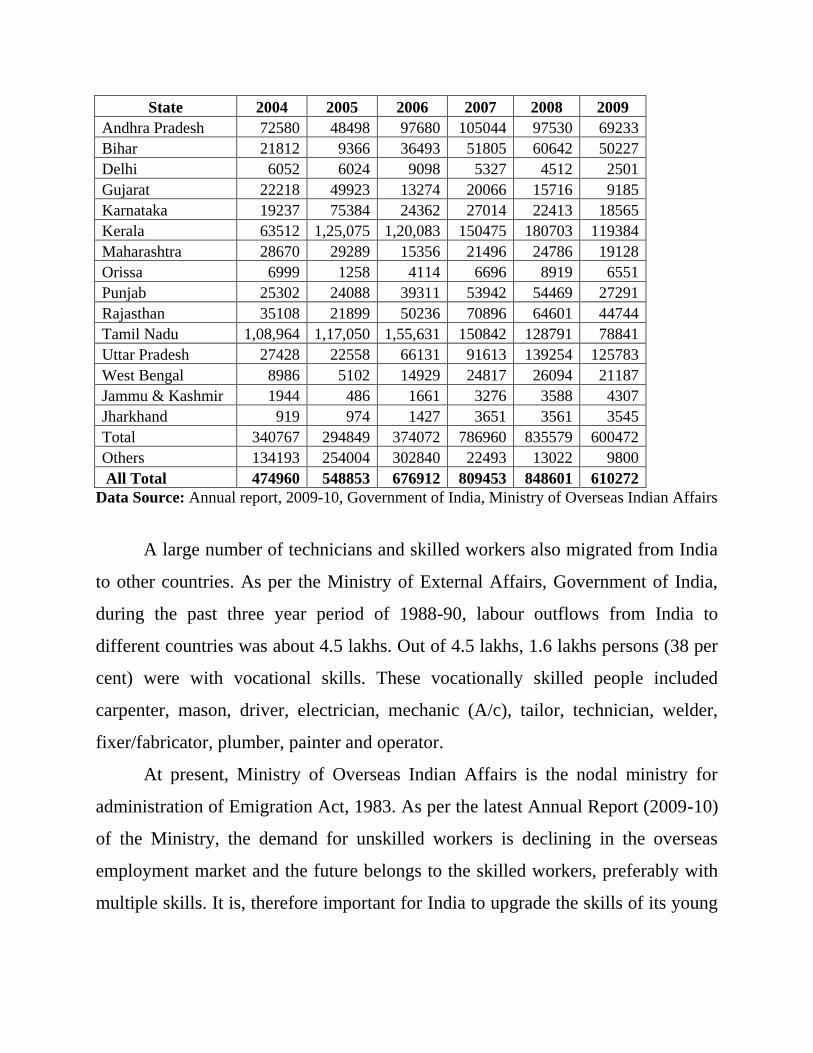
State 2004 2005 2006 2007 2008 2009
Andhra Pradesh 72580 48498 97680 105044 97530 69233
Bihar 21812 9366 36493 51805 60642 50227
Delhi 6052 6024 9098 5327 4512 2501
Gujarat 22218 49923 13274 20066 15716 9185
Karnataka 19237 75384 24362 27014 22413 18565
Kerala 63512 1,25,075 1,20,083 150475 180703 119384
Maharashtra 28670 29289 15356 21496 24786 19128
Orissa 6999 1258 4114 6696 8919 6551
Punjab 25302 24088 39311 53942 54469 27291
Rajasthan 35108 21899 50236 70896 64601 44744
Tamil Nadu 1,08,964 1,17,050 1,55,631 150842 128791 78841
Uttar Pradesh 27428 22558 66131 91613 139254 125783
West Bengal 8986 5102 14929 24817 26094 21187
Jammu & Kashmir 1944 486 1661 3276 3588 4307
Jharkhand 919 974 1427 3651 3561 3545
Total 340767 294849 374072 786960 835579 600472
Others 134193 254004 302840 22493 13022 9800
All Total 474960 548853 676912 809453 848601 610272
Data Source: Annual report, 2009-10, Government of India, Ministry of Overseas Indian Affairs
A large number of technicians and skilled workers also migrated from India
to other countries. As per the Ministry of External Affairs, Government of India,
during the past three year period of 1988-90, labour outflows from India to
different countries was about 4.5 lakhs. Out of 4.5 lakhs, 1.6 lakhs persons (38 per
cent) were with vocational skills. These vocationally skilled people included
carpenter, mason, driver, electrician, mechanic (A/c), tailor, technician, welder,
fixer/fabricator, plumber, painter and operator.
At present, Ministry of Overseas Indian Affairs is the nodal ministry for
administration of Emigration Act, 1983. As per the latest Annual Report (2009-10)
of the Ministry, the demand for unskilled workers is declining in the overseas
employment market and the future belongs to the skilled workers, preferably with
multiple skills. It is, therefore important for India to upgrade the skills of its young
work force to meet the challenges of future needs in the overseas employment
market which is having flux of emigrant labourers from neighboring countries.
Keeping the above facts in view, one may argue that, out of 6 lakh persons
who were migrating per year from India to other countries, about 2 lakh persons
(33 per cent of total) were having vocational training. If we assume the existing
trend to continue, there would be a demand of more than 2 lakh persons per year of
vocationally trained persons from India to other countries.
In the total out-migration from India, Bihar state‘s share of migration is
about eight per cent. One may argue that, share of skilled workers who would
migrate from Bihar would be less as compared to All India. So even if we go by
conservative estimates, out of 2 lakh persons with vocational skills who would
have demand in other countries, 8,000 (i.e. 4 per cent of 2 lakhs) would be from
Bihar. Further, out of 8000 skilled persons of the state 4000 persons (i.e. 4000)
may be from ITI/ITCs and remaining 4000 persons (i.e. 50 per cent) may be
trained by Institutes/Centres run by other departments.
6.6 Projected Estimates of shortages and surpluses of ITI/ITC trained
We can project the estimates of shortages and surpluses of ―ITI/ITC trained‖
(under the Labour Department, Government of Bihar) as well as of the persons
who would pass these skills from the ―Other Departments‖ of the state. But
because of the non-availability of data of pass out students from the ―Other
Departments‖ we could do this exercise for ―ITI/ITC‖ only.
6.6.1 Additional Demand on Five Yearly Basis
Estimates of shortages and surpluses of ITI/ITC passed are obtained by
comparing their demand and supply estimates. Demand estimates obtained in
Section 6.5 are of total demand (i.e. stock sense) but we don‘t have the comparable
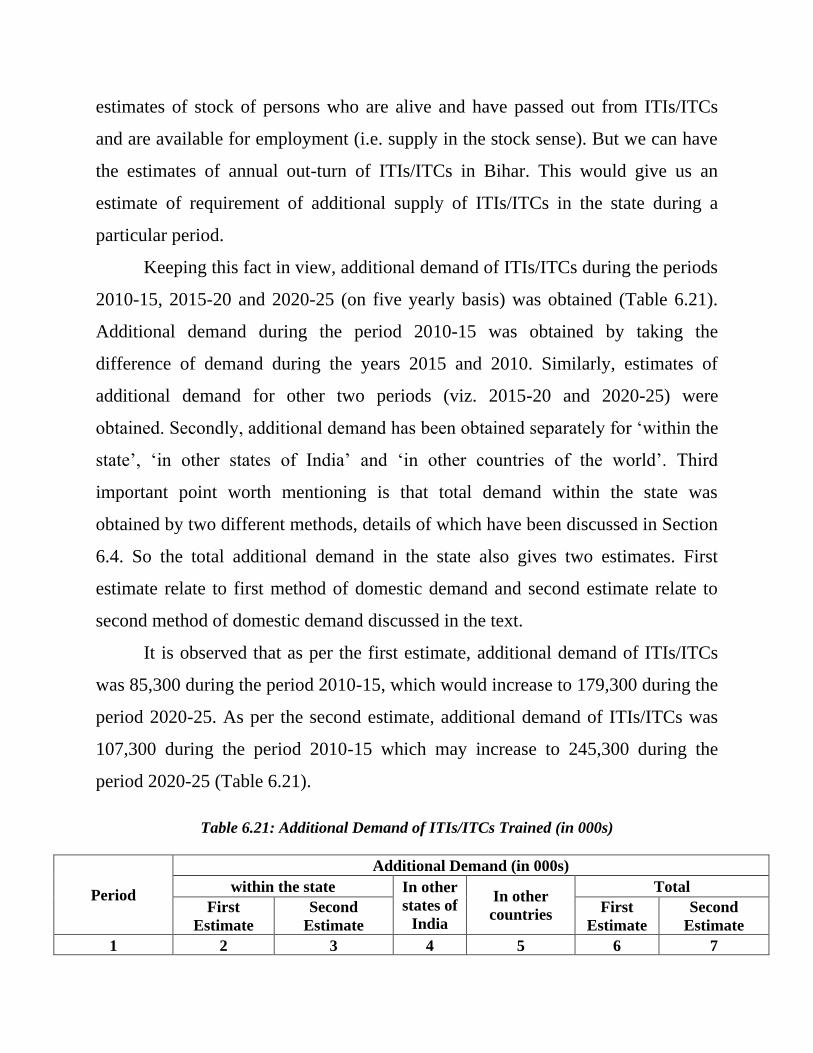
estimates of stock of persons who are alive and have passed out from ITIs/ITCs
and are available for employment (i.e. supply in the stock sense). But we can have
the estimates of annual out-turn of ITIs/ITCs in Bihar. This would give us an
estimate of requirement of additional supply of ITIs/ITCs in the state during a
particular period.
Keeping this fact in view, additional demand of ITIs/ITCs during the periods
2010-15, 2015-20 and 2020-25 (on five yearly basis) was obtained (Table 6.21).
Additional demand during the period 2010-15 was obtained by taking the
difference of demand during the years 2015 and 2010. Similarly, estimates of
additional demand for other two periods (viz. 2015-20 and 2020-25) were
obtained. Secondly, additional demand has been obtained separately for ‗within the
state‘, ‗in other states of India‘ and ‗in other countries of the world‘. Third
important point worth mentioning is that total demand within the state was
obtained by two different methods, details of which have been discussed in Section
6.4. So the total additional demand in the state also gives two estimates. First
estimate relate to first method of domestic demand and second estimate relate to
second method of domestic demand discussed in the text.
It is observed that as per the first estimate, additional demand of ITIs/ITCs
was 85,300 during the period 2010-15, which would increase to 179,300 during the
period 2020-25. As per the second estimate, additional demand of ITIs/ITCs was
107,300 during the period 2010-15 which may increase to 245,300 during the
period 2020-25 (Table 6.21).
Table 6.21: Additional Demand of ITIs/ITCs Trained (in 000s)
Period
Additional Demand (in 000s)
within the state In other
states of
India
In other
countries
Total
First
Estimate
Second
Estimate
First
Estimate
Second
Estimate
1 2 3 4 5 6 7
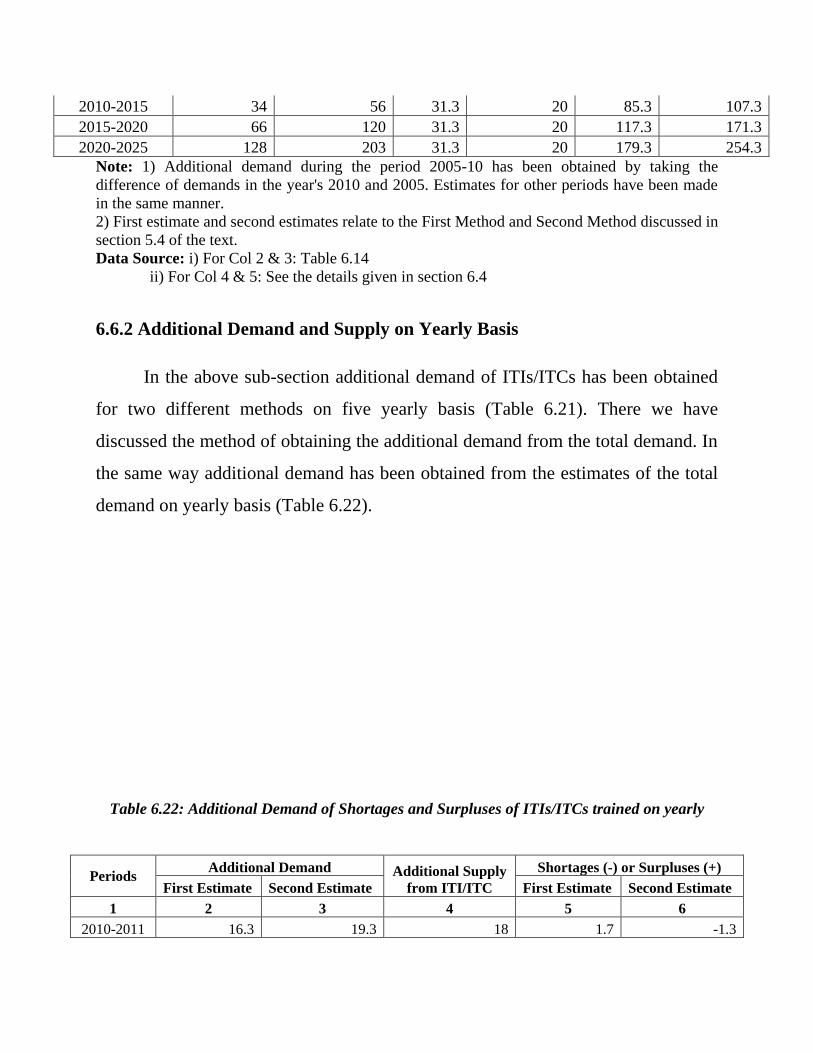
2010-2015 34 56 31.3 20 85.3 107.3
2015-2020 66 120 31.3 20 117.3 171.3
2020-2025 128 203 31.3 20 179.3 254.3
Note: 1) Additional demand during the period 2005-10 has been obtained by taking the
difference of demands in the year's 2010 and 2005. Estimates for other periods have been made
in the same manner.
2) First estimate and second estimates relate to the First Method and Second Method discussed in
section 5.4 of the text.
Data Source: i) For Col 2 & 3: Table 6.14
ii) For Col 4 & 5: See the details given in section 6.4
6.6.2 Additional Demand and Supply on Yearly Basis
In the above sub-section additional demand of ITIs/ITCs has been obtained
for two different methods on five yearly basis (Table 6.21). There we have
discussed the method of obtaining the additional demand from the total demand. In
the same way additional demand has been obtained from the estimates of the total
demand on yearly basis (Table 6.22).
Table 6.22: Additional Demand of Shortages and Surpluses of ITIs/ITCs trained on yearly
Periods Additional Demand Additional Supply
from ITI/ITC
Shortages (-) or Surpluses (+)
First Estimate Second Estimate First Estimate Second Estimate
1 2 3 4 5 6
2010-2011 16.3 19.3 18 1.7 -1.3
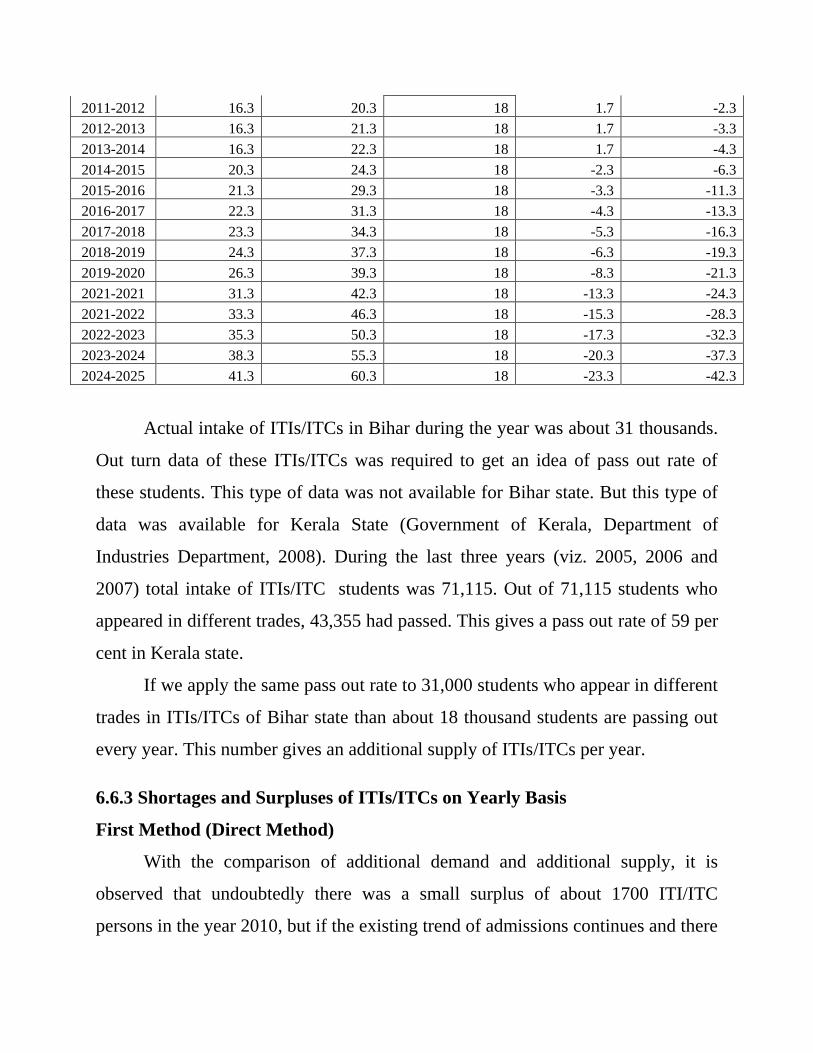
2011-2012 16.3 20.3 18 1.7 -2.3
2012-2013 16.3 21.3 18 1.7 -3.3
2013-2014 16.3 22.3 18 1.7 -4.3
2014-2015 20.3 24.3 18 -2.3 -6.3
2015-2016 21.3 29.3 18 -3.3 -11.3
2016-2017 22.3 31.3 18 -4.3 -13.3
2017-2018 23.3 34.3 18 -5.3 -16.3
2018-2019 24.3 37.3 18 -6.3 -19.3
2019-2020 26.3 39.3 18 -8.3 -21.3
2021-2021 31.3 42.3 18 -13.3 -24.3
2021-2022 33.3 46.3 18 -15.3 -28.3
2022-2023 35.3 50.3 18 -17.3 -32.3
2023-2024 38.3 55.3 18 -20.3 -37.3
2024-2025 41.3 60.3 18 -23.3 -42.3
Actual intake of ITIs/ITCs in Bihar during the year was about 31 thousands.
Out turn data of these ITIs/ITCs was required to get an idea of pass out rate of
these students. This type of data was not available for Bihar state. But this type of
data was available for Kerala State (Government of Kerala, Department of
Industries Department, 2008). During the last three years (viz. 2005, 2006 and
2007) total intake of ITIs/ITC students was 71,115. Out of 71,115 students who
appeared in different trades, 43,355 had passed. This gives a pass out rate of 59 per
cent in Kerala state.
If we apply the same pass out rate to 31,000 students who appear in different
trades in ITIs/ITCs of Bihar state than about 18 thousand students are passing out
every year. This number gives an additional supply of ITIs/ITCs per year.
6.6.3 Shortages and Surpluses of ITIs/ITCs on Yearly Basis
First Method (Direct Method)
With the comparison of additional demand and additional supply, it is
observed that undoubtedly there was a small surplus of about 1700 ITI/ITC
persons in the year 2010, but if the existing trend of admissions continues and there
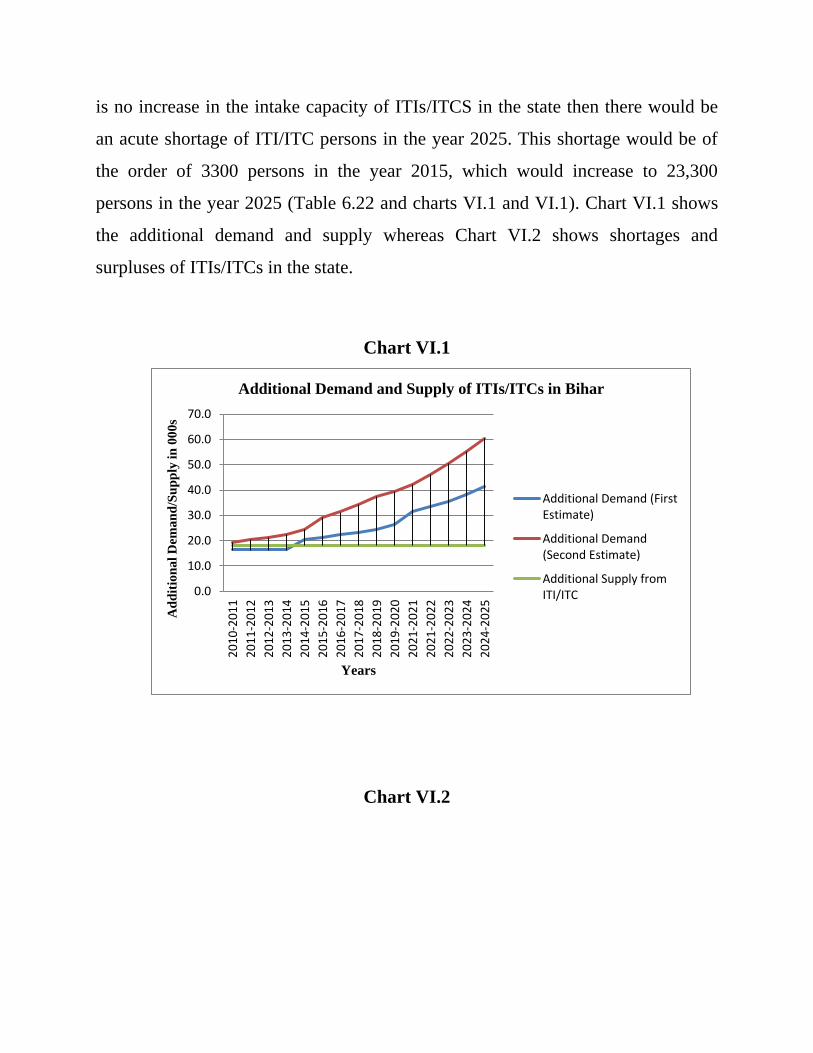
is no increase in the intake capacity of ITIs/ITCS in the state then there would be
an acute shortage of ITI/ITC persons in the year 2025. This shortage would be of
the order of 3300 persons in the year 2015, which would increase to 23,300
persons in the year 2025 (Table 6.22 and charts VI.1 and VI.1). Chart VI.1 shows
the additional demand and supply whereas Chart VI.2 shows shortages and
surpluses of ITIs/ITCs in the state.
Chart VI.1
Chart VI.2
0.0
10.0
20.0
30.0
40.0
50.0
60.0
70.0
20
10
-20
11
20
11
-20
12
20
12
-20
13
20
13
-20
14
20
14
-20
15
20
15
-20
16
20
16
-20
17
20
17
-20
18
20
18
-20
19
20
19
-20
20
20
21
-20
21
20
21
-20
22
20
22
-20
23
20
23
-20
24
20
24
-20
25
Ad
dit
ion
al
Dem
an
d/S
up
ply
in
00
0s
Years
Additional Demand and Supply of ITIs/ITCs in Bihar
Additional Demand (FirstEstimate)
Additional Demand(Second Estimate)
Additional Supply fromITI/ITC
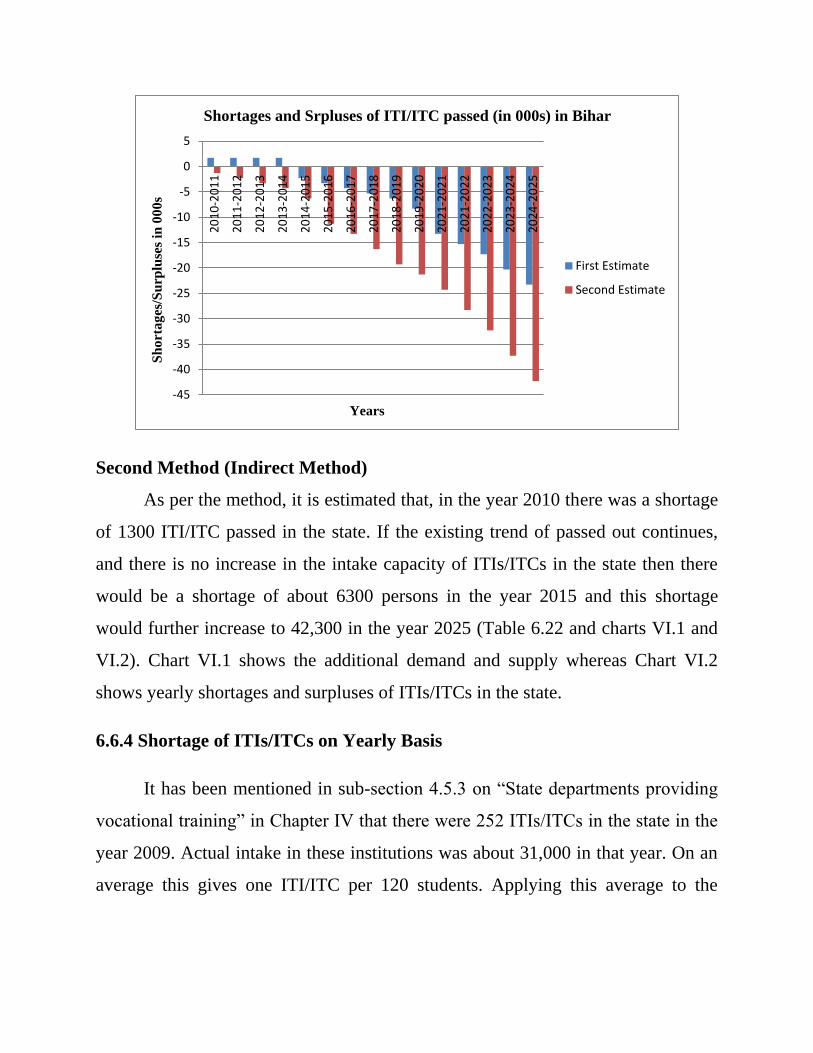
Second Method (Indirect Method)
As per the method, it is estimated that, in the year 2010 there was a shortage
of 1300 ITI/ITC passed in the state. If the existing trend of passed out continues,
and there is no increase in the intake capacity of ITIs/ITCs in the state then there
would be a shortage of about 6300 persons in the year 2015 and this shortage
would further increase to 42,300 in the year 2025 (Table 6.22 and charts VI.1 and
VI.2). Chart VI.1 shows the additional demand and supply whereas Chart VI.2
shows yearly shortages and surpluses of ITIs/ITCs in the state.
6.6.4 Shortage of ITIs/ITCs on Yearly Basis
It has been mentioned in sub-section 4.5.3 on ―State departments providing
vocational training‖ in Chapter IV that there were 252 ITIs/ITCs in the state in the
year 2009. Actual intake in these institutions was about 31,000 in that year. On an
average this gives one ITI/ITC per 120 students. Applying this average to the
-45
-40
-35
-30
-25
-20
-15
-10
-5
0
5
20
10
-20
11
20
11
-20
12
20
12
-20
13
20
13
-20
14
20
14
-20
15
20
15
-20
16
20
16
-20
17
20
17
-20
18
20
18
-20
19
20
19
-20
20
20
21
-20
21
20
21
-20
22
20
22
-20
23
20
23
-20
24
20
24
-20
25
Sh
orta
ges
/Su
rplu
ses
in 0
00s
Years
Shortages and Srpluses of ITI/ITC passed (in 000s) in Bihar
First Estimate
Second Estimate
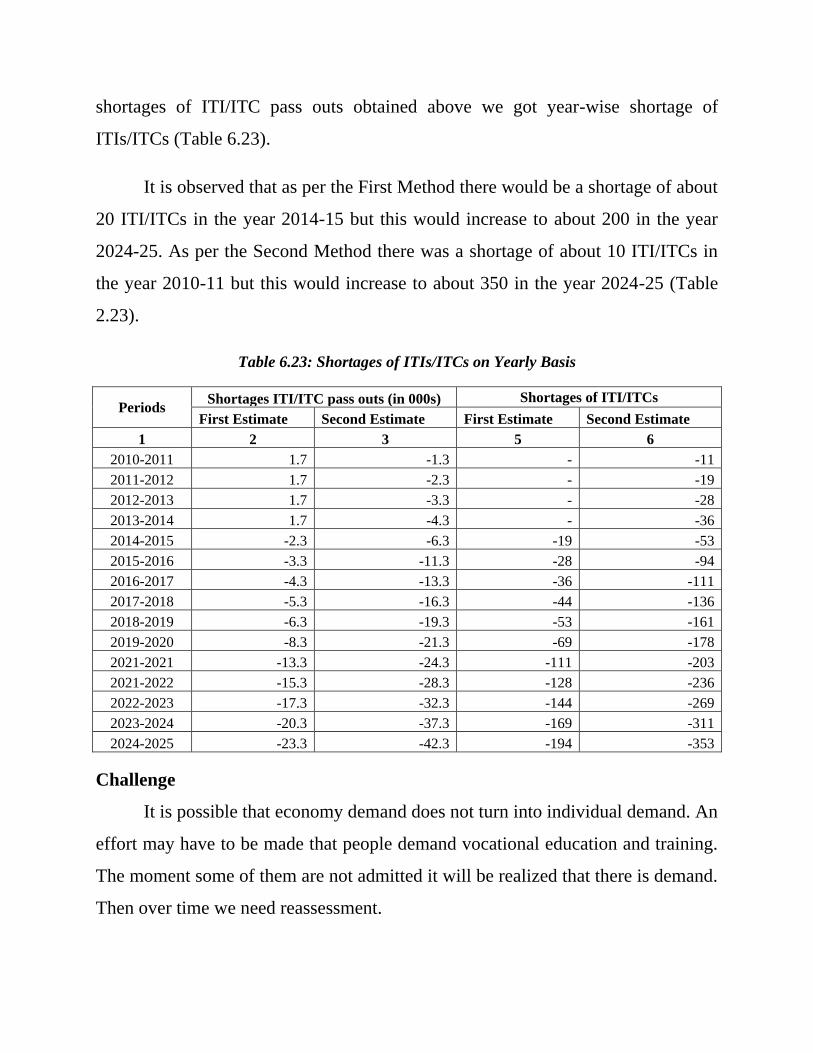
shortages of ITI/ITC pass outs obtained above we got year-wise shortage of
ITIs/ITCs (Table 6.23).
It is observed that as per the First Method there would be a shortage of about
20 ITI/ITCs in the year 2014-15 but this would increase to about 200 in the year
2024-25. As per the Second Method there was a shortage of about 10 ITI/ITCs in
the year 2010-11 but this would increase to about 350 in the year 2024-25 (Table
2.23).
Table 6.23: Shortages of ITIs/ITCs on Yearly Basis
Periods Shortages ITI/ITC pass outs (in 000s) Shortages of ITI/ITCs
First Estimate Second Estimate First Estimate Second Estimate
1 2 3 5 6
2010-2011 1.7 -1.3 - -11
2011-2012 1.7 -2.3 - -19
2012-2013 1.7 -3.3 - -28
2013-2014 1.7 -4.3 - -36
2014-2015 -2.3 -6.3 -19 -53
2015-2016 -3.3 -11.3 -28 -94
2016-2017 -4.3 -13.3 -36 -111
2017-2018 -5.3 -16.3 -44 -136
2018-2019 -6.3 -19.3 -53 -161
2019-2020 -8.3 -21.3 -69 -178
2021-2021 -13.3 -24.3 -111 -203
2021-2022 -15.3 -28.3 -128 -236
2022-2023 -17.3 -32.3 -144 -269
2023-2024 -20.3 -37.3 -169 -311
2024-2025 -23.3 -42.3 -194 -353
Challenge
It is possible that economy demand does not turn into individual demand. An
effort may have to be made that people demand vocational education and training.
The moment some of them are not admitted it will be realized that there is demand.
Then over time we need reassessment.
Chapter VII
Estimating the Societal requirement of Vocational Education
and Training in Bihar
7.1 Introduction
We have discussed in Section 1.3 (i.e. Methodology) that it is very important
to estimate the requirement of Vocational Education and Training in Bihar. The
word ‗requirement ‗has different meaning than ‗actual demand‘. ‗Actual demand‘
is the ‗Industry demand‘. Other two terms which can be used here for requirement
are ‗Social Demand‘ and ‗Need‘. In Bihar a large section of people are very poor
and illiterate, who do not have the money to bear the cost of training. Some of
them do not know the benefit of the training so there would be no demand of
vocational skills from their side. In spite of this the fact is that millions of such
people are going to other states for (daily) wage work. If such persons are imparted
some training they would have a better bargaining power in those states. Late Prof.
Arjun Sengupta has mentioned in the International workshop on skill development:
Policy learning and exchange (Hosted by IAMR in May, 2010) that in informal
sector there may not be demand for training. We will have to adopt a deliberate
approach to increase their productivity.
Requirement of persons with vocational education and training will depend
on how ambitious the planners are. If they are more ambitious, number of persons
required to be technically trained would be more and if they are less ambitious
requirement would be less. If they want that by particular year all the unemployed
persons should be trained, requirement would be more and if they want that
unemployed persons in the age group of 15-19 only should be trained then the
requirement would be less. Similarly if they plan that by particular year, 10 per
cent of persons in the age group 15-29 years should have training then the
requirement would be more but if they plan that only 5 per cent of persons in this
age group should have training then the requirement would be less.
There are various methods to estimate the requirement of Vocational
Education and Training but all these methods depend upon the targets we want to
achieve. Some of the methods may not give the total requirement of the society
rather they give the requirement of a particular segment. Before estimating the total
requirement of the society, two estimates of selected segments have been
discussed.
Whether it is Vocational Education or Vocational Training most appropriate
age-groups for imparting such training are 15-29 years, 20-24 years and 25-29
years. Most of the school dropouts in the classes 9 to 12 are in these age-groups.
Some school dropouts of lower classes may be in the age-group 10-14 years but
their number would be very less. Such persons may be provided some vocational
education in the schools. Planning Commission has suggested that such students
may be imparted last mile employment skills (viz. English language skills,
quantitative skills, computer literacy, presentation skills, behavioral and
interpersonal skills etc) in schools. Future requirement of persons in the age-group
10-14 years, who should be imparted vocational education in schools has been
worked out and is given in Annexure 7.1, given at the end of this chapter. Another
exercise estimating the number of unemployed and underemployed required to be
trained in the age-groups 15-19 years, 20-24 years and 25-29 years has been
discussed in Annexure 7.2 given at the end of this Chapter. Both these Annexures
explain about the data used, methodology and requirement estimates for the
terminal years 2005, 2010, 2015, 2020 and 2025. These estimates are of two
different segments of the society.
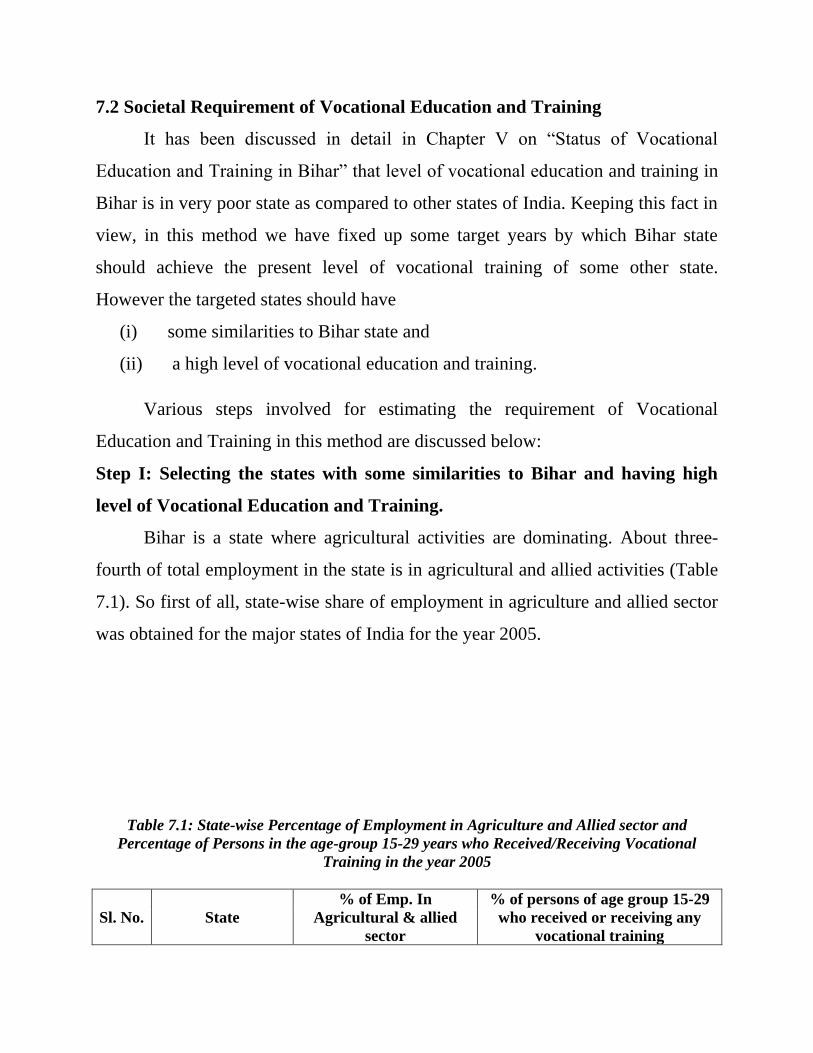
7.2 Societal Requirement of Vocational Education and Training
It has been discussed in detail in Chapter V on ―Status of Vocational
Education and Training in Bihar‖ that level of vocational education and training in
Bihar is in very poor state as compared to other states of India. Keeping this fact in
view, in this method we have fixed up some target years by which Bihar state
should achieve the present level of vocational training of some other state.
However the targeted states should have
(i) some similarities to Bihar state and
(ii) a high level of vocational education and training.
Various steps involved for estimating the requirement of Vocational
Education and Training in this method are discussed below:
Step I: Selecting the states with some similarities to Bihar and having high
level of Vocational Education and Training.
Bihar is a state where agricultural activities are dominating. About three-
fourth of total employment in the state is in agricultural and allied activities (Table
7.1). So first of all, state-wise share of employment in agriculture and allied sector
was obtained for the major states of India for the year 2005.
Table 7.1: State-wise Percentage of Employment in Agriculture and Allied sector and
Percentage of Persons in the age-group 15-29 years who Received/Receiving Vocational
Training in the year 2005
Sl. No. State
% of Emp. In
Agricultural & allied
sector
% of persons of age group 15-29
who received or receiving any
vocational training
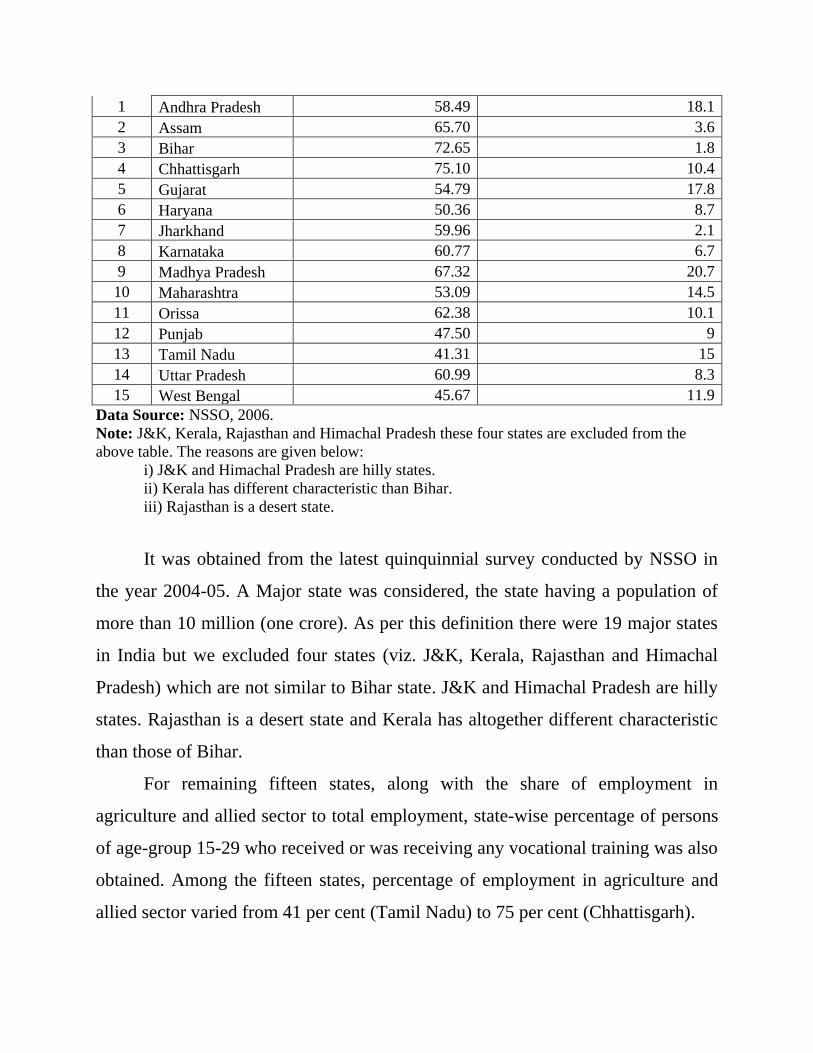
1 Andhra Pradesh 58.49 18.1
2 Assam 65.70 3.6
3 Bihar 72.65 1.8
4 Chhattisgarh 75.10 10.4
5 Gujarat 54.79 17.8
6 Haryana 50.36 8.7
7 Jharkhand 59.96 2.1
8 Karnataka 60.77 6.7
9 Madhya Pradesh 67.32 20.7
10 Maharashtra 53.09 14.5
11 Orissa 62.38 10.1
12 Punjab 47.50 9
13 Tamil Nadu 41.31 15
14 Uttar Pradesh 60.99 8.3
15 West Bengal 45.67 11.9
Data Source: NSSO, 2006.
Note: J&K, Kerala, Rajasthan and Himachal Pradesh these four states are excluded from the
above table. The reasons are given below:
i) J&K and Himachal Pradesh are hilly states.
ii) Kerala has different characteristic than Bihar.
iii) Rajasthan is a desert state.
It was obtained from the latest quinquinnial survey conducted by NSSO in
the year 2004-05. A Major state was considered, the state having a population of
more than 10 million (one crore). As per this definition there were 19 major states
in India but we excluded four states (viz. J&K, Kerala, Rajasthan and Himachal
Pradesh) which are not similar to Bihar state. J&K and Himachal Pradesh are hilly
states. Rajasthan is a desert state and Kerala has altogether different characteristic
than those of Bihar.
For remaining fifteen states, along with the share of employment in
agriculture and allied sector to total employment, state-wise percentage of persons
of age-group 15-29 who received or was receiving any vocational training was also
obtained. Among the fifteen states, percentage of employment in agriculture and
allied sector varied from 41 per cent (Tamil Nadu) to 75 per cent (Chhattisgarh).
If we take the share of employment in agriculture and allied activities as a
similarity among the states than out of these fifteen states, there are four other
states viz. Assam (66 per cent), Chhattisgarh (75 per cent), Madhya Pradesh (67
per cent) and Orissa (63 per cent) which have percentage employment in
―Agriculture and allied activities‖ in the range of ±10 per cent to that of Bihar state
(73 per cent).
Step II: Fixing the Targets of Vocational Education and Training
Among the four states having employment in agriculture and allied activities
close to that of Bihar, Chhattisgarh (10.4 per cent), Madhya Pradesh (20.7 per cent)
and Orissa (10.1 per cent) have much higher percentage of persons in the age-
group of 15-29 years who have received or were receiving any vocational training
as compared to Bihar state (1.8 per cent) in the year 2005. Though there are many
factors which determine the level of vocational education and training in a state but
share of employment in agriculture and allied activities in the state plays a vital
role in determining the level of vocational education and training. One can argue
that if these three states which are much similar and in proximity to Bihar state in
agriculture activities, can achieve a high level of vocational education and training
than why not Bihar in the near future.
Keeping this fact in view we have assumed that following two targets for
Bihar which can be achieved with some efforts by the state government.
(i) Bihar can achieve the target of 10 per cent persons in the age-group of 15-29
years who would have received or would be receiving the vocational
education and training by the year 2020. This is the present level of
Chhattisgarh and Orissa states.
(ii) Bihar can achieve the target of 20 per cent persons in the age-group of 15-
29 years who would have received or would be receiving the vocational
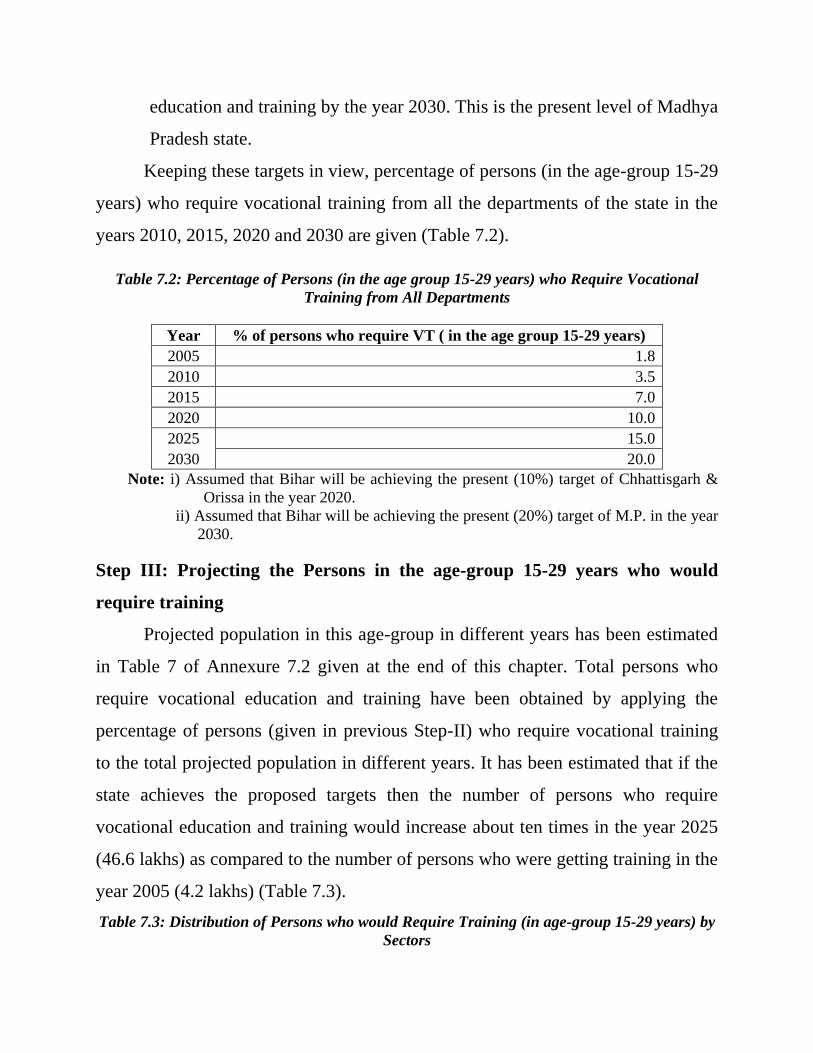
education and training by the year 2030. This is the present level of Madhya
Pradesh state.
Keeping these targets in view, percentage of persons (in the age-group 15-29
years) who require vocational training from all the departments of the state in the
years 2010, 2015, 2020 and 2030 are given (Table 7.2).
Table 7.2: Percentage of Persons (in the age group 15-29 years) who Require Vocational
Training from All Departments
Year % of persons who require VT ( in the age group 15-29 years)
2005 1.8
2010 3.5
2015 7.0
2020 10.0
2025 15.0
2030 20.0
Note: i) Assumed that Bihar will be achieving the present (10%) target of Chhattisgarh &
Orissa in the year 2020.
ii) Assumed that Bihar will be achieving the present (20%) target of M.P. in the year
2030.
Step III: Projecting the Persons in the age-group 15-29 years who would
require training
Projected population in this age-group in different years has been estimated
in Table 7 of Annexure 7.2 given at the end of this chapter. Total persons who
require vocational education and training have been obtained by applying the
percentage of persons (given in previous Step-II) who require vocational training
to the total projected population in different years. It has been estimated that if the
state achieves the proposed targets then the number of persons who require
vocational education and training would increase about ten times in the year 2025
(46.6 lakhs) as compared to the number of persons who were getting training in the
year 2005 (4.2 lakhs) (Table 7.3).
Table 7.3: Distribution of Persons who would Require Training (in age-group 15-29 years) by
Sectors
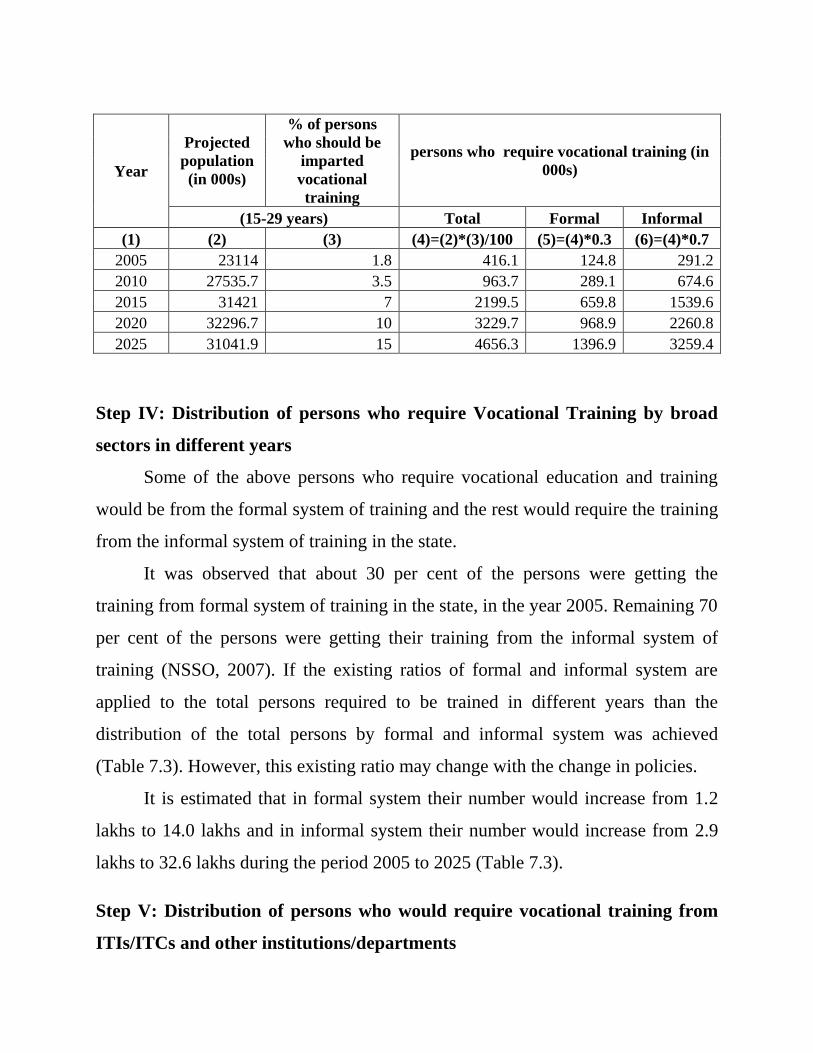
Year
Projected
population
(in 000s)
% of persons
who should be
imparted
vocational
training
persons who require vocational training (in
000s)
(15-29 years) Total Formal Informal
(1) (2) (3) (4)=(2)*(3)/100 (5)=(4)*0.3 (6)=(4)*0.7
2005 23114 1.8 416.1 124.8 291.2
2010 27535.7 3.5 963.7 289.1 674.6
2015 31421 7 2199.5 659.8 1539.6
2020 32296.7 10 3229.7 968.9 2260.8
2025 31041.9 15 4656.3 1396.9 3259.4
Step IV: Distribution of persons who require Vocational Training by broad
sectors in different years
Some of the above persons who require vocational education and training
would be from the formal system of training and the rest would require the training
from the informal system of training in the state.
It was observed that about 30 per cent of the persons were getting the
training from formal system of training in the state, in the year 2005. Remaining 70
per cent of the persons were getting their training from the informal system of
training (NSSO, 2007). If the existing ratios of formal and informal system are
applied to the total persons required to be trained in different years than the
distribution of the total persons by formal and informal system was achieved
(Table 7.3). However, this existing ratio may change with the change in policies.
It is estimated that in formal system their number would increase from 1.2
lakhs to 14.0 lakhs and in informal system their number would increase from 2.9
lakhs to 32.6 lakhs during the period 2005 to 2025 (Table 7.3).
Step V: Distribution of persons who would require vocational training from
ITIs/ITCs and other institutions/departments
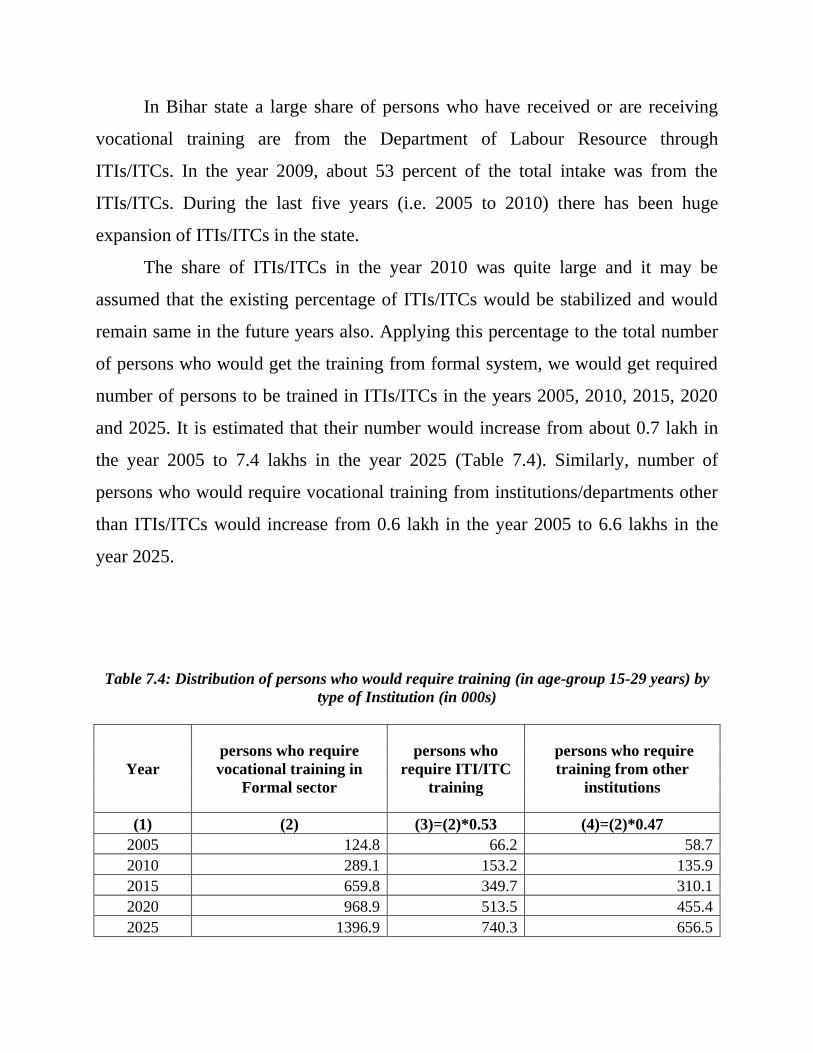
In Bihar state a large share of persons who have received or are receiving
vocational training are from the Department of Labour Resource through
ITIs/ITCs. In the year 2009, about 53 percent of the total intake was from the
ITIs/ITCs. During the last five years (i.e. 2005 to 2010) there has been huge
expansion of ITIs/ITCs in the state.
The share of ITIs/ITCs in the year 2010 was quite large and it may be
assumed that the existing percentage of ITIs/ITCs would be stabilized and would
remain same in the future years also. Applying this percentage to the total number
of persons who would get the training from formal system, we would get required
number of persons to be trained in ITIs/ITCs in the years 2005, 2010, 2015, 2020
and 2025. It is estimated that their number would increase from about 0.7 lakh in
the year 2005 to 7.4 lakhs in the year 2025 (Table 7.4). Similarly, number of
persons who would require vocational training from institutions/departments other
than ITIs/ITCs would increase from 0.6 lakh in the year 2005 to 6.6 lakhs in the
year 2025.
Table 7.4: Distribution of persons who would require training (in age-group 15-29 years) by
type of Institution (in 000s)
Year
persons who require
vocational training in
Formal sector
persons who
require ITI/ITC
training
persons who require
training from other
institutions
(1) (2) (3)=(2)*0.53 (4)=(2)*0.47
2005 124.8 66.2 58.7
2010 289.1 153.2 135.9
2015 659.8 349.7 310.1
2020 968.9 513.5 455.4
2025 1396.9 740.3 656.5
7.3 Estimates of the Persons with Non-formal Training
Table 7.3 gives an estimate of the persons who would require non-formal
vocational training from the informal sector. As per the estimates about 33 lakh
persons would be having non-formal training in the year 2025. One of the
objectives of Skill Development Mission set up by Government of India is to
increase the mobility and employability of the persons with non-formal vocational
training by certification. These future estimates of the persons with non-formal
vocational training can be used as the number of persons who would require
certification.
7.4 Comparison of Demand and Requirement of Vocationally Trained
Persons
In the last chapter on ―Estimating the Demand of Persons with Vocational
Education and Training‖, we have estimated the demand of persons in ITIs as well
as other institutions of the state by two methods. Out of the two methods Second
method was considered as better than the First method. Pass outs from it is/ITCs
and other institutions gives total demand of persons in formal sector in the state.
Comparison of demand estimates (Second Method) has been made with the
requirement (Table 7.5).
Obviously requirement estimates are higher than demand estimates. In case
of ITIs/ITCs pass outs, requirement was higher than demand by about 52,000 in
the year 2010 but this difference would increase to 2.6 lakhs in the year 2025. In
case of pass outs from ―Other Institutes‖ the difference was 46,000 in the year
2010 but this difference is likely to increase to 2.3 lakhs in the year 2025.
Table 7.5: Comparison of Future Demand and Requirement of Persons with Vocational
Training (in 000s)
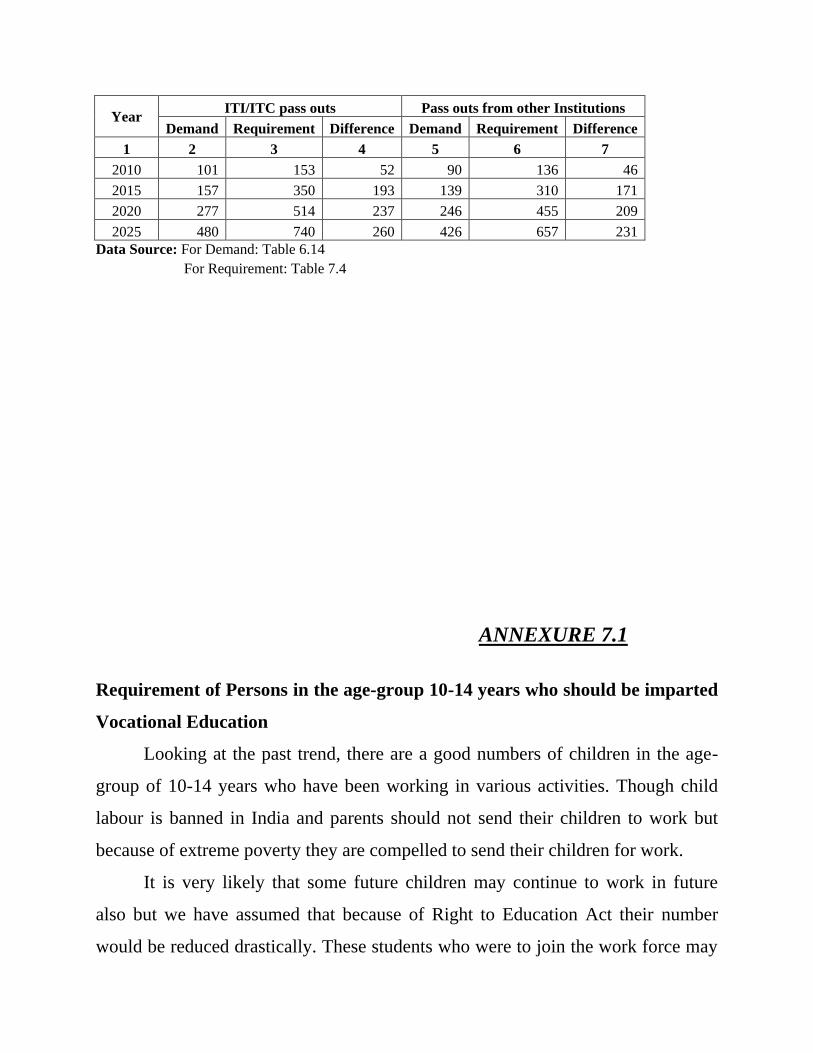
Year ITI/ITC pass outs Pass outs from other Institutions
Demand Requirement Difference Demand Requirement Difference
1 2 3 4 5 6 7
2010 101 153 52 90 136 46
2015 157 350 193 139 310 171
2020 277 514 237 246 455 209
2025 480 740 260 426 657 231 Data Source: For Demand: Table 6.14
For Requirement: Table 7.4
ANNEXURE 7.1
Requirement of Persons in the age-group 10-14 years who should be imparted
Vocational Education
Looking at the past trend, there are a good numbers of children in the age-
group of 10-14 years who have been working in various activities. Though child
labour is banned in India and parents should not send their children to work but
because of extreme poverty they are compelled to send their children for work.
It is very likely that some future children may continue to work in future
also but we have assumed that because of Right to Education Act their number
would be reduced drastically. These students who were to join the work force may
be imparted some Vocational Education in schools so that after attaining the
working age they can start some work in a more productive manner. Eleventh Five
Year Plan (Government of India, Planning Commission, 2006) has further
suggested that we should impart last mile employment related skills to these
students viz. English language skills, quantitative skills, computer literacy,
presentation skills, behavior and interpersonal skills etc.
Another point to be mentioned here is that the word ‗requirement‘ has
different meaning than ‗Demand‘. Requirement here means ‗social Demand‘ of the
state. This annexure gives the requirement of persons who should be imparted
vocational education in the age-group 10-14 years.
Estimating the population for the age-group 10-14 years
Projected population of Bihar state (as on 1st march) for the age-group 10-14
years is available from the office of Registrar General and Census Commissioner
of India (RG&CCI, 2006) for the years 2001, 2006, 2011, 2016, 2021 and 2026.
We required the projected population of Bihar state (as on 1st January) for this age-
group for the terminal years viz. 2005, 2010, 2015, 2020 and 2025. It is because
the age-group-wise WFPRs from employment and unemployment surveys
conducted by NSSO in the years 1993-94 and 2004-05 are available for 1st January.
So the projected population as on 1st January for terminal years was obtained from
the projected population of this age-group given by RG&CCI for the years 2001,
2006, 2011, 2016, 2021 and 2026 by interpolation method (Table 1 of Annexure
7.1). Estimates of population in this age-group during the years 2005, 2010, 2015,
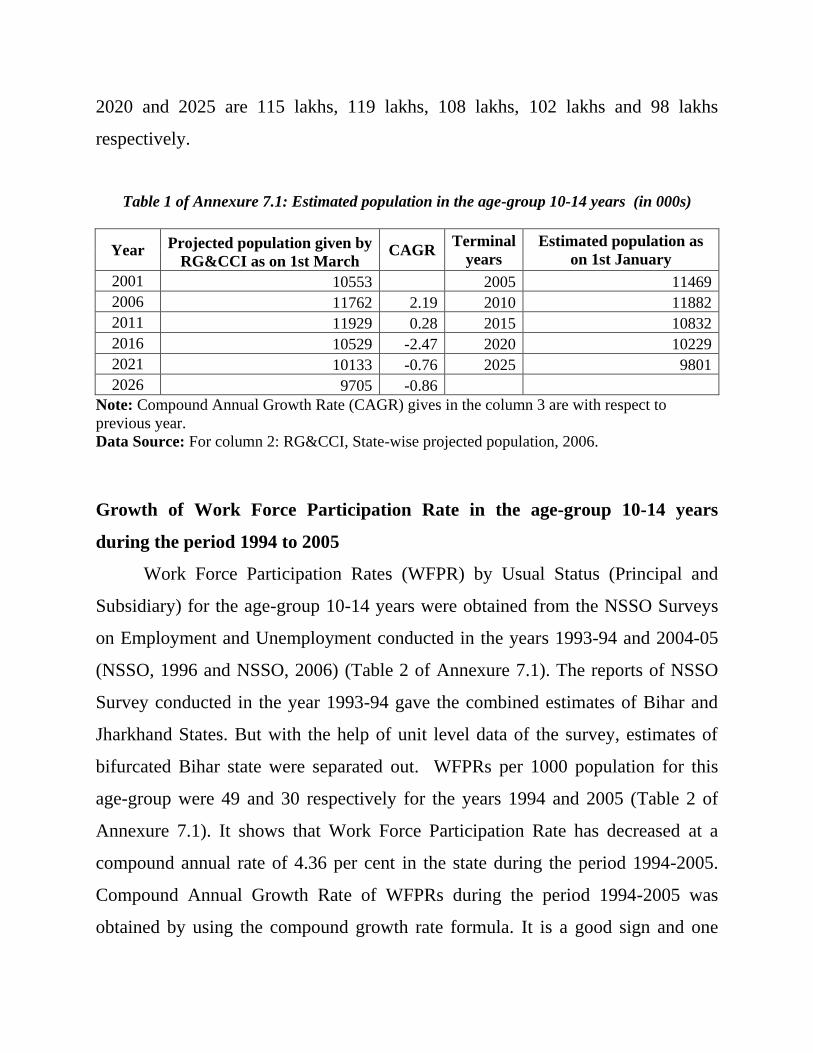
2020 and 2025 are 115 lakhs, 119 lakhs, 108 lakhs, 102 lakhs and 98 lakhs
respectively.
Table 1 of Annexure 7.1: Estimated population in the age-group 10-14 years (in 000s)
Year Projected population given by
RG&CCI as on 1st March CAGR
Terminal
years
Estimated population as
on 1st January
2001 10553 2005 11469
2006 11762 2.19 2010 11882
2011 11929 0.28 2015 10832
2016 10529 -2.47 2020 10229
2021 10133 -0.76 2025 9801
2026 9705 -0.86
Note: Compound Annual Growth Rate (CAGR) gives in the column 3 are with respect to
previous year.
Data Source: For column 2: RG&CCI, State-wise projected population, 2006.
Growth of Work Force Participation Rate in the age-group 10-14 years
during the period 1994 to 2005
Work Force Participation Rates (WFPR) by Usual Status (Principal and
Subsidiary) for the age-group 10-14 years were obtained from the NSSO Surveys
on Employment and Unemployment conducted in the years 1993-94 and 2004-05
(NSSO, 1996 and NSSO, 2006) (Table 2 of Annexure 7.1). The reports of NSSO
Survey conducted in the year 1993-94 gave the combined estimates of Bihar and
Jharkhand States. But with the help of unit level data of the survey, estimates of
bifurcated Bihar state were separated out. WFPRs per 1000 population for this
age-group were 49 and 30 respectively for the years 1994 and 2005 (Table 2 of
Annexure 7.1). It shows that Work Force Participation Rate has decreased at a
compound annual rate of 4.36 per cent in the state during the period 1994-2005.
Compound Annual Growth Rate of WFPRs during the period 1994-2005 was
obtained by using the compound growth rate formula. It is a good sign and one
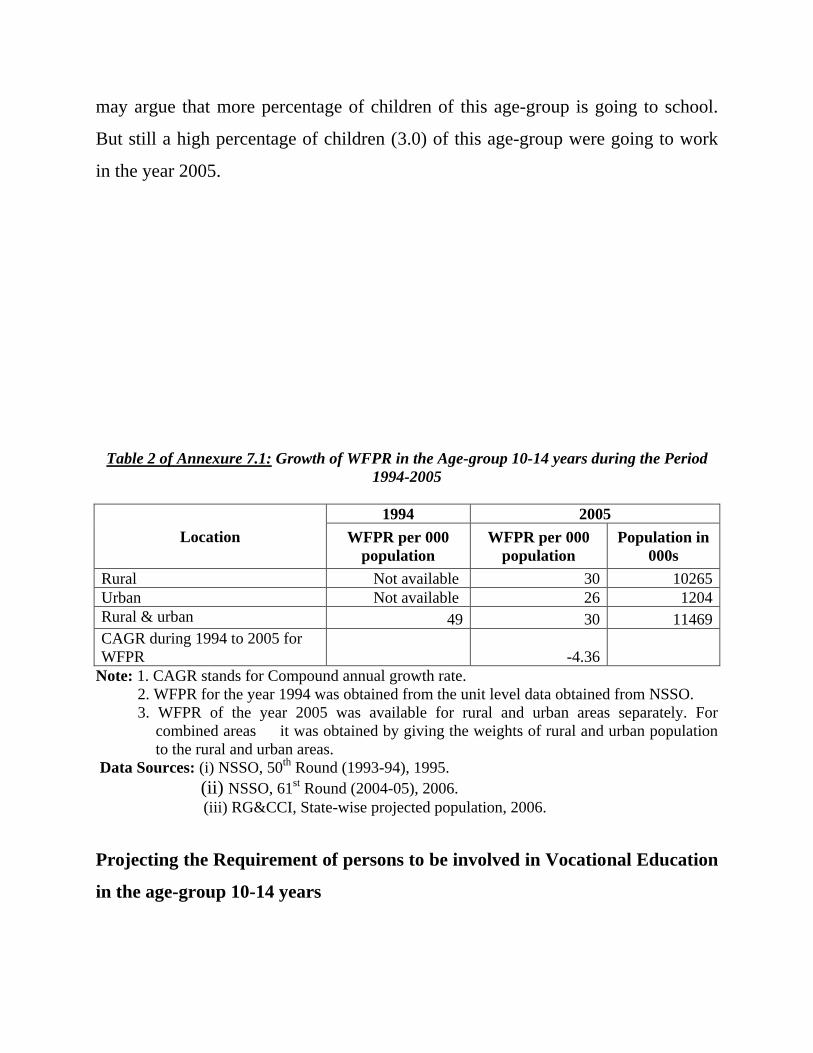
may argue that more percentage of children of this age-group is going to school.
But still a high percentage of children (3.0) of this age-group were going to work
in the year 2005.
Table 2 of Annexure 7.1: Growth of WFPR in the Age-group 10-14 years during the Period
1994-2005
Location
1994 2005
WFPR per 000
population
WFPR per 000
population
Population in
000s
Rural Not available 30 10265
Urban Not available 26 1204
Rural & urban 49 30 11469
CAGR during 1994 to 2005 for
WFPR -4.36
Note: 1. CAGR stands for Compound annual growth rate.
2. WFPR for the year 1994 was obtained from the unit level data obtained from NSSO.
3. WFPR of the year 2005 was available for rural and urban areas separately. For
combined areas it was obtained by giving the weights of rural and urban population
to the rural and urban areas. Data Sources: (i) NSSO, 50
th Round (1993-94), 1995.
(ii) NSSO, 61st Round (2004-05), 2006.
(iii) RG&CCI, State-wise projected population, 2006.
Projecting the Requirement of persons to be involved in Vocational Education
in the age-group 10-14 years
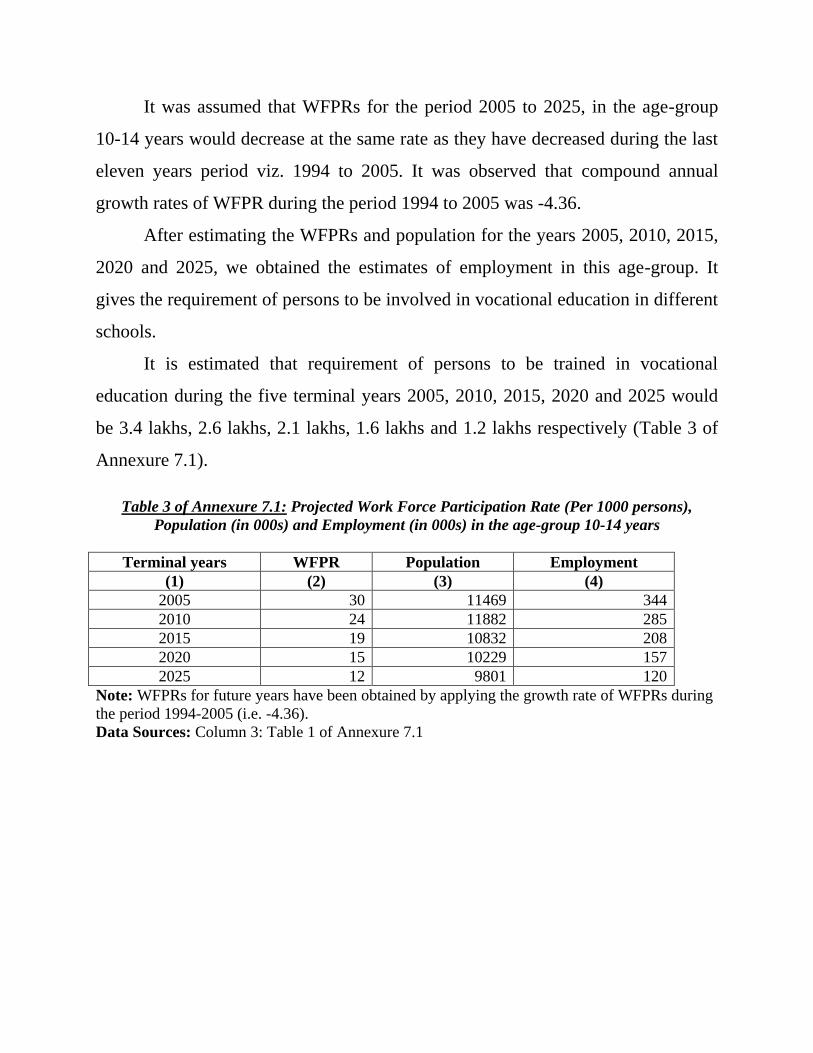
It was assumed that WFPRs for the period 2005 to 2025, in the age-group
10-14 years would decrease at the same rate as they have decreased during the last
eleven years period viz. 1994 to 2005. It was observed that compound annual
growth rates of WFPR during the period 1994 to 2005 was -4.36.
After estimating the WFPRs and population for the years 2005, 2010, 2015,
2020 and 2025, we obtained the estimates of employment in this age-group. It
gives the requirement of persons to be involved in vocational education in different
schools.
It is estimated that requirement of persons to be trained in vocational
education during the five terminal years 2005, 2010, 2015, 2020 and 2025 would
be 3.4 lakhs, 2.6 lakhs, 2.1 lakhs, 1.6 lakhs and 1.2 lakhs respectively (Table 3 of
Annexure 7.1).
Table 3 of Annexure 7.1: Projected Work Force Participation Rate (Per 1000 persons),
Population (in 000s) and Employment (in 000s) in the age-group 10-14 years
Terminal years WFPR Population Employment
(1) (2) (3) (4)
2005 30 11469 344
2010 24 11882 285
2015 19 10832 208
2020 15 10229 157
2025 12 9801 120
Note: WFPRs for future years have been obtained by applying the growth rate of WFPRs during
the period 1994-2005 (i.e. -4.36).
Data Sources: Column 3: Table 1 of Annexure 7.1
ANNEXURE 7.2
Requirement of Unemployed and underemployed in the Age-group 15-29 who
should be imparted Vocational Training
In this method, unemployed persons in the age-groups 15-19, 20-24 and 25-
29 are estimated for future years and that number would give an estimate of need
for vocational training. Objective of this training should be such that there is no
unemployed in future for reasons of skills. Some of the unemployed in these age-
groups particularly in the age-group 25-29 may be having higher professional
qualifications viz. doctors, engineers and diploma holders. These should not be
included in our estimate as the objective of our study is to estimate the number of
persons required to be trained in the vocational training for which the basic
qualification for admission is generally matriculation or below. But the number of
unemployed persons with such professional qualifications may be very few as
compared those having less qualifications. Similarly some of persons with higher
age-group (30 years and above) may also require vocational training. But such
persons may not be in the priority list. So these have also not been taken into
consideration. Number of projected unemployed persons in the age-group of 15-29
years has been estimated by using the proportion of unemployed to total population
in the year 2005 from NSSO Survey on Employment and Unemployment (NSSO,
2006).
Besides this there are a large number of underemployed persons in these
age-groups, who may be employed but their productivity is very low or get
employment for a short duration of the year. They should also be imparted some
vocational training to increase their productivity. There are different ways to
estimate the number of underemployed. One such estimate which gives the number
of underemployed is the difference in the number of unemployed by CDS and
Usual Status (UPSS) (Gupta, S.P.; 2006). Again there may be a large number of
underemployed in the age-group 30 years and above also but on priority basis we
have included only those who are in the age-group of 15-29 years.
These underemployed belong to the category of small and marginal farmers,
agriculture labourers, self employed, persons working part-time and seasonal jobs
and other persons working in the informal sector. They lack alternative gainful
employment available to them. Different courses in which the underemployed may
be imparted training may be started by ITIs/ITCs or other Departments of the state.
Such courses should be of short duration and should also be flexible in nature.
Their training and locations should be adjusted as per the requirement of the
underemployed persons living in a particular area.
Age-wise Number of Persons Requiring Vocational Education and Training
Step I: Age-wise Proportion of unemployed per 1000 population by usual
status in 2005
Age-group-wise proportion of unemployed to population (i.e. number of
unemployed per 1000 population) was not available directly for the year 2004-05,
from the NSSO report on Employment and Unemployment in India. For this we
have to use the WFPRs and Unemployment Rates (UR) of these age-groups.
Unemployment Rate is defined as the number of unemployed per 1000 labour
force (i.e. employed and unemployed combined). These estimates were also not
available for the total population rather they were available separately for rural and
urban areas. Again for combining the estimates of rural and urban areas, we have
to get the estimates of population in Bihar by location (Rural/Urban) and age-
groups, from NSSO report (Table 1 of Annexure 7.2). Population and WFPRs gave
the estimates of employed by location and age-groups (Table 2 of Annexure 7.2).
Numbers of unemployed by usual status (adjusted) were obtained by using the
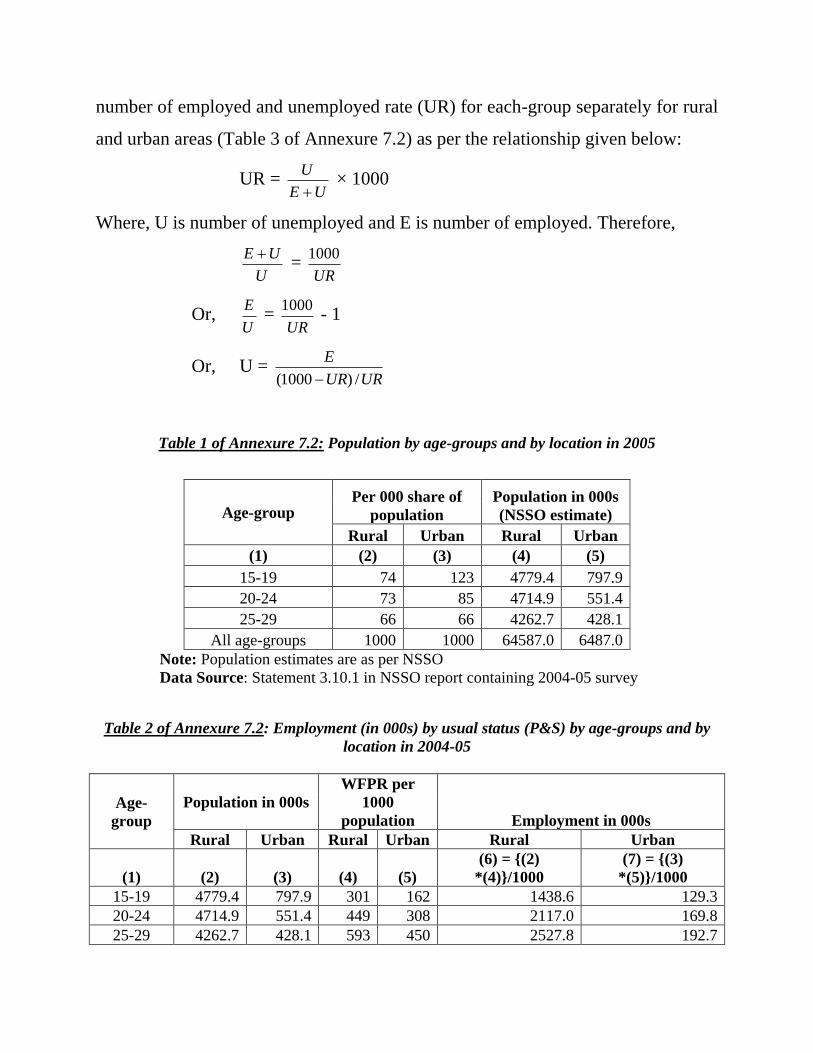
number of employed and unemployed rate (UR) for each-group separately for rural
and urban areas (Table 3 of Annexure 7.2) as per the relationship given below:
UR = UE
U
× 1000
Where, U is number of unemployed and E is number of employed. Therefore,
U
UE =
UR
1000
Or, U
E =
UR
1000 - 1
Or, U = URUR
E
/)1000(
Table 1 of Annexure 7.2: Population by age-groups and by location in 2005
Age-group Per 000 share of
population
Population in 000s
(NSSO estimate)
Rural Urban Rural Urban
(1) (2) (3) (4) (5)
15-19 74 123 4779.4 797.9
20-24 73 85 4714.9 551.4
25-29 66 66 4262.7 428.1
All age-groups 1000 1000 64587.0 6487.0
Note: Population estimates are as per NSSO
Data Source: Statement 3.10.1 in NSSO report containing 2004-05 survey
Table 2 of Annexure 7.2: Employment (in 000s) by usual status (P&S) by age-groups and by
location in 2004-05
Age-
group
Population in 000s
WFPR per
1000
population Employment in 000s
Rural Urban Rural Urban Rural Urban
(1) (2) (3) (4) (5)
(6) = {(2)
*(4)}/1000
(7) = {(3)
*(5)}/1000
15-19 4779.4 797.9 301 162 1438.6 129.3
20-24 4714.9 551.4 449 308 2117.0 169.8
25-29 4262.7 428.1 593 450 2527.8 192.7
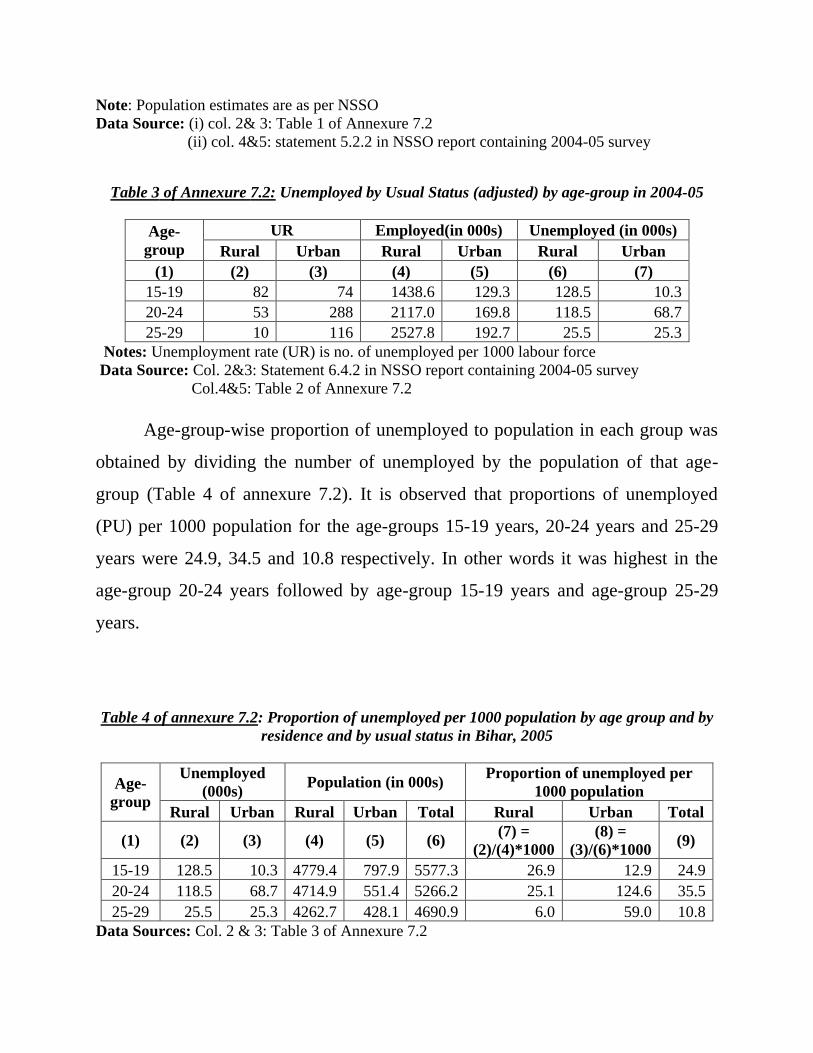
Note: Population estimates are as per NSSO
Data Source: (i) col. 2& 3: Table 1 of Annexure 7.2
(ii) col. 4&5: statement 5.2.2 in NSSO report containing 2004-05 survey
Table 3 of Annexure 7.2: Unemployed by Usual Status (adjusted) by age-group in 2004-05
Age-
group
UR Employed(in 000s) Unemployed (in 000s)
Rural Urban Rural Urban Rural Urban
(1) (2) (3) (4) (5) (6) (7)
15-19 82 74 1438.6 129.3 128.5 10.3
20-24 53 288 2117.0 169.8 118.5 68.7
25-29 10 116 2527.8 192.7 25.5 25.3
Notes: Unemployment rate (UR) is no. of unemployed per 1000 labour force
Data Source: Col. 2&3: Statement 6.4.2 in NSSO report containing 2004-05 survey
Col.4&5: Table 2 of Annexure 7.2
Age-group-wise proportion of unemployed to population in each group was
obtained by dividing the number of unemployed by the population of that age-
group (Table 4 of annexure 7.2). It is observed that proportions of unemployed
(PU) per 1000 population for the age-groups 15-19 years, 20-24 years and 25-29
years were 24.9, 34.5 and 10.8 respectively. In other words it was highest in the
age-group 20-24 years followed by age-group 15-19 years and age-group 25-29
years.
Table 4 of annexure 7.2: Proportion of unemployed per 1000 population by age group and by
residence and by usual status in Bihar, 2005
Age-
group
Unemployed
(000s) Population (in 000s)
Proportion of unemployed per
1000 population
Rural Urban Rural Urban Total Rural Urban Total
(1) (2) (3) (4) (5) (6) (7) =
(2)/(4)*1000
(8) =
(3)/(6)*1000 (9)
15-19 128.5 10.3 4779.4 797.9 5577.3 26.9 12.9 24.9
20-24 118.5 68.7 4714.9 551.4 5266.2 25.1 124.6 35.5
25-29 25.5 25.3 4262.7 428.1 4690.9 6.0 59.0 10.8
Data Sources: Col. 2 & 3: Table 3 of Annexure 7.2
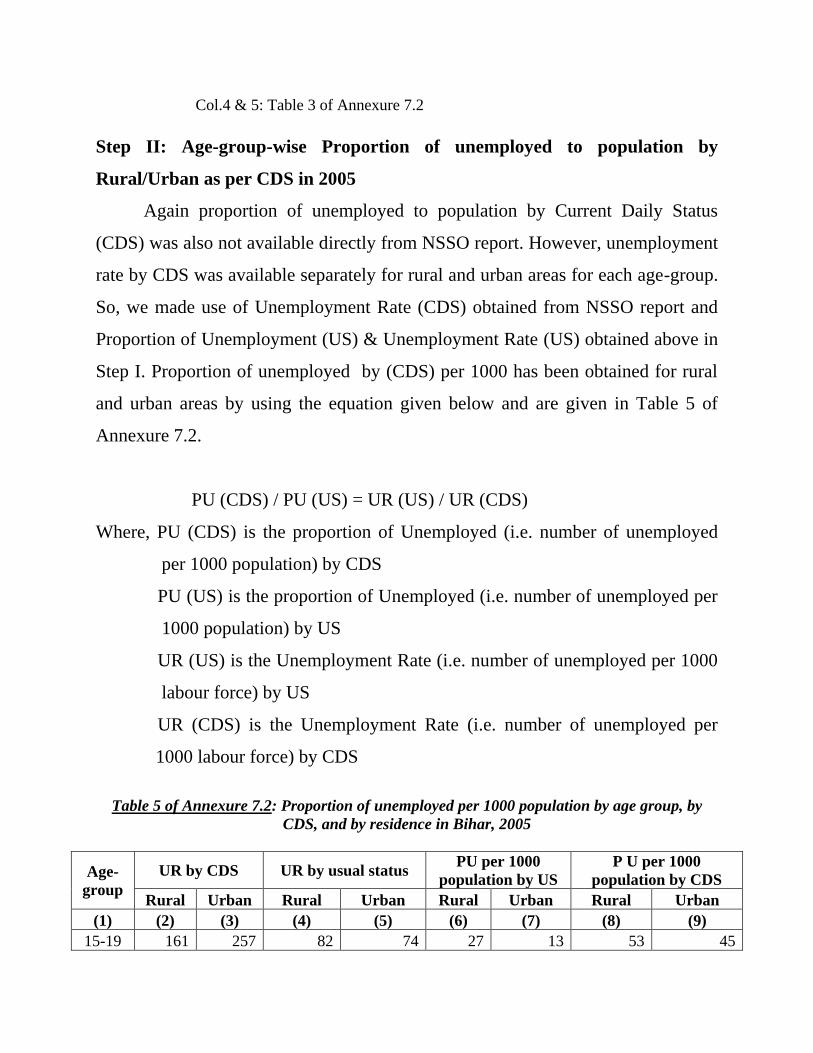
Col.4 & 5: Table 3 of Annexure 7.2
Step II: Age-group-wise Proportion of unemployed to population by
Rural/Urban as per CDS in 2005
Again proportion of unemployed to population by Current Daily Status
(CDS) was also not available directly from NSSO report. However, unemployment
rate by CDS was available separately for rural and urban areas for each age-group.
So, we made use of Unemployment Rate (CDS) obtained from NSSO report and
Proportion of Unemployment (US) & Unemployment Rate (US) obtained above in
Step I. Proportion of unemployed by (CDS) per 1000 has been obtained for rural
and urban areas by using the equation given below and are given in Table 5 of
Annexure 7.2.
PU (CDS) / PU (US) = UR (US) / UR (CDS)
Where, PU (CDS) is the proportion of Unemployed (i.e. number of unemployed
per 1000 population) by CDS
PU (US) is the proportion of Unemployed (i.e. number of unemployed per
1000 population) by US
UR (US) is the Unemployment Rate (i.e. number of unemployed per 1000
labour force) by US
UR (CDS) is the Unemployment Rate (i.e. number of unemployed per
1000 labour force) by CDS
Table 5 of Annexure 7.2: Proportion of unemployed per 1000 population by age group, by
CDS, and by residence in Bihar, 2005
Age-
group
UR by CDS UR by usual status PU per 1000
population by US
P U per 1000
population by CDS
Rural Urban Rural Urban Rural Urban Rural Urban
(1) (2) (3) (4) (5) (6) (7) (8) (9)
15-19 161 257 82 74 27 13 53 45
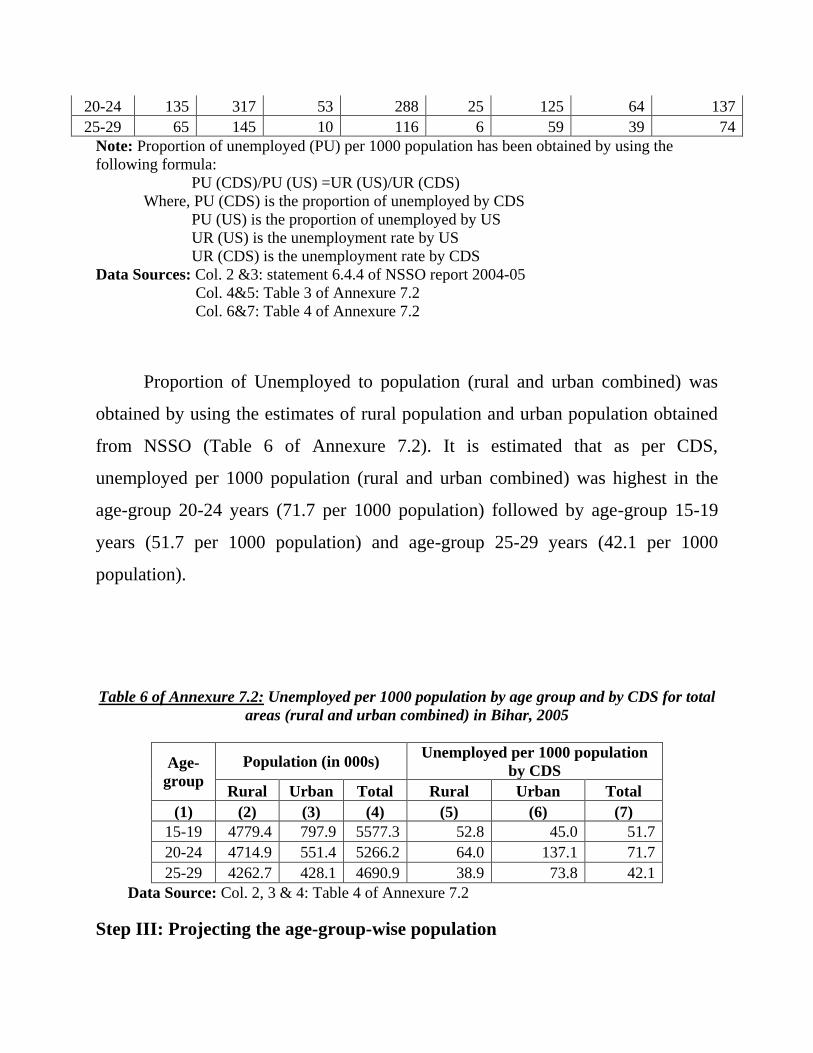
20-24 135 317 53 288 25 125 64 137
25-29 65 145 10 116 6 59 39 74
Note: Proportion of unemployed (PU) per 1000 population has been obtained by using the
following formula:
PU (CDS)/PU (US) =UR (US)/UR (CDS)
Where, PU (CDS) is the proportion of unemployed by CDS
PU (US) is the proportion of unemployed by US
UR (US) is the unemployment rate by US
UR (CDS) is the unemployment rate by CDS
Data Sources: Col. 2 &3: statement 6.4.4 of NSSO report 2004-05
Col. 4&5: Table 3 of Annexure 7.2
Col. 6&7: Table 4 of Annexure 7.2
Proportion of Unemployed to population (rural and urban combined) was
obtained by using the estimates of rural population and urban population obtained
from NSSO (Table 6 of Annexure 7.2). It is estimated that as per CDS,
unemployed per 1000 population (rural and urban combined) was highest in the
age-group 20-24 years (71.7 per 1000 population) followed by age-group 15-19
years (51.7 per 1000 population) and age-group 25-29 years (42.1 per 1000
population).
Table 6 of Annexure 7.2: Unemployed per 1000 population by age group and by CDS for total
areas (rural and urban combined) in Bihar, 2005
Age-
group
Population (in 000s) Unemployed per 1000 population
by CDS
Rural Urban Total Rural Urban Total
(1) (2) (3) (4) (5) (6) (7)
15-19 4779.4 797.9 5577.3 52.8 45.0 51.7
20-24 4714.9 551.4 5266.2 64.0 137.1 71.7
25-29 4262.7 428.1 4690.9 38.9 73.8 42.1
Data Source: Col. 2, 3 & 4: Table 4 of Annexure 7.2
Step III: Projecting the age-group-wise population
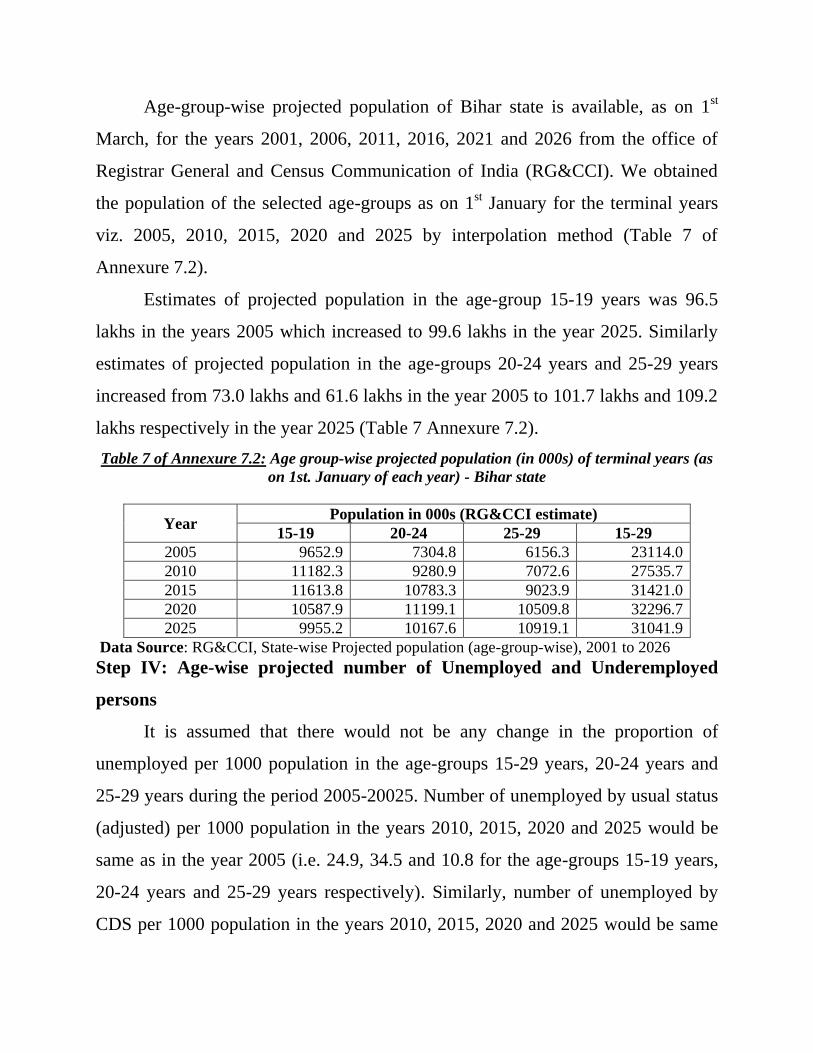
Age-group-wise projected population of Bihar state is available, as on 1st
March, for the years 2001, 2006, 2011, 2016, 2021 and 2026 from the office of
Registrar General and Census Communication of India (RG&CCI). We obtained
the population of the selected age-groups as on 1st January for the terminal years
viz. 2005, 2010, 2015, 2020 and 2025 by interpolation method (Table 7 of
Annexure 7.2).
Estimates of projected population in the age-group 15-19 years was 96.5
lakhs in the years 2005 which increased to 99.6 lakhs in the year 2025. Similarly
estimates of projected population in the age-groups 20-24 years and 25-29 years
increased from 73.0 lakhs and 61.6 lakhs in the year 2005 to 101.7 lakhs and 109.2
lakhs respectively in the year 2025 (Table 7 Annexure 7.2).
Table 7 of Annexure 7.2: Age group-wise projected population (in 000s) of terminal years (as
on 1st. January of each year) - Bihar state
Year Population in 000s (RG&CCI estimate)
15-19 20-24 25-29 15-29
2005 9652.9 7304.8 6156.3 23114.0
2010 11182.3 9280.9 7072.6 27535.7
2015 11613.8 10783.3 9023.9 31421.0
2020 10587.9 11199.1 10509.8 32296.7
2025 9955.2 10167.6 10919.1 31041.9
Data Source: RG&CCI, State-wise Projected population (age-group-wise), 2001 to 2026
Step IV: Age-wise projected number of Unemployed and Underemployed
persons
It is assumed that there would not be any change in the proportion of
unemployed per 1000 population in the age-groups 15-29 years, 20-24 years and
25-29 years during the period 2005-20025. Number of unemployed by usual status
(adjusted) per 1000 population in the years 2010, 2015, 2020 and 2025 would be
same as in the year 2005 (i.e. 24.9, 34.5 and 10.8 for the age-groups 15-19 years,
20-24 years and 25-29 years respectively). Similarly, number of unemployed by
CDS per 1000 population in the years 2010, 2015, 2020 and 2025 would be same
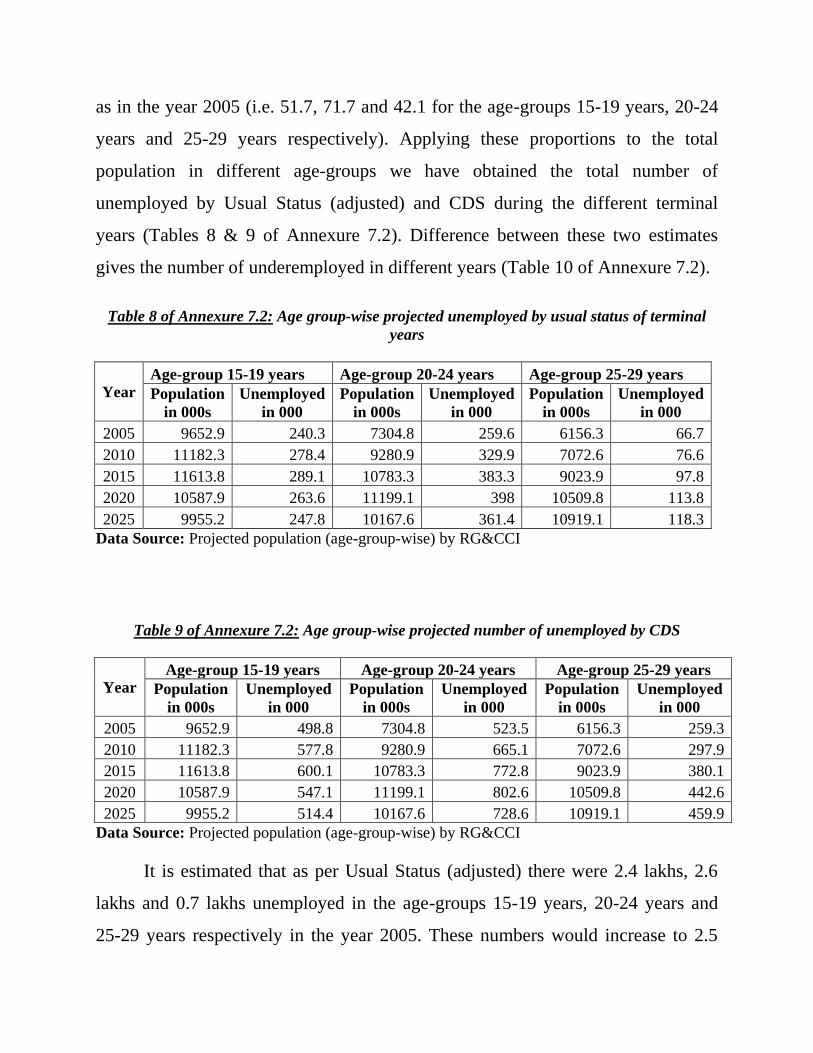
as in the year 2005 (i.e. 51.7, 71.7 and 42.1 for the age-groups 15-19 years, 20-24
years and 25-29 years respectively). Applying these proportions to the total
population in different age-groups we have obtained the total number of
unemployed by Usual Status (adjusted) and CDS during the different terminal
years (Tables 8 & 9 of Annexure 7.2). Difference between these two estimates
gives the number of underemployed in different years (Table 10 of Annexure 7.2).
Table 8 of Annexure 7.2: Age group-wise projected unemployed by usual status of terminal
years
Year Age-group 15-19 years Age-group 20-24 years Age-group 25-29 years
Population
in 000s
Unemployed
in 000
Population
in 000s
Unemployed
in 000
Population
in 000s
Unemployed
in 000
2005 9652.9 240.3 7304.8 259.6 6156.3 66.7
2010 11182.3 278.4 9280.9 329.9 7072.6 76.6
2015 11613.8 289.1 10783.3 383.3 9023.9 97.8
2020 10587.9 263.6 11199.1 398 10509.8 113.8
2025 9955.2 247.8 10167.6 361.4 10919.1 118.3
Data Source: Projected population (age-group-wise) by RG&CCI
Table 9 of Annexure 7.2: Age group-wise projected number of unemployed by CDS
Year Age-group 15-19 years Age-group 20-24 years Age-group 25-29 years
Population
in 000s
Unemployed
in 000
Population
in 000s
Unemployed
in 000
Population
in 000s
Unemployed
in 000
2005 9652.9 498.8 7304.8 523.5 6156.3 259.3
2010 11182.3 577.8 9280.9 665.1 7072.6 297.9
2015 11613.8 600.1 10783.3 772.8 9023.9 380.1
2020 10587.9 547.1 11199.1 802.6 10509.8 442.6
2025 9955.2 514.4 10167.6 728.6 10919.1 459.9
Data Source: Projected population (age-group-wise) by RG&CCI
It is estimated that as per Usual Status (adjusted) there were 2.4 lakhs, 2.6
lakhs and 0.7 lakhs unemployed in the age-groups 15-19 years, 20-24 years and
25-29 years respectively in the year 2005. These numbers would increase to 2.5
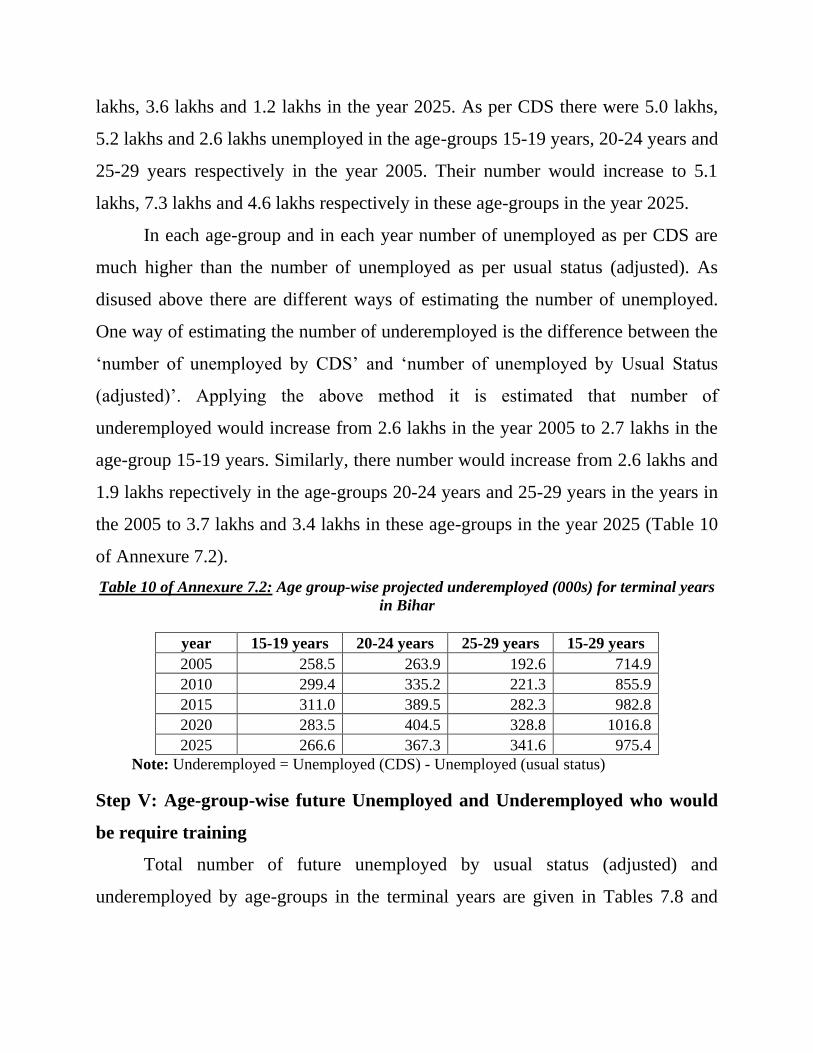
lakhs, 3.6 lakhs and 1.2 lakhs in the year 2025. As per CDS there were 5.0 lakhs,
5.2 lakhs and 2.6 lakhs unemployed in the age-groups 15-19 years, 20-24 years and
25-29 years respectively in the year 2005. Their number would increase to 5.1
lakhs, 7.3 lakhs and 4.6 lakhs respectively in these age-groups in the year 2025.
In each age-group and in each year number of unemployed as per CDS are
much higher than the number of unemployed as per usual status (adjusted). As
disused above there are different ways of estimating the number of unemployed.
One way of estimating the number of underemployed is the difference between the
‗number of unemployed by CDS‘ and ‗number of unemployed by Usual Status
(adjusted)‘. Applying the above method it is estimated that number of
underemployed would increase from 2.6 lakhs in the year 2005 to 2.7 lakhs in the
age-group 15-19 years. Similarly, there number would increase from 2.6 lakhs and
1.9 lakhs repectively in the age-groups 20-24 years and 25-29 years in the years in
the 2005 to 3.7 lakhs and 3.4 lakhs in these age-groups in the year 2025 (Table 10
of Annexure 7.2).
Table 10 of Annexure 7.2: Age group-wise projected underemployed (000s) for terminal years
in Bihar
year 15-19 years 20-24 years 25-29 years 15-29 years
2005 258.5 263.9 192.6 714.9
2010 299.4 335.2 221.3 855.9
2015 311.0 389.5 282.3 982.8
2020 283.5 404.5 328.8 1016.8
2025 266.6 367.3 341.6 975.4
Note: Underemployed = Unemployed (CDS) - Unemployed (usual status)
Step V: Age-group-wise future Unemployed and Underemployed who would
be require training
Total number of future unemployed by usual status (adjusted) and
underemployed by age-groups in the terminal years are given in Tables 7.8 and
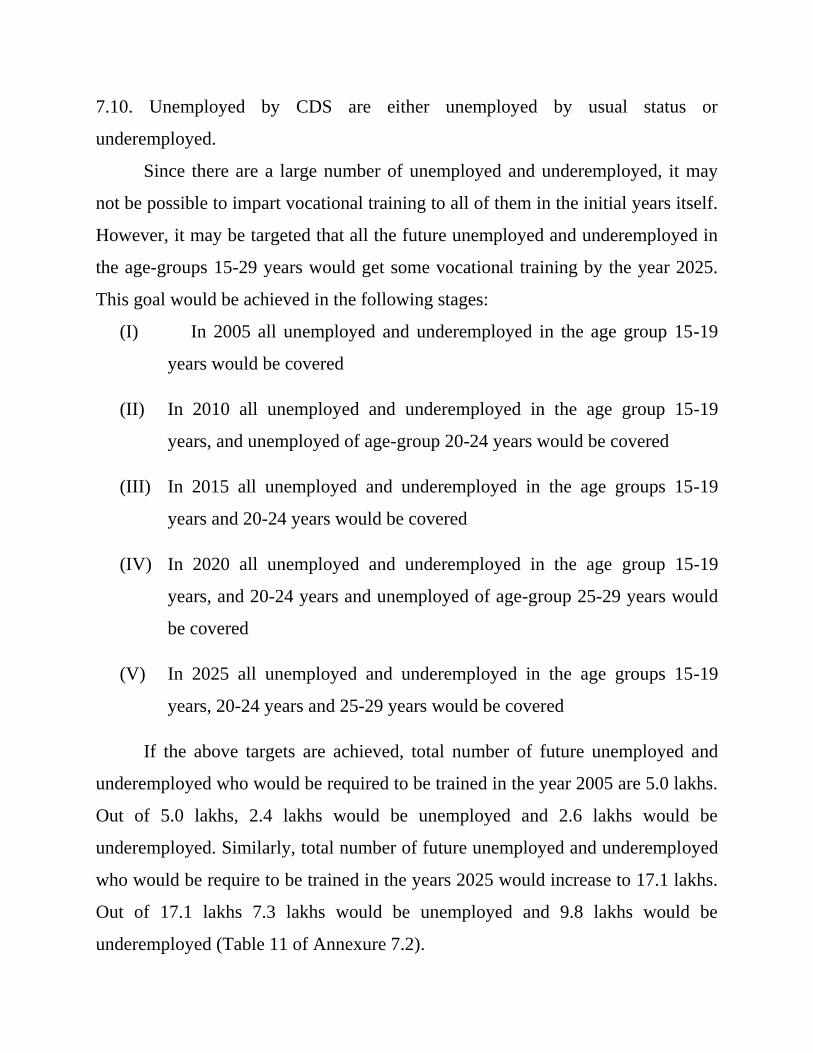
7.10. Unemployed by CDS are either unemployed by usual status or
underemployed.
Since there are a large number of unemployed and underemployed, it may
not be possible to impart vocational training to all of them in the initial years itself.
However, it may be targeted that all the future unemployed and underemployed in
the age-groups 15-29 years would get some vocational training by the year 2025.
This goal would be achieved in the following stages:
(I) In 2005 all unemployed and underemployed in the age group 15-19
years would be covered
(II) In 2010 all unemployed and underemployed in the age group 15-19
years, and unemployed of age-group 20-24 years would be covered
(III) In 2015 all unemployed and underemployed in the age groups 15-19
years and 20-24 years would be covered
(IV) In 2020 all unemployed and underemployed in the age group 15-19
years, and 20-24 years and unemployed of age-group 25-29 years would
be covered
(V) In 2025 all unemployed and underemployed in the age groups 15-19
years, 20-24 years and 25-29 years would be covered
If the above targets are achieved, total number of future unemployed and
underemployed who would be required to be trained in the year 2005 are 5.0 lakhs.
Out of 5.0 lakhs, 2.4 lakhs would be unemployed and 2.6 lakhs would be
underemployed. Similarly, total number of future unemployed and underemployed
who would be require to be trained in the years 2025 would increase to 17.1 lakhs.
Out of 17.1 lakhs 7.3 lakhs would be unemployed and 9.8 lakhs would be
underemployed (Table 11 of Annexure 7.2).
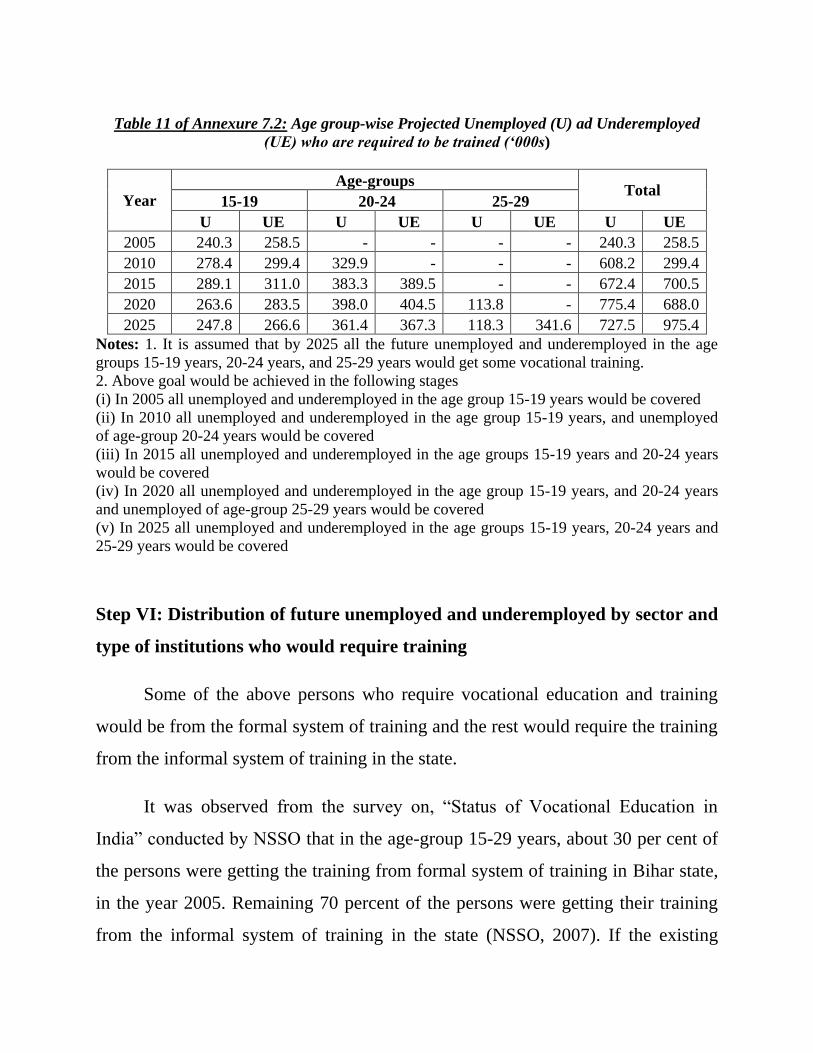
Table 11 of Annexure 7.2: Age group-wise Projected Unemployed (U) ad Underemployed
(UE) who are required to be trained (‘000s)
Year
Age-groups Total
15-19 20-24 25-29
U UE U UE U UE U UE
2005 240.3 258.5 - - - - 240.3 258.5
2010 278.4 299.4 329.9 - - - 608.2 299.4
2015 289.1 311.0 383.3 389.5 - - 672.4 700.5
2020 263.6 283.5 398.0 404.5 113.8 - 775.4 688.0
2025 247.8 266.6 361.4 367.3 118.3 341.6 727.5 975.4
Notes: 1. It is assumed that by 2025 all the future unemployed and underemployed in the age
groups 15-19 years, 20-24 years, and 25-29 years would get some vocational training.
2. Above goal would be achieved in the following stages
(i) In 2005 all unemployed and underemployed in the age group 15-19 years would be covered
(ii) In 2010 all unemployed and underemployed in the age group 15-19 years, and unemployed
of age-group 20-24 years would be covered
(iii) In 2015 all unemployed and underemployed in the age groups 15-19 years and 20-24 years
would be covered
(iv) In 2020 all unemployed and underemployed in the age group 15-19 years, and 20-24 years
and unemployed of age-group 25-29 years would be covered
(v) In 2025 all unemployed and underemployed in the age groups 15-19 years, 20-24 years and
25-29 years would be covered
Step VI: Distribution of future unemployed and underemployed by sector and
type of institutions who would require training
Some of the above persons who require vocational education and training
would be from the formal system of training and the rest would require the training
from the informal system of training in the state.
It was observed from the survey on, ―Status of Vocational Education in
India‖ conducted by NSSO that in the age-group 15-29 years, about 30 per cent of
the persons were getting the training from formal system of training in Bihar state,
in the year 2005. Remaining 70 percent of the persons were getting their training
from the informal system of training in the state (NSSO, 2007). If the existing
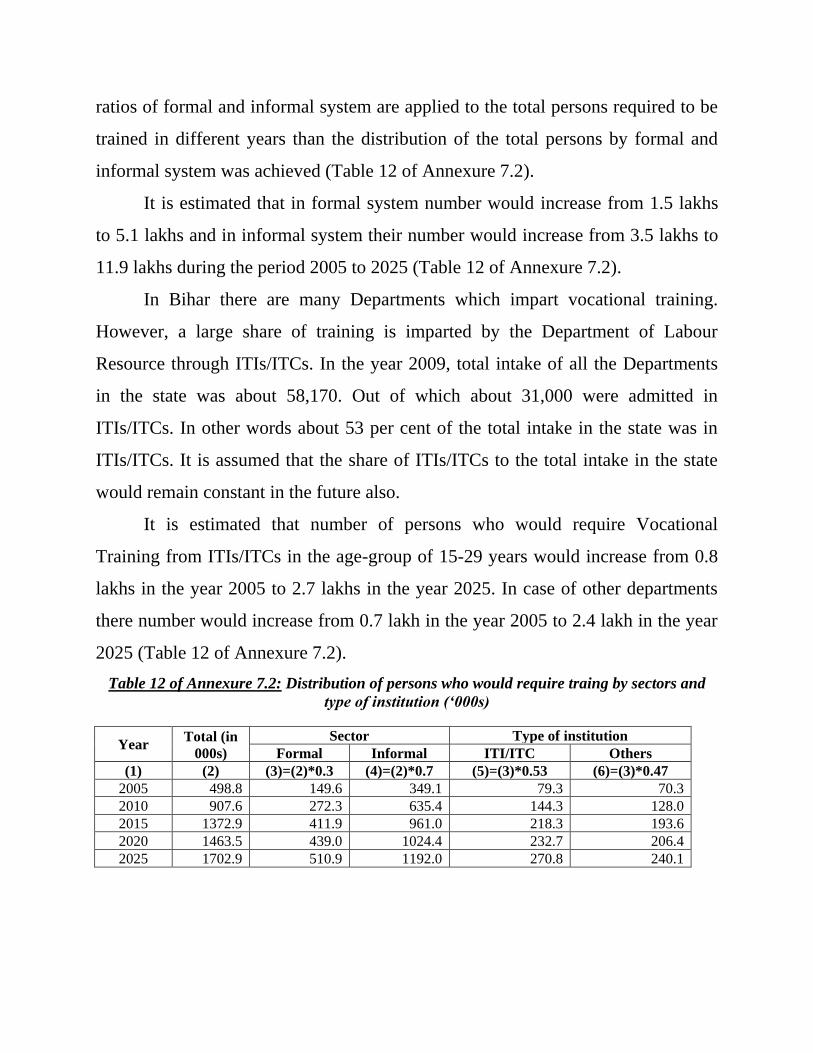
ratios of formal and informal system are applied to the total persons required to be
trained in different years than the distribution of the total persons by formal and
informal system was achieved (Table 12 of Annexure 7.2).
It is estimated that in formal system number would increase from 1.5 lakhs
to 5.1 lakhs and in informal system their number would increase from 3.5 lakhs to
11.9 lakhs during the period 2005 to 2025 (Table 12 of Annexure 7.2).
In Bihar there are many Departments which impart vocational training.
However, a large share of training is imparted by the Department of Labour
Resource through ITIs/ITCs. In the year 2009, total intake of all the Departments
in the state was about 58,170. Out of which about 31,000 were admitted in
ITIs/ITCs. In other words about 53 per cent of the total intake in the state was in
ITIs/ITCs. It is assumed that the share of ITIs/ITCs to the total intake in the state
would remain constant in the future also.
It is estimated that number of persons who would require Vocational
Training from ITIs/ITCs in the age-group of 15-29 years would increase from 0.8
lakhs in the year 2005 to 2.7 lakhs in the year 2025. In case of other departments
there number would increase from 0.7 lakh in the year 2005 to 2.4 lakh in the year
2025 (Table 12 of Annexure 7.2).
Table 12 of Annexure 7.2: Distribution of persons who would require traing by sectors and
type of institution (‘000s)
Year Total (in
000s) Sector Type of institution
Formal Informal ITI/ITC Others (1) (2) (3)=(2)*0.3 (4)=(2)*0.7 (5)=(3)*0.53 (6)=(3)*0.47
2005 498.8 149.6 349.1 79.3 70.3 2010 907.6 272.3 635.4 144.3 128.0 2015 1372.9 411.9 961.0 218.3 193.6 2020 1463.5 439.0 1024.4 232.7 206.4 2025 1702.9 510.9 1192.0 270.8 240.1
Chapter VIII Identification of Skill Sets in Bihar
8.1 Introduction
Beside this section the chapter has four more sections. Second section gives
the methodology for identification of skill-sets (trades). Third section is about the
sectors having concentration of skill-sets (trades) in future. It has discussed (a)
important trades in demand in India based on a study by FICCI (b) industry-wise
increase in demand of skilled persons in Bihar, and (c) concentration of some
selected trades in different industries in the State. Fourth section is about the views
of experts regarding the future demand of vocational skills in India, in select
sectors. Last section is about the existing trades being taught and new trades which
may be introduced in the state.
Chapter VI has detailed the sector-wise demand of skilled persons. In the
present chapter the main focus would be on identification of skill-sets (trades), in
which training should be imparted, through specially development training
modules delivered by the Departments dealing with skill formation.
Bihar, due to peculiar socio-economic and governance reasons, ranked at the
bottom in literacy ladder in India; low enrolment rates and high dropouts and
absence of adequate number of schools and teachers in Bihar are all cited in
literature. Similar trend also exists in vocational education and training. The
dropout students' entry in labour market without formal skill development creates
mismatch between demand and supply, in the skilled labour market. In the absence
of a proper certificate, skilled and semi-skilled workers of the state are subject to
exploitation and their mobility is very restricted. A basic problem with skill
development system is that the system is non-responsive to labour market, due to a
demand-supply mismatch on several counts viz. numbers, quantity and skill types.
It is also observed that the inflexibilities in the course/curriculum set-up,
lead to oversupply in some trades and shortages in others. To come out of these
problems it is necessary to create a pool of skilled personnel in appropriate
numbers with adequate skills in the line with the requirements of the ultimate users
such as the industry and service sectors. Such an effort is necessary to support the
employment expansion envisaged as a result of inclusive growth, including in
particular the shift of surplus labour from agriculture to non-agriculture in the state
of Bihar. In order to create a pool of skilled personnel in the adequate numbers
with appropriate skills in the line with the employment requirements across entire
economy with particular emphasis on the high growth and high employment
sectors, the state government must look into the appropriate structures aimed at
enhancing training opportunities of new entrants to the labour force. The state can
capitalize on its demographic dividend only by up-gradation and introduction of
trades which have demand in the economy. Hence, one of the important tasks is to
make concrete plans in a mission mode towards improving the educational
attainment of the labour force.
8.2 Methodology for Identification of Skill-sets (Trades)
Planning Commission, Government of India has identified twenty high
growth sectors for vocational skills where employment can be generated. These
sectors are also relevant for Bihar state, where employment can be generated in
future and pass-outs of vocational institutes can be absorbed. The list comprising
of twenty growth sectors for vocational skills is given at the end of this chapter in
Annexure VIII.I.
Chapter IV of this report has discussed in detail about the resources of Bihar
state. It gives an idea about the area where employment could be generated in
future. In turn it also gives an idea of the trades specific to growth sectors, which
will be demanded. While doing this exercise we have discussed the matter with
officers of various departments of States and Centre. Officials of industries and
other offices located at Delhi viz. FICCI, Planning Commission and DGE&T gave
an idea about the high growth sectors where employment could be generated and
new trades could be introduced. Reports, papers and articles published by different
organizations viz. DGE&T, IAMR, Department of Industries, Government of
Bihar, IGNOU were also consulted.
It was also important to know about the long duration trades (one year and
more duration) and short duration trades (less than one year duration) which are
taught in ITIs/ITCs and other Institutions/Departments of Bihar. These trades were
distributed among different growth sectors identified by Planning Commission (in
consultation with FICCI) to know about the growth sectors which are not being
covered, so far as training component is concerned.
We also, consulted the reports of labour departments of two developed states
viz. Maharashtra and Gujarat for identifying the trades which are being taught in
these developed states but these are not being taught in the state of Bihar though
they have employment potential in the state. List of such trades is given at the end
of this chapter in Annexure VIII.2.
A long list of courses under Modular Employment Scheme (MES) approved
by National Council of Vocational Trust (NCVT) is also available. As per the
latest data as on August, 2010, there are 1164 courses under 64 different sectors. It
also gives the minimum educational qualification required for admission in these
courses, duration of the courses (in hours), and test fee of the course. These details
of the courses under MES were also taken into consideration while identifying the
new trades for Bihar. Sector-wise number of courses, approved by NCVT are
given in Annexure VIII.3.
8.3 Sectors having concentration of skill-sets (trades) in Future
8.3.1 All INDIA
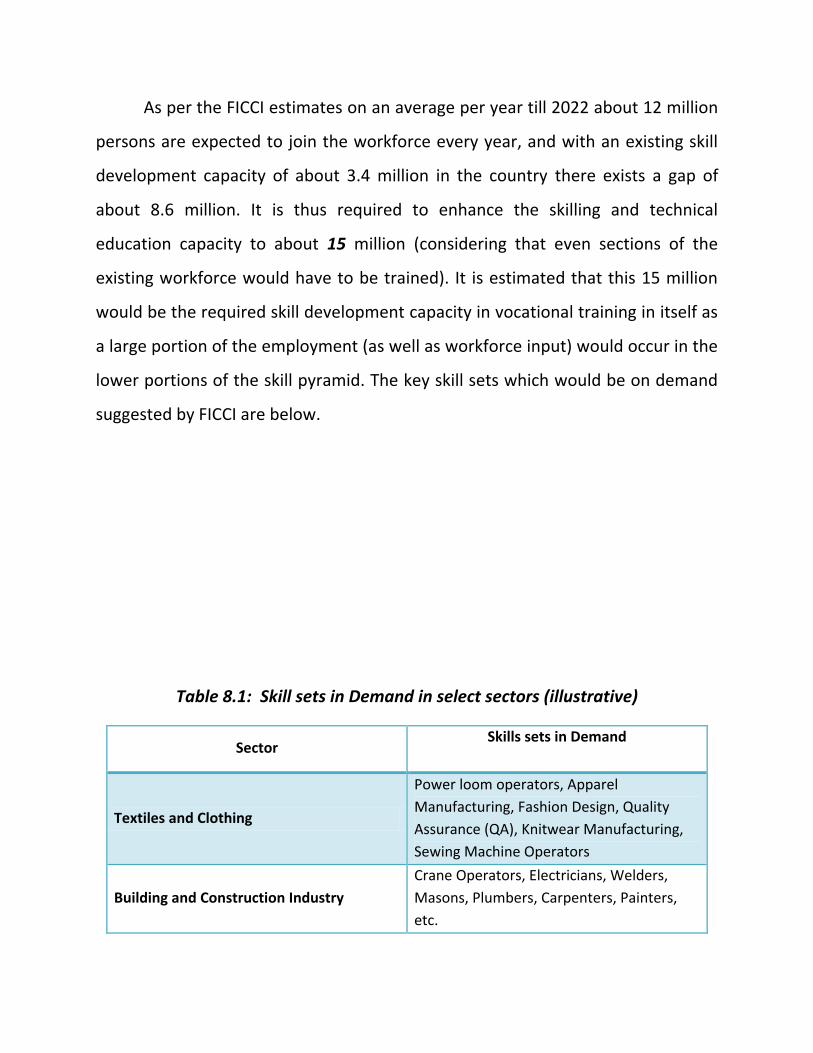
As per the FICCI estimates on an average per year till 2022 about 12 million
persons are expected to join the workforce every year, and with an existing skill
development capacity of about 3.4 million in the country there exists a gap of
about 8.6 million. It is thus required to enhance the skilling and technical
education capacity to about 15 million (considering that even sections of the
existing workforce would have to be trained). It is estimated that this 15 million
would be the required skill development capacity in vocational training in itself as
a large portion of the employment (as well as workforce input) would occur in the
lower portions of the skill pyramid. The key skill sets which would be on demand
suggested by FICCI are below.
Table 8.1: Skill sets in Demand in select sectors (illustrative)
Sector Skills sets in Demand
Textiles and Clothing
Power loom operators, Apparel
Manufacturing, Fashion Design, Quality
Assurance (QA), Knitwear Manufacturing,
Sewing Machine Operators
Building and Construction Industry
Crane Operators, Electricians, Welders,
Masons, Plumbers, Carpenters, Painters,
etc.
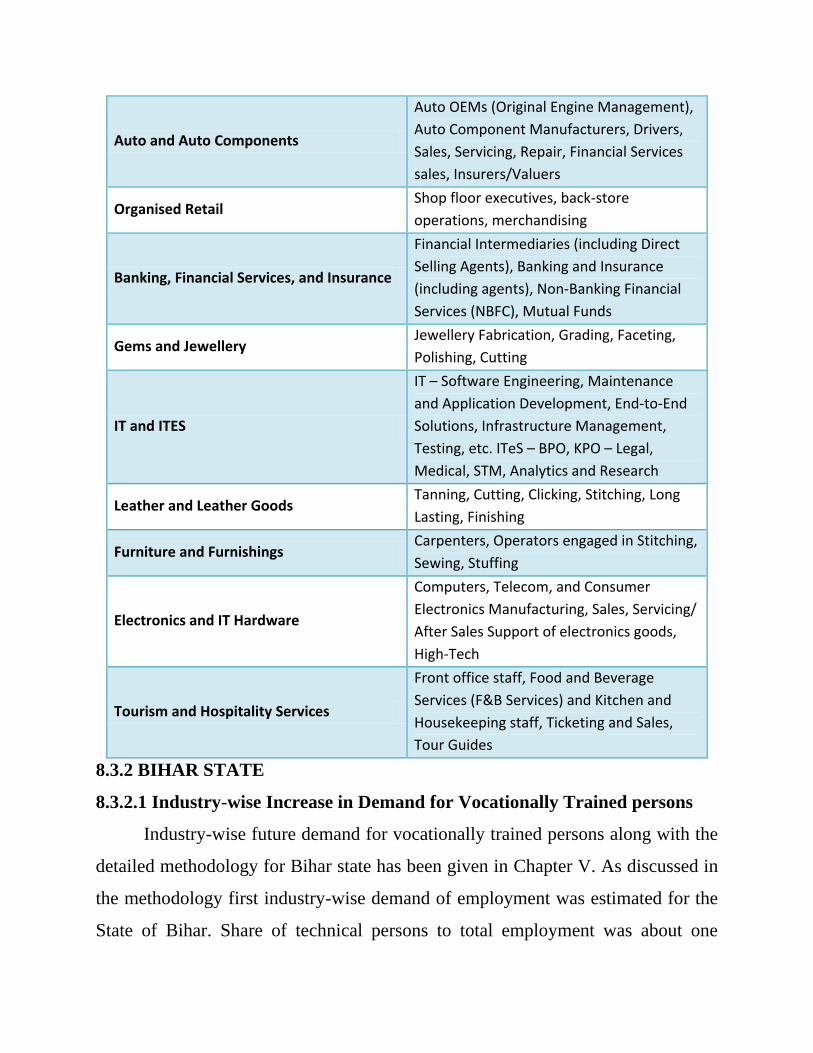
Auto and Auto Components
Auto OEMs (Original Engine Management),
Auto Component Manufacturers, Drivers,
Sales, Servicing, Repair, Financial Services
sales, Insurers/Valuers
Organised Retail Shop floor executives, back-store
operations, merchandising
Banking, Financial Services, and Insurance
Financial Intermediaries (including Direct
Selling Agents), Banking and Insurance
(including agents), Non-Banking Financial
Services (NBFC), Mutual Funds
Gems and Jewellery Jewellery Fabrication, Grading, Faceting,
Polishing, Cutting
IT and ITES
IT – Software Engineering, Maintenance
and Application Development, End-to-End
Solutions, Infrastructure Management,
Testing, etc. ITeS – BPO, KPO – Legal,
Medical, STM, Analytics and Research
Leather and Leather Goods Tanning, Cutting, Clicking, Stitching, Long
Lasting, Finishing
Furniture and Furnishings Carpenters, Operators engaged in Stitching,
Sewing, Stuffing
Electronics and IT Hardware
Computers, Telecom, and Consumer
Electronics Manufacturing, Sales, Servicing/
After Sales Support of electronics goods,
High-Tech
Tourism and Hospitality Services
Front office staff, Food and Beverage
Services (F&B Services) and Kitchen and
Housekeeping staff, Ticketing and Sales,
Tour Guides
8.3.2 BIHAR STATE
8.3.2.1 Industry-wise Increase in Demand for Vocationally Trained persons
Industry-wise future demand for vocationally trained persons along with the
detailed methodology for Bihar state has been given in Chapter V. As discussed in
the methodology first industry-wise demand of employment was estimated for the
State of Bihar. Share of technical persons to total employment was about one
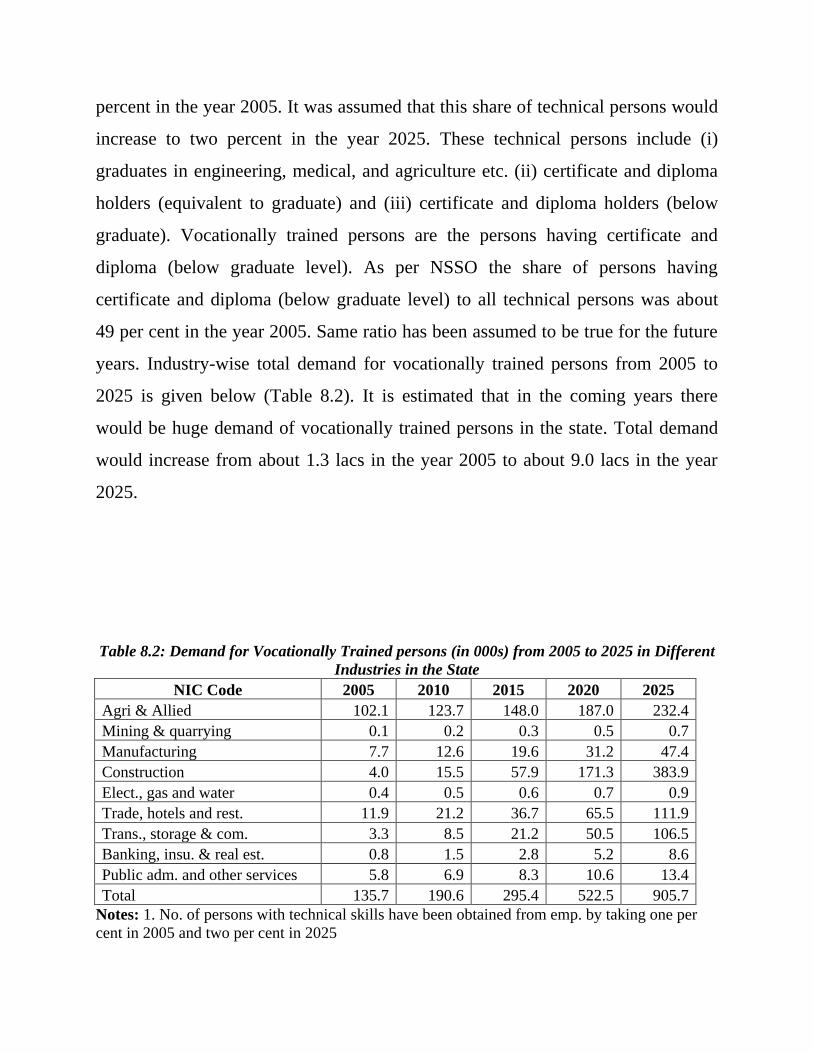
percent in the year 2005. It was assumed that this share of technical persons would
increase to two percent in the year 2025. These technical persons include (i)
graduates in engineering, medical, and agriculture etc. (ii) certificate and diploma
holders (equivalent to graduate) and (iii) certificate and diploma holders (below
graduate). Vocationally trained persons are the persons having certificate and
diploma (below graduate level). As per NSSO the share of persons having
certificate and diploma (below graduate level) to all technical persons was about
49 per cent in the year 2005. Same ratio has been assumed to be true for the future
years. Industry-wise total demand for vocationally trained persons from 2005 to
2025 is given below (Table 8.2). It is estimated that in the coming years there
would be huge demand of vocationally trained persons in the state. Total demand
would increase from about 1.3 lacs in the year 2005 to about 9.0 lacs in the year
2025.
Table 8.2: Demand for Vocationally Trained persons (in 000s) from 2005 to 2025 in Different
Industries in the State
NIC Code 2005 2010 2015 2020 2025
Agri & Allied 102.1 123.7 148.0 187.0 232.4
Mining & quarrying 0.1 0.2 0.3 0.5 0.7
Manufacturing 7.7 12.6 19.6 31.2 47.4
Construction 4.0 15.5 57.9 171.3 383.9
Elect., gas and water 0.4 0.5 0.6 0.7 0.9
Trade, hotels and rest. 11.9 21.2 36.7 65.5 111.9
Trans., storage & com. 3.3 8.5 21.2 50.5 106.5
Banking, insu. & real est. 0.8 1.5 2.8 5.2 8.6
Public adm. and other services 5.8 6.9 8.3 10.6 13.4
Total 135.7 190.6 295.4 522.5 905.7
Notes: 1. No. of persons with technical skills have been obtained from emp. by taking one per
cent in 2005 and two per cent in 2025
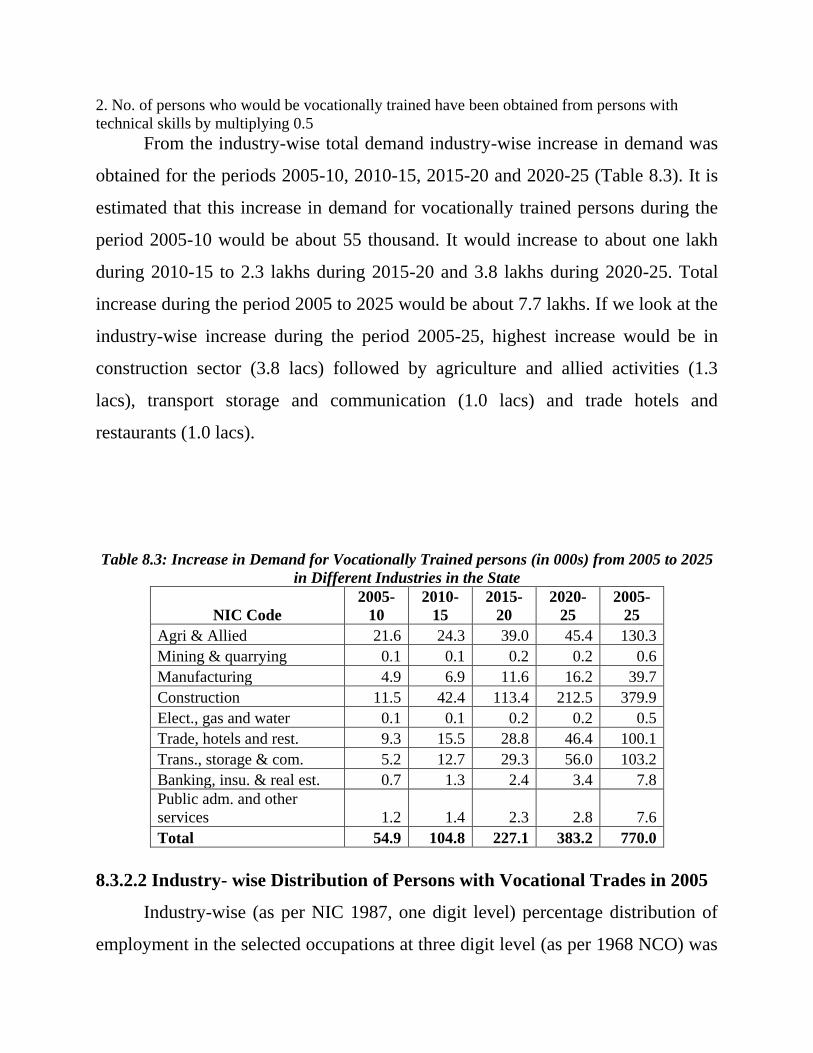
2. No. of persons who would be vocationally trained have been obtained from persons with
technical skills by multiplying 0.5
From the industry-wise total demand industry-wise increase in demand was
obtained for the periods 2005-10, 2010-15, 2015-20 and 2020-25 (Table 8.3). It is
estimated that this increase in demand for vocationally trained persons during the
period 2005-10 would be about 55 thousand. It would increase to about one lakh
during 2010-15 to 2.3 lakhs during 2015-20 and 3.8 lakhs during 2020-25. Total
increase during the period 2005 to 2025 would be about 7.7 lakhs. If we look at the
industry-wise increase during the period 2005-25, highest increase would be in
construction sector (3.8 lacs) followed by agriculture and allied activities (1.3
lacs), transport storage and communication (1.0 lacs) and trade hotels and
restaurants (1.0 lacs).
Table 8.3: Increase in Demand for Vocationally Trained persons (in 000s) from 2005 to 2025
in Different Industries in the State
NIC Code
2005-
10
2010-
15
2015-
20
2020-
25
2005-
25
Agri & Allied 21.6 24.3 39.0 45.4 130.3
Mining & quarrying 0.1 0.1 0.2 0.2 0.6
Manufacturing 4.9 6.9 11.6 16.2 39.7
Construction 11.5 42.4 113.4 212.5 379.9
Elect., gas and water 0.1 0.1 0.2 0.2 0.5
Trade, hotels and rest. 9.3 15.5 28.8 46.4 100.1
Trans., storage & com. 5.2 12.7 29.3 56.0 103.2
Banking, insu. & real est. 0.7 1.3 2.4 3.4 7.8
Public adm. and other
services 1.2 1.4 2.3 2.8 7.6
Total 54.9 104.8 227.1 383.2 770.0
8.3.2.2 Industry- wise Distribution of Persons with Vocational Trades in 2005
Industry-wise (as per NIC 1987, one digit level) percentage distribution of
employment in the selected occupations at three digit level (as per 1968 NCO) was
obtained for Bihar from NSSO survey for the year 2005 and is given in Table 8.4.
These occupations were selected in such a way that either they are exactly same or
are very much similar to the trades being covered in the State. Vocational trades
covered by each selected occupation is shown within the parenthesis. So we can
say that this distribution of employment in the selected occupations at three digit
level also gives an idea of industry-wise distribution of persons with vocation
vocational trades in that year.
As per this distribution, it is observed that 62 per cent of ―mechanic-
agriculture machinery persons‖ were employed in Agriculture & allied industry in
the year 2005. Similarly, 96 per cent of ―persons with foundry trade‖, 100 per cent
with ―fashion technology‖, 92 per cent with ―computer aided embroidery and
needle work‖ and 58 per cent with ―bakery and confectionary trade‖ were
employed in manufacturing industry. Construction industry has employed 64 per
cent of the persons of the persons with ―Building maintenance‖, 95 per cent of
―painters‖ and 91 per cent of ―masons‖ as their skill. Trade, hotels and restaurant
industry has employed a very high share of persons with ―Hotel and restaurant
keepers‖ (100 per cent) and ―Leather foot wear‖ (71 per cent). Banking, insurance
and real estate industry employs ―Agents and salesman‖ (100 per cent), ―Agents,
brokers shares and real estate‖ (100 per cent). Similarly, Public Administration and
other services industry employed 100 per cent of ―Photography/digital
photographer‖, 81 per cent of ―Steward‖ and ―Hospital house keeping‖, 100 per
cent of ―Ayahas & maids‖, 100 per cent of ―home care-maid servant‖, and 99 per
cent of ―Beauticians and related work‖ (Table 8.4).
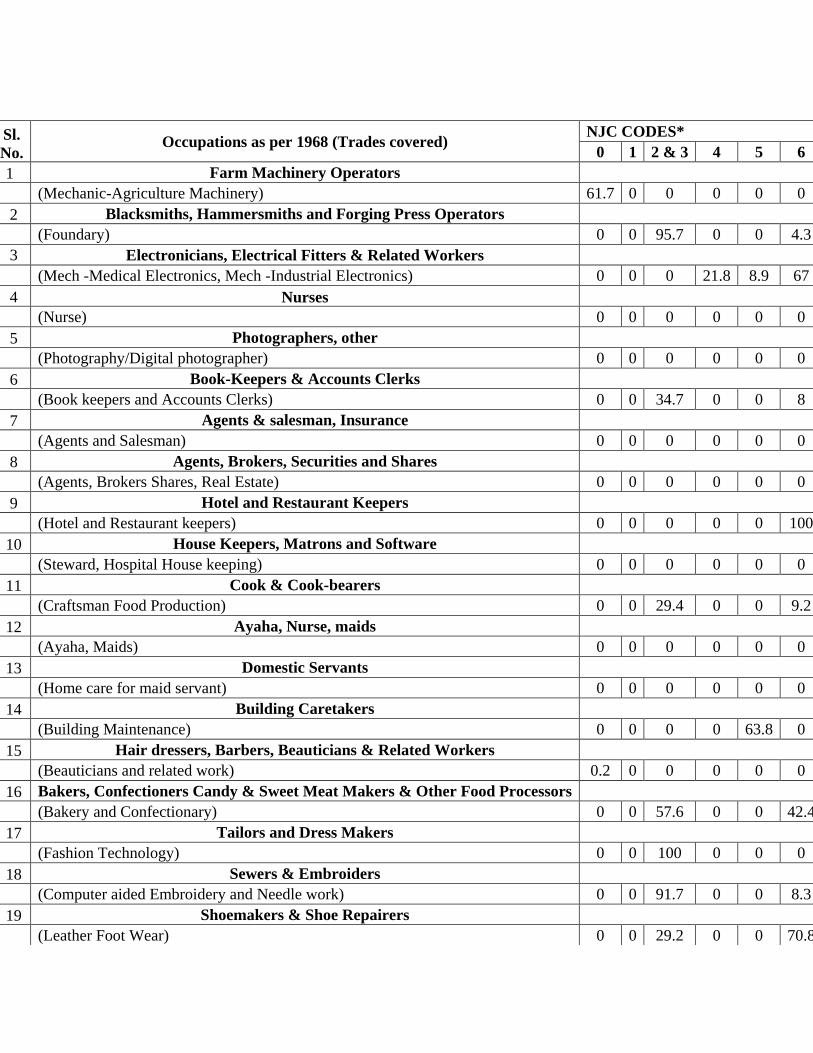
Sl.
No. Occupations as per 1968 (Trades covered)
NJC CODES*
0 1 2 & 3 4 5 6 7 8 9 Total
1 Farm Machinery Operators
(Mechanic-Agriculture Machinery) 61.7 0 0 0 0 0 38.3 0 0 100
2 Blacksmiths, Hammersmiths and Forging Press Operators
(Foundary) 0 0 95.7 0 0 4.3 0 0 0 100
3 Electronicians, Electrical Fitters & Related Workers
(Mech -Medical Electronics, Mech -Industrial Electronics) 0 0 0 21.8 8.9 67 0 0 2.3 100
4 Nurses
(Nurse) 0 0 0 0 0 0 0 0 100 100
5 Photographers, other
(Photography/Digital photographer) 0 0 0 0 0 0 0 100 0 100
6 Book-Keepers & Accounts Clerks
(Book keepers and Accounts Clerks) 0 0 34.7 0 0 8 57.3 0 0 100
7 Agents & salesman, Insurance
(Agents and Salesman) 0 0 0 0 0 0 0 100 0 100
8 Agents, Brokers, Securities and Shares
(Agents, Brokers Shares, Real Estate) 0 0 0 0 0 0 0 100 0 100
9 Hotel and Restaurant Keepers
(Hotel and Restaurant keepers) 0 0 0 0 0 100 0 0 0 100
10 House Keepers, Matrons and Software
(Steward, Hospital House keeping) 0 0 0 0 0 0 0 18.6 81.4 100
11 Cook & Cook-bearers
(Craftsman Food Production) 0 0 29.4 0 0 9.2 0 0 61.5 100
12 Ayaha, Nurse, maids
(Ayaha, Maids) 0 0 0 0 0 0 0 0 100 100
13 Domestic Servants
(Home care for maid servant) 0 0 0 0 0 0 0 0 100 100
14 Building Caretakers
(Building Maintenance) 0 0 0 0 63.8 0 0.8 0 35.4 100
15 Hair dressers, Barbers, Beauticians & Related Workers
(Beauticians and related work) 0.2 0 0 0 0 0 0 0 99.8 100
16 Bakers, Confectioners Candy & Sweet Meat Makers & Other Food Processors
(Bakery and Confectionary) 0 0 57.6 0 0 42.4 0 0 0 100
17 Tailors and Dress Makers
(Fashion Technology) 0 0 100 0 0 0 0 0 0 100
18 Sewers & Embroiders
(Computer aided Embroidery and Needle work) 0 0 91.7 0 0 8.3 0 0 0 100
19 Shoemakers & Shoe Repairers
(Leather Foot Wear) 0 0 29.2 0 0 70.8 0 0 0 100
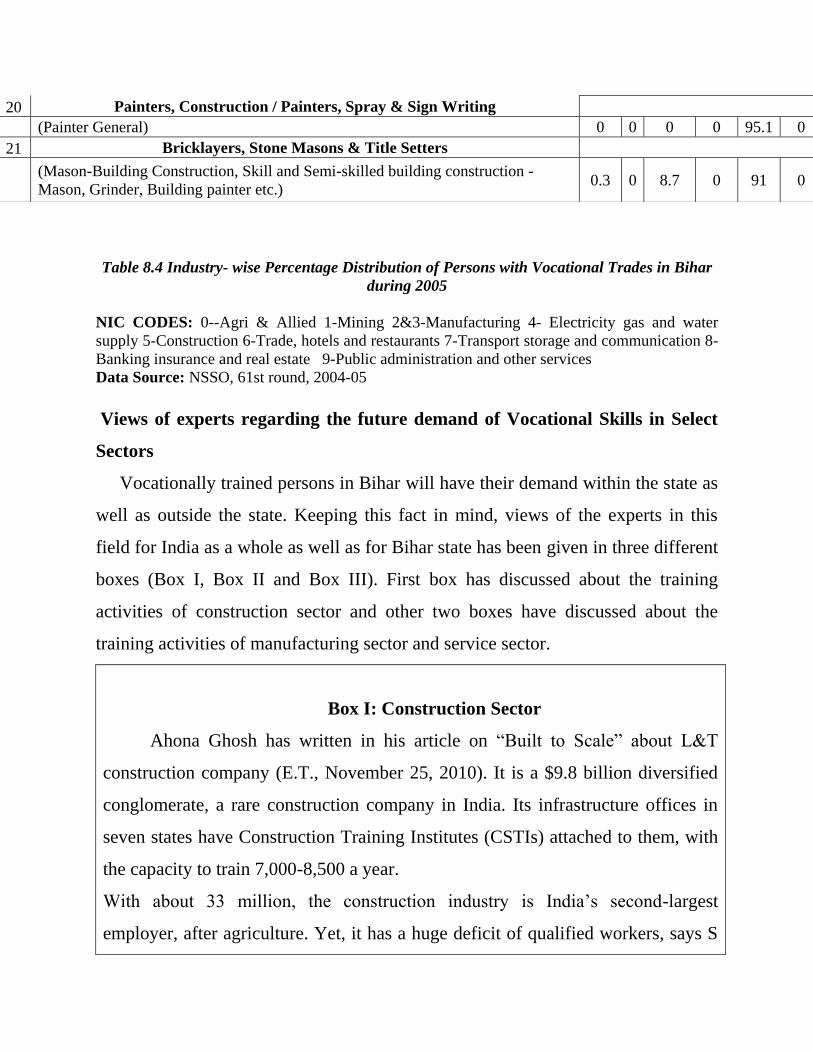
Table 8.4 Industry- wise Percentage Distribution of Persons with Vocational Trades in Bihar
during 2005
NIC CODES: 0--Agri & Allied 1-Mining 2&3-Manufacturing 4- Electricity gas and water
supply 5-Construction 6-Trade, hotels and restaurants 7-Transport storage and communication 8-
Banking insurance and real estate 9-Public administration and other services
Data Source: NSSO, 61st round, 2004-05
Views of experts regarding the future demand of Vocational Skills in Select
Sectors
Vocationally trained persons in Bihar will have their demand within the state as
well as outside the state. Keeping this fact in mind, views of the experts in this
field for India as a whole as well as for Bihar state has been given in three different
boxes (Box I, Box II and Box III). First box has discussed about the training
activities of construction sector and other two boxes have discussed about the
training activities of manufacturing sector and service sector.
Box I: Construction Sector
Ahona Ghosh has written in his article on ―Built to Scale‖ about L&T
construction company (E.T., November 25, 2010). It is a $9.8 billion diversified
conglomerate, a rare construction company in India. Its infrastructure offices in
seven states have Construction Training Institutes (CSTIs) attached to them, with
the capacity to train 7,000-8,500 a year.
With about 33 million, the construction industry is India‘s second-largest
employer, after agriculture. Yet, it has a huge deficit of qualified workers, says S
20 Painters, Construction / Painters, Spray & Sign Writing
(Painter General) 0 0 0 0 95.1 0 0 0 4.9 100
21 Bricklayers, Stone Masons & Title Setters
(Mason-Building Construction, Skill and Semi-skilled building construction -
Mason, Grinder, Building painter etc.) 0.3 0 8.7 0 91 0 0 0 0 100
Natarajan, who oversees all CSTIs. ―By 2022, this deficit will be 170-180
million‖, he says.
Globalization has enabled the industry to adopt the latest technologies,
resulting in a growing demand for world-class workmanship. With this in mind,
L&T‘s programme incorporates the latest technology with regular ground work.
The Programme sets high standards for each candidate, though the eligibility bar
is low - starting from class V fail (diploma and degree holders are barred).
Everyone who clears the training course is employed on contract at the company‘s
work sites through sub-contractors.
All the courses are designed for short-term vocational training. The period
varies from 200 hours spread over a month to 600 hours over three months,
depending on the trade. After a classroom session, the trainees work on a mock
construction site in the institute.
As one of the biggest players in construction, the company is in need of
skills like carpenters, bar benders, mason, welders, plumbers and electricians for
its frontline work. Moreover, it is bringing respectability to a trade that has been
looked down upon as a profession requiring no formal skills.
In an another article on ―Rustomjee Group - The Slab Test‖ Percy
Chowdhry, director of Rustomjee Group says, ―We have 4.5 million sq ft of
construction work going on and we need a huge quantum of manpower to be
developed‖ (E.T., November 25, 2010).
Asian Development Bank is ready to channel a fresh $300 million loan to
Bihar for developing state roads. State‘s road construction department secretary
Pratyaya Amrit has said, ―Our mission is to develop state highways so that one
can travel to Patna from any part of Bihar within six hours‖ (The Economic
Times, December 7, 2010).
Box II : Manufacturing Sector
Arun Maira, an industry veteran and the member, in-charge of Industry,
Planning Commission, spoke to Malini Goyal, Correspondant Economic Times
about the layout of the broad contours of the 12th
Five-Year Plan (E.T., November
26, 2010). He said, the Plan, still in preparation, will have a clear and sharp
manufacturing agenda. He expressed his concern by saying that Imports from
China of IT and telecom equipment have surged on the back of the telecom boom.
In the next five years, we expect ICT hardware imports to cross the amount we
spend on petroleum imports. This should be of concern. Today, China‘s machine
tools industry is 55 times that of India – 25 years ago they were at the same level.
Biggest challenges to achieve this goal are infrastructure and indigenous
technology. Our machine tool segment, which is of strategic importance, is weak.
It is critical and needs to be strengthened.
He further mentioned that we need to create enabling environment and
build mother industry that will generate jobs in labour intensive sectors.
Assembling anything is the low-skill, low-wage activity and it can freely cross
borders when wage costs moves up. Singapore chose to encourage only high-end
knowledge-intensive economic activity. As we look globally, it is clear countries
will need to build depth in specific sectors to build a robust manufacturing. China
is doing it very well. While it began with low-value products like toys etc, it has
ended in high categories.
Institutes for competitiveness, Gurgaon dedicated to conducting research in
the core fields of strategy, economic development and productivity, has
mentioned that states can harness their population to grow by making policies that
make productive use of available resources. States with healthy GDP and
population growth rates, such as Haryana and Bihar must focus on sectors where
they are inherently competitive because of the presence of natural resources or
traditional skills and knowledge (E.T. November 27, 2010). Because of large
agricultural resources in Bihar, it has good scope of industries relating to Food
Processing (fruit, vegetables and other food), Food Preservation, Preparation of
Juice and drinks, Power generation and fisheries sector.
Surat‘s diamond industry is facing server manpower crunch at a time when
demand for cut and polished diamonds from the US, China and other markets is
regaining momentum lost during the global recessions of 208-09. Dinesh
Navadia, President, Surat Diamond Association says that they are facing a
shortage of around 25 per cent of skilled workers (H.T., December 6, 2010).
Chandrakant Sanghavi, head, Sanghavi exports, one of the largest firms in Surat
says that these shortages of skilled workers will worson if the simply of rough
diamond goes up.
India‘s solar sector is gearing up for huge capacity additions – plants that
will eventually generate about 20,000 MW of solar power, a whopping Rs 4,337
crore in allocating. Ministry of New and Renewable Energy had indicated that
about one lakh trained and skilled personnel would be required by 2020, the last
year of National Solar Mission. Sanjay Chandrakant from Ernst & Young says
that for manufacturing, system installation, R&D work and operations &
maintenance technicians will be needed (E.T., December 10, 2010).
Box III :Service Sector
(i) Information Technology & Information Technology enabled services (IT
& ITeS)
According to the study done by ICRA Management Consulting Services
for the National Skill Development Corporation, the IT and ITeS sector is
expected to employ about 7.5 million persons directly by 2022. This means there
would be an incremental requirement of about 5.3 million persons in the sector till
2022. Nasscom estimates say that IT industry spends about Rs 3000 crore every
year for entry level training due to acute talent shortage. If suitably trained
persons are available industry can save a large amount of money by employing
them directly (E.T., December 12, 2010).
Rita Soni, the newly appointed CEO of Nasscom Foundation says we are in
talks with the National Skill Development Committee (NSDC) to partner NSDC
to provide training in the IT space. ―The IT sector is a $60 billion industry and
will certainly need a lot of people. We are going to help take this forward‖, says
Soni.
Keeping in view the importance of IT and ITeS sector, Kerala Government
is developing a Techno park at the outskirts of Thiruvanthapuram. Developed
over 450 acres as an integrated township, encompassing IT/ITeS infrastructure,
residential apartments shopping malls, hospitals, hotels, educational institutions,
and other support facilities, the project is expected to generate one lakh direct
IT/ITeS jobs and another four lakh indirect jobs (E.T., January 6, 2011).
(ii) Rural Marketing
Vikas Kumar writes about the rural jobs rush in India (E.T. November 18,
2010). He says that host of services-driven companies in emerging sectors - MFI,
retail, telecom, ITES, healthcare, infrastructure and logistics - are scouting for
local talent in small towns or from boarding villages. Further he illustrates about
the future plans of employment by some employing agencies in rural areas:
Telecom-tower maintenance firms: These firms could employ
200,000 people in the near future, is a good example. There are about
140,000 towers in semi-urban locations. ―About 80% of 25,000 new
towers to be added this year will be in rural and remote areas‖; says
Amarjit Gupta, executive VP-sales & marketing, Acme Telepower, a
company that provides energy-management solutions to tower
companies.
Their operations and maintenance are managed by specialist firms
like Chandigarh-based synergy telecom, which runs 5000 sites in
rural areas. Maninder Nanda, CEO for this business says that one
technician can manage 5-6 rural sites. These technicians are I.T.I
certificate holders who join at a monthly salary of Rs. 8000-10000.
Team lease: About half the 60,000 people this staffing firm places
every year are in upcountry jobs, especially in fast moving consumer
goods (FMCG), financial services, customer durables and telecom.
―Rural sales force hiring by companies is growing at 40% annually
against 5% in the past‖, says Manish Salharwal, Chairman, Team
lease.
V-Shesh: The Chennai- based ‗Livelihood Exchange‘ places rural
youth as customer service agents or transaction processing officers in
rural BPOs, as loan officers in MFIs and as rural market developers
in FMCG and consumer durable companies. It has trained and placed
850 people in the last two years. It is targeting 2,000 placements in
2010-11.
FMCG Companies: As they renew their rural drive, FMCG
companies are hiring field staff in large number. Dabur plans to hire
200 ‗feet on street‘ and indirect employees through stockiests in
villages and small towns. Marico has just finished hiring 220 people.
ITC, Nesle, Glaxo Smith Kline Consumer and Emami speak of
doubling their direct employee strength in rural locations.
Archana Rai & Peerzada Abrar have mentioned in their article on,
―India set to emerge as social innovation hub‖ about the innovative
business models that combine profit with social good could well be
the country‘s best known export in coming years as India emerges as
the social innovation hub of the world (E.T. November 11, 2010).
They have also talked about AISECT, a company which provides
information and technology education in rural areas, is now hawking
products of computer firms, banks and undertaking government
projects through its network of 8000 rural education centers in over
30 states that run on franchise model. ―By 2013, we aim to have
15,000 centres‖ says Santosh Kumar Choubey, founder of this
organisation.
(iii) Microfinance Institutions (MFIs)
Microfinance Institutions have great scope in India. Recently some
promoters of these institutions have exploited the poor beneficiaries, but overall
these institutions have done a great job in rural areas. Public sector and rural
banks have not achieved the goal of financial inclusion because of their high
human resources costs. Only MFIs provide a low-cost platform to achieve it. The
average cost per head of MFIs is about Rs 1 lakh per annum compared with Rs.
5.6 lakh for PSU banks, Rs.5.3 lakh for private sector banks, and Rs. 3.8 lakhs for
regional rural banks (Sauabh Tripathi, E.T. February, 4 2011). Alok Prashad has
talked about the rural jobs in Microfinance Institutions (The Hindu, Business
Line, January 5, 2011). The major MFIs have over 10,000 branches, which have a
field staff of 60,000-75,000. If other MFIs are also included, the number would go
beyond one lakh. Candidates join as relationship officers, disbursing loans to self
help groups and collecting repayments.
(iv) Business Processing Organizations (BPOs)
About Rural BPOs it is said that so far, there have largely been
experiments- now they are going mainstream (E.T. November 18, 2010). For
instance, Genpact; India‘s largest BPO has outsourced its internal finance and
accounts work to Rural Shores. Infosys BPO, Wipro BPO and Aditya Minacs are
looking to outsource some of their work to rural BPOs. Five years from now,
according to industry estimates about 1,000 rural BPOs could employ 1,50,000
people.
(v) Organised Retail Sector:
Muralidhar Rao, chief executive of future of Future Group says that
frontline workforce for retail industry has a growing requirement of skilled
people. He further says that we need to increase focus on curses and training
programmes that are aimed at creating employability at the bottom-of-the
pyramid. Future group hires at least 2000 people every month in retail (E.T.,
October 20 2010).
8.5 Existing and New Trades for the state
8.5.1 Existing Trades being taught in the state
In ITIs/ITCs, training was being imparted in 21 courses of two year duration
and 29 courses of one year duration (Table 8.5). In other institutions/departments it
was observed that three courses were of more than six months duration, 21 courses
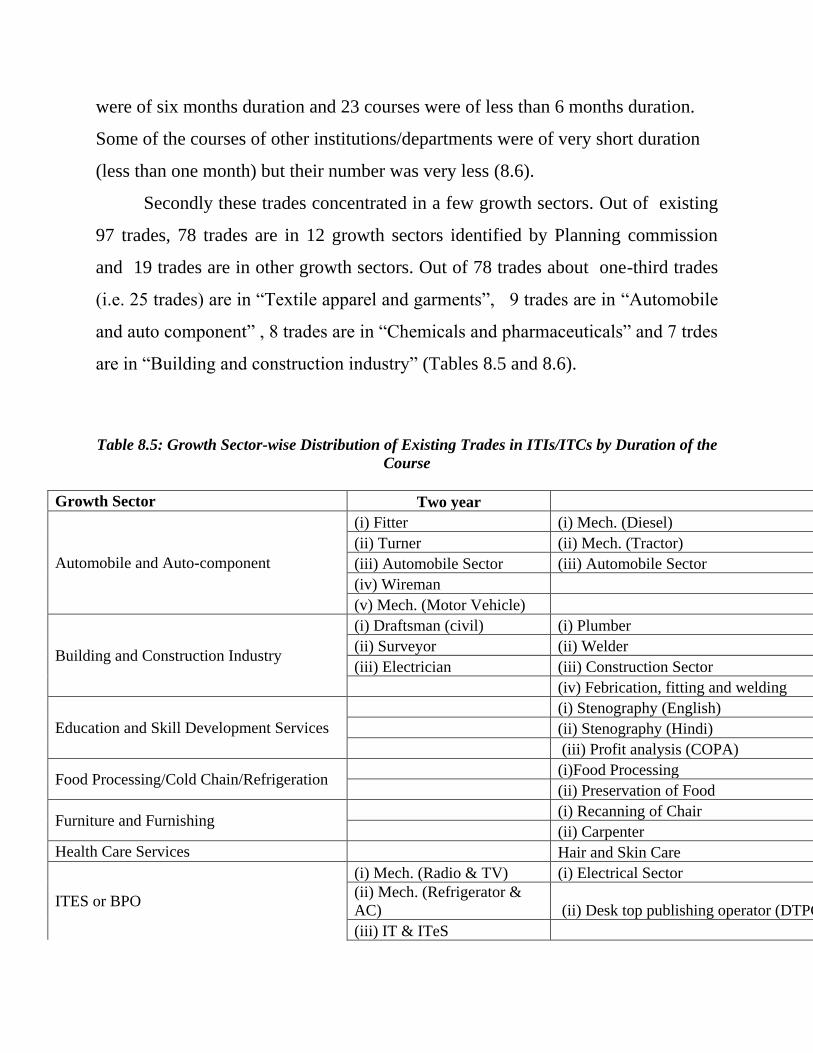
were of six months duration and 23 courses were of less than 6 months duration.
Some of the courses of other institutions/departments were of very short duration
(less than one month) but their number was very less (8.6).
Secondly these trades concentrated in a few growth sectors. Out of existing
97 trades, 78 trades are in 12 growth sectors identified by Planning commission
and 19 trades are in other growth sectors. Out of 78 trades about one-third trades
(i.e. 25 trades) are in ―Textile apparel and garments‖, 9 trades are in ―Automobile
and auto component‖ , 8 trades are in ―Chemicals and pharmaceuticals‖ and 7 trdes
are in ―Building and construction industry‖ (Tables 8.5 and 8.6).
Table 8.5: Growth Sector-wise Distribution of Existing Trades in ITIs/ITCs by Duration of the
Course
Growth Sector Two year One year
Automobile and Auto-component
(i) Fitter (i) Mech. (Diesel)
(ii) Turner (ii) Mech. (Tractor)
(iii) Automobile Sector (iii) Automobile Sector
(iv) Wireman
(v) Mech. (Motor Vehicle)
Building and Construction Industry
(i) Draftsman (civil) (i) Plumber
(ii) Surveyor (ii) Welder
(iii) Electrician (iii) Construction Sector
(iv) Febrication, fitting and welding
Education and Skill Development Services
(i) Stenography (English)
(ii) Stenography (Hindi)
(iii) Profit analysis (COPA)
Food Processing/Cold Chain/Refrigeration (i)Food Processing
(ii) Preservation of Food
Furniture and Furnishing (i) Recanning of Chair
(ii) Carpenter
Health Care Services Hair and Skin Care
ITES or BPO
(i) Mech. (Radio & TV) (i) Electrical Sector
(ii) Mech. (Refrigerator &
AC) (ii) Desk top publishing operator (DTPO)
(iii) IT & ITeS
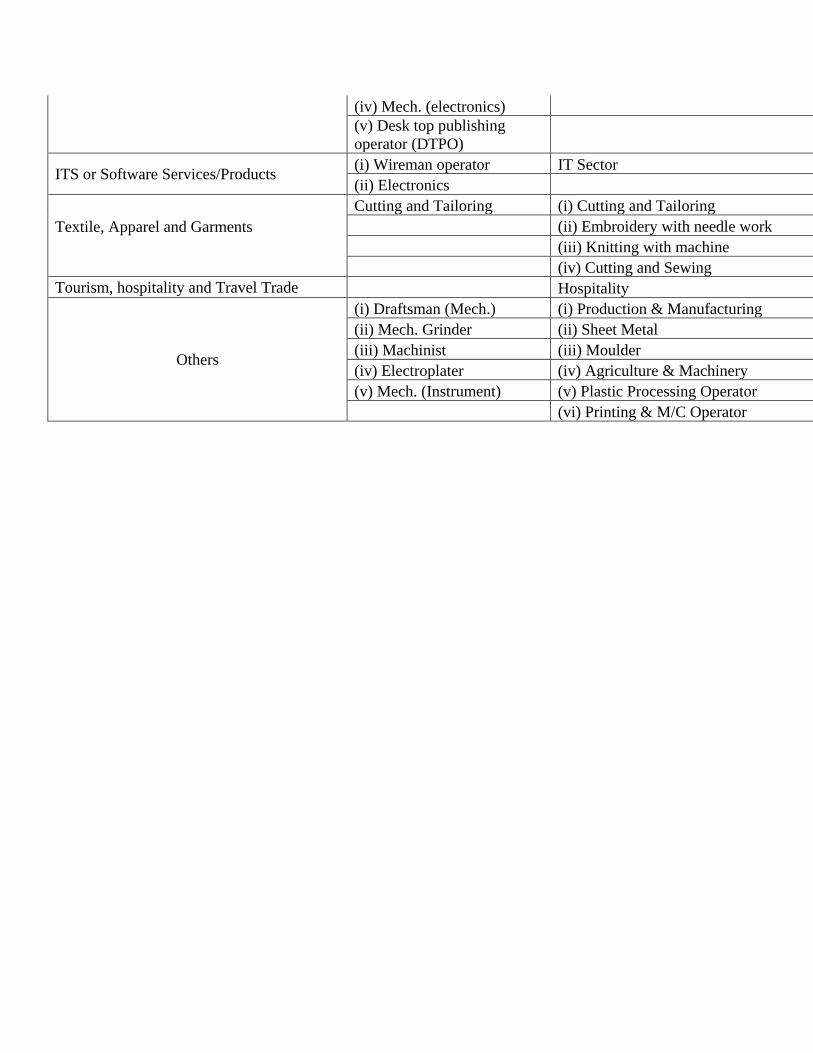
(iv) Mech. (electronics)
(v) Desk top publishing
operator (DTPO)
ITS or Software Services/Products (i) Wireman operator IT Sector
(ii) Electronics
Textile, Apparel and Garments
Cutting and Tailoring (i) Cutting and Tailoring
(ii) Embroidery with needle work
(iii) Knitting with machine
(iv) Cutting and Sewing
Tourism, hospitality and Travel Trade Hospitality
Others
(i) Draftsman (Mech.) (i) Production & Manufacturing
(ii) Mech. Grinder (ii) Sheet Metal
(iii) Machinist (iii) Moulder
(iv) Electroplater (iv) Agriculture & Machinery
(v) Mech. (Instrument) (v) Plastic Processing Operator
(vi) Printing & M/C Operator
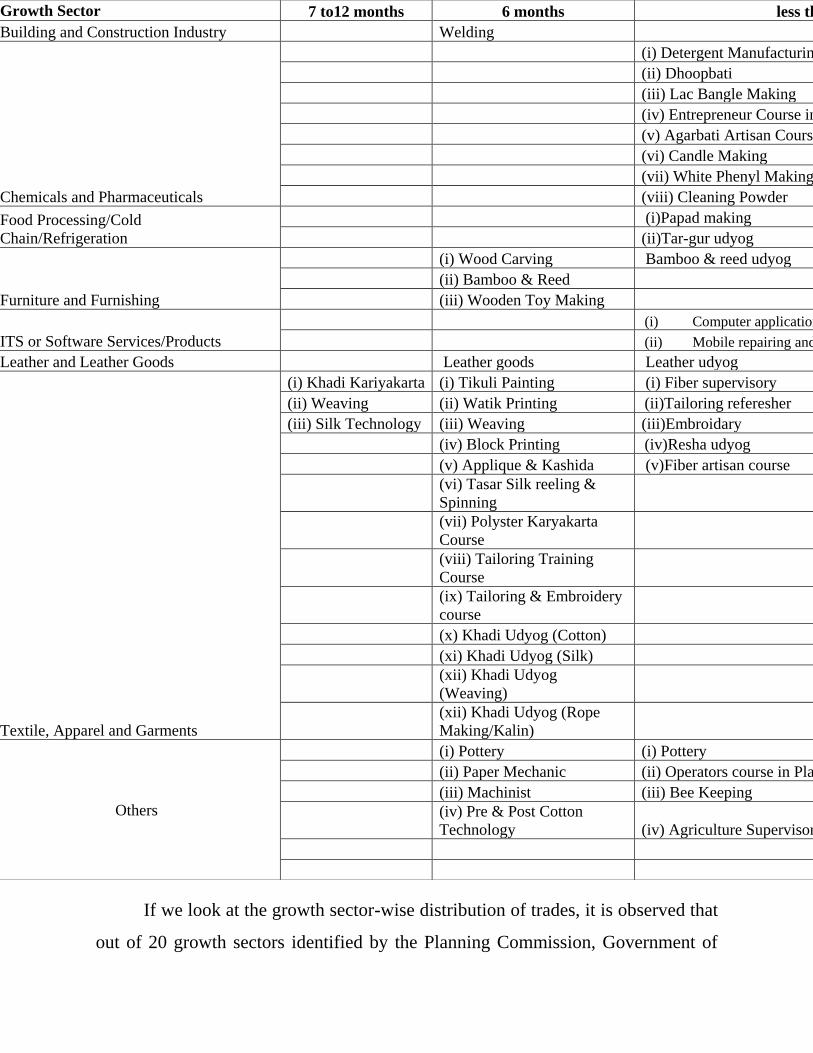
If we look at the growth sector-wise distribution of trades, it is observed that
out of 20 growth sectors identified by the Planning Commission, Government of
Growth Sector 7 to12 months 6 months less than 6 months
Building and Construction Industry Welding
Chemicals and Pharmaceuticals
(i) Detergent Manufacturing
(ii) Dhoopbati
(iii) Lac Bangle Making
(iv) Entrepreneur Course in Laundry Soap Making
(v) Agarbati Artisan Course
(vi) Candle Making
(vii) White Phenyl Making
(viii) Cleaning Powder
Food Processing/Cold
Chain/Refrigeration
(i)Papad making
(ii)Tar-gur udyog
Furniture and Furnishing
(i) Wood Carving Bamboo & reed udyog
(ii) Bamboo & Reed
(iii) Wooden Toy Making
ITS or Software Services/Products
(i) Computer application
(ii) Mobile repairing and software
Leather and Leather Goods Leather goods Leather udyog
Textile, Apparel and Garments
(i) Khadi Kariyakarta (i) Tikuli Painting (i) Fiber supervisory
(ii) Weaving (ii) Watik Printing (ii)Tailoring referesher
(iii) Silk Technology (iii) Weaving (iii)Embroidary
(iv) Block Printing (iv)Resha udyog
(v) Applique & Kashida (v)Fiber artisan course
(vi) Tasar Silk reeling &
Spinning
(vii) Polyster Karyakarta
Course
(viii) Tailoring Training
Course
(ix) Tailoring & Embroidery
course
(x) Khadi Udyog (Cotton)
(xi) Khadi Udyog (Silk)
(xii) Khadi Udyog
(Weaving)
(xii) Khadi Udyog (Rope
Making/Kalin)
Others
(i) Pottery (i) Pottery
(ii) Paper Mechanic (ii) Operators course in Plastic Processing
(iii) Machinist (iii) Bee Keeping
(iv) Pre & Post Cotton
Technology (iv) Agriculture Supervisory Course
India , only 12 growth sectors had some trade either in ITI/ITC or other
departments. In other words 8 sectors were not covered either by ITI/ITC or other
departments. These eight growth sectors are : (i) Banking /insurance and finance
services (ii) Construction materials/building hardware etc.(iii) Electronics
hardware (iv) Gem and jewellary (v) Media, entertainment, broadcasting, content
creation and animation (vi) Organised retail (vii)Real estate services and (viii)
Transportation logistics, warehousing and packaging etc
Table 8.6: Growth Sector-wise Existing Trades in Other Departments by Duration of the
Course
8.5.1 New Trades which may be introduced in the state
After analyzing the above information the study team has suggested some
new trades of different durations which may be introduced in Bihar. These trades
are in addition to the existing trades in the state. Growth sector -wise distribution
of these new trades suggested is given in Tables 8.7 and 8.8. In all 84 new trades
have been suggested for the state. Out of 84 trades, 33 trades are of six months
duration, 26 trades are of one year duration, 19 trades are of two year duration and
remaining 6 trades are of 3 months duration.
Training in these skills will considerably improve the earning capacity and
the prospects of employment of those persons. The workers who return to Bihar,
after serving many years in other states can be trained and encouraged to use their
skills and knowledge in establishing small enterprises either individually or in
groups. State government should consider convergence of the various existing
development programms in a manner which enhances skill acquisition and skill
formation of the workers.
Table 8.7: Growth Sector-wise Trades of one to two year Duration which may be Introduced
in Bihar
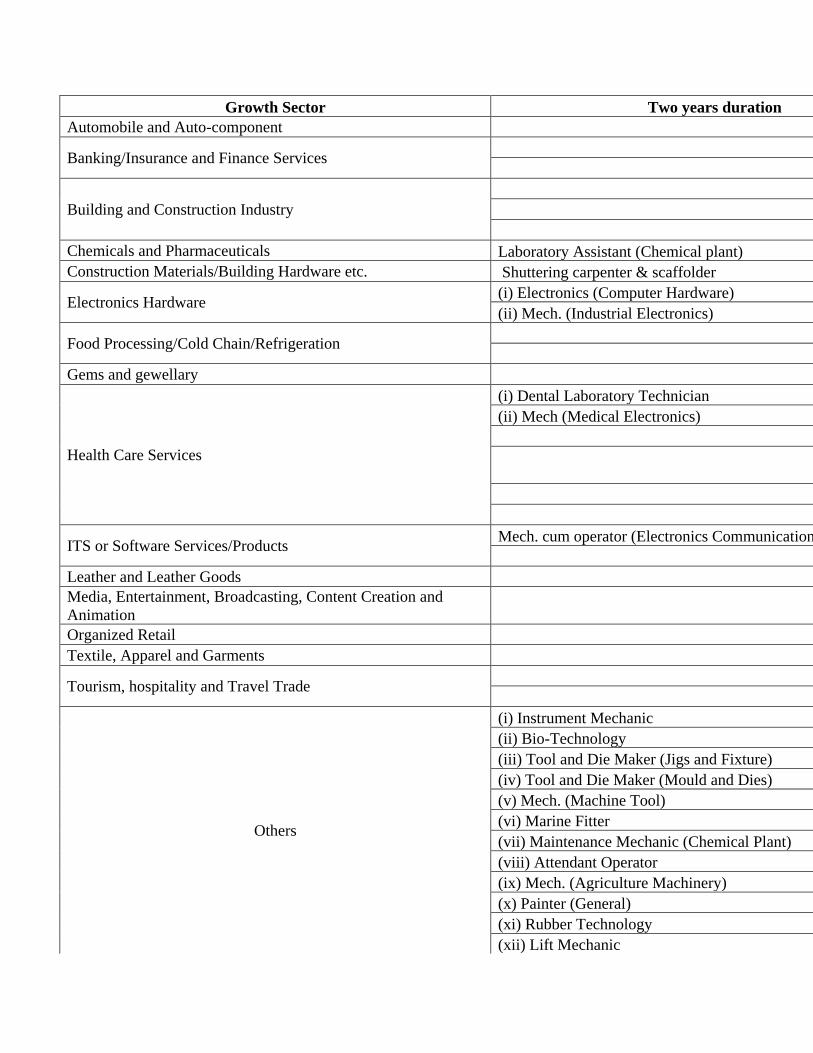
Growth Sector Two years duration One year duration
Automobile and Auto-component Armature Rewinding
Banking/Insurance and Finance Services (i) Visual Merchandising
(ii) Book Keepers & Accounts Clerks
Building and Construction Industry
(i) Mason (Building Construction)
(ii) Architecture Assistant
(iii) Interior Decoration & Designing
Chemicals and Pharmaceuticals Laboratory Assistant (Chemical plant)
Construction Materials/Building Hardware etc. Shuttering carpenter & scaffolder Earth work excavator
Electronics Hardware (i) Electronics (Computer Hardware) Mobile phone Repair
(ii) Mech. (Industrial Electronics)
Food Processing/Cold Chain/Refrigeration (i) Bakery and confectionary
(ii) Craftsman food production
Gems and gewellary Foundation course for jewellary
Health Care Services
(i) Dental Laboratory Technician (i) Physiotherapy Technician
(ii) Mech (Medical Electronics) (ii) X-ray Technologist
(iii) Health Sanitary Inspector
(iv) Opthemetrists and Occupational
Therapists
(v) Nurse
(vi) Beauticians and Related Work
ITS or Software Services/Products Mech. cum operator (Electronics Communication System) (i) E-commerce
(ii) Wel Designing
Leather and Leather Goods Leather Foot wear
Media, Entertainment, Broadcasting, Content Creation and
Animation Photography/Digital Photographer
Organized Retail Supply Chain Management
Textile, Apparel and Garments Fashion Technology
Tourism, hospitality and Travel Trade (i) Steward
(ii) Hospital House Keeping
Others
(i) Instrument Mechanic (i) Foundary
(ii) Bio-Technology (ii) Pump operator cum mechanic
(iii) Tool and Die Maker (Jigs and Fixture) (iii) Book Binder
(iv) Tool and Die Maker (Mould and Dies)
(v) Mech. (Machine Tool)
(vi) Marine Fitter
(vii) Maintenance Mechanic (Chemical Plant)
(viii) Attendant Operator
(ix) Mech. (Agriculture Machinery)
(x) Painter (General)
(xi) Rubber Technology
(xii) Lift Mechanic
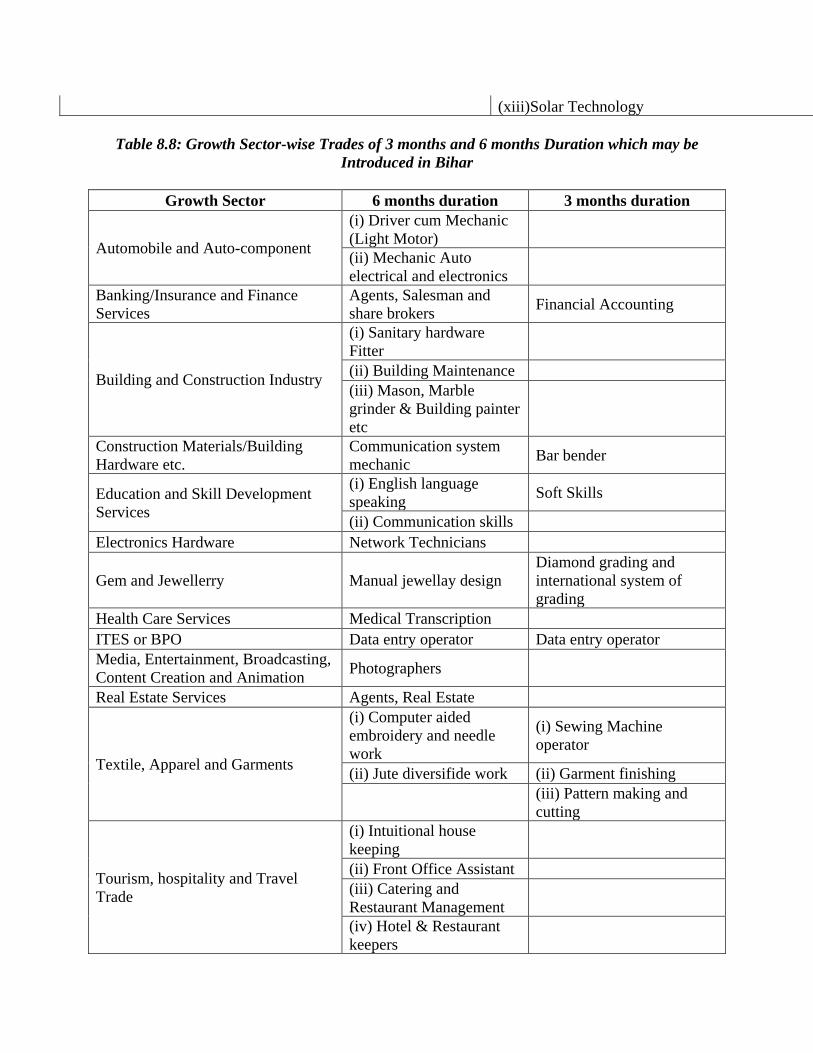
(xiii)Solar Technology
Table 8.8: Growth Sector-wise Trades of 3 months and 6 months Duration which may be
Introduced in Bihar
Growth Sector 6 months duration 3 months duration
Automobile and Auto-component
(i) Driver cum Mechanic
(Light Motor)
(ii) Mechanic Auto
electrical and electronics
Banking/Insurance and Finance
Services
Agents, Salesman and
share brokers Financial Accounting
Building and Construction Industry
(i) Sanitary hardware
Fitter
(ii) Building Maintenance
(iii) Mason, Marble
grinder & Building painter
etc
Construction Materials/Building
Hardware etc.
Communication system
mechanic Bar bender
Education and Skill Development
Services
(i) English language
speaking Soft Skills
(ii) Communication skills
Electronics Hardware Network Technicians
Gem and Jewellerry Manual jewellay design
Diamond grading and
international system of
grading
Health Care Services Medical Transcription
ITES or BPO Data entry operator Data entry operator
Media, Entertainment, Broadcasting,
Content Creation and Animation Photographers
Real Estate Services Agents, Real Estate
Textile, Apparel and Garments
(i) Computer aided
embroidery and needle
work
(i) Sewing Machine
operator
(ii) Jute diversifide work (ii) Garment finishing
(iii) Pattern making and
cutting
Tourism, hospitality and Travel
Trade
(i) Intuitional house
keeping
(ii) Front Office Assistant
(iii) Catering and
Restaurant Management
(iv) Hotel & Restaurant
keepers
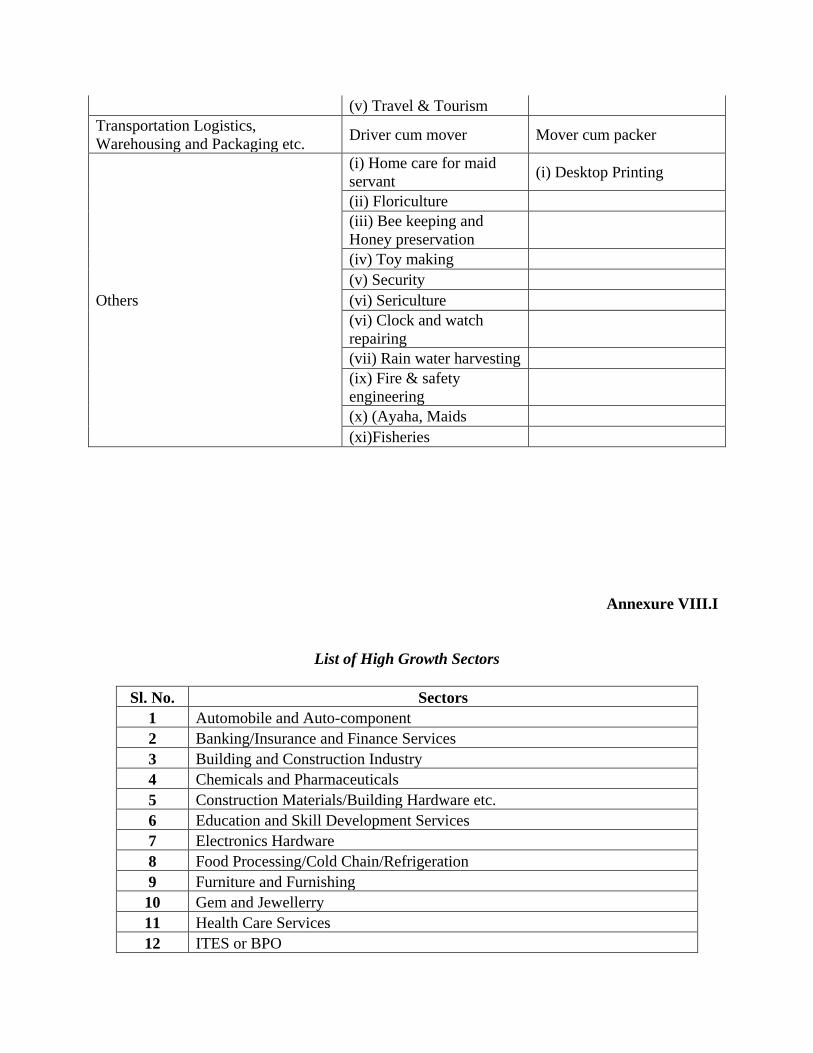
(v) Travel & Tourism
Transportation Logistics,
Warehousing and Packaging etc. Driver cum mover Mover cum packer
Others
(i) Home care for maid
servant (i) Desktop Printing
(ii) Floriculture
(iii) Bee keeping and
Honey preservation
(iv) Toy making
(v) Security
(vi) Sericulture
(vi) Clock and watch
repairing
(vii) Rain water harvesting
(ix) Fire & safety
engineering
(x) (Ayaha, Maids
(xi)Fisheries
Annexure VIII.I
List of High Growth Sectors
Sl. No. Sectors
1 Automobile and Auto-component
2 Banking/Insurance and Finance Services
3 Building and Construction Industry
4 Chemicals and Pharmaceuticals
5 Construction Materials/Building Hardware etc.
6 Education and Skill Development Services
7 Electronics Hardware
8 Food Processing/Cold Chain/Refrigeration
9 Furniture and Furnishing
10 Gem and Jewellerry
11 Health Care Services
12 ITES or BPO
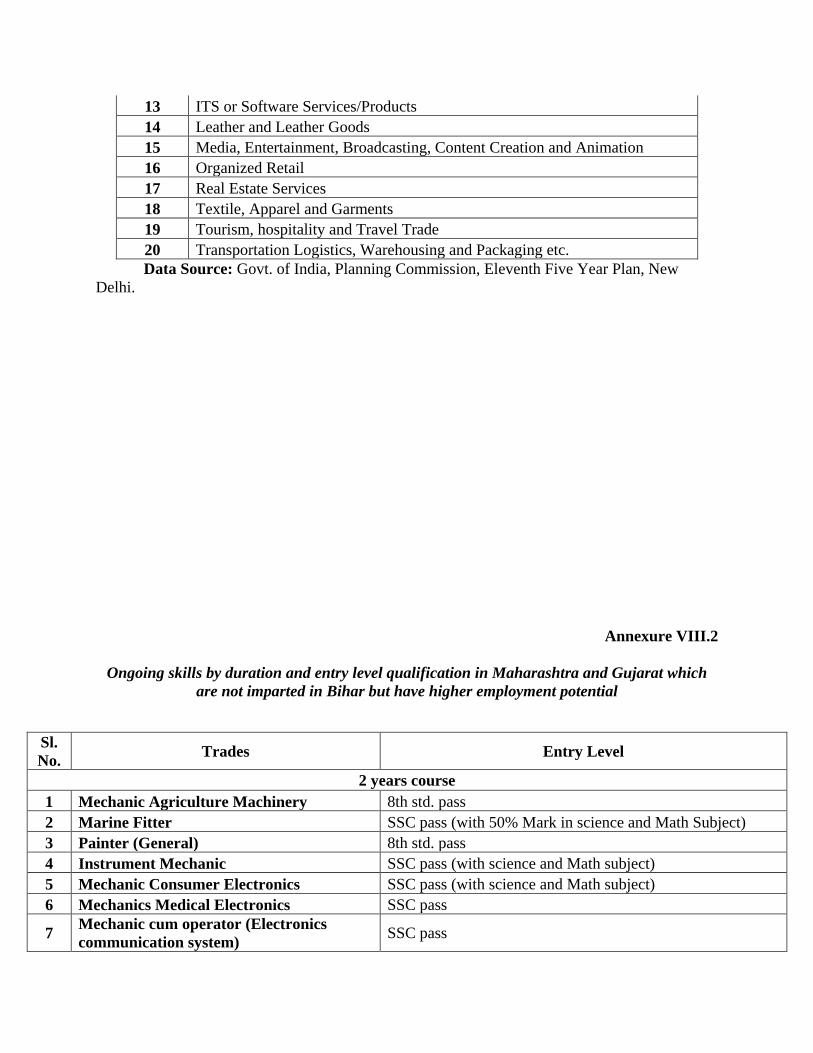
13 ITS or Software Services/Products
14 Leather and Leather Goods
15 Media, Entertainment, Broadcasting, Content Creation and Animation
16 Organized Retail
17 Real Estate Services
18 Textile, Apparel and Garments
19 Tourism, hospitality and Travel Trade
20 Transportation Logistics, Warehousing and Packaging etc.
Data Source: Govt. of India, Planning Commission, Eleventh Five Year Plan, New
Delhi.
Annexure VIII.2
Ongoing skills by duration and entry level qualification in Maharashtra and Gujarat which
are not imparted in Bihar but have higher employment potential
Sl.
No. Trades Entry Level
2 years course
1 Mechanic Agriculture Machinery 8th std. pass
2 Marine Fitter SSC pass (with 50% Mark in science and Math Subject)
3 Painter (General) 8th std. pass
4 Instrument Mechanic SSC pass (with science and Math subject)
5 Mechanic Consumer Electronics SSC pass (with science and Math subject)
6 Mechanics Medical Electronics SSC pass
7 Mechanic cum operator (Electronics
communication system) SSC pass
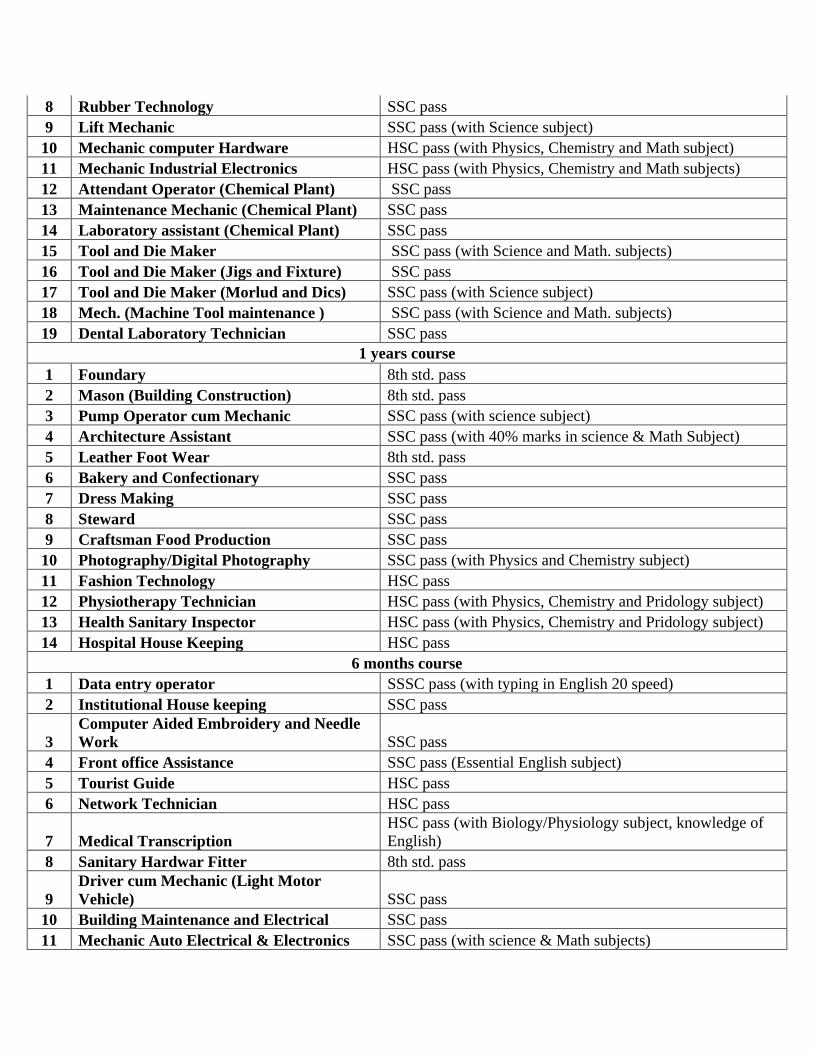
8 Rubber Technology SSC pass
9 Lift Mechanic SSC pass (with Science subject)
10 Mechanic computer Hardware HSC pass (with Physics, Chemistry and Math subject)
11 Mechanic Industrial Electronics HSC pass (with Physics, Chemistry and Math subjects)
12 Attendant Operator (Chemical Plant) SSC pass
13 Maintenance Mechanic (Chemical Plant) SSC pass
14 Laboratory assistant (Chemical Plant) SSC pass
15 Tool and Die Maker SSC pass (with Science and Math. subjects)
16 Tool and Die Maker (Jigs and Fixture) SSC pass
17 Tool and Die Maker (Morlud and Dics) SSC pass (with Science subject)
18 Mech. (Machine Tool maintenance ) SSC pass (with Science and Math. subjects)
19 Dental Laboratory Technician SSC pass
1 years course
1 Foundary 8th std. pass
2 Mason (Building Construction) 8th std. pass
3 Pump Operator cum Mechanic SSC pass (with science subject)
4 Architecture Assistant SSC pass (with 40% marks in science & Math Subject)
5 Leather Foot Wear 8th std. pass
6 Bakery and Confectionary SSC pass
7 Dress Making SSC pass
8 Steward SSC pass
9 Craftsman Food Production SSC pass
10 Photography/Digital Photography SSC pass (with Physics and Chemistry subject)
11 Fashion Technology HSC pass
12 Physiotherapy Technician HSC pass (with Physics, Chemistry and Pridology subject)
13 Health Sanitary Inspector HSC pass (with Physics, Chemistry and Pridology subject)
14 Hospital House Keeping HSC pass
6 months course
1 Data entry operator SSSC pass (with typing in English 20 speed)
2 Institutional House keeping SSC pass
3
Computer Aided Embroidery and Needle
Work SSC pass
4 Front office Assistance SSC pass (Essential English subject)
5 Tourist Guide HSC pass
6 Network Technician HSC pass
7 Medical Transcription
HSC pass (with Biology/Physiology subject, knowledge of
English)
8 Sanitary Hardwar Fitter 8th std. pass
9
Driver cum Mechanic (Light Motor
Vehicle) SSC pass
10 Building Maintenance and Electrical SSC pass
11 Mechanic Auto Electrical & Electronics SSC pass (with science & Math subjects)
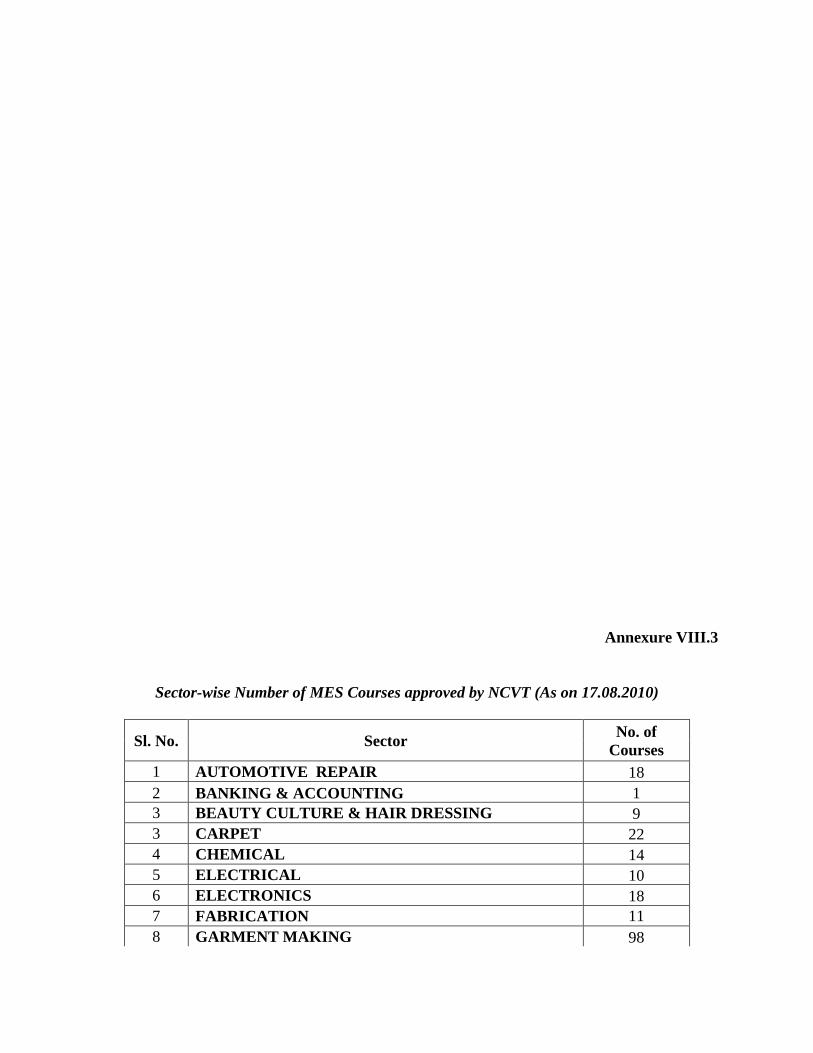
Annexure VIII.3
Sector-wise Number of MES Courses approved by NCVT (As on 17.08.2010)
Sl. No. Sector No. of
Courses
1 AUTOMOTIVE REPAIR 18
2 BANKING & ACCOUNTING 1
3 BEAUTY CULTURE & HAIR DRESSING 9
3 CARPET 22
4 CHEMICAL 14
5 ELECTRICAL 10
6 ELECTRONICS 18
7 FABRICATION 11
8 GARMENT MAKING 98
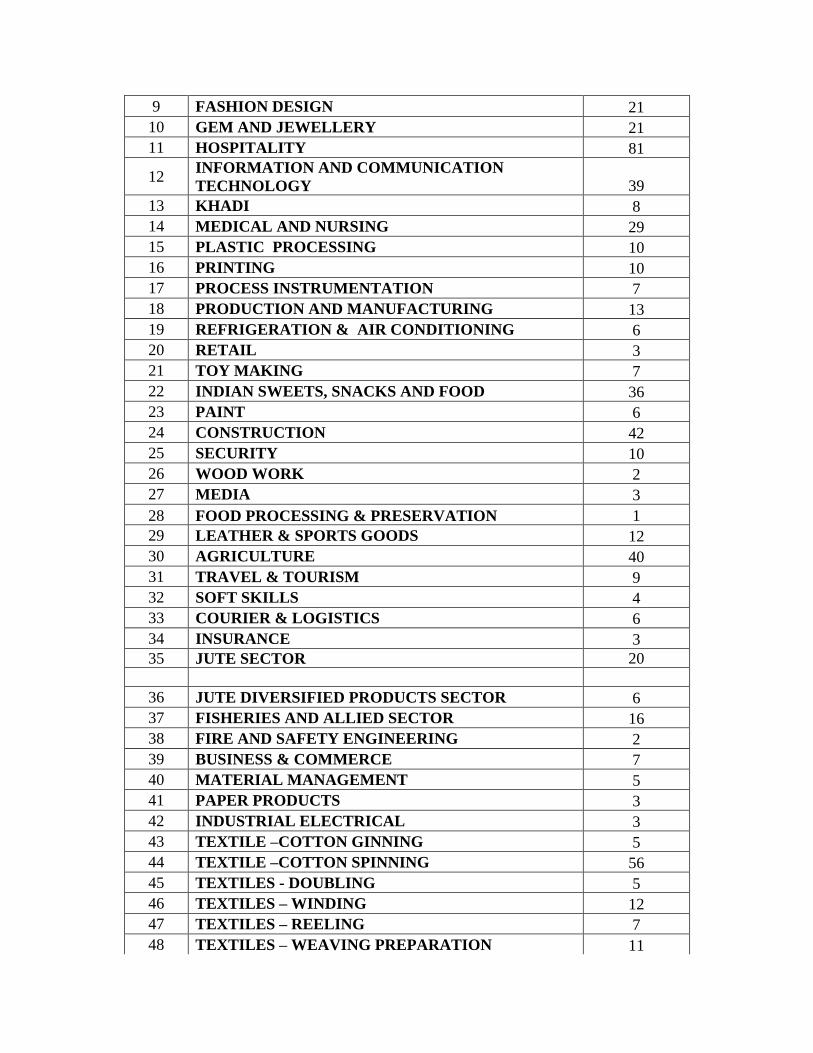
9 FASHION DESIGN 21
10 GEM AND JEWELLERY 21
11 HOSPITALITY 81
12 INFORMATION AND COMMUNICATION
TECHNOLOGY 39
13 KHADI 8
14 MEDICAL AND NURSING 29
15 PLASTIC PROCESSING 10
16 PRINTING 10
17 PROCESS INSTRUMENTATION 7
18 PRODUCTION AND MANUFACTURING 13
19 REFRIGERATION & AIR CONDITIONING 6
20 RETAIL 3
21 TOY MAKING 7
22 INDIAN SWEETS, SNACKS AND FOOD 36
23 PAINT 6
24 CONSTRUCTION 42
25 SECURITY 10
26 WOOD WORK 2
27 MEDIA 3
28 FOOD PROCESSING & PRESERVATION 1
29 LEATHER & SPORTS GOODS 12
30 AGRICULTURE 40
31 TRAVEL & TOURISM 9
32 SOFT SKILLS 4
33 COURIER & LOGISTICS 6
34 INSURANCE 3
35 JUTE SECTOR 20
36 JUTE DIVERSIFIED PRODUCTS SECTOR 6
37 FISHERIES AND ALLIED SECTOR 16
38 FIRE AND SAFETY ENGINEERING 2
39 BUSINESS & COMMERCE 7
40 MATERIAL MANAGEMENT 5
41 PAPER PRODUCTS 3
42 INDUSTRIAL ELECTRICAL 3
43 TEXTILE –COTTON GINNING 5
44 TEXTILE –COTTON SPINNING 56
45 TEXTILES - DOUBLING 5
46 TEXTILES – WINDING 12
47 TEXTILES – REELING 7
48 TEXTILES – WEAVING PREPARATION 11
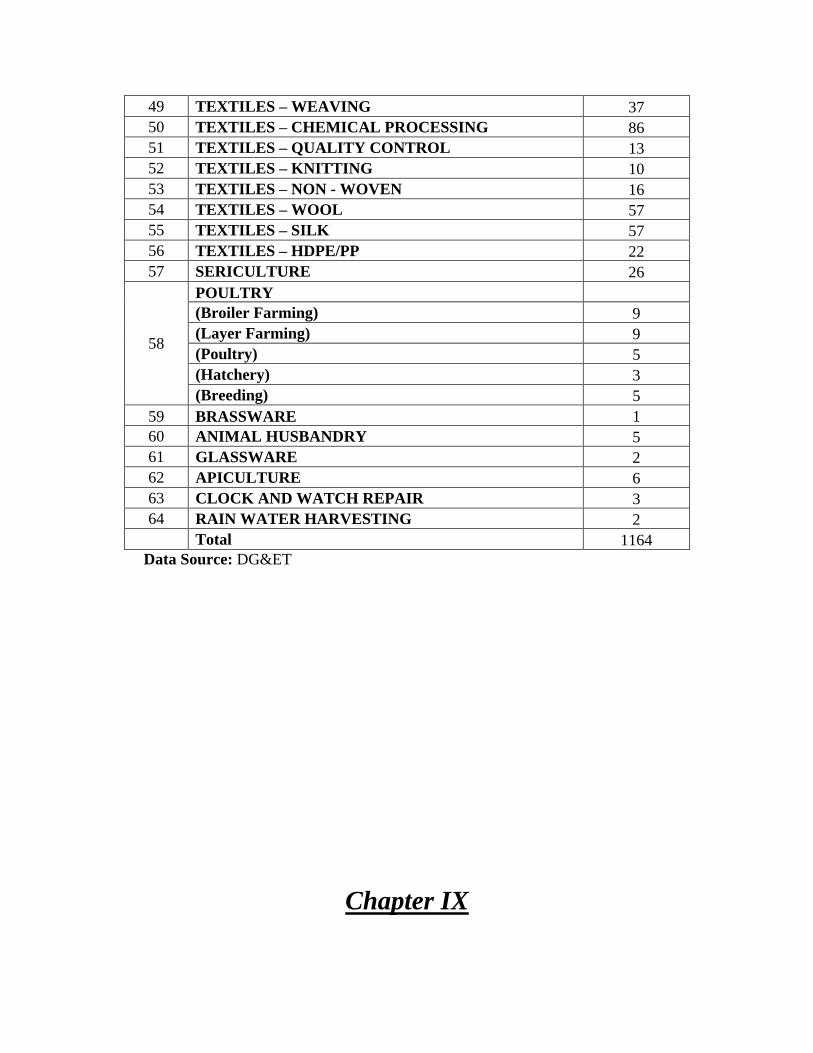
49 TEXTILES – WEAVING 37
50 TEXTILES – CHEMICAL PROCESSING 86
51 TEXTILES – QUALITY CONTROL 13
52 TEXTILES – KNITTING 10
53 TEXTILES – NON - WOVEN 16
54 TEXTILES – WOOL 57
55 TEXTILES – SILK 57
56 TEXTILES – HDPE/PP 22
57 SERICULTURE 26
58
POULTRY
(Broiler Farming) 9
(Layer Farming) 9
(Poultry) 5
(Hatchery) 3
(Breeding) 5
59 BRASSWARE 1
60 ANIMAL HUSBANDRY 5
61 GLASSWARE 2
62 APICULTURE 6
63 CLOCK AND WATCH REPAIR 3
64 RAIN WATER HARVESTING 2
Total 1164
Data Source: DG&ET
Chapter IX
Summary and Conclusions
9.1 Skill Development and Training in India
In the next two three decades India will have an advantage of demographic
dividend as compared to other developed countries. Its dependency ratio is
expected to decrease in future. Total dependency ratio in the country was 73.4 per
cent in the year 2001. This is expected to reduce to 65.6 per cent in 2006, 59.6 per
cent in 2011, 56.6 per cent in 2016, 55.9 per cent in 2021 and 55.6 per cent in
2026. At the same time median age of the country was 22.5 years in 2001 and it is
expected to increase to 31.4 years in 2026.
According to UN projections the working-age population in India will
increase by a stunning 240 m (equivalent to four times the total population of the
UK) over the next two decades, compared with 20 m in Brazil. The working-age
population in Russia, by contrast, will decline sharply by almost 20 m. China‘s
working-age population will peak in 2015 and then gradually decline. By 2030 it
will be merely 10 m larger than today – a negligible change given a total
population of 1.35-1.45 bn. By 2030, India will also have overtaken China as the
world‘s most populous country.
Vocational education and training in our country is being imparted in two
ways – one formal system and another informal system. Share of informal system
is much larger than the formal system.
.The quantitative aspect of skill shortage is one of the areas of concern
because there is always mismatch between the availability of number of jobs and
the number of people available for particular job. The huge number of people
added to the workforce each year and their low preparedness to avail of the
emerging employment opportunities make the issue of skill development self
evident. About 12 million workforce is entering every year but training facilities
for vocational education and training are only for 1.5 million. The rest either are
fresh hands – they come into the workforce untrained or are trained by the
employer on the job. Some others get trained at an unorganized local shop, but
mostly they remain untrained or under-trained.
For quite some time now concern has been expressed about the mismatch
between the job market‘s requirements on the one hand and the inputs provided by
our education system in general on the other hand. The quality of technical
education which is given in our country is not up to mark and it is not fulfilling the
market requirement.
Prioritization of skill building and vocational training is another important
aspect for consideration. There is an urgent need to identify the priority areas in
selected sections of the labour force to render appropriate training and skill. The
first priority should be given to the new entrants (from class VIII, IX, X and XI) in
the labour force. All these entrants need gainful employment. The second priority
group is the incremental educated youth, with a high unemployment rate against
the national average. Third priority group is all the other youth who are in the
labour force, whether illiterate or semi literate. The fourth identified section largely
comprise of underemployed working people.
There has to be a drastic shift in the national policy on skill development
with the private sector playing a lead role instead of the government, as they are
the job providers. The government‘s role would have to change from being a
vocational training provider to a partner and facilitator.
The eleventh five year plan is emphasizing on creating a pool of skilled
personnel in appropriate numbers and skills in line with the requirements of
ultimate users such as industry, trade and services sector. ―Skill development
mission" with an outlay of Rs. 22800 crores has been launched to achieve this goal.
The mission would also create a surplus of skilled persons to meet the requirement
of other aging economies in the world.
The mission is to ensure that our supply side responses are moving in the
same way as our demand. These responses should move in the same way as
demand not only in the present but the future also. For this the mission will involve
both public and private sectors in such a way that it is beneficial to both.
Vocational training is a concurrent subject and both Central Government and
the State Governments share responsibilities. At the national level, Director
General of Employment & Training (DGE&T), Ministry of Labour is the nodal
department for formulating policies, laying down standards, conducting trade
testing and certification, etc. in the field of vocational training. At the State level,
the State government departments are responsible for vocational training
programmes.
9.2 The Study
It is in context that the Government of Bihar has sponsored the study on
―Assessing the Demand for Skill Sets in Domestic/National and Overseas Markets
by the Year 2025 in Bihar State‖. The IIPA at the request of Labour Department,
Government of Bihar has carried out the study. The objectives and methodology of
the study have been discussed in the following paragraphs.
9.3 Objectives
4. To estimate the Industry-wise demand of persons with Vocational Education
and Training in Bihar by the years 2009-10, 2014-15, 2019-20 and 2024-25.
5. To estimate the demand of persons with Vocational Training from ITIs/ITCs
of Bihar by the years 200-10, 2014-15, 2019-20 and 2024-25.
6. Identification of new trades (Skill-sets) having employment potential in
which training should be imparted by the different departments of the state.
9.4 Methodology
This study is based on the secondary data analysis. In this study our concern
of training is in vocational training, not in high level skills provided in professional
colleges (viz. engineering colleges, medical colleges, agriculture colleges,
polytechnics and other professional colleges) which should be estimated on the
basis of demand by the economy or individuals (potential trainees). Our concern of
vocational training here is to provide the skills to make them employable whenever
the opportunity exists in the state or outside the state and earn the income which
can meet the basic needs of their families. Millions of the unskilled laborers who
are going every year from Bihar to other developed states should go as skilled
workers so that they can have a better bargaining power.
Keeping in view the surplus labour in the state, ―the demand of persons to be
trained‖ as well as ―requirement of the persons, who should be trained in
vocational skills‖ have been estimated, and for this four exercises given below
have been attempted.
1. Estimating the industry-wise demand of persons with vocational education
and training in the state in the years 2010, 2015, 2020 and 2025.
2. Estimating the total number of persons required to be trained in vocational
education and training in the years 2010, 2015, 2020 and 2025.
3. Distributing the demand and requirement of persons with vocational
education and training to be trained in ITIs and ITCs and in other
departments of the state in the years 2010, 2015, 2020 and 2025.
4. Identification of new trades having employment potential in the state.
Methodology adopted in carrying out the above four exercises is given below in
four sub-sections.
9.4.1 Industry-wise Demand for Vocational Educational and Training
9.4.1.1 Demand of persons with vocational training within state
Demand of vocationally trained persons within the state was projected by
two methods:
First Method (Direct Method)
In this method industry-wise employment elasticity (of technical persons)
with respect to GSDP was obtained for the period 1993-94 to 2004-05.
Employment (of technical persons) for the years 1993-94 and 2004-05 was
obtained from NSSO surveys and GSDP was obtained from the department of
Statistics, Govt. of Bihar. Industry-wise CAGRs of GSDP for the periods 2010-15,
2015-20 and 2020-25 were projected on the basis of past achievements during the
period 2000 to 2010, targets of Eleventh Five Year Plan (2007-12) of the state and
future economic agenda of the newly elected government of Bihar. It was assumed
that industry-wise EEs of technical persons with respect to GSDP would remain
more or less same during the projected period. Then industry-wise employment (of
technical persons) was estimated for this period by using the projected EEs and
projected GSDP.
Projected employment of vocationally trained persons was obtained from the
projected employment of technical persons by applying the same ratio as obtained
from the latest survey on Employment and Unemployment conducted in the year
2004-05. This projected employment of vocationally trained persons gave the
demand of vocationally trained persons within the state.
Second Method (Indirect Method)
In this method first Industry-wise employment was projected in the same
way as industry-wise employment (of technical persons) has been projected in the
first method. Then projected employment of technical persons was obtained from
the projected total employment by assuming that the existed share of employment
of technical persons to total employment in the year 2004-05 would be doubled in
the year 2024-2025. Further projected employment of vocationally trained persons
was obtained from the projected employment of technical persons by applying the
same ratio as obtained from the latest survey on Employment and Unemployment
conducted in the year 2004-05. Again this projected employment of vocationally
trained persons gave the estimate of demand of vocationally trained persons within
the state.
9.4.1.2 Demand of persons with vocational training outside the state
There are two major sources which give estimates of the incidence of
migrations from Bihar. The first is the Population Census conducted after every ten
years and the other is the surveys conducted by NSSO. Extent of migration from
Bihar to other states, along with the background (i.e. age, qualification and sex
etc.) of migrants and reasons of migrations was obtained from these two sources.
Besides these two official sources, there are a number of studies on ―Migration
from Bihar state‖. Ministry of External Affairs and the newly constituted Ministry
of Overseas Affaires provide data on International Migration from India to
different countries. Demand of persons with vocational training outside the state
was projected on the basis of the past trend of migration, reasons of migration, and
the demographic dividend of the state.
9.4.2: Estimating the total number of persons required to be trained in
vocational education and training
There are different ways to look at the scene of how many people ought to
be trained. Here we have compared the present status of vocational training in
Bihar with that of other states. We find that the situation in Bihar is very
unsatisfactory as compared to other states. Keeping this fact in view we fixed up
some target year by which Bihar state would achieve the present status of some
state having some similarities to Bihar and is one of the highest producing students
through formal/non-formal vocational training. Major states having some
similarities to Bihar were identified by comparing the share of employment in
agriculture and allied activities in the year 2004-05.
9.4.3: Demand for Vocationally Trained in ITIs and ITCs
Above two sub-sections (sub-section 9.3.1 and 9.3.2) give the estimates of
students demanded/required to be trained in all the institutes/departments of the
state. Keeping in view the past trend of the share of students who were admitted in
ITIs/ITCs to the total students admitted in all institutes/departments and the
policies of the state government, persons to be trained in ITIs/ITCs for the terminal
years were obtained.
9.4.4: Identification of Trades with Employment Potential in the State
Eleventh Five Year Plan of India has identified 20 growth sectors having
high employment potential in the country. These growth sectors have employment
potential in the state also. The trades in which vocational training is being provided
in the state and have employment potential were classified, under these growth
sectors. It was observed that some of the growth sectors were not covered by the
existing trades. Effort was made to identify some trades under these left out growth
sectors.
The trades in which vocational training is being provided in developed states
(viz. Gujarat, and Maharashtra) and the courses under Modular Employable
Scheme (MES) approved by National Council of Vocational Training (NCVT) but
are not covered in Bihar state were also taken into consideration. However before
including these trades in the list of skill-sets it was ensured that these trades should
have employment potential in the state. Duration and minimum qualification
required for each trade were also suggested. Scope of employment potential of
trades suggested was analysed, keeping in view the market demand, infrastructure
facilities and resources of the State.
Before finalizing the trades, opinion of the experts published in news papers
and reports were kept in view. Team members have also met some experts in the
area and obtained their views.
9.5 Status of Vocational Education and Training in Bihar
9.5.1 Training Institutes/Centers Under Different Departments
There are many training institutes/centres, though not adequate yet, under
different departments in Bihar for imparting the vocational training programmes to
make supply of skilled personnel to the industrial sectors. The purpose of these
institutes is to generate skilled manpower to fulfill the demand of industries. The
skills imparted by ITIs/ITCs are to keep pace with the technological demands of
economy and the expanding universe of knowledge. There were 45 Govt. ITIs and
207 private Industrial Training Centers (ITCs) in the state in the year 2010.
Actual intake in different trades of ITIs during the year 2009 was 12,143 out
of which 5,769 took admissions in one year courses and the remaining students
6,374 took admissions in two year courses. Similarly in ITCs actual intake in
different trades during that year was 18,859 out of which 2,625 took admissions in
one year courses and the remaining 16,234 students took admissions in two year
courses.
Beside ITI/ITCs there are other departments of the state which provide
vocational and educational training. Actual intake in other departments during the
year 2009 was about 20 thousands. In Education Department about 7000 students
have taken admission in schools for vocational courses.
9.5.2 Status of Vocational Training as per NSSO Survey in 2004-05
9.5.2.1 Vocation Training Received/being Received
In Bihar state, of the persons of age 15-29 years, during the year 2004-05 (i)
only 0.3 per cent was receiving formal vocational training, (ii) 0.2 per cent
reported to have received formal vocational training and (iii) another 1.3 percent
reported to have received non-formal vocational training. If we assume that
another one per cent of the persons were receiving the non-formal vocational
training than we can say that only 3 per cent of the persons in this age group were
either receiving any vocational training or they have received any vocational
training (formal or non-formal), which is very low percentage. The proportion of
the persons who received/being received the vocational training was lower in the
case of females than in the case of males in both the rural and urban areas.
Moreover, as expected, the proportion was higher in the urban areas than that of
rural areas.
9.5.2.2 Field of Formal Vocational Training
Field of training signifies the specific area of the training that a person has
obtained in the past and tallies broadly with the specific trade. In the 2004-05
survey, data in respect of 21 specific areas of trade were collected. But in case of
Bihar state a large proportion (i.e. 44 per cent) of persons were non-respondent
compare to all India rate of 1.5 per cent.
Usually, vocational training has been oriented towards a number of
engineering and technical trades. Though they continue to form the core of
vocational training, its scope was considerably widened to include many non-
engineering trades also. In Bihar state, there was a limited choice for different
trades. In case of males, the most demanded field of training was found to be
‗Mechanical engineering trades‘ (32 per cent) followed by ‗Electrical and
electronic engineering trades‘ (12 per cent) in the rural areas; and ‗Computer
trades‘ (31 per cent) followed by ‗Electrical and electronic engineering trades‘ (21
per cent) in the urban areas. Among rural female youths, the demand was a little
different. About 21 per cent of them, in the rural areas, the highest proportion
among all fields had formal vocational training in the field of ‗Computer trades‘.
Among the urban female youths, the most important choices in terms of
proportions were: ‗Textile related trades‘ and ‗Artisan/Craftsman/Handicraft and
cottage based production trades‘. Each of these two trades had a share of about 31
per cent of total urban females in this age-group.
9.5.2.3 Institution of Formal Vocational Training
Some of the major sources from where vocational training could be received
were collected in the survey (2004-05). These sources were classified into 24
different types of institutes. It is important to note that in case of Bihar the
proportion of non-respondents (i.e.44 per cent) was very large. Beside this about
20 per cent of the respondents in the state reported their institute of training as
‗Other institutes‘.
In Bihar state Industrial training institutes (ITIs)/ Industrial training centers
(ITCs) played the major role in providing training to male youths. The institutes of
‗Tailoring, embroidery and stitch craft‘ and ‗Handloom/handicraft design training
centers/KVIC‘ together played the major role in providing training to female
youths.
As compared to Bihar state, at all India level Industrial training institutes
(ITIs)/ Industrial training centers (ITCs), recognized Motor driving schools,
Schools offering vocational courses, Polytechnics, Institutes run by
Companies/Corporations, UGC together played the major role in providing
training to male youths. The Craft institutes, Industrial training institutes (ITIs)/
Industrial training centers (ITCs), Schools offering vocational courses, Nursing
institutes, Hospital and medical training institutes, Institutes run by
Companies/Corporations and Nursery teacher‘s training institutes together played
the major role in providing training to female youths in the country.
9.6 Estimating the Demand of persons with vocational training in Bihar
9.6.1 Demand of persons with vocational training within state
Demand of persons in the economy is considered as the persons who are
employed by different industries in the economy. Projected demand of persons
with vocational skills would be the number of vocationally trained persons who
would be getting employment in these industries. It was obtained by two different
methods. In the first method, we projected the demand of persons with technical
skills, using the past employment elasticity of technical persons with respect to
GSDP. In the second method, first we projected the demand of total persons, using
the past employment elasticity of total employment with respect to GSDP and then
separated the share of technical persons from the total employment. ‗Total
employment‘ includes ‗employment with technical skills‘ and ‗employment with
no technical skills‘. In both the methods share of vocationally trained persons was
obtained from the projected values of technical persons.
First Method:
It has been observed that in the year 2005, 1.33 lakhs of persons with
vocational training were employed in the state which would be increasing to about
6 lakhs in the year 2025. In other words there was a demand of 1.33 lakhs persons
with vocational training in the year 2005 in the state, which would be increasing to
about 6 lakhs in the year 2025.
Second Method
It has been estimated that in the year 2005, 1.33 lakhs of persons with
vocational training were employed in the state which would be increasing to about
9 lakhs in the year 2025. In other words there was a demand of 1.33 lakhs persons
with vocational training in the year 2005 in the state, which would be increasing to
about 9 lakhs in the year 2025.
Comparison of the estimates by two methods
We have estimated above the demand of persons with vocational skills within the
state by two methods. As per the first method there was a demand of 1.33 lakhs
persons with vocational training in the year 2005 in the state, which would be
increasing to about 6 lakhs in the year 2025. As per the second method there was a
demand of 1.33 lakhs persons with vocational training in the year 2005 in the state,
which would be increasing to about 9 lakhs in the year 2025.However out of the
two methods second method was considered to be better than the first method. In
the second method we have assumed that share of personnel employed with
technical skills would be doubled during the period 2010 to 2025.
9.6.2 Demand of persons who have passed ITIs/ITCs within the state
In the above section we have estimated the demand of persons with
vocational skills within the state by two methods. It includes the demand of ITIs as
well as from other departments. From this we have estimated the demand of
persons within the state who have passed out ITIs/ITCs. As per the intake data of
ITIs/ITCs and other departments of the year 2009, received from the department of
labour resources, government of Bihar, share of ITIs/ITCs to total vocationally
trained persons having diploma or certificate (below graduate) was about 53 per
cent. It is assumed that this ratio would continue in the future years also.
As per the first method, demand of persons with I.T.Is/I.T.Cs would increase from
0.7 lakh in the year 2005 to 3.2 lakhs in the year 2025. As per the second method,
demand of persons with vocational skills would increase from 0.7 lakhs in the year
2005 to 4.8 lakhs in the year 2025.
9.6.3 Out of State Demand for persons from Bihar with Vocational Skills
As per 2001 Population Census, Bihari migrants in different states of India
whose place of last residence was Bihar were about 22 lakhs. Duration of these
migrants from Bihar to other states may vary from 0 to 9 years. In other words,
average numbers of out-migrants per year from Bihar to other states are about 2.2
lakhs. As per NSSO estimates it is observed that 56.5 per cent of these migrants
(males and females combined) are migrating for employment related activities. In
other words, out of 2.20 lakhs of out-migrants, 1.25 lakhs are migrating per year to
other states of India for employment related activities.
Even if we go by conservative estimates, out of 1.25 lakhs economic labour
migrants per year from Bihar about 12,500 (i.e. 10 per cent of out-migrants) may
be imparted vocational training in the state. In other words there would be an
additional demand of 12,500 per year in the state for vocationally trained persons.
If we assume that 50 per cent of these migrants would be those who have
completed their education from ITIs/ITCs, then we can say that there would be an
additional demand of 6,250 per year for ITIs/ITCs trained persons.
Year-wise labour outflows from India to different countries of the world
during 2004 to 2009 shows that about 6 lakhs persons per year migrated to other
countries. Main destination countries of these migrants are Saudi Arabia, UAE,
Oman, Kuwait and Bahrain. Looking at the past trend of out-migration, one may
argue that during next two decades their number would increase further. State-wise
out-migrants to different countries shows that in the year 2009, out of 6.1 lakhs
Indian out-migrants to different countries, about 50,000 (i.e. more than 8%) were
from Bihar state, which is at par with the population share of the state. In the
previous five years also about same percentage of total out migrants were from
Bihar.
A large number of technicians and skilled workers also migrate from India
to other countries. As per the Ministry of External Affairs, Government of India,
(Presently Ministry of Overseas Indian Affairs) during the past three year period of
1988-90, labour outflows from India to different countries was about 4.5 lakhs.
Out of 4.5 lakhs, 1.6 lakhs persons (38 per cent) were with vocational skills. These
vocational skills included carpenter, mason, driver, electrician, Mechanic (A/c),
tailor, technician, welder, fixer/fabricator, plumber, painter and operator.
Though this data is quite old, one may argue that this ratio of vocationally trained
persons to total labour outflow is not going to decrease because nowadays more
skilled workers are in demand as compared to unskilled persons. Even if apply the
same old ratio we can say that out of 6 lakh persons who are migrating per year
from India to other countries, about 2 lakh persons (33 per cent of total) would be
with vocational training. If we assume the existing trend to continue, there would
be a demand of more than 2 lakh persons per year of vocationally trained persons
from India to other countries.
In the total out-migration from India, Bihar state‘s share of migration is
about eight per cent. One may argue that, share of skilled workers who would
migrate from Bihar would be less as compared to All India. So even if we go by
conservative estimates, out of 2 lakh persons with vocational skills who would
have demand in other countries, 8,000 (i.e. 4 per cent of 2 lakhs) would be from
Bihar. Further, out of 8000 skilled persons of the state 4000 persons (i.e. 4000)
may be from ITI/ITCs and remaining 4000 persons (i.e. 50 per cent) may be
trained by institutes/centers run by other departments.
9.6.4 Projected Estimates of shortages and surpluses of ITIs/ITCs passed in
Bihar
Estimates of shortages and surpluses of ―ITI/ITC passed‖ (under the Labour
Department, Government of Bihar) as well as of the persons who would pass these
skills from the ―Other Departments‖ of the state can be projected. But because of
the non-availability of data of pass out students from the ―Other Departments‖ we
could do this exercise for ―ITI/ITC‖ only.
9.6.4.1 Additional Demand on Yearly Basis
First additional demand on five yearly basis was obtained. Then this
additional demand was converted into yearly basis. Additional demand of
ITIs/ITCs within the state for the period 2010-15 was obtained by taking the
difference of demand during the years 2015 and 2010. Similarly, estimates of
additional demand for other two periods (viz. 2015-20 and 2020-25) were
obtained. Secondly, additional demand has been obtained directly for ‗other states
of India‘ and ‗other countries of the world‘. Third important point worth
mentioning is that total demand within the state was obtained by two different
methods, details of which have been discussed in chapter VI. So the additional
demand in the state also has two estimates. First estimate relate to first method and
second estimate relate to second method discussed in the text.
It is observed that as per the first estimate, additional demand of ITIs/ITCs was
85,300 during the period 2010-15, which would increase to 179,300 during the
period 2020-25. As per the second estimate, additional demand of ITIs/ITCs was
107,300 during the period 2010-15 which may increase to 245,300 during the
period 2020-25.
9.6.4.2 Additional Supply on Yearly Basis
Actual intake of ITIs/ITCs in Bihar during the year was about 31 thousands.
Out turn data of these ITIs/ITCs was required to get an idea of pass out rate of
these students. This type of data was not available for Bihar state. But this type of
data was available for Kerala State. During the last three years (viz. 2005, 2006
and 2007) total intake of ITIs/ITC students was 71,115. Out of 71,115 students
appeared in different trades, 43,355 had passed. This gives a pass out rate of 59 per
cent in Kerala state.
If we apply the same pass out rate to 31,000 students who appear in different
trades in ITIs/ITCs of Bihar state than about 18 thousand students are passing out
every year. This number gives an additional supply of ITIs/ITCs per year.
9.6.4.3 Shortages and Surpluses of ITIs/ITCs on Yearly Basis:
First Method
With the comparison of additional demand and additional supply, it is
observed that undoubtedly there was a small surplus of about 1700 ITIs/ITCs
persons in the year 2010, but if the existing trend of admissions continues and there
is no change in the intake capacity of ITIs/ITCs in the state than there would be an
acute shortage of ITI/ITC persons in the year 2025. This shortage would be of the
order of 3,300 persons in the year 2015, which would increase to 23,300 persons in
the year 2025.
Second Method
As per this method it is estimated that, in the year 2010 there was a shortage
of 1300 ITIs/ITCs passed in the state. If the existing trend of passed out continues,
and there is no change in the intake capacity of ITIs/ITCs in the state then there
would be a shortage of about 6300 persons in the year 2015 and this shortage
would further increase to 42300 in the year 2025.
9.7 Estimating the requirement of Vocational Education and Training in
Bihar
Here we have fixed up some target years by which Bihar state should
achieve the present level of vocational training of some other state. However the
targeted states should have
(iii) some similarities to Bihar state and
(iv) a high level of vocational education and training.
Five steps involved for estimating the requirement of vocational education and
training in this method are discussed below
Step I: Selecting the states with some similarities to Bihar and having high
level of Vocational Education and Training.
Taking the share of employment in agriculture and allied activities as a
similarity among the states, there are four states viz. Asham (66 per cent),
Chhattisgarh (75 per cent), Madhya Pradesh (67 per cent) and Orissa (63 per cent)
which have percentage employment in ―Agriculture and allied activities‖ in the
range of ±10 per cent to that of Bihar state (73 per cent).
Step II: Fixing the Targets of Vocational Education and Training for Bihar
state
Among the four states having employment in agriculture and allied activities
close to that of Bihar, Chhattisgarh (10.4 per cent), Madhya Pradesh (20.7 per cent)
and Orissa (10.1 per cent) have much higher percentage of persons in the age-
group of 15-29 years who have received or were receiving any vocational training
as compared to Bihar state (1.8 per cent) in the year 2005. Keeping this fact in
view we have assumed that following two targets for Bihar which can be achieved
with some efforts by the state government.
(iii) Bihar can achieve the target of 10 per cent persons in the age-group of
15-29 years who would have received or would be receiving the vocational
education and training by the year 2020. This is the present level of
Chhattisgarh and Orissa states.
(iv) Bihar can achieve the target of 20 per cent persons in the age-group of 15-
29 years who would have received or would be receiving the vocational
education and training by the year 2030. This is the present level of Madhya
Pradesh state.
Step III: Projecting the Persons in the age-group 15-29 years who would
require Vocational Training
Total persons who require vocational education and training have been
obtained by applying the percentage of persons (as per the targets fixed above)
who require vocational training to the total projected population in different years.
It has been estimated that if the state achieves the proposed targets then the number
of persons who require vocational education and training would increase about ten
times in the year 2025 (46.6 lakhs) as compared to the number of persons who
were getting training in the year 2005 (4.2 lakhs).
Step IV: Distribution of persons who require Vocational Training by broad
sectors in different years
As discussed above about 30 per cent of the persons were getting the
training from formal system of training in the state, in the year 2005. Remaining 70
per cent of the persons were getting their training from the informal system of
training. If the existing ratios of formal and informal system are applied to the total
persons required to be trained in different years than the distribution of the total
persons by formal and informal system was achieved.
It is estimated that in formal system their number would increase from 1.2 lakhs to
14.0 lakhs and in informal system their number would increase from 2.9 lakhs to
32.6 lakhs during the period 2005 to 2025.
Step V: Distribution of persons who would require vocational training from
ITIs/ITCs and other institutions/departments
As discussed above in the year 2009, about 53 percent of the total intake was
from the ITIs/ITCs. During the last five years (i.e. 2005 to 2010) there has been
huge expansion of ITIs/ITCs in the state. The share of ITIs/ITCs in the year 2010
was quite large and it may be assumed that the existing percentage of ITIs/ITCs
would be stabilized and would remain same in the future years also. Applying this
percentage to the total number of persons who would get the training from formal
system, we would get required number of persons to be trained in ITIs/ITCs in
different years.
It is estimated that their number would increase from about 0.7 lakh in the
year 2005 to 7.4 lakhs in the year 2025. Similarly, number of persons who would
require vocational training from institutions/departments other than ITIs/ITCs
would increase from 0.6 lakh in the year 2005 to 6.6 lakhs in the year 2025.
9.8: Identification of Trades in Bihar
9.8.1: Methodology for Identification of Trades
Resources of Bihar state gave an idea about the areas of employment that
should be targeted in future. In turn it also gave an idea of the trades which will be
demanded. Planning Commission, Government of India has identified 20 Growth
Sectors which have employment potential in the country. While doing this exercise
we have kept in view the Growth Sectors identified by Planning Commission, and
discussed the matter with officers of various departments of States and Centre.
Officials of industries and other offices located at Delhi viz. FICCI, Planning
Commission and DGE&T also gave an idea about the high growth sectors where
employment could be generated and new trades could be introduced or vice versa.
Reports, papers and articles published by different organizations viz. DGE&T,
IAMR, Department of Industries, Government of Bihar, IGNOU were also
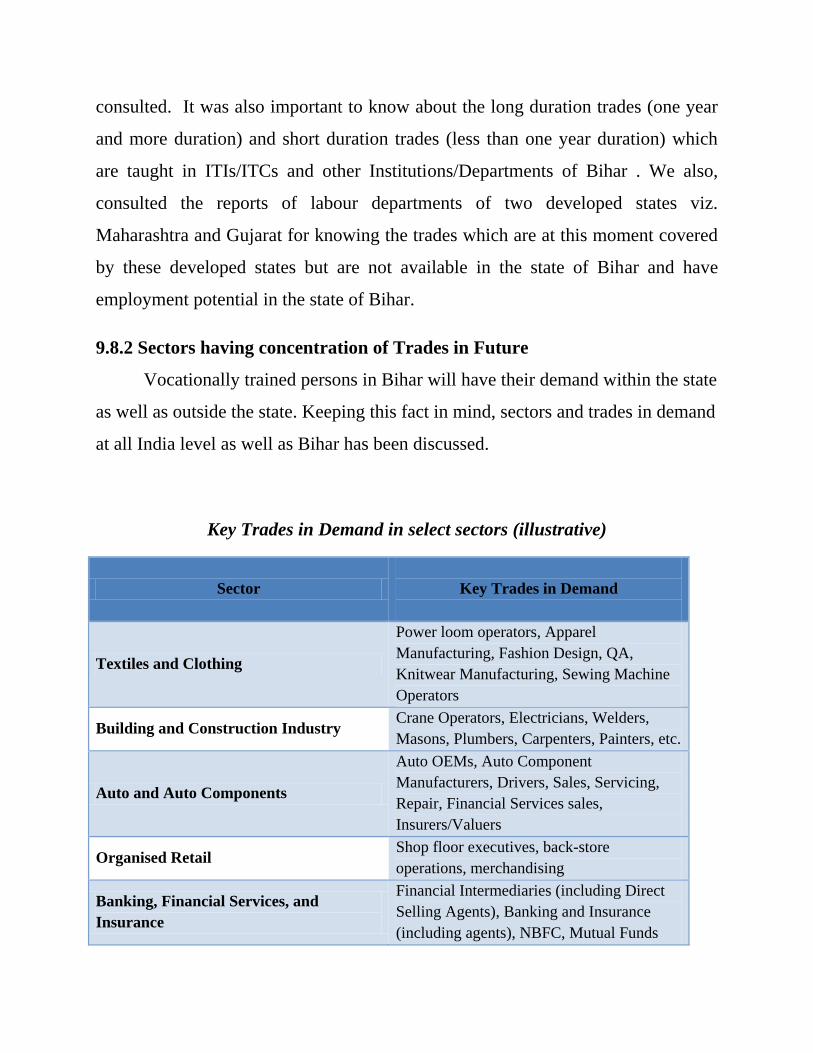
consulted. It was also important to know about the long duration trades (one year
and more duration) and short duration trades (less than one year duration) which
are taught in ITIs/ITCs and other Institutions/Departments of Bihar . We also,
consulted the reports of labour departments of two developed states viz.
Maharashtra and Gujarat for knowing the trades which are at this moment covered
by these developed states but are not available in the state of Bihar and have
employment potential in the state of Bihar.
9.8.2 Sectors having concentration of Trades in Future
Vocationally trained persons in Bihar will have their demand within the state
as well as outside the state. Keeping this fact in mind, sectors and trades in demand
at all India level as well as Bihar has been discussed.
Key Trades in Demand in select sectors (illustrative)
Sector
Key Trades in Demand
Textiles and Clothing
Power loom operators, Apparel
Manufacturing, Fashion Design, QA,
Knitwear Manufacturing, Sewing Machine
Operators
Building and Construction Industry Crane Operators, Electricians, Welders,
Masons, Plumbers, Carpenters, Painters, etc.
Auto and Auto Components
Auto OEMs, Auto Component
Manufacturers, Drivers, Sales, Servicing,
Repair, Financial Services sales,
Insurers/Valuers
Organised Retail Shop floor executives, back-store
operations, merchandising
Banking, Financial Services, and
Insurance
Financial Intermediaries (including Direct
Selling Agents), Banking and Insurance
(including agents), NBFC, Mutual Funds
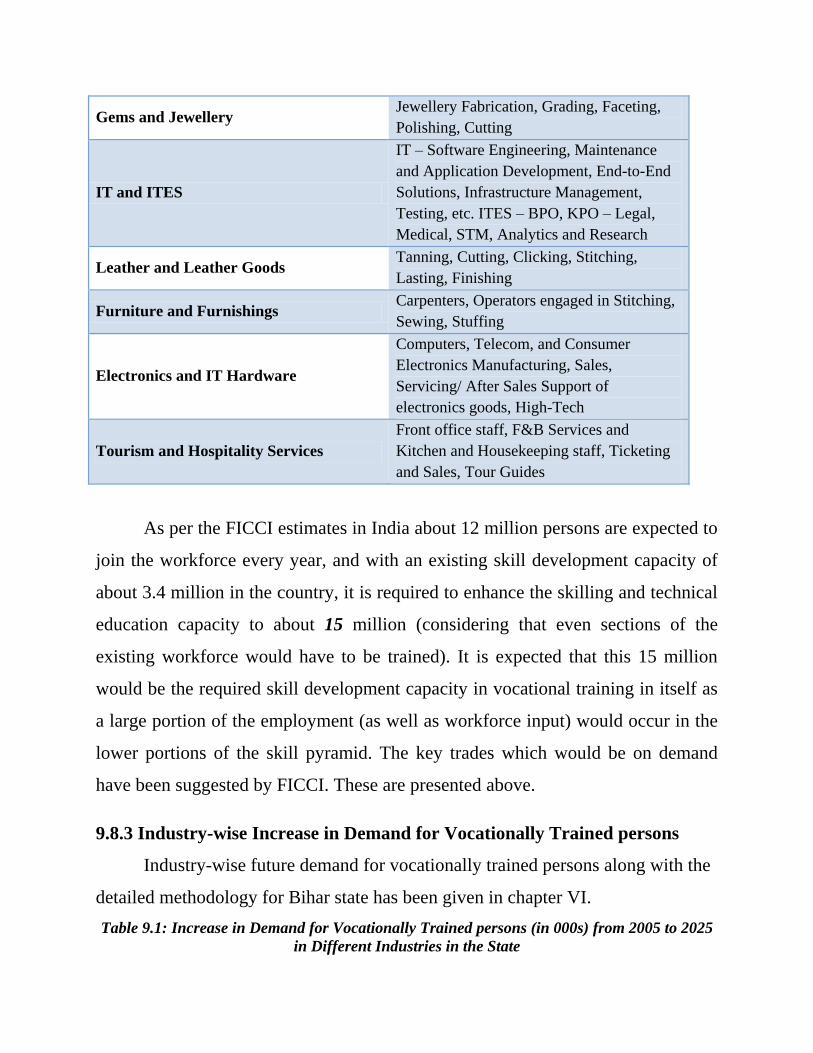
Gems and Jewellery Jewellery Fabrication, Grading, Faceting,
Polishing, Cutting
IT and ITES
IT – Software Engineering, Maintenance
and Application Development, End-to-End
Solutions, Infrastructure Management,
Testing, etc. ITES – BPO, KPO – Legal,
Medical, STM, Analytics and Research
Leather and Leather Goods Tanning, Cutting, Clicking, Stitching,
Lasting, Finishing
Furniture and Furnishings Carpenters, Operators engaged in Stitching,
Sewing, Stuffing
Electronics and IT Hardware
Computers, Telecom, and Consumer
Electronics Manufacturing, Sales,
Servicing/ After Sales Support of
electronics goods, High-Tech
Tourism and Hospitality Services
Front office staff, F&B Services and
Kitchen and Housekeeping staff, Ticketing
and Sales, Tour Guides
As per the FICCI estimates in India about 12 million persons are expected to
join the workforce every year, and with an existing skill development capacity of
about 3.4 million in the country, it is required to enhance the skilling and technical
education capacity to about 15 million (considering that even sections of the
existing workforce would have to be trained). It is expected that this 15 million
would be the required skill development capacity in vocational training in itself as
a large portion of the employment (as well as workforce input) would occur in the
lower portions of the skill pyramid. The key trades which would be on demand
have been suggested by FICCI. These are presented above.
9.8.3 Industry-wise Increase in Demand for Vocationally Trained persons
Industry-wise future demand for vocationally trained persons along with the
detailed methodology for Bihar state has been given in chapter VI.
Table 9.1: Increase in Demand for Vocationally Trained persons (in 000s) from 2005 to 2025
in Different Industries in the State
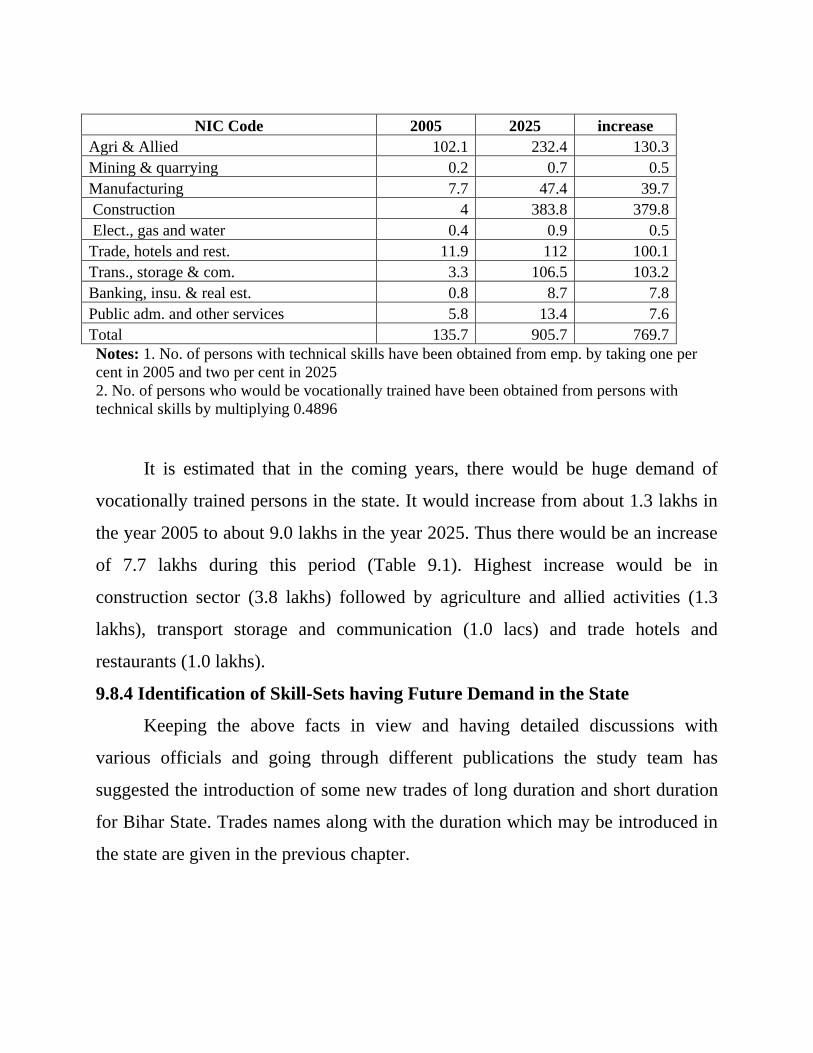
NIC Code 2005 2025 increase
Agri & Allied 102.1 232.4 130.3
Mining & quarrying 0.2 0.7 0.5
Manufacturing 7.7 47.4 39.7
Construction 4 383.8 379.8
Elect., gas and water 0.4 0.9 0.5
Trade, hotels and rest. 11.9 112 100.1
Trans., storage & com. 3.3 106.5 103.2
Banking, insu. & real est. 0.8 8.7 7.8
Public adm. and other services 5.8 13.4 7.6
Total 135.7 905.7 769.7
Notes: 1. No. of persons with technical skills have been obtained from emp. by taking one per
cent in 2005 and two per cent in 2025
2. No. of persons who would be vocationally trained have been obtained from persons with
technical skills by multiplying 0.4896
It is estimated that in the coming years, there would be huge demand of
vocationally trained persons in the state. It would increase from about 1.3 lakhs in
the year 2005 to about 9.0 lakhs in the year 2025. Thus there would be an increase
of 7.7 lakhs during this period (Table 9.1). Highest increase would be in
construction sector (3.8 lakhs) followed by agriculture and allied activities (1.3
lakhs), transport storage and communication (1.0 lacs) and trade hotels and
restaurants (1.0 lakhs).
9.8.4 Identification of Skill-Sets having Future Demand in the State
Keeping the above facts in view and having detailed discussions with
various officials and going through different publications the study team has
suggested the introduction of some new trades of long duration and short duration
for Bihar State. Trades names along with the duration which may be introduced in
the state are given in the previous chapter.
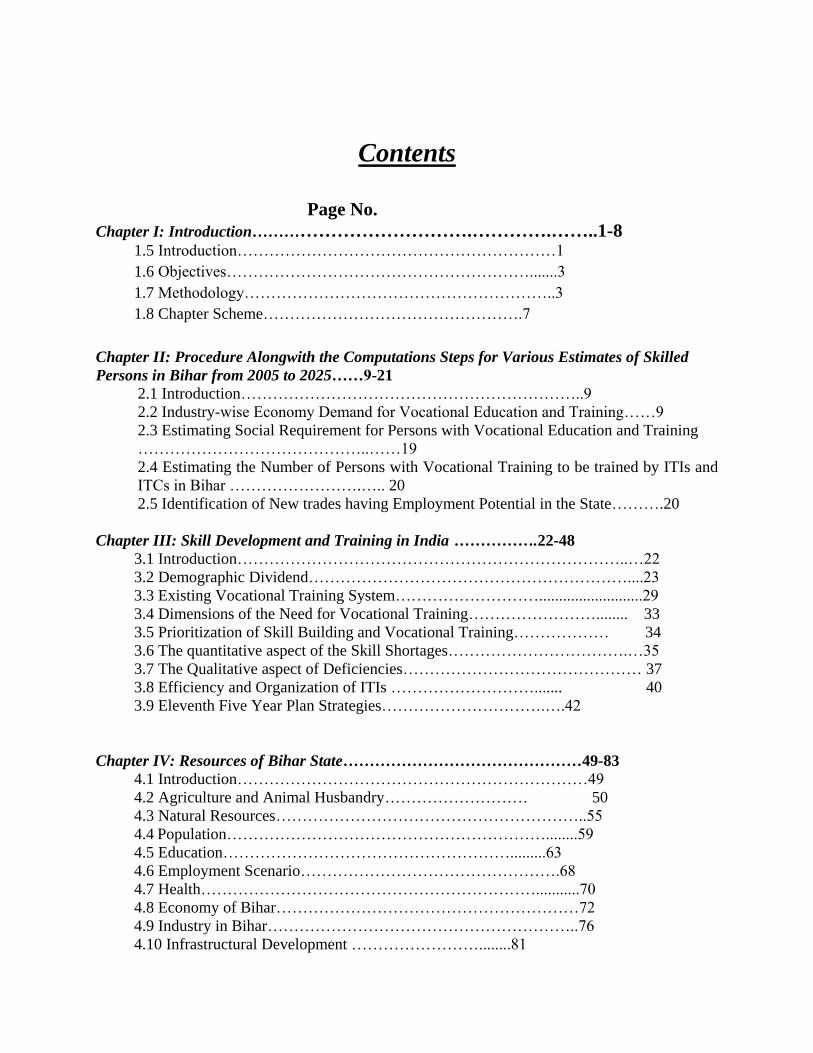
Contents
Page No. Chapter I: Introduction……………………………….………….……..1-8
1.5 Introduction……………………………………………………1
1.6 Objectives………………………………………………….......3
1.7 Methodology…………………………………………………..3
1.8 Chapter Scheme………………………………………….7
Chapter II: Procedure Alongwith the Computations Steps for Various Estimates of Skilled
Persons in Bihar from 2005 to 2025……9-21 2.1 Introduction………………………………………………………..9
2.2 Industry-wise Economy Demand for Vocational Education and Training……9
2.3 Estimating Social Requirement for Persons with Vocational Education and Training ……………………………………..……19
2.4 Estimating the Number of Persons with Vocational Training to be trained by ITIs and
ITCs in Bihar …………………….….. 20
2.5 Identification of New trades having Employment Potential in the State……….20
Chapter III: Skill Development and Training in India …………….22-48 3.1 Introduction………………………………………………………………..…22
3.2 Demographic Dividend……………………………………………………....23
3.3 Existing Vocational Training System………………………..........................29
3.4 Dimensions of the Need for Vocational Training……………………........ 33
3.5 Prioritization of Skill Building and Vocational Training……………… 34
3.6 The quantitative aspect of the Skill Shortages…………………………….…35
3.7 The Qualitative aspect of Deficiencies……………………………………… 37
3.8 Efficiency and Organization of ITIs ………………………....... 40
3.9 Eleventh Five Year Plan Strategies………………………….….42
Chapter IV: Resources of Bihar State………………………………………49-83
4.1 Introduction…………………………………………………………49
4.2 Agriculture and Animal Husbandry……………………… 50
4.3 Natural Resources…………………………………………………..55
4.4 Population……………………………………………………........59
4.5 Education……………………………………………….........63
4.6 Employment Scenario………………………………………….68
4.7 Health………………………………………………………...........70
4.8 Economy of Bihar…………………………………………………72
4.9 Industry in Bihar…………………………………………………..76
4.10 Infrastructural Development ……………………........81
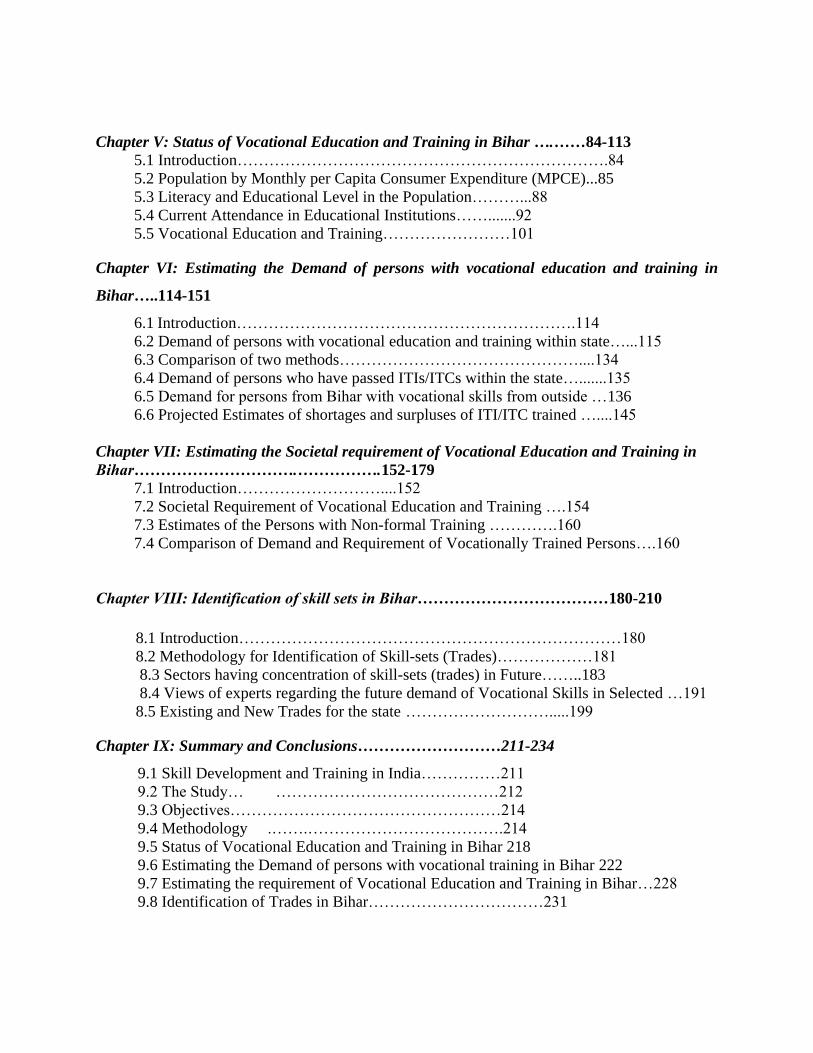
Chapter V: Status of Vocational Education and Training in Bihar ….……84-113
5.1 Introduction…………………………………………………………….84
5.2 Population by Monthly per Capita Consumer Expenditure (MPCE)...85
5.3 Literacy and Educational Level in the Population………...88
5.4 Current Attendance in Educational Institutions…….......92
5.5 Vocational Education and Training……………………101
Chapter VI: Estimating the Demand of persons with vocational education and training in
Bihar…..114-151
6.1 Introduction……………………………………………………….114 6.2 Demand of persons with vocational education and training within state…...115
6.3 Comparison of two methods………………………………………....134
6.4 Demand of persons who have passed ITIs/ITCs within the state….......135
6.5 Demand for persons from Bihar with vocational skills from outside …136
6.6 Projected Estimates of shortages and surpluses of ITI/ITC trained …....145
Chapter VII: Estimating the Societal requirement of Vocational Education and Training in
Bihar………………………….…………….152-179
7.1 Introduction………………………....152
7.2 Societal Requirement of Vocational Education and Training ….154
7.3 Estimates of the Persons with Non-formal Training ………….160
7.4 Comparison of Demand and Requirement of Vocationally Trained Persons….160
Chapter VIII: Identification of skill sets in Bihar………………………………180-210
8.1 Introduction………………………………………………………………180
8.2 Methodology for Identification of Skill-sets (Trades)………………181
8.3 Sectors having concentration of skill-sets (trades) in Future……..183
8.4 Views of experts regarding the future demand of Vocational Skills in Selected …191
8.5 Existing and New Trades for the state ……………………….....199
Chapter IX: Summary and Conclusions………………………211-234
9.1 Skill Development and Training in India……………211
9.2 The Study… ……………………………………212
9.3 Objectives……………………………………………214
9.4 Methodology .…….……………………………….214
9.5 Status of Vocational Education and Training in Bihar 218
9.6 Estimating the Demand of persons with vocational training in Bihar 222
9.7 Estimating the requirement of Vocational Education and Training in Bihar…228
9.8 Identification of Trades in Bihar……………………………231
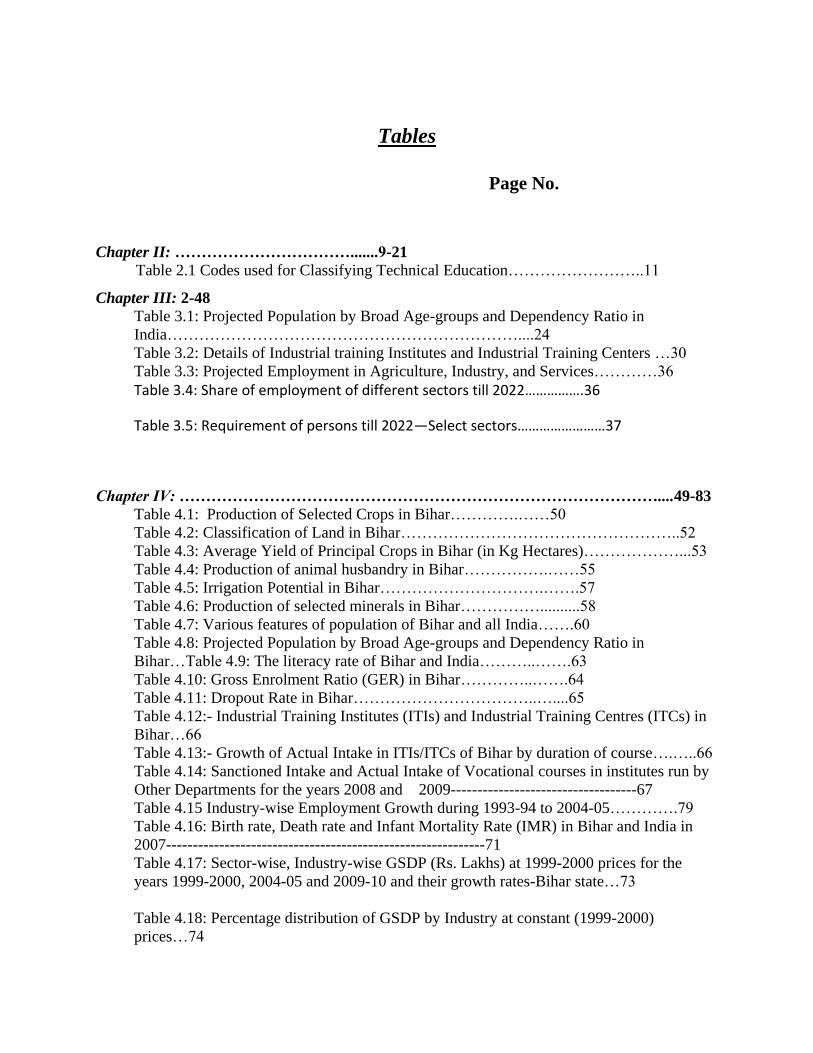
Tables
Page No.
Chapter II: …………………………….......9-21
Table 2.1 Codes used for Classifying Technical Education……………………..11
Chapter III: 2-48
Table 3.1: Projected Population by Broad Age-groups and Dependency Ratio in
India…………………………………………………………....24
Table 3.2: Details of Industrial training Institutes and Industrial Training Centers …30
Table 3.3: Projected Employment in Agriculture, Industry, and Services…………36
Table 3.4: Share of employment of different sectors till 2022…………….36
Table 3.5: Requirement of persons till 2022—Select sectors……………………37
Chapter IV: ………………………………………………………………………………....49-83
Table 4.1: Production of Selected Crops in Bihar………….……50
Table 4.2: Classification of Land in Bihar……………………………………………..52
Table 4.3: Average Yield of Principal Crops in Bihar (in Kg Hectares)………………...53
Table 4.4: Production of animal husbandry in Bihar…………….……55
Table 4.5: Irrigation Potential in Bihar………………………….…….57
Table 4.6: Production of selected minerals in Bihar……………..........58
Table 4.7: Various features of population of Bihar and all India…….60
Table 4.8: Projected Population by Broad Age-groups and Dependency Ratio in
Bihar…Table 4.9: The literacy rate of Bihar and India………..…….63
Table 4.10: Gross Enrolment Ratio (GER) in Bihar…………..…….64
Table 4.11: Dropout Rate in Bihar……………………………..…....65
Table 4.12:- Industrial Training Institutes (ITIs) and Industrial Training Centres (ITCs) in
Bihar…66
Table 4.13:- Growth of Actual Intake in ITIs/ITCs of Bihar by duration of course….…..66
Table 4.14: Sanctioned Intake and Actual Intake of Vocational courses in institutes run by
Other Departments for the years 2008 and 2009-----------------------------------67
Table 4.15 Industry-wise Employment Growth during 1993-94 to 2004-05………….79
Table 4.16: Birth rate, Death rate and Infant Mortality Rate (IMR) in Bihar and India in
2007------------------------------------------------------------71
Table 4.17: Sector-wise, Industry-wise GSDP (Rs. Lakhs) at 1999-2000 prices for the
years 1999-2000, 2004-05 and 2009-10 and their growth rates-Bihar state…73
Table 4.18: Percentage distribution of GSDP by Industry at constant (1999-2000)
prices…74
Table 4.19: Number of Establishment and Workers in non-farm activities in Bihar and
India in 2005……………………………………….……76
Table 4.20: Share of Establishment and Workers in non-farm activities in Bihar in
2005…………………………………………………….……77
Table 4.21: Number of Workers per Establishment in Bihar in 2005….......78
Table 4.22: Production and Distribution of Electricity in Bihar….….....82
Table 4.23: Households availing banking services in Bihar in 2001….....83
Chapter V: ………………………………………………………….84-113
Table 5.1: Per 1000 Distribution of Population by MPCE (Rs.) Class during 2004-05…..86
Table 52: Number of Households with no Literate Member of Age 15 years and above Per
1000 Households among all Members for Each MPCE Class during 2004-05…89
Table 5.3: Per 1000 Distribution of Persons of 15 years and above by General Educational
Level for Bihar State………………………………..91
Table 5.4: Per 1000 Distribution of Age 5-29 years by Level of Current Attendance…94
Table 5.5: Dropout Rate at Middle level for the Age-group 5-29 years…96
Table 5.6: Current Attendance Rates (Per 1000) in Educational Institutions Per 1000
Persons of Different Age Groups…………………………98
Table 5.7: Per 1000 Distribution of Persons of Age 5-29 Years Who were Currently Not
Attending Any Educational Institution by Status and Broad Reason for Non-
Attendance………………………………………………………99
Table 5.8: Per 1000 Distribution of Persons of Age 15-29 Years by Status of Vocational
Training Received or Being Received………………..103
Table 5.9: Number Per 1000 Persons of Different Age Groups Who Received Formal
Vocational Training……………………………………..104
Table 5.10: Number Per 1000 Persons of Different Broad Usual Principal Activity Status
in the Age -Group 15-29 Who Received Formal Vocational Training….....105
Table 5.11: Per 1000 Distribution of Persons of Age 5-29 Years by Status of Vocational
Training Received or being Received………………...107
Table 5.12: Per 1000 Distribution of Persons of Age 5-29 years Who Received Formal
Vocational Training by Institution of Training ………..110
Chapter VI: ……………………………………………………114-151
Table 6.1: Sector-wise Industry-wise GSDP (Rs. Lakhs) at 1999-2000 Prices for the years
1999-2000, 2004-05 and 2009-10 and their Growth Rates-Bihar State…......117
Table 6.2: Sector-wise/Industry-wise Targeted Growth Rates of GSDP at 1999-2000 Prices
for the Period 2007-12 (Eleventh Plan)-Bihar State..118
Table 6.3: Industry-wise Actual and Proposed Growth Rates of GSDP at 1999-2000 Prices
for the Period 2005-25 in Bihar State……………….119
Table 6.4: Employment Elasticity of Employment (With Tech. Skills. 1994-2005)
Table 6.5: Actual & Proposed Employment Elasticity of Employment (Tech.) w.r.t. SGDP
during 2005 to 2025…………………………..……...122
Table 6.6: Estimating the Projected Growth Rates of Employment (Technical)…123
Table 6.7: Estimating the Employment of Technical Manpower (in numbers) ….......125
Table 6.8: Distribution of Employment Tech. (in 000s) by Levels of Skills in 2010, 2015
2020 and 2025…………………………………………..127
Table 6.9: Employment Elasticity of Total Employment w.r.t. GSDP during 1993 to
2004…………………………………………………………..128
Table 6.10: Actual & Proposed Employment Elasticity of Total Employment w.r.t. GSDP
during 2005 to 2025……………………………………130
Table 6.11: Estimating the Projected Growth Rates of Employment…131
Table 6.12: Estimating the Employment (in numbers) in 2010, 2015 2020 and 2025…133
Table 6.13: Estimating the Employment of Technical Manpower (with segregation and
different levels) (in 000s)……………………………….....135
Table 6.14: Estimating Future Demand for Vocational Employment in '000s
………………….137
Table 6.15 Net migration in Bihar state ………………........139
Table 6.16 Distribution (per 1000) of out migrants by reason for out migration
………………………………………………………………...........139
Table 6.17 Migrants in other states whose place of last residence was Bihar (duration 0-9
years)……………………………………………………141
Table 6.18 Percentage Distribution of Migrant labour from Bihar by level of
Education……………………………………………………..............142
Table 6.19: Labour Outflows from India by destination 2004-2009…...143
Table 6.20: State-wise Figures of Workers Granted Emigration Clearance/ECNR
Endorsement during the years 2004-2009……………………….144
Table 6.21 Additional Demand of ITIs/trained (in 000s)………………..…147
Table 6.22: Projected Additional Demand of Shortages and Surpluses of ITIs/ITCs trained
on yearly ……………………………………………...148
Chapter VII: …………………………………………………………152-179
Table 7.1: State-wise Percentage of Employment in Agriculture and Allied sector and
Percentage of Persons in the age-group 15-29 years who Received/Receiving
Vocational Training in the year 2005 ………………...155
Table 7.2: Percentage of Persons (in the age group 15-29 years) who require vocational
training from all departments ………………………..157
Table 7.3: Distribution of persons who would require training (in age-group 15-29 years)
by sectors………..………………………………...158
Table 7.4: Distribution of persons who would require training (in age-group 15-29 years)
by type of institution (in 000s)……………………..160
Table 7.5: Comparison of Future Demand and Requirement of Persons with Vocational
Training (in 000s)…………………………..161
Chapter VIII:………………………………………………………......180-210
Table 8.1: Skill sets in Demand in select sectors (illustrative)…….184
Table 8.2: Demand for Vocationally Trained persons (in 000s) from 2005 to 2025 in
Different Industries in the State…………………..……186
Table 8.3: Increase in Demand for Vocationally Trained persons (in 000s) from 2005 to
2025 in Different Industries in the State…………..187
Table 8.4: Industry- wise Percentage Distribution of Persons with Vocational Trades in
Bihar during 2005……….………………………..189
Table 8.5 Growth Sector-wise Distribution of Existing Trades in ITIs/ITCs by Duration
of the Course ……………………………………200
Table 8.6: Growth Sector-wise Existing Trades in Other Departments by Duration of the
Course……………………………………………….203
Table 8.7: Growth Sector-wise Trades of one to two year Duration which may be
Introduced in Bihar……………………………………….....204
Table 8.8: Growth Sector-wise Trades of 3 months and 6 months Duration which may be
Introduced in Bihar……………………………...….205
Chapter IX:………………………………………………..........211-234
Table 9.1: Increase in Demand for Vocationally Trained persons (in 000s) from 2005 to
2025 in Different Industries in the State….233
Charts
Chapter II:……………………………………………………….…9-21
Chart II.1 Demand from Bihar……………………………...10
Chart II.2 technical Education……………………………10
Chart II.3 Estimation of Demand…………………………12
Chapter III: ………………………………….22-48
Chart III.1: Age Pyramid of India in 2001…….....25
Chart III.2: Age Pyramid of India in 2006…….…26
Chart III.3: Age Pyramid of India in 2011…26
Chart III.4: Age Pyramid of India in 2016….…26
Chart III.5: Age Pyramid of India in 2021….…27
Chart III.6: Age Pyramid of India in 2026….…27 Chart III.7: Diverse picture (Dependency ratio, %)…..28
Chart III.8 Stark Differences ………………………..29
Chapter IV: ……………………………………………..49-83
Chart IV.1: Age Pyramid of Bihar in 2001………….62
Chart IV.2: Age Pyramid of Bihar in 2006……….62
Chart IV.3: Age Pyramid of Bihar in 2011……….62
Chart IV.4: Age Pyramid of Bihar in 2016…….62
Chart IV.5: Age Pyramid of Bihar in 2021 62
Chart IV.6: Age Pyramid of Bihar in 2026…….62
Chapter V:.…………………………………………84-113
Chart V.1: MPCE below Rs 410 (Rural) and below Rs 580 (Urban)…..86
Chart V.2: Mean of MPCE……………………………………………...88
Chart V.3: Median of MPCE……………………………………………88
Chart V.4: Has to Supplement hh. Income……………………….......99
Chart V.5: Education not necessary…………………100
Chart V.6: Has to attend domestic Chores………………………..100
Chapter VI: ……………………………………………………..…...114-151
Chart VI.1 Additional Demand and Supply of ITIs/ITCs in
Bihar………………………………………………………………….………………....149
Chart VI.2 Shortages and Surpluses of ITC/ITC passed (in 000s) in
Bihar………………………………………………..………………………….150

Chapter I
Introduction
1.1 Introduction
The prevailing employment strategy emphasizes the need for high growth as
a necessary condition for increase in employment. But high growth requires
adequate, qualified manpower with appropriate skills. Importance of skilled
manpower is further increased with the increasing pace of globalization which has
intensified the race of competitiveness among the producers world over to deliver
the goods at cheaper prices.
Recent data has shown that our education system and vocational training
programmes have not been able to provide the adequate size of skilled manpower.
As per the NSSO survey conducted in the year 2004-05, among the persons of age
15-29 years, only two per cent are reported to have received formal vocational
training and another 8 per cent, to have received non-formal vocational training
(NSSO, 2006). This indicates that very few young persons with formal vocational
training enter the workforce. This proportion of trained youth is one of the lowest
in the world (Govt. of India, Planning Commission, 2006).
It is not necessary that high growth with better skilled manpower would
always generate higher growth in employment. In India, during the recent past,
growth in organized sector, high as it was, has been jobless (Chaubey, P.K. 2005;
Arora and Saxena, 2003). So we may have to identify an appropriate combination
of sub-sectors from the unorganized sector where potential of employment growth
is higher than that of organized sector. It is important, therefore, that unorganized
sector gets the qualified manpower with appropriate skills. But most of the skills
this sector gets are traditional in nature viz. weaving, cutting, tailoring,
construction activities, and motor vehicle driving, etc, which are acquired through
non-formal training.
In India different types of institutions/schools running under different departments
which impart the formal vocational training are:
7. Industrial Training Institutes (ITIs)
8. Industrial Training Centres (ITCs)
9. Schools offering vocational courses (Secondary, Higher Secondary level)
10. Tailoring, embroidery and stitch craft institutes
11. Recognized motor driving schools
12. Institutes run by companies/corporations
They together had played a major role in providing training to the youths (NSSO,
2006).
Industrial Training Institutes have been set up by the respective State
Governments under Craftsman Training Progrramme of Government of India.
These Institutes aim at meeting twin objectives of creating skilled manpower to
enhance the employability of the youth and meet the industry demand for skill sets.
Students are imparted long term and short term vocational training in various
trades, presuming that it would enhance their employability, build their capabilities
for self-employment avenues and supply quality skill sets to the industry.
But in India, in most cases, the lack of demand orientation in vocational
training and skill development projects often resulted in unemployment, while at
the same time a large number of activities could not grow because of lack of
appropriate skilled manpower (Gupta, 2006). Keeping these facts in view, it is very
important to assess the demand for these skill sets for the future in different states.
For this a demand-oriented approach to vocational training needs to be adopted
giving due weight to general development activities in those states.
Bihar state is one of the most backward states in the matter of vocational
training. As compared to 2 per cent for the country as a whole only 0.2 per cent of
persons in 15-29 years age group have received the formal vocational training in
the state during the year 2004-05 (NSSO, 2006). However, now the state
government has realized the importance of vocational training and given high
priority in its Eleventh Five Year Plan (Govt. of Bihar, Planning Department,
2006).
At the request of Labour Department, Government of Bihar, IIPA has
conducted this study on ―Assessing the Demand for Skill Sets in
Domestic/National and Overseas Markets by the Year 2025 in Bihar State‖.
Following paragraphs state the objectives of the study, discuss methodology
adopted in the study and outline cauterization scheme.
1.2 Objectives
7. To estimate the industry-wise economy demand of persons with Vocational
Education and Training in Bihar by the years 2009-10, 2014-15, 2019-20
and 2024-25.
8. To estimate the demand of persons with Vocational Training from ITIs/ITCs
of Bihar by the years 2009-10, 2014-15, 2019-20 and 2024-25.
9. Identification of new trades (Skill-sets) having employment potential in
which training should be imparted/arranged by the different departments of
the state.
1.3 Methodology
Manpower demand is derived demand. Since most of the manpower demand
is likely to be locally generated in an area, for knowing the demand of a particular
manpower group in an area, it is important that the planner is knowing about the
resources of that area and the kinds of products that industries need to produce.
The resources of the area include natural resources, human resources and
infrastructure resources. It is also important to know about the amount of
investments, likely to be made in the sector in which that manpower group can get
the employment.
The challenge before India is to develop a vocational education and training
system that will enable employers to find the skilled labour inputs they need. At
the same time currently unskilled workers must also be empowered to develop
skills in a trade and become upwardly mobile participants in the economy (FICCI,
―Skill Development in India‖, 2009).
One may argue that demand for a given skill arises when a person is
interested in the skill and can afford to bear the cost of that skill. But if a person is
poor and illiterate who neither has the money to bear the cost of receiving the skill
nor he knows the benefit of the skill, then there would be no demand for that skill.
The situation in Bihar state is very much similar to that. As per the NSSO Survey
conducted in the year 2004-05, in rural areas of the state 52 per cent of the
population could spend only up to Rs. 410/- per month per person and in urban
areas 57 per cent of the population could spent less than Rs. 580/- per month per
person. In case of females in the age-group of 15-29 years, in rural areas, it was
intriguing to note, in that survey, that the predominant reason for not having
attended any educational institution was ‗education not considered necessary‘ in
the kind of occupation they are likely to be in.
Because of poverty there may not be any demand for vocational training by
the individuals but society demands to empower such unskilled workers to develop
skills and make them upwardly mobile participants in the society. This means that
in addition to the economy demand of vocationally trained persons we should also
have some estimates of ‗society demand‘ - which we have called the requirement
of vocationally trained persons.
Here our concern is in vocational training, not in high level skills provided
in professional colleges (viz. engineering colleges, medical colleges, agriculture
colleges, polytechnics and other professional colleges). Our concern of vocational
training here is to provide skills to make them employable whenever the
opportunity exists in the state or outside the state and earn income which can meet
the basic needs of their families. A large number of the unskilled laborers who are
going every year from Bihar to other developed states should go with skills so that
they can have a better bargaining power.
Realizing this, the Eleventh Five Year Plan of India has set up a Skill
Development Mission (SDM) consisting of an agglomeration of programmes and
appropriate structures aimed at enhancing training opportunities four-fold. New
entrants to the labour force in the non-agricultural sector should increase from the
existing 2.5 million to 10 million per year in the country, and they need to be
trained.
In Bihar state, it is observed that drop out rate is very high in schools due to
which work participation rate is very high among the age group of 15-29 years. In
the age-group of 5-19 years, about 45 per cent were attending the school at primary
level, but due to higher dropout rate (i.e. 54.2 per cent) it reduces to 22 per cent at
middle level. High dropout rate and low infrastructure of formal vocational
training in the state compels a large proportion of persons in the age-group of 15-
29 to join the work force without any skill training. In the year 2004-05, only 0.3
per cent was receiving formal vocational training, 0.2 per cent reported to have
received formal vocational training and another 2.3 per cent reported to have
received non-formal vocational training. This means that more than 97 per cent of
the persons in this age-group had neither received nor receiving any vocational
training (whether formal or non-formal). One may argue that some of the persons
who are not engaged in vocational education and training they may be engaged in
higher technical skills viz. professional degrees in engineering, medicine and
agriculture etc or diploma/certificate in vocational education &training equal to
graduate level. But their number is less than those engaged in vocational education
and training (below graduate level). Conceding that a number of them may be
engaged in non-vocational pursuits, we may still hold that a large percentage still
needs to undergo some vocational training.
Recommended employment strategy of Eleventh Five Year Plan emphasizes
the need for high growth in the country. High growth is also expected to require
skilled manpower. Not only this, in the process of liberalization in our country,
youth without any vocational training can easily be exploited and involved in
destructive activities. Bihar is already suffering from naxalite activities which,
many analysts feel, partly owe to twin whammy of unemployment and poverty.
Keeping in view the high poverty and surplus labour in the state as discussed
above, the economy demand of persons to be trained as well as society requirement
of the persons who should be trained in vocational skills have been estimated.
However demand estimates for skilled personnel has been matched with the flow
of supply of persons being trained in different vocations by the institutes
(ITIs/ITCs) in Bihar. Gap between these two if any, has given surplus or shortage
of ITI/ITC trained persons in the state. After estimating the total number of persons
demanded by economy/society to be trained, trades have been identified which will
have more demand in the market. Vocational training and skill development cannot
tackle the problem of unemployment, unless the products these people are capable
of turning out satisfy the demand pattern of market. Thus different skill-sets/trades
have been identified by keeping in view the market demand pattern of the state.
1.4 Chapter Scheme
Besides this chapter the report consists of eight more chapters. Second chapter has
discussed about the procedure along with the computation steps for various
estimates of skilled persons in Bihar for the years 2005, 2010, 2015, 2020 and
2025. Next chapter is on ‗Skill Development and Training in India‘. It has
discussed about the existing vocational training system in the country, quantitative
and qualitative aspects of skill deficiencies and the strategy of Eleventh Five Year
Plan. Fourth chapter is about the resources of Bihar State. It has discussed about
the natural resources, human resources and infrastructural resources of the state.
Fifth chapter is about the status of vocational education and training in the state of
Bihar in comparison to that of India as whole and other major states. It is based on
the NSSO survey on ―Status of Education and Vocational Training in India‖
conducted in the year 2004-05. Next chapter has discussed about the demand of
vocational education and training in Bihar. There are many institutes/schools,
under the aegis of different departments, which impart the vocational training in
the state. Among all these institutes, Industrial Training Institutes/Industrial
Training Centers under the Ministry of Labor Resources have played the major
role in imparting the vocational training to the youths of the state. So the total
demand of ITI/ITC trained persons in the state in the years 2010, 2015, 2020 and
2025 has been estimated separately. Seventh chapter has discussed about the
requirement of vocational education and training in Bihar. The requirement has
also been estimated separately for (a) Industrial Training Institutes/Industrial
Training Centers under the Ministry of Labor and (b) other Departments in the
state. Chapter eighth has discussed about the new trades which have demand and
employment potential and should be included in the state. Last chapter of this
report gives the summary and conclusions of the report.
Chapter I
Introduction
1.1 Introduction
The prevailing employment strategy emphasizes the need for high growth as
a necessary condition for increase in employment. But high growth requires
adequate, qualified manpower with appropriate skills. Importance of skilled
manpower is further increased with the increasing pace of globalization which has
intensified the race of competitiveness among the producers world over to deliver
the goods at cheaper prices.
Recent data has shown that our education system and vocational training
programmes have not been able to provide the adequate size of skilled manpower.
As per the NSSO survey conducted in the year 2004-05, among the persons of age
15-29 years, only two per cent are reported to have received formal vocational
training and another 8 per cent, to have received non-formal vocational training
(NSSO, 2006). This indicates that very few young persons with formal vocational
training enter the workforce. This proportion of trained youth is one of the lowest
in the world (Govt. of India, Planning Commission, 2006).
It is not necessary that high growth with better skilled manpower would
always generate higher growth in employment. In India, during the recent past,
growth in organized sector, high as it was, has been jobless (Chaubey, P.K. 2005;
Arora and Saxena, 2003). So we may have to identify an appropriate combination
of sub-sectors from the unorganized sector where potential of employment growth
is higher than that of organized sector. It is important, therefore, that unorganized
sector gets the qualified manpower with appropriate skills. But most of the skills
this sector gets are traditional in nature viz. weaving, cutting, tailoring,
construction activities, and motor vehicle driving, etc, which are acquired through
non-formal training.
In India different types of institutions/schools running under different departments
which impart the formal vocational training are:
13. Industrial Training Institutes (ITIs)
14. Industrial Training Centres (ITCs)
15. Schools offering vocational courses (Secondary, Higher Secondary level)
16. Tailoring, embroidery and stitch craft institutes
17. Recognized motor driving schools
18. Institutes run by companies/corporations
They together had played a major role in providing training to the youths (NSSO,
2006).
Industrial Training Institutes have been set up by the respective State
Governments under Craftsman Training Progrramme of Government of India.
These Institutes aim at meeting twin objectives of creating skilled manpower to
enhance the employability of the youth and meet the industry demand for skill sets.
Students are imparted long term and short term vocational training in various
trades, presuming that it would enhance their employability, build their capabilities
for self-employment avenues and supply quality skill sets to the industry.
But in India, in most cases, the lack of demand orientation in vocational
training and skill development projects often resulted in unemployment, while at
the same time a large number of activities could not grow because of lack of
appropriate skilled manpower (Gupta, 2006). Keeping these facts in view, it is very
important to assess the demand for these skill sets for the future in different states.
For this a demand-oriented approach to vocational training needs to be adopted
giving due weight to general development activities in those states.
Bihar state is one of the most backward states in the matter of vocational
training. As compared to 2 per cent for the country as a whole only 0.2 per cent of
persons in 15-29 years age group have received the formal vocational training in
the state during the year 2004-05 (NSSO, 2006). However, now the state
government has realized the importance of vocational training and given high
priority in its Eleventh Five Year Plan (Govt. of Bihar, Planning Department,
2006).
At the request of Labour Department, Government of Bihar, IIPA has
conducted this study on ―Assessing the Demand for Skill Sets in
Domestic/National and Overseas Markets by the Year 2025 in Bihar State‖.
Following paragraphs state the objectives of the study, discuss methodology
adopted in the study and outline cauterization scheme.
1.2 Objectives
10. To estimate the industry-wise economy demand of persons with Vocational
Education and Training in Bihar by the years 2009-10, 2014-15, 2019-20
and 2024-25.
11. To estimate the demand of persons with Vocational Training from ITIs/ITCs
of Bihar by the years 2009-10, 2014-15, 2019-20 and 2024-25.
12. Identification of new trades (Skill-sets) having employment potential in
which training should be imparted/arranged by the different departments of
the state.
1.3 Methodology
Manpower demand is derived demand. Since most of the manpower demand
is likely to be locally generated in an area, for knowing the demand of a particular
manpower group in an area, it is important that the planner is knowing about the
resources of that area and the kinds of products that industries need to produce.
The resources of the area include natural resources, human resources and
infrastructure resources. It is also important to know about the amount of
investments, likely to be made in the sector in which that manpower group can get
the employment.
The challenge before India is to develop a vocational education and training
system that will enable employers to find the skilled labour inputs they need. At
the same time currently unskilled workers must also be empowered to develop
skills in a trade and become upwardly mobile participants in the economy (FICCI,
―Skill Development in India‖, 2009).
One may argue that demand for a given skill arises when a person is
interested in the skill and can afford to bear the cost of that skill. But if a person is
poor and illiterate who neither has the money to bear the cost of receiving the skill
nor he knows the benefit of the skill, then there would be no demand for that skill.
The situation in Bihar state is very much similar to that. As per the NSSO Survey
conducted in the year 2004-05, in rural areas of the state 52 per cent of the
population could spend only up to Rs. 410/- per month per person and in urban
areas 57 per cent of the population could spent less than Rs. 580/- per month per
person. In case of females in the age-group of 15-29 years, in rural areas, it was
intriguing to note, in that survey, that the predominant reason for not having
attended any educational institution was ‗education not considered necessary‘ in
the kind of occupation they are likely to be in.
Because of poverty there may not be any demand for vocational training by
the individuals but society demands to empower such unskilled workers to develop
skills and make them upwardly mobile participants in the society. This means that
in addition to the economy demand of vocationally trained persons we should also
have some estimates of ‗society demand‘ - which we have called the requirement
of vocationally trained persons.
Here our concern is in vocational training, not in high level skills provided
in professional colleges (viz. engineering colleges, medical colleges, agriculture
colleges, polytechnics and other professional colleges). Our concern of vocational
training here is to provide skills to make them employable whenever the
opportunity exists in the state or outside the state and earn income which can meet
the basic needs of their families. A large number of the unskilled laborers who are
going every year from Bihar to other developed states should go with skills so that
they can have a better bargaining power.
Realizing this, the Eleventh Five Year Plan of India has set up a Skill
Development Mission (SDM) consisting of an agglomeration of programmes and
appropriate structures aimed at enhancing training opportunities four-fold. New
entrants to the labour force in the non-agricultural sector should increase from the
existing 2.5 million to 10 million per year in the country, and they need to be
trained.
In Bihar state, it is observed that drop out rate is very high in schools due to
which work participation rate is very high among the age group of 15-29 years. In
the age-group of 5-19 years, about 45 per cent were attending the school at primary
level, but due to higher dropout rate (i.e. 54.2 per cent) it reduces to 22 per cent at
middle level. High dropout rate and low infrastructure of formal vocational
training in the state compels a large proportion of persons in the age-group of 15-
29 to join the work force without any skill training. In the year 2004-05, only 0.3
per cent was receiving formal vocational training, 0.2 per cent reported to have
received formal vocational training and another 2.3 per cent reported to have
received non-formal vocational training. This means that more than 97 per cent of
the persons in this age-group had neither received nor receiving any vocational
training (whether formal or non-formal). One may argue that some of the persons
who are not engaged in vocational education and training they may be engaged in
higher technical skills viz. professional degrees in engineering, medicine and
agriculture etc or diploma/certificate in vocational education &training equal to
graduate level. But their number is less than those engaged in vocational education
and training (below graduate level). Conceding that a number of them may be
engaged in non-vocational pursuits, we may still hold that a large percentage still
needs to undergo some vocational training.
Recommended employment strategy of Eleventh Five Year Plan emphasizes
the need for high growth in the country. High growth is also expected to require
skilled manpower. Not only this, in the process of liberalization in our country,
youth without any vocational training can easily be exploited and involved in
destructive activities. Bihar is already suffering from naxalite activities which,
many analysts feel, partly owe to twin whammy of unemployment and poverty.
Keeping in view the high poverty and surplus labour in the state as discussed
above, the economy demand of persons to be trained as well as society requirement
of the persons who should be trained in vocational skills have been estimated.
However demand estimates for skilled personnel has been matched with the flow
of supply of persons being trained in different vocations by the institutes
(ITIs/ITCs) in Bihar. Gap between these two if any, has given surplus or shortage
of ITI/ITC trained persons in the state. After estimating the total number of persons
demanded by economy/society to be trained, trades have been identified which will
have more demand in the market. Vocational training and skill development cannot
tackle the problem of unemployment, unless the products these people are capable
of turning out satisfy the demand pattern of market. Thus different skill-sets/trades
have been identified by keeping in view the market demand pattern of the state.
1.4 Chapter Scheme
Besides this chapter the report consists of eight more chapters. Second chapter has
discussed about the procedure along with the computation steps for various
estimates of skilled persons in Bihar for the years 2005, 2010, 2015, 2020 and
2025. Next chapter is on ‗Skill Development and Training in India‘. It has
discussed about the existing vocational training system in the country, quantitative
and qualitative aspects of skill deficiencies and the strategy of Eleventh Five Year
Plan. Fourth chapter is about the resources of Bihar State. It has discussed about
the natural resources, human resources and infrastructural resources of the state.
Fifth chapter is about the status of vocational education and training in the state of
Bihar in comparison to that of India as whole and other major states. It is based on
the NSSO survey on ―Status of Education and Vocational Training in India‖
conducted in the year 2004-05. Next chapter has discussed about the demand of
vocational education and training in Bihar. There are many institutes/schools,
under the aegis of different departments, which impart the vocational training in
the state. Among all these institutes, Industrial Training Institutes/Industrial
Training Centers under the Ministry of Labor Resources have played the major
role in imparting the vocational training to the youths of the state. So the total
demand of ITI/ITC trained persons in the state in the years 2010, 2015, 2020 and
2025 has been estimated separately. Seventh chapter has discussed about the
requirement of vocational education and training in Bihar. The requirement has
also been estimated separately for (a) Industrial Training Institutes/Industrial
Training Centers under the Ministry of Labor and (b) other Departments in the
state. Chapter eighth has discussed about the new trades which have demand and
employment potential and should be included in the state. Last chapter of this
report gives the summary and conclusions of the report.
Chapter III Skill Development and Training in India
3.1 Introduction Skill and knowledge are the driving forces of Economic Growth and Social
Development of any country. Skill building and training contributes significantly
for promoting the interests of individuals, enterprises, economy and society. Skill
building and training, a central pillar of decent work, is a means to empower
people, improve the quality and organization of work, enhance citizens‘
productivity, raise workers‘ incomes, promote job security and social equity and
help individuals become more employable in rapidly changing internal and
external labour markets. In fact they have become more important in the era of
globalization because countries with higher and better levels of skills adjust more
effectively to the challenges and opportunities of globalization (Government of
India, Planning Commission, 2008).
In the old economy, skill development was mainly considered as the
development of shop floor or manual skills. In the new economy the skill set can
range from professional, conceptual, managerial, and operational behavioral to
inter-personal skills and inter-domain skills. To deal with this level of complexity,
Government of India has given a very high priority to higher education in the
Eleventh Five Year Plan (Government of India, Planning Commission, 2008).
However, in this chapter we have discussed skill development in different trades at
the mass scale through ITIs, vocational schools and other institutions.
As discussed in the previous chapter, India‘s record in the area of skill
development has been very poor. One of the reasons for poor performance is the
total reliance upon a few training courses (i.e. just about 100 courses) of long
duration (i.e. 2 to 3 years) with no up gradation from time to time (Government of
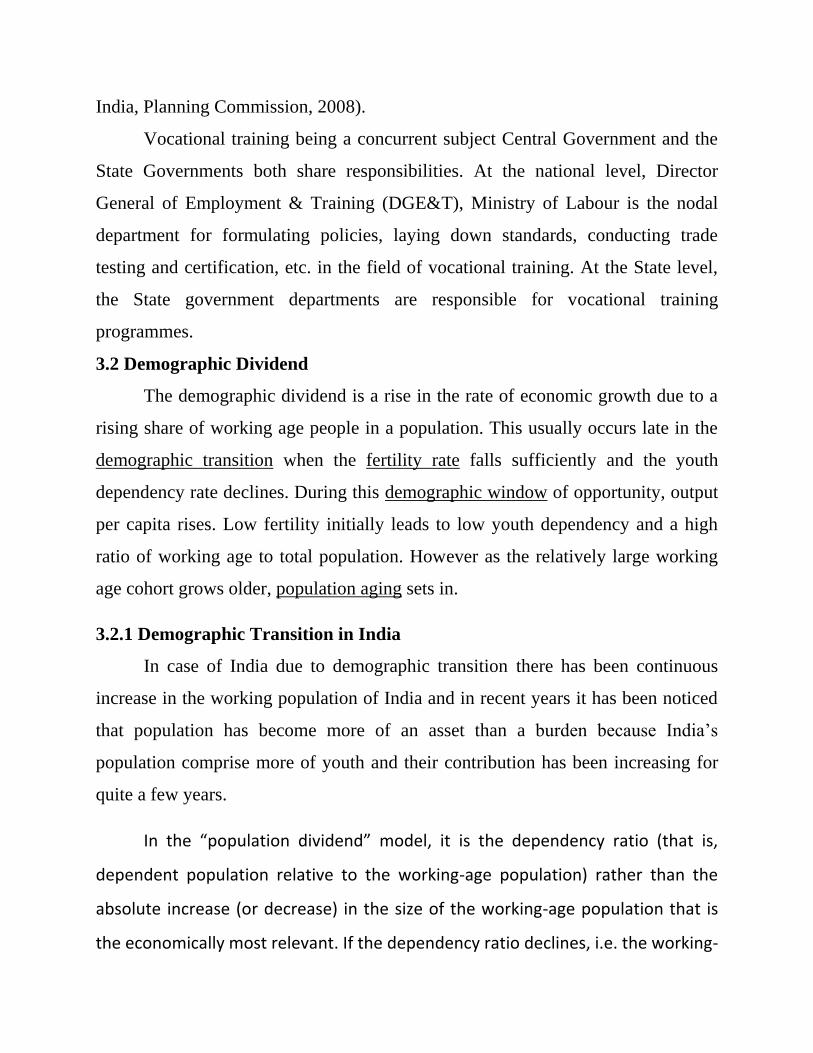
India, Planning Commission, 2008).
Vocational training being a concurrent subject Central Government and the
State Governments both share responsibilities. At the national level, Director
General of Employment & Training (DGE&T), Ministry of Labour is the nodal
department for formulating policies, laying down standards, conducting trade
testing and certification, etc. in the field of vocational training. At the State level,
the State government departments are responsible for vocational training
programmes.
3.2 Demographic Dividend
The demographic dividend is a rise in the rate of economic growth due to a
rising share of working age people in a population. This usually occurs late in the
demographic transition when the fertility rate falls sufficiently and the youth
dependency rate declines. During this demographic window of opportunity, output
per capita rises. Low fertility initially leads to low youth dependency and a high
ratio of working age to total population. However as the relatively large working
age cohort grows older, population aging sets in.
3.2.1 Demographic Transition in India
In case of India due to demographic transition there has been continuous
increase in the working population of India and in recent years it has been noticed
that population has become more of an asset than a burden because India‘s
population comprise more of youth and their contribution has been increasing for
quite a few years.
In the “population dividend” model, it is the dependency ratio (that is,
dependent population relative to the working-age population) rather than the
absolute increase (or decrease) in the size of the working-age population that is
the economically most relevant. If the dependency ratio declines, i.e. the working-
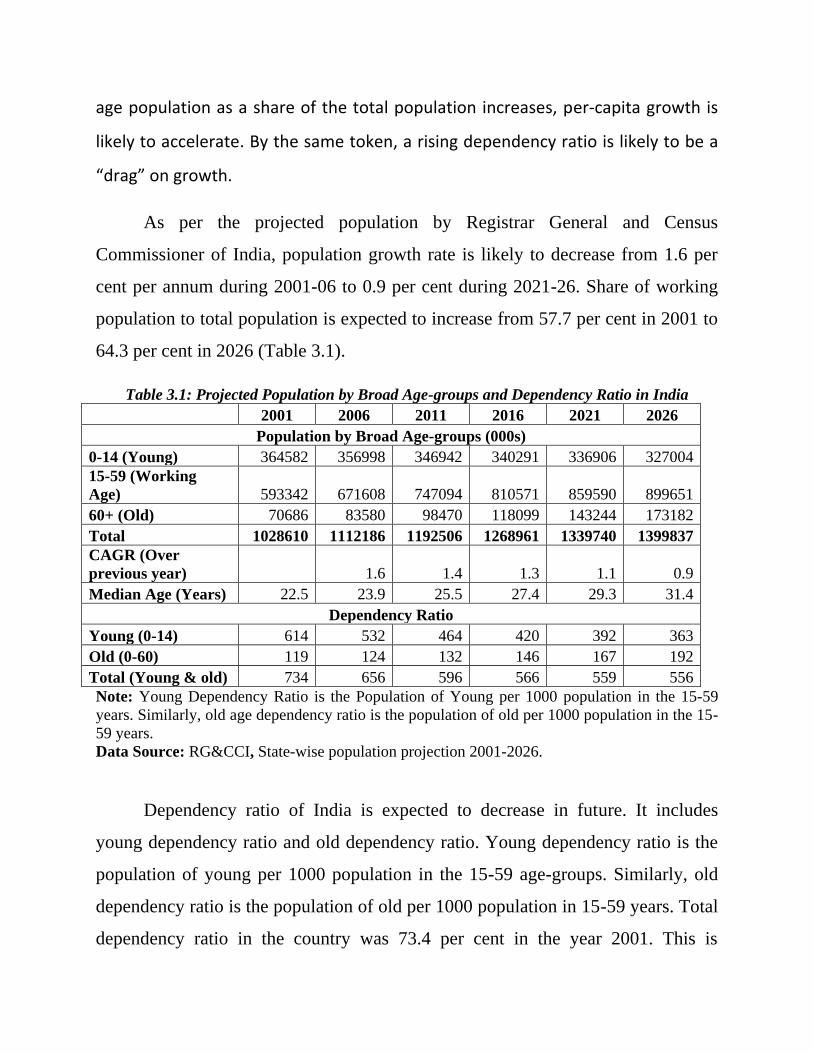
age population as a share of the total population increases, per-capita growth is
likely to accelerate. By the same token, a rising dependency ratio is likely to be a
“drag” on growth.
As per the projected population by Registrar General and Census
Commissioner of India, population growth rate is likely to decrease from 1.6 per
cent per annum during 2001-06 to 0.9 per cent during 2021-26. Share of working
population to total population is expected to increase from 57.7 per cent in 2001 to
64.3 per cent in 2026 (Table 3.1).
Table 3.1: Projected Population by Broad Age-groups and Dependency Ratio in India
2001 2006 2011 2016 2021 2026
Population by Broad Age-groups (000s)
0-14 (Young) 364582 356998 346942 340291 336906 327004
15-59 (Working
Age) 593342 671608 747094 810571 859590 899651
60+ (Old) 70686 83580 98470 118099 143244 173182
Total 1028610 1112186 1192506 1268961 1339740 1399837
CAGR (Over
previous year) 1.6 1.4 1.3 1.1 0.9
Median Age (Years) 22.5 23.9 25.5 27.4 29.3 31.4
Dependency Ratio
Young (0-14) 614 532 464 420 392 363
Old (0-60) 119 124 132 146 167 192
Total (Young & old) 734 656 596 566 559 556
Note: Young Dependency Ratio is the Population of Young per 1000 population in the 15-59
years. Similarly, old age dependency ratio is the population of old per 1000 population in the 15-
59 years.
Data Source: RG&CCI, State-wise population projection 2001-2026.
Dependency ratio of India is expected to decrease in future. It includes
young dependency ratio and old dependency ratio. Young dependency ratio is the
population of young per 1000 population in the 15-59 age-groups. Similarly, old
dependency ratio is the population of old per 1000 population in 15-59 years. Total
dependency ratio in the country was 73.4 per cent in the year 2001. This is
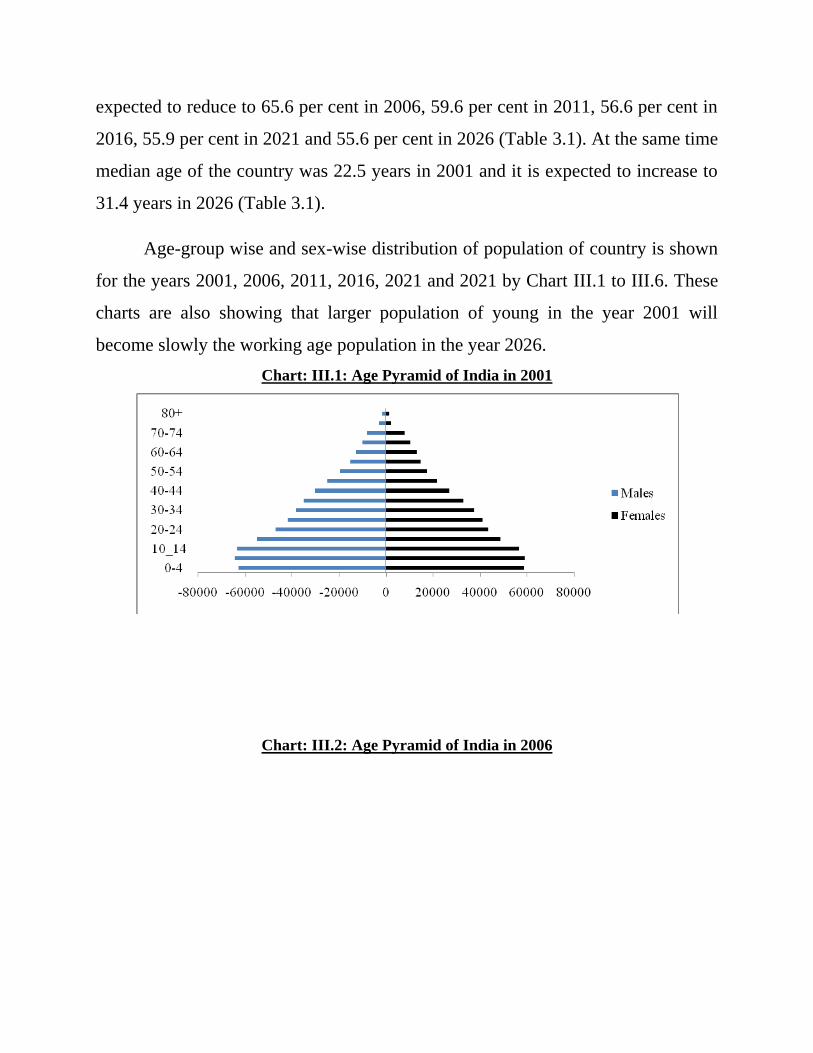
expected to reduce to 65.6 per cent in 2006, 59.6 per cent in 2011, 56.6 per cent in
2016, 55.9 per cent in 2021 and 55.6 per cent in 2026 (Table 3.1). At the same time
median age of the country was 22.5 years in 2001 and it is expected to increase to
31.4 years in 2026 (Table 3.1).
Age-group wise and sex-wise distribution of population of country is shown
for the years 2001, 2006, 2011, 2016, 2021 and 2021 by Chart III.1 to III.6. These
charts are also showing that larger population of young in the year 2001 will
become slowly the working age population in the year 2026.
Chart: III.1: Age Pyramid of India in 2001
Chart: III.2: Age Pyramid of India in 2006
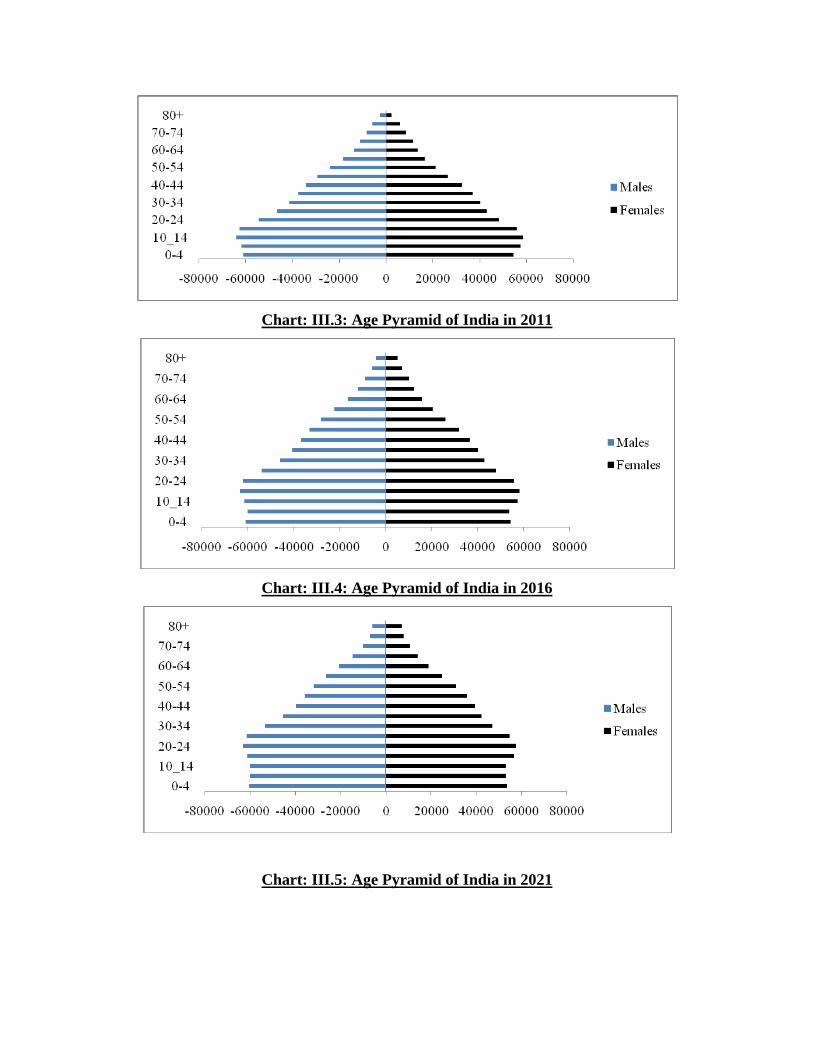
Chart: III.3: Age Pyramid of India in 2011
Chart: III.4: Age Pyramid of India in 2016
Chart: III.5: Age Pyramid of India in 2021
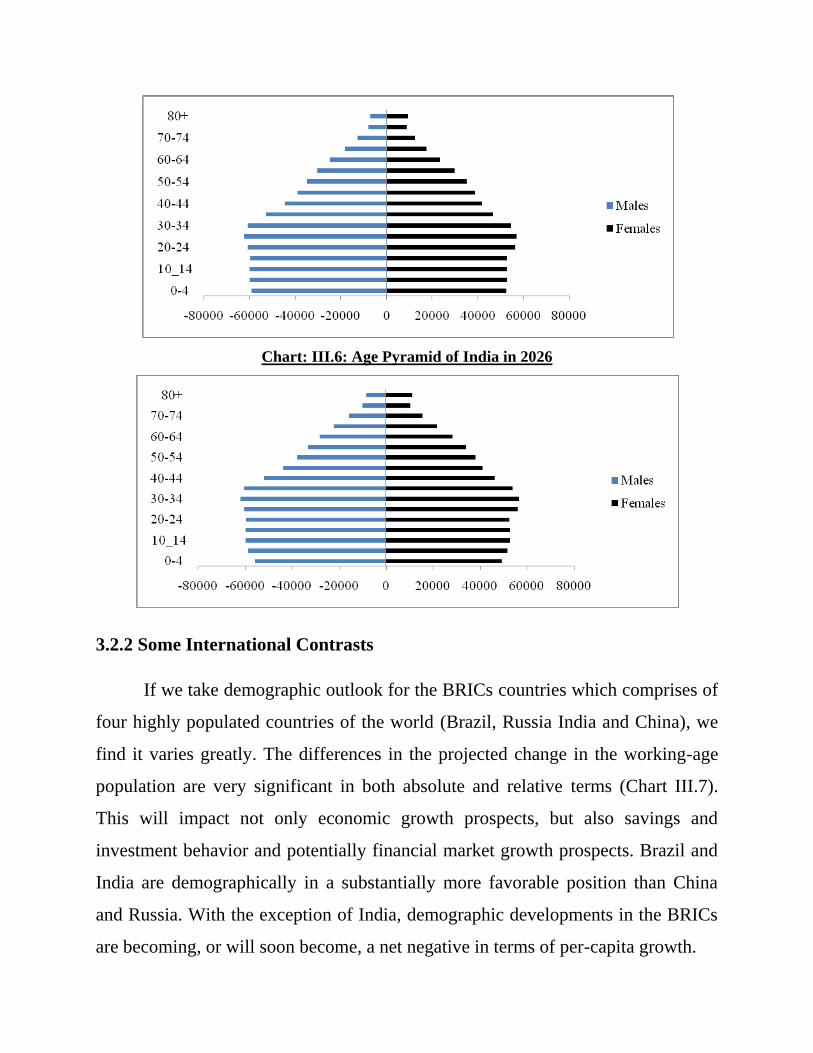
Chart: III.6: Age Pyramid of India in 2026
3.2.2 Some International Contrasts
If we take demographic outlook for the BRICs countries which comprises of
four highly populated countries of the world (Brazil, Russia India and China), we
find it varies greatly. The differences in the projected change in the working-age
population are very significant in both absolute and relative terms (Chart III.7).
This will impact not only economic growth prospects, but also savings and
investment behavior and potentially financial market growth prospects. Brazil and
India are demographically in a substantially more favorable position than China
and Russia. With the exception of India, demographic developments in the BRICs
are becoming, or will soon become, a net negative in terms of per-capita growth.
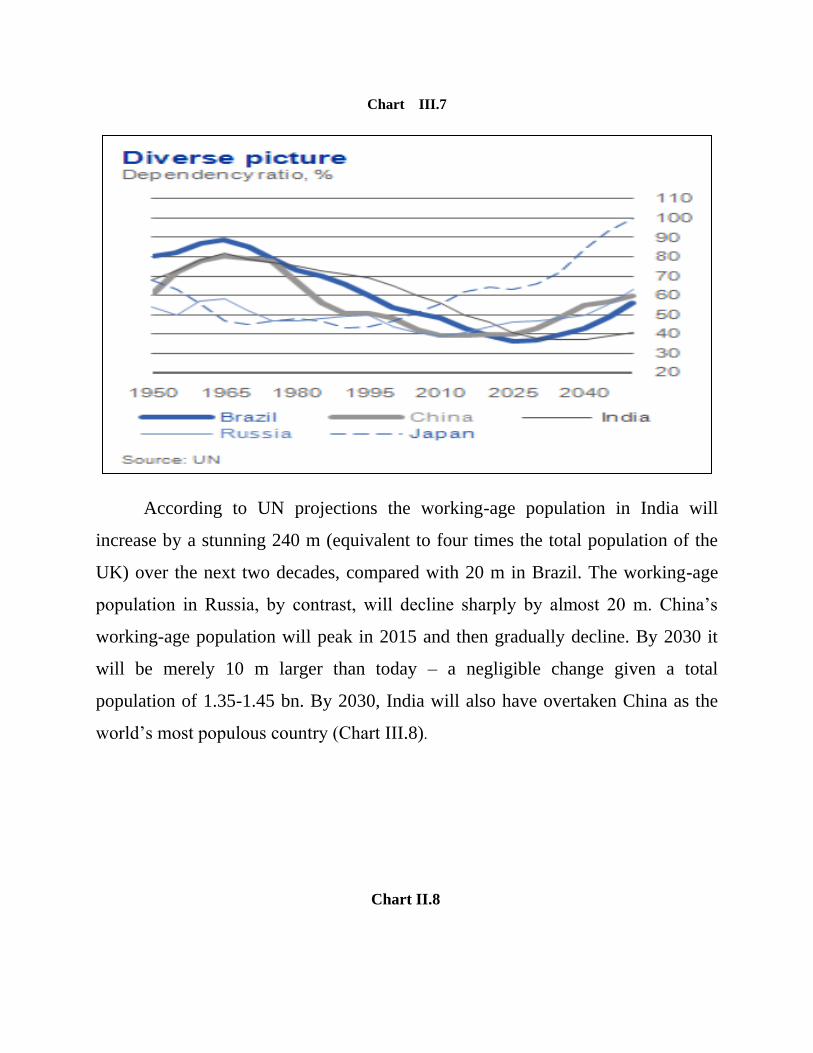
Chart III.7
According to UN projections the working-age population in India will
increase by a stunning 240 m (equivalent to four times the total population of the
UK) over the next two decades, compared with 20 m in Brazil. The working-age
population in Russia, by contrast, will decline sharply by almost 20 m. China‘s
working-age population will peak in 2015 and then gradually decline. By 2030 it
will be merely 10 m larger than today – a negligible change given a total
population of 1.35-1.45 bn. By 2030, India will also have overtaken China as the
world‘s most populous country (Chart III.8).
Chart II.8
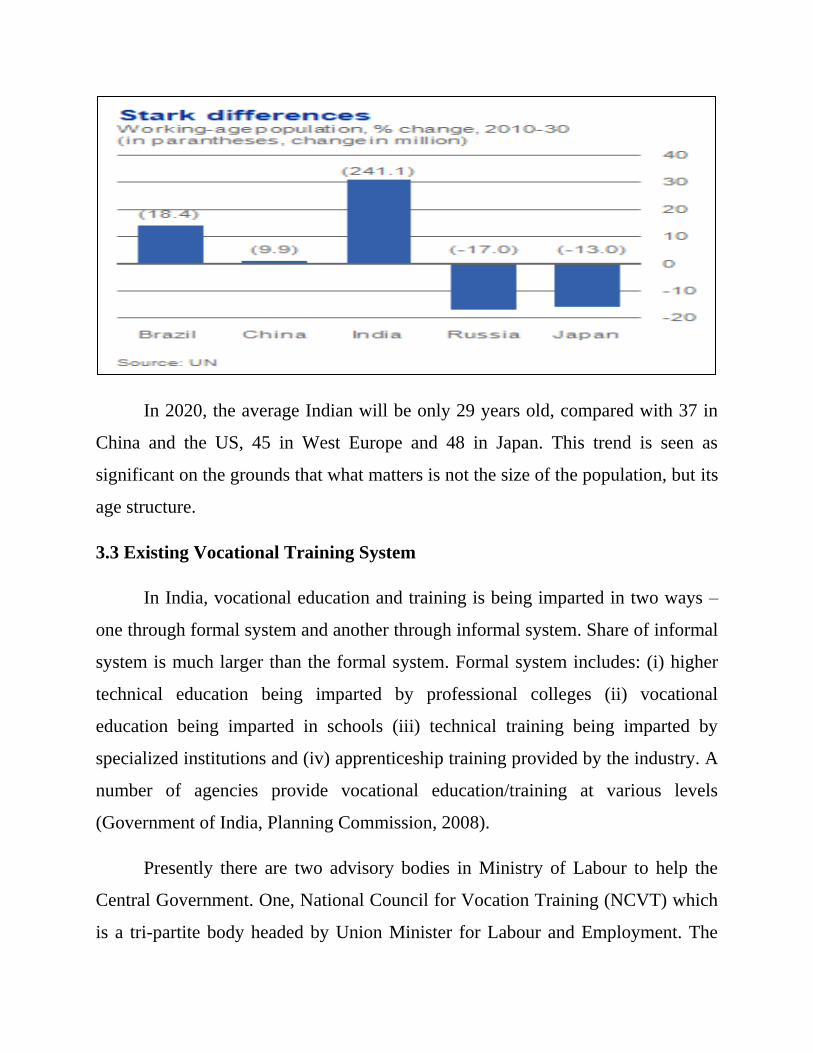
In 2020, the average Indian will be only 29 years old, compared with 37 in
China and the US, 45 in West Europe and 48 in Japan. This trend is seen as
significant on the grounds that what matters is not the size of the population, but its
age structure.
3.3 Existing Vocational Training System
In India, vocational education and training is being imparted in two ways –
one through formal system and another through informal system. Share of informal
system is much larger than the formal system. Formal system includes: (i) higher
technical education being imparted by professional colleges (ii) vocational
education being imparted in schools (iii) technical training being imparted by
specialized institutions and (iv) apprenticeship training provided by the industry. A
number of agencies provide vocational education/training at various levels
(Government of India, Planning Commission, 2008).
Presently there are two advisory bodies in Ministry of Labour to help the
Central Government. One, National Council for Vocation Training (NCVT) which
is a tri-partite body headed by Union Minister for Labour and Employment. The
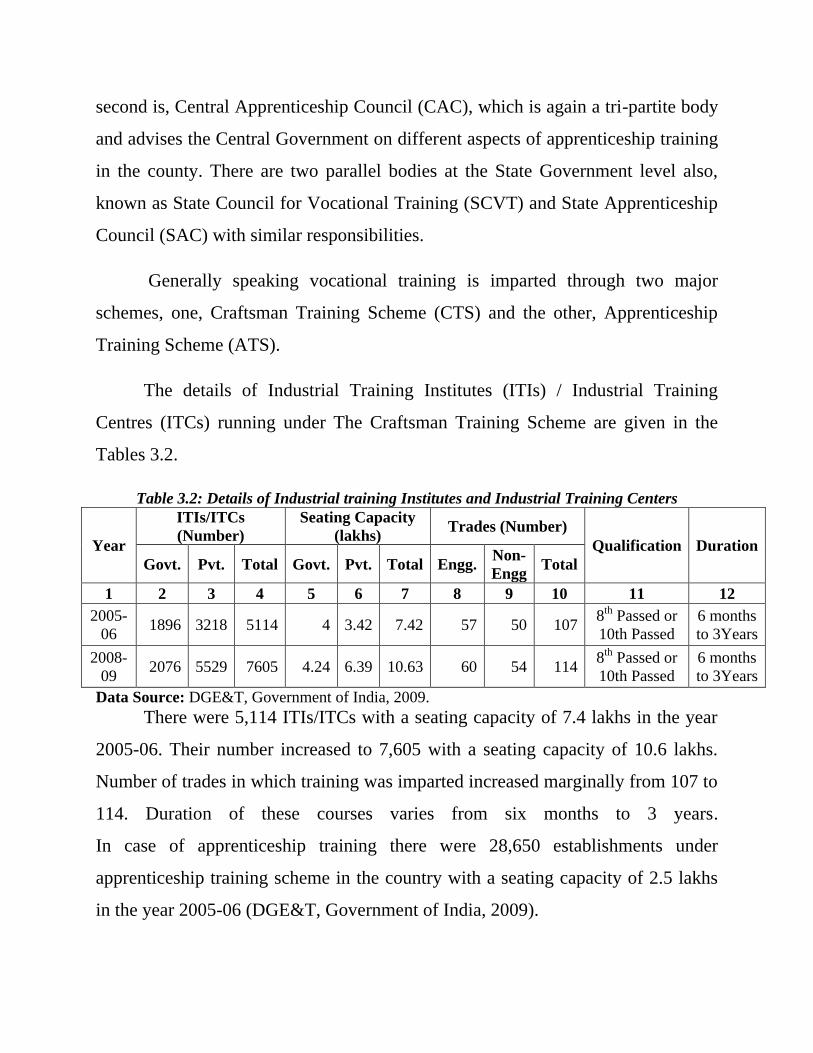
second is, Central Apprenticeship Council (CAC), which is again a tri-partite body
and advises the Central Government on different aspects of apprenticeship training
in the county. There are two parallel bodies at the State Government level also,
known as State Council for Vocational Training (SCVT) and State Apprenticeship
Council (SAC) with similar responsibilities.
Generally speaking vocational training is imparted through two major
schemes, one, Craftsman Training Scheme (CTS) and the other, Apprenticeship
Training Scheme (ATS).
The details of Industrial Training Institutes (ITIs) / Industrial Training
Centres (ITCs) running under The Craftsman Training Scheme are given in the
Tables 3.2.
Table 3.2: Details of Industrial training Institutes and Industrial Training Centers
Year
ITIs/ITCs
(Number)
Seating Capacity
(lakhs) Trades (Number)
Qualification Duration
Govt. Pvt. Total Govt. Pvt. Total Engg. Non-
Engg Total
1 2 3 4 5 6 7 8 9 10 11 12
2005-
06 1896 3218 5114 4 3.42 7.42 57 50 107
8th
Passed or
10th Passed
6 months
to 3Years
2008-
09 2076 5529 7605 4.24 6.39 10.63 60 54 114
8th
Passed or
10th Passed
6 months
to 3Years
Data Source: DGE&T, Government of India, 2009.
There were 5,114 ITIs/ITCs with a seating capacity of 7.4 lakhs in the year
2005-06. Their number increased to 7,605 with a seating capacity of 10.6 lakhs.
Number of trades in which training was imparted increased marginally from 107 to
114. Duration of these courses varies from six months to 3 years.
In case of apprenticeship training there were 28,650 establishments under
apprenticeship training scheme in the country with a seating capacity of 2.5 lakhs
in the year 2005-06 (DGE&T, Government of India, 2009).
There are also specialized Advanced Training Institutes (ATIs) which impart
training to trainers, upgrade skills of in-service industrial workers, train supervisors
and middle management level in the industry, train Training Managers and Principals
of ITIs , and National and Regional Vocational Training Institutes for Women which
offer basic, advanced and instructor training courses for women. Both these institutes
are under DGE&T.
Existing 500 ITIs are being upgraded into Centers of Excellence (CoE) with the
World Bank assistance. In each of these ITIs, a Broad Based Basic Training course
would be provided to the trainees and then multi skilling courses would be offered in
the trades of their choice so that they are better employable. An Institute Management
Committee (IMC) is being constituted in each of the ITIs, which is to be headed by a
prominent industrialist of the area and all industrial guilds are supposed to be
represented in the IMC.
In order to offer employment opportunities to physically challenged persons, 20
Vocational Rehabilitation Centers (VRCs) are also being run in 19 States of the
country. Similarly, Coaching-cum-Guidance Centers (CGCs) for providing larger
employment opportunities to members of SCs and STs are run in 22 States of the
country. There is also one specialized institute, National Instructional Media Institute
(NIMI) for development of course curricula and instructional media packages in
different languages for the benefit of ITI trainees and instructors (DGE&T,
Government of India, 2009).
In addition to above, there are 16 other Ministries and Departments of
Government of India like Health and Family Welfare, Human Resource Development,
Information Technology, Small Scale Industries, Tourism, Urban Development,
Urban Employment and Poverty Alleviation, Agro Rural Industries, Agriculture,
Textiles, Heavy Industry and Public Enterprises, Food Processing Industries, Rural
Development, Tribal Affairs and Women and Child Development, which impart
vocational training. All these Ministries and Departments taken together train about
1.5 million persons every year (Gupta, S.P., 2006).
The critical appraisal of the present state of affairs would however indicate that
our base of skilled and particularly knowledge workers is rather narrow. One way of
looking at this problem is to make a general assessment as to how vocational
education and training (VET) has failed to make an impact in this country. In order to
make the existing vocational education system more efficient and effective more
initiatives will have to be taken by the Government.
There is also need for strengthening the certification system in vocational
training. Though Directorate General of Employment & Training has been
conducting trade tests and awarding National Trade Certificates and National
Apprenticeship Certificates which make these certificate holders employable within
the country and abroad, the set up is becoming unequal to the task in future as against
certification of one million at present, it will require to certify about 10 million
persons every year for which the infrastructure is awfully inadequate. It will,
therefore, be worthwhile to consider setting up a National Trade Testing, Certification
and Accreditation Authority to take care of the growing numbers for certification.
(DGE&T, Government of India, 2009).
At present, vocational education and training is regulated by both the All India
Council of Technical Education (AICTE) and the National Council for Vocational
Training. This has led to an element of duplication. The Task Force on skill
development and vocational education set up by Planning Commission,
Government of India has recommended that the NCVT should be the sole
regulatory authority for vocational training and that the AICTE‘s role should be
confined to institutions of higher learning that fall within its sphere, and
polytechnics.
3.4 Dimensions of the Need for Vocational Training
The mismatch between the quality of labour demanded and its availability
needs to be analyzed and quantified. This will ultimately require reorientation of
India‘s educational system, particularly existing vocational education and training
programmes, as well as enhancing their capabilities. It has been observed that
vocational training and skill development can be imparted better among persons
with basic education rather than to illiterates. Therefore the present drive for
literacy and basic education should continue along with more vocational education
and training programmes. As it had been stipulated in the Tenth Five Year Plan
that India will grow at 8 percent per annum and will rank as a developed country
by the year 2020 so, the capacity of the appropriate formal vocational education
training programmes needs to be expanded significantly.
Unemployment on the Daily Status basis in 1999-2000 was as high as 26.5
million (i.e. 7.4 percent of the total labour force), 10.8 million of whom were
educated (i.e. 41 percent of the unemployed). Compared to this large, unemployed
number of persons, the existing available training and skill development facilities
in formal training and institutions and agencies throughout India exist for around
one and a half million (Gupta, S.P., 2006).
Further, of the 104 to 114 million educated and employed workers, nearly 50 to 55
percent are self employed. Hence, special vocational training and entrepreneurship
development for the self employed need to be developed. Indeed, educated youth
are the primary source of future potential entrepreneurs. As to semi educated youth
(up to primary class), there have also been large number of unemployed or under –
employed and they need a different type of education and vocational training.
There is a vast area where formal and informal training is required particularly
where workforce engaged in low productivity and low earning jobs. The earnings
of this group in most cases are well below the norm for the decent living so to
discover new opportunities in these sectors suitable programs for vocational
training and skill development will be needed, some on part time basis so that the
enhanced training program will not cause disruption in their running sources of
earning. Here, again a different nature of skill development programme is required.
All this statistics gives a sense of the magnitude of need for large scale vocational
education and training programmes (Gupta .S.P., 2006).
3.7 Prioritization of Skill Building and Vocational Training
There is an urgent need to identify the priority areas in selected sections of
the labour force to render appropriate training and skill. The first priority should be
given to the new entrants (from class VIII, IX, X and XI) in the labour force. All
these entrants need gainful employment. The second priority group is the
incremental educated youth. With a high unemployment rate i.e. 12.1 among the
educated youth against the national average of 7.3 percent as per CDS in the year
1999-2000. In this group unemployment rate of female was as high as 22.5
percent. Third priority group should be all the other youth who are in the labour
force, whether illiterate or semi literate. The fourth priority should largely
comprise of underemployed working people.
Another aspect that should be covered under prioritization of skill
development is that vocational training should be given on recent trades. That
means the trades which are in demand or the skill which the market requires has
got the capacity to absorb those skill sets. Plumbing, air conditioning and
refrigeration, secretarial practice, beauty culture, auto fitter, mobile repairing etc.
are recent trades and there should be training in these skill sets.
3.8 The quantitative aspect of the Skill Shortages
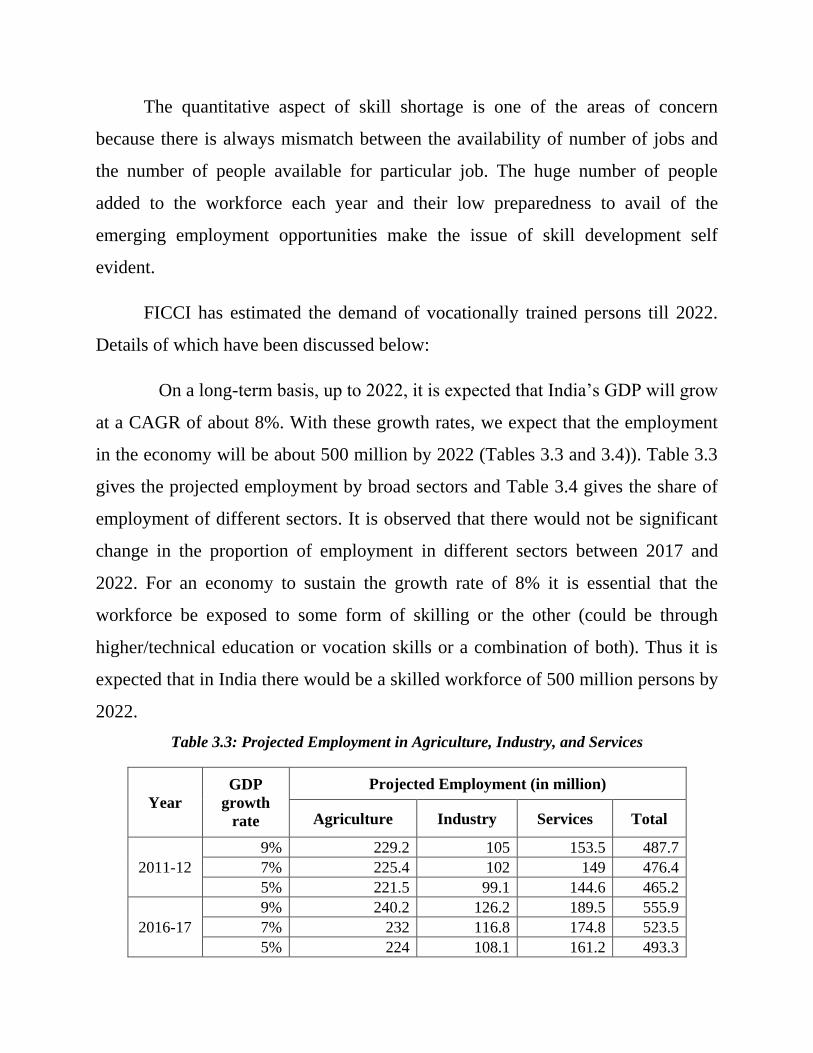
The quantitative aspect of skill shortage is one of the areas of concern
because there is always mismatch between the availability of number of jobs and
the number of people available for particular job. The huge number of people
added to the workforce each year and their low preparedness to avail of the
emerging employment opportunities make the issue of skill development self
evident.
FICCI has estimated the demand of vocationally trained persons till 2022.
Details of which have been discussed below:
On a long-term basis, up to 2022, it is expected that India‘s GDP will grow
at a CAGR of about 8%. With these growth rates, we expect that the employment
in the economy will be about 500 million by 2022 (Tables 3.3 and 3.4)). Table 3.3
gives the projected employment by broad sectors and Table 3.4 gives the share of
employment of different sectors. It is observed that there would not be significant
change in the proportion of employment in different sectors between 2017 and
2022. For an economy to sustain the growth rate of 8% it is essential that the
workforce be exposed to some form of skilling or the other (could be through
higher/technical education or vocation skills or a combination of both). Thus it is
expected that in India there would be a skilled workforce of 500 million persons by
2022.
Table 3.3: Projected Employment in Agriculture, Industry, and Services
Year
GDP
growth
rate
Projected Employment (in million)
Agriculture Industry Services Total
2011-12
9% 229.2 105 153.5 487.7
7% 225.4 102 149 476.4
5% 221.5 99.1 144.6 465.2
2016-17
9% 240.2 126.2 189.5 555.9
7% 232 116.8 174.8 523.5
5% 224 108.1 161.2 493.3
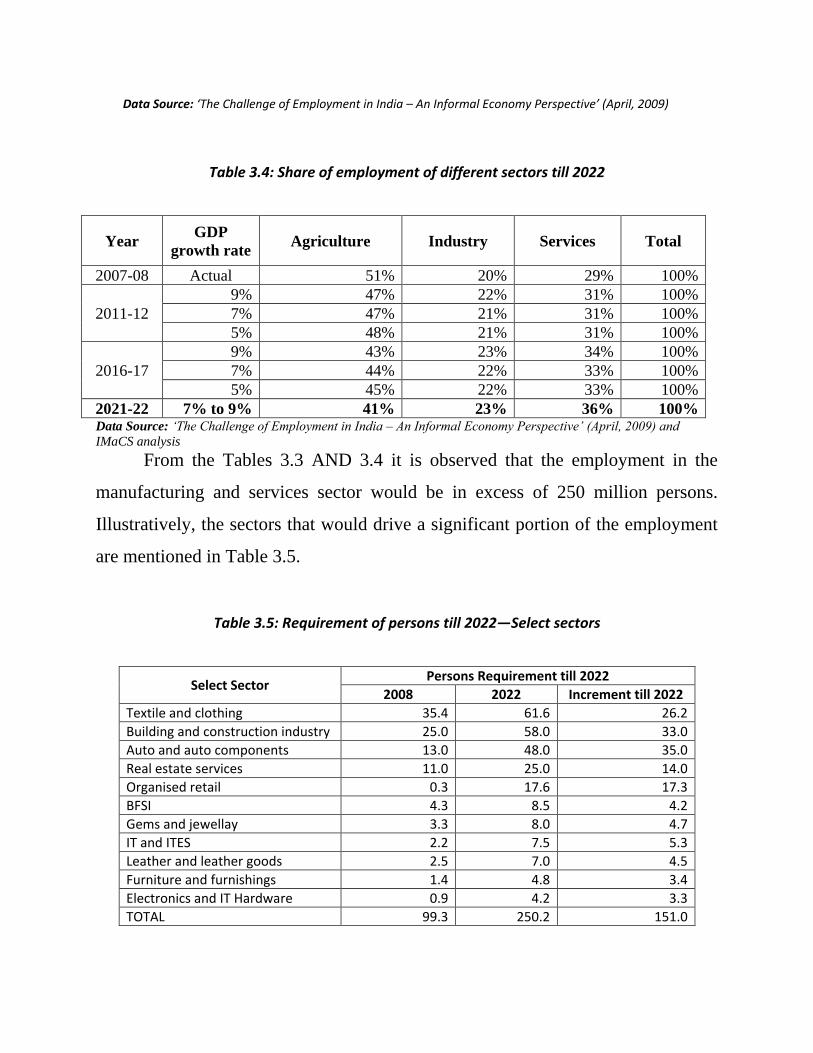
Data Source: ‘The Challenge of Employment in India – An Informal Economy Perspective’ (April, 2009)
Table 3.4: Share of employment of different sectors till 2022
Year GDP
growth rate Agriculture Industry Services Total
2007-08 Actual 51% 20% 29% 100%
2011-12
9% 47% 22% 31% 100%
7% 47% 21% 31% 100%
5% 48% 21% 31% 100%
2016-17
9% 43% 23% 34% 100%
7% 44% 22% 33% 100%
5% 45% 22% 33% 100%
2021-22 7% to 9% 41% 23% 36% 100% Data Source: „The Challenge of Employment in India – An Informal Economy Perspective‟ (April, 2009) and
IMaCS analysis
From the Tables 3.3 AND 3.4 it is observed that the employment in the
manufacturing and services sector would be in excess of 250 million persons.
Illustratively, the sectors that would drive a significant portion of the employment
are mentioned in Table 3.5.
Table 3.5: Requirement of persons till 2022—Select sectors
Select Sector Persons Requirement till 2022
2008 2022 Increment till 2022
Textile and clothing 35.4 61.6 26.2
Building and construction industry 25.0 58.0 33.0
Auto and auto components 13.0 48.0 35.0
Real estate services 11.0 25.0 14.0
Organised retail 0.3 17.6 17.3
BFSI 4.3 8.5 4.2
Gems and jewellay 3.3 8.0 4.7
IT and ITES 2.2 7.5 5.3
Leather and leather goods 2.5 7.0 4.5
Furniture and furnishings 1.4 4.8 3.4
Electronics and IT Hardware 0.9 4.2 3.3
TOTAL 99.3 250.2 151.0
As is obvious, the above sectors would, amongst themselves, have a
demand of about 150 million of the 250 million that is required in the
manufacturing and services sectors. While observing the demographic patterns
that are expected to emerge, about 860 million persons would be in the age
group of 15 to 59 by 2022 (as compared to about 725 million currently).In other
words about 12 million persons are expected to join the workforce every year.
Thus with about 12 million persons expected to join the workforce every
year, and an existing skill development capacity of about 3.4 million, it is thus
required to enhance the skilling and technical education capacity to about 15
million (considering that even sections of the existing workforce would have to be
trained). It is expected that this 15 million would be the required skill
development capacity in vocational training in itself as a large portion of the
employment (as well as workforce input) would occur in the lower portions of the
skill pyramid.
3.7 The Qualitative aspect of Deficiencies
For quite some time now concern has been expressed about the mismatch
between the job market‘s requirements on the one hand and the inputs provided by
our education system in general on the other hand. This has become one of the
major areas of concern and our Prime Minister has also emphasized it. The quality
of technical education which is given in our country is not up to mark and it is not
fulfilling the market requirement. This is an area where the Prime Minister has
welcomed Chambers of Commerce and Industry (CII) to join hands with the
Government and create a public-private partnership model for designing and
implementing the scheme.
In vocational education training there are too much structural deficiencies.
The kind of courses which are provided through ITIs /ITCs are very traditional and
they are not absorbing the market demand. This is one of the reasons for the poor
performance of the vocational education training in India. It has also been observed
that the quality of vocational education training which is being provided is very
poor. There are not enough teachers available for the courses offered. The seating
capacity is also very less. There are not any arrangements of new courses. There is
not any proper placement cell. It has also been observed that there is a different fee
structure in different states. The general feeling is that the fee charged from the
trainees is much less than the cost of actual training but it is not so. Moreover
whatever fee is charged from the candidates, it goes to the Consolidated Fund of
the State and in the allocation of resources for vocational training, generally a very
low priority is accorded by the State Government as a result of which almost 90%
of resources go towards payment of salaries and only 10% are spent on the actual
training. The result is that the quality of training is not up to the mark. The effort,
therefore, should be made to increase the sources of revenue and try to plough
them back for improving the quality of training and meeting the requirement of
raw material for training purposes as well as up gradation of tools, equipments,
machinery and technology. Greater priority is accorded to create new institutions
by the State Governments, as compared to the upkeep of the existing institutions
which is not a good practice.
Training is a critical input for up-scaling the informal sector activities. This
is highlighted in various workshops. Issues such as extending training to workers
who are not necessarily educated and who are scattered over wide geographic
locales, without easy access to stipulated centres of training and not necessarily
able to pay for it, are required to be addressed.
It is difficult to address the issue of training in the conventional training
framework, given the broad band of activities in the informal economy. Most
studies suggest that there is very little training available for informal sector
activities, and whatever is available, is not necessarily relevant or effective. Some
characteristics of a successful approach to training have been identified. These
include: (1) the design of effective training programmes requires knowledge of
labour markets ; (2) the whole training approach should be demand-driven and job-
linked, so as to minimize skill mis-match ; (3) multi-skilling should be a part of
the training process ; (4) effort should be made to ensure that training is skill
oriented and cuts across occupational specificity ; (5) training, as a matter of
principle, should be of relatively short duration, if possible, it should be field based
and cost effective and there should be stakeholder participation in the design of
training schemes ; and (6) training for the informal sector work should not be
linked to degrees or diplomas ; the aim should be to identify effective users of
skills.
It has been argued by a number of economists, that India should use its
service sector more than its manufacturing sector to solve its unemployment
problem. At the same time our education system and society follow the lowest
common denominator in assigning young people to the service sector, a problem
which may continue for a couple of decades. Our focus therefore should be on the
manufacturing sector as well, as it is the basic engine of growth for the nation.
In order to enhance the training capacity, the State Governments should
persuade the ITIs and ITCs to run 2-3 shifts, wherever it is feasible. In fact, the
Apprenticeship Training System also needs expansion as well as modification because
in a country like India where there is a huge requirement of skilled workforce, there is
a need to increase the number of participating enterprises in the services sector and in
the un-organised sector as majority of the job opportunities are available in these
sectors.
3.9 Efficiency and Organization of ITIs
The Industrial Training form the backbone of the vocational training
structure in the states, yet the government institutes generally suffer from the
sluggishness and inadequacies in management and financial support processes. A
recent study by the ILO (International Labour Organization) shows that there are
problems of internal as well as external efficiencies with the ITI setup. The study
also shows that there is wide variation in the coverage, both in terms of area and
the trades. Regarding the private institutes (i.e. ITCs) the study says that, generally
the instructors are often not paid adequately, resulting in poor standard of training
offered.
One trend that has been noticed is the long term regular training programmes
is not a good trend. In case of women, their low enrolment and graduation is due to
sociological reason and because of non availability of hostels, proper transport
arrangements and security issues. Another trend which has been noticed is that
majority of unorganized sector establishments are in urban areas and serve mainly
urban needs, while the educated youth in the rural areas are without access to
adequate training opportunities. The original purpose of setting up these
institutions was to strengthen the urban industrialization process, not as skill
development agencies for the rural poor.
There is a need for decentralized decision making at the district levels and
for the coordination of training needs and ensuring commensurate response from
these institutions. The most important aspect which needs more attention is that
training facilities should be coupled by placement cells. It is necessary to give
them inherent strength and flexibility to meet the changing demands of the market
(Gupta, S.P., 2006).
It is necessary to develop a national portal which can keep the details of each
and every trainee passing from any ITI / ITC with his name, address, educational
qualification, technical qualification, telephone number, mobile number, etc. so
that any industry wanting to recruit persons with certain skills may access this
portal and select the best amongst them for his purpose. This data base will have to
be developed at the ITI level and then networked with the national portal so that
the information is updated regularly. The Directorate General of Employment &
Training has started the exercise but it needs to be done expeditiously so that it can
serve the growing needs of the industry and the skilled youth. In order to attract a
larger number of youth to the vocational training, it may be worthwhile to consider
change the name of ITIs / ITCs to ―Skill Development College‖ and carry out
massive publicity campaign to change the mind set of parents and young persons
and make them realize that going to a Skill Development College provides much
better career prospects than going to a general education stream.
3.9 Eleventh Five Year Plan Strategies
The eleventh five year plan is mainly emphasizing on creating a pool of
skilled personnel in appropriate numbers and skills in line with the requirements of
ultimate users such as industry, trade and services sector. In this way it will lead to
expansion of employment including shift of surplus labour from agriculture to non-
agriculture sector. So it was proposed to launch a major ―skill development
mission" during the Eleventh Five Year Plan with an outlay of Rs. 22800 crore
(Government of India, Planning Commission, 2008).
While imparting the training, emphasis would be given to twenty high
growth employment sectors identified by the Confederation of Indian Industries
(CII) and Federation of Indian Chambers of Commerce (FICCI). Details of these
growth sectors has been discussed in Chapter VIII on ―Identification of Trades for
Training‖. It is also proposed to increase the training facilities for the new entrants
to labour force from the existing 2.5 million per year to 10 million per year in non-
agriculture sectors.
3.9.1 Skill Development Mission (SDM)
I) Mission Goal
Government has launched a skill development mission in order to create a
pool of skilled personnel in a period of 5 to 8 years to meet the increasing demand
of the skilled workforce in domestic economy. The mission would also create a
surplus of skilled persons to meet the requirement of other aging economies in the
world.
The mission would ensure that our supply side responses are moving in the
same way as our demand. These responses should move in the same way as
demand not only in the present but the future also. For this the mission will involve
both public and private sectors in such a way that it is beneficial to both.
II) Mission objectives and functions:
Main objectives and functions of the mission are:
f) To identify skill deficits sector-wise as well as region-wise and then
meet their demand through planned action in a given time period.
g) To reposition and change the existing ITIs, polytechnics and VET in
school in a Public Private Partnership mode. Private Institutions
should be given functional as well as governance autonomy.
h) To establish a 'credible accreditation system and a ‗guidance
framework ' for all accrediting Agencies, set up by various ministries
and or by industry associations.
i) To establish a National skill inventory and another National database
for skill deficiency mapping on a national web portal for exchange of
information between employers and employment seekers.
j) To enlarge the 50000 Skill Development centers (SDCs) programme
eventually into a 'virtual skill development resource network ' for
web-based learning.
Apart from all these objectives and functions there should be an
establishment of trainee placement and tracking system for effective evaluation
and enable employment exchanges to function as career counseling centers.
III) Mission Strategies
Main strategies of the Mission are:
f) To encourage Ministries to expand existing public sector skill development
Infrastructure and its utilization by a factor of five which will increase the
vocational education training capacity from 3.1 million to 15 million so that it
could meet the growth of the annual workforce which is of the order 12.8
million. This infrastructure should be shifted to private management in period
of next 2 to 3 years. States should be guided to act as a facilitator to manage
this transition.
g) To make a distinction between structural, interventional and last mile un-
employability and correspondingly set up programmes for 24 months, 12
months and 6 months duration. Encourage ‗Finishing schools‘ to take care of
last mile un-employability.
h) To encourage accreditations agencies in different areas to move away from
regulation to performance measurement and rating and ranking of institutions.
i) To establish a National Qualification Framework, which establishes
equivalence and provides for horizontal mobility between VET, technical and
academic streams.
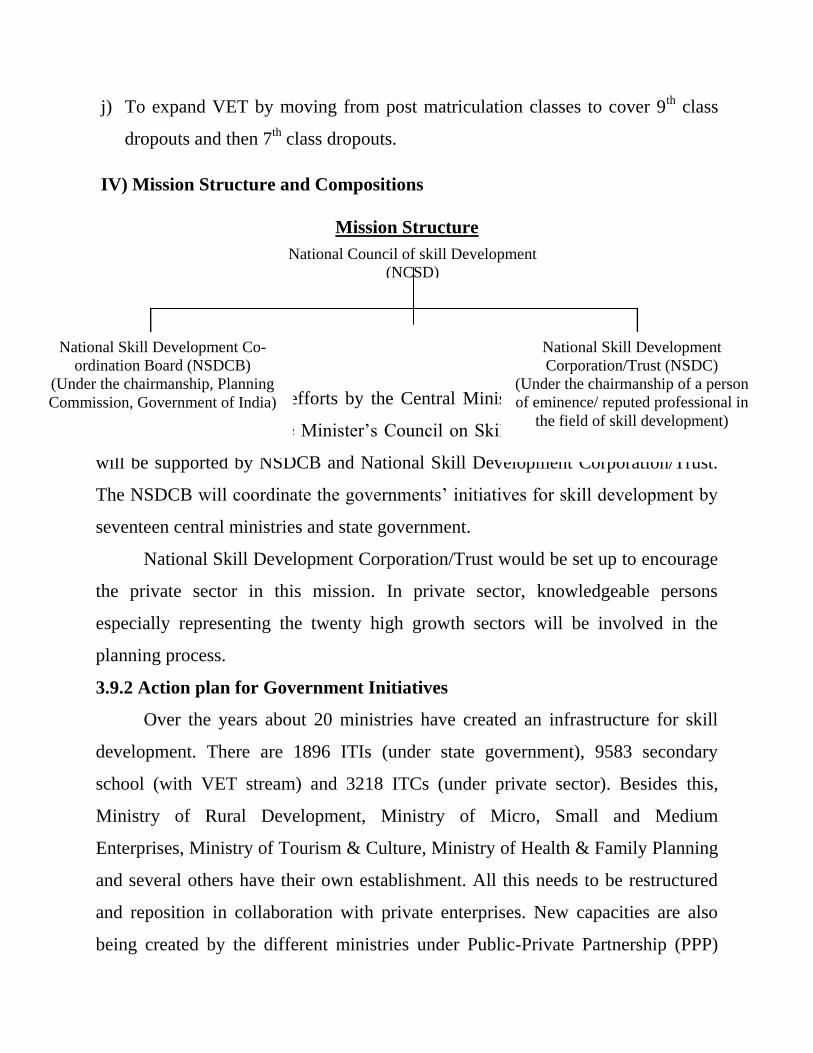
j) To expand VET by moving from post matriculation classes to cover 9th
class
dropouts and then 7th class dropouts.
IV) Mission Structure and Compositions
Mission Structure
Skill development efforts by the Central Ministries will be reviewed from
time to time by the Prime Minister‘s Council on Skill Development. The council
will be supported by NSDCB and National Skill Development Corporation/Trust.
The NSDCB will coordinate the governments‘ initiatives for skill development by
seventeen central ministries and state government.
National Skill Development Corporation/Trust would be set up to encourage
the private sector in this mission. In private sector, knowledgeable persons
especially representing the twenty high growth sectors will be involved in the
planning process.
3.9.2 Action plan for Government Initiatives
Over the years about 20 ministries have created an infrastructure for skill
development. There are 1896 ITIs (under state government), 9583 secondary
school (with VET stream) and 3218 ITCs (under private sector). Besides this,
Ministry of Rural Development, Ministry of Micro, Small and Medium
Enterprises, Ministry of Tourism & Culture, Ministry of Health & Family Planning
and several others have their own establishment. All this needs to be restructured
and reposition in collaboration with private enterprises. New capacities are also
being created by the different ministries under Public-Private Partnership (PPP)
National Council of skill Development
(NCSD)
(Under the chairmanship of Prime Minister)
National Skill Development Co-
ordination Board (NSDCB)
(Under the chairmanship, Planning
Commission, Government of India)
National Skill Development
Corporation/Trust (NSDC)
(Under the chairmanship of a person
of eminence/ reputed professional in
the field of skill development)
mode.
I) ITI’s by the Ministry of Labour and Employment
Complete Up gradation of 500 ITI‘s by investing Rs. 2.0-3.5 crore in each
into institutions of excellence and up gradation of remaining 1396 ITI‘s in PPP
mode by providing interest for loan up to Rs. 2.5 crore each. It is also proposed to
set up 1000 new ITI‘s in underserved regions in PPP mode.
Beside this it is also proposed to set up 500 new ITIs in industrial
clusters/special Economic zone on a demand led basis, quadruple ITI capacity by
encouraging them to run two or more shifts, start intensive training programmes
for the facially and reforming the MOUs between states and private agencies to
transform the ITIs in PPP mode.
II) Vocational Education by the Ministry of HRD.
It is proposed to expand the vocational education in 9500 senior secondary
schools with an intake capacity of 1.0 million to 20000 schools with an intake
capacity of 2.5 million by encouraging public-private partnership in schools. Move
the vocational education progressively from 2-year stream, starting after class 10,
to a stream that captures 9th class drop outs and later on it should commence from
class 7, capturing 7th class drop outs. In these schools emphasis should be given to
soft skills which can help in getting employment viz. English language skills,
quantitative skills, computer literacy, spread sheet, word processing, computer
graphics, presentation skills, behavioral and interpersonal skills etc.
III) RUDSETIs (Rural Development Self Employment Training institute) by
Ministry of Rural Development.
It is proposed to set up 600 RUDSETIs, one in each district. State
government will provide land and Government will meet 75% of the capital cost
and the remaining 25% will be provided by the banks.
IV) Setting up a virtual Skill Development Resource Network Linking 50000
Skill Development Centers (SDCs) under the Ministries of Information
Technology, Small and Medium enterprises, Rural Development and Textile
These ministries have proposed to set up 50000 SDCs to train approximately
200 persons per centre per year. These SDCs will deliver training capsules of 8-12
week duration. Training material will be created by participating ministries,
enterprises, industry associations with the help of NASSCOM. Mentor Groups for
tutorial support in online interactive mode will be provided by industry
associations. At the end of the programmes there will be Employment Melas for
placement of unplaced trainees.
3.9.3 Private Sector
Ten high growth sectors of industries and ten high growth sectors of services
have been identified. These sectors will have the potentiality to provide
employment. The mission will involve the association of these 20 sectors to
identify and quantify skill deficiencies in their respective sectors and will prepare
the sectoral plan to meet their growing skill needs. Skill Development Corporation
Trust will make periodic as well as annual report of its plans and activities and put
them in public domain. It will also identify the areas where government support is
required.
3.9.4 Ministries of the Central Government having Skill Development
Programmes
Line ministries/departments will be responsible for the implementation of
the skill development programmes. They will modify the programmes in line with
the policies and strategies by the apex committee suggested by Skill Development
Mission.
3.9.5 State Governments
I) State Government will transform Employment Exchanges to act as Career
Counseling Centre.
II) State council of Vocational Training will be upgraded and strengthened.
III) The existing ITI‘s will be modernized and the effectiveness of the
ongoing programmes will also be enhanced
IV) There should be Personnel Policy to ensure accountability and
outcomes.
V) Draw up plan for strengthening existing infrastructure.
VI) Deligate powers to local management of institutes
VII) Revamp the institute‘s management committees to give more
autonomy in the management of institutes.
3.9.6 State Skill Development Mission
The state Governments may establish the state-level missions. The main
aim of State Skill Development Mission will be to gear up skill development
activities, in the mission mode.
Chapter IV Resources of Bihar State
4.1 Introduction
Bihar is one of the major state of India, located in the eastern part of the
Indo-Gangetic plain of the country. It has an incredible and glorious history as a
major centre of the culture and politics in Indian subcontinent since ancient times.
Through its history from the 6th
century BC to 5th
century AD, Bihar had been a
centre of major empires of Indian subcontinent.
The State of Bihar is situated between 83°19'50"E and 88°17'40"E longitude
and 24°20'10"N and 27°31'15"N latitudes with an area of over 94 thousand sq. km.
constituting 2.86 per cent of the geographical area of India. Of this, over 92
thousand sq. km. (about 98 per cent of total area of Bihar) is rural and only 1.8
thousand sq. km. (less than 2 per cent) is urban area in Bihar.
Bihar is a landlocked state that has borders with West Bengal in the east and
Uttar Pradesh in the west, Nepal in the north and Jharkhand in the south. Bihar lies
mid-way between the humid West Bengal and sub-humid Uttar Pradesh which
provide it with a transitional position in respect of climate, and culture and
economy as well. The Bihar plain is divided into two unequal halves by the river
Ganges that flows through the middle of the State from west to east.
After bifurcation, Bihar is the third largest population in India. As per
Census of India, 2001, its total population figure was about 83 million, which is
about eight per cent of total population of India.
From the administrative point of view, Bihar is divided into 9 divisions, 38
districts and 101 sub-divisions. It has 534 community development blocks, 8,471
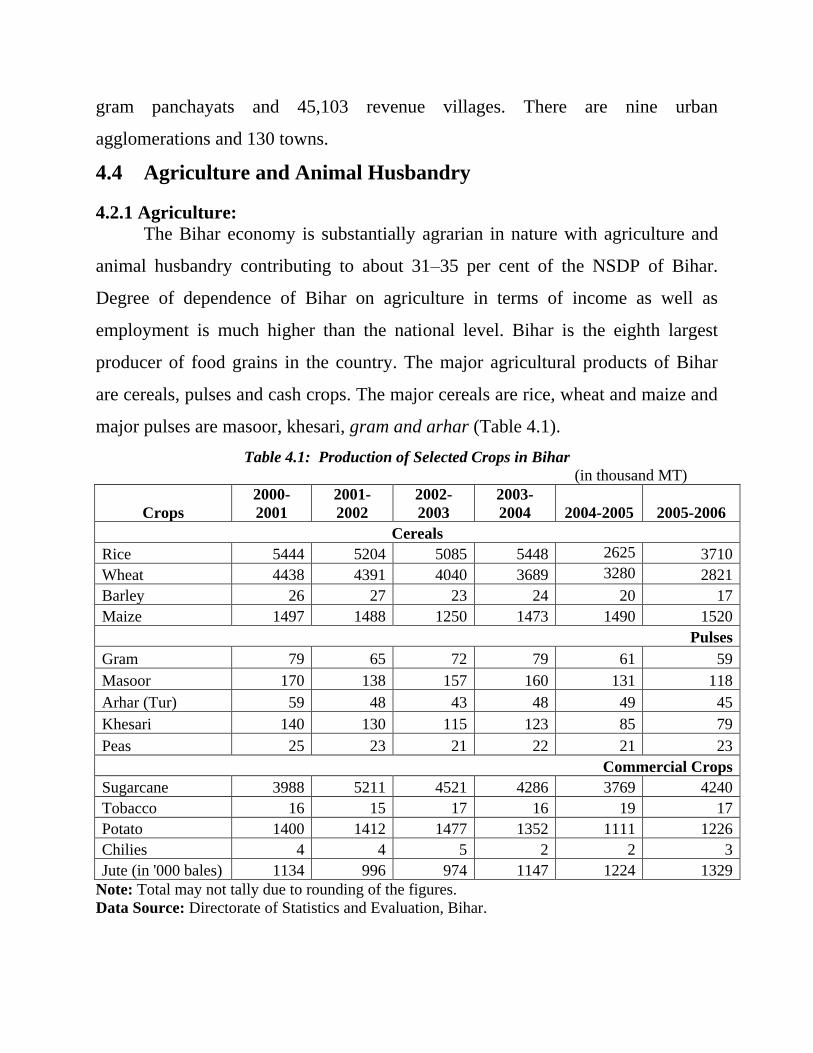
gram panchayats and 45,103 revenue villages. There are nine urban
agglomerations and 130 towns.
4.4 Agriculture and Animal Husbandry
4.2.1 Agriculture:
The Bihar economy is substantially agrarian in nature with agriculture and
animal husbandry contributing to about 31–35 per cent of the NSDP of Bihar.
Degree of dependence of Bihar on agriculture in terms of income as well as
employment is much higher than the national level. Bihar is the eighth largest
producer of food grains in the country. The major agricultural products of Bihar
are cereals, pulses and cash crops. The major cereals are rice, wheat and maize and
major pulses are masoor, khesari, gram and arhar (Table 4.1).
Table 4.1: Production of Selected Crops in Bihar
(in thousand MT)
Crops
2000-
2001
2001-
2002
2002-
2003
2003-
2004 2004-2005 2005-2006
Cereals
Rice 5444 5204 5085 5448 2625 3710
Wheat 4438 4391 4040 3689 3280 2821
Barley 26 27 23 24 20 17
Maize 1497 1488 1250 1473 1490 1520
Pulses
Gram 79 65 72 79 61 59
Masoor 170 138 157 160 131 118
Arhar (Tur) 59 48 43 48 49 45
Khesari 140 130 115 123 85 79
Peas 25 23 21 22 21 23
Commercial Crops
Sugarcane 3988 5211 4521 4286 3769 4240
Tobacco 16 15 17 16 19 17
Potato 1400 1412 1477 1352 1111 1226
Chilies 4 4 5 2 2 3
Jute (in '000 bales) 1134 996 974 1147 1224 1329
Note: Total may not tally due to rounding of the figures.
Data Source: Directorate of Statistics and Evaluation, Bihar.
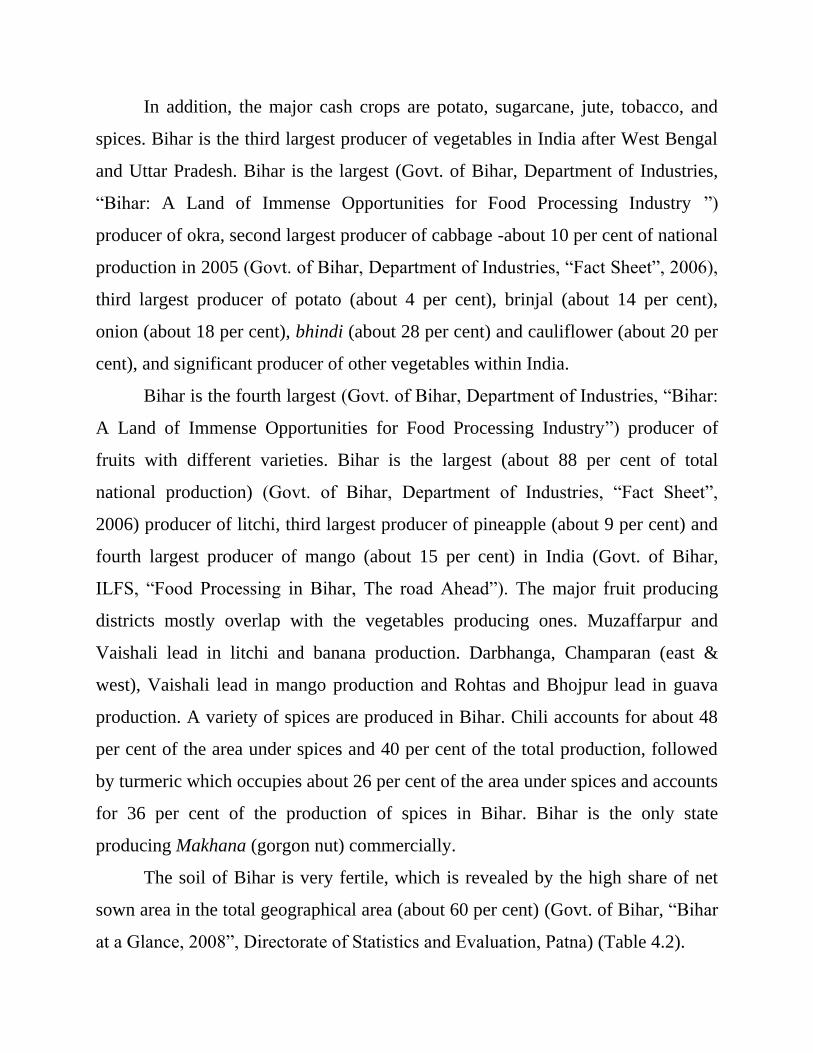
In addition, the major cash crops are potato, sugarcane, jute, tobacco, and
spices. Bihar is the third largest producer of vegetables in India after West Bengal
and Uttar Pradesh. Bihar is the largest (Govt. of Bihar, Department of Industries,
―Bihar: A Land of Immense Opportunities for Food Processing Industry ‖)
producer of okra, second largest producer of cabbage -about 10 per cent of national
production in 2005 (Govt. of Bihar, Department of Industries, ―Fact Sheet‖, 2006),
third largest producer of potato (about 4 per cent), brinjal (about 14 per cent),
onion (about 18 per cent), bhindi (about 28 per cent) and cauliflower (about 20 per
cent), and significant producer of other vegetables within India.
Bihar is the fourth largest (Govt. of Bihar, Department of Industries, ―Bihar:
A Land of Immense Opportunities for Food Processing Industry‖) producer of
fruits with different varieties. Bihar is the largest (about 88 per cent of total
national production) (Govt. of Bihar, Department of Industries, ―Fact Sheet‖,
2006) producer of litchi, third largest producer of pineapple (about 9 per cent) and
fourth largest producer of mango (about 15 per cent) in India (Govt. of Bihar,
ILFS, ―Food Processing in Bihar, The road Ahead‖). The major fruit producing
districts mostly overlap with the vegetables producing ones. Muzaffarpur and
Vaishali lead in litchi and banana production. Darbhanga, Champaran (east &
west), Vaishali lead in mango production and Rohtas and Bhojpur lead in guava
production. A variety of spices are produced in Bihar. Chili accounts for about 48
per cent of the area under spices and 40 per cent of the total production, followed
by turmeric which occupies about 26 per cent of the area under spices and accounts
for 36 per cent of the production of spices in Bihar. Bihar is the only state
producing Makhana (gorgon nut) commercially.
The soil of Bihar is very fertile, which is revealed by the high share of net
sown area in the total geographical area (about 60 per cent) (Govt. of Bihar, ―Bihar
at a Glance, 2008‖, Directorate of Statistics and Evaluation, Patna) (Table 4.2).
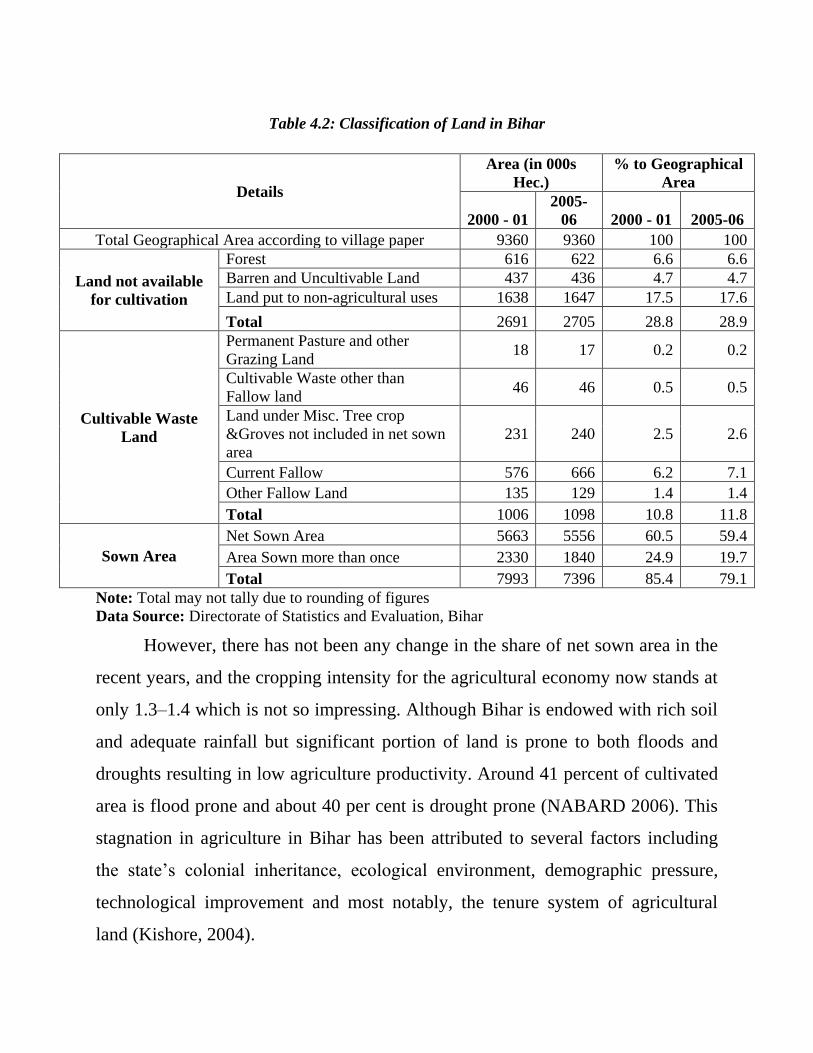
Table 4.2: Classification of Land in Bihar
Details
Area (in 000s
Hec.)
% to Geographical
Area
2000 - 01
2005-
06 2000 - 01 2005-06
Total Geographical Area according to village paper 9360 9360 100 100
Land not available
for cultivation
Forest 616 622 6.6 6.6
Barren and Uncultivable Land 437 436 4.7 4.7
Land put to non-agricultural uses 1638 1647 17.5 17.6
Total 2691 2705 28.8 28.9
Cultivable Waste
Land
Permanent Pasture and other
Grazing Land 18 17 0.2 0.2
Cultivable Waste other than
Fallow land 46 46 0.5 0.5
Land under Misc. Tree crop
&Groves not included in net sown
area
231 240 2.5 2.6
Current Fallow 576 666 6.2 7.1
Other Fallow Land 135 129 1.4 1.4
Total 1006 1098 10.8 11.8
Sown Area
Net Sown Area 5663 5556 60.5 59.4
Area Sown more than once 2330 1840 24.9 19.7
Total 7993 7396 85.4 79.1
Note: Total may not tally due to rounding of figures
Data Source: Directorate of Statistics and Evaluation, Bihar
However, there has not been any change in the share of net sown area in the
recent years, and the cropping intensity for the agricultural economy now stands at
only 1.3–1.4 which is not so impressing. Although Bihar is endowed with rich soil
and adequate rainfall but significant portion of land is prone to both floods and
droughts resulting in low agriculture productivity. Around 41 percent of cultivated
area is flood prone and about 40 per cent is drought prone (NABARD 2006). This
stagnation in agriculture in Bihar has been attributed to several factors including
the state‘s colonial inheritance, ecological environment, demographic pressure,
technological improvement and most notably, the tenure system of agricultural
land (Kishore, 2004).
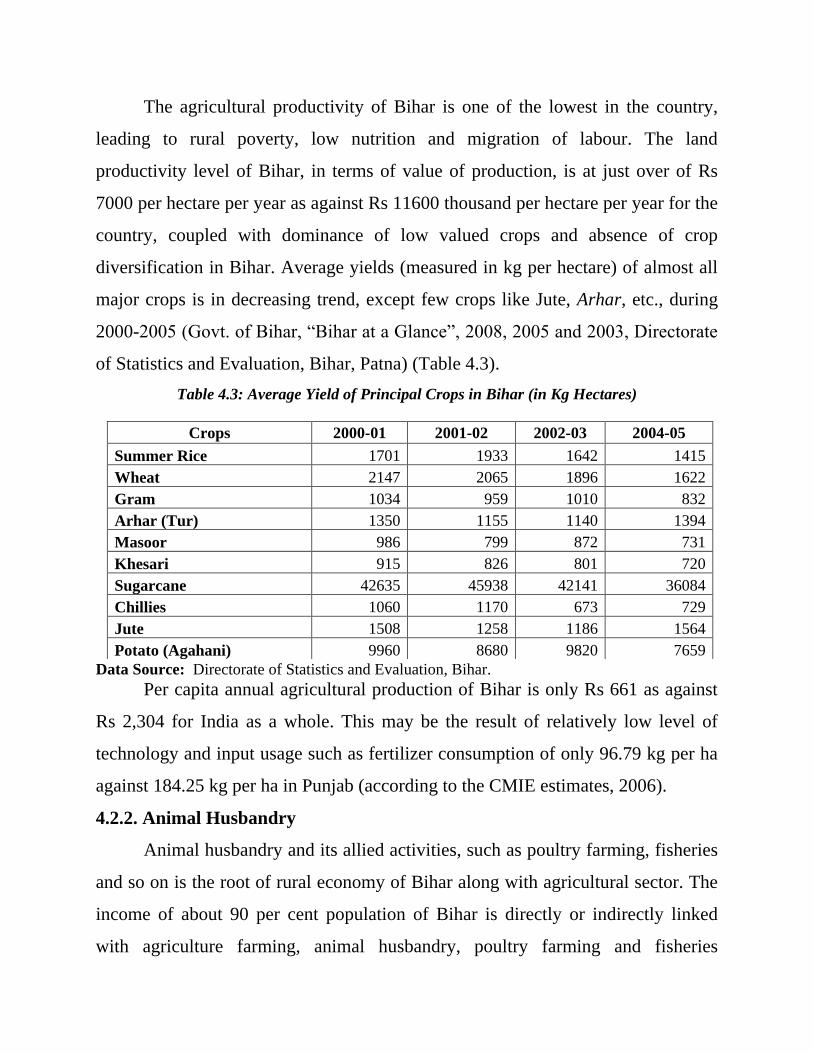
The agricultural productivity of Bihar is one of the lowest in the country,
leading to rural poverty, low nutrition and migration of labour. The land
productivity level of Bihar, in terms of value of production, is at just over of Rs
7000 per hectare per year as against Rs 11600 thousand per hectare per year for the
country, coupled with dominance of low valued crops and absence of crop
diversification in Bihar. Average yields (measured in kg per hectare) of almost all
major crops is in decreasing trend, except few crops like Jute, Arhar, etc., during
2000-2005 (Govt. of Bihar, ―Bihar at a Glance‖, 2008, 2005 and 2003, Directorate
of Statistics and Evaluation, Bihar, Patna) (Table 4.3).
Table 4.3: Average Yield of Principal Crops in Bihar (in Kg Hectares)
Data Source: Directorate of Statistics and Evaluation, Bihar.
Per capita annual agricultural production of Bihar is only Rs 661 as against
Rs 2,304 for India as a whole. This may be the result of relatively low level of
technology and input usage such as fertilizer consumption of only 96.79 kg per ha
against 184.25 kg per ha in Punjab (according to the CMIE estimates, 2006).
4.2.2. Animal Husbandry
Animal husbandry and its allied activities, such as poultry farming, fisheries
and so on is the root of rural economy of Bihar along with agricultural sector. The
income of about 90 per cent population of Bihar is directly or indirectly linked
with agriculture farming, animal husbandry, poultry farming and fisheries
Crops 2000-01 2001-02 2002-03 2004-05
Summer Rice 1701 1933 1642 1415
Wheat 2147 2065 1896 1622
Gram 1034 959 1010 832
Arhar (Tur) 1350 1155 1140 1394
Masoor 986 799 872 731
Khesari 915 826 801 720
Sugarcane 42635 45938 42141 36084
Chillies 1060 1170 673 729
Jute 1508 1258 1186 1564
Potato (Agahani) 9960 8680 9820 7659
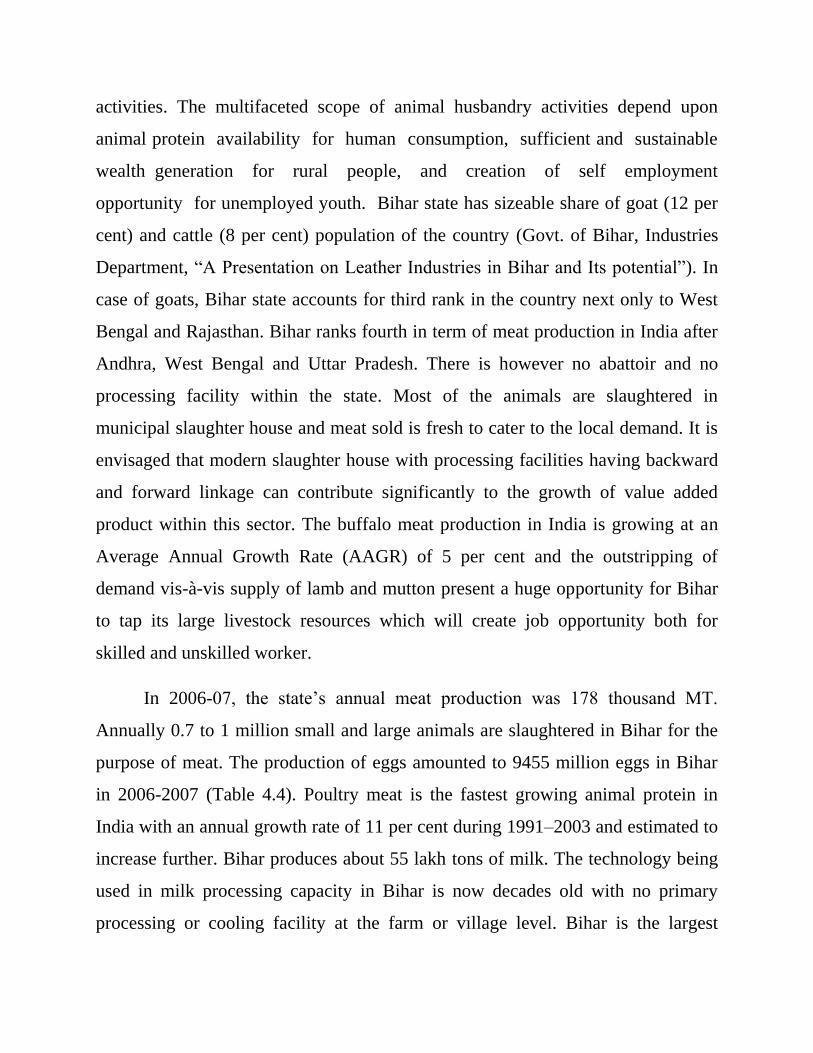
activities. The multifaceted scope of animal husbandry activities depend upon
animal protein availability for human consumption, sufficient and sustainable
wealth generation for rural people, and creation of self employment
opportunity for unemployed youth. Bihar state has sizeable share of goat (12 per
cent) and cattle (8 per cent) population of the country (Govt. of Bihar, Industries
Department, ―A Presentation on Leather Industries in Bihar and Its potential‖). In
case of goats, Bihar state accounts for third rank in the country next only to West
Bengal and Rajasthan. Bihar ranks fourth in term of meat production in India after
Andhra, West Bengal and Uttar Pradesh. There is however no abattoir and no
processing facility within the state. Most of the animals are slaughtered in
municipal slaughter house and meat sold is fresh to cater to the local demand. It is
envisaged that modern slaughter house with processing facilities having backward
and forward linkage can contribute significantly to the growth of value added
product within this sector. The buffalo meat production in India is growing at an
Average Annual Growth Rate (AAGR) of 5 per cent and the outstripping of
demand vis-à-vis supply of lamb and mutton present a huge opportunity for Bihar
to tap its large livestock resources which will create job opportunity both for
skilled and unskilled worker.
In 2006-07, the state‘s annual meat production was 178 thousand MT.
Annually 0.7 to 1 million small and large animals are slaughtered in Bihar for the
purpose of meat. The production of eggs amounted to 9455 million eggs in Bihar
in 2006-2007 (Table 4.4). Poultry meat is the fastest growing animal protein in
India with an annual growth rate of 11 per cent during 1991–2003 and estimated to
increase further. Bihar produces about 55 lakh tons of milk. The technology being
used in milk processing capacity in Bihar is now decades old with no primary
processing or cooling facility at the farm or village level. Bihar is the largest
producer (about 50% of national production) of honey in India with total
production of about 3900 MT in 2002 and about one lakh families directly engaged
in honey production activities in Bihar (Govt. of Bihar , ―Fact Sheet‖, Department
of Industries, 2006). The productivity of honey production is almost thrice (about
60 kg per box) of national average.
Table 4.4: Production of animal husbandry in Bihar
2000-01 2002-03 2005-06 2006-07
Production of Milk (in Lakh ton.) 24.89 28.69 50.6 54.5
Production of Eggs (in million no.) 718 737 10012 9455
Production of Meat (in thousand
MT) 140 173 176 178
Production of Fish (in thousand
MT) - - 279.53 267.04
Fish is one of the popularly consumed items in Bihar, particularly in Mithila
region. The fishery sector provides employment to a large section of population.
According to reports of NABARD, the fishery sector is the fastest growing sub-
sector indicating a growth rate of over 10 per cent per annum (NABARD, 2006).
The annual consumption of fish within Bihar is nearly 4.5 lakh tonnes, against the
present annual production of around 2.50-3.0 lakh tones (Government of Bihar,
Planning and Development Department, ―Bihar Approach to 11th
Five Year Plan:
Vision for Accelerated Inclusive Growth‖, Patna, 2006). The under utilization of
aquaculture resources, unscientific management of water bodies and lack of
entrepreneurship are some of the most obvious reasons for the gap between
demand and supply. Farmers will need to be given proper technical training to
increase the skill sets for fishery sector and incentives for composite fish culture.
4.5 Natural Resources
The geographical features of any region are the basic determinant of whether
that region would be resource rich or not. And these natural resources are the main
force for having a specific type of cultural and socio-economic base of the people
living with the natural resources of that region through the continuous influence of
the pattern of production as well as consumption behaviour. Water resources, land,
forest products, minerals etc are the main natural resources which also enter into
the production process as a factor of production, apart from capital and labour. The
skill sets development of the local people is also associated with the nature of the
natural resources. The natural resources decide about the kind of industries which
should come up in that region from both production as well as consumption point
of view. Therefore natural resources determine the derived demand for manpower
(skilled as well as unskilled) in that region.
Bihar is very rich in terms of natural resources. Although, it has
comparatively less proportion of forest and minerals as against national average
availability, Bihar has a vast area of fertile land, huge volume of water resources
and hard working manpower. To assess the demand for skill sets in Bihar, it is
necessary to give a look on the natural resources of Bihar.
4.3.1. Forest
Forest products are one of the major resources for the production as well as
direct consumption. Bihar lies in the tropical to sub-tropical region. Rainfall here is
the most significant factor in determining the nature of vegetation. Out of total
geographical area of Bihar, only 6.6 per cent is under the forest cover (see Table
3.2). The sub Himalayan foothill constitutes the belt of moist deciduous forests.
These consist of scrub, grass and reeds. Since the annual rainfall in this region is
more than 1600 mm, so it favours the luxuriant Sal forest in this area. Due to the
hot and dry summer, the deciduous forests also abound there, which consist of Sal,
Shisham, Cendrela Toona, Khair, and Semal, etc. This type of forest can be seen in
the eastern part of Bihar mainly in Saharsa and Purnia districts.
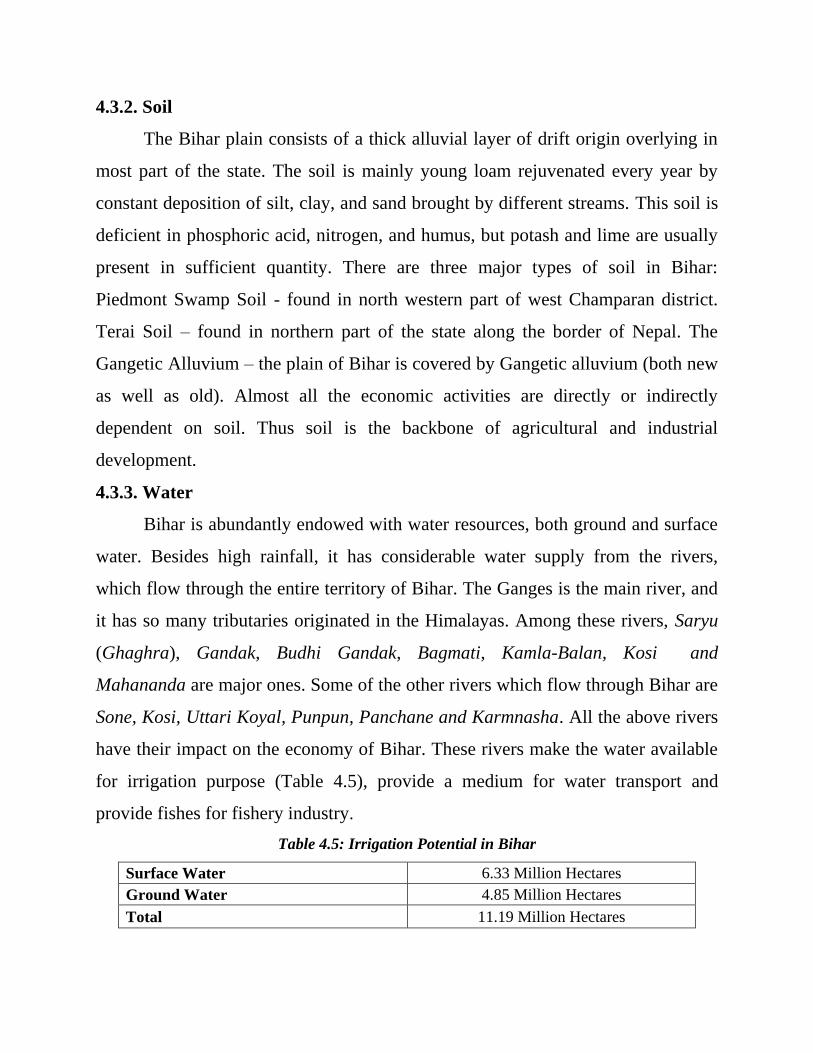
4.3.2. Soil
The Bihar plain consists of a thick alluvial layer of drift origin overlying in
most part of the state. The soil is mainly young loam rejuvenated every year by
constant deposition of silt, clay, and sand brought by different streams. This soil is
deficient in phosphoric acid, nitrogen, and humus, but potash and lime are usually
present in sufficient quantity. There are three major types of soil in Bihar:
Piedmont Swamp Soil - found in north western part of west Champaran district.
Terai Soil – found in northern part of the state along the border of Nepal. The
Gangetic Alluvium – the plain of Bihar is covered by Gangetic alluvium (both new
as well as old). Almost all the economic activities are directly or indirectly
dependent on soil. Thus soil is the backbone of agricultural and industrial
development.
4.3.3. Water
Bihar is abundantly endowed with water resources, both ground and surface
water. Besides high rainfall, it has considerable water supply from the rivers,
which flow through the entire territory of Bihar. The Ganges is the main river, and
it has so many tributaries originated in the Himalayas. Among these rivers, Saryu
(Ghaghra), Gandak, Budhi Gandak, Bagmati, Kamla-Balan, Kosi and
Mahananda are major ones. Some of the other rivers which flow through Bihar are
Sone, Kosi, Uttari Koyal, Punpun, Panchane and Karmnasha. All the above rivers
have their impact on the economy of Bihar. These rivers make the water available
for irrigation purpose (Table 4.5), provide a medium for water transport and
provide fishes for fishery industry.
Table 4.5: Irrigation Potential in Bihar
Surface Water 6.33 Million Hectares
Ground Water 4.85 Million Hectares
Total 11.19 Million Hectares
Data Source: Bihar at Making: A Presentation to Investment Commission, Ministry of
Industries and Government of Bihar.
Though Bihar is getting benefited from her abundant water resources, yet,
Bihar is suffering from the devastation by flood in rainy seasons in almost every
year. Out of 38 districts of Bihar, 29 districts are flood prone covering about 75
per cent of total geographical area of Bihar (Dr. M S Ahluwalia, Dy. Chairman,
Planning Commission, Govt. of Bihar ―Water Resources: A presentation by Water
Resources Department‖). The flood in Bihar destroys the agricultural products,
cattle, infrastructure, and so on, and shake the Bihar‘s economy in frequent years.
4.3.4. Minerals
Manufacturing needs two types of raw materials viz. agriculture/forest and
minerals. In undivided Bihar, there were so many mines which is the main mine
belt in India. After bifurcation of Bihar in 2000, this minerals rich region is now a
part of Jharkhand. However, there are some kinds of mineral which can also be
found till now in Bihar. The important minerals which are found in Bihar are
limestone, mica (crude), quartz, quartzite, steatite, etc. The total production of
limestone was about 250 thousand Tonns, that of quartzite was about 13 thousand
Tonnes (Table 4.6) in 2004-05 in Bihar (Indian Bureau of Mines). Therefore, there
is a scope to develop some industry through exploring these minerals available in
Bihar and it may create some skill based job opportunities (alongwith unskilled job
also) in the State.
Table 4.6: Production of selected minerals in Bihar
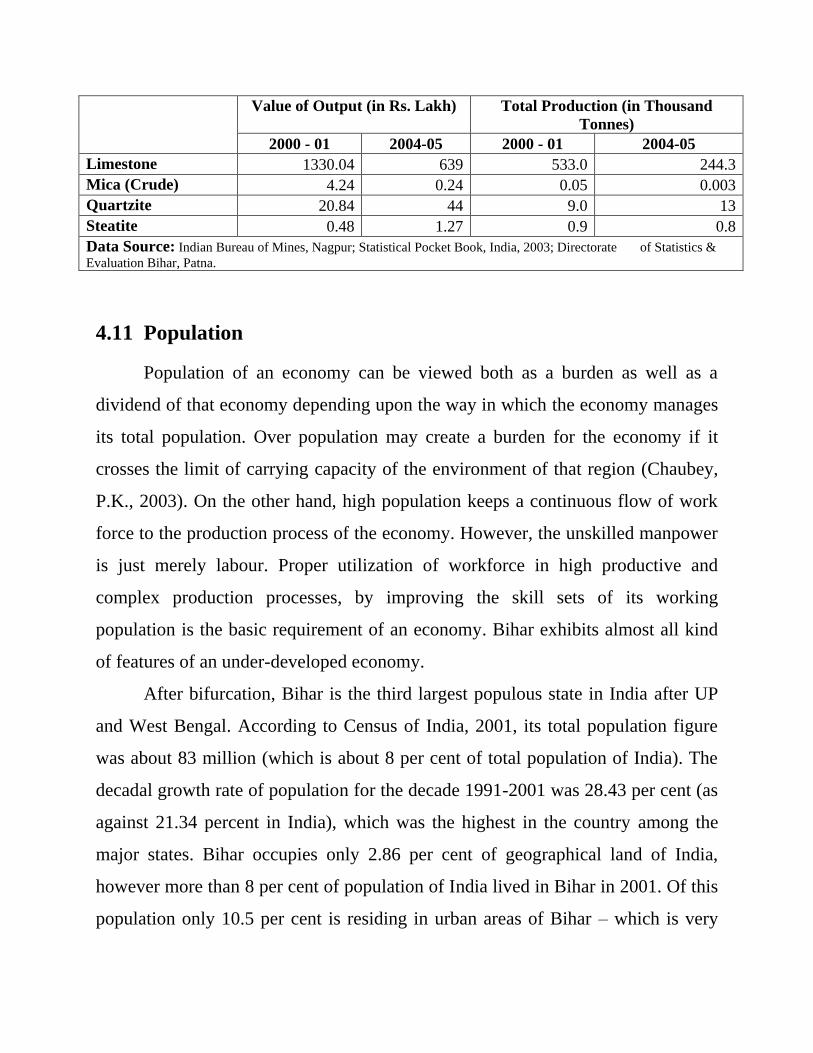
4.11 Population
Population of an economy can be viewed both as a burden as well as a
dividend of that economy depending upon the way in which the economy manages
its total population. Over population may create a burden for the economy if it
crosses the limit of carrying capacity of the environment of that region (Chaubey,
P.K., 2003). On the other hand, high population keeps a continuous flow of work
force to the production process of the economy. However, the unskilled manpower
is just merely labour. Proper utilization of workforce in high productive and
complex production processes, by improving the skill sets of its working
population is the basic requirement of an economy. Bihar exhibits almost all kind
of features of an under-developed economy.
After bifurcation, Bihar is the third largest populous state in India after UP
and West Bengal. According to Census of India, 2001, its total population figure
was about 83 million (which is about 8 per cent of total population of India). The
decadal growth rate of population for the decade 1991-2001 was 28.43 per cent (as
against 21.34 percent in India), which was the highest in the country among the
major states. Bihar occupies only 2.86 per cent of geographical land of India,
however more than 8 per cent of population of India lived in Bihar in 2001. Of this
population only 10.5 per cent is residing in urban areas of Bihar – which is very
Value of Output (in Rs. Lakh) Total Production (in Thousand
Tonnes)
2000 - 01 2004-05 2000 - 01 2004-05
Limestone 1330.04 639 533.0 244.3
Mica (Crude) 4.24 0.24 0.05 0.003
Quartzite 20.84 44 9.0 13
Steatite 0.48 1.27 0.9 0.8
Data Source: Indian Bureau of Mines, Nagpur; Statistical Pocket Book, India, 2003; Directorate of Statistics &
Evaluation Bihar, Patna.
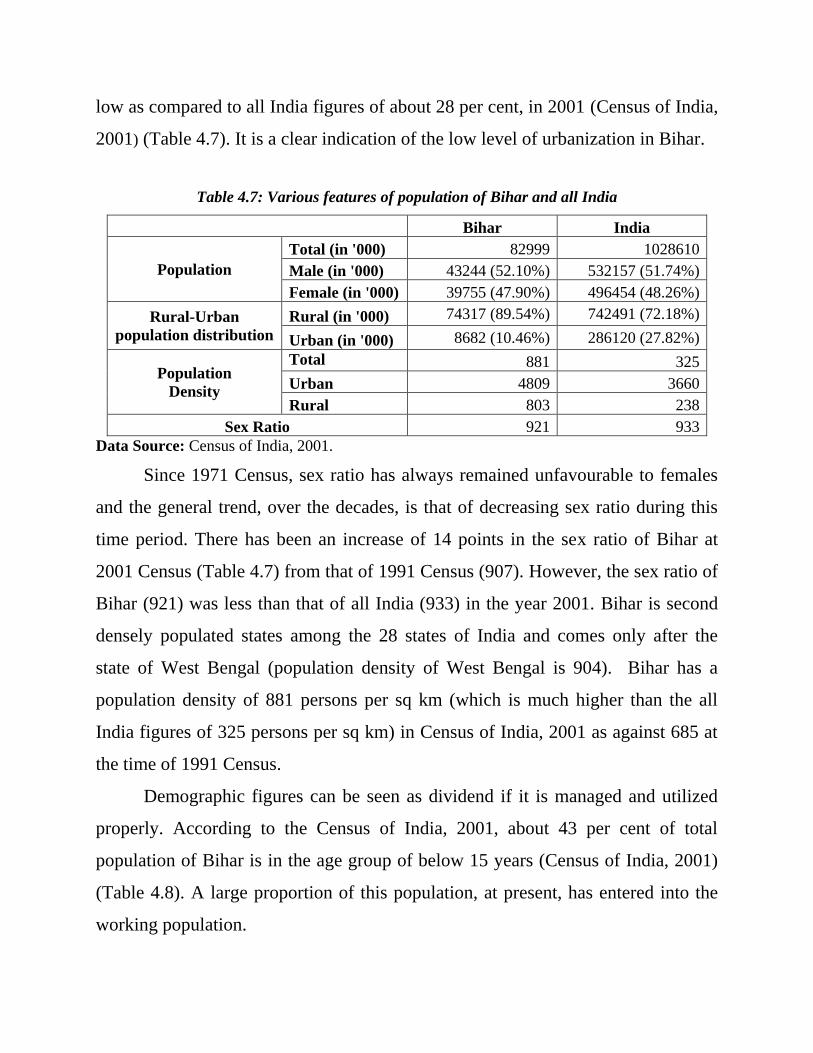
low as compared to all India figures of about 28 per cent, in 2001 (Census of India,
2001) (Table 4.7). It is a clear indication of the low level of urbanization in Bihar.
Table 4.7: Various features of population of Bihar and all India
Bihar India
Population
Total (in '000) 82999 1028610
Male (in '000) 43244 (52.10%) 532157 (51.74%)
Female (in '000) 39755 (47.90%) 496454 (48.26%)
Rural-Urban
population distribution
Rural (in '000) 74317 (89.54%) 742491 (72.18%)
Urban (in '000) 8682 (10.46%) 286120 (27.82%)
Population
Density
Total 881 325
Urban 4809 3660
Rural 803 238
Sex Ratio 921 933
Data Source: Census of India, 2001.
Since 1971 Census, sex ratio has always remained unfavourable to females
and the general trend, over the decades, is that of decreasing sex ratio during this
time period. There has been an increase of 14 points in the sex ratio of Bihar at
2001 Census (Table 4.7) from that of 1991 Census (907). However, the sex ratio of
Bihar (921) was less than that of all India (933) in the year 2001. Bihar is second
densely populated states among the 28 states of India and comes only after the
state of West Bengal (population density of West Bengal is 904). Bihar has a
population density of 881 persons per sq km (which is much higher than the all
India figures of 325 persons per sq km) in Census of India, 2001 as against 685 at
the time of 1991 Census.
Demographic figures can be seen as dividend if it is managed and utilized
properly. According to the Census of India, 2001, about 43 per cent of total
population of Bihar is in the age group of below 15 years (Census of India, 2001)
(Table 4.8). A large proportion of this population, at present, has entered into the
working population.
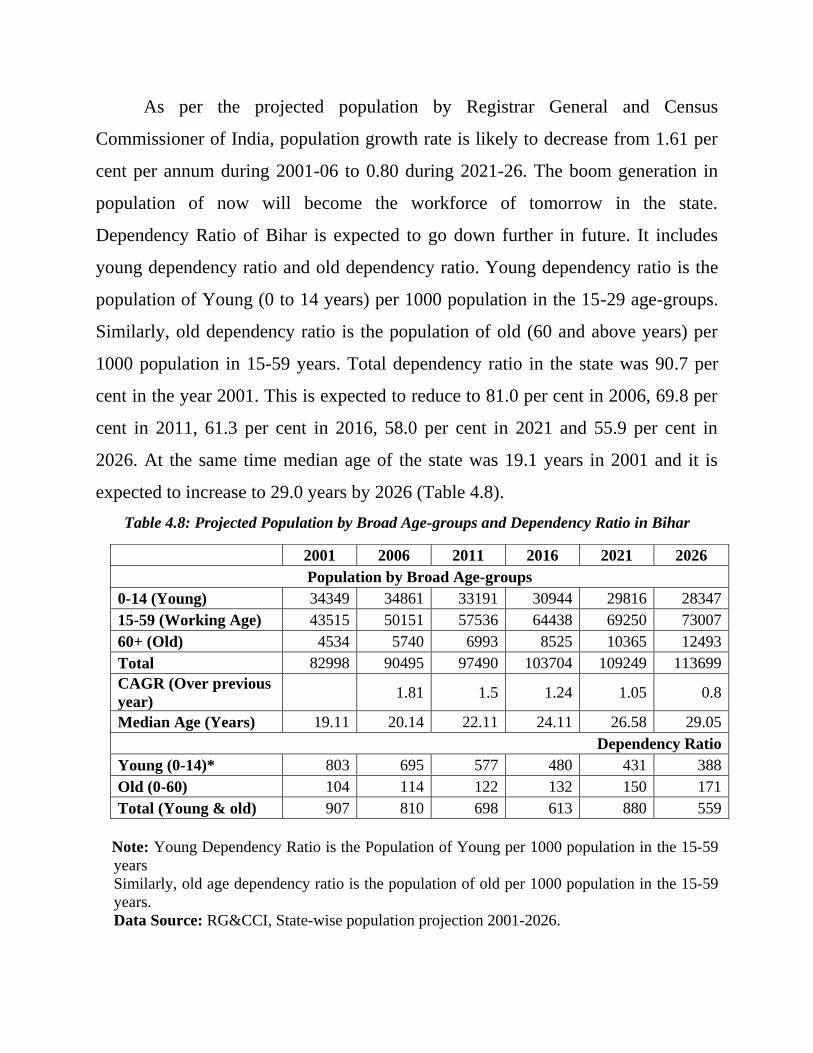
As per the projected population by Registrar General and Census
Commissioner of India, population growth rate is likely to decrease from 1.61 per
cent per annum during 2001-06 to 0.80 during 2021-26. The boom generation in
population of now will become the workforce of tomorrow in the state.
Dependency Ratio of Bihar is expected to go down further in future. It includes
young dependency ratio and old dependency ratio. Young dependency ratio is the
population of Young (0 to 14 years) per 1000 population in the 15-29 age-groups.
Similarly, old dependency ratio is the population of old (60 and above years) per
1000 population in 15-59 years. Total dependency ratio in the state was 90.7 per
cent in the year 2001. This is expected to reduce to 81.0 per cent in 2006, 69.8 per
cent in 2011, 61.3 per cent in 2016, 58.0 per cent in 2021 and 55.9 per cent in
2026. At the same time median age of the state was 19.1 years in 2001 and it is
expected to increase to 29.0 years by 2026 (Table 4.8).
Table 4.8: Projected Population by Broad Age-groups and Dependency Ratio in Bihar
Note: Young Dependency Ratio is the Population of Young per 1000 population in the 15-59
years
Similarly, old age dependency ratio is the population of old per 1000 population in the 15-59
years.
Data Source: RG&CCI, State-wise population projection 2001-2026.
2001 2006 2011 2016 2021 2026
Population by Broad Age-groups
0-14 (Young) 34349 34861 33191 30944 29816 28347
15-59 (Working Age) 43515 50151 57536 64438 69250 73007
60+ (Old) 4534 5740 6993 8525 10365 12493
Total 82998 90495 97490 103704 109249 113699
CAGR (Over previous
year) 1.81 1.5 1.24 1.05 0.8
Median Age (Years) 19.11 20.14 22.11 24.11 26.58 29.05
Dependency Ratio
Young (0-14)* 803 695 577 480 431 388
Old (0-60) 104 114 122 132 150 171
Total (Young & old) 907 810 698 613 880 559
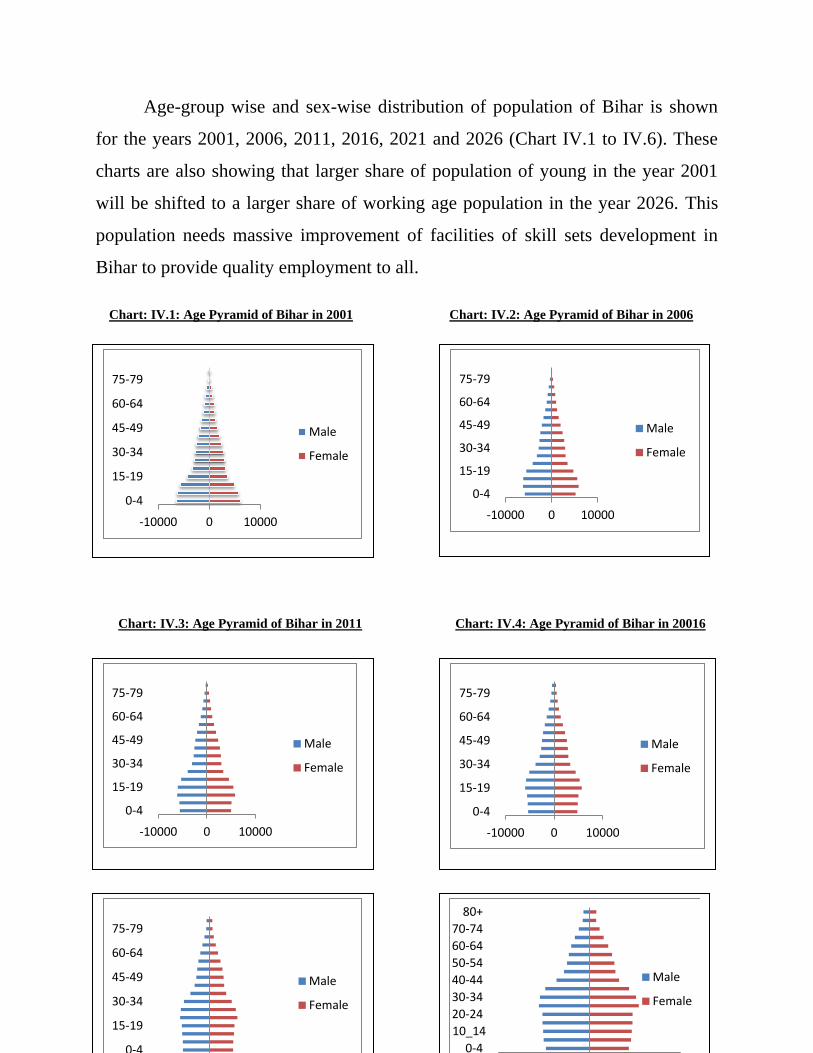
Age-group wise and sex-wise distribution of population of Bihar is shown
for the years 2001, 2006, 2011, 2016, 2021 and 2026 (Chart IV.1 to IV.6). These
charts are also showing that larger share of population of young in the year 2001
will be shifted to a larger share of working age population in the year 2026. This
population needs massive improvement of facilities of skill sets development in
Bihar to provide quality employment to all.
Chart: IV.1: Age Pyramid of Bihar in 2001 Chart: IV.2: Age Pyramid of Bihar in 2006
..
Chart: IV.3: Age Pyramid of Bihar in 2011 Chart: IV.4: Age Pyramid of Bihar in 20016
Chart: IV.5: Age Pyramid of Bihar in 2021 Chart: IV.6: Age Pyramid of Bihar in 2026
-10000 0 10000
0-4
15-19
30-34
45-49
60-64
75-79
Male
Female
-10000 0 10000
0-4
15-19
30-34
45-49
60-64
75-79
Male
Female
-10000 0 10000
0-4
15-19
30-34
45-49
60-64
75-79
Male
Female
-10000 0 10000
0-4
15-19
30-34
45-49
60-64
75-79
Male
Female
-10000 0 10000
0-4
15-19
30-34
45-49
60-64
75-79
Male
Female
-10000 -5000 0 5000 10000
0-4
10_14
20-24
30-34
40-44
50-54
60-64
70-74
80+
Male
Female
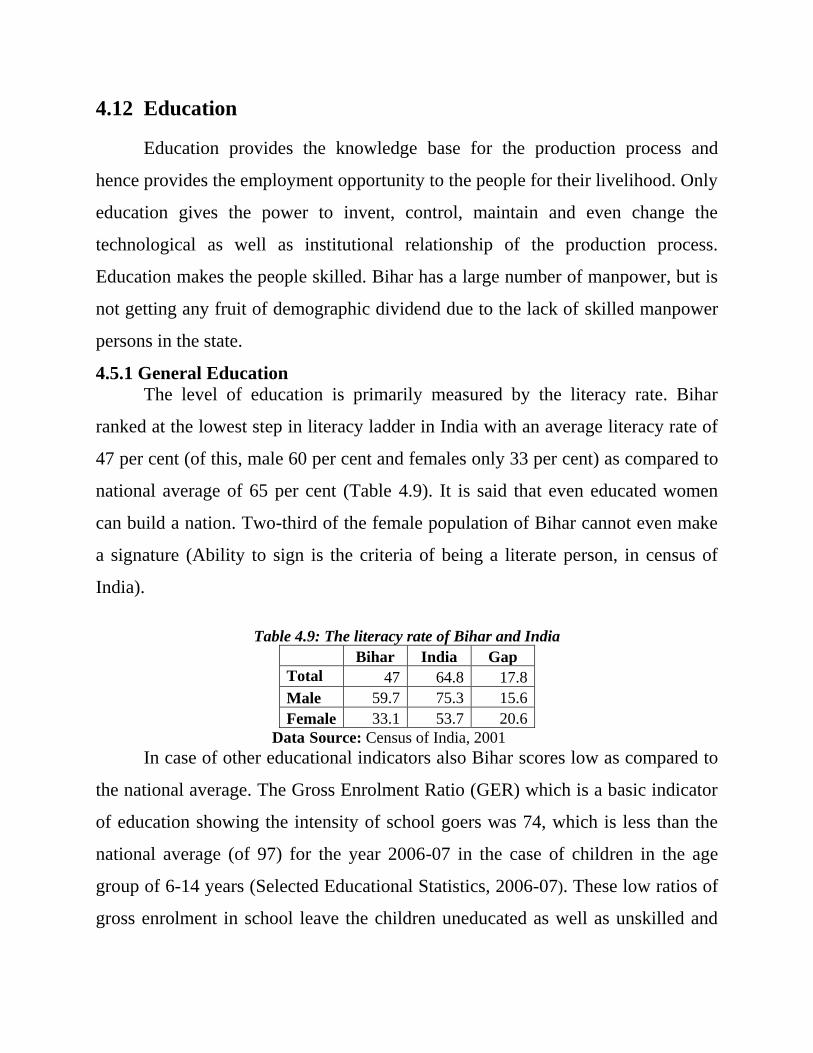
4.12 Education
Education provides the knowledge base for the production process and
hence provides the employment opportunity to the people for their livelihood. Only
education gives the power to invent, control, maintain and even change the
technological as well as institutional relationship of the production process.
Education makes the people skilled. Bihar has a large number of manpower, but is
not getting any fruit of demographic dividend due to the lack of skilled manpower
persons in the state.
4.5.1 General Education
The level of education is primarily measured by the literacy rate. Bihar
ranked at the lowest step in literacy ladder in India with an average literacy rate of
47 per cent (of this, male 60 per cent and females only 33 per cent) as compared to
national average of 65 per cent (Table 4.9). It is said that even educated women
can build a nation. Two-third of the female population of Bihar cannot even make
a signature (Ability to sign is the criteria of being a literate person, in census of
India).
Table 4.9: The literacy rate of Bihar and India
Bihar India Gap
Total 47 64.8 17.8
Male 59.7 75.3 15.6
Female 33.1 53.7 20.6
Data Source: Census of India, 2001
In case of other educational indicators also Bihar scores low as compared to
the national average. The Gross Enrolment Ratio (GER) which is a basic indicator
of education showing the intensity of school goers was 74, which is less than the
national average (of 97) for the year 2006-07 in the case of children in the age
group of 6-14 years (Selected Educational Statistics, 2006-07). These low ratios of
gross enrolment in school leave the children uneducated as well as unskilled and
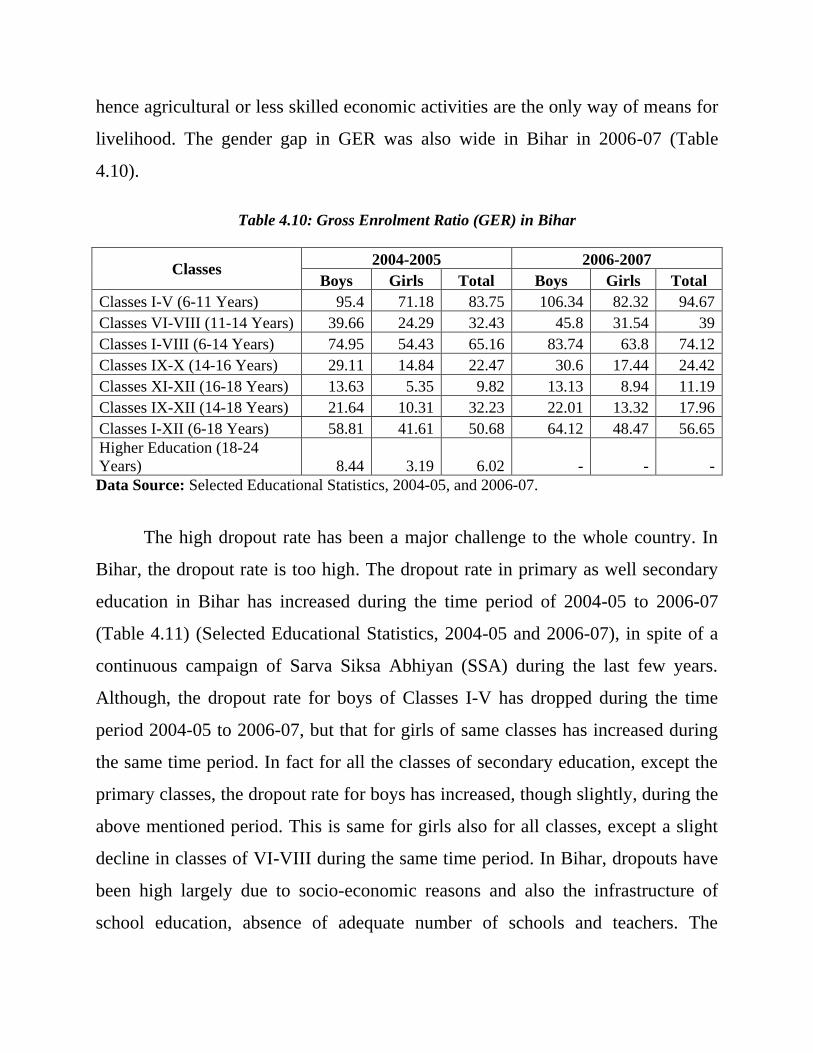
hence agricultural or less skilled economic activities are the only way of means for
livelihood. The gender gap in GER was also wide in Bihar in 2006-07 (Table
4.10).
Table 4.10: Gross Enrolment Ratio (GER) in Bihar
Classes 2004-2005 2006-2007
Boys Girls Total Boys Girls Total
Classes I-V (6-11 Years) 95.4 71.18 83.75 106.34 82.32 94.67
Classes VI-VIII (11-14 Years) 39.66 24.29 32.43 45.8 31.54 39
Classes I-VIII (6-14 Years) 74.95 54.43 65.16 83.74 63.8 74.12
Classes IX-X (14-16 Years) 29.11 14.84 22.47 30.6 17.44 24.42
Classes XI-XII (16-18 Years) 13.63 5.35 9.82 13.13 8.94 11.19
Classes IX-XII (14-18 Years) 21.64 10.31 32.23 22.01 13.32 17.96
Classes I-XII (6-18 Years) 58.81 41.61 50.68 64.12 48.47 56.65
Higher Education (18-24
Years) 8.44 3.19 6.02 - - -
Data Source: Selected Educational Statistics, 2004-05, and 2006-07.
The high dropout rate has been a major challenge to the whole country. In
Bihar, the dropout rate is too high. The dropout rate in primary as well secondary
education in Bihar has increased during the time period of 2004-05 to 2006-07
(Table 4.11) (Selected Educational Statistics, 2004-05 and 2006-07), in spite of a
continuous campaign of Sarva Siksa Abhiyan (SSA) during the last few years.
Although, the dropout rate for boys of Classes I-V has dropped during the time
period 2004-05 to 2006-07, but that for girls of same classes has increased during
the same time period. In fact for all the classes of secondary education, except the
primary classes, the dropout rate for boys has increased, though slightly, during the
above mentioned period. This is same for girls also for all classes, except a slight
decline in classes of VI-VIII during the same time period. In Bihar, dropouts have
been high largely due to socio-economic reasons and also the infrastructure of
school education, absence of adequate number of schools and teachers. The
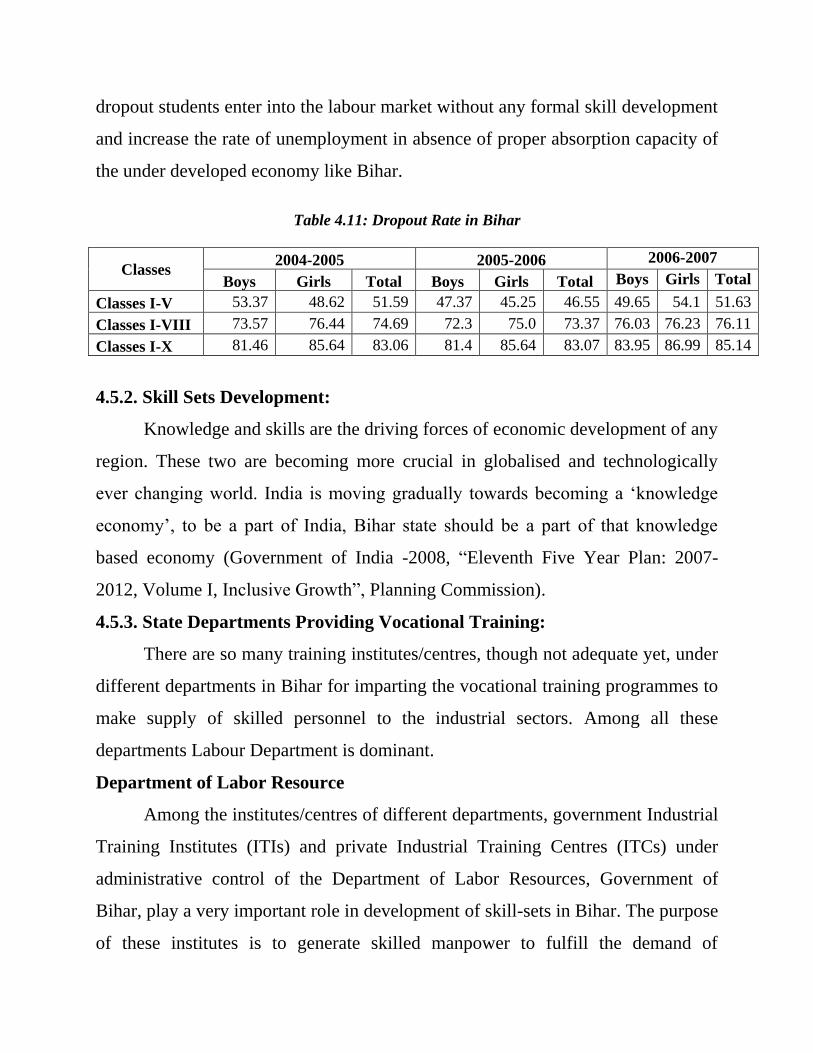
dropout students enter into the labour market without any formal skill development
and increase the rate of unemployment in absence of proper absorption capacity of
the under developed economy like Bihar.
Table 4.11: Dropout Rate in Bihar
Classes 2004-2005 2005-2006 2006-2007
Boys Girls Total Boys Girls Total Boys Girls Total
Classes I-V 53.37 48.62 51.59 47.37 45.25 46.55 49.65 54.1 51.63
Classes I-VIII 73.57 76.44 74.69 72.3 75.0 73.37 76.03 76.23 76.11
Classes I-X 81.46 85.64 83.06 81.4 85.64 83.07 83.95 86.99 85.14
4.5.2. Skill Sets Development:
Knowledge and skills are the driving forces of economic development of any
region. These two are becoming more crucial in globalised and technologically
ever changing world. India is moving gradually towards becoming a ‗knowledge
economy‘, to be a part of India, Bihar state should be a part of that knowledge
based economy (Government of India -2008, ―Eleventh Five Year Plan: 2007-
2012, Volume I, Inclusive Growth‖, Planning Commission).
4.5.3. State Departments Providing Vocational Training:
There are so many training institutes/centres, though not adequate yet, under
different departments in Bihar for imparting the vocational training programmes to
make supply of skilled personnel to the industrial sectors. Among all these
departments Labour Department is dominant.
Department of Labor Resource
Among the institutes/centres of different departments, government Industrial
Training Institutes (ITIs) and private Industrial Training Centres (ITCs) under
administrative control of the Department of Labor Resources, Government of
Bihar, play a very important role in development of skill-sets in Bihar. The purpose
of these institutes is to generate skilled manpower to fulfill the demand of
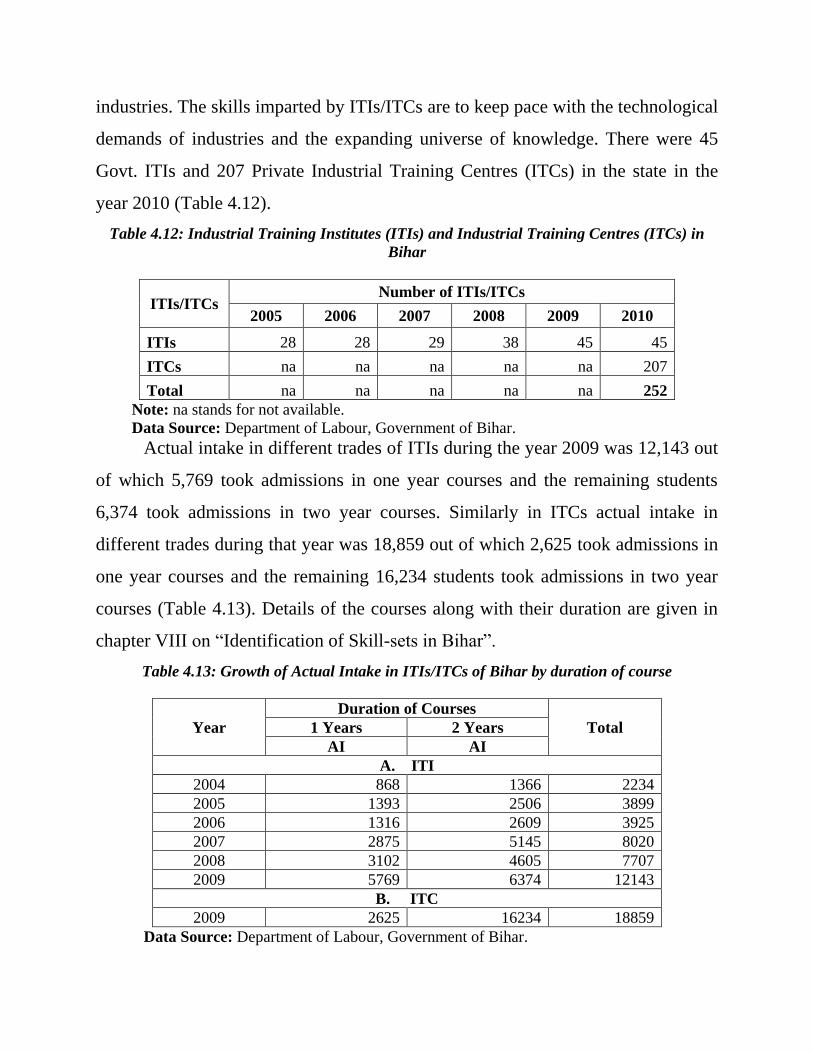
industries. The skills imparted by ITIs/ITCs are to keep pace with the technological
demands of industries and the expanding universe of knowledge. There were 45
Govt. ITIs and 207 Private Industrial Training Centres (ITCs) in the state in the
year 2010 (Table 4.12).
Table 4.12: Industrial Training Institutes (ITIs) and Industrial Training Centres (ITCs) in
Bihar
ITIs/ITCs Number of ITIs/ITCs
2005 2006 2007 2008 2009 2010
ITIs 28 28 29 38 45 45
ITCs na na na na na 207
Total na na na na na 252
Note: na stands for not available.
Data Source: Department of Labour, Government of Bihar.
Actual intake in different trades of ITIs during the year 2009 was 12,143 out
of which 5,769 took admissions in one year courses and the remaining students
6,374 took admissions in two year courses. Similarly in ITCs actual intake in
different trades during that year was 18,859 out of which 2,625 took admissions in
one year courses and the remaining 16,234 students took admissions in two year
courses (Table 4.13). Details of the courses along with their duration are given in
chapter VIII on ―Identification of Skill-sets in Bihar‖.
Table 4.13: Growth of Actual Intake in ITIs/ITCs of Bihar by duration of course
Year
Duration of Courses
Total 1 Years 2 Years
AI AI
A. ITI
2004 868 1366 2234
2005 1393 2506 3899
2006 1316 2609 3925
2007 2875 5145 8020
2008 3102 4605 7707
2009 5769 6374 12143
B. ITC
2009 2625 16234 18859
Data Source: Department of Labour, Government of Bihar.
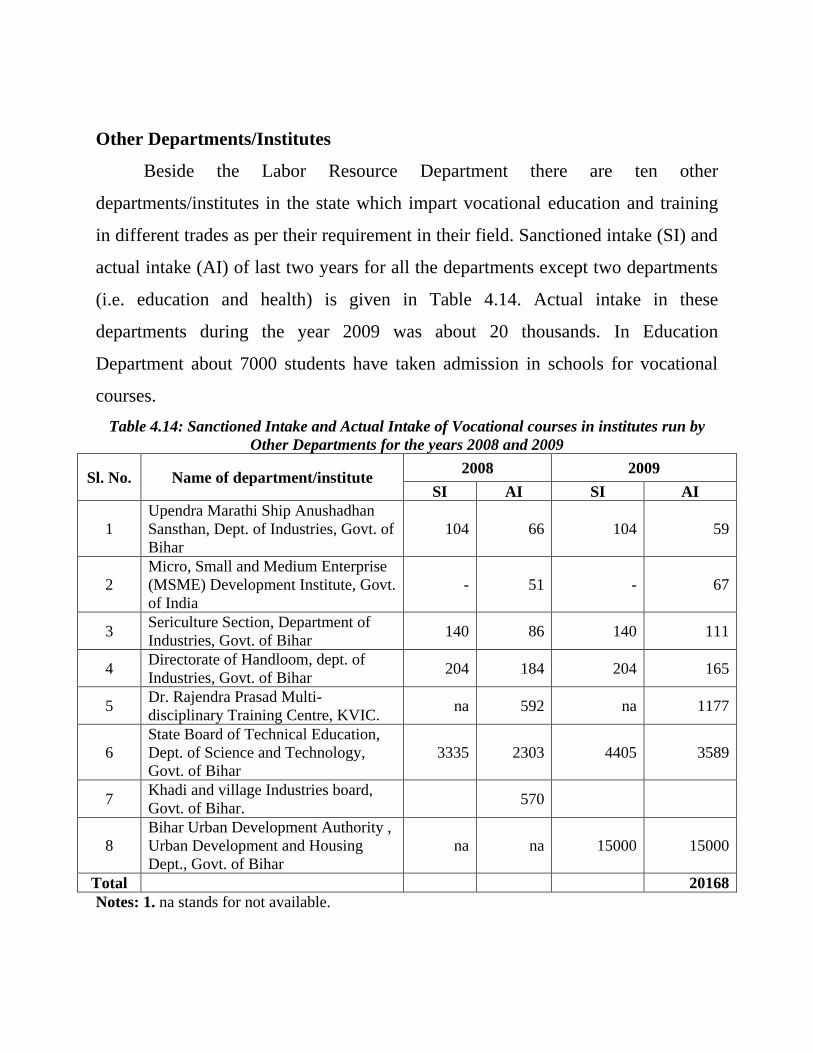
Other Departments/Institutes
Beside the Labor Resource Department there are ten other
departments/institutes in the state which impart vocational education and training
in different trades as per their requirement in their field. Sanctioned intake (SI) and
actual intake (AI) of last two years for all the departments except two departments
(i.e. education and health) is given in Table 4.14. Actual intake in these
departments during the year 2009 was about 20 thousands. In Education
Department about 7000 students have taken admission in schools for vocational
courses.
Table 4.14: Sanctioned Intake and Actual Intake of Vocational courses in institutes run by
Other Departments for the years 2008 and 2009
Sl. No. Name of department/institute 2008 2009
SI AI SI AI
1
Upendra Marathi Ship Anushadhan
Sansthan, Dept. of Industries, Govt. of
Bihar
104 66 104 59
2
Micro, Small and Medium Enterprise
(MSME) Development Institute, Govt.
of India
- 51 - 67
3 Sericulture Section, Department of
Industries, Govt. of Bihar 140 86 140 111
4 Directorate of Handloom, dept. of
Industries, Govt. of Bihar 204 184 204 165
5 Dr. Rajendra Prasad Multi-
disciplinary Training Centre, KVIC. na 592 na 1177
6
State Board of Technical Education,
Dept. of Science and Technology,
Govt. of Bihar
3335 2303 4405 3589
7 Khadi and village Industries board,
Govt. of Bihar. 570
8
Bihar Urban Development Authority ,
Urban Development and Housing
Dept., Govt. of Bihar
na na 15000 15000
Total 20168
Notes: 1. na stands for not available.
2. Data for Dr. Rajendra Prasad Multi-disciplinary Training Centre, KVIC, and State Board of
Technical Education, Department of Science and Technology, Govt. of Bihar pertains to the
years 2007 and 2008.
3. It does not include the vocational education provided in schools by the education department.
4.13 Employment Scenario
Employment is the main source of livelihood for most of the people. It is
critical to the way women and men live and view their lives. A well-nurtured and
productive labour force contributes towards a dynamic economy and equitable
society. Lack of access to employment lowers self-esteem and leads to denial of
basic needs of the individual and the family, and can lead to social instability.
As per the Employment and Unemployment surveys conducted by NSSO,
total employment of Bihar (bifurcated) by Usual Status (including subsidiary
workers) was 243.3 lakhs in the year 1993-94 which increased to 277.2 lakhs in the
year 2004-05, showing a Compound Annual Growth Rate (CAGR) of 1.19 per
cent. Share of primary sector has decreased from 80.5 per cent to 75.4 percent
during this period. Shares of Secondary and Tertiary sectors in total employment
have increased from 5.4 per cent to 8.7 per cent and 14.1 per cent to 16.0 per cent
respectively during this period (Table 4.15).
Industry wise growth of employment during 1993-94 to 2004-05 shows that
it was highest in construction industry (10.5 per cent per annum) followed by
Transport, Storage & Communication (6.5 per cent per annum), Banking &
Insurance and Real Estate, Ownership of Dwellings (6.0 per cent per annum),
Manufacturing (4.5 per cent per annum) and Trade, Hotel & Restaurants (4.2 per
cent per annum). Growth of employment in Agriculture & Animal Husbandry,
Forestry & Logging and Fisheries industry was very low at the rate 0.6 per cent per
annum as the sector has a surplus of work force and even this increase may be due
to non-employment of these workers elsewhere. Two industries namely Electricity,
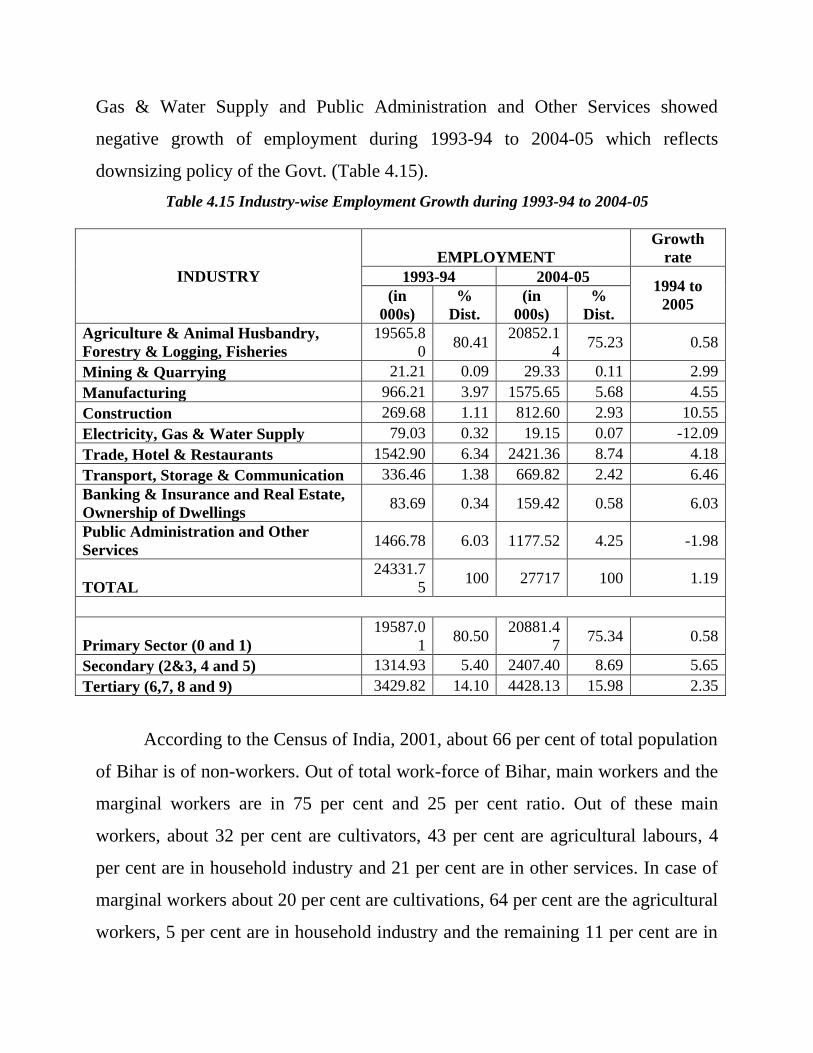
Gas & Water Supply and Public Administration and Other Services showed
negative growth of employment during 1993-94 to 2004-05 which reflects
downsizing policy of the Govt. (Table 4.15).
Table 4.15 Industry-wise Employment Growth during 1993-94 to 2004-05
INDUSTRY
EMPLOYMENT
Growth
rate
1993-94 2004-05 1994 to
2005 (in
000s)
%
Dist.
(in
000s)
%
Dist.
Agriculture & Animal Husbandry,
Forestry & Logging, Fisheries
19565.8
0 80.41
20852.1
4 75.23 0.58
Mining & Quarrying 21.21 0.09 29.33 0.11 2.99
Manufacturing 966.21 3.97 1575.65 5.68 4.55
Construction 269.68 1.11 812.60 2.93 10.55
Electricity, Gas & Water Supply 79.03 0.32 19.15 0.07 -12.09
Trade, Hotel & Restaurants 1542.90 6.34 2421.36 8.74 4.18
Transport, Storage & Communication 336.46 1.38 669.82 2.42 6.46
Banking & Insurance and Real Estate,
Ownership of Dwellings 83.69 0.34 159.42 0.58 6.03
Public Administration and Other
Services 1466.78 6.03 1177.52 4.25 -1.98
TOTAL
24331.7
5 100 27717 100 1.19
Primary Sector (0 and 1)
19587.0
1 80.50
20881.4
7 75.34 0.58
Secondary (2&3, 4 and 5) 1314.93 5.40 2407.40 8.69 5.65
Tertiary (6,7, 8 and 9) 3429.82 14.10 4428.13 15.98 2.35
According to the Census of India, 2001, about 66 per cent of total population
of Bihar is of non-workers. Out of total work-force of Bihar, main workers and the
marginal workers are in 75 per cent and 25 per cent ratio. Out of these main
workers, about 32 per cent are cultivators, 43 per cent are agricultural labours, 4
per cent are in household industry and 21 per cent are in other services. In case of
marginal workers about 20 per cent are cultivations, 64 per cent are the agricultural
workers, 5 per cent are in household industry and the remaining 11 per cent are in
other services. So, there is a large population in Bihar whose occupation is
agriculture (including main and marginal workers). The household industry
provide very less employment compared to the other sectors.
In order to link skills development with the actual productive use the steps
would be taken in the 11th
five year plan of the state by providing adequate
incentives in terms of skill and entrepreneurship development, credit facilities of
self-employment, and would encourage the forward and backward linkages to
finance, marketing and human resource management.
4.14 Health
There is a proverb, Health is Wealth. Living with good health is one of the
basic needs of human being. Good health improves the standard of living and vice
versa. Although the population provides the labour force to the country, the healthy
population provides the efficient and more productive work force. To increase the
skill sets for the economy of the Bihar, a healthy population is the pre-requisite.
4.7.1. Health Status
The health status in Bihar is not satisfactory. The maternal mortality rate
(MMR) is 371 per one lakh live births in Bihar, which is 4th
highest among states
in India. Full immunization has very low coverage in Bihar, with only 33 per cent
(National Family and Health Survey (NFHS)-III, 2005-06). Institutional deliveries
are undertaken only for 23 per cent of total deliveries, which is almost half of
national average of 41 per cent. More than 50 per cent of the girls are getting
married below the age of 18 years whereas national average is 28 per cent. Infant
mortality rate (IMR) in Bihar is higher at 58 per 1000 live births compared to
national average of 55 in 2007 (Table 4.16). The life expectancy at birth during the
year 2001-2005 in Bihar was 61.4 years which is much closer to the national
average of 63.2 years. Bihar is the only state where the life expectancy for female
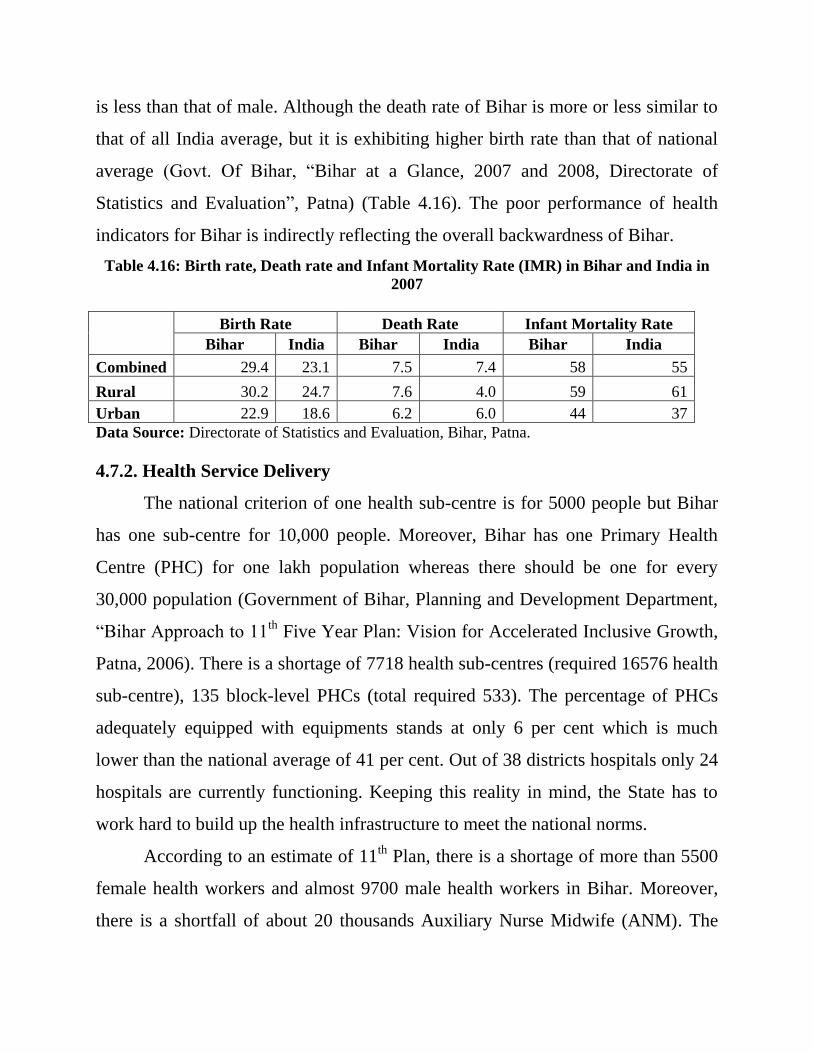
is less than that of male. Although the death rate of Bihar is more or less similar to
that of all India average, but it is exhibiting higher birth rate than that of national
average (Govt. Of Bihar, ―Bihar at a Glance, 2007 and 2008, Directorate of
Statistics and Evaluation‖, Patna) (Table 4.16). The poor performance of health
indicators for Bihar is indirectly reflecting the overall backwardness of Bihar.
Table 4.16: Birth rate, Death rate and Infant Mortality Rate (IMR) in Bihar and India in
2007
Birth Rate Death Rate Infant Mortality Rate
Bihar India Bihar India Bihar India
Combined 29.4 23.1 7.5 7.4 58 55
Rural 30.2 24.7 7.6 4.0 59 61
Urban 22.9 18.6 6.2 6.0 44 37
Data Source: Directorate of Statistics and Evaluation, Bihar, Patna.
4.7.2. Health Service Delivery
The national criterion of one health sub-centre is for 5000 people but Bihar
has one sub-centre for 10,000 people. Moreover, Bihar has one Primary Health
Centre (PHC) for one lakh population whereas there should be one for every
30,000 population (Government of Bihar, Planning and Development Department,
―Bihar Approach to 11th
Five Year Plan: Vision for Accelerated Inclusive Growth,
Patna, 2006). There is a shortage of 7718 health sub-centres (required 16576 health
sub-centre), 135 block-level PHCs (total required 533). The percentage of PHCs
adequately equipped with equipments stands at only 6 per cent which is much
lower than the national average of 41 per cent. Out of 38 districts hospitals only 24
hospitals are currently functioning. Keeping this reality in mind, the State has to
work hard to build up the health infrastructure to meet the national norms.
According to an estimate of 11th
Plan, there is a shortage of more than 5500
female health workers and almost 9700 male health workers in Bihar. Moreover,
there is a shortfall of about 20 thousands Auxiliary Nurse Midwife (ANM). The
national norm is one ANM per 2500 population. As technically skilled people are
in short supply in Bihar, an effort of skill sets development has to be made in
health sector. The state has to boost up its capacity further to provide health
services at the grass-root level by appointing approximately 75 thousands
Accredited Social Health Activists (ASHA) under National Rural Health Mission
(NRHM) (Government of Bihar, Planning and Development Department, ―Bihar
Approach to 11th
Five Year Plan: Vision for Accelerated Inclusive Growth, Patna,
2006). Comprehensive Training Policy has to be drawn to administer all the
capacity building initiatives in Health sector. An attempt has to be made during the
11th
five year plan and thereafter to train more personnel to increase the skill sets
for health sector and to operate more vocational institutes, (for Nurses and other
Paramedicals including Laboratory Technicians) using Public Private-Partnership
(PPP) mechanism.
4.15 Economy of Bihar
Bihar remains one of the least developed states of India, with a per capita
annual income of Rs. 7,928 in 2007-08 which is less than one third of India‘s
average of Rs. 24,256 at constant price of 1999-2000. This divide has become
wider during 1993-94 to 2007-08, the so called period of liberalization. While the
state‘s per capita income was around 40 per cent of national figure in 1993-94, it
got reduced to only 32.68 per cent in 2007-08. Bihar ranks at the bottom of the 18
major States in India in terms of socio-economic development.
Gross State Domestic Product (GSDP) of Bihar state (bifurcated) was Rs.
50174 crores in the year 1999-2000 at 1999-2000 prices. It increased to Rs 65909
crores in the year 2004-05 at the CAGR 5.6 per cent per annum. Growth rate of
GSDP was highest in Tertiary sector (6.25 per cent) followed by Primary sector
(5.10 per cent) and Secondary sector (4.33 per cent) (Table 4.17).
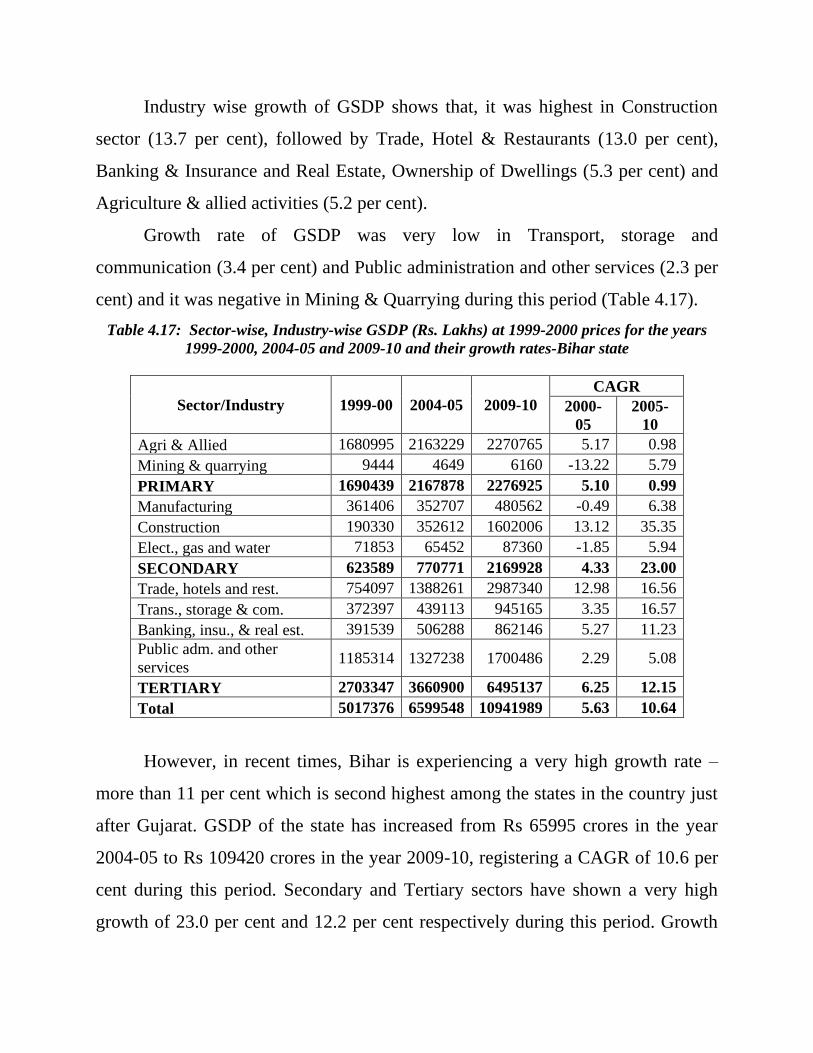
Industry wise growth of GSDP shows that, it was highest in Construction
sector (13.7 per cent), followed by Trade, Hotel & Restaurants (13.0 per cent),
Banking & Insurance and Real Estate, Ownership of Dwellings (5.3 per cent) and
Agriculture & allied activities (5.2 per cent).
Growth rate of GSDP was very low in Transport, storage and
communication (3.4 per cent) and Public administration and other services (2.3 per
cent) and it was negative in Mining & Quarrying during this period (Table 4.17).
Table 4.17: Sector-wise, Industry-wise GSDP (Rs. Lakhs) at 1999-2000 prices for the years
1999-2000, 2004-05 and 2009-10 and their growth rates-Bihar state
Sector/Industry 1999-00 2004-05 2009-10
CAGR
2000-
05
2005-
10
Agri & Allied 1680995 2163229 2270765 5.17 0.98
Mining & quarrying 9444 4649 6160 -13.22 5.79
PRIMARY 1690439 2167878 2276925 5.10 0.99
Manufacturing 361406 352707 480562 -0.49 6.38
Construction 190330 352612 1602006 13.12 35.35
Elect., gas and water 71853 65452 87360 -1.85 5.94
SECONDARY 623589 770771 2169928 4.33 23.00
Trade, hotels and rest. 754097 1388261 2987340 12.98 16.56
Trans., storage & com. 372397 439113 945165 3.35 16.57
Banking, insu., & real est. 391539 506288 862146 5.27 11.23
Public adm. and other
services 1185314 1327238 1700486 2.29 5.08
TERTIARY 2703347 3660900 6495137 6.25 12.15
Total 5017376 6599548 10941989 5.63 10.64
However, in recent times, Bihar is experiencing a very high growth rate –
more than 11 per cent which is second highest among the states in the country just
after Gujarat. GSDP of the state has increased from Rs 65995 crores in the year
2004-05 to Rs 109420 crores in the year 2009-10, registering a CAGR of 10.6 per
cent during this period. Secondary and Tertiary sectors have shown a very high
growth of 23.0 per cent and 12.2 per cent respectively during this period. Growth
of secondary sector demands adequate supply of manufacturing and repairing
skills.
Industry-wise growth of GSDP shows that except Agriculture & allied
activities all other industries at one digit level of NIC have shown a growth of
more than five per cent. It was highest in construction sector (36.0 per cent)
reflecting improvement in infrastructure like road etc. followed by Trade, Hotels
and Restaurants (16.6 per cent), Banking, insurance and real estate (11.2 per cent),
Manufacturing (6.4 per cent), Electricity, gas and water (5.9 per cent) Mining &
quarrying (5.8 per cent), and Public administration & other services (5.1 per cent).
At the same time it was very low in Agriculture & allied activities (1.0 per cent).
Some structural change over the years has also been experienced in Bihar.
Bihar is a predominantly agrarian economy with a small manufacturing hold.
While the share of agriculture has hardly declined in early years of the new
centaury from 33 per cent in 1999-00 to 32 per cent in 2004-2005 but it has
drastically come down to about 21 per cent in 2009-10 (Table 4.18). The share of
manufacturing sector has also decreased from 7 per cent in 1999-00 to 5 per cent in
2004-05 and further to about 4 per cent in 2009-10. However, the contribution of
the secondary and tertiary sectors has improved in recent times. Secondary sector
has increased from nearly 12 per cent of GSDP in 1999-00 to 20 per cent in 2009-
10 (Table 4.18). It is mainly because of the increase in the share of Construction
sector in Secondary sector. Tertiary sector has increased from 54 per cent to 59 per
cent of GSDP during this period, surpassing its share in the country as a whole.
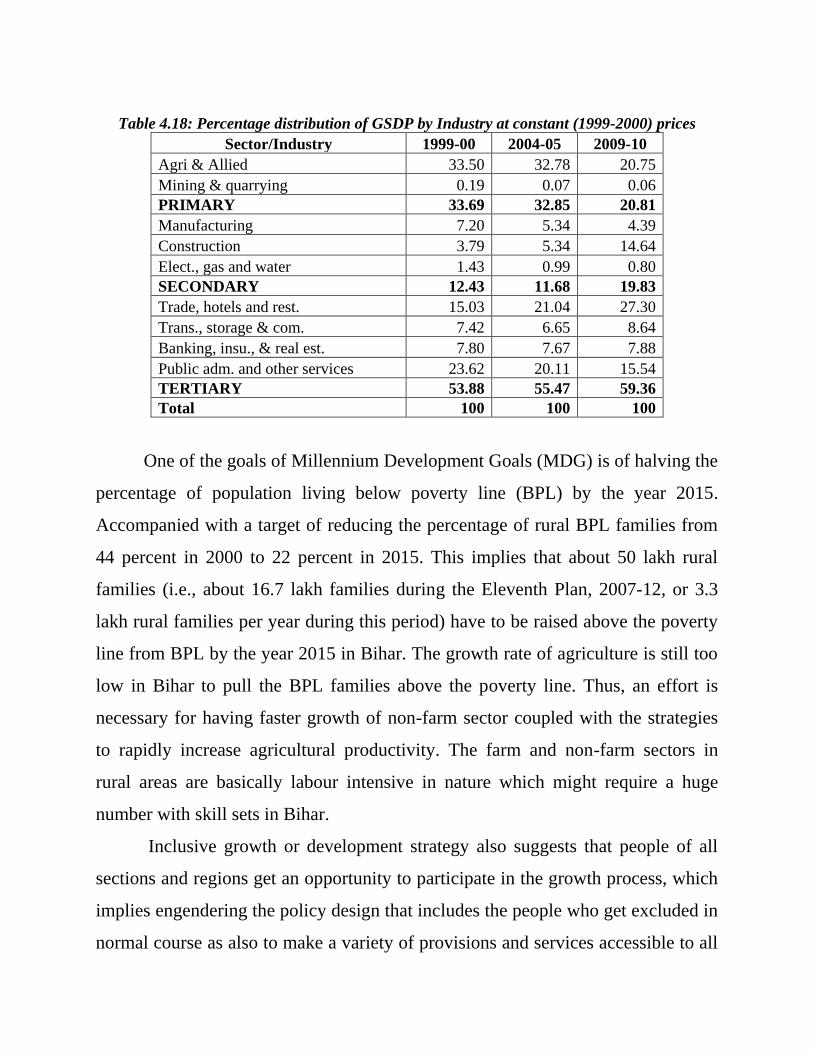
Table 4.18: Percentage distribution of GSDP by Industry at constant (1999-2000) prices
Sector/Industry 1999-00 2004-05 2009-10
Agri & Allied 33.50 32.78 20.75
Mining & quarrying 0.19 0.07 0.06
PRIMARY 33.69 32.85 20.81
Manufacturing 7.20 5.34 4.39
Construction 3.79 5.34 14.64
Elect., gas and water 1.43 0.99 0.80
SECONDARY 12.43 11.68 19.83
Trade, hotels and rest. 15.03 21.04 27.30
Trans., storage & com. 7.42 6.65 8.64
Banking, insu., & real est. 7.80 7.67 7.88
Public adm. and other services 23.62 20.11 15.54
TERTIARY 53.88 55.47 59.36
Total 100 100 100
One of the goals of Millennium Development Goals (MDG) is of halving the
percentage of population living below poverty line (BPL) by the year 2015.
Accompanied with a target of reducing the percentage of rural BPL families from
44 percent in 2000 to 22 percent in 2015. This implies that about 50 lakh rural
families (i.e., about 16.7 lakh families during the Eleventh Plan, 2007-12, or 3.3
lakh rural families per year during this period) have to be raised above the poverty
line from BPL by the year 2015 in Bihar. The growth rate of agriculture is still too
low in Bihar to pull the BPL families above the poverty line. Thus, an effort is
necessary for having faster growth of non-farm sector coupled with the strategies
to rapidly increase agricultural productivity. The farm and non-farm sectors in
rural areas are basically labour intensive in nature which might require a huge
number with skill sets in Bihar.
Inclusive growth or development strategy also suggests that people of all
sections and regions get an opportunity to participate in the growth process, which
implies engendering the policy design that includes the people who get excluded in
normal course as also to make a variety of provisions and services accessible to all
sections including those who got excluded so far (Chaubey, P.K., 2009). There are
sections and regions which have gone relatively speaking backward. While
practically all sections and all regions might have advanced in absolute terms,
growth experience has been widely different across sections / regions. Per capita
income of say Bihar, may be double in its own absolute terms, has steadily
declined from 1/3rd
to 1/5th
of that of richer state in the course of last eleven years
between 1993-94 and 2004-05. Likewise the share of poor persons within the states
of Bihar has increased much beyond the increase in their population share. The
rural-urban divide is as well on increase: with more than 50 per cent of GDP and a
little more than 25 per cent population in urban areas enjoying per capita income
2.8 times of their rural counterpart.
Although the state is almost at the lowest step of the economic development,
a process of rapid growth based on Bihar's incredible potential has been set in
action during the last few years in the State of Bihar.
4.16 Industry in Bihar
Industrial development of any under-developed economy is necessary when
its agricultural sector becomes stagnant. The population pressure on agricultural
land is very high in Bihar and in addition to that the productivity in agriculture
sector is very low compared to all India average. The industrial development with
agricultural reform can break the ice of the stagnant economy like Bihar through
the backward and forward linkages.
Importance of inclusive growth in industrial sector of Bihar has been
highlighted by interpreting the data of latest Economic Census conducted in the
year 2005. This census has covered all establishments of all economic activities
except agriculture proper viz. crop production and plantation. If we now compare
the position of Bihar with respect to India in terms of both number of
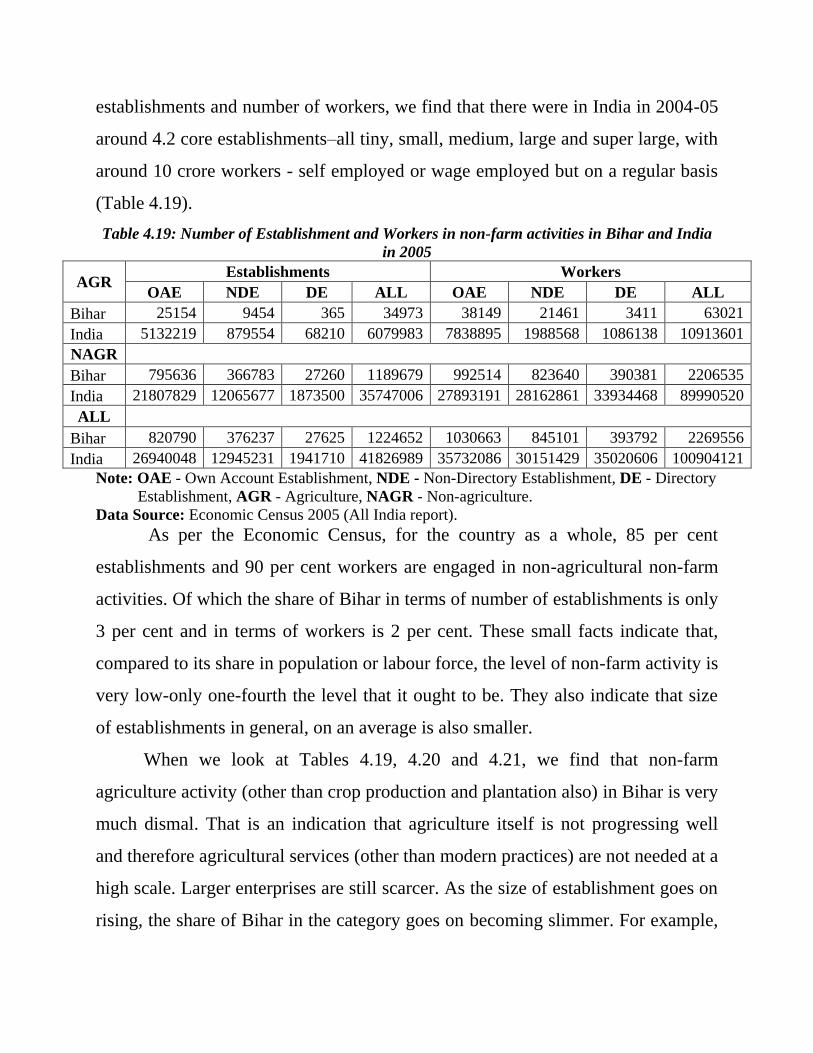
establishments and number of workers, we find that there were in India in 2004-05
around 4.2 core establishments–all tiny, small, medium, large and super large, with
around 10 crore workers - self employed or wage employed but on a regular basis
(Table 4.19).
Table 4.19: Number of Establishment and Workers in non-farm activities in Bihar and India
in 2005
AGR Establishments Workers
OAE NDE DE ALL OAE NDE DE ALL
Bihar 25154 9454 365 34973 38149 21461 3411 63021
India 5132219 879554 68210 6079983 7838895 1988568 1086138 10913601
NAGR
Bihar 795636 366783 27260 1189679 992514 823640 390381 2206535
India 21807829 12065677 1873500 35747006 27893191 28162861 33934468 89990520
ALL
Bihar 820790 376237 27625 1224652 1030663 845101 393792 2269556
India 26940048 12945231 1941710 41826989 35732086 30151429 35020606 100904121
Note: OAE - Own Account Establishment, NDE - Non-Directory Establishment, DE - Directory
Establishment, AGR - Agriculture, NAGR - Non-agriculture.
Data Source: Economic Census 2005 (All India report).
As per the Economic Census, for the country as a whole, 85 per cent
establishments and 90 per cent workers are engaged in non-agricultural non-farm
activities. Of which the share of Bihar in terms of number of establishments is only
3 per cent and in terms of workers is 2 per cent. These small facts indicate that,
compared to its share in population or labour force, the level of non-farm activity is
very low-only one-fourth the level that it ought to be. They also indicate that size
of establishments in general, on an average is also smaller.
When we look at Tables 4.19, 4.20 and 4.21, we find that non-farm
agriculture activity (other than crop production and plantation also) in Bihar is very
much dismal. That is an indication that agriculture itself is not progressing well
and therefore agricultural services (other than modern practices) are not needed at a
high scale. Larger enterprises are still scarcer. As the size of establishment goes on
rising, the share of Bihar in the category goes on becoming slimmer. For example,
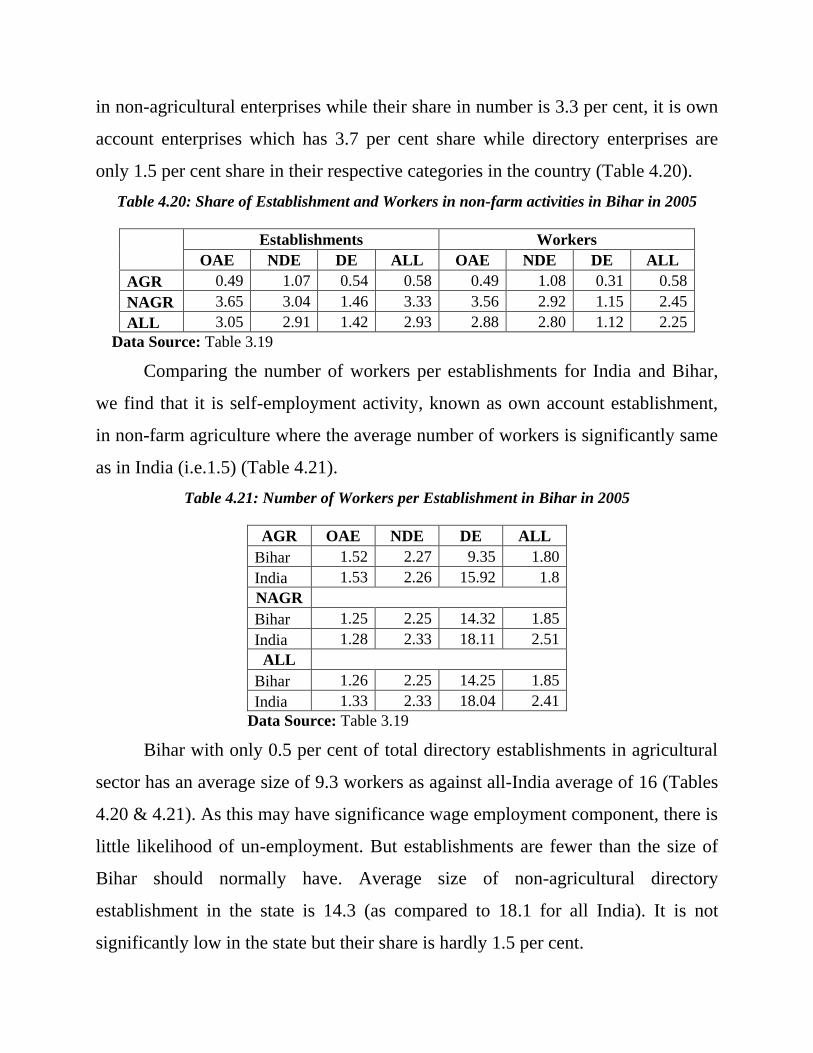
in non-agricultural enterprises while their share in number is 3.3 per cent, it is own
account enterprises which has 3.7 per cent share while directory enterprises are
only 1.5 per cent share in their respective categories in the country (Table 4.20).
Table 4.20: Share of Establishment and Workers in non-farm activities in Bihar in 2005
Establishments Workers
OAE NDE DE ALL OAE NDE DE ALL
AGR 0.49 1.07 0.54 0.58 0.49 1.08 0.31 0.58
NAGR 3.65 3.04 1.46 3.33 3.56 2.92 1.15 2.45
ALL 3.05 2.91 1.42 2.93 2.88 2.80 1.12 2.25
Data Source: Table 3.19
Comparing the number of workers per establishments for India and Bihar,
we find that it is self-employment activity, known as own account establishment,
in non-farm agriculture where the average number of workers is significantly same
as in India (i.e.1.5) (Table 4.21).
Table 4.21: Number of Workers per Establishment in Bihar in 2005
AGR OAE NDE DE ALL
Bihar 1.52 2.27 9.35 1.80
India 1.53 2.26 15.92 1.8
NAGR
Bihar 1.25 2.25 14.32 1.85
India 1.28 2.33 18.11 2.51
ALL
Bihar 1.26 2.25 14.25 1.85
India 1.33 2.33 18.04 2.41
Data Source: Table 3.19
Bihar with only 0.5 per cent of total directory establishments in agricultural
sector has an average size of 9.3 workers as against all-India average of 16 (Tables
4.20 & 4.21). As this may have significance wage employment component, there is
little likelihood of un-employment. But establishments are fewer than the size of
Bihar should normally have. Average size of non-agricultural directory
establishment in the state is 14.3 (as compared to 18.1 for all India). It is not
significantly low in the state but their share is hardly 1.5 per cent.
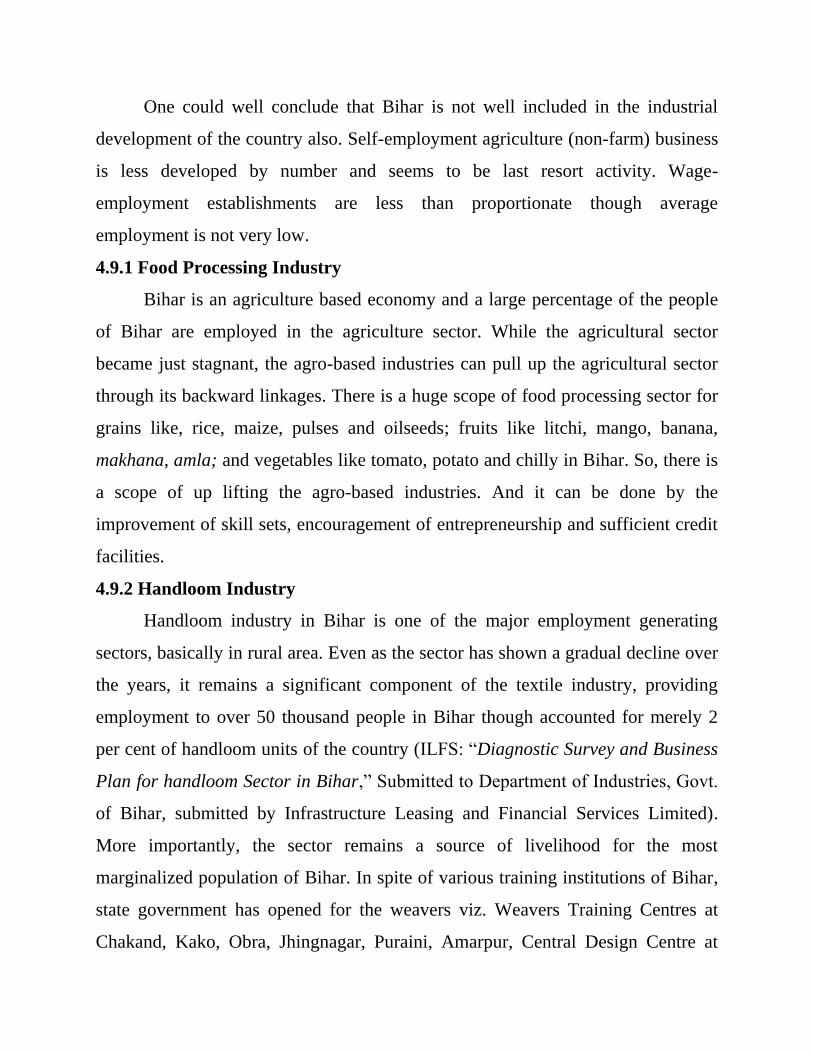
One could well conclude that Bihar is not well included in the industrial
development of the country also. Self-employment agriculture (non-farm) business
is less developed by number and seems to be last resort activity. Wage-
employment establishments are less than proportionate though average
employment is not very low.
4.9.1 Food Processing Industry
Bihar is an agriculture based economy and a large percentage of the people
of Bihar are employed in the agriculture sector. While the agricultural sector
became just stagnant, the agro-based industries can pull up the agricultural sector
through its backward linkages. There is a huge scope of food processing sector for
grains like, rice, maize, pulses and oilseeds; fruits like litchi, mango, banana,
makhana, amla; and vegetables like tomato, potato and chilly in Bihar. So, there is
a scope of up lifting the agro-based industries. And it can be done by the
improvement of skill sets, encouragement of entrepreneurship and sufficient credit
facilities.
4.9.2 Handloom Industry
Handloom industry in Bihar is one of the major employment generating
sectors, basically in rural area. Even as the sector has shown a gradual decline over
the years, it remains a significant component of the textile industry, providing
employment to over 50 thousand people in Bihar though accounted for merely 2
per cent of handloom units of the country (ILFS: ―Diagnostic Survey and Business
Plan for handloom Sector in Bihar,‖ Submitted to Department of Industries, Govt.
of Bihar, submitted by Infrastructure Leasing and Financial Services Limited).
More importantly, the sector remains a source of livelihood for the most
marginalized population of Bihar. In spite of various training institutions of Bihar,
state government has opened for the weavers viz. Weavers Training Centres at
Chakand, Kako, Obra, Jhingnagar, Puraini, Amarpur, Central Design Centre at
Rajendra Nagar, Polyster & Silk Vastra Training Cum Production Centre at
Bhagalpur, etc., most of weavers have not been able to take advantage of them. To
help them take advantage, the training institutes should be properly managed, well
equipped. Hiring ‗quality trainers‘ and development of infrastructure is needed, so
that they can produce skill sets for the handloom industry. However, it is said that
progress is slow because of severe lack of resources with state government
organizations, both in terms of physical and financial resources.
4.9.3 Leather Industry in Bihar
The leather and allied industries play a significant role in terms of providing
employment to the large number of artisans in India and also earning foreign
exchange through exports. However, the leather industry of Bihar has failed to
grab the opportunity to make a gain from it, although Bihar is known for very good
quality of cow hides, buffalo calf skins and goat skins – the basic raw material for
the leather industry. Though Bihar has considerable share of goat and cattle
population of the country the tanning industry of Bihar is functioning with a few
working tanneries in Muzaffarpur and another BATA tannery at Mokhamaghat,
therefore most of the raw material is drained to the tanneries hubs in Kolkata,
Kanpur and Chennai (Govt. of Bihar, Industries Department, ―A Presentation on
Leather Industries in Bihar and Its potential‖). There is a sufficient local demand
for footwear and other leather goods within Bihar. At present, a large quantity of
footwear is being brought into Bihar from places like Kanpur, Kolkata and Agra.
The leather tanning industry in Bihar consists of three important segments (a) units
established under Bihar Leather Development Corporation (BLDC) and its sister
concern viz. Bihar Finished Leather Ltd. (b) a few private tanneries working at
Muzaffarpur and (c) BATA tannery at Mokhamaghat (Govt. of Bihar, Industries
Department, ―Leather and Allied Industries in Bihar – An Overview and
Prospects‖). There are other artisanal units (including about 1000 household or
cottage footwear units) located in all urban and semi-urban centers, namely
Muzaffarpur, Bettiah, Danapur, Patna etc, employing about 50 thousand footwear
artisans in Bihar. Now these days, all these tanneries and footwear artisanal units
are suffering from the lack of necessary financial support for working capital needs
and skill up gradation. Although, Bihar has large number of footwear workers, but
most of them have migrated to centers like Kolkata, Mumbai etc due to the lack of
job opportunity in the leather industry in Bihar. However, there is enough scope to
develop leather and leather based industries in Bihar. Only the raw material can‘t
show the magic, Bihar needs an improvement of technical skill of the leather
workers. Only the skill sets development along with sufficient investment can
make Bihar‘s leather industry profitable.
4.17 Infrastructural Development
Sound Infrastructure is viewed as the basement of overall development of an
economy. Improved infrastructure creates a favorable environment for the
investment in industrial sector. To create gainful employment and to increase the
skill sets, it is necessary to create Bihar as another destination of investment in
India through the proper infrastructural facilities.
4.10.1. Transportation
Road connectivity which is one of the basic infrastructural requirements for
development is in miserable shape in Bihar. It is poorly developed and is in need of
major revamp. Bihar has 3734 km of national highways, about 4 thousand km of
state highways and about 8200 km of major district roads in 2009 (Govt. of Bihar,
Road Construction Department, ―Road Infrastructure: An Evolving
Transformation‖). As per 2001–02 data, road density per 1000 sq m is 80.7 km in
Bihar, which is higher than average road density for the country as whole (74.7
km) but lagging the states like Kerala (388.2 km), Orissa (169 km). However, a
World Bank estimate shows that roads do not still connect 70 per cent of inhabited
areas. Railways have a good network in Bihar and as per 2004–05 statistics,
railway line density per 1,000 sq m was 35.88 km as against 19.3 km for India as a
whole. Only two states WB & Punjab do better than Bihar (The states of West
Bengal (43.43 km) and Punjab (41.66 km) had higher railway line density than
Bihar)
4.10.2. Power generation
The rapid acceleration of power generation capacity should be an earnest
priority for the state government and a crucial pre-requisite to achieve its socio-
economic growth targets during the Eleventh Plan (2007-12). Power generation
and availability rates both are the lowest in Bihar compared to all India average.
The average per capita consumption of electricity in Bihar was only around 76
kWh in 2005 (Government of Bihar, Planning and Development Department,
―Bihar Approach to 11th
Five Year Plan: Vision for Accelerated Inclusive
Growth‖, Patna, 2006) which was only 1/8th
of all India‘s annual per capita
electricity consumption level of 612. One of the aims of the National Electricity
Policy is to increase the average annual per capita consumption to 1000 units by
2012. Both the electricity generation and the electricity purchased have decreased
substantially during the period of 2000 to 2005 (Table 4.22) (Govt. of Bihar, Bihar
State Electricity Board, Patna). The electricity system in Bihar covers only around
53 per cent of total villages and just over 10 per cent of the households. However,
it is expected that the coverage should have increased as Rajiv Gandhi Grameen
Vidyutikaran Yojana (RGGVY) under Central government grants amounting to 90
to 100 per cent, had targeted to electrify all villages by 2009.
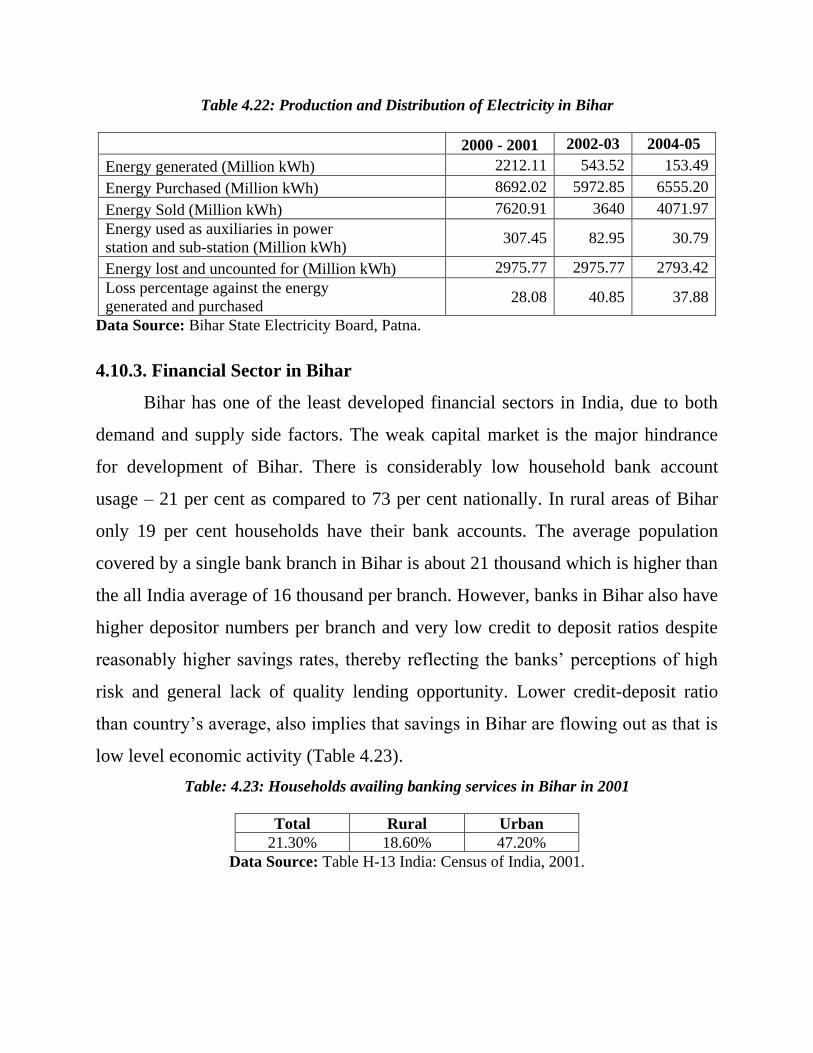
Table 4.22: Production and Distribution of Electricity in Bihar
2000 - 2001 2002-03 2004-05
Energy generated (Million kWh) 2212.11 543.52 153.49
Energy Purchased (Million kWh) 8692.02 5972.85 6555.20
Energy Sold (Million kWh) 7620.91 3640 4071.97
Energy used as auxiliaries in power
station and sub-station (Million kWh) 307.45 82.95 30.79
Energy lost and uncounted for (Million kWh) 2975.77 2975.77 2793.42
Loss percentage against the energy
generated and purchased 28.08 40.85 37.88
Data Source: Bihar State Electricity Board, Patna.
4.10.3. Financial Sector in Bihar
Bihar has one of the least developed financial sectors in India, due to both
demand and supply side factors. The weak capital market is the major hindrance
for development of Bihar. There is considerably low household bank account
usage – 21 per cent as compared to 73 per cent nationally. In rural areas of Bihar
only 19 per cent households have their bank accounts. The average population
covered by a single bank branch in Bihar is about 21 thousand which is higher than
the all India average of 16 thousand per branch. However, banks in Bihar also have
higher depositor numbers per branch and very low credit to deposit ratios despite
reasonably higher savings rates, thereby reflecting the banks‘ perceptions of high
risk and general lack of quality lending opportunity. Lower credit-deposit ratio
than country‘s average, also implies that savings in Bihar are flowing out as that is
low level economic activity (Table 4.23).
Table: 4.23: Households availing banking services in Bihar in 2001
Total Rural Urban
21.30% 18.60% 47.20%
Data Source: Table H-13 India: Census of India, 2001.
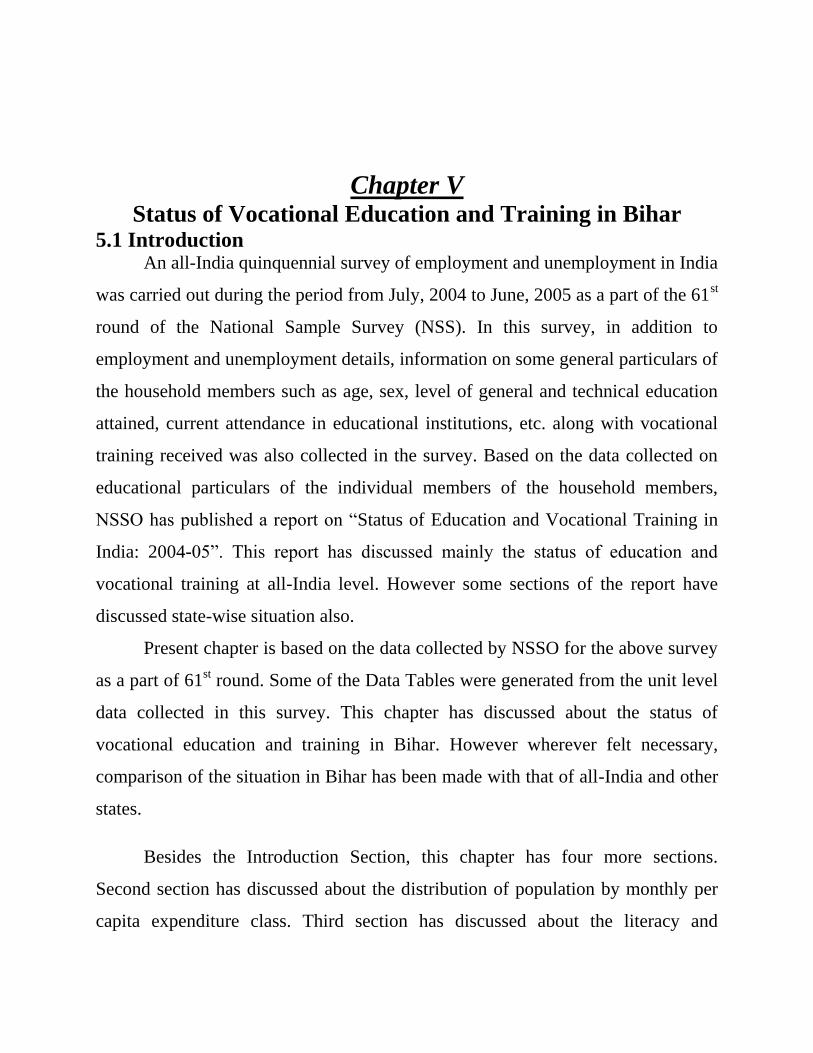
Chapter V Status of Vocational Education and Training in Bihar
5.1 Introduction An all-India quinquennial survey of employment and unemployment in India
was carried out during the period from July, 2004 to June, 2005 as a part of the 61st
round of the National Sample Survey (NSS). In this survey, in addition to
employment and unemployment details, information on some general particulars of
the household members such as age, sex, level of general and technical education
attained, current attendance in educational institutions, etc. along with vocational
training received was also collected in the survey. Based on the data collected on
educational particulars of the individual members of the household members,
NSSO has published a report on ―Status of Education and Vocational Training in
India: 2004-05‖. This report has discussed mainly the status of education and
vocational training at all-India level. However some sections of the report have
discussed state-wise situation also.
Present chapter is based on the data collected by NSSO for the above survey
as a part of 61st round. Some of the Data Tables were generated from the unit level
data collected in this survey. This chapter has discussed about the status of
vocational education and training in Bihar. However wherever felt necessary,
comparison of the situation in Bihar has been made with that of all-India and other
states.
Besides the Introduction Section, this chapter has four more sections.
Second section has discussed about the distribution of population by monthly per
capita expenditure class. Third section has discussed about the literacy and
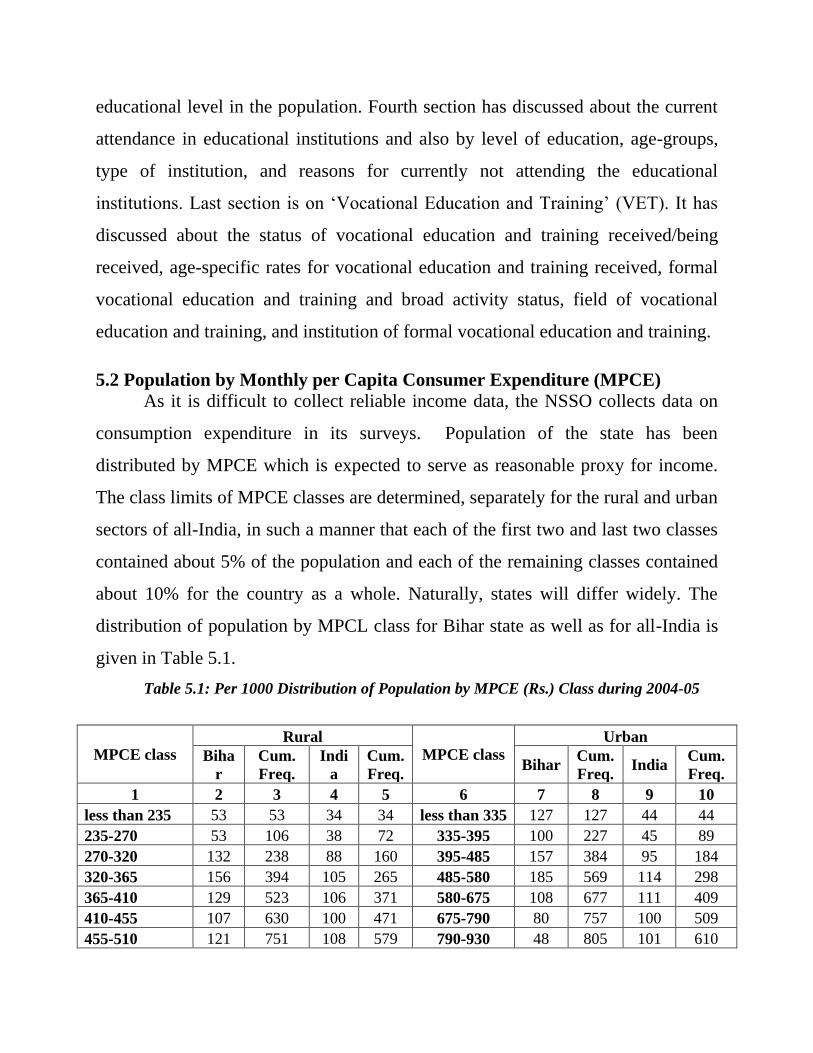
educational level in the population. Fourth section has discussed about the current
attendance in educational institutions and also by level of education, age-groups,
type of institution, and reasons for currently not attending the educational
institutions. Last section is on ‗Vocational Education and Training‘ (VET). It has
discussed about the status of vocational education and training received/being
received, age-specific rates for vocational education and training received, formal
vocational education and training and broad activity status, field of vocational
education and training, and institution of formal vocational education and training.
5.2 Population by Monthly per Capita Consumer Expenditure (MPCE)
As it is difficult to collect reliable income data, the NSSO collects data on
consumption expenditure in its surveys. Population of the state has been
distributed by MPCE which is expected to serve as reasonable proxy for income.
The class limits of MPCE classes are determined, separately for the rural and urban
sectors of all-India, in such a manner that each of the first two and last two classes
contained about 5% of the population and each of the remaining classes contained
about 10% for the country as a whole. Naturally, states will differ widely. The
distribution of population by MPCL class for Bihar state as well as for all-India is
given in Table 5.1.
Table 5.1: Per 1000 Distribution of Population by MPCE (Rs.) Class during 2004-05
MPCE class
Rural
MPCE class
Urban
Biha
r
Cum.
Freq.
Indi
a
Cum.
Freq. Bihar
Cum.
Freq. India
Cum.
Freq.
1 2 3 4 5 6 7 8 9 10
less than 235 53 53 34 34 less than 335 127 127 44 44
235-270 53 106 38 72 335-395 100 227 45 89
270-320 132 238 88 160 395-485 157 384 95 184
320-365 156 394 105 265 485-580 185 569 114 298
365-410 129 523 106 371 580-675 108 677 111 409
410-455 107 630 100 471 675-790 80 757 100 509
455-510 121 751 108 579 790-930 48 805 101 610
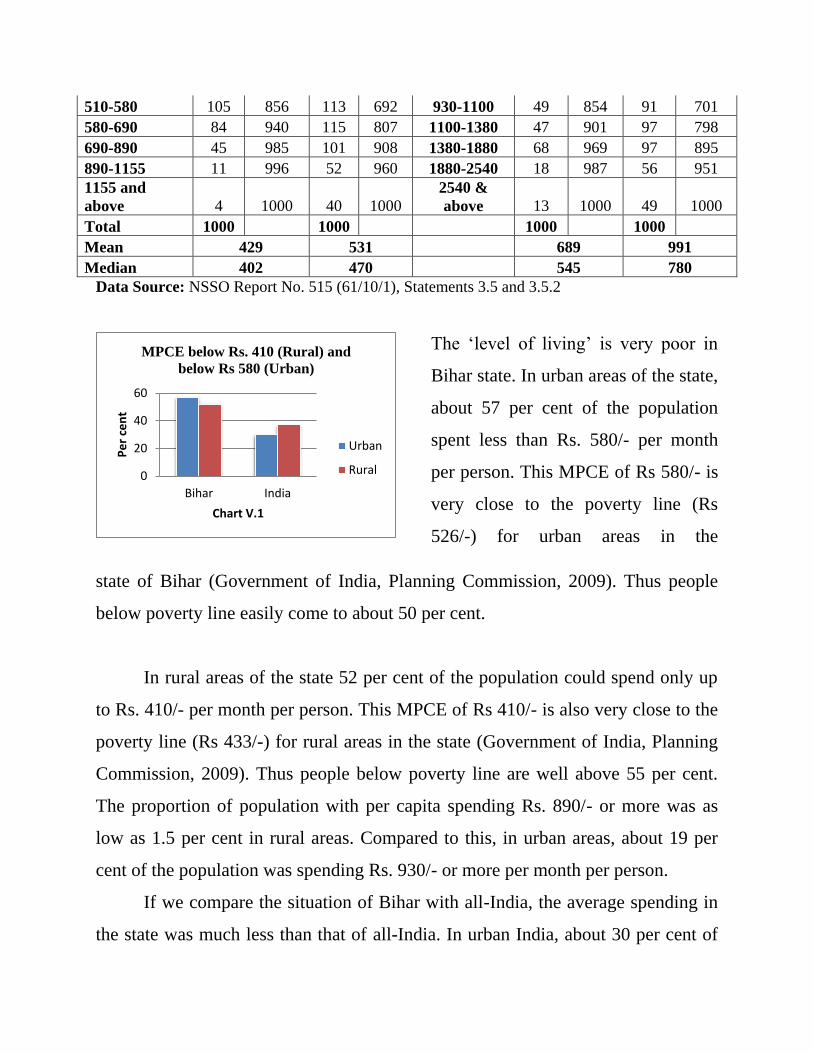
510-580 105 856 113 692 930-1100 49 854 91 701
580-690 84 940 115 807 1100-1380 47 901 97 798
690-890 45 985 101 908 1380-1880 68 969 97 895
890-1155 11 996 52 960 1880-2540 18 987 56 951
1155 and
above 4 1000 40 1000
2540 &
above 13 1000 49 1000
Total 1000 1000 1000 1000
Mean 429 531 689 991
Median 402 470 545 780
Data Source: NSSO Report No. 515 (61/10/1), Statements 3.5 and 3.5.2
The ‗level of living‘ is very poor in
Bihar state. In urban areas of the state,
about 57 per cent of the population
spent less than Rs. 580/- per month
per person. This MPCE of Rs 580/- is
very close to the poverty line (Rs
526/-) for urban areas in the
state of Bihar (Government of India, Planning Commission, 2009). Thus people
below poverty line easily come to about 50 per cent.
In rural areas of the state 52 per cent of the population could spend only up
to Rs. 410/- per month per person. This MPCE of Rs 410/- is also very close to the
poverty line (Rs 433/-) for rural areas in the state (Government of India, Planning
Commission, 2009). Thus people below poverty line are well above 55 per cent.
The proportion of population with per capita spending Rs. 890/- or more was as
low as 1.5 per cent in rural areas. Compared to this, in urban areas, about 19 per
cent of the population was spending Rs. 930/- or more per month per person.
If we compare the situation of Bihar with all-India, the average spending in
the state was much less than that of all-India. In urban India, about 30 per cent of
0
20
40
60
Bihar India
Pe
r ce
nt
Chart V.1
MPCE below Rs. 410 (Rural) and
below Rs 580 (Urban)
Urban
Rural
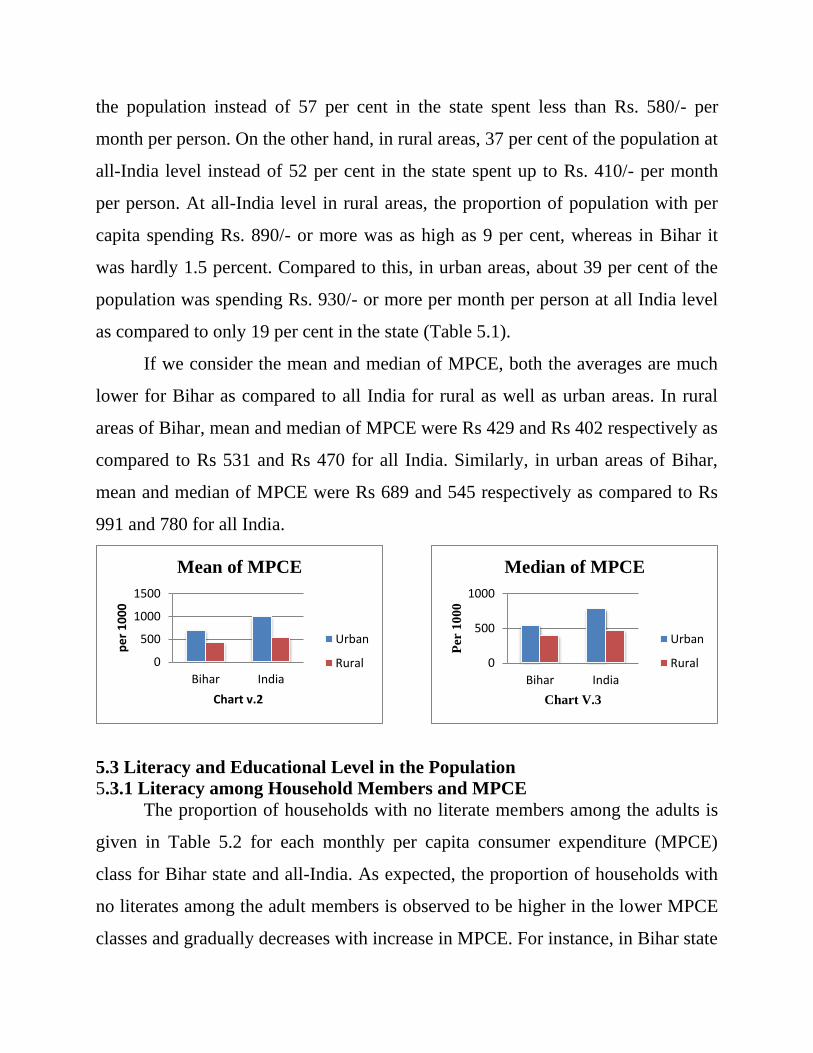
the population instead of 57 per cent in the state spent less than Rs. 580/- per
month per person. On the other hand, in rural areas, 37 per cent of the population at
all-India level instead of 52 per cent in the state spent up to Rs. 410/- per month
per person. At all-India level in rural areas, the proportion of population with per
capita spending Rs. 890/- or more was as high as 9 per cent, whereas in Bihar it
was hardly 1.5 percent. Compared to this, in urban areas, about 39 per cent of the
population was spending Rs. 930/- or more per month per person at all India level
as compared to only 19 per cent in the state (Table 5.1).
If we consider the mean and median of MPCE, both the averages are much
lower for Bihar as compared to all India for rural as well as urban areas. In rural
areas of Bihar, mean and median of MPCE were Rs 429 and Rs 402 respectively as
compared to Rs 531 and Rs 470 for all India. Similarly, in urban areas of Bihar,
mean and median of MPCE were Rs 689 and 545 respectively as compared to Rs
991 and 780 for all India.
5.3 Literacy and Educational Level in the Population
5.3.1 Literacy among Household Members and MPCE
The proportion of households with no literate members among the adults is
given in Table 5.2 for each monthly per capita consumer expenditure (MPCE)
class for Bihar state and all-India. As expected, the proportion of households with
no literates among the adult members is observed to be higher in the lower MPCE
classes and gradually decreases with increase in MPCE. For instance, in Bihar state
0
500
1000
1500
Bihar India
pe
r 1
00
0
Chart v.2
Mean of MPCE
Urban
Rural 0
500
1000
Bihar India
Per
10
00
Chart V.3
Median of MPCE
Urban
Rural
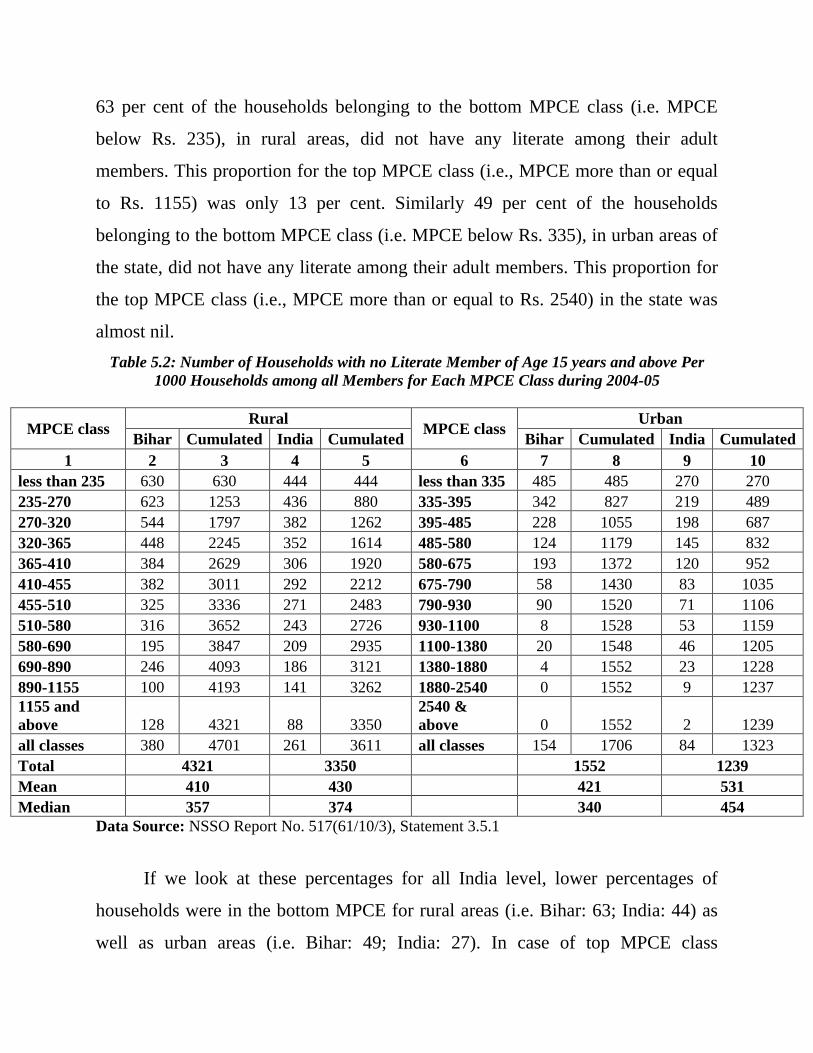
63 per cent of the households belonging to the bottom MPCE class (i.e. MPCE
below Rs. 235), in rural areas, did not have any literate among their adult
members. This proportion for the top MPCE class (i.e., MPCE more than or equal
to Rs. 1155) was only 13 per cent. Similarly 49 per cent of the households
belonging to the bottom MPCE class (i.e. MPCE below Rs. 335), in urban areas of
the state, did not have any literate among their adult members. This proportion for
the top MPCE class (i.e., MPCE more than or equal to Rs. 2540) in the state was
almost nil.
Table 5.2: Number of Households with no Literate Member of Age 15 years and above Per
1000 Households among all Members for Each MPCE Class during 2004-05
MPCE class Rural
MPCE class Urban
Bihar Cumulated India Cumulated Bihar Cumulated India Cumulated
1 2 3 4 5 6 7 8 9 10
less than 235 630 630 444 444 less than 335 485 485 270 270
235-270 623 1253 436 880 335-395 342 827 219 489
270-320 544 1797 382 1262 395-485 228 1055 198 687
320-365 448 2245 352 1614 485-580 124 1179 145 832
365-410 384 2629 306 1920 580-675 193 1372 120 952
410-455 382 3011 292 2212 675-790 58 1430 83 1035
455-510 325 3336 271 2483 790-930 90 1520 71 1106
510-580 316 3652 243 2726 930-1100 8 1528 53 1159
580-690 195 3847 209 2935 1100-1380 20 1548 46 1205
690-890 246 4093 186 3121 1380-1880 4 1552 23 1228
890-1155 100 4193 141 3262 1880-2540 0 1552 9 1237
1155 and
above 128 4321 88 3350
2540 &
above 0 1552 2 1239
all classes 380 4701 261 3611 all classes 154 1706 84 1323
Total 4321 3350 1552 1239
Mean 410 430 421 531
Median 357 374 340 454
Data Source: NSSO Report No. 517(61/10/3), Statement 3.5.1
If we look at these percentages for all India level, lower percentages of
households were in the bottom MPCE for rural areas (i.e. Bihar: 63; India: 44) as
well as urban areas (i.e. Bihar: 49; India: 27). In case of top MPCE class

percentages for all India were higher in comparison to the state in urban areas (i.e.
Bihar: 0; India: 2), but these were lower in rural areas (i.e. Bihar: 13; India: 9).
If we compare the mean and median of MPCE, these are also much lower
for Bihar compared to all India for rural as well as for urban areas. This shows that
average number of households with no literate are have a low level of income in
Bihar as compared to all India.
5.3.2 Literacy and Educational Level
In the survey, the general educational level of the household members was
determined considering the highest level of education (i.e. general, technical and
vocational education & training) successfully completed. The level of general
education is categorized in seven groups: not literate, literate & up to primary,
middle, secondary, higher secondary, diploma/certificate, graduate and above. The
general educational level was recorded as ‗diploma/certificate‘ for those who
completed diploma or certificate course that was below graduation level.
Diploma/certificate courses, which were of graduation level or above, were
classified under the respective class of general education (i.e. graduate and above).
Table 5.3 presents the distribution of the persons of age 15 years and above by
level of general education separately for each sex and sector for the Bihar state and
all-India. Literates with general educational level secondary and above including
diploma/certificate course have been considered to be educated.
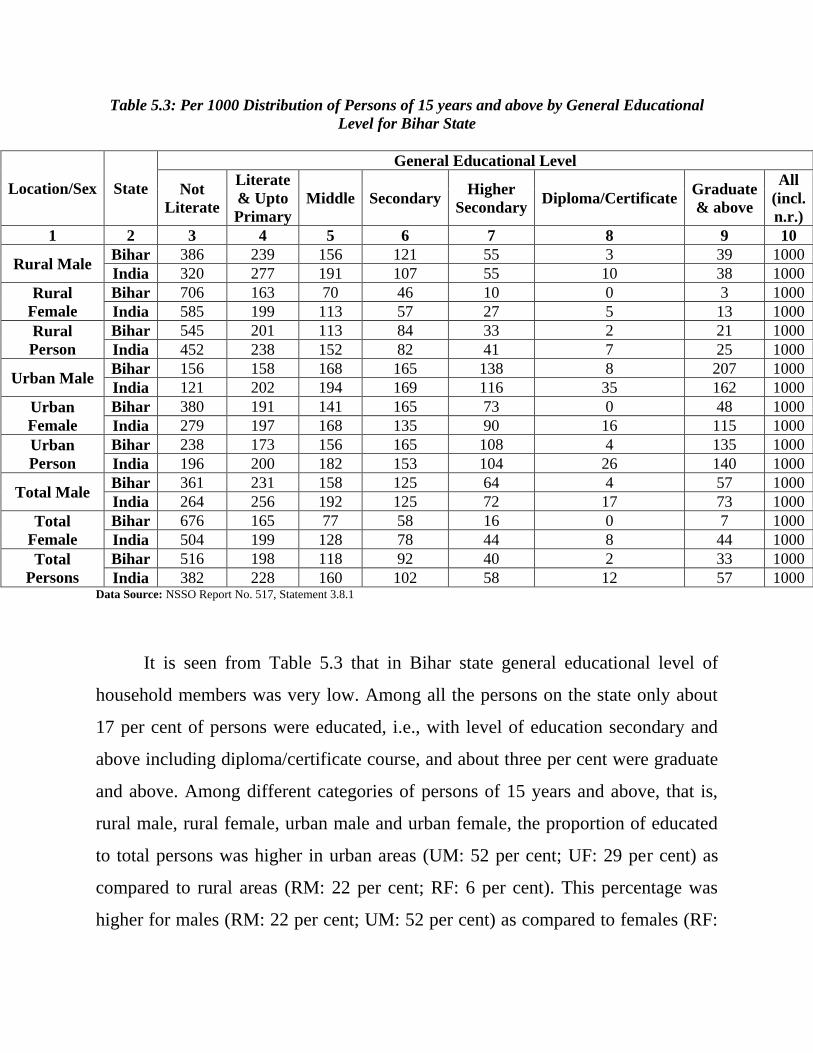
Table 5.3: Per 1000 Distribution of Persons of 15 years and above by General Educational
Level for Bihar State
Location/Sex State
General Educational Level
Not
Literate
Literate
& Upto
Primary
Middle Secondary Higher
Secondary Diploma/Certificate
Graduate
& above
All
(incl.
n.r.)
1 2 3 4 5 6 7 8 9 10
Rural Male Bihar 386 239 156 121 55 3 39 1000
India 320 277 191 107 55 10 38 1000
Rural
Female
Bihar 706 163 70 46 10 0 3 1000
India 585 199 113 57 27 5 13 1000
Rural
Person
Bihar 545 201 113 84 33 2 21 1000
India 452 238 152 82 41 7 25 1000
Urban Male Bihar 156 158 168 165 138 8 207 1000
India 121 202 194 169 116 35 162 1000
Urban
Female
Bihar 380 191 141 165 73 0 48 1000
India 279 197 168 135 90 16 115 1000
Urban
Person
Bihar 238 173 156 165 108 4 135 1000
India 196 200 182 153 104 26 140 1000
Total Male Bihar 361 231 158 125 64 4 57 1000
India 264 256 192 125 72 17 73 1000
Total
Female
Bihar 676 165 77 58 16 0 7 1000
India 504 199 128 78 44 8 44 1000
Total
Persons
Bihar 516 198 118 92 40 2 33 1000
India 382 228 160 102 58 12 57 1000 Data Source: NSSO Report No. 517, Statement 3.8.1
It is seen from Table 5.3 that in Bihar state general educational level of
household members was very low. Among all the persons on the state only about
17 per cent of persons were educated, i.e., with level of education secondary and
above including diploma/certificate course, and about three per cent were graduate
and above. Among different categories of persons of 15 years and above, that is,
rural male, rural female, urban male and urban female, the proportion of educated
to total persons was higher in urban areas (UM: 52 per cent; UF: 29 per cent) as
compared to rural areas (RM: 22 per cent; RF: 6 per cent). This percentage was
higher for males (RM: 22 per cent; UM: 52 per cent) as compared to females (RF:
6 per cent; UF: 29 per cent). Interestingly, this percentage of rural males (22 per
cent) was even less than those of urban females (29 per cent). Similar pattern was
observed for the proportion of persons with level of education at graduate and
above to the total persons of age 15 years and above.
If we compare the percentage of person who were not literate, it was much
higher for Bihar (52 per cent) as compared to all India (38 per cent). At all other
levels of education (viz. literate & upto primary, middle, secondary, higher
secondary, diploma/certificate, and graduate and above) percentage of persons with
different educational levels to total persons in the state was much low in
comparison to all India.
If we compare general educational level of Bihar state with other 15 major
states of India its rank is very poor. In case of ―not literate‖ and
―Diploma/Certificate below graduate level‖ its rank was 15. This means in all other
states percentage of ―not literate‖ to total persons was lower in comparison to
Bihar (because not literate is not a good indicator) but percentage of persons with
―Diploma/Certificate below graduate level‖ was higher in comparison to Bihar
(because diploma/certificate below graduate level is a better indicator). In case of
―higher secondary‖ and ―graduate and above‖ its rank was 14. In other words for
these two levels of education percentage of persons was lower in the state in
comparison to 13 other states but it was higher in comparison to only one state.
Similarly in case of ―literate & up to primary‖, ―middle‖ and ―secondary‖ its rank
was 13, 12 and 8 respectively.
5.4 Current Attendance in Educational Institutions
5.4.1 Current Attendance and level of Education
The current attendance status refers to whether a person was attending any
educational institution on the date of survey and the information was collected for
each individual of age-group 5-29 years from the respondent household. It may
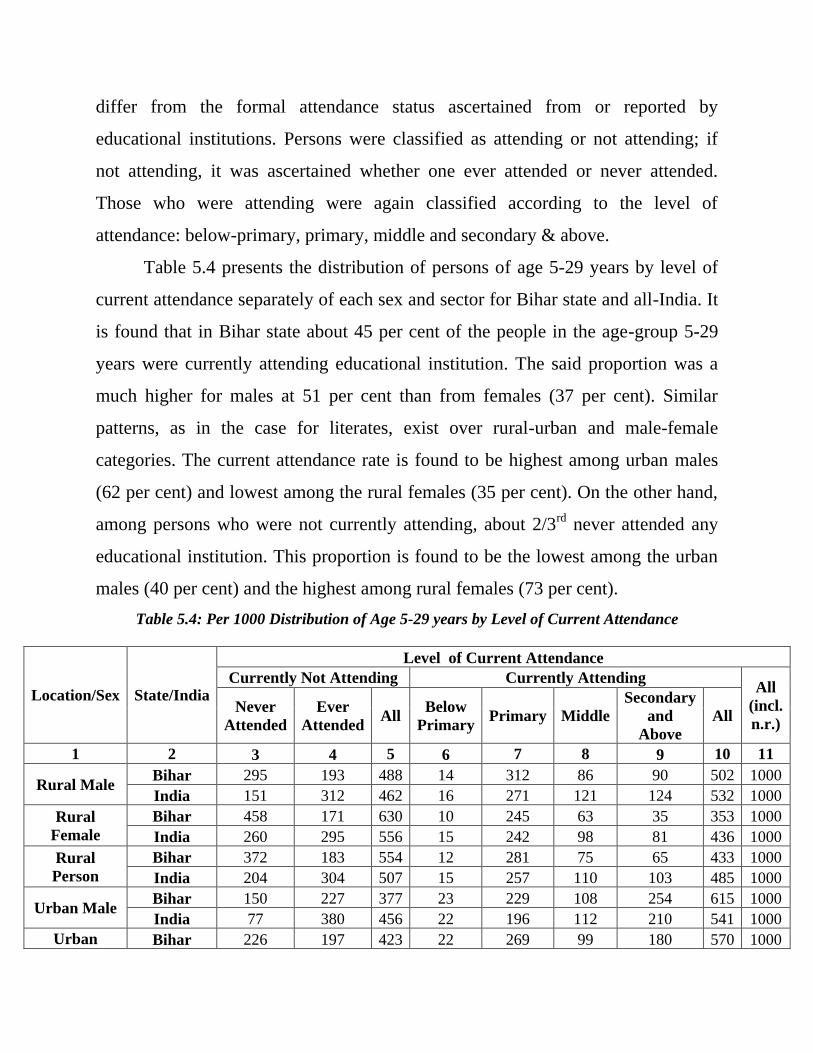
differ from the formal attendance status ascertained from or reported by
educational institutions. Persons were classified as attending or not attending; if
not attending, it was ascertained whether one ever attended or never attended.
Those who were attending were again classified according to the level of
attendance: below-primary, primary, middle and secondary & above.
Table 5.4 presents the distribution of persons of age 5-29 years by level of
current attendance separately of each sex and sector for Bihar state and all-India. It
is found that in Bihar state about 45 per cent of the people in the age-group 5-29
years were currently attending educational institution. The said proportion was a
much higher for males at 51 per cent than from females (37 per cent). Similar
patterns, as in the case for literates, exist over rural-urban and male-female
categories. The current attendance rate is found to be highest among urban males
(62 per cent) and lowest among the rural females (35 per cent). On the other hand,
among persons who were not currently attending, about 2/3rd
never attended any
educational institution. This proportion is found to be the lowest among the urban
males (40 per cent) and the highest among rural females (73 per cent).
Table 5.4: Per 1000 Distribution of Age 5-29 years by Level of Current Attendance
Location/Sex State/India
Level of Current Attendance
Currently Not Attending Currently Attending All
(incl.
n.r.) Never
Attended
Ever
Attended All
Below
Primary Primary Middle
Secondary
and
Above
All
1 2 3 4 5 6 7 8 9 10 11
Rural Male Bihar 295 193 488 14 312 86 90 502 1000
India 151 312 462 16 271 121 124 532 1000
Rural
Female
Bihar 458 171 630 10 245 63 35 353 1000
India 260 295 556 15 242 98 81 436 1000
Rural
Person
Bihar 372 183 554 12 281 75 65 433 1000
India 204 304 507 15 257 110 103 485 1000
Urban Male Bihar 150 227 377 23 229 108 254 615 1000
India 77 380 456 22 196 112 210 541 1000
Urban Bihar 226 197 423 22 269 99 180 570 1000
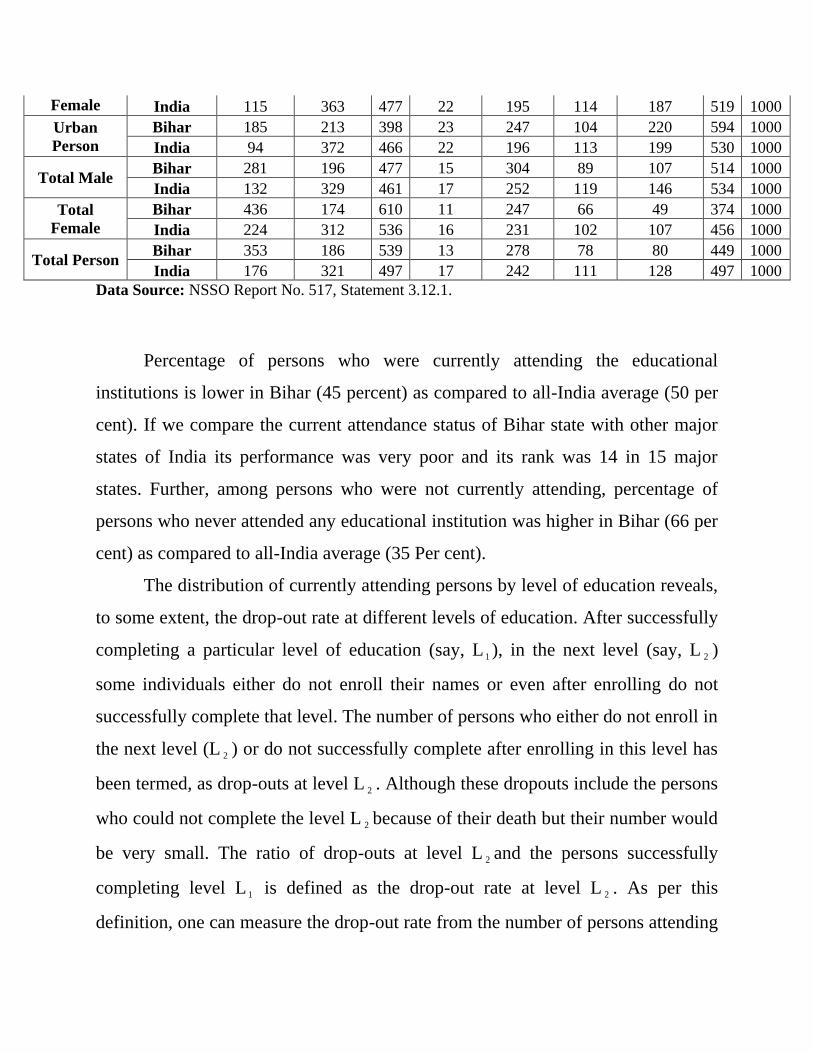
Female India 115 363 477 22 195 114 187 519 1000
Urban
Person
Bihar 185 213 398 23 247 104 220 594 1000
India 94 372 466 22 196 113 199 530 1000
Total Male Bihar 281 196 477 15 304 89 107 514 1000
India 132 329 461 17 252 119 146 534 1000
Total
Female
Bihar 436 174 610 11 247 66 49 374 1000
India 224 312 536 16 231 102 107 456 1000
Total Person Bihar 353 186 539 13 278 78 80 449 1000
India 176 321 497 17 242 111 128 497 1000
Data Source: NSSO Report No. 517, Statement 3.12.1.
Percentage of persons who were currently attending the educational
institutions is lower in Bihar (45 percent) as compared to all-India average (50 per
cent). If we compare the current attendance status of Bihar state with other major
states of India its performance was very poor and its rank was 14 in 15 major
states. Further, among persons who were not currently attending, percentage of
persons who never attended any educational institution was higher in Bihar (66 per
cent) as compared to all-India average (35 Per cent).
The distribution of currently attending persons by level of education reveals,
to some extent, the drop-out rate at different levels of education. After successfully
completing a particular level of education (say, L 1 ), in the next level (say, L 2 )
some individuals either do not enroll their names or even after enrolling do not
successfully complete that level. The number of persons who either do not enroll in
the next level (L 2 ) or do not successfully complete after enrolling in this level has
been termed, as drop-outs at level L 2 . Although these dropouts include the persons
who could not complete the level L 2 because of their death but their number would
be very small. The ratio of drop-outs at level L 2 and the persons successfully
completing level L 1 is defined as the drop-out rate at level L 2 . As per this
definition, one can measure the drop-out rate from the number of persons attending
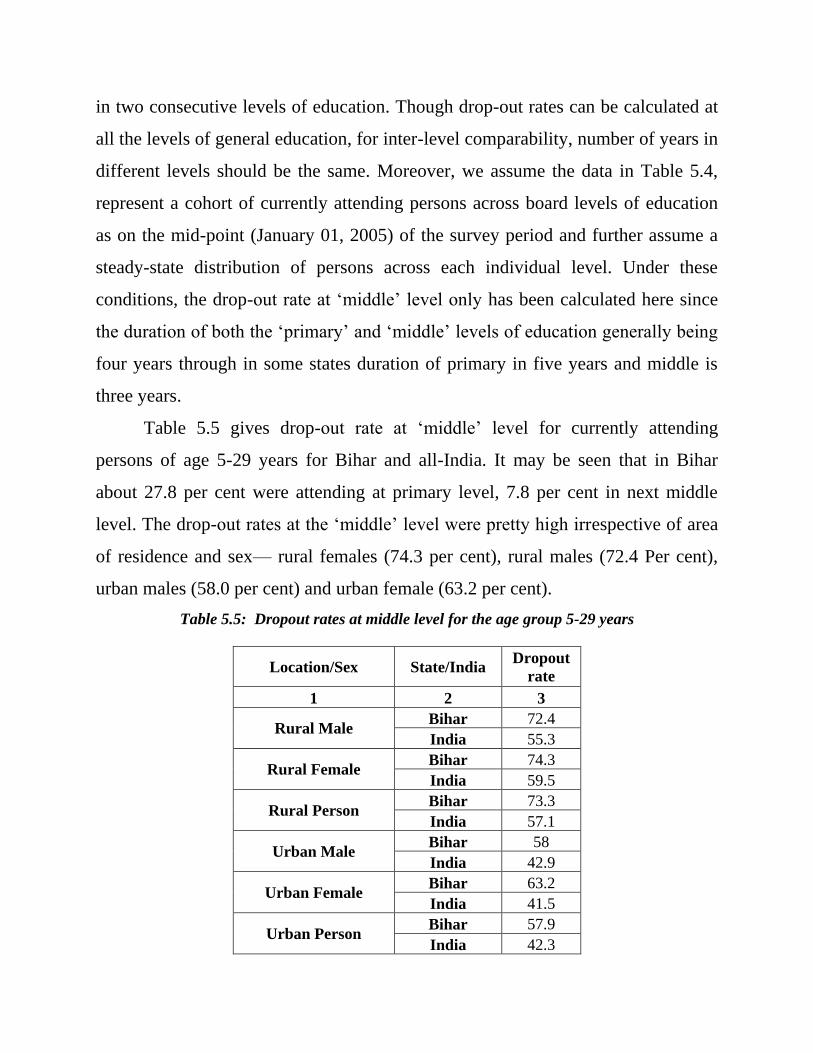
in two consecutive levels of education. Though drop-out rates can be calculated at
all the levels of general education, for inter-level comparability, number of years in
different levels should be the same. Moreover, we assume the data in Table 5.4,
represent a cohort of currently attending persons across board levels of education
as on the mid-point (January 01, 2005) of the survey period and further assume a
steady-state distribution of persons across each individual level. Under these
conditions, the drop-out rate at ‗middle‘ level only has been calculated here since
the duration of both the ‗primary‘ and ‗middle‘ levels of education generally being
four years through in some states duration of primary in five years and middle is
three years.
Table 5.5 gives drop-out rate at ‗middle‘ level for currently attending
persons of age 5-29 years for Bihar and all-India. It may be seen that in Bihar
about 27.8 per cent were attending at primary level, 7.8 per cent in next middle
level. The drop-out rates at the ‗middle‘ level were pretty high irrespective of area
of residence and sex— rural females (74.3 per cent), rural males (72.4 Per cent),
urban males (58.0 per cent) and urban female (63.2 per cent).
Table 5.5: Dropout rates at middle level for the age group 5-29 years
Location/Sex State/India Dropout
rate
1 2 3
Rural Male Bihar 72.4
India 55.3
Rural Female Bihar 74.3
India 59.5
Rural Person Bihar 73.3
India 57.1
Urban Male Bihar 58
India 42.9
Urban Female Bihar 63.2
India 41.5
Urban Person Bihar 57.9
India 42.3
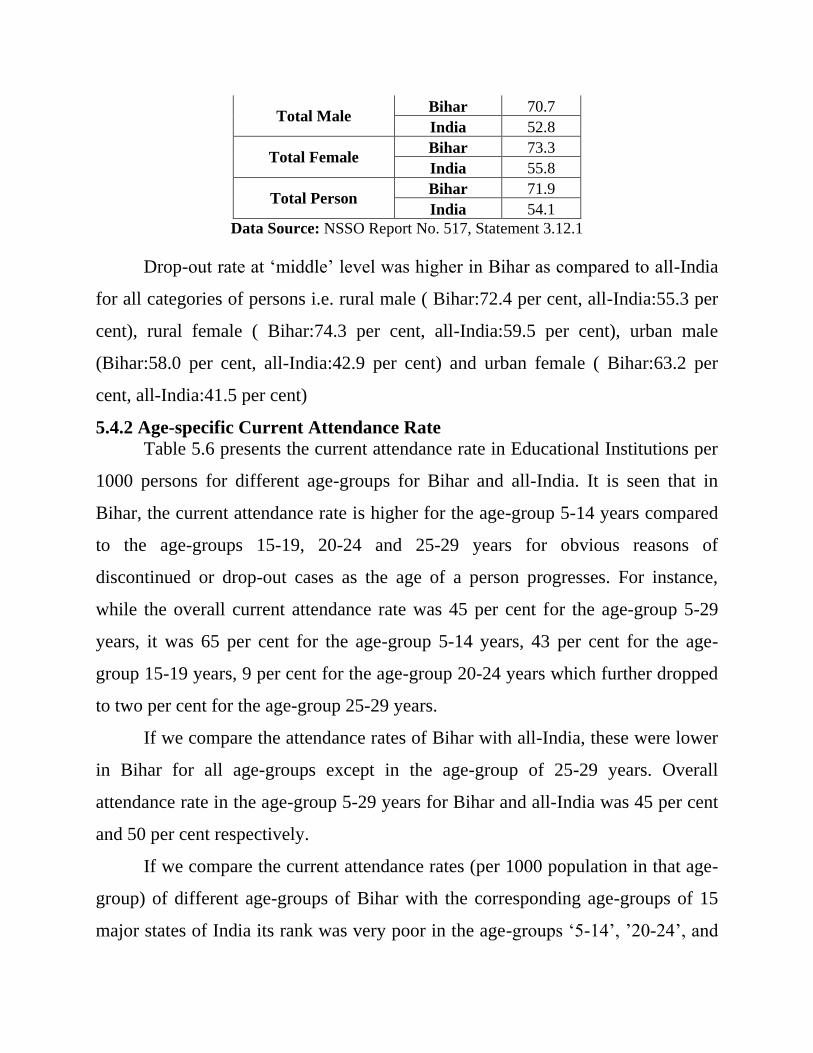
Total Male Bihar 70.7
India 52.8
Total Female Bihar 73.3
India 55.8
Total Person Bihar 71.9
India 54.1
Data Source: NSSO Report No. 517, Statement 3.12.1
Drop-out rate at ‗middle‘ level was higher in Bihar as compared to all-India
for all categories of persons i.e. rural male ( Bihar:72.4 per cent, all-India:55.3 per
cent), rural female ( Bihar:74.3 per cent, all-India:59.5 per cent), urban male
(Bihar:58.0 per cent, all-India:42.9 per cent) and urban female ( Bihar:63.2 per
cent, all-India:41.5 per cent)
5.4.2 Age-specific Current Attendance Rate
Table 5.6 presents the current attendance rate in Educational Institutions per
1000 persons for different age-groups for Bihar and all-India. It is seen that in
Bihar, the current attendance rate is higher for the age-group 5-14 years compared
to the age-groups 15-19, 20-24 and 25-29 years for obvious reasons of
discontinued or drop-out cases as the age of a person progresses. For instance,
while the overall current attendance rate was 45 per cent for the age-group 5-29
years, it was 65 per cent for the age-group 5-14 years, 43 per cent for the age-
group 15-19 years, 9 per cent for the age-group 20-24 years which further dropped
to two per cent for the age-group 25-29 years.
If we compare the attendance rates of Bihar with all-India, these were lower
in Bihar for all age-groups except in the age-group of 25-29 years. Overall
attendance rate in the age-group 5-29 years for Bihar and all-India was 45 per cent
and 50 per cent respectively.
If we compare the current attendance rates (per 1000 population in that age-
group) of different age-groups of Bihar with the corresponding age-groups of 15
major states of India its rank was very poor in the age-groups ‗5-14‘, ‘20-24‘, and
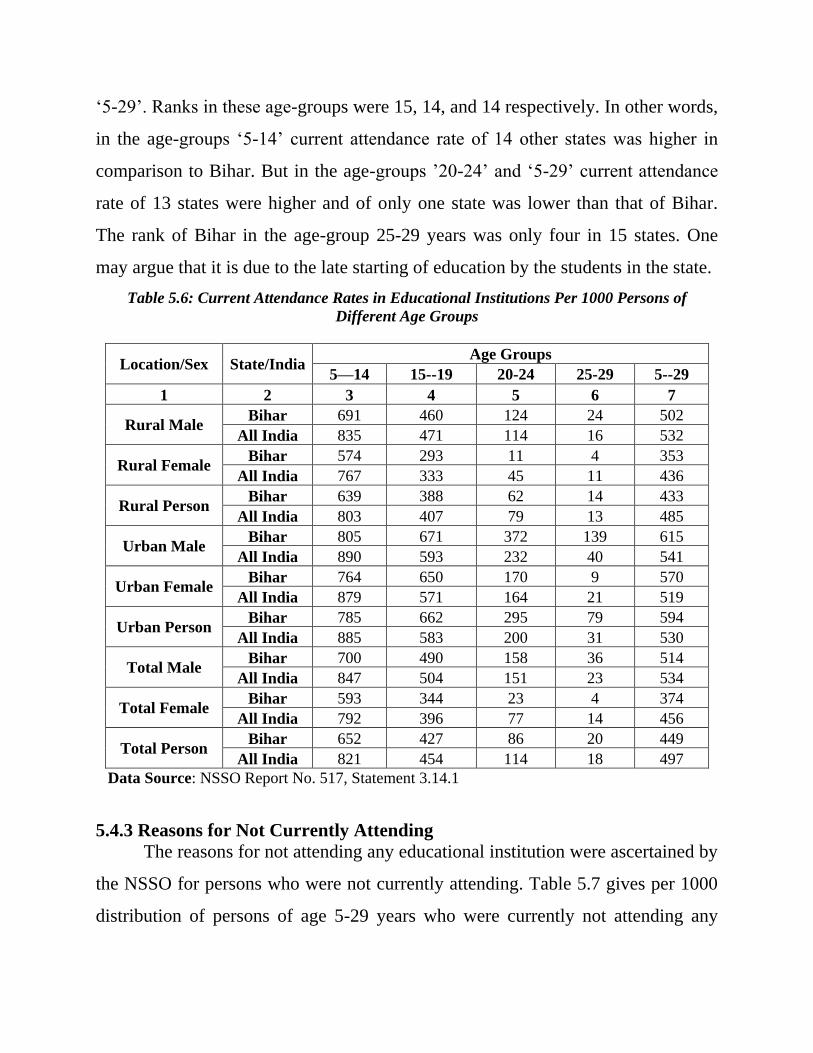
‗5-29‘. Ranks in these age-groups were 15, 14, and 14 respectively. In other words,
in the age-groups ‗5-14‘ current attendance rate of 14 other states was higher in
comparison to Bihar. But in the age-groups ‘20-24‘ and ‗5-29‘ current attendance
rate of 13 states were higher and of only one state was lower than that of Bihar.
The rank of Bihar in the age-group 25-29 years was only four in 15 states. One
may argue that it is due to the late starting of education by the students in the state.
Table 5.6: Current Attendance Rates in Educational Institutions Per 1000 Persons of
Different Age Groups
Location/Sex State/India Age Groups
5—14 15--19 20-24 25-29 5--29
1 2 3 4 5 6 7
Rural Male Bihar 691 460 124 24 502
All India 835 471 114 16 532
Rural Female Bihar 574 293 11 4 353
All India 767 333 45 11 436
Rural Person Bihar 639 388 62 14 433
All India 803 407 79 13 485
Urban Male Bihar 805 671 372 139 615
All India 890 593 232 40 541
Urban Female Bihar 764 650 170 9 570
All India 879 571 164 21 519
Urban Person Bihar 785 662 295 79 594
All India 885 583 200 31 530
Total Male Bihar 700 490 158 36 514
All India 847 504 151 23 534
Total Female Bihar 593 344 23 4 374
All India 792 396 77 14 456
Total Person Bihar 652 427 86 20 449
All India 821 454 114 18 497
Data Source: NSSO Report No. 517, Statement 3.14.1
5.4.3 Reasons for Not Currently Attending
The reasons for not attending any educational institution were ascertained by
the NSSO for persons who were not currently attending. Table 5.7 gives per 1000
distribution of persons of age 5-29 years who were currently not attending any
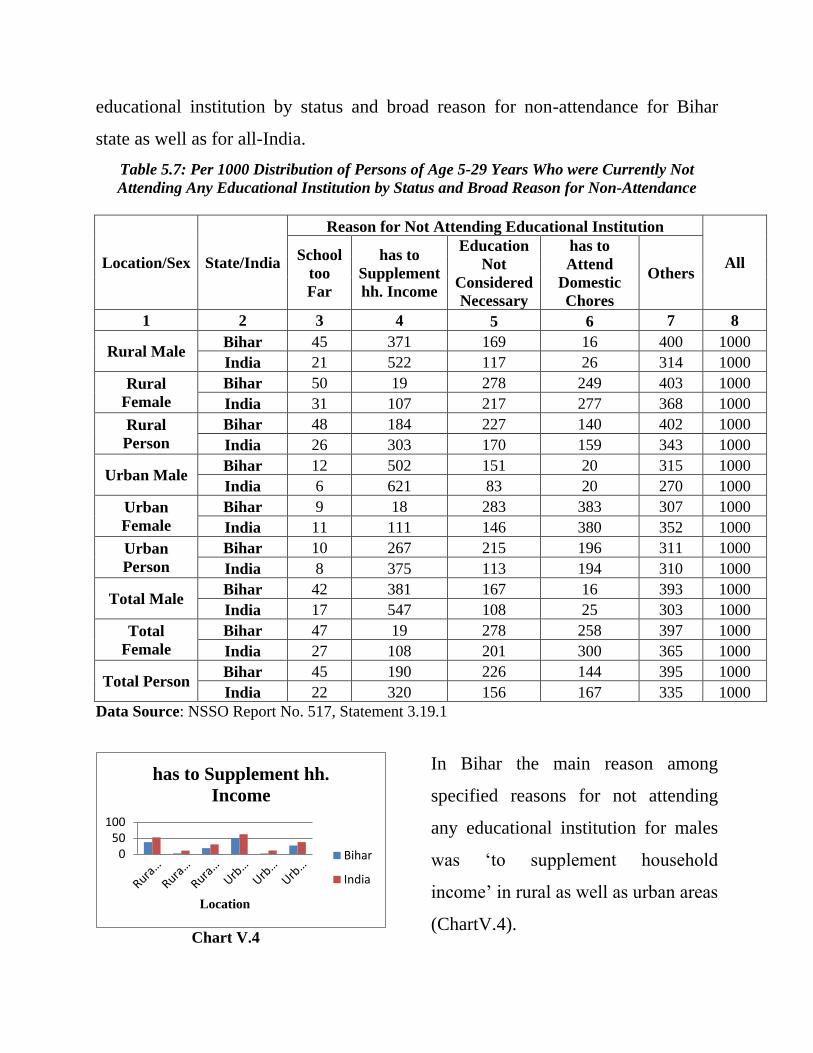
educational institution by status and broad reason for non-attendance for Bihar
state as well as for all-India.
Table 5.7: Per 1000 Distribution of Persons of Age 5-29 Years Who were Currently Not
Attending Any Educational Institution by Status and Broad Reason for Non-Attendance
Location/Sex State/India
Reason for Not Attending Educational Institution
All School
too
Far
has to
Supplement
hh. Income
Education
Not
Considered
Necessary
has to
Attend
Domestic
Chores
Others
1 2 3 4 5 6 7 8
Rural Male Bihar 45 371 169 16 400 1000
India 21 522 117 26 314 1000
Rural
Female
Bihar 50 19 278 249 403 1000
India 31 107 217 277 368 1000
Rural
Person
Bihar 48 184 227 140 402 1000
India 26 303 170 159 343 1000
Urban Male Bihar 12 502 151 20 315 1000
India 6 621 83 20 270 1000
Urban
Female
Bihar 9 18 283 383 307 1000
India 11 111 146 380 352 1000
Urban
Person
Bihar 10 267 215 196 311 1000
India 8 375 113 194 310 1000
Total Male Bihar 42 381 167 16 393 1000
India 17 547 108 25 303 1000
Total
Female
Bihar 47 19 278 258 397 1000
India 27 108 201 300 365 1000
Total Person Bihar 45 190 226 144 395 1000
India 22 320 156 167 335 1000
Data Source: NSSO Report No. 517, Statement 3.19.1
Chart V.4
In Bihar the main reason among
specified reasons for not attending
any educational institution for males
was ‗to supplement household
income‘ in rural as well as urban areas
(ChartV.4).
050
100
Location
has to Supplement hh.
Income
Bihar
India
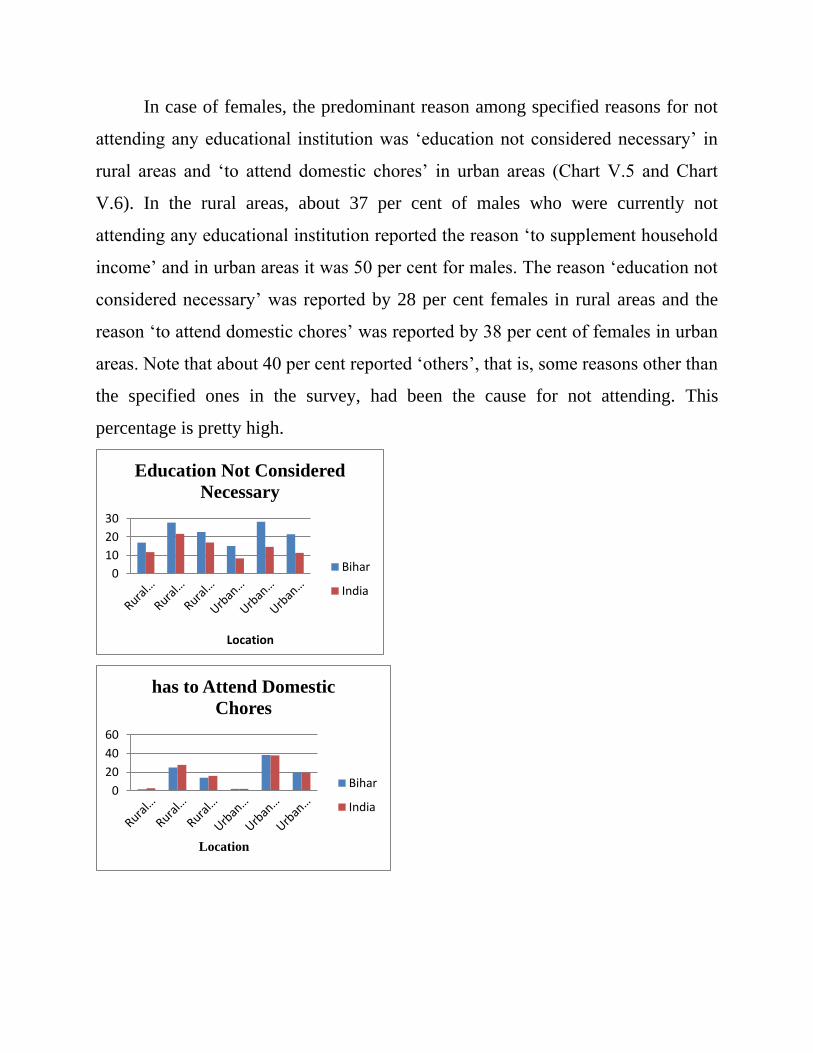
In case of females, the predominant reason among specified reasons for not
attending any educational institution was ‗education not considered necessary‘ in
rural areas and ‗to attend domestic chores‘ in urban areas (Chart V.5 and Chart
V.6). In the rural areas, about 37 per cent of males who were currently not
attending any educational institution reported the reason ‗to supplement household
income‘ and in urban areas it was 50 per cent for males. The reason ‗education not
considered necessary‘ was reported by 28 per cent females in rural areas and the
reason ‗to attend domestic chores‘ was reported by 38 per cent of females in urban
areas. Note that about 40 per cent reported ‗others‘, that is, some reasons other than
the specified ones in the survey, had been the cause for not attending. This
percentage is pretty high.
0
10
20
30
Location
Education Not Considered
Necessary
Bihar
India
0
20
40
60
Location
has to Attend Domestic
Chores
Bihar
India
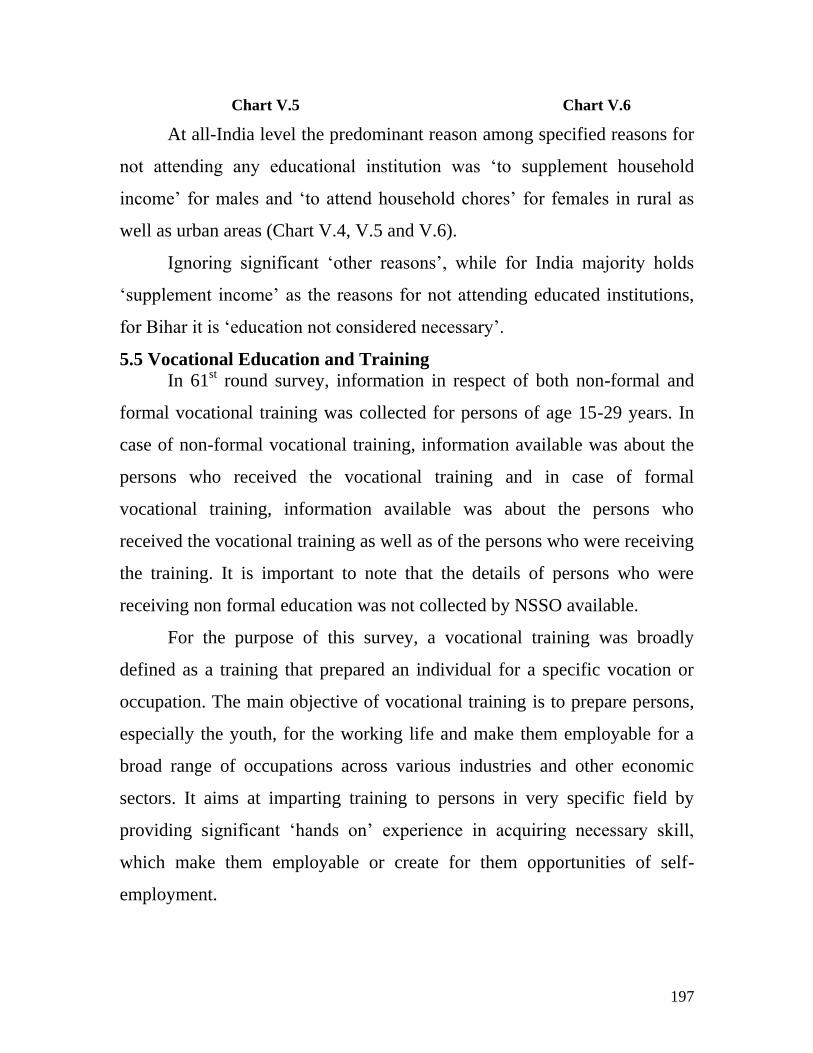
197
Chart V.5 Chart V.6
At all-India level the predominant reason among specified reasons for
not attending any educational institution was ‗to supplement household
income‘ for males and ‗to attend household chores‘ for females in rural as
well as urban areas (Chart V.4, V.5 and V.6).
Ignoring significant ‗other reasons‘, while for India majority holds
‗supplement income‘ as the reasons for not attending educated institutions,
for Bihar it is ‗education not considered necessary‘.
5.5 Vocational Education and Training
In 61st round survey, information in respect of both non-formal and
formal vocational training was collected for persons of age 15-29 years. In
case of non-formal vocational training, information available was about the
persons who received the vocational training and in case of formal
vocational training, information available was about the persons who
received the vocational training as well as of the persons who were receiving
the training. It is important to note that the details of persons who were
receiving non formal education was not collected by NSSO available.
For the purpose of this survey, a vocational training was broadly
defined as a training that prepared an individual for a specific vocation or
occupation. The main objective of vocational training is to prepare persons,
especially the youth, for the working life and make them employable for a
broad range of occupations across various industries and other economic
sectors. It aims at imparting training to persons in very specific field by
providing significant ‗hands on‘ experience in acquiring necessary skill,
which make them employable or create for them opportunities of self-
employment.
198
The training that took place in institutions which followed a structured
training programme and led to recognized certificates, diplomas or degrees
was treated as formal vocational training. When the expertise in a vocation
or trade was acquired from family members which enabled one to carry out
the trade or occupation of one‘s ancestors over generations, or from any
other ‗non-formal‘ sources, vocational training was considered as ‗non-
formal‘ vocational training.
5.5.1 Status of Vocational Training Received/being Received
Table 5.8 presents the distribution of persons of age 15-29 years by
status of vocational training received/being received, separately for each sex
and sector at Bihar and all-India level. In Bihar state, of the persons of age
15-29 years, (i) only 0.3 per cent reported formal vocational training as on
the date of survey, (ii) 0.2 per cent reported to have received formal
vocational training and (iii) another 1.3 per cent reported to have received
non-formal vocational training. If we assume that another one per cent of the
persons were receiving the non-formal vocational training then we can say
that only 3 per cent of the persons in this age group were either receiving or
have received any vocational training (formal or non-formal). This is a very
low percentage. The proportion of the persons who received/being received
the vocational training was further lower in the case of females than in the
case of males in both the rural and urban areas. Moreover, as expected, the
proportion of such persons was higher in the urban areas than that of rural
areas.
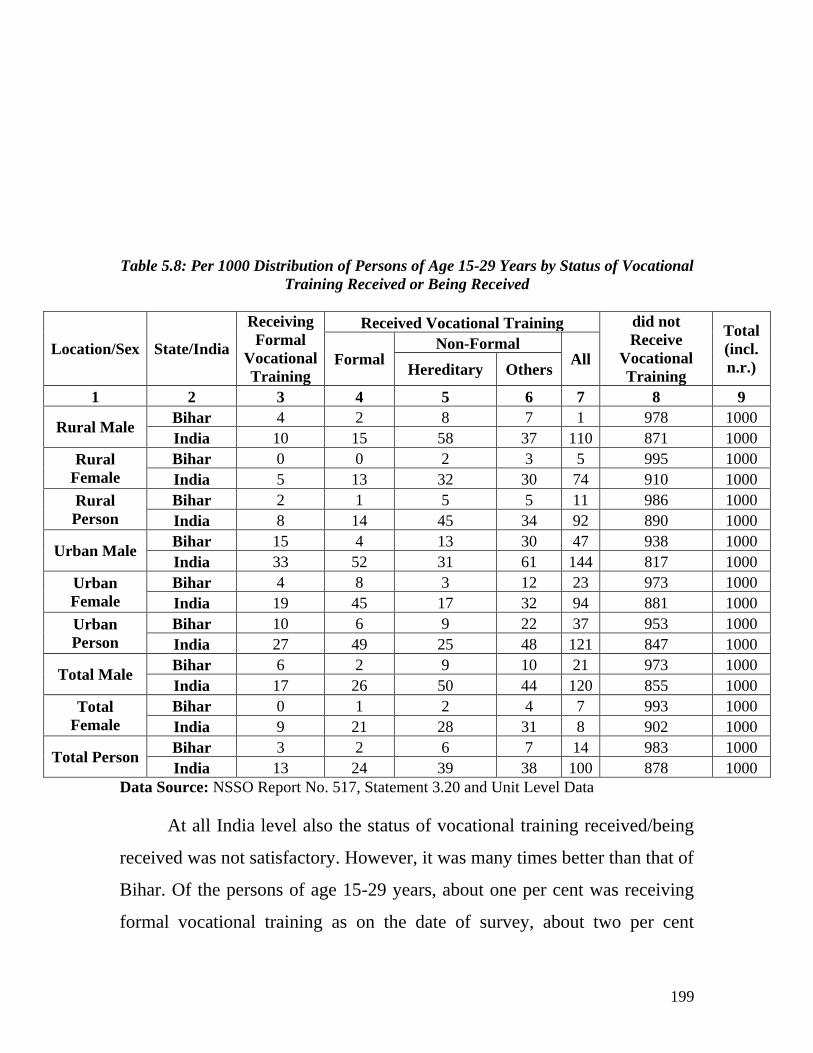
199
Table 5.8: Per 1000 Distribution of Persons of Age 15-29 Years by Status of Vocational
Training Received or Being Received
Location/Sex State/India
Receiving
Formal
Vocational
Training
Received Vocational Training did not
Receive
Vocational
Training
Total
(incl.
n.r.) Formal
Non-Formal All
Hereditary Others
1 2 3 4 5 6 7 8 9
Rural Male Bihar 4 2 8 7 1 978 1000
India 10 15 58 37 110 871 1000
Rural
Female
Bihar 0 0 2 3 5 995 1000
India 5 13 32 30 74 910 1000
Rural
Person
Bihar 2 1 5 5 11 986 1000
India 8 14 45 34 92 890 1000
Urban Male Bihar 15 4 13 30 47 938 1000
India 33 52 31 61 144 817 1000
Urban
Female
Bihar 4 8 3 12 23 973 1000
India 19 45 17 32 94 881 1000
Urban
Person
Bihar 10 6 9 22 37 953 1000
India 27 49 25 48 121 847 1000
Total Male Bihar 6 2 9 10 21 973 1000
India 17 26 50 44 120 855 1000
Total
Female
Bihar 0 1 2 4 7 993 1000
India 9 21 28 31 8 902 1000
Total Person Bihar 3 2 6 7 14 983 1000
India 13 24 39 38 100 878 1000
Data Source: NSSO Report No. 517, Statement 3.20 and Unit Level Data
At all India level also the status of vocational training received/being
received was not satisfactory. However, it was many times better than that of
Bihar. Of the persons of age 15-29 years, about one per cent was receiving
formal vocational training as on the date of survey, about two per cent
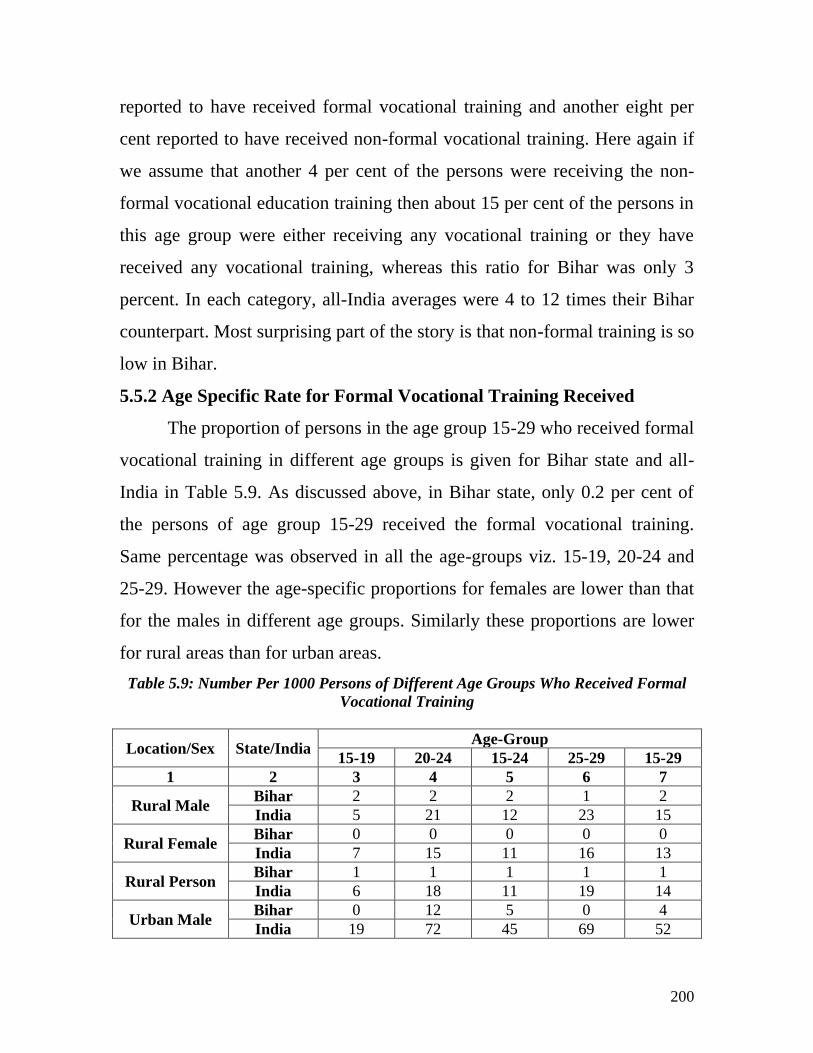
200
reported to have received formal vocational training and another eight per
cent reported to have received non-formal vocational training. Here again if
we assume that another 4 per cent of the persons were receiving the non-
formal vocational education training then about 15 per cent of the persons in
this age group were either receiving any vocational training or they have
received any vocational training, whereas this ratio for Bihar was only 3
percent. In each category, all-India averages were 4 to 12 times their Bihar
counterpart. Most surprising part of the story is that non-formal training is so
low in Bihar.
5.5.2 Age Specific Rate for Formal Vocational Training Received
The proportion of persons in the age group 15-29 who received formal
vocational training in different age groups is given for Bihar state and all-
India in Table 5.9. As discussed above, in Bihar state, only 0.2 per cent of
the persons of age group 15-29 received the formal vocational training.
Same percentage was observed in all the age-groups viz. 15-19, 20-24 and
25-29. However the age-specific proportions for females are lower than that
for the males in different age groups. Similarly these proportions are lower
for rural areas than for urban areas.
Table 5.9: Number Per 1000 Persons of Different Age Groups Who Received Formal
Vocational Training
Location/Sex State/India Age-Group
15-19 20-24 15-24 25-29 15-29
1 2 3 4 5 6 7
Rural Male Bihar 2 2 2 1 2
India 5 21 12 23 15
Rural Female Bihar 0 0 0 0 0
India 7 15 11 16 13
Rural Person Bihar 1 1 1 1 1
India 6 18 11 19 14
Urban Male Bihar 0 12 5 0 4
India 19 72 45 69 52
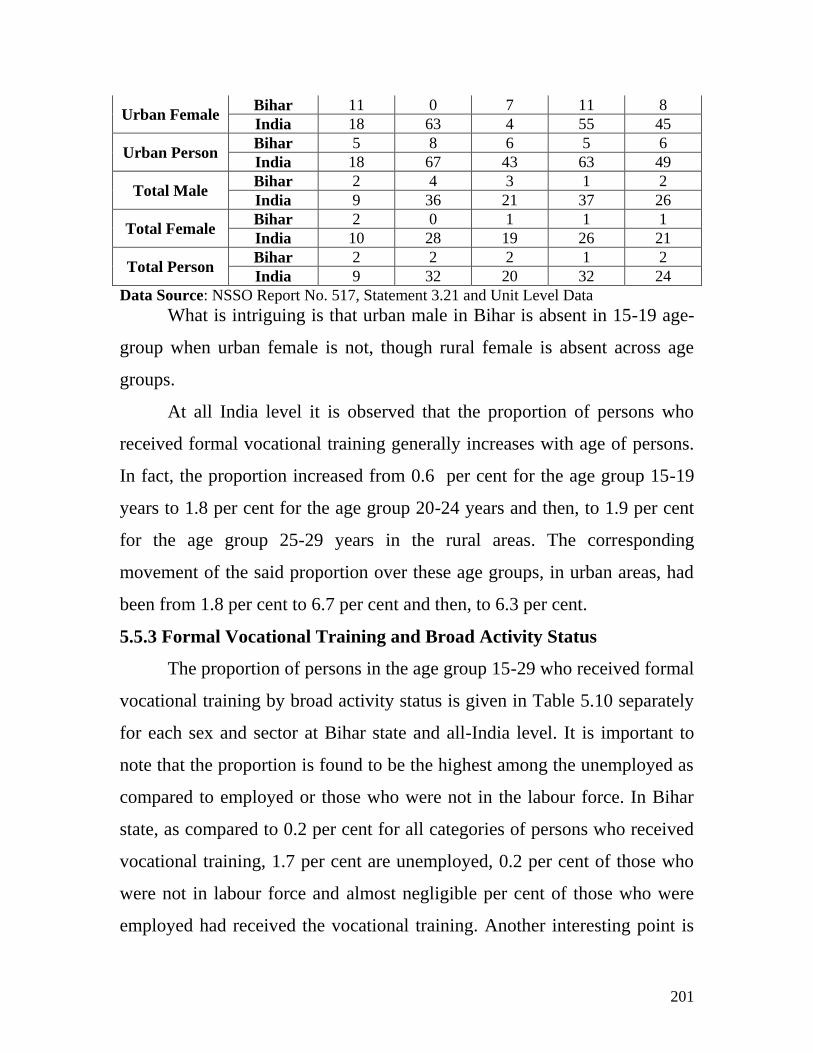
201
Urban Female Bihar 11 0 7 11 8
India 18 63 4 55 45
Urban Person Bihar 5 8 6 5 6
India 18 67 43 63 49
Total Male Bihar 2 4 3 1 2
India 9 36 21 37 26
Total Female Bihar 2 0 1 1 1
India 10 28 19 26 21
Total Person Bihar 2 2 2 1 2
India 9 32 20 32 24
Data Source: NSSO Report No. 517, Statement 3.21 and Unit Level Data
What is intriguing is that urban male in Bihar is absent in 15-19 age-
group when urban female is not, though rural female is absent across age
groups.
At all India level it is observed that the proportion of persons who
received formal vocational training generally increases with age of persons.
In fact, the proportion increased from 0.6 per cent for the age group 15-19
years to 1.8 per cent for the age group 20-24 years and then, to 1.9 per cent
for the age group 25-29 years in the rural areas. The corresponding
movement of the said proportion over these age groups, in urban areas, had
been from 1.8 per cent to 6.7 per cent and then, to 6.3 per cent.
5.5.3 Formal Vocational Training and Broad Activity Status
The proportion of persons in the age group 15-29 who received formal
vocational training by broad activity status is given in Table 5.10 separately
for each sex and sector at Bihar state and all-India level. It is important to
note that the proportion is found to be the highest among the unemployed as
compared to employed or those who were not in the labour force. In Bihar
state, as compared to 0.2 per cent for all categories of persons who received
vocational training, 1.7 per cent are unemployed, 0.2 per cent of those who
were not in labour force and almost negligible per cent of those who were
employed had received the vocational training. Another interesting point is
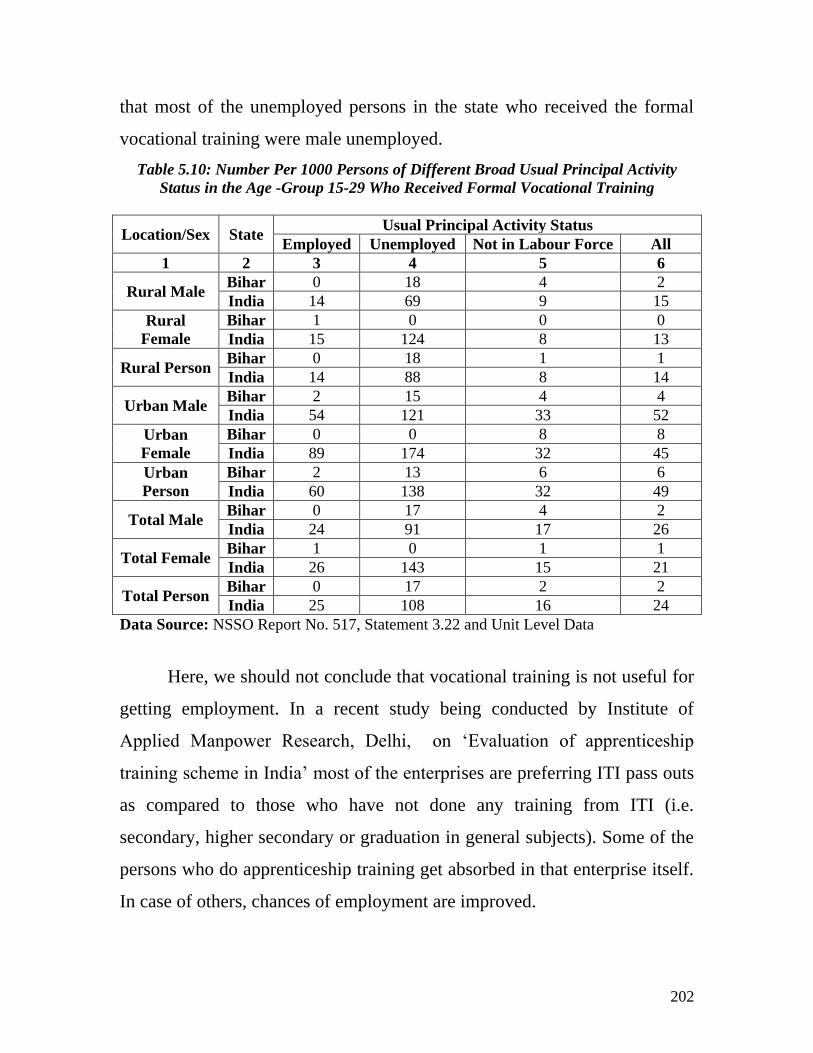
202
that most of the unemployed persons in the state who received the formal
vocational training were male unemployed.
Table 5.10: Number Per 1000 Persons of Different Broad Usual Principal Activity
Status in the Age -Group 15-29 Who Received Formal Vocational Training
Location/Sex State Usual Principal Activity Status
Employed Unemployed Not in Labour Force All
1 2 3 4 5 6
Rural Male Bihar 0 18 4 2
India 14 69 9 15
Rural
Female
Bihar 1 0 0 0
India 15 124 8 13
Rural Person Bihar 0 18 1 1
India 14 88 8 14
Urban Male Bihar 2 15 4 4
India 54 121 33 52
Urban
Female
Bihar 0 0 8 8
India 89 174 32 45
Urban
Person
Bihar 2 13 6 6
India 60 138 32 49
Total Male Bihar 0 17 4 2
India 24 91 17 26
Total Female Bihar 1 0 1 1
India 26 143 15 21
Total Person Bihar 0 17 2 2
India 25 108 16 24
Data Source: NSSO Report No. 517, Statement 3.22 and Unit Level Data
Here, we should not conclude that vocational training is not useful for
getting employment. In a recent study being conducted by Institute of
Applied Manpower Research, Delhi, on ‗Evaluation of apprenticeship
training scheme in India‘ most of the enterprises are preferring ITI pass outs
as compared to those who have not done any training from ITI (i.e.
secondary, higher secondary or graduation in general subjects). Some of the
persons who do apprenticeship training get absorbed in that enterprise itself.
In case of others, chances of employment are improved.
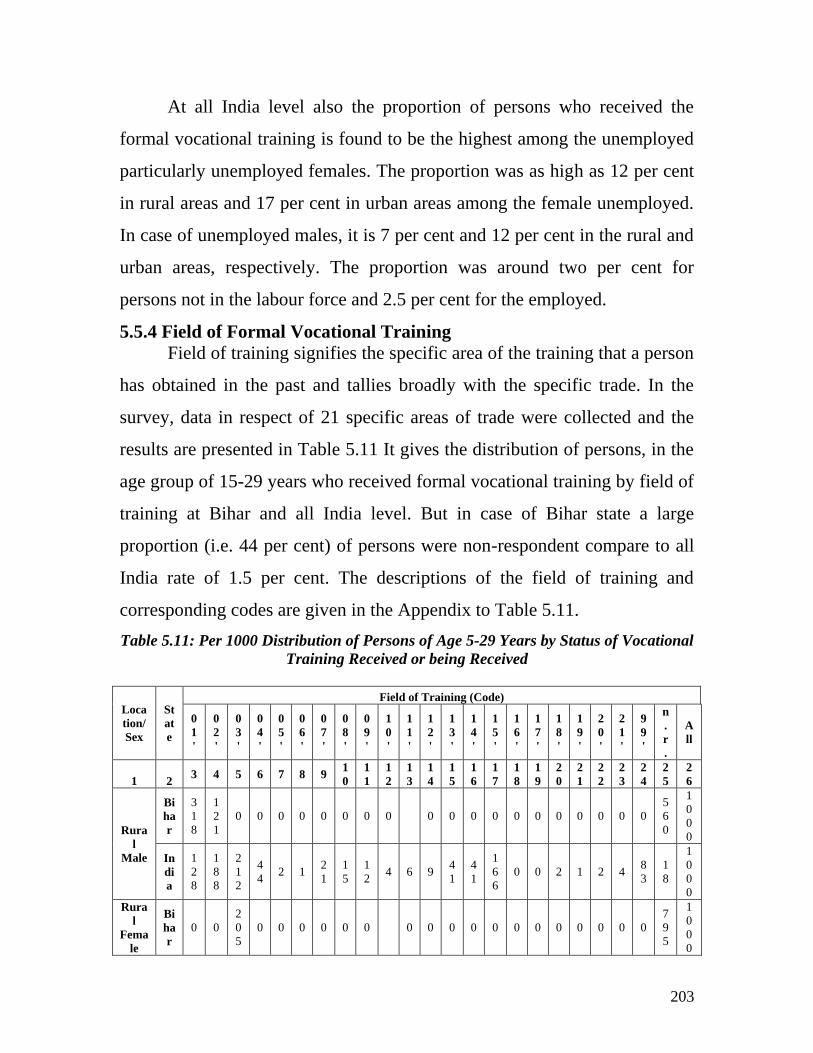
203
At all India level also the proportion of persons who received the
formal vocational training is found to be the highest among the unemployed
particularly unemployed females. The proportion was as high as 12 per cent
in rural areas and 17 per cent in urban areas among the female unemployed.
In case of unemployed males, it is 7 per cent and 12 per cent in the rural and
urban areas, respectively. The proportion was around two per cent for
persons not in the labour force and 2.5 per cent for the employed.
5.5.4 Field of Formal Vocational Training
Field of training signifies the specific area of the training that a person
has obtained in the past and tallies broadly with the specific trade. In the
survey, data in respect of 21 specific areas of trade were collected and the
results are presented in Table 5.11 It gives the distribution of persons, in the
age group of 15-29 years who received formal vocational training by field of
training at Bihar and all India level. But in case of Bihar state a large
proportion (i.e. 44 per cent) of persons were non-respondent compare to all
India rate of 1.5 per cent. The descriptions of the field of training and
corresponding codes are given in the Appendix to Table 5.11.
Table 5.11: Per 1000 Distribution of Persons of Age 5-29 Years by Status of Vocational
Training Received or being Received
Loca
tion/
Sex
St
at
e
Field of Training (Code)
0
1
'
0
2
'
0
3
'
0
4
'
0
5
'
0
6
'
0
7
'
0
8
'
0
9
'
1
0
'
1
1
'
1
2
'
1
3
'
1
4
'
1
5
'
1
6
'
1
7
'
1
8
'
1
9
'
2
0
'
2
1
'
9
9
'
n
.
r
.
A
ll
1 2 3 4 5 6 7 8 9
1
0
1
1
1
2
1
3
1
4
1
5
1
6
1
7
1
8
1
9
2
0
2
1
2
2
2
3
2
4
2
5
2
6
Rura
l
Male
Bi
ha
r
3
1
8
1
2
1
0 0 0 0 0 0 0 0 0 0 0 0 0 0 0 0 0 0 0
5
6
0
1
0
0
0
In
di
a
1
2
8
1
8
8
2
1
2
4
4 2 1
2
1
1
5
1
2 4 6 9
4
1
4
1
1
6
6
0 0 2 1 2 4 8
3
1
8
1
0
0
0
Rura
l
Fema
le
Bi
ha
r
0 0
2
0
5
0 0 0 0 0 0 0 0 0 0 0 0 0 0 0 0 0 0
7
9
5
1
0
0
0
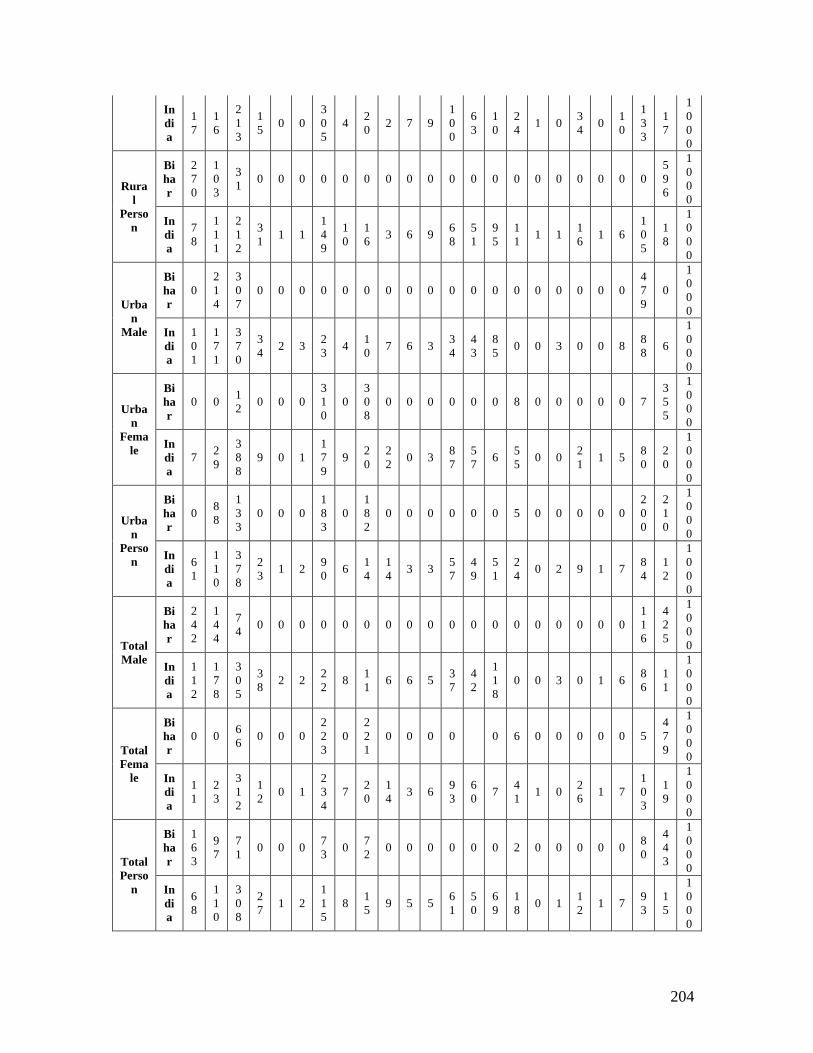
204
In
di
a
1
7
1
6
2
1
3
1
5 0 0
3
0
5
4 2
0 2 7 9
1
0
0
6
3
1
0
2
4 1 0
3
4 0
1
0
1
3
3
1
7
1
0
0
0
Rura
l
Perso
n
Bi
ha
r
2
7
0
1
0
3
3
1 0 0 0 0 0 0 0 0 0 0 0 0 0 0 0 0 0 0 0
5
9
6
1
0
0
0
In
di
a
7
8
1
1
1
2
1
2
3
1 1 1
1
4
9
1
0
1
6 3 6 9
6
8
5
1
9
5
1
1 1 1
1
6 1 6
1
0
5
1
8
1
0
0
0
Urba
n
Male
Bi
ha
r
0
2
1
4
3
0
7
0 0 0 0 0 0 0 0 0 0 0 0 0 0 0 0 0 0
4
7
9
0
1
0
0
0
In
di
a
1
0
1
1
7
1
3
7
0
3
4 2 3
2
3 4
1
0 7 6 3
3
4
4
3
8
5 0 0 3 0 0 8
8
8 6
1
0
0
0
Urba
n
Fema
le
Bi
ha
r
0 0 1
2 0 0 0
3
1
0
0
3
0
8
0 0 0 0 0 0 8 0 0 0 0 0 7
3
5
5
1
0
0
0
In
di
a
7 2
9
3
8
8
9 0 1
1
7
9
9 2
0
2
2 0 3
8
7
5
7 6
5
5 0 0
2
1 1 5
8
0
2
0
1
0
0
0
Urba
n
Perso
n
Bi
ha
r
0 8
8
1
3
3
0 0 0
1
8
3
0
1
8
2
0 0 0 0 0 0 5 0 0 0 0 0
2
0
0
2
1
0
1
0
0
0
In
di
a
6
1
1
1
0
3
7
8
2
3 1 2
9
0 6
1
4
1
4 3 3
5
7
4
9
5
1
2
4 0 2 9 1 7
8
4
1
2
1
0
0
0
Total
Male
Bi
ha
r
2
4
2
1
4
4
7
4 0 0 0 0 0 0 0 0 0 0 0 0 0 0 0 0 0 0
1
1
6
4
2
5
1
0
0
0
In
di
a
1
1
2
1
7
8
3
0
5
3
8 2 2
2
2 8
1
1 6 6 5
3
7
4
2
1
1
8
0 0 3 0 1 6 8
6
1
1
1
0
0
0
Total
Fema
le
Bi
ha
r
0 0 6
6 0 0 0
2
2
3
0
2
2
1
0 0 0 0 0 6 0 0 0 0 0 5
4
7
9
1
0
0
0
In
di
a
1
1
2
3
3
1
2
1
2 0 1
2
3
4
7 2
0
1
4 3 6
9
3
6
0 7
4
1 1 0
2
6 1 7
1
0
3
1
9
1
0
0
0
Total
Perso
n
Bi
ha
r
1
6
3
9
7
7
1 0 0 0
7
3 0
7
2 0 0 0 0 0 0 2 0 0 0 0 0
8
0
4
4
3
1
0
0
0
In
di
a
6
8
1
1
0
3
0
8
2
7 1 2
1
1
5
8 1
5 9 5 5
6
1
5
0
6
9
1
8 0 1
1
2 1 7
9
3
1
5
1
0
0
0
205
Note: Codes of field of training are given in appendix to Table 5.12 given at the end of
the chapter.
Data Source: NSSO Report No. 517, Statement 3.23 and Unit Level Data
Usually, vocational training has been oriented towards a number of
engineering and technical trades. Though they continue to form the core of
vocational training, its scope was considerably widened to include many
non-engineering trades also. In Bihar state, Table 5.11 shows that there was
a limited choice for different trades. In case of males, the most demanded
field of training was found to be ‗Mechanical engineering trades‘ (code 01:
32 per cent) followed by ‗Electrical and electronic engineering trades‘ (code
02: 12 per cent) in the rural areas; and ‗Computer trades‘ (code 03: 31 per
cent) followed by ‗Electrical and electronic engineering trades‘ (code 02: 21
per cent) in the urban areas. Among rural female youths, the demand was a
little different. About 21 per cent of them, in the rural areas, the highest
proportion among all fields had formal vocational training in the field of
‗Computer trades‘. Among the urban female youths, the most important
choices in terms of proportions were: ‗Textile related trades‘ and
‗Artisan/Craftsman/Handicraft and cottage based production trades‘. Each of
these two trades had a share of about 31 per cent of total urban females in
this age-group.
At all India level for obvious reasons the choice for different trades
was larger in comparison to Bihar. In India, it is observed that for males, the
most demanded field of training was found to be ‗Computer trades‘ (code
03: 21 per cent) followed by ‗Textile related trades‘ (code 07: 15 per cent),
‗Electrical and electronic engineering trades‘ (code 02: 11 per cent), ‗driving
and motor mechanic work‘ (code 15: 10 per cent) and ‗Mechanical
engineering trades‘ (code 01: 8 per cent) in the rural areas; and ‗Computer
trades‘ (code 03: 38 per cent) followed by ‗Electrical and electronic
206
engineering trades‘ (code 02: 11 per cent) and ‗Mechanical engineering
trades‘ (code 01: 6 per cent) in the urban areas. As in case of Bihar, at all
India level also among rural female youths, the demand was a little different.
About 31 per cent of them, in the rural areas, the highest proportion among
all fields had formal vocational training in the field of ‗Textile related
trades‘. This was followed by the ‗Computer trades‘ (code 03: 21 per cent)
and ‗Health and paramedical related trades‘ (code 13: 10 per cent). Among
the urban female youths, the most important choices in terms of proportions
were: ‗Computer trades‘ (code 03: 39 per cent), Textile related trades‘ (code
07: 18 per cent) and ‗Health and paramedical related trades‘ (code 13: 9 per
cent).
5.5.5 Institution of Formal Vocational Training
Some of the major sources from where vocational training could be
received were collected in the survey and the distribution of persons, in the
age group of 5-29 who received formal vocational training by institution of
training has been presented in Table 5.12, separately for each sex and sector
at Bihar state and all-India level. Major sources from where vocational
training could be received were classified into 24 different types of
institutes. The types of institute of training and corresponding codes are
given in the Appendix to Table 5.12. It is important to note that in case of
Bihar the proportion of non-respondents was very large (i.e.44 per cent).
Beside this about 20 per cent of the respondents in the state reported their
institute of training as ‗Other institutes‘ - which means all-India
classification did not suit Bihar well.
Table 5.12: Per 1000 Distribution of Persons of Age 5-29 years Who Received Formal
Vocational Training by Institution of Training
Loc S Institution of Training (Code)
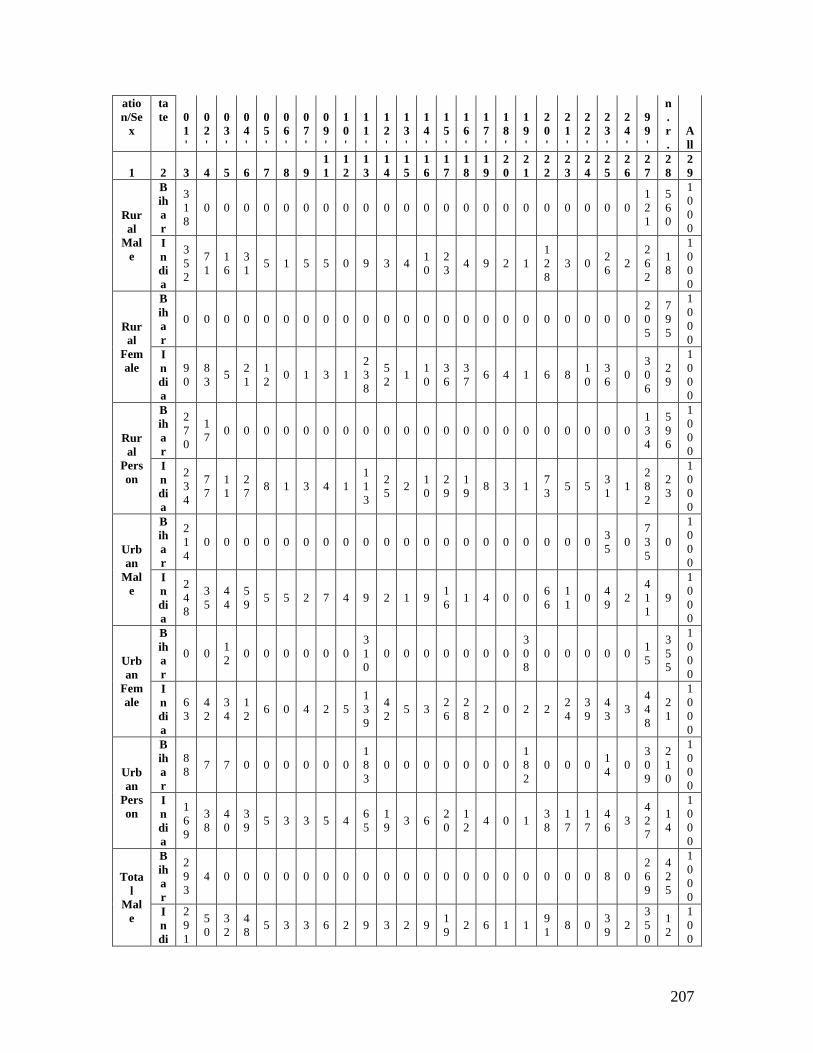
207
atio
n/Se
x
ta
te 0
1
'
0
2
'
0
3
'
0
4
'
0
5
'
0
6
'
0
7
'
0
9
'
1
0
'
1
1
'
1
2
'
1
3
'
1
4
'
1
5
'
1
6
'
1
7
'
1
8
'
1
9
'
2
0
'
2
1
'
2
2
'
2
3
'
2
4
'
9
9
'
n
.
r
.
A
ll
1 2 3 4 5 6 7 8 9
1
1
1
2
1
3
1
4
1
5
1
6
1
7
1
8
1
9
2
0
2
1
2
2
2
3
2
4
2
5
2
6
2
7
2
8
2
9
Rur
al
Mal
e
B
ih
a
r
3
1
8
0 0 0 0 0 0 0 0 0 0 0 0 0 0 0 0 0 0 0 0 0 0
1
2
1
5
6
0
1
0
0
0
I
n
di
a
3
5
2
7
1
1
6
3
1 5 1 5 5 0 9 3 4
1
0
2
3 4 9 2 1
1
2
8
3 0 2
6 2
2
6
2
1
8
1
0
0
0
Rur
al
Fem
ale
B
ih
a
r
0 0 0 0 0 0 0 0 0 0 0 0 0 0 0 0 0 0 0 0 0 0 0
2
0
5
7
9
5
1
0
0
0
I
n
di
a
9
0
8
3 5
2
1
1
2 0 1 3 1
2
3
8
5
2 1
1
0
3
6
3
7 6 4 1 6 8
1
0
3
6 0
3
0
6
2
9
1
0
0
0
Rur
al
Pers
on
B
ih
a
r
2
7
0
1
7 0 0 0 0 0 0 0 0 0 0 0 0 0 0 0 0 0 0 0 0 0
1
3
4
5
9
6
1
0
0
0
I
n
di
a
2
3
4
7
7
1
1
2
7 8 1 3 4 1
1
1
3
2
5 2
1
0
2
9
1
9 8 3 1
7
3 5 5
3
1 1
2
8
2
2
3
1
0
0
0
Urb
an
Mal
e
B
ih
a
r
2
1
4
0 0 0 0 0 0 0 0 0 0 0 0 0 0 0 0 0 0 0 0 3
5 0
7
3
5
0
1
0
0
0
I
n
di
a
2
4
8
3
5
4
4
5
9 5 5 2 7 4 9 2 1 9
1
6 1 4 0 0
6
6
1
1 0
4
9 2
4
1
1
9
1
0
0
0
Urb
an
Fem
ale
B
ih
a
r
0 0 1
2 0 0 0 0 0 0
3
1
0
0 0 0 0 0 0 0
3
0
8
0 0 0 0 0 1
5
3
5
5
1
0
0
0
I
n
di
a
6
3
4
2
3
4
1
2 6 0 4 2 5
1
3
9
4
2 5 3
2
6
2
8 2 0 2 2
2
4
3
9
4
3 3
4
4
8
2
1
1
0
0
0
Urb
an
Pers
on
B
ih
a
r
8
8 7 7 0 0 0 0 0 0
1
8
3
0 0 0 0 0 0 0
1
8
2
0 0 0 1
4 0
3
0
9
2
1
0
1
0
0
0
I
n
di
a
1
6
9
3
8
4
0
3
9 5 3 3 5 4
6
5
1
9 3 6
2
0
1
2 4 0 1
3
8
1
7
1
7
4
6 3
4
2
7
1
4
1
0
0
0
Tota
l
Mal
e
B
ih
a
r
2
9
3
4 0 0 0 0 0 0 0 0 0 0 0 0 0 0 0 0 0 0 0 8 0
2
6
9
4
2
5
1
0
0
0
I
n
di
2
9
1
5
0
3
2
4
8 5 3 3 6 2 9 3 2 9
1
9 2 6 1 1
9
1 8 0
3
9 2
3
5
0
1
2
1
0
0
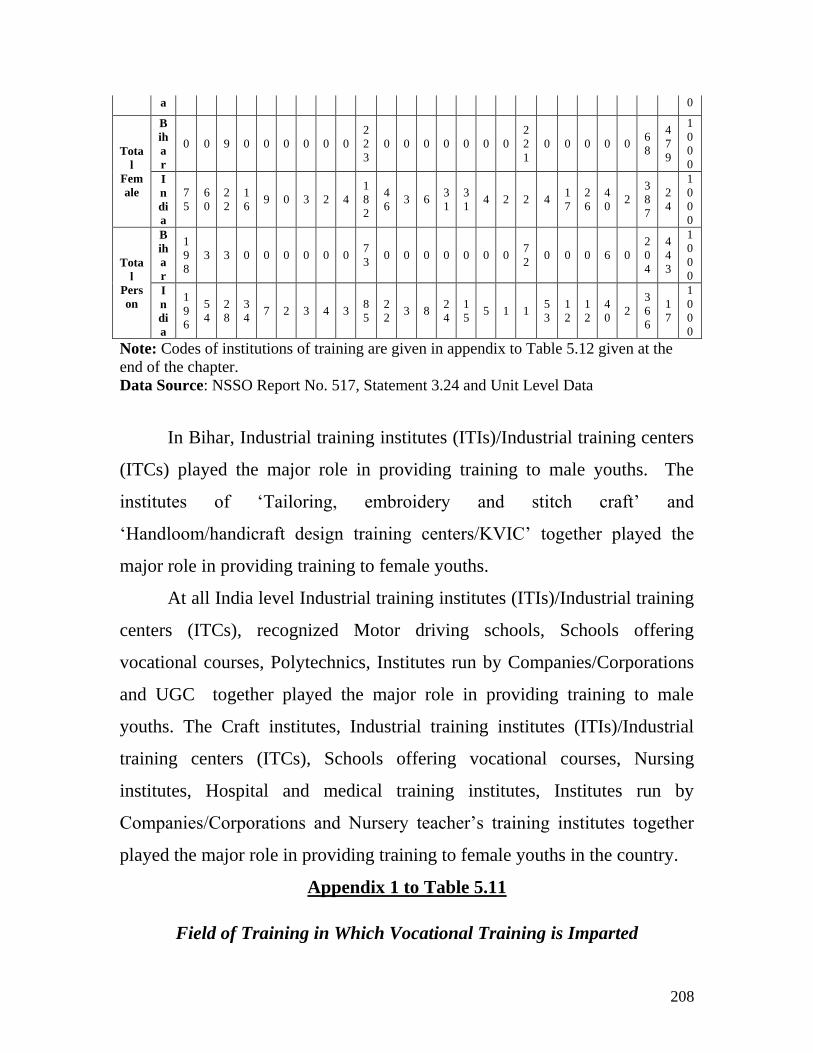
208
a 0
Tota
l
Fem
ale
B
ih
a
r
0 0 9 0 0 0 0 0 0
2
2
3
0 0 0 0 0 0 0
2
2
1
0 0 0 0 0 6
8
4
7
9
1
0
0
0
I
n
di
a
7
5
6
0
2
2
1
6 9 0 3 2 4
1
8
2
4
6 3 6
3
1
3
1 4 2 2 4
1
7
2
6
4
0 2
3
8
7
2
4
1
0
0
0
Tota
l
Pers
on
B
ih
a
r
1
9
8
3 3 0 0 0 0 0 0 7
3 0 0 0 0 0 0 0
7
2 0 0 0 6 0
2
0
4
4
4
3
1
0
0
0
I
n
di
a
1
9
6
5
4
2
8
3
4 7 2 3 4 3
8
5
2
2 3 8
2
4
1
5 5 1 1
5
3
1
2
1
2
4
0 2
3
6
6
1
7
1
0
0
0
Note: Codes of institutions of training are given in appendix to Table 5.12 given at the
end of the chapter.
Data Source: NSSO Report No. 517, Statement 3.24 and Unit Level Data
In Bihar, Industrial training institutes (ITIs)/Industrial training centers
(ITCs) played the major role in providing training to male youths. The
institutes of ‗Tailoring, embroidery and stitch craft‘ and
‗Handloom/handicraft design training centers/KVIC‘ together played the
major role in providing training to female youths.
At all India level Industrial training institutes (ITIs)/Industrial training
centers (ITCs), recognized Motor driving schools, Schools offering
vocational courses, Polytechnics, Institutes run by Companies/Corporations
and UGC together played the major role in providing training to male
youths. The Craft institutes, Industrial training institutes (ITIs)/Industrial
training centers (ITCs), Schools offering vocational courses, Nursing
institutes, Hospital and medical training institutes, Institutes run by
Companies/Corporations and Nursery teacher‘s training institutes together
played the major role in providing training to female youths in the country.
Appendix 1 to Table 5.11
Field of Training in Which Vocational Training is Imparted
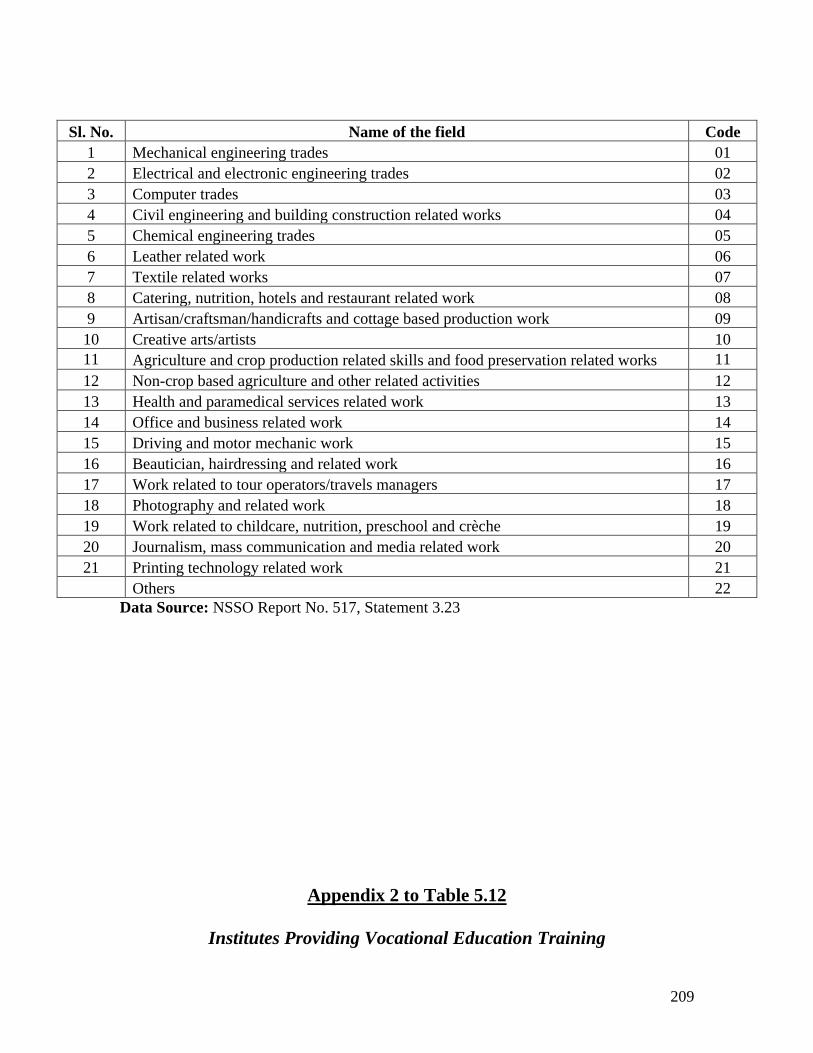
209
Sl. No. Name of the field Code
1 Mechanical engineering trades 01
2 Electrical and electronic engineering trades 02
3 Computer trades 03
4 Civil engineering and building construction related works 04
5 Chemical engineering trades 05
6 Leather related work 06
7 Textile related works 07
8 Catering, nutrition, hotels and restaurant related work 08
9 Artisan/craftsman/handicrafts and cottage based production work 09
10 Creative arts/artists 10
11 Agriculture and crop production related skills and food preservation related works 11
12 Non-crop based agriculture and other related activities 12
13 Health and paramedical services related work 13
14 Office and business related work 14
15 Driving and motor mechanic work 15
16 Beautician, hairdressing and related work 16
17 Work related to tour operators/travels managers 17
18 Photography and related work 18
19 Work related to childcare, nutrition, preschool and crèche 19
20 Journalism, mass communication and media related work 20
21 Printing technology related work 21
Others 22
Data Source: NSSO Report No. 517, Statement 3.23
Appendix 2 to Table 5.12
Institutes Providing Vocational Education Training
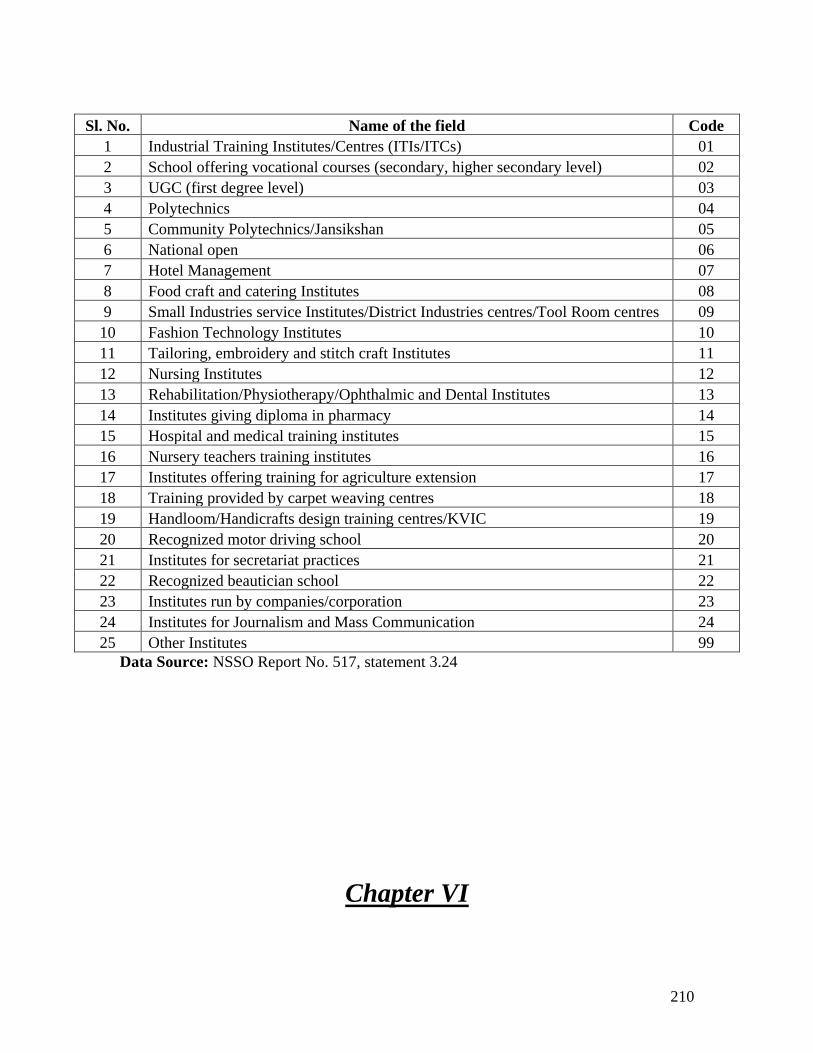
210
Sl. No. Name of the field Code
1 Industrial Training Institutes/Centres (ITIs/ITCs) 01
2 School offering vocational courses (secondary, higher secondary level) 02
3 UGC (first degree level) 03
4 Polytechnics 04
5 Community Polytechnics/Jansikshan 05
6 National open 06
7 Hotel Management 07
8 Food craft and catering Institutes 08
9 Small Industries service Institutes/District Industries centres/Tool Room centres 09
10 Fashion Technology Institutes 10
11 Tailoring, embroidery and stitch craft Institutes 11
12 Nursing Institutes 12
13 Rehabilitation/Physiotherapy/Ophthalmic and Dental Institutes 13
14 Institutes giving diploma in pharmacy 14
15 Hospital and medical training institutes 15
16 Nursery teachers training institutes 16
17 Institutes offering training for agriculture extension 17
18 Training provided by carpet weaving centres 18
19 Handloom/Handicrafts design training centres/KVIC 19
20 Recognized motor driving school 20
21 Institutes for secretariat practices 21
22 Recognized beautician school 22
23 Institutes run by companies/corporation 23
24 Institutes for Journalism and Mass Communication 24
25 Other Institutes 99
Data Source: NSSO Report No. 517, statement 3.24
Chapter VI
211
Estimating the Demand of persons with Vocational
Education and Training
6.1 Introduction
Vocational Education and Training includes two parts viz. Vocational
Education, and Vocational Training. Vocational Education in India refers
specifically to vocational courses offered in school Grades 11 and 12 under a
centrally sponsored scheme. Now the Government is encouraging these
vocational courses in school for lower grades also. Vocational Education
falls under the purview of Ministry of Human Resource Development.
Vocational Training is imparted in a variety of institutions (24 categories)
which are supported by various ministries but most of them are supported by
the Departments of Labour in State Government while they may make use of
the central funds under various schemes.
Vocational training is generally given by ITIs/ITCs, run under the
supervision of Labour Department of the state government. In Bihar state,
besides ITIs, other Departments/Institutes which impart vocational training
are: KVIC; Bihar Urban Development Authority (BUDA); Directorate of
Handloom, Department of Industries; Sericulture Division, Department of
Industries; Upendra Maharathi Shilp Anushandhan Sansthan Department of
Industries; and Micro, Small and Medium enterprise Development Institute.
The main objective of vocational training is to prepare persons,
especially the youth, for the working life and make them employable for a
broad range of occupations in various industries and other economic sectors
where there is demand for skilled personnel. It aims at imparting training to
persons in very specific field through providing significant ‗hands on‘
212
experience in acquiring necessary skill, which make them employable or
create for them opportunity of self employment (NSSO, 2006) .
In this chapter demand of persons with vocational education and
training, has been estimated for Bihar state for the terminal years of 2010,
2015, 2020 and 2025. Demand of these persons has been estimated for three
segments: (a) within the state (b) in other states of India and (c) in other
countries of the world. Beside this, the chapter includes the estimates of
shortages and surpluses of persons with vocational training in the state in
terminal years.
6.2 Demand of Persons with Vocational Education and Training within
state
NSSO surveys on employment and unemployment give the
distribution of total number of persons employed in the state by industry,
and by age-groups. It also gives the distribution of technical persons
employed in the state by industry. Various classifications, along with the
codes, used in the distribution of technical persons are given in chapter I on
―Introduction‖. As per NSSO, estimates of persons having diploma or
certificate (below graduate level) are available. It does not separate out
diploma and certificate. So the estimates of Diploma/Certificate (below
graduate level) have been taken as vocationally trained persons. So their
estimate would give an estimate of persons with vocational education and
training in the state in that year. As per our view persons having Diploma
(below graduate level) from technical institutions should not be included in
vocational training but their number is very small as compared to certificate
holders (below graduate level).
213
Thus number of technical persons with diploma or certificate (below
graduate level) employed in the state in terminal years would give an
estimate of demand of persons with vocational training in the state for those
years. This demand of persons (who would be employed in the state) would
be considered as stock of demand. If we add the number of unemployed
persons with vocational training in those terminal years to this demand it
would give the stock of supply in those years. If we take the difference of
stocks of demand in two terminal years it would give the additional demand
generated between those two years. For estimating the demand (in stock
sense) of vocationally trained persons two methods have been used. They
were discussed in detail in Chapter 2.
Growth Rates of GSDP
In both these methods Compound Annual Growth Rates (CAGRs) of
industry-wise GSDP at constant prices have been estimated for the periods
2005-10, 2010-15, 2015-20 and 2020-25 (Tables 6.1 to 6.3). As an
illustration, CAGR for the period 2005-10 has been obtained as the growth
of GSDP during the period 2004-05 to 2009-10 by solving the following
equation (Tables 6.1) for g.
Y t 5 = Y t
(1+g) 5
Where,
Y t 5 = GSDP in year 2009-10
Y t = GSDP in year 2004-05
g = CAGR during the period between 2004-05 and 2009-10
During the period 2005-10 growth of GSDP in Bihar was very high
i.e.10.64 per cent per annum. It was higher than the targeted growth rate of
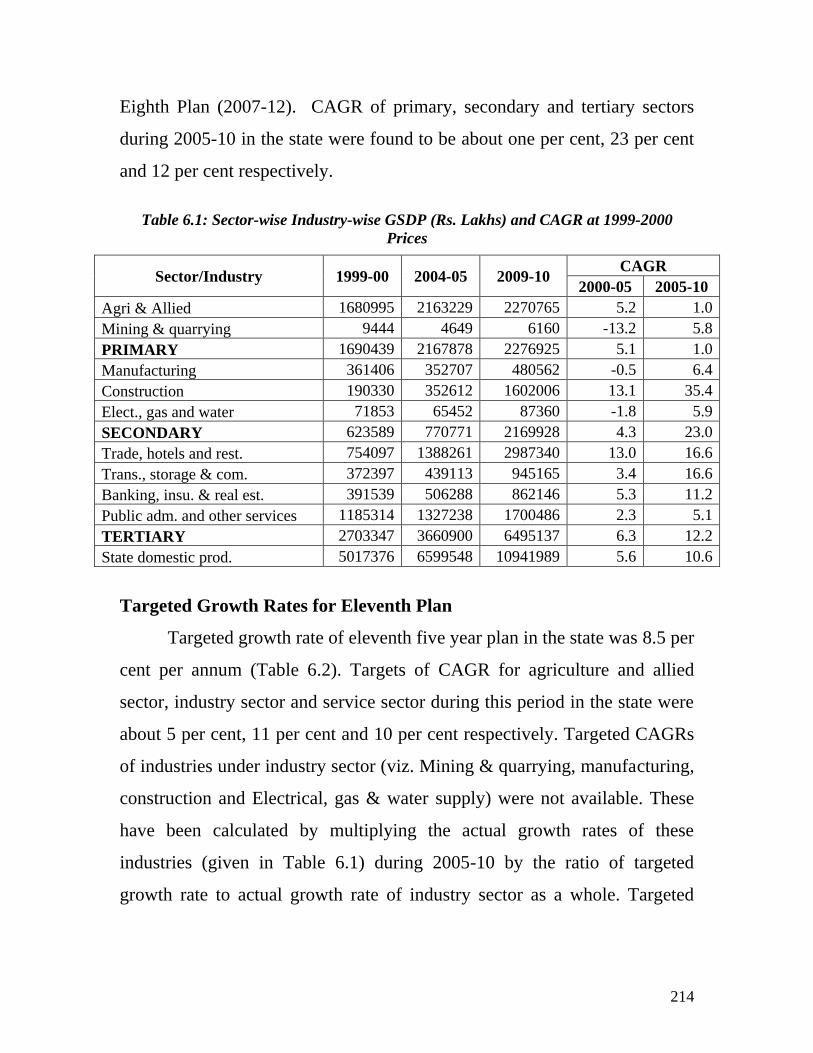
214
Eighth Plan (2007-12). CAGR of primary, secondary and tertiary sectors
during 2005-10 in the state were found to be about one per cent, 23 per cent
and 12 per cent respectively.
Table 6.1: Sector-wise Industry-wise GSDP (Rs. Lakhs) and CAGR at 1999-2000
Prices
Sector/Industry 1999-00 2004-05 2009-10 CAGR
2000-05 2005-10
Agri & Allied 1680995 2163229 2270765 5.2 1.0
Mining & quarrying 9444 4649 6160 -13.2 5.8
PRIMARY 1690439 2167878 2276925 5.1 1.0
Manufacturing 361406 352707 480562 -0.5 6.4
Construction 190330 352612 1602006 13.1 35.4
Elect., gas and water 71853 65452 87360 -1.8 5.9
SECONDARY 623589 770771 2169928 4.3 23.0
Trade, hotels and rest. 754097 1388261 2987340 13.0 16.6
Trans., storage & com. 372397 439113 945165 3.4 16.6
Banking, insu. & real est. 391539 506288 862146 5.3 11.2
Public adm. and other services 1185314 1327238 1700486 2.3 5.1
TERTIARY 2703347 3660900 6495137 6.3 12.2
State domestic prod. 5017376 6599548 10941989 5.6 10.6
Targeted Growth Rates for Eleventh Plan
Targeted growth rate of eleventh five year plan in the state was 8.5 per
cent per annum (Table 6.2). Targets of CAGR for agriculture and allied
sector, industry sector and service sector during this period in the state were
about 5 per cent, 11 per cent and 10 per cent respectively. Targeted CAGRs
of industries under industry sector (viz. Mining & quarrying, manufacturing,
construction and Electrical, gas & water supply) were not available. These
have been calculated by multiplying the actual growth rates of these
industries (given in Table 6.1) during 2005-10 by the ratio of targeted
growth rate to actual growth rate of industry sector as a whole. Targeted
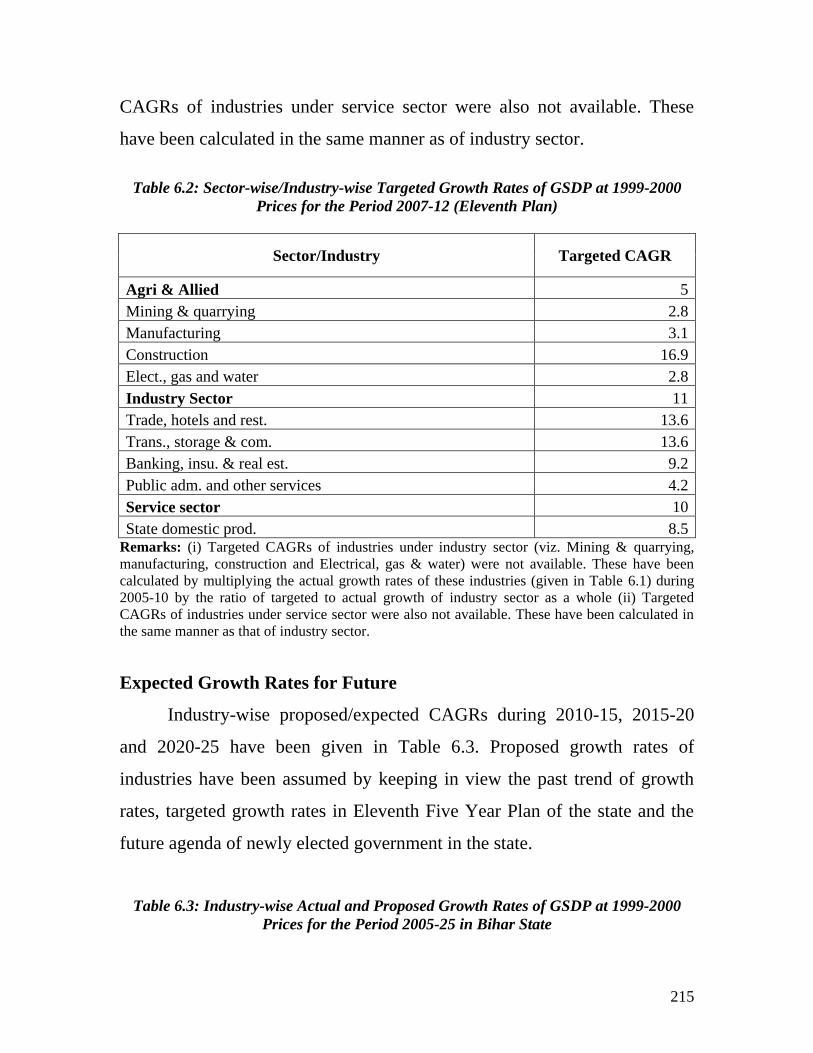
215
CAGRs of industries under service sector were also not available. These
have been calculated in the same manner as of industry sector.
Table 6.2: Sector-wise/Industry-wise Targeted Growth Rates of GSDP at 1999-2000
Prices for the Period 2007-12 (Eleventh Plan)
Sector/Industry Targeted CAGR
Agri & Allied 5
Mining & quarrying 2.8
Manufacturing 3.1
Construction 16.9
Elect., gas and water 2.8
Industry Sector 11
Trade, hotels and rest. 13.6
Trans., storage & com. 13.6
Banking, insu. & real est. 9.2
Public adm. and other services 4.2
Service sector 10
State domestic prod. 8.5 Remarks: (i) Targeted CAGRs of industries under industry sector (viz. Mining & quarrying,
manufacturing, construction and Electrical, gas & water) were not available. These have been
calculated by multiplying the actual growth rates of these industries (given in Table 6.1) during
2005-10 by the ratio of targeted to actual growth of industry sector as a whole (ii) Targeted
CAGRs of industries under service sector were also not available. These have been calculated in
the same manner as that of industry sector.
Expected Growth Rates for Future
Industry-wise proposed/expected CAGRs during 2010-15, 2015-20
and 2020-25 have been given in Table 6.3. Proposed growth rates of
industries have been assumed by keeping in view the past trend of growth
rates, targeted growth rates in Eleventh Five Year Plan of the state and the
future agenda of newly elected government in the state.
Table 6.3: Industry-wise Actual and Proposed Growth Rates of GSDP at 1999-2000
Prices for the Period 2005-25 in Bihar State
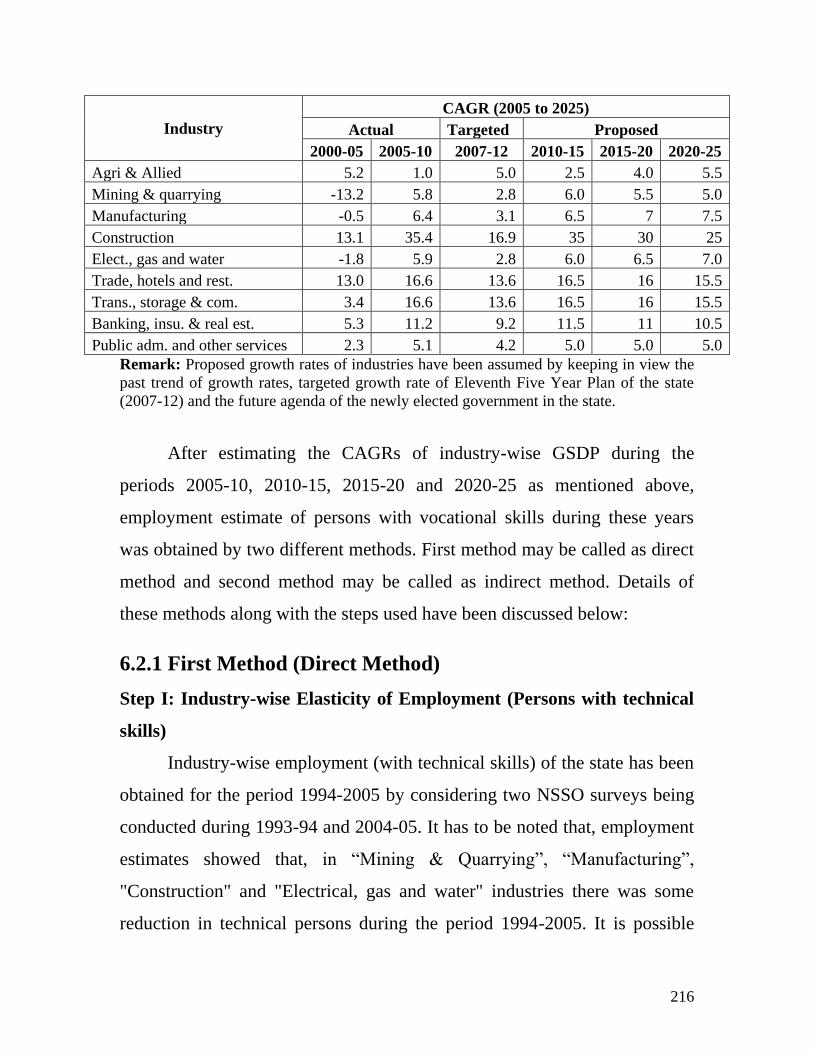
216
Industry
CAGR (2005 to 2025)
Actual Targeted Proposed
2000-05 2005-10 2007-12 2010-15 2015-20 2020-25
Agri & Allied 5.2 1.0 5.0 2.5 4.0 5.5
Mining & quarrying -13.2 5.8 2.8 6.0 5.5 5.0
Manufacturing -0.5 6.4 3.1 6.5 7 7.5
Construction 13.1 35.4 16.9 35 30 25
Elect., gas and water -1.8 5.9 2.8 6.0 6.5 7.0
Trade, hotels and rest. 13.0 16.6 13.6 16.5 16 15.5
Trans., storage & com. 3.4 16.6 13.6 16.5 16 15.5
Banking, insu. & real est. 5.3 11.2 9.2 11.5 11 10.5
Public adm. and other services 2.3 5.1 4.2 5.0 5.0 5.0
Remark: Proposed growth rates of industries have been assumed by keeping in view the
past trend of growth rates, targeted growth rate of Eleventh Five Year Plan of the state
(2007-12) and the future agenda of the newly elected government in the state.
After estimating the CAGRs of industry-wise GSDP during the
periods 2005-10, 2010-15, 2015-20 and 2020-25 as mentioned above,
employment estimate of persons with vocational skills during these years
was obtained by two different methods. First method may be called as direct
method and second method may be called as indirect method. Details of
these methods along with the steps used have been discussed below:
6.2.1 First Method (Direct Method)
Step I: Industry-wise Elasticity of Employment (Persons with technical
skills)
Industry-wise employment (with technical skills) of the state has been
obtained for the period 1994-2005 by considering two NSSO surveys being
conducted during 1993-94 and 2004-05. It has to be noted that, employment
estimates showed that, in ―Mining & Quarrying‖, ―Manufacturing‖,
"Construction" and "Electrical, gas and water" industries there was some
reduction in technical persons during the period 1994-2005. It is possible
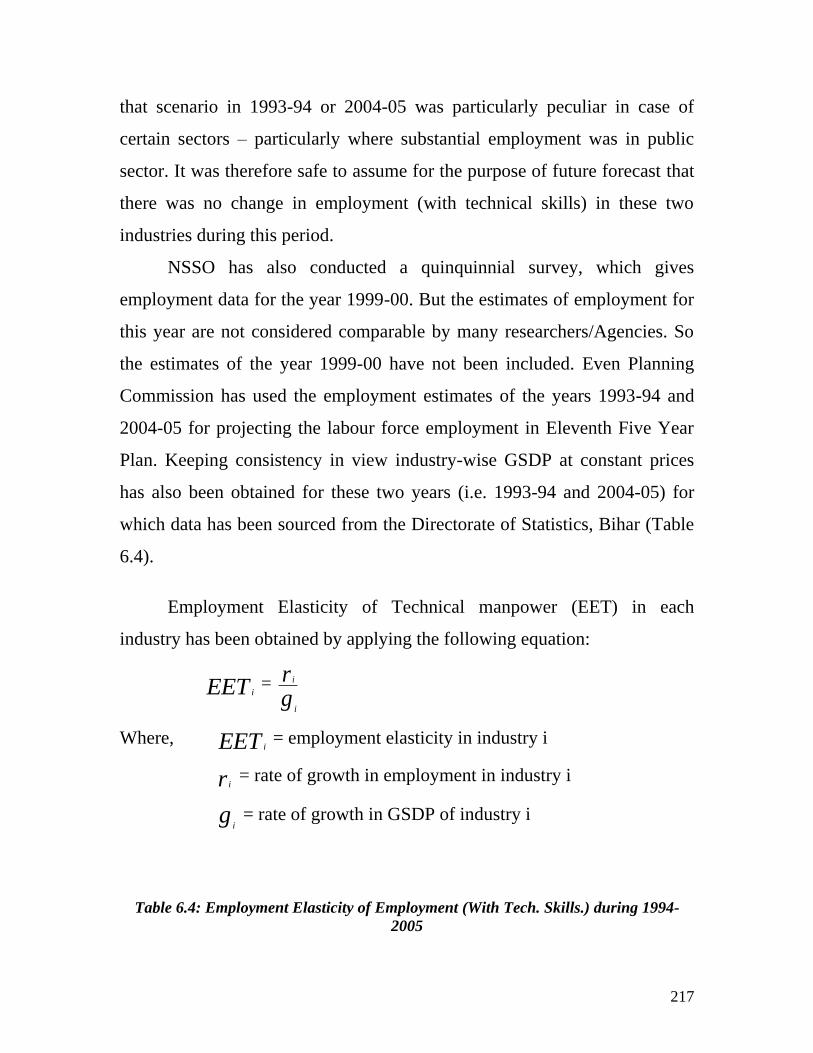
217
that scenario in 1993-94 or 2004-05 was particularly peculiar in case of
certain sectors – particularly where substantial employment was in public
sector. It was therefore safe to assume for the purpose of future forecast that
there was no change in employment (with technical skills) in these two
industries during this period.
NSSO has also conducted a quinquinnial survey, which gives
employment data for the year 1999-00. But the estimates of employment for
this year are not considered comparable by many researchers/Agencies. So
the estimates of the year 1999-00 have not been included. Even Planning
Commission has used the employment estimates of the years 1993-94 and
2004-05 for projecting the labour force employment in Eleventh Five Year
Plan. Keeping consistency in view industry-wise GSDP at constant prices
has also been obtained for these two years (i.e. 1993-94 and 2004-05) for
which data has been sourced from the Directorate of Statistics, Bihar (Table
6.4).
Employment Elasticity of Technical manpower (EET) in each
industry has been obtained by applying the following equation:
EET i =
gr
i
i
Where, EET i = employment elasticity in industry i
r i = rate of growth in employment in industry i
gi = rate of growth in GSDP of industry i
Table 6.4: Employment Elasticity of Employment (With Tech. Skills.) during 1994-
2005
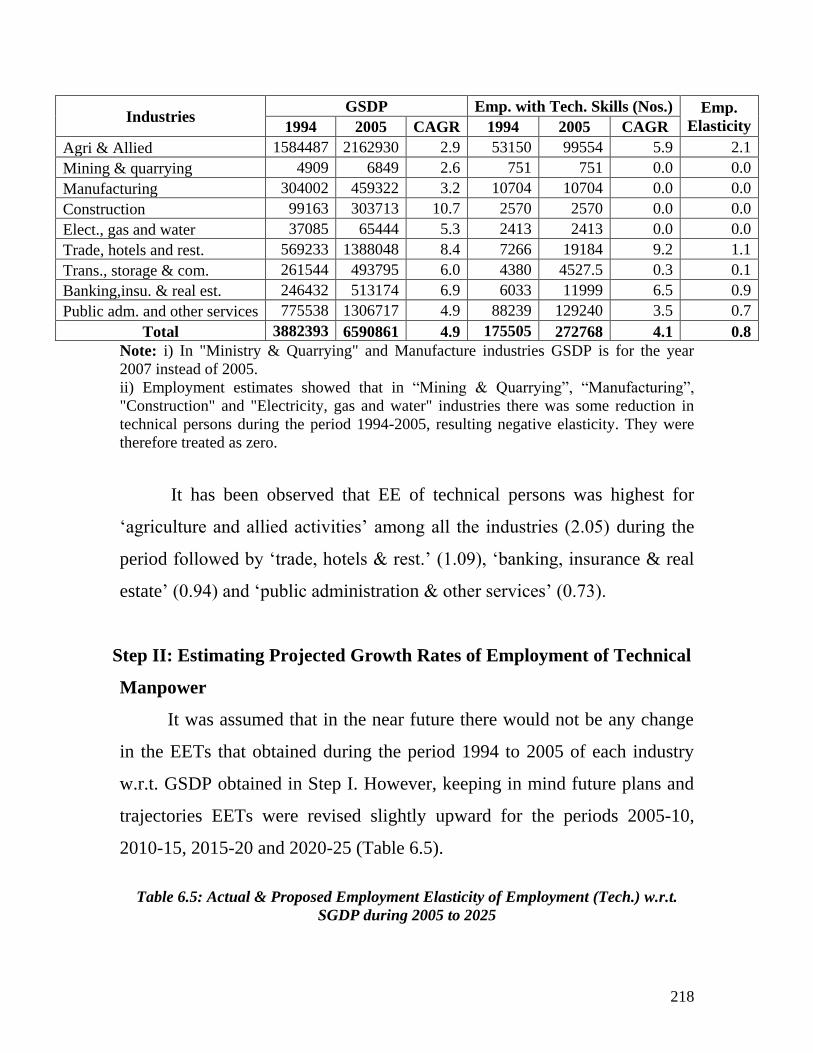
218
Industries GSDP Emp. with Tech. Skills (Nos.) Emp.
Elasticity 1994 2005 CAGR 1994 2005 CAGR
Agri & Allied 1584487 2162930 2.9 53150 99554 5.9 2.1
Mining & quarrying 4909 6849 2.6 751 751 0.0 0.0
Manufacturing 304002 459322 3.2 10704 10704 0.0 0.0
Construction 99163 303713 10.7 2570 2570 0.0 0.0
Elect., gas and water 37085 65444 5.3 2413 2413 0.0 0.0
Trade, hotels and rest. 569233 1388048 8.4 7266 19184 9.2 1.1
Trans., storage & com. 261544 493795 6.0 4380 4527.5 0.3 0.1
Banking,insu. & real est. 246432 513174 6.9 6033 11999 6.5 0.9
Public adm. and other services 775538 1306717 4.9 88239 129240 3.5 0.7
Total 3882393 6590861 4.9 175505 272768 4.1 0.8
Note: i) In "Ministry & Quarrying" and Manufacture industries GSDP is for the year
2007 instead of 2005.
ii) Employment estimates showed that in ―Mining & Quarrying‖, ―Manufacturing‖,
"Construction" and "Electricity, gas and water" industries there was some reduction in
technical persons during the period 1994-2005, resulting negative elasticity. They were
therefore treated as zero.
It has been observed that EE of technical persons was highest for
‗agriculture and allied activities‘ among all the industries (2.05) during the
period followed by ‗trade, hotels & rest.‘ (1.09), ‗banking, insurance & real
estate‘ (0.94) and ‗public administration & other services‘ (0.73).
Step II: Estimating Projected Growth Rates of Employment of Technical
Manpower
It was assumed that in the near future there would not be any change
in the EETs that obtained during the period 1994 to 2005 of each industry
w.r.t. GSDP obtained in Step I. However, keeping in mind future plans and
trajectories EETs were revised slightly upward for the periods 2005-10,
2010-15, 2015-20 and 2020-25 (Table 6.5).
Table 6.5: Actual & Proposed Employment Elasticity of Employment (Tech.) w.r.t.
SGDP during 2005 to 2025
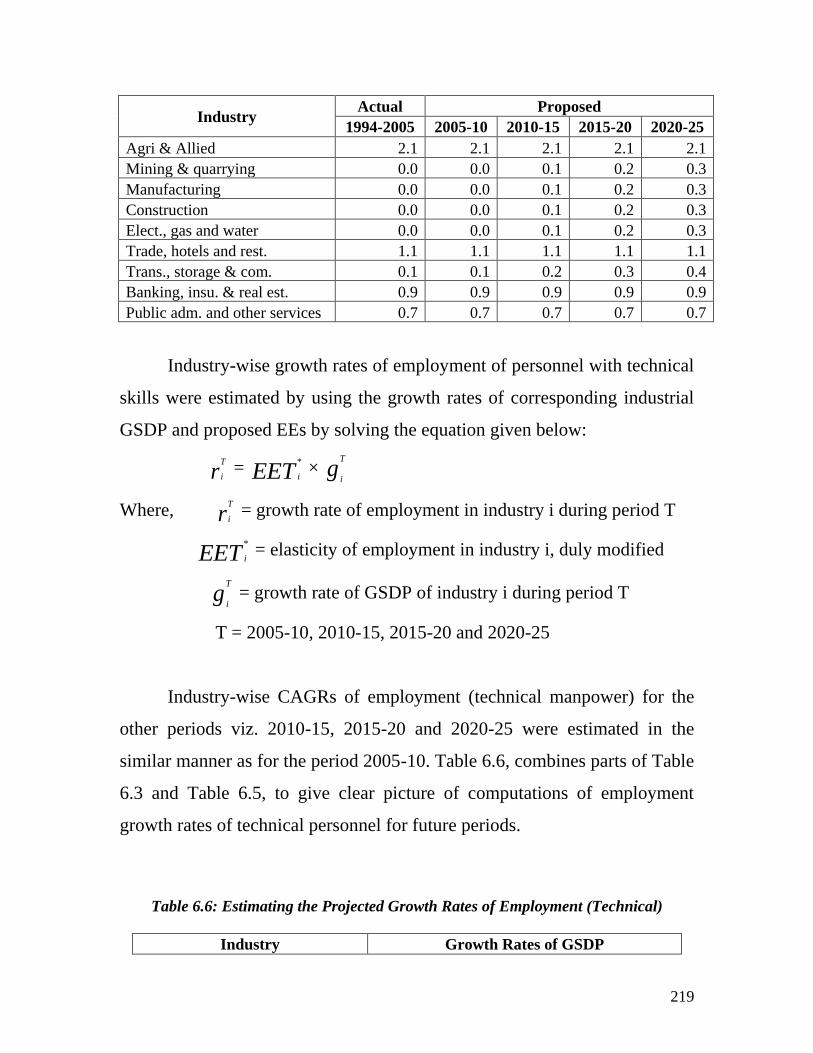
219
Industry Actual Proposed
1994-2005 2005-10 2010-15 2015-20 2020-25
Agri & Allied 2.1 2.1 2.1 2.1 2.1
Mining & quarrying 0.0 0.0 0.1 0.2 0.3
Manufacturing 0.0 0.0 0.1 0.2 0.3
Construction 0.0 0.0 0.1 0.2 0.3
Elect., gas and water 0.0 0.0 0.1 0.2 0.3
Trade, hotels and rest. 1.1 1.1 1.1 1.1 1.1
Trans., storage & com. 0.1 0.1 0.2 0.3 0.4
Banking, insu. & real est. 0.9 0.9 0.9 0.9 0.9
Public adm. and other services 0.7 0.7 0.7 0.7 0.7
Industry-wise growth rates of employment of personnel with technical
skills were estimated by using the growth rates of corresponding industrial
GSDP and proposed EEs by solving the equation given below:
rT
i = EET i
* × g
T
i
Where, rT
i = growth rate of employment in industry i during period T
EET i
* = elasticity of employment in industry i, duly modified
gT
i = growth rate of GSDP of industry i during period T
T = 2005-10, 2010-15, 2015-20 and 2020-25
Industry-wise CAGRs of employment (technical manpower) for the
other periods viz. 2010-15, 2015-20 and 2020-25 were estimated in the
similar manner as for the period 2005-10. Table 6.6, combines parts of Table
6.3 and Table 6.5, to give clear picture of computations of employment
growth rates of technical personnel for future periods.
Table 6.6: Estimating the Projected Growth Rates of Employment (Technical)
Industry Growth Rates of GSDP
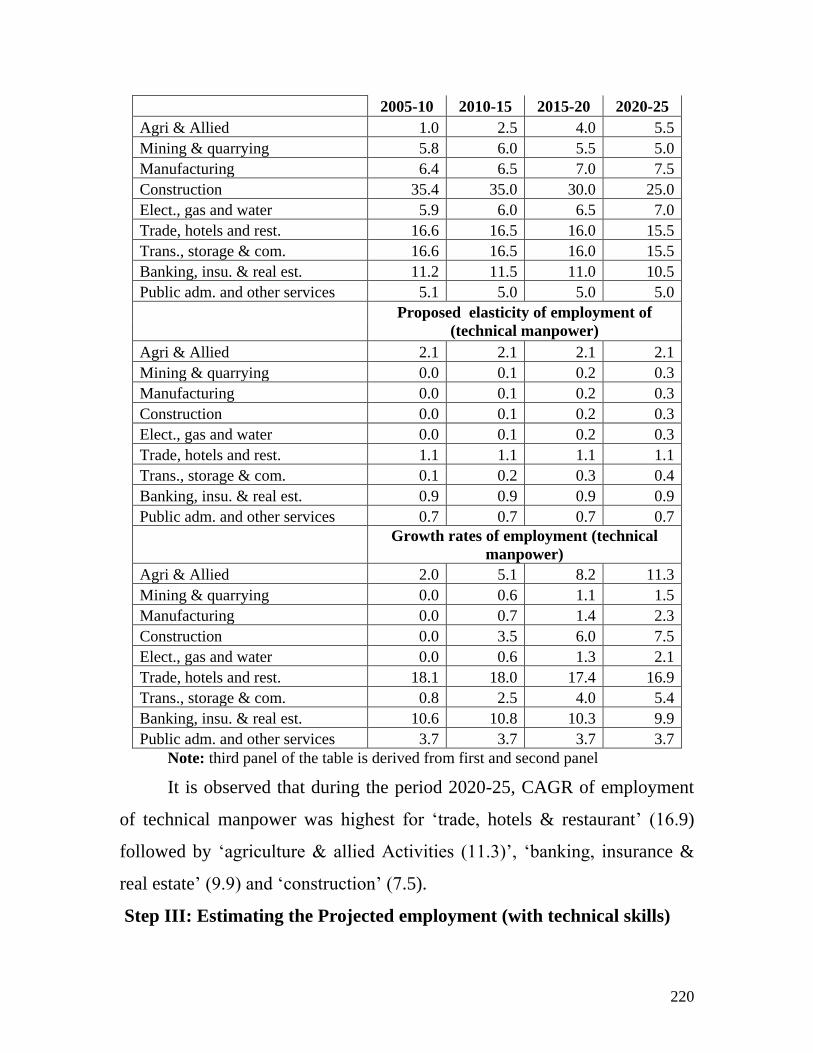
220
2005-10 2010-15 2015-20 2020-25
Agri & Allied 1.0 2.5 4.0 5.5
Mining & quarrying 5.8 6.0 5.5 5.0
Manufacturing 6.4 6.5 7.0 7.5
Construction 35.4 35.0 30.0 25.0
Elect., gas and water 5.9 6.0 6.5 7.0
Trade, hotels and rest. 16.6 16.5 16.0 15.5
Trans., storage & com. 16.6 16.5 16.0 15.5
Banking, insu. & real est. 11.2 11.5 11.0 10.5
Public adm. and other services 5.1 5.0 5.0 5.0
Proposed elasticity of employment of
(technical manpower)
Agri & Allied 2.1 2.1 2.1 2.1
Mining & quarrying 0.0 0.1 0.2 0.3
Manufacturing 0.0 0.1 0.2 0.3
Construction 0.0 0.1 0.2 0.3
Elect., gas and water 0.0 0.1 0.2 0.3
Trade, hotels and rest. 1.1 1.1 1.1 1.1
Trans., storage & com. 0.1 0.2 0.3 0.4
Banking, insu. & real est. 0.9 0.9 0.9 0.9
Public adm. and other services 0.7 0.7 0.7 0.7
Growth rates of employment (technical
manpower)
Agri & Allied 2.0 5.1 8.2 11.3
Mining & quarrying 0.0 0.6 1.1 1.5
Manufacturing 0.0 0.7 1.4 2.3
Construction 0.0 3.5 6.0 7.5
Elect., gas and water 0.0 0.6 1.3 2.1
Trade, hotels and rest. 18.1 18.0 17.4 16.9
Trans., storage & com. 0.8 2.5 4.0 5.4
Banking, insu. & real est. 10.6 10.8 10.3 9.9
Public adm. and other services 3.7 3.7 3.7 3.7
Note: third panel of the table is derived from first and second panel
It is observed that during the period 2020-25, CAGR of employment
of technical manpower was highest for ‗trade, hotels & restaurant‘ (16.9)
followed by ‗agriculture & allied Activities (11.3)‘, ‗banking, insurance &
real estate‘ (9.9) and ‗construction‘ (7.5).
Step III: Estimating the Projected employment (with technical skills)
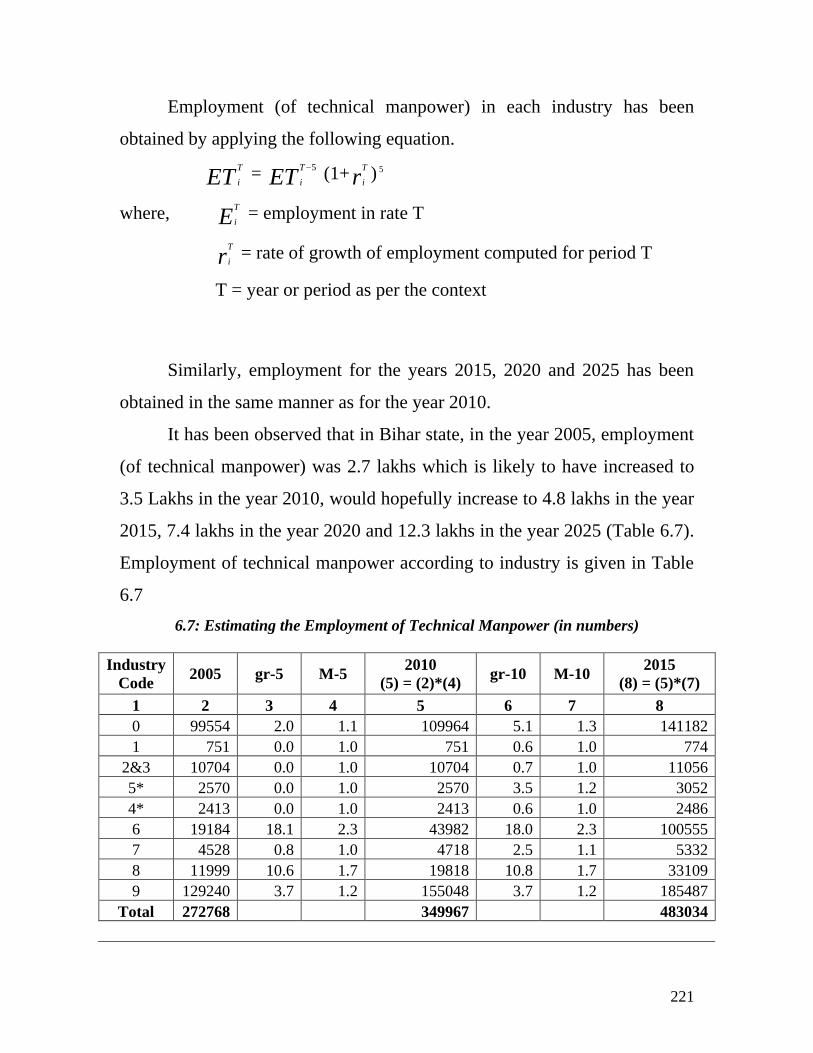
221
Employment (of technical manpower) in each industry has been
obtained by applying the following equation.
ETT
i = ET
T
i
5 (1+r
T
i) 5
where, ET
i = employment in rate T
rT
i = rate of growth of employment computed for period T
T = year or period as per the context
Similarly, employment for the years 2015, 2020 and 2025 has been
obtained in the same manner as for the year 2010.
It has been observed that in Bihar state, in the year 2005, employment
(of technical manpower) was 2.7 lakhs which is likely to have increased to
3.5 Lakhs in the year 2010, would hopefully increase to 4.8 lakhs in the year
2015, 7.4 lakhs in the year 2020 and 12.3 lakhs in the year 2025 (Table 6.7).
Employment of technical manpower according to industry is given in Table
6.7
6.7: Estimating the Employment of Technical Manpower (in numbers)
Industry
Code 2005 gr-5 M-5
2010
(5) = (2)*(4) gr-10 M-10
2015
(8) = (5)*(7)
1 2 3 4 5 6 7 8
0 99554 2.0 1.1 109964 5.1 1.3 141182
1 751 0.0 1.0 751 0.6 1.0 774
2&3 10704 0.0 1.0 10704 0.7 1.0 11056
5* 2570 0.0 1.0 2570 3.5 1.2 3052
4* 2413 0.0 1.0 2413 0.6 1.0 2486
6 19184 18.1 2.3 43982 18.0 2.3 100555
7 4528 0.8 1.0 4718 2.5 1.1 5332
8 11999 10.6 1.7 19818 10.8 1.7 33109
9 129240 3.7 1.2 155048 3.7 1.2 185487
Total 272768 349967 483034
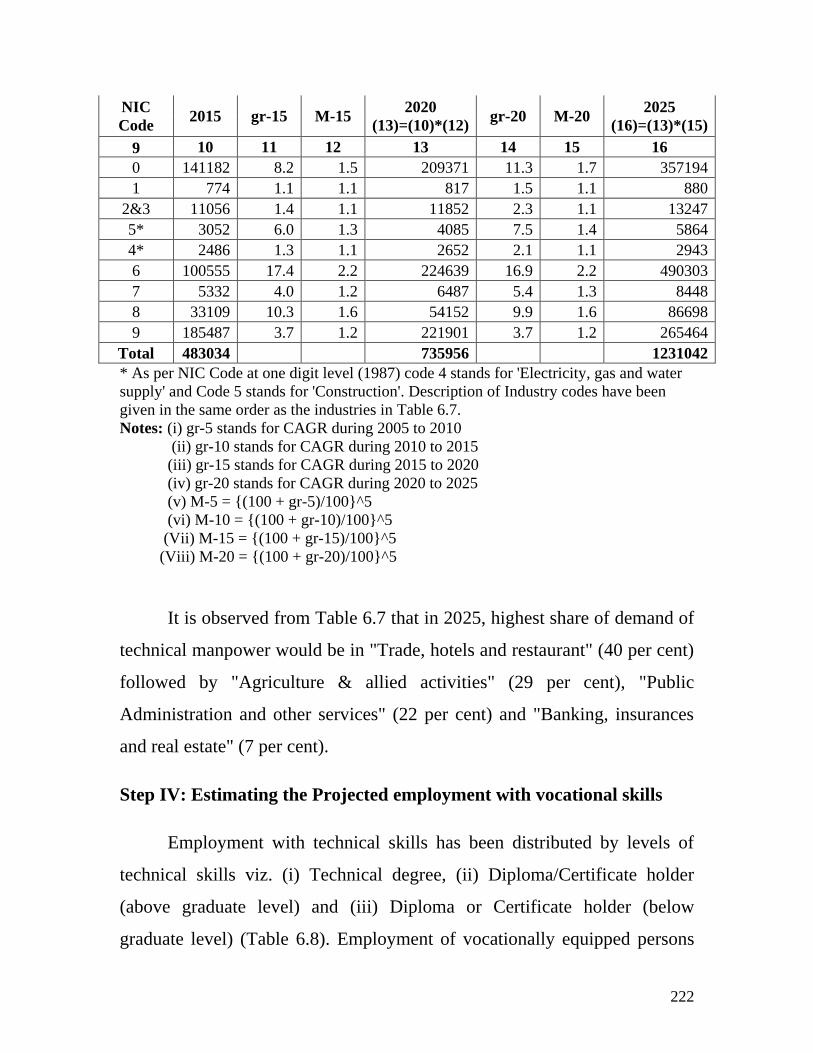
222
NIC
Code 2015 gr-15 M-15
2020
(13)=(10)*(12) gr-20 M-20
2025
(16)=(13)*(15)
9 10 11 12 13 14 15 16
0 141182 8.2 1.5 209371 11.3 1.7 357194
1 774 1.1 1.1 817 1.5 1.1 880
2&3 11056 1.4 1.1 11852 2.3 1.1 13247
5* 3052 6.0 1.3 4085 7.5 1.4 5864
4* 2486 1.3 1.1 2652 2.1 1.1 2943
6 100555 17.4 2.2 224639 16.9 2.2 490303
7 5332 4.0 1.2 6487 5.4 1.3 8448
8 33109 10.3 1.6 54152 9.9 1.6 86698
9 185487 3.7 1.2 221901 3.7 1.2 265464
Total 483034 735956 1231042
* As per NIC Code at one digit level (1987) code 4 stands for 'Electricity, gas and water
supply' and Code 5 stands for 'Construction'. Description of Industry codes have been
given in the same order as the industries in Table 6.7.
Notes: (i) gr-5 stands for CAGR during 2005 to 2010
(ii) gr-10 stands for CAGR during 2010 to 2015
(iii) gr-15 stands for CAGR during 2015 to 2020
(iv) gr-20 stands for CAGR during 2020 to 2025
(v) M-5 = {(100 + gr-5)/100}^5
(vi) M-10 = {(100 + gr-10)/100}^5
(Vii) M-15 = {(100 + gr-15)/100}^5
(Viii) M-20 = {(100 + gr-20)/100}^5
It is observed from Table 6.7 that in 2025, highest share of demand of
technical manpower would be in "Trade, hotels and restaurant" (40 per cent)
followed by "Agriculture & allied activities" (29 per cent), "Public
Administration and other services" (22 per cent) and "Banking, insurances
and real estate" (7 per cent).
Step IV: Estimating the Projected employment with vocational skills
Employment with technical skills has been distributed by levels of
technical skills viz. (i) Technical degree, (ii) Diploma/Certificate holder
(above graduate level) and (iii) Diploma or Certificate holder (below
graduate level) (Table 6.8). Employment of vocationally equipped persons
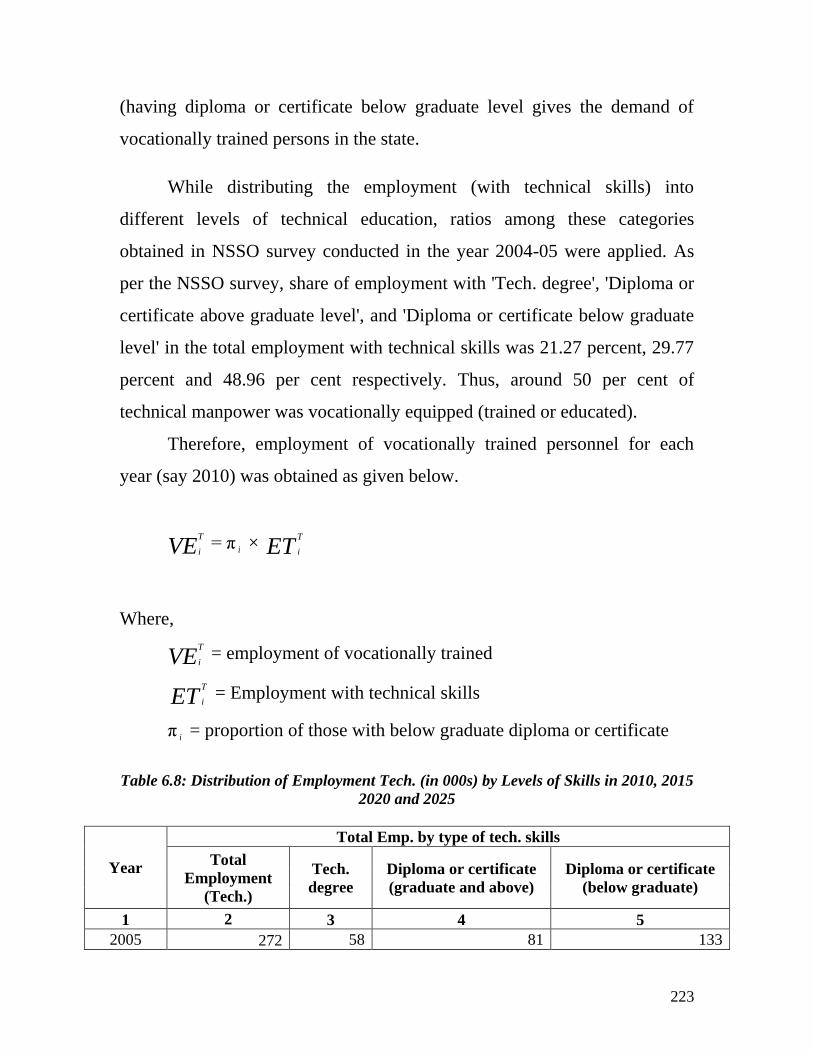
223
(having diploma or certificate below graduate level gives the demand of
vocationally trained persons in the state.
While distributing the employment (with technical skills) into
different levels of technical education, ratios among these categories
obtained in NSSO survey conducted in the year 2004-05 were applied. As
per the NSSO survey, share of employment with 'Tech. degree', 'Diploma or
certificate above graduate level', and 'Diploma or certificate below graduate
level' in the total employment with technical skills was 21.27 percent, 29.77
percent and 48.96 per cent respectively. Thus, around 50 per cent of
technical manpower was vocationally equipped (trained or educated).
Therefore, employment of vocationally trained personnel for each
year (say 2010) was obtained as given below.
VET
i = π i × ET
T
i
Where,
VET
i = employment of vocationally trained
ETT
i = Employment with technical skills
π i = proportion of those with below graduate diploma or certificate
Table 6.8: Distribution of Employment Tech. (in 000s) by Levels of Skills in 2010, 2015
2020 and 2025
Year
Total Emp. by type of tech. skills
Total
Employment
(Tech.)
Tech.
degree
Diploma or certificate
(graduate and above)
Diploma or certificate
(below graduate)
1 2 3 4 5
2005 272 58 81 133
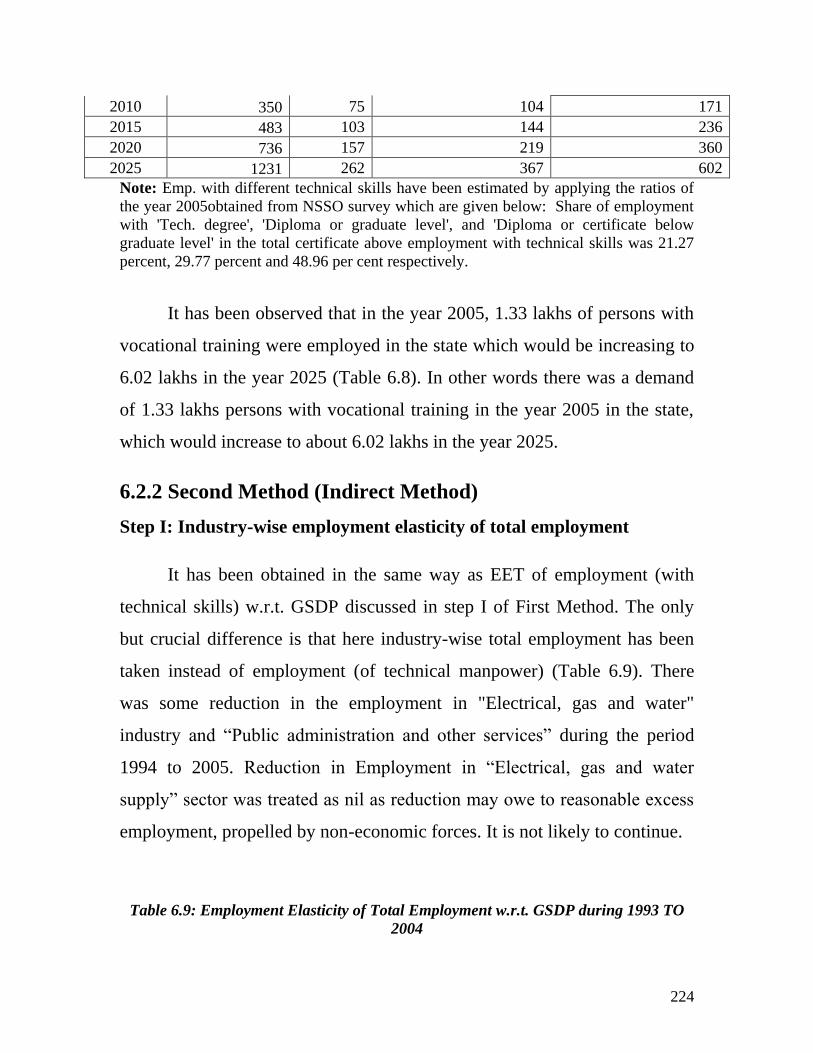
224
2010 350 75 104 171
2015 483 103 144 236
2020 736 157 219 360
2025 1231 262 367 602
Note: Emp. with different technical skills have been estimated by applying the ratios of
the year 2005obtained from NSSO survey which are given below: Share of employment
with 'Tech. degree', 'Diploma or graduate level', and 'Diploma or certificate below
graduate level' in the total certificate above employment with technical skills was 21.27
percent, 29.77 percent and 48.96 per cent respectively.
It has been observed that in the year 2005, 1.33 lakhs of persons with
vocational training were employed in the state which would be increasing to
6.02 lakhs in the year 2025 (Table 6.8). In other words there was a demand
of 1.33 lakhs persons with vocational training in the year 2005 in the state,
which would increase to about 6.02 lakhs in the year 2025.
6.2.2 Second Method (Indirect Method)
Step I: Industry-wise employment elasticity of total employment
It has been obtained in the same way as EET of employment (with
technical skills) w.r.t. GSDP discussed in step I of First Method. The only
but crucial difference is that here industry-wise total employment has been
taken instead of employment (of technical manpower) (Table 6.9). There
was some reduction in the employment in "Electrical, gas and water"
industry and ―Public administration and other services‖ during the period
1994 to 2005. Reduction in Employment in ―Electrical, gas and water
supply‖ sector was treated as nil as reduction may owe to reasonable excess
employment, propelled by non-economic forces. It is not likely to continue.
Table 6.9: Employment Elasticity of Total Employment w.r.t. GSDP during 1993 TO
2004
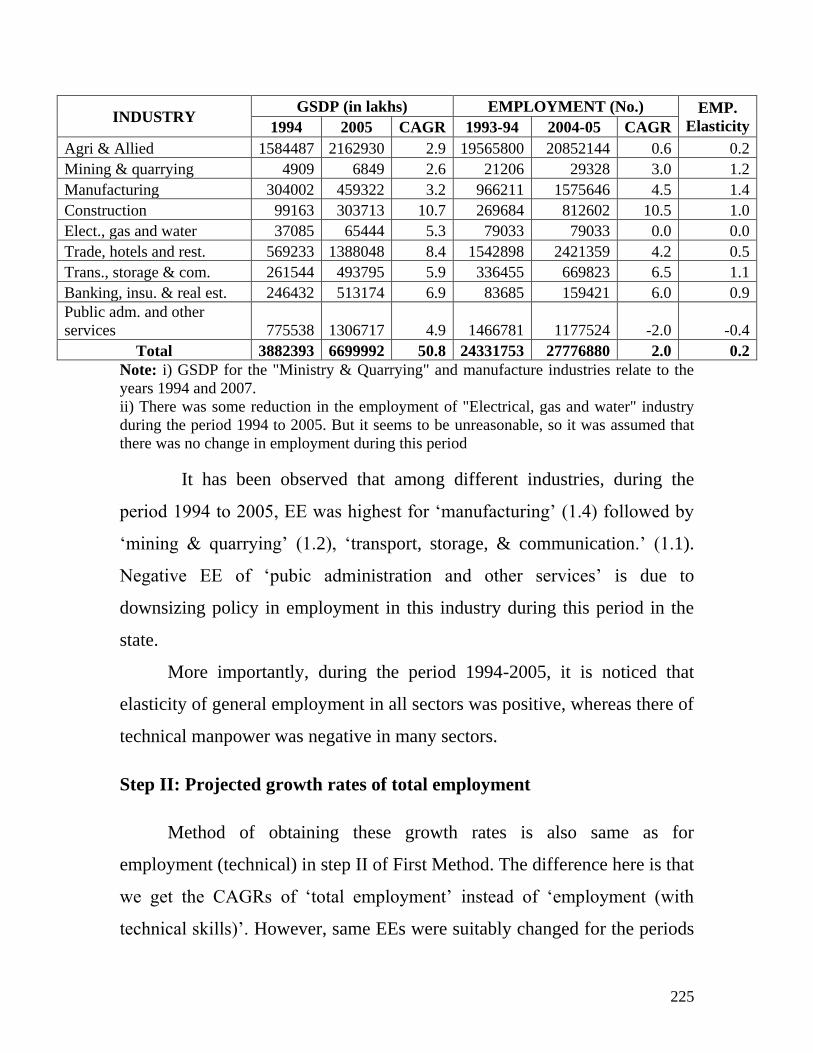
225
INDUSTRY GSDP (in lakhs) EMPLOYMENT (No.) EMP.
Elasticity 1994 2005 CAGR 1993-94 2004-05 CAGR
Agri & Allied 1584487 2162930 2.9 19565800 20852144 0.6 0.2
Mining & quarrying 4909 6849 2.6 21206 29328 3.0 1.2
Manufacturing 304002 459322 3.2 966211 1575646 4.5 1.4
Construction 99163 303713 10.7 269684 812602 10.5 1.0
Elect., gas and water 37085 65444 5.3 79033 79033 0.0 0.0
Trade, hotels and rest. 569233 1388048 8.4 1542898 2421359 4.2 0.5
Trans., storage & com. 261544 493795 5.9 336455 669823 6.5 1.1
Banking, insu. & real est. 246432 513174 6.9 83685 159421 6.0 0.9
Public adm. and other
services 775538 1306717 4.9 1466781 1177524 -2.0 -0.4
Total 3882393 6699992 50.8 24331753 27776880 2.0 0.2
Note: i) GSDP for the "Ministry & Quarrying" and manufacture industries relate to the
years 1994 and 2007.
ii) There was some reduction in the employment of "Electrical, gas and water" industry
during the period 1994 to 2005. But it seems to be unreasonable, so it was assumed that
there was no change in employment during this period
It has been observed that among different industries, during the
period 1994 to 2005, EE was highest for ‗manufacturing‘ (1.4) followed by
‗mining & quarrying‘ (1.2), ‗transport, storage, & communication.‘ (1.1).
Negative EE of ‗pubic administration and other services‘ is due to
downsizing policy in employment in this industry during this period in the
state.
More importantly, during the period 1994-2005, it is noticed that
elasticity of general employment in all sectors was positive, whereas there of
technical manpower was negative in many sectors.
Step II: Projected growth rates of total employment
Method of obtaining these growth rates is also same as for
employment (technical) in step II of First Method. The difference here is that
we get the CAGRs of ‗total employment‘ instead of ‗employment (with
technical skills)‘. However, same EEs were suitably changed for the periods
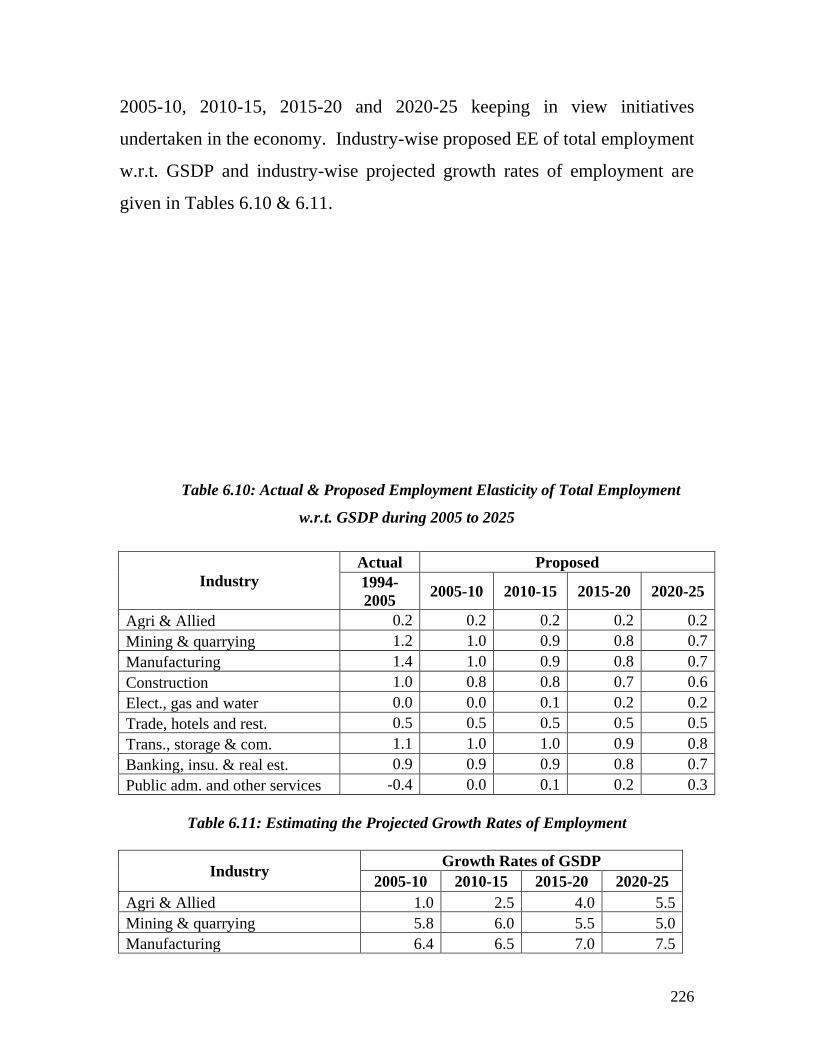
226
2005-10, 2010-15, 2015-20 and 2020-25 keeping in view initiatives
undertaken in the economy. Industry-wise proposed EE of total employment
w.r.t. GSDP and industry-wise projected growth rates of employment are
given in Tables 6.10 & 6.11.
Table 6.10: Actual & Proposed Employment Elasticity of Total Employment
w.r.t. GSDP during 2005 to 2025
Industry
Actual Proposed
1994-
2005 2005-10 2010-15 2015-20 2020-25
Agri & Allied 0.2 0.2 0.2 0.2 0.2
Mining & quarrying 1.2 1.0 0.9 0.8 0.7
Manufacturing 1.4 1.0 0.9 0.8 0.7
Construction 1.0 0.8 0.8 0.7 0.6
Elect., gas and water 0.0 0.0 0.1 0.2 0.2
Trade, hotels and rest. 0.5 0.5 0.5 0.5 0.5
Trans., storage & com. 1.1 1.0 1.0 0.9 0.8
Banking, insu. & real est. 0.9 0.9 0.9 0.8 0.7
Public adm. and other services -0.4 0.0 0.1 0.2 0.3
Table 6.11: Estimating the Projected Growth Rates of Employment
Industry Growth Rates of GSDP
2005-10 2010-15 2015-20 2020-25
Agri & Allied 1.0 2.5 4.0 5.5
Mining & quarrying 5.8 6.0 5.5 5.0
Manufacturing 6.4 6.5 7.0 7.5
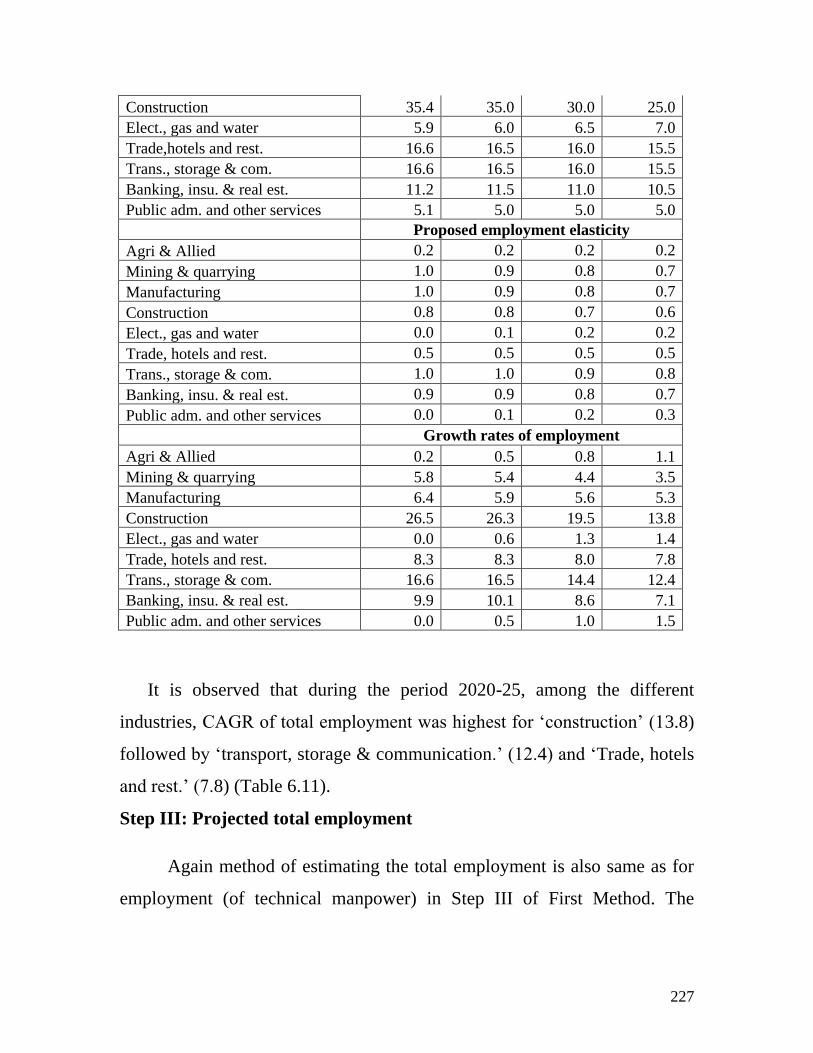
227
Construction 35.4 35.0 30.0 25.0
Elect., gas and water 5.9 6.0 6.5 7.0
Trade,hotels and rest. 16.6 16.5 16.0 15.5
Trans., storage & com. 16.6 16.5 16.0 15.5
Banking, insu. & real est. 11.2 11.5 11.0 10.5
Public adm. and other services 5.1 5.0 5.0 5.0
Proposed employment elasticity
Agri & Allied 0.2 0.2 0.2 0.2
Mining & quarrying 1.0 0.9 0.8 0.7
Manufacturing 1.0 0.9 0.8 0.7
Construction 0.8 0.8 0.7 0.6
Elect., gas and water 0.0 0.1 0.2 0.2
Trade, hotels and rest. 0.5 0.5 0.5 0.5
Trans., storage & com. 1.0 1.0 0.9 0.8
Banking, insu. & real est. 0.9 0.9 0.8 0.7
Public adm. and other services 0.0 0.1 0.2 0.3
Growth rates of employment
Agri & Allied 0.2 0.5 0.8 1.1
Mining & quarrying 5.8 5.4 4.4 3.5
Manufacturing 6.4 5.9 5.6 5.3
Construction 26.5 26.3 19.5 13.8
Elect., gas and water 0.0 0.6 1.3 1.4
Trade, hotels and rest. 8.3 8.3 8.0 7.8
Trans., storage & com. 16.6 16.5 14.4 12.4
Banking, insu. & real est. 9.9 10.1 8.6 7.1
Public adm. and other services 0.0 0.5 1.0 1.5
It is observed that during the period 2020-25, among the different
industries, CAGR of total employment was highest for ‗construction‘ (13.8)
followed by ‗transport, storage & communication.‘ (12.4) and ‗Trade, hotels
and rest.‘ (7.8) (Table 6.11).
Step III: Projected total employment
Again method of estimating the total employment is also same as for
employment (of technical manpower) in Step III of First Method. The
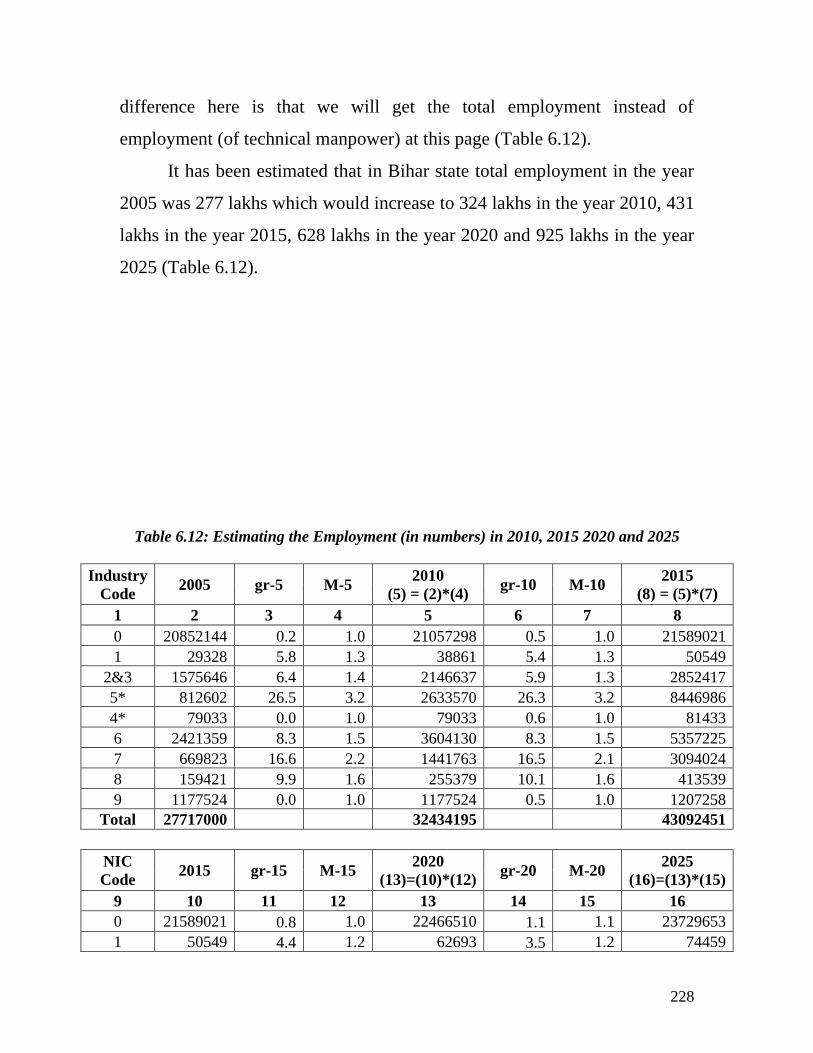
228
difference here is that we will get the total employment instead of
employment (of technical manpower) at this page (Table 6.12).
It has been estimated that in Bihar state total employment in the year
2005 was 277 lakhs which would increase to 324 lakhs in the year 2010, 431
lakhs in the year 2015, 628 lakhs in the year 2020 and 925 lakhs in the year
2025 (Table 6.12).
Table 6.12: Estimating the Employment (in numbers) in 2010, 2015 2020 and 2025
Industry
Code 2005 gr-5 M-5
2010
(5) = (2)*(4) gr-10 M-10
2015
(8) = (5)*(7)
1 2 3 4 5 6 7 8
0 20852144 0.2 1.0 21057298 0.5 1.0 21589021
1 29328 5.8 1.3 38861 5.4 1.3 50549
2&3 1575646 6.4 1.4 2146637 5.9 1.3 2852417
5* 812602 26.5 3.2 2633570 26.3 3.2 8446986
4* 79033 0.0 1.0 79033 0.6 1.0 81433
6 2421359 8.3 1.5 3604130 8.3 1.5 5357225
7 669823 16.6 2.2 1441763 16.5 2.1 3094024
8 159421 9.9 1.6 255379 10.1 1.6 413539
9 1177524 0.0 1.0 1177524 0.5 1.0 1207258
Total 27717000 32434195 43092451
NIC
Code 2015 gr-15 M-15
2020
(13)=(10)*(12) gr-20 M-20
2025
(16)=(13)*(15)
9 10 11 12 13 14 15 16
0 21589021 0.8 1.0 22466510 1.1 1.1 23729653
1 50549 4.4 1.2 62693 3.5 1.2 74459
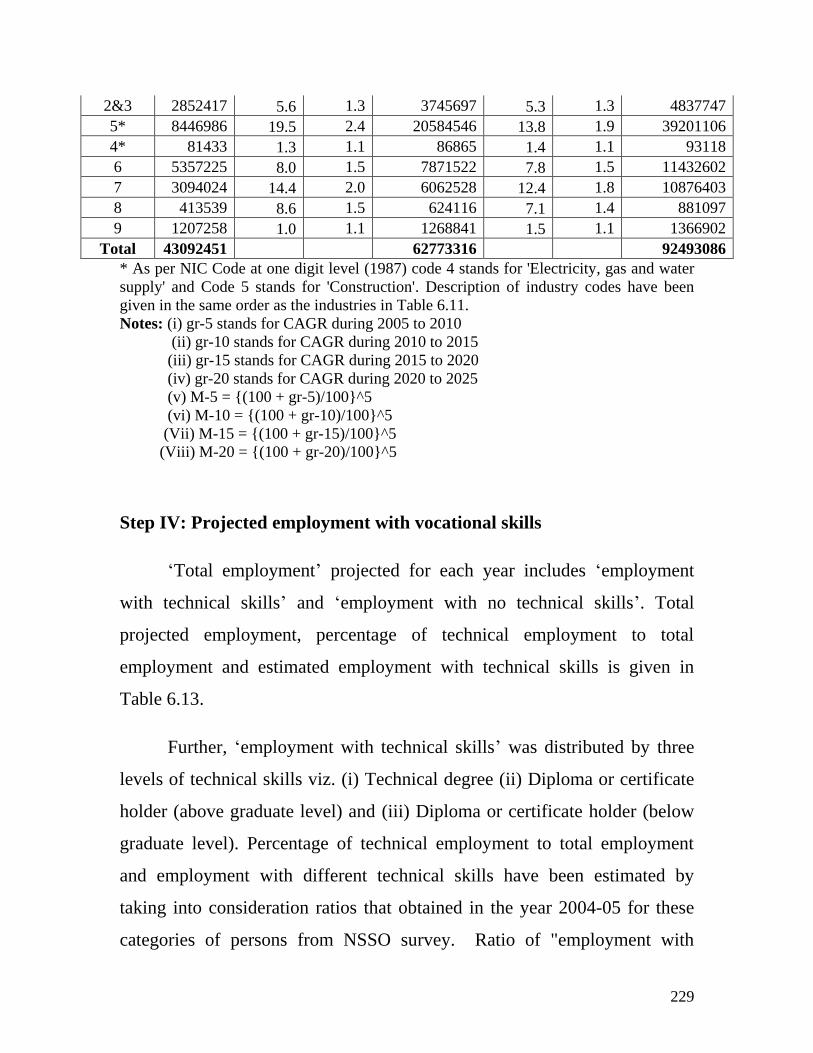
229
2&3 2852417 5.6 1.3 3745697 5.3 1.3 4837747
5* 8446986 19.5 2.4 20584546 13.8 1.9 39201106
4* 81433 1.3 1.1 86865 1.4 1.1 93118
6 5357225 8.0 1.5 7871522 7.8 1.5 11432602
7 3094024 14.4 2.0 6062528 12.4 1.8 10876403
8 413539 8.6 1.5 624116 7.1 1.4 881097
9 1207258 1.0 1.1 1268841 1.5 1.1 1366902
Total 43092451 62773316 92493086
* As per NIC Code at one digit level (1987) code 4 stands for 'Electricity, gas and water
supply' and Code 5 stands for 'Construction'. Description of industry codes have been
given in the same order as the industries in Table 6.11.
Notes: (i) gr-5 stands for CAGR during 2005 to 2010
(ii) gr-10 stands for CAGR during 2010 to 2015
(iii) gr-15 stands for CAGR during 2015 to 2020
(iv) gr-20 stands for CAGR during 2020 to 2025
(v) M-5 = {(100 + gr-5)/100}^5
(vi) M-10 = {(100 + gr-10)/100}^5
(Vii) M-15 = {(100 + gr-15)/100}^5
(Viii) M-20 = {(100 + gr-20)/100}^5
Step IV: Projected employment with vocational skills
‗Total employment‘ projected for each year includes ‗employment
with technical skills‘ and ‗employment with no technical skills‘. Total
projected employment, percentage of technical employment to total
employment and estimated employment with technical skills is given in
Table 6.13.
Further, ‗employment with technical skills‘ was distributed by three
levels of technical skills viz. (i) Technical degree (ii) Diploma or certificate
holder (above graduate level) and (iii) Diploma or certificate holder (below
graduate level). Percentage of technical employment to total employment
and employment with different technical skills have been estimated by
taking into consideration ratios that obtained in the year 2004-05 for these
categories of persons from NSSO survey. Ratio of "employment with
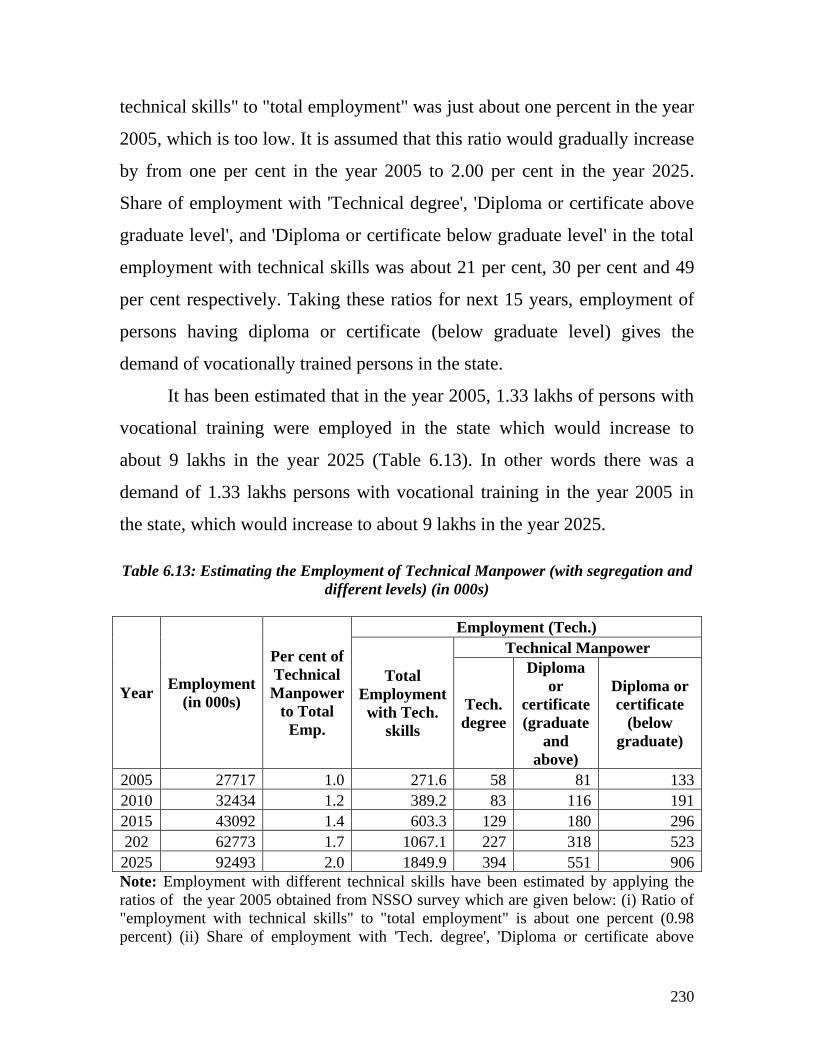
230
technical skills" to "total employment" was just about one percent in the year
2005, which is too low. It is assumed that this ratio would gradually increase
by from one per cent in the year 2005 to 2.00 per cent in the year 2025.
Share of employment with 'Technical degree', 'Diploma or certificate above
graduate level', and 'Diploma or certificate below graduate level' in the total
employment with technical skills was about 21 per cent, 30 per cent and 49
per cent respectively. Taking these ratios for next 15 years, employment of
persons having diploma or certificate (below graduate level) gives the
demand of vocationally trained persons in the state.
It has been estimated that in the year 2005, 1.33 lakhs of persons with
vocational training were employed in the state which would increase to
about 9 lakhs in the year 2025 (Table 6.13). In other words there was a
demand of 1.33 lakhs persons with vocational training in the year 2005 in
the state, which would increase to about 9 lakhs in the year 2025.
Table 6.13: Estimating the Employment of Technical Manpower (with segregation and
different levels) (in 000s)
Year Employment
(in 000s)
Per cent of
Technical
Manpower
to Total
Emp.
Employment (Tech.)
Total
Employment
with Tech.
skills
Technical Manpower
Tech.
degree
Diploma
or
certificate
(graduate
and
above)
Diploma or
certificate
(below
graduate)
2005 27717 1.0 271.6 58 81 133
2010 32434 1.2 389.2 83 116 191
2015 43092 1.4 603.3 129 180 296
202 62773 1.7 1067.1 227 318 523
2025 92493 2.0 1849.9 394 551 906
Note: Employment with different technical skills have been estimated by applying the
ratios of the year 2005 obtained from NSSO survey which are given below: (i) Ratio of
"employment with technical skills" to "total employment" is about one percent (0.98
percent) (ii) Share of employment with 'Tech. degree', 'Diploma or certificate above
231
graduate level', and 'Diploma or certificate below graduate level' in the total employment
with technical skills was 21percent, 30 percent and 49 per cent respectively.
6.3 Comparison of two methods
In the above section we have estimated the demand for employment
of persons with vocational skills within the state by two methods. As per the
first method, demand of persons with vocational skills would increase from
1.3 lakhs in the year 2005 to about 6 lakhs in the year 2025 (Table 6.8). As
per the second method, demand of persons with vocational skills would
increase from 1.3 lakhs in the year 2005 to about 9 lakhs in the year 2025.
In the period of liberalizations, share of technical manpower to total
manpower is going to increase very fast in future. This factor is well taken
into consideration in the second method, so we can say that the estimates of
second method are better than those obtained in the first method.
6.4 Demand of persons who have passed ITIs/ITCs within the state
Here we have estimated the demand of persons within the state who
have passed out from ITIs/ITCs (Table 6.14). As per the intake data of
ITIs/ITCs and other departments of the year 2009, received from the
department of labour resources, government of Bihar, share of ITIs/ITCs to
total vocationally trained persons having diploma or certificate (below
graduate) was about 53.0 per cent. It is assumed that this ratio would
continue to hold in future also.
However this ratio may change with the change in government
policies. Therefore, employment (demand) of ITIs/ITCs in each terminal
year was obtained as given below:
Demand in 2005 (ITIs/ITCs) = Demand in 2005 (vocational skills) × 0.53
Demand for 2010 = Demand in 2010 (VE) × 0.53
Demand for 2015 = Demand in 2015 (VE) × 0.53
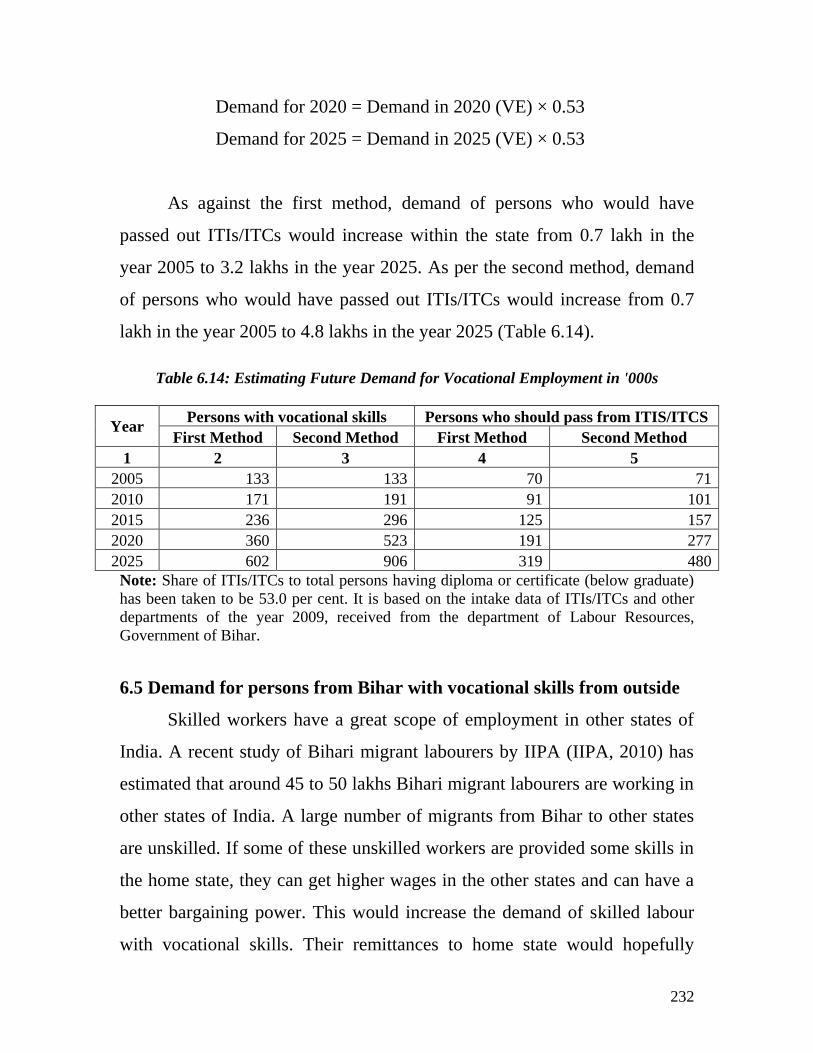
232
Demand for 2020 = Demand in 2020 (VE) × 0.53
Demand for 2025 = Demand in 2025 (VE) × 0.53
As against the first method, demand of persons who would have
passed out ITIs/ITCs would increase within the state from 0.7 lakh in the
year 2005 to 3.2 lakhs in the year 2025. As per the second method, demand
of persons who would have passed out ITIs/ITCs would increase from 0.7
lakh in the year 2005 to 4.8 lakhs in the year 2025 (Table 6.14).
Table 6.14: Estimating Future Demand for Vocational Employment in '000s
Year Persons with vocational skills Persons who should pass from ITIS/ITCS
First Method Second Method First Method Second Method
1 2 3 4 5
2005 133 133 70 71
2010 171 191 91 101
2015 236 296 125 157
2020 360 523 191 277
2025 602 906 319 480
Note: Share of ITIs/ITCs to total persons having diploma or certificate (below graduate)
has been taken to be 53.0 per cent. It is based on the intake data of ITIs/ITCs and other
departments of the year 2009, received from the department of Labour Resources,
Government of Bihar.
6.5 Demand for persons from Bihar with vocational skills from outside
Skilled workers have a great scope of employment in other states of
India. A recent study of Bihari migrant labourers by IIPA (IIPA, 2010) has
estimated that around 45 to 50 lakhs Bihari migrant labourers are working in
other states of India. A large number of migrants from Bihar to other states
are unskilled. If some of these unskilled workers are provided some skills in
the home state, they can get higher wages in the other states and can have a
better bargaining power. This would increase the demand of skilled labour
with vocational skills. Their remittances to home state would hopefully
233
trigger economic activity backyard or at least improve living conditions of
family members left behind. Multiplier would rejuvenate economic activity
in the state.
Skilled workers have a great scope of employment in other countries
also, particularly in the countries where dependency ratio is very high. In the
year 2001, about 43 percent of total population of the state was in the age-
group of below 15 years (Census of India, 2001). A high proportion of this
population has entered in the working population by now. Another
advantage is that with increasing participation of female work force in the
state, dependency ratio is going to decrease significantly in future. It would
increase per capita income of the state which may have a direct bearing on
the individuals demand for vocational training. Once they are trained, they
can have a great scope of employment in other countries and this way
Bihar‘s share in total outmigration from India to other countries can
increase.
There are two major sources which give estimates of the incidence of
migrations from Bihar. The first is the Population Census conducted every
tenth
years and the other is the periodic survey conducted by NSSO. Data for
estimating the extent of migration from Bihar to other states, along with the
background (i.e. age, qualification and sex etc.) of migrants and reasons of
migrations would be obtained from these two sources. Besides these two
official sources, there are a number of studies on ―Migration from Bihar
state‖. Main source of data on International Migration from India to different
countries is the Ministry of External Affairs, Government of India.
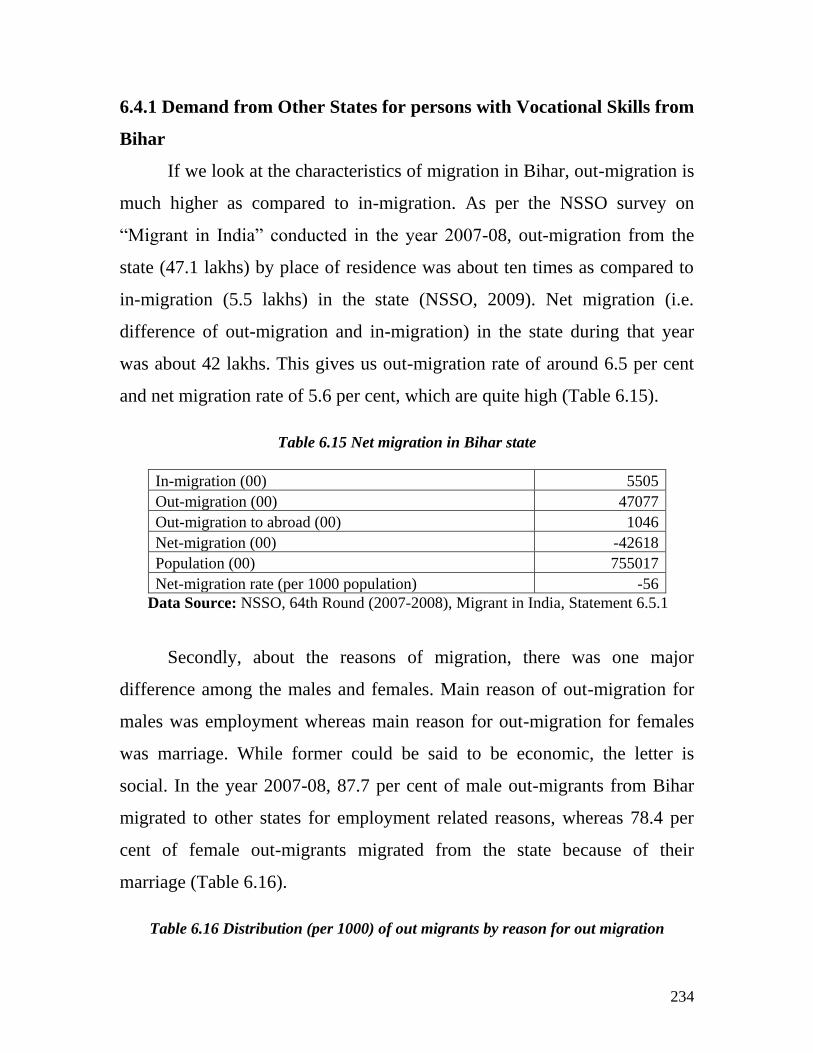
234
6.4.1 Demand from Other States for persons with Vocational Skills from
Bihar
If we look at the characteristics of migration in Bihar, out-migration is
much higher as compared to in-migration. As per the NSSO survey on
―Migrant in India‖ conducted in the year 2007-08, out-migration from the
state (47.1 lakhs) by place of residence was about ten times as compared to
in-migration (5.5 lakhs) in the state (NSSO, 2009). Net migration (i.e.
difference of out-migration and in-migration) in the state during that year
was about 42 lakhs. This gives us out-migration rate of around 6.5 per cent
and net migration rate of 5.6 per cent, which are quite high (Table 6.15).
Table 6.15 Net migration in Bihar state
In-migration (00) 5505
Out-migration (00) 47077
Out-migration to abroad (00) 1046
Net-migration (00) -42618
Population (00) 755017
Net-migration rate (per 1000 population) -56
Data Source: NSSO, 64th Round (2007-2008), Migrant in India, Statement 6.5.1
Secondly, about the reasons of migration, there was one major
difference among the males and females. Main reason of out-migration for
males was employment whereas main reason for out-migration for females
was marriage. While former could be said to be economic, the letter is
social. In the year 2007-08, 87.7 per cent of male out-migrants from Bihar
migrated to other states for employment related reasons, whereas 78.4 per
cent of female out-migrants migrated from the state because of their
marriage (Table 6.16).
Table 6.16 Distribution (per 1000) of out migrants by reason for out migration
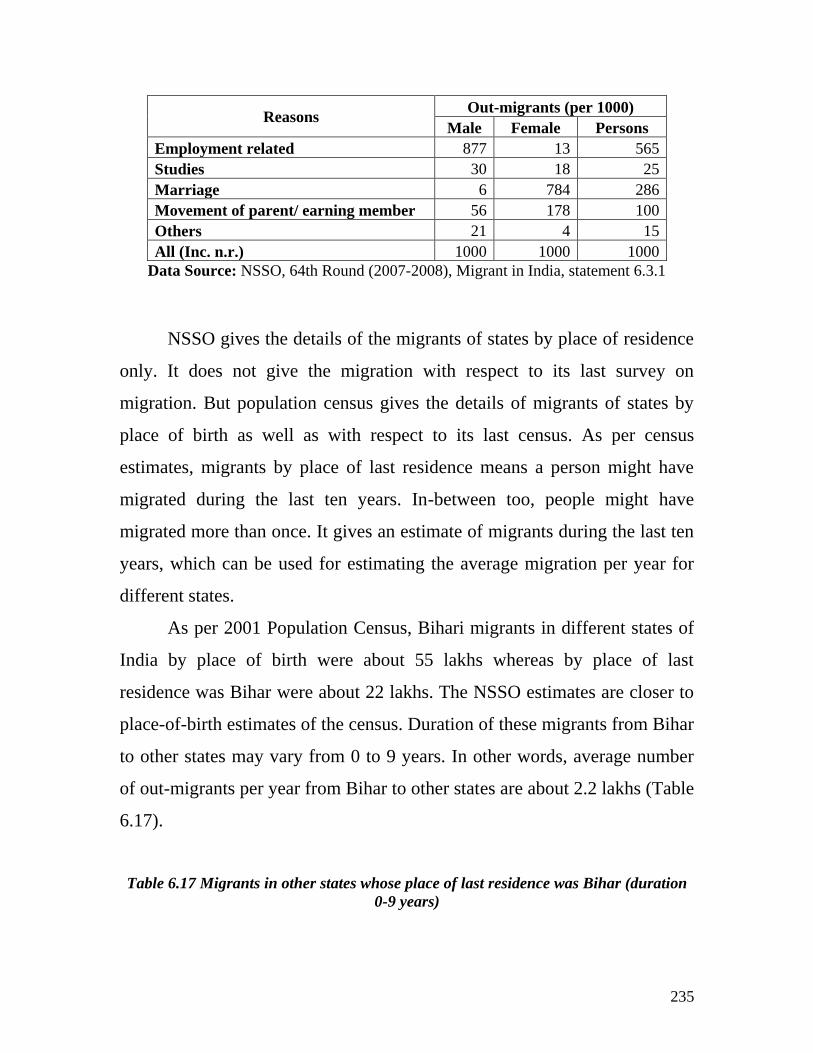
235
Reasons Out-migrants (per 1000)
Male Female Persons
Employment related 877 13 565
Studies 30 18 25
Marriage 6 784 286
Movement of parent/ earning member 56 178 100
Others 21 4 15
All (Inc. n.r.) 1000 1000 1000
Data Source: NSSO, 64th Round (2007-2008), Migrant in India, statement 6.3.1
NSSO gives the details of the migrants of states by place of residence
only. It does not give the migration with respect to its last survey on
migration. But population census gives the details of migrants of states by
place of birth as well as with respect to its last census. As per census
estimates, migrants by place of last residence means a person might have
migrated during the last ten years. In-between too, people might have
migrated more than once. It gives an estimate of migrants during the last ten
years, which can be used for estimating the average migration per year for
different states.
As per 2001 Population Census, Bihari migrants in different states of
India by place of birth were about 55 lakhs whereas by place of last
residence was Bihar were about 22 lakhs. The NSSO estimates are closer to
place-of-birth estimates of the census. Duration of these migrants from Bihar
to other states may vary from 0 to 9 years. In other words, average number
of out-migrants per year from Bihar to other states are about 2.2 lakhs (Table
6.17).
Table 6.17 Migrants in other states whose place of last residence was Bihar (duration
0-9 years)
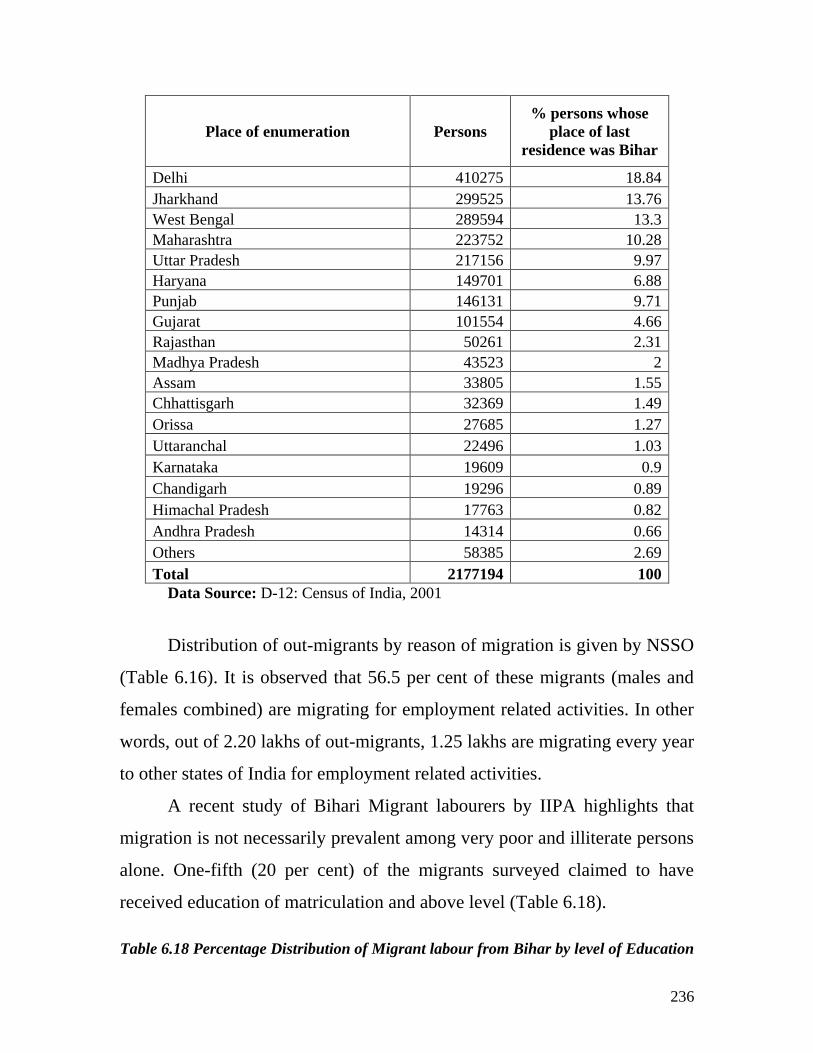
236
Place of enumeration Persons
% persons whose
place of last
residence was Bihar
Delhi 410275 18.84
Jharkhand 299525 13.76
West Bengal 289594 13.3
Maharashtra 223752 10.28
Uttar Pradesh 217156 9.97
Haryana 149701 6.88
Punjab 146131 9.71
Gujarat 101554 4.66
Rajasthan 50261 2.31
Madhya Pradesh 43523 2
Assam 33805 1.55
Chhattisgarh 32369 1.49
Orissa 27685 1.27
Uttaranchal 22496 1.03
Karnataka 19609 0.9
Chandigarh 19296 0.89
Himachal Pradesh 17763 0.82
Andhra Pradesh 14314 0.66
Others 58385 2.69
Total 2177194 100
Data Source: D-12: Census of India, 2001
Distribution of out-migrants by reason of migration is given by NSSO
(Table 6.16). It is observed that 56.5 per cent of these migrants (males and
females combined) are migrating for employment related activities. In other
words, out of 2.20 lakhs of out-migrants, 1.25 lakhs are migrating every year
to other states of India for employment related activities.
A recent study of Bihari Migrant labourers by IIPA highlights that
migration is not necessarily prevalent among very poor and illiterate persons
alone. One-fifth (20 per cent) of the migrants surveyed claimed to have
received education of matriculation and above level (Table 6.18).
Table 6.18 Percentage Distribution of Migrant labour from Bihar by level of Education
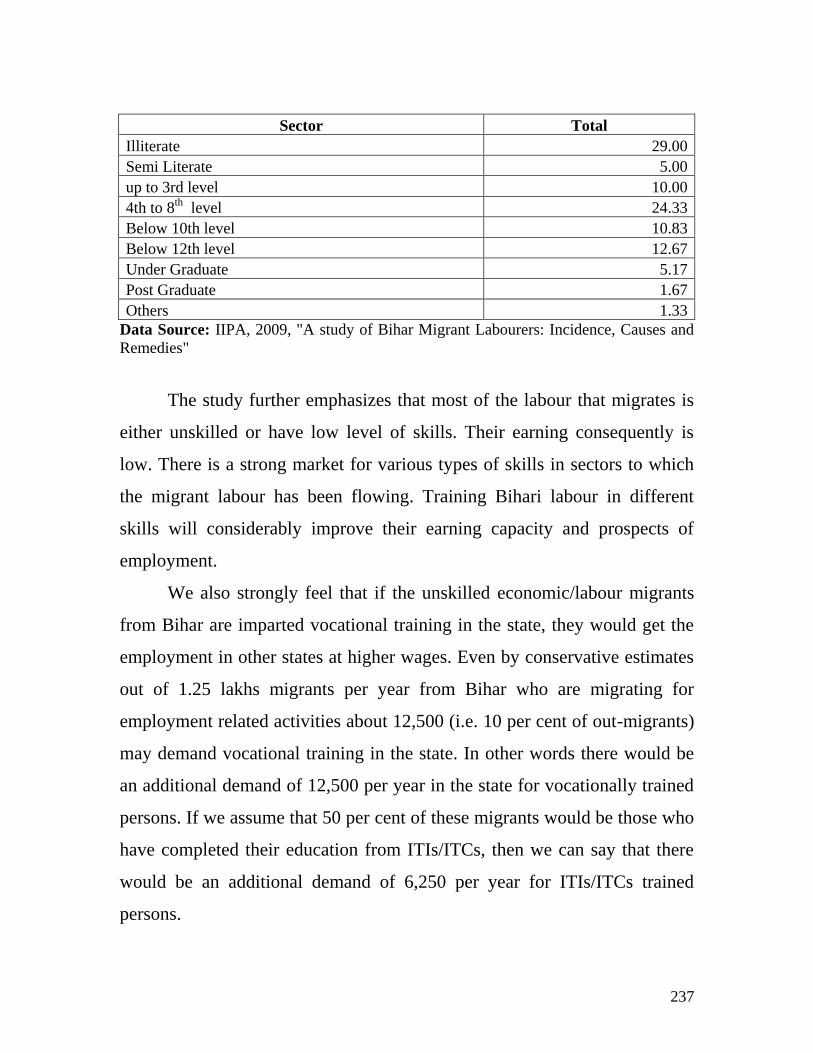
237
Sector Total
Illiterate 29.00
Semi Literate 5.00
up to 3rd level 10.00
4th to 8th
level 24.33
Below 10th level 10.83
Below 12th level 12.67
Under Graduate 5.17
Post Graduate 1.67
Others 1.33
Data Source: IIPA, 2009, "A study of Bihar Migrant Labourers: Incidence, Causes and
Remedies"
The study further emphasizes that most of the labour that migrates is
either unskilled or have low level of skills. Their earning consequently is
low. There is a strong market for various types of skills in sectors to which
the migrant labour has been flowing. Training Bihari labour in different
skills will considerably improve their earning capacity and prospects of
employment.
We also strongly feel that if the unskilled economic/labour migrants
from Bihar are imparted vocational training in the state, they would get the
employment in other states at higher wages. Even by conservative estimates
out of 1.25 lakhs migrants per year from Bihar who are migrating for
employment related activities about 12,500 (i.e. 10 per cent of out-migrants)
may demand vocational training in the state. In other words there would be
an additional demand of 12,500 per year in the state for vocationally trained
persons. If we assume that 50 per cent of these migrants would be those who
have completed their education from ITIs/ITCs, then we can say that there
would be an additional demand of 6,250 per year for ITIs/ITCs trained
persons.
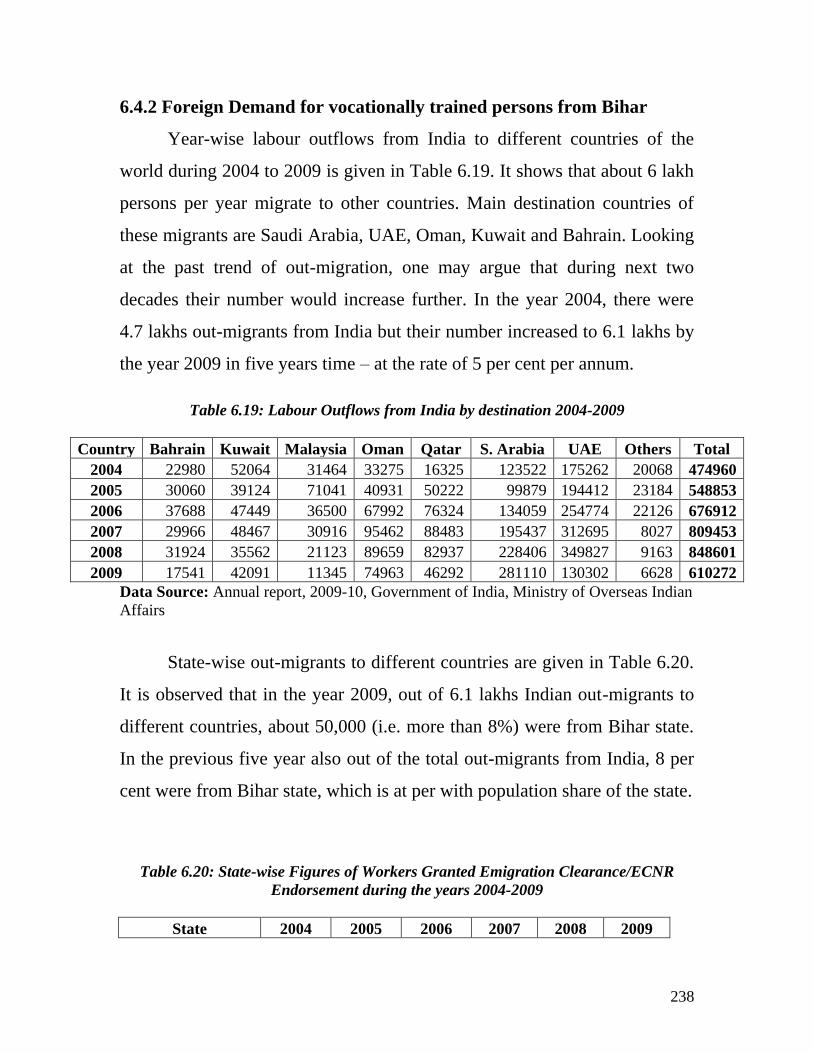
238
6.4.2 Foreign Demand for vocationally trained persons from Bihar
Year-wise labour outflows from India to different countries of the
world during 2004 to 2009 is given in Table 6.19. It shows that about 6 lakh
persons per year migrate to other countries. Main destination countries of
these migrants are Saudi Arabia, UAE, Oman, Kuwait and Bahrain. Looking
at the past trend of out-migration, one may argue that during next two
decades their number would increase further. In the year 2004, there were
4.7 lakhs out-migrants from India but their number increased to 6.1 lakhs by
the year 2009 in five years time – at the rate of 5 per cent per annum.
Table 6.19: Labour Outflows from India by destination 2004-2009
Country Bahrain Kuwait Malaysia Oman Qatar S. Arabia UAE Others Total
2004 22980 52064 31464 33275 16325 123522 175262 20068 474960
2005 30060 39124 71041 40931 50222 99879 194412 23184 548853
2006 37688 47449 36500 67992 76324 134059 254774 22126 676912
2007 29966 48467 30916 95462 88483 195437 312695 8027 809453
2008 31924 35562 21123 89659 82937 228406 349827 9163 848601
2009 17541 42091 11345 74963 46292 281110 130302 6628 610272
Data Source: Annual report, 2009-10, Government of India, Ministry of Overseas Indian
Affairs
State-wise out-migrants to different countries are given in Table 6.20.
It is observed that in the year 2009, out of 6.1 lakhs Indian out-migrants to
different countries, about 50,000 (i.e. more than 8%) were from Bihar state.
In the previous five year also out of the total out-migrants from India, 8 per
cent were from Bihar state, which is at per with population share of the state.
Table 6.20: State-wise Figures of Workers Granted Emigration Clearance/ECNR
Endorsement during the years 2004-2009
State 2004 2005 2006 2007 2008 2009
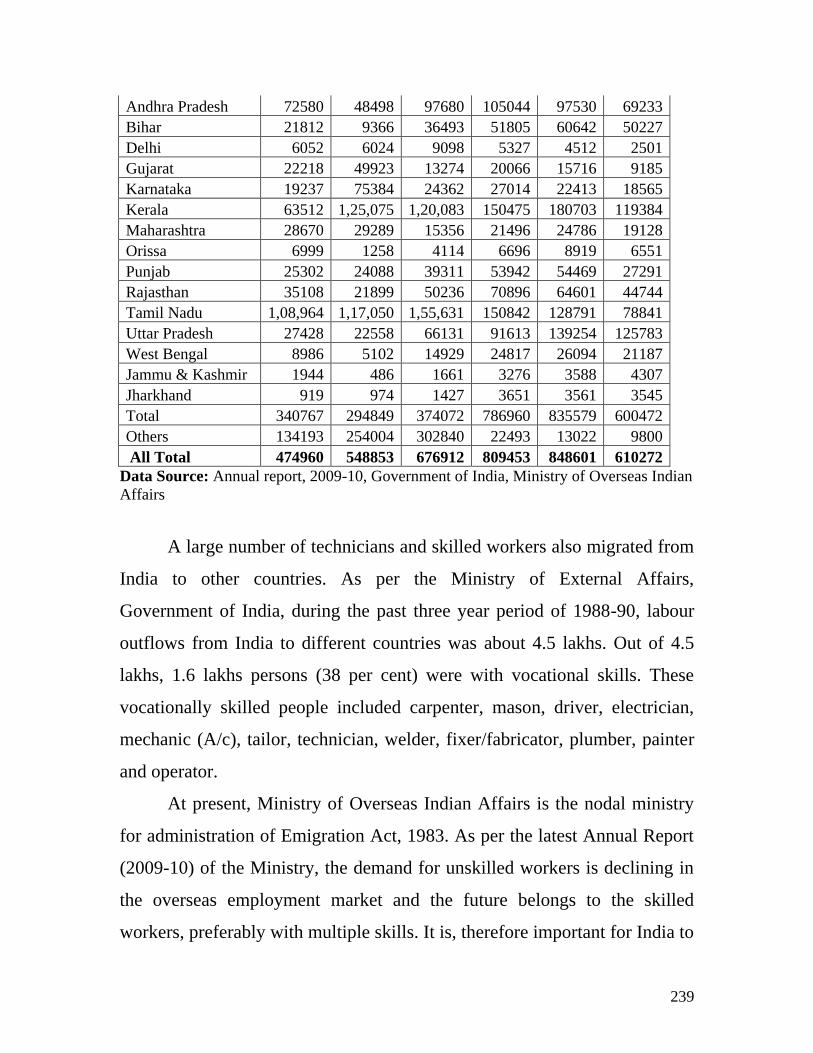
239
Andhra Pradesh 72580 48498 97680 105044 97530 69233
Bihar 21812 9366 36493 51805 60642 50227
Delhi 6052 6024 9098 5327 4512 2501
Gujarat 22218 49923 13274 20066 15716 9185
Karnataka 19237 75384 24362 27014 22413 18565
Kerala 63512 1,25,075 1,20,083 150475 180703 119384
Maharashtra 28670 29289 15356 21496 24786 19128
Orissa 6999 1258 4114 6696 8919 6551
Punjab 25302 24088 39311 53942 54469 27291
Rajasthan 35108 21899 50236 70896 64601 44744
Tamil Nadu 1,08,964 1,17,050 1,55,631 150842 128791 78841
Uttar Pradesh 27428 22558 66131 91613 139254 125783
West Bengal 8986 5102 14929 24817 26094 21187
Jammu & Kashmir 1944 486 1661 3276 3588 4307
Jharkhand 919 974 1427 3651 3561 3545
Total 340767 294849 374072 786960 835579 600472
Others 134193 254004 302840 22493 13022 9800
All Total 474960 548853 676912 809453 848601 610272
Data Source: Annual report, 2009-10, Government of India, Ministry of Overseas Indian
Affairs
A large number of technicians and skilled workers also migrated from
India to other countries. As per the Ministry of External Affairs,
Government of India, during the past three year period of 1988-90, labour
outflows from India to different countries was about 4.5 lakhs. Out of 4.5
lakhs, 1.6 lakhs persons (38 per cent) were with vocational skills. These
vocationally skilled people included carpenter, mason, driver, electrician,
mechanic (A/c), tailor, technician, welder, fixer/fabricator, plumber, painter
and operator.
At present, Ministry of Overseas Indian Affairs is the nodal ministry
for administration of Emigration Act, 1983. As per the latest Annual Report
(2009-10) of the Ministry, the demand for unskilled workers is declining in
the overseas employment market and the future belongs to the skilled
workers, preferably with multiple skills. It is, therefore important for India to
240
upgrade the skills of its young work force to meet the challenges of future
needs in the overseas employment market which is having flux of emigrant
labourers from neighboring countries.
Keeping the above facts in view, one may argue that, out of 6 lakh
persons who were migrating per year from India to other countries, about 2
lakh persons (33 per cent of total) were having vocational training. If we
assume the existing trend to continue, there would be a demand of more than
2 lakh persons per year of vocationally trained persons from India to other
countries.
In the total out-migration from India, Bihar state‘s share of migration
is about eight per cent. One may argue that, share of skilled workers who
would migrate from Bihar would be less as compared to All India. So even if
we go by conservative estimates, out of 2 lakh persons with vocational skills
who would have demand in other countries, 8,000 (i.e. 4 per cent of 2 lakhs)
would be from Bihar. Further, out of 8000 skilled persons of the state 4000
persons (i.e. 4000) may be from ITI/ITCs and remaining 4000 persons (i.e.
50 per cent) may be trained by Institutes/Centres run by other departments.
6.6 Projected Estimates of shortages and surpluses of ITI/ITC trained
We can project the estimates of shortages and surpluses of ―ITI/ITC
trained‖ (under the Labour Department, Government of Bihar) as well as of
the persons who would pass these skills from the ―Other Departments‖ of
the state. But because of the non-availability of data of pass out students
from the ―Other Departments‖ we could do this exercise for ―ITI/ITC‖ only.
6.6.1 Additional Demand on Five Yearly Basis
241
Estimates of shortages and surpluses of ITI/ITC passed are obtained
by comparing their demand and supply estimates. Demand estimates
obtained in Section 6.5 are of total demand (i.e. stock sense) but we don‘t
have the comparable estimates of stock of persons who are alive and have
passed out from ITIs/ITCs and are available for employment (i.e. supply in
the stock sense). But we can have the estimates of annual out-turn of
ITIs/ITCs in Bihar. This would give us an estimate of requirement of
additional supply of ITIs/ITCs in the state during a particular period.
Keeping this fact in view, additional demand of ITIs/ITCs during the
periods 2010-15, 2015-20 and 2020-25 (on five yearly basis) was obtained
(Table 6.21). Additional demand during the period 2010-15 was obtained by
taking the difference of demand during the years 2015 and 2010. Similarly,
estimates of additional demand for other two periods (viz. 2015-20 and
2020-25) were obtained. Secondly, additional demand has been obtained
separately for ‗within the state‘, ‗in other states of India‘ and ‗in other
countries of the world‘. Third important point worth mentioning is that total
demand within the state was obtained by two different methods, details of
which have been discussed in Section 6.4. So the total additional demand in
the state also gives two estimates. First estimate relate to first method of
domestic demand and second estimate relate to second method of domestic
demand discussed in the text.
It is observed that as per the first estimate, additional demand of
ITIs/ITCs was 85,300 during the period 2010-15, which would increase to
179,300 during the period 2020-25. As per the second estimate, additional
demand of ITIs/ITCs was 107,300 during the period 2010-15 which may
increase to 245,300 during the period 2020-25 (Table 6.21).
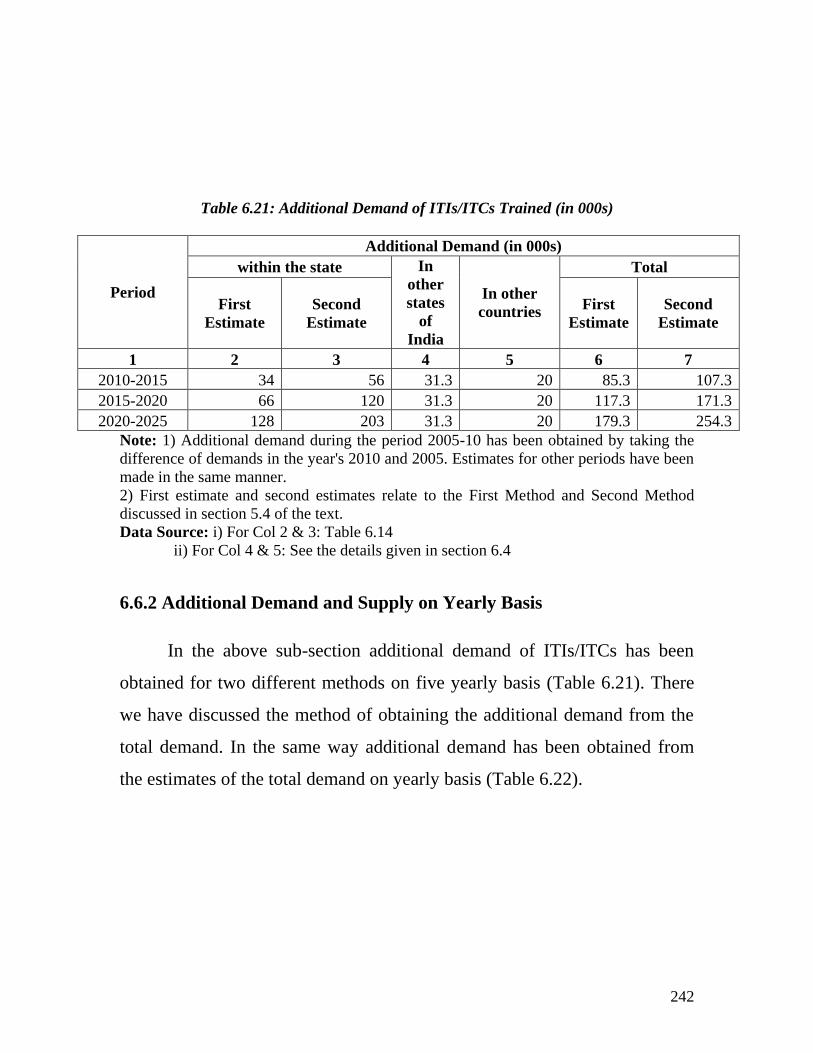
242
Table 6.21: Additional Demand of ITIs/ITCs Trained (in 000s)
Period
Additional Demand (in 000s)
within the state In
other
states
of
India
In other
countries
Total
First
Estimate
Second
Estimate
First
Estimate
Second
Estimate
1 2 3 4 5 6 7
2010-2015 34 56 31.3 20 85.3 107.3
2015-2020 66 120 31.3 20 117.3 171.3
2020-2025 128 203 31.3 20 179.3 254.3
Note: 1) Additional demand during the period 2005-10 has been obtained by taking the
difference of demands in the year's 2010 and 2005. Estimates for other periods have been
made in the same manner.
2) First estimate and second estimates relate to the First Method and Second Method
discussed in section 5.4 of the text.
Data Source: i) For Col 2 & 3: Table 6.14
ii) For Col 4 & 5: See the details given in section 6.4
6.6.2 Additional Demand and Supply on Yearly Basis
In the above sub-section additional demand of ITIs/ITCs has been
obtained for two different methods on five yearly basis (Table 6.21). There
we have discussed the method of obtaining the additional demand from the
total demand. In the same way additional demand has been obtained from
the estimates of the total demand on yearly basis (Table 6.22).
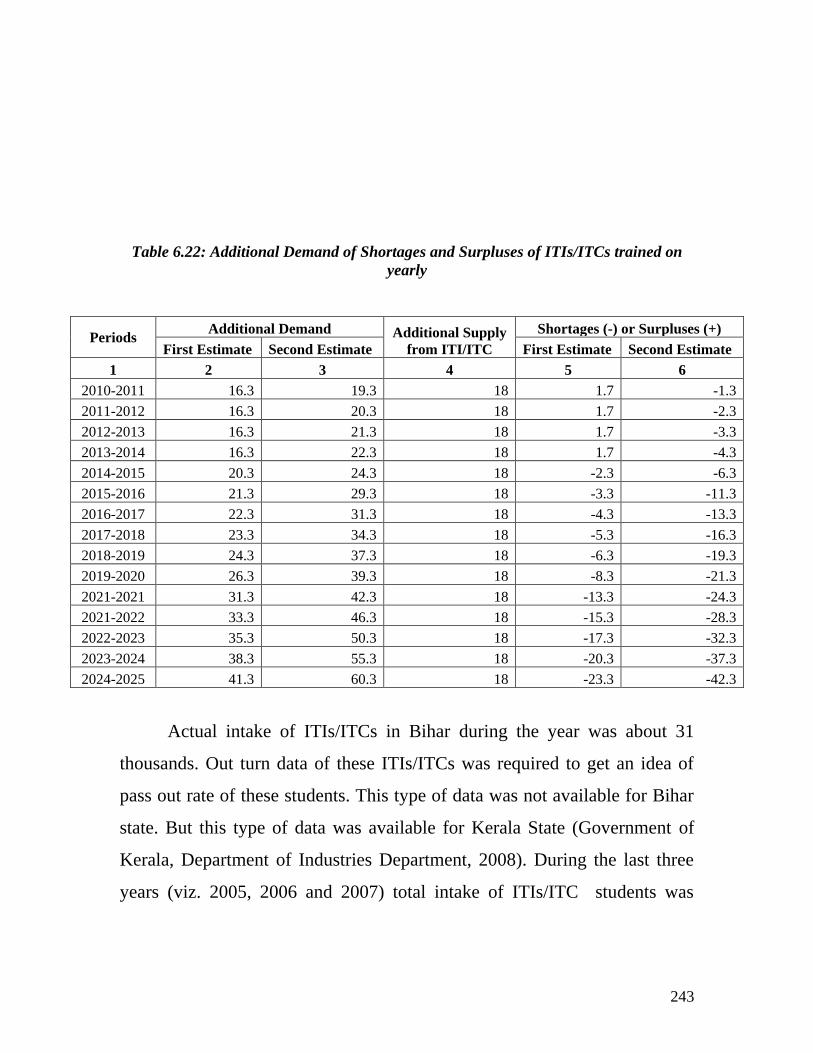
243
Table 6.22: Additional Demand of Shortages and Surpluses of ITIs/ITCs trained on
yearly
Periods Additional Demand Additional Supply
from ITI/ITC
Shortages (-) or Surpluses (+)
First Estimate Second Estimate First Estimate Second Estimate
1 2 3 4 5 6
2010-2011 16.3 19.3 18 1.7 -1.3
2011-2012 16.3 20.3 18 1.7 -2.3
2012-2013 16.3 21.3 18 1.7 -3.3
2013-2014 16.3 22.3 18 1.7 -4.3
2014-2015 20.3 24.3 18 -2.3 -6.3
2015-2016 21.3 29.3 18 -3.3 -11.3
2016-2017 22.3 31.3 18 -4.3 -13.3
2017-2018 23.3 34.3 18 -5.3 -16.3
2018-2019 24.3 37.3 18 -6.3 -19.3
2019-2020 26.3 39.3 18 -8.3 -21.3
2021-2021 31.3 42.3 18 -13.3 -24.3
2021-2022 33.3 46.3 18 -15.3 -28.3
2022-2023 35.3 50.3 18 -17.3 -32.3
2023-2024 38.3 55.3 18 -20.3 -37.3
2024-2025 41.3 60.3 18 -23.3 -42.3
Actual intake of ITIs/ITCs in Bihar during the year was about 31
thousands. Out turn data of these ITIs/ITCs was required to get an idea of
pass out rate of these students. This type of data was not available for Bihar
state. But this type of data was available for Kerala State (Government of
Kerala, Department of Industries Department, 2008). During the last three
years (viz. 2005, 2006 and 2007) total intake of ITIs/ITC students was
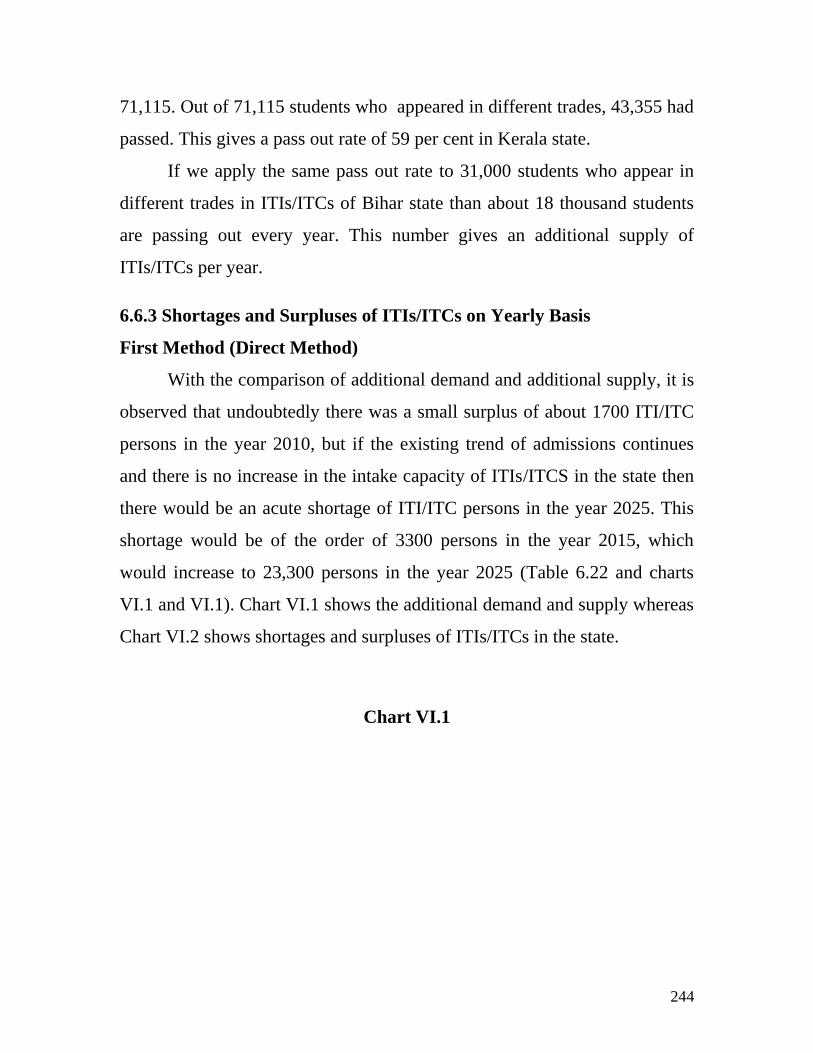
244
71,115. Out of 71,115 students who appeared in different trades, 43,355 had
passed. This gives a pass out rate of 59 per cent in Kerala state.
If we apply the same pass out rate to 31,000 students who appear in
different trades in ITIs/ITCs of Bihar state than about 18 thousand students
are passing out every year. This number gives an additional supply of
ITIs/ITCs per year.
6.6.3 Shortages and Surpluses of ITIs/ITCs on Yearly Basis
First Method (Direct Method)
With the comparison of additional demand and additional supply, it is
observed that undoubtedly there was a small surplus of about 1700 ITI/ITC
persons in the year 2010, but if the existing trend of admissions continues
and there is no increase in the intake capacity of ITIs/ITCS in the state then
there would be an acute shortage of ITI/ITC persons in the year 2025. This
shortage would be of the order of 3300 persons in the year 2015, which
would increase to 23,300 persons in the year 2025 (Table 6.22 and charts
VI.1 and VI.1). Chart VI.1 shows the additional demand and supply whereas
Chart VI.2 shows shortages and surpluses of ITIs/ITCs in the state.
Chart VI.1
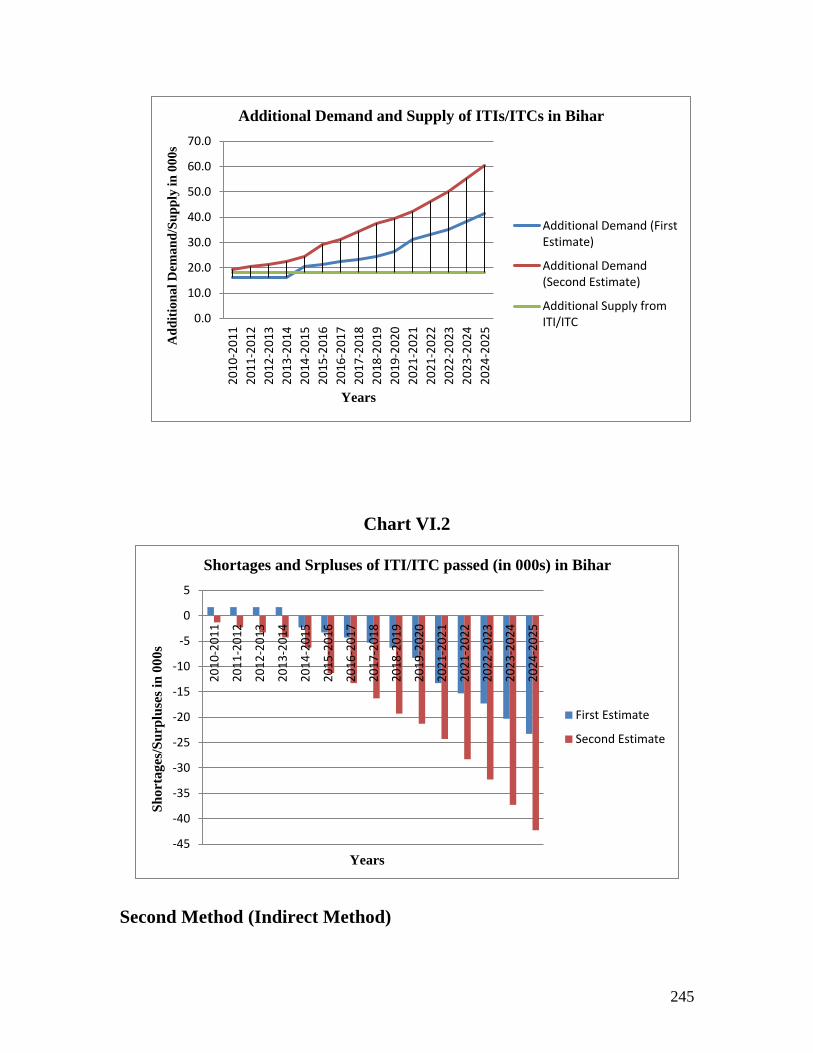
245
Chart VI.2
Second Method (Indirect Method)
0.0
10.0
20.0
30.0
40.0
50.0
60.0
70.0
20
10
-20
11
20
11
-20
12
20
12
-20
13
20
13
-20
14
20
14
-20
15
20
15
-20
16
20
16
-20
17
20
17
-20
18
20
18
-20
19
20
19
-20
20
20
21
-20
21
20
21
-20
22
20
22
-20
23
20
23
-20
24
20
24
-20
25
Ad
dit
ion
al
Dem
an
d/S
up
ply
in
00
0s
Years
Additional Demand and Supply of ITIs/ITCs in Bihar
Additional Demand (FirstEstimate)
Additional Demand(Second Estimate)
Additional Supply fromITI/ITC
-45
-40
-35
-30
-25
-20
-15
-10
-5
0
5
20
10
-20
11
20
11
-20
12
20
12
-20
13
20
13
-20
14
20
14
-20
15
20
15
-20
16
20
16
-20
17
20
17
-20
18
20
18
-20
19
20
19
-20
20
20
21
-20
21
20
21
-20
22
20
22
-20
23
20
23
-20
24
20
24
-20
25
Sh
orta
ges
/Su
rplu
ses
in 0
00s
Years
Shortages and Srpluses of ITI/ITC passed (in 000s) in Bihar
First Estimate
Second Estimate
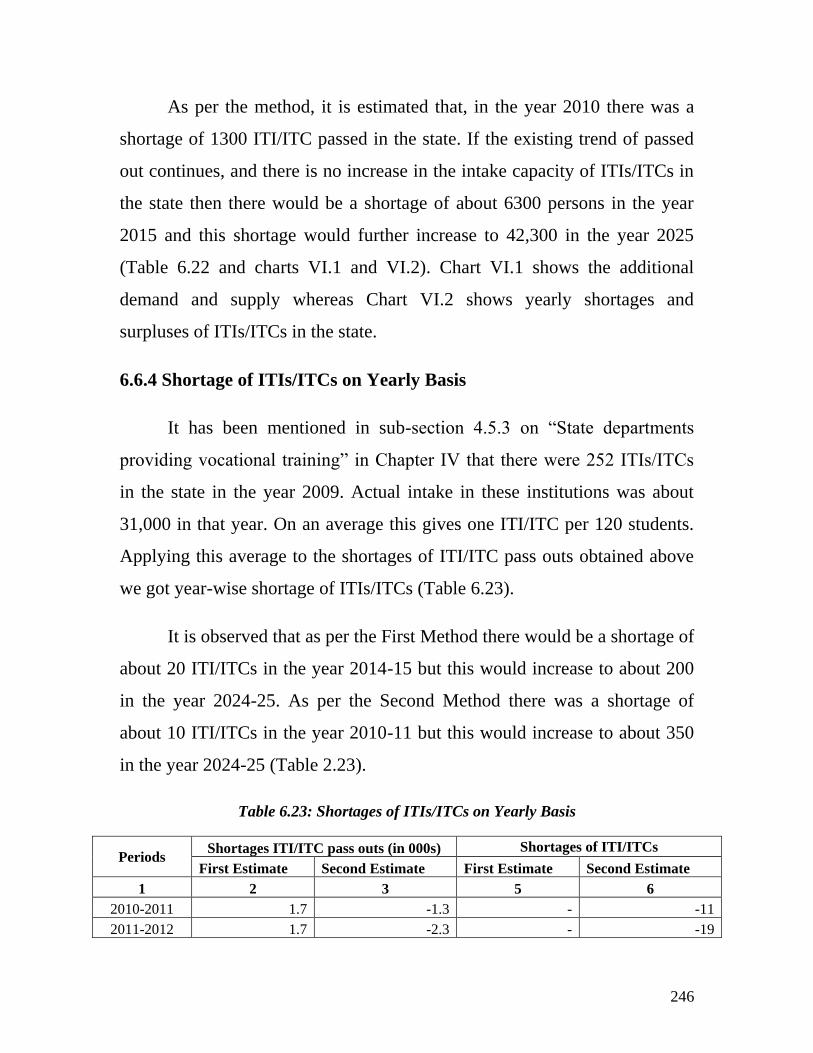
246
As per the method, it is estimated that, in the year 2010 there was a
shortage of 1300 ITI/ITC passed in the state. If the existing trend of passed
out continues, and there is no increase in the intake capacity of ITIs/ITCs in
the state then there would be a shortage of about 6300 persons in the year
2015 and this shortage would further increase to 42,300 in the year 2025
(Table 6.22 and charts VI.1 and VI.2). Chart VI.1 shows the additional
demand and supply whereas Chart VI.2 shows yearly shortages and
surpluses of ITIs/ITCs in the state.
6.6.4 Shortage of ITIs/ITCs on Yearly Basis
It has been mentioned in sub-section 4.5.3 on ―State departments
providing vocational training‖ in Chapter IV that there were 252 ITIs/ITCs
in the state in the year 2009. Actual intake in these institutions was about
31,000 in that year. On an average this gives one ITI/ITC per 120 students.
Applying this average to the shortages of ITI/ITC pass outs obtained above
we got year-wise shortage of ITIs/ITCs (Table 6.23).
It is observed that as per the First Method there would be a shortage of
about 20 ITI/ITCs in the year 2014-15 but this would increase to about 200
in the year 2024-25. As per the Second Method there was a shortage of
about 10 ITI/ITCs in the year 2010-11 but this would increase to about 350
in the year 2024-25 (Table 2.23).
Table 6.23: Shortages of ITIs/ITCs on Yearly Basis
Periods Shortages ITI/ITC pass outs (in 000s) Shortages of ITI/ITCs
First Estimate Second Estimate First Estimate Second Estimate
1 2 3 5 6
2010-2011 1.7 -1.3 - -11
2011-2012 1.7 -2.3 - -19
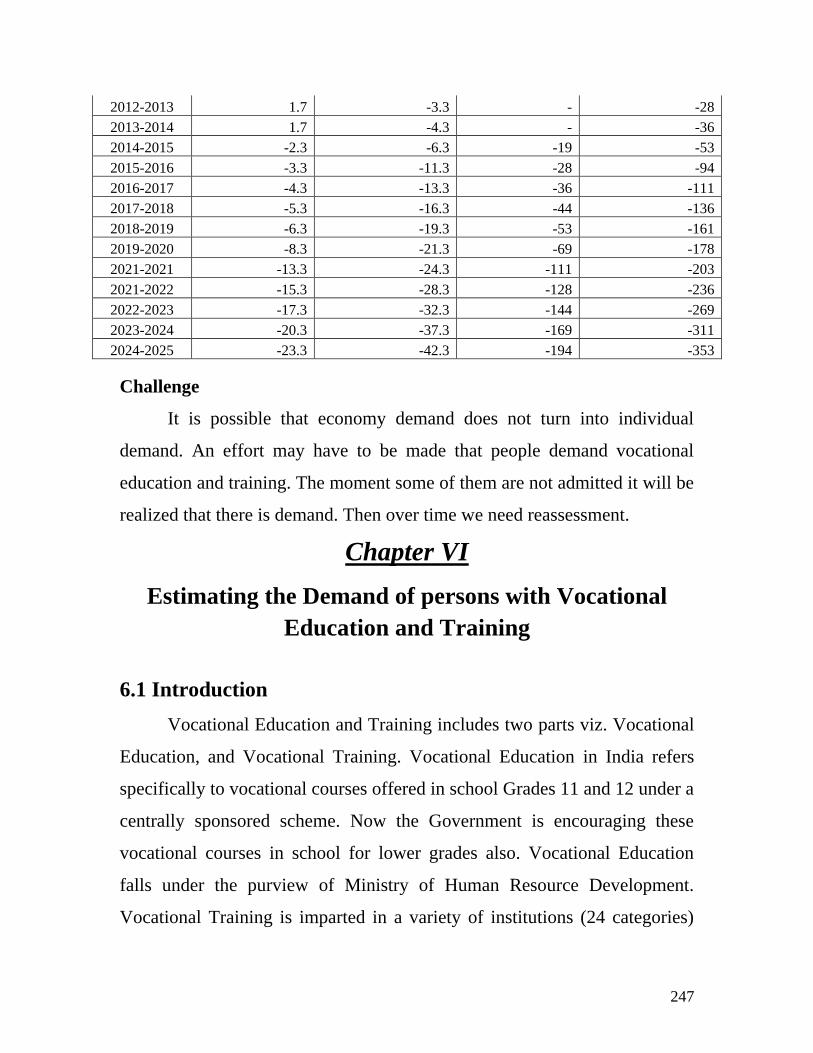
247
2012-2013 1.7 -3.3 - -28
2013-2014 1.7 -4.3 - -36
2014-2015 -2.3 -6.3 -19 -53
2015-2016 -3.3 -11.3 -28 -94
2016-2017 -4.3 -13.3 -36 -111
2017-2018 -5.3 -16.3 -44 -136
2018-2019 -6.3 -19.3 -53 -161
2019-2020 -8.3 -21.3 -69 -178
2021-2021 -13.3 -24.3 -111 -203
2021-2022 -15.3 -28.3 -128 -236
2022-2023 -17.3 -32.3 -144 -269
2023-2024 -20.3 -37.3 -169 -311
2024-2025 -23.3 -42.3 -194 -353
Challenge
It is possible that economy demand does not turn into individual
demand. An effort may have to be made that people demand vocational
education and training. The moment some of them are not admitted it will be
realized that there is demand. Then over time we need reassessment.
Chapter VI
Estimating the Demand of persons with Vocational
Education and Training
6.1 Introduction
Vocational Education and Training includes two parts viz. Vocational
Education, and Vocational Training. Vocational Education in India refers
specifically to vocational courses offered in school Grades 11 and 12 under a
centrally sponsored scheme. Now the Government is encouraging these
vocational courses in school for lower grades also. Vocational Education
falls under the purview of Ministry of Human Resource Development.
Vocational Training is imparted in a variety of institutions (24 categories)
248
which are supported by various ministries but most of them are supported by
the Departments of Labour in State Government while they may make use of
the central funds under various schemes.
Vocational training is generally given by ITIs/ITCs, run under the
supervision of Labour Department of the state government. In Bihar state,
besides ITIs, other Departments/Institutes which impart vocational training
are: KVIC; Bihar Urban Development Authority (BUDA); Directorate of
Handloom, Department of Industries; Sericulture Division, Department of
Industries; Upendra Maharathi Shilp Anushandhan Sansthan Department of
Industries; and Micro, Small and Medium enterprise Development Institute.
The main objective of vocational training is to prepare persons,
especially the youth, for the working life and make them employable for a
broad range of occupations in various industries and other economic sectors
where there is demand for skilled personnel. It aims at imparting training to
persons in very specific field through providing significant ‗hands on‘
experience in acquiring necessary skill, which make them employable or
create for them opportunity of self employment (NSSO, 2006) .
In this chapter demand of persons with vocational education and
training, has been estimated for Bihar state for the terminal years of 2010,
2015, 2020 and 2025. Demand of these persons has been estimated for three
segments: (a) within the state (b) in other states of India and (c) in other
countries of the world. Beside this, the chapter includes the estimates of
shortages and surpluses of persons with vocational training in the state in
terminal years.
249
6.2 Demand of Persons with Vocational Education and Training within
state
NSSO surveys on employment and unemployment give the
distribution of total number of persons employed in the state by industry,
and by age-groups. It also gives the distribution of technical persons
employed in the state by industry. Various classifications, along with the
codes, used in the distribution of technical persons are given in chapter I on
―Introduction‖. As per NSSO, estimates of persons having diploma or
certificate (below graduate level) are available. It does not separate out
diploma and certificate. So the estimates of Diploma/Certificate (below
graduate level) have been taken as vocationally trained persons. So their
estimate would give an estimate of persons with vocational education and
training in the state in that year. As per our view persons having Diploma
(below graduate level) from technical institutions should not be included in
vocational training but their number is very small as compared to certificate
holders (below graduate level).
Thus number of technical persons with diploma or certificate (below
graduate level) employed in the state in terminal years would give an
estimate of demand of persons with vocational training in the state for those
years. This demand of persons (who would be employed in the state) would
be considered as stock of demand. If we add the number of unemployed
persons with vocational training in those terminal years to this demand it
would give the stock of supply in those years. If we take the difference of
stocks of demand in two terminal years it would give the additional demand
generated between those two years. For estimating the demand (in stock
sense) of vocationally trained persons two methods have been used. They
were discussed in detail in Chapter 2.
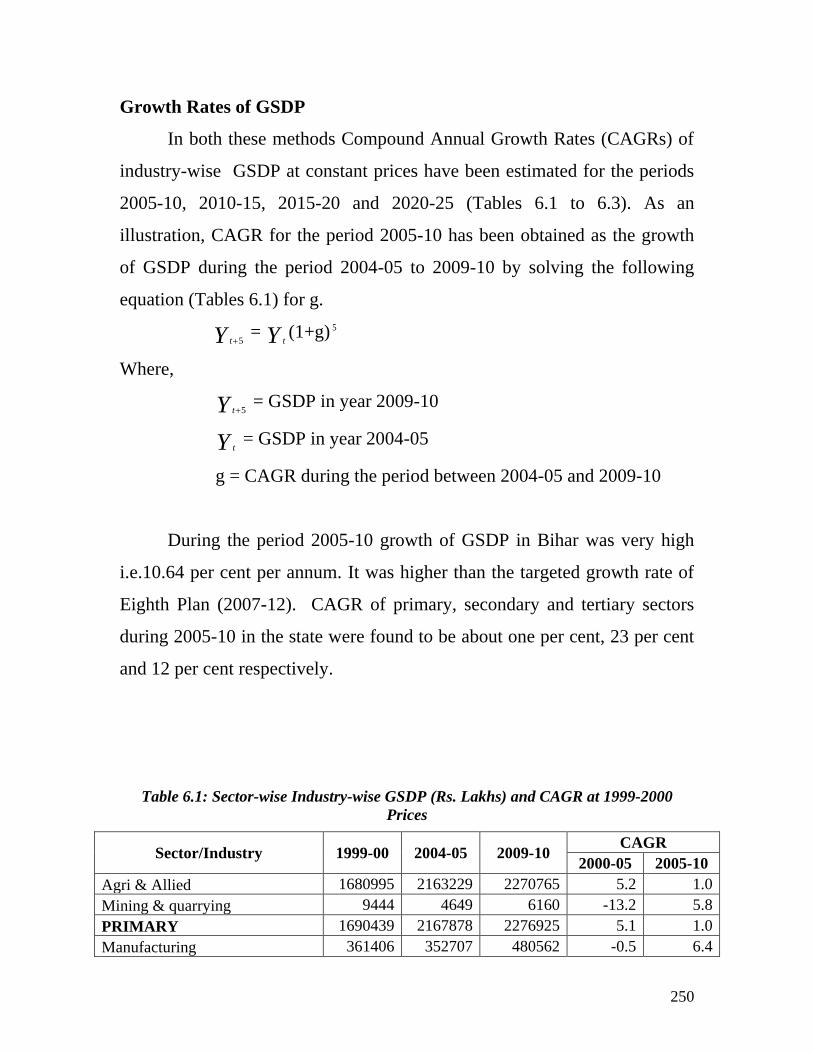
250
Growth Rates of GSDP
In both these methods Compound Annual Growth Rates (CAGRs) of
industry-wise GSDP at constant prices have been estimated for the periods
2005-10, 2010-15, 2015-20 and 2020-25 (Tables 6.1 to 6.3). As an
illustration, CAGR for the period 2005-10 has been obtained as the growth
of GSDP during the period 2004-05 to 2009-10 by solving the following
equation (Tables 6.1) for g.
Y t 5 = Y t
(1+g) 5
Where,
Y t 5 = GSDP in year 2009-10
Y t = GSDP in year 2004-05
g = CAGR during the period between 2004-05 and 2009-10
During the period 2005-10 growth of GSDP in Bihar was very high
i.e.10.64 per cent per annum. It was higher than the targeted growth rate of
Eighth Plan (2007-12). CAGR of primary, secondary and tertiary sectors
during 2005-10 in the state were found to be about one per cent, 23 per cent
and 12 per cent respectively.
Table 6.1: Sector-wise Industry-wise GSDP (Rs. Lakhs) and CAGR at 1999-2000
Prices
Sector/Industry 1999-00 2004-05 2009-10 CAGR
2000-05 2005-10
Agri & Allied 1680995 2163229 2270765 5.2 1.0
Mining & quarrying 9444 4649 6160 -13.2 5.8
PRIMARY 1690439 2167878 2276925 5.1 1.0
Manufacturing 361406 352707 480562 -0.5 6.4
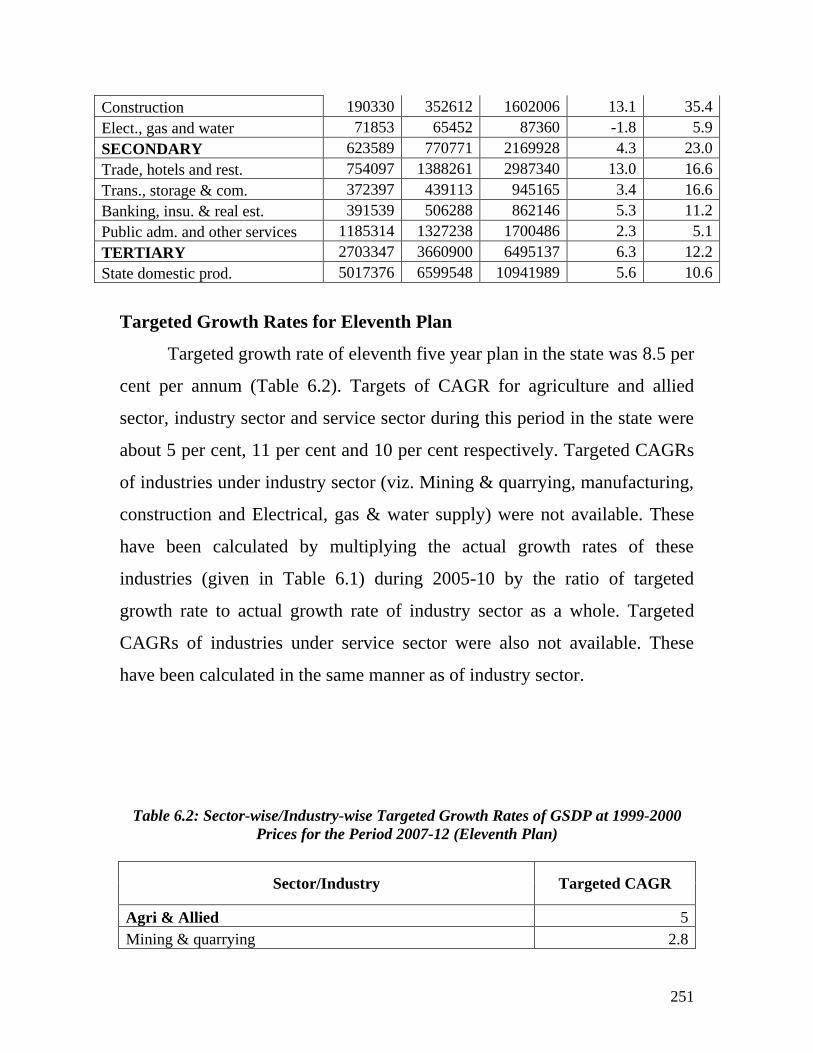
251
Construction 190330 352612 1602006 13.1 35.4
Elect., gas and water 71853 65452 87360 -1.8 5.9
SECONDARY 623589 770771 2169928 4.3 23.0
Trade, hotels and rest. 754097 1388261 2987340 13.0 16.6
Trans., storage & com. 372397 439113 945165 3.4 16.6
Banking, insu. & real est. 391539 506288 862146 5.3 11.2
Public adm. and other services 1185314 1327238 1700486 2.3 5.1
TERTIARY 2703347 3660900 6495137 6.3 12.2
State domestic prod. 5017376 6599548 10941989 5.6 10.6
Targeted Growth Rates for Eleventh Plan
Targeted growth rate of eleventh five year plan in the state was 8.5 per
cent per annum (Table 6.2). Targets of CAGR for agriculture and allied
sector, industry sector and service sector during this period in the state were
about 5 per cent, 11 per cent and 10 per cent respectively. Targeted CAGRs
of industries under industry sector (viz. Mining & quarrying, manufacturing,
construction and Electrical, gas & water supply) were not available. These
have been calculated by multiplying the actual growth rates of these
industries (given in Table 6.1) during 2005-10 by the ratio of targeted
growth rate to actual growth rate of industry sector as a whole. Targeted
CAGRs of industries under service sector were also not available. These
have been calculated in the same manner as of industry sector.
Table 6.2: Sector-wise/Industry-wise Targeted Growth Rates of GSDP at 1999-2000
Prices for the Period 2007-12 (Eleventh Plan)
Sector/Industry Targeted CAGR
Agri & Allied 5
Mining & quarrying 2.8
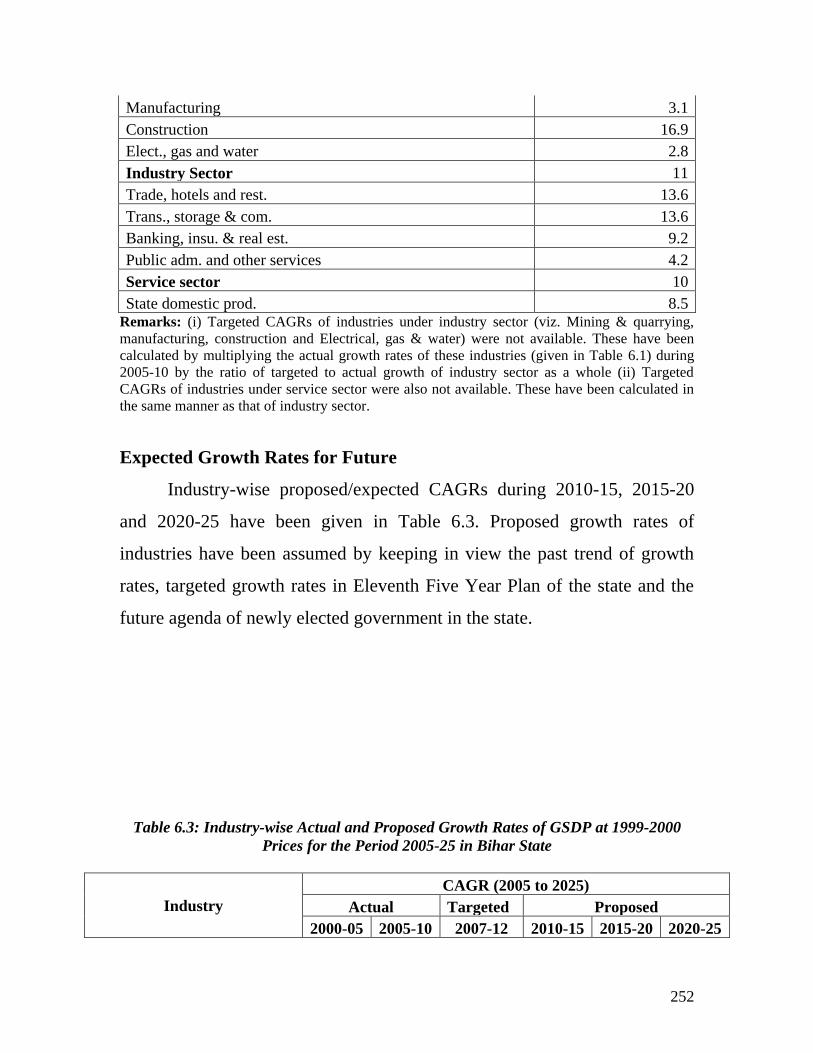
252
Manufacturing 3.1
Construction 16.9
Elect., gas and water 2.8
Industry Sector 11
Trade, hotels and rest. 13.6
Trans., storage & com. 13.6
Banking, insu. & real est. 9.2
Public adm. and other services 4.2
Service sector 10
State domestic prod. 8.5 Remarks: (i) Targeted CAGRs of industries under industry sector (viz. Mining & quarrying,
manufacturing, construction and Electrical, gas & water) were not available. These have been
calculated by multiplying the actual growth rates of these industries (given in Table 6.1) during
2005-10 by the ratio of targeted to actual growth of industry sector as a whole (ii) Targeted
CAGRs of industries under service sector were also not available. These have been calculated in
the same manner as that of industry sector.
Expected Growth Rates for Future
Industry-wise proposed/expected CAGRs during 2010-15, 2015-20
and 2020-25 have been given in Table 6.3. Proposed growth rates of
industries have been assumed by keeping in view the past trend of growth
rates, targeted growth rates in Eleventh Five Year Plan of the state and the
future agenda of newly elected government in the state.
Table 6.3: Industry-wise Actual and Proposed Growth Rates of GSDP at 1999-2000
Prices for the Period 2005-25 in Bihar State
Industry
CAGR (2005 to 2025)
Actual Targeted Proposed
2000-05 2005-10 2007-12 2010-15 2015-20 2020-25
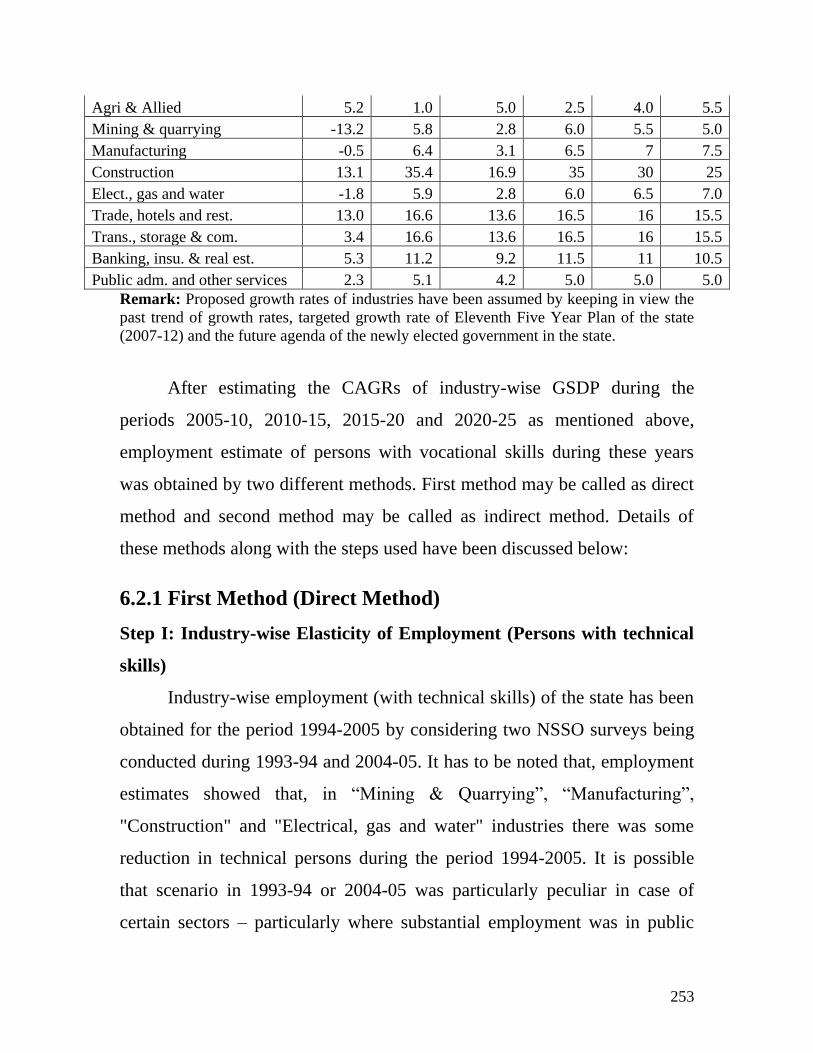
253
Agri & Allied 5.2 1.0 5.0 2.5 4.0 5.5
Mining & quarrying -13.2 5.8 2.8 6.0 5.5 5.0
Manufacturing -0.5 6.4 3.1 6.5 7 7.5
Construction 13.1 35.4 16.9 35 30 25
Elect., gas and water -1.8 5.9 2.8 6.0 6.5 7.0
Trade, hotels and rest. 13.0 16.6 13.6 16.5 16 15.5
Trans., storage & com. 3.4 16.6 13.6 16.5 16 15.5
Banking, insu. & real est. 5.3 11.2 9.2 11.5 11 10.5
Public adm. and other services 2.3 5.1 4.2 5.0 5.0 5.0
Remark: Proposed growth rates of industries have been assumed by keeping in view the
past trend of growth rates, targeted growth rate of Eleventh Five Year Plan of the state
(2007-12) and the future agenda of the newly elected government in the state.
After estimating the CAGRs of industry-wise GSDP during the
periods 2005-10, 2010-15, 2015-20 and 2020-25 as mentioned above,
employment estimate of persons with vocational skills during these years
was obtained by two different methods. First method may be called as direct
method and second method may be called as indirect method. Details of
these methods along with the steps used have been discussed below:
6.2.1 First Method (Direct Method)
Step I: Industry-wise Elasticity of Employment (Persons with technical
skills)
Industry-wise employment (with technical skills) of the state has been
obtained for the period 1994-2005 by considering two NSSO surveys being
conducted during 1993-94 and 2004-05. It has to be noted that, employment
estimates showed that, in ―Mining & Quarrying‖, ―Manufacturing‖,
"Construction" and "Electrical, gas and water" industries there was some
reduction in technical persons during the period 1994-2005. It is possible
that scenario in 1993-94 or 2004-05 was particularly peculiar in case of
certain sectors – particularly where substantial employment was in public
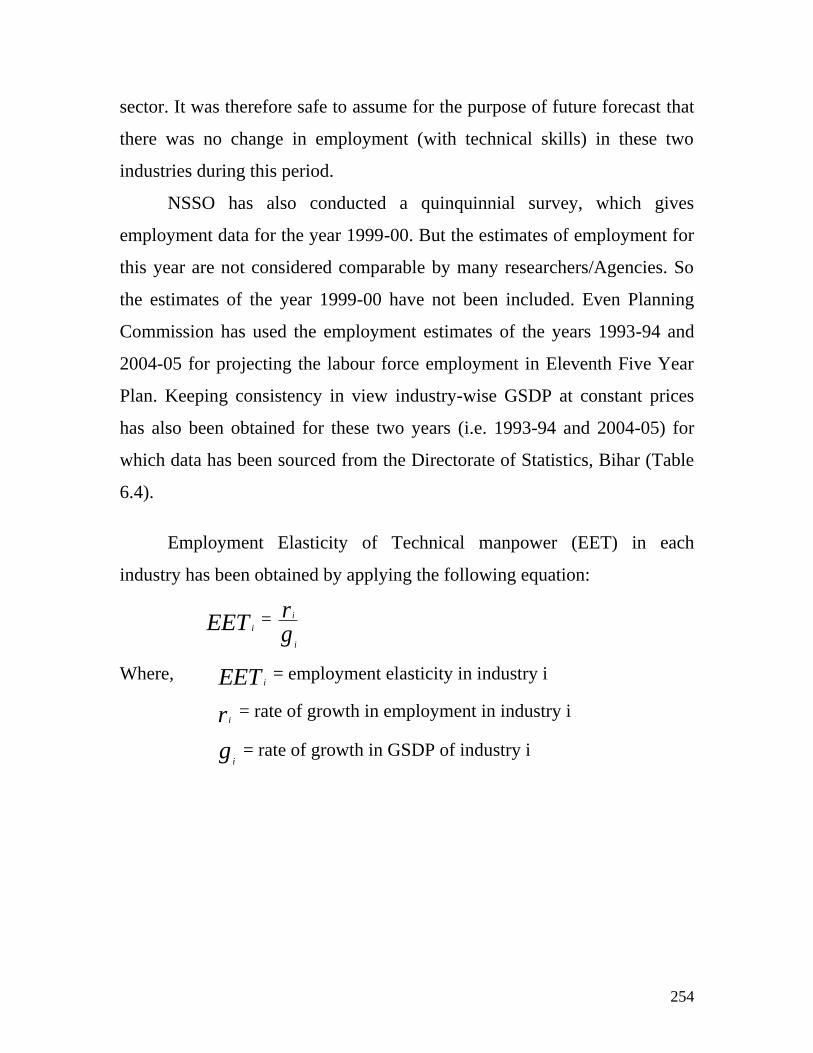
254
sector. It was therefore safe to assume for the purpose of future forecast that
there was no change in employment (with technical skills) in these two
industries during this period.
NSSO has also conducted a quinquinnial survey, which gives
employment data for the year 1999-00. But the estimates of employment for
this year are not considered comparable by many researchers/Agencies. So
the estimates of the year 1999-00 have not been included. Even Planning
Commission has used the employment estimates of the years 1993-94 and
2004-05 for projecting the labour force employment in Eleventh Five Year
Plan. Keeping consistency in view industry-wise GSDP at constant prices
has also been obtained for these two years (i.e. 1993-94 and 2004-05) for
which data has been sourced from the Directorate of Statistics, Bihar (Table
6.4).
Employment Elasticity of Technical manpower (EET) in each
industry has been obtained by applying the following equation:
EET i =
gr
i
i
Where, EET i = employment elasticity in industry i
r i = rate of growth in employment in industry i
gi = rate of growth in GSDP of industry i
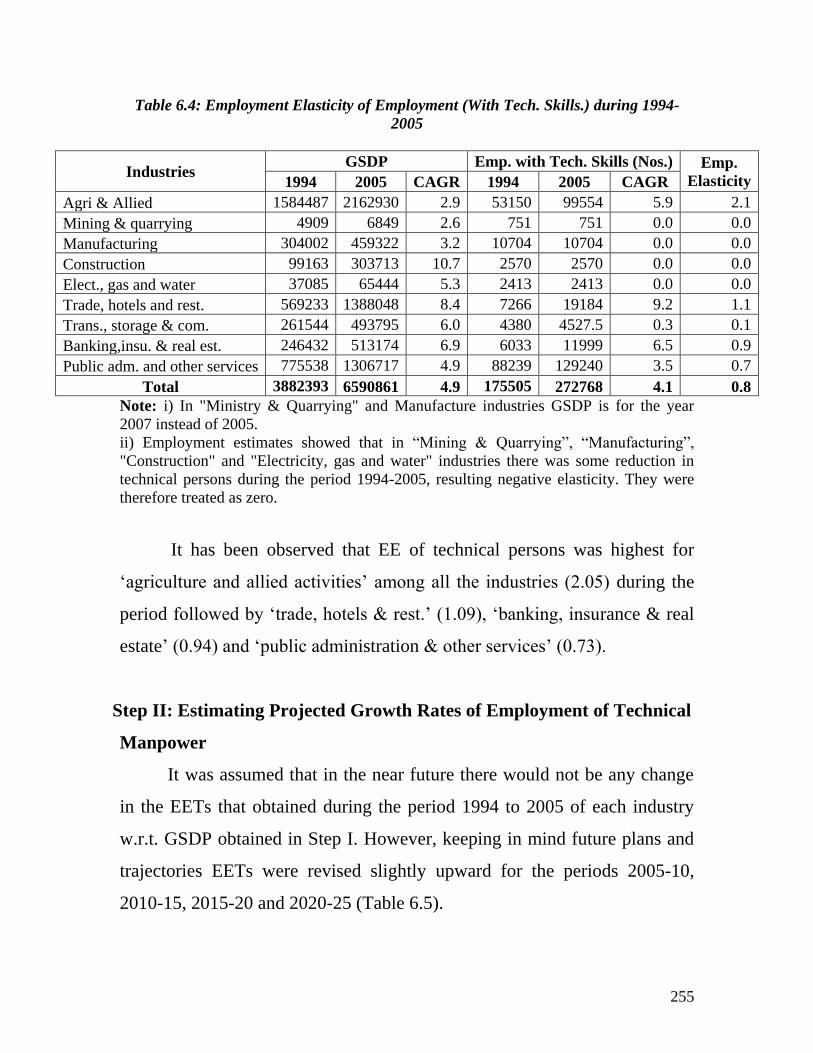
255
Table 6.4: Employment Elasticity of Employment (With Tech. Skills.) during 1994-
2005
Industries GSDP Emp. with Tech. Skills (Nos.) Emp.
Elasticity 1994 2005 CAGR 1994 2005 CAGR
Agri & Allied 1584487 2162930 2.9 53150 99554 5.9 2.1
Mining & quarrying 4909 6849 2.6 751 751 0.0 0.0
Manufacturing 304002 459322 3.2 10704 10704 0.0 0.0
Construction 99163 303713 10.7 2570 2570 0.0 0.0
Elect., gas and water 37085 65444 5.3 2413 2413 0.0 0.0
Trade, hotels and rest. 569233 1388048 8.4 7266 19184 9.2 1.1
Trans., storage & com. 261544 493795 6.0 4380 4527.5 0.3 0.1
Banking,insu. & real est. 246432 513174 6.9 6033 11999 6.5 0.9
Public adm. and other services 775538 1306717 4.9 88239 129240 3.5 0.7
Total 3882393 6590861 4.9 175505 272768 4.1 0.8
Note: i) In "Ministry & Quarrying" and Manufacture industries GSDP is for the year
2007 instead of 2005.
ii) Employment estimates showed that in ―Mining & Quarrying‖, ―Manufacturing‖,
"Construction" and "Electricity, gas and water" industries there was some reduction in
technical persons during the period 1994-2005, resulting negative elasticity. They were
therefore treated as zero.
It has been observed that EE of technical persons was highest for
‗agriculture and allied activities‘ among all the industries (2.05) during the
period followed by ‗trade, hotels & rest.‘ (1.09), ‗banking, insurance & real
estate‘ (0.94) and ‗public administration & other services‘ (0.73).
Step II: Estimating Projected Growth Rates of Employment of Technical
Manpower
It was assumed that in the near future there would not be any change
in the EETs that obtained during the period 1994 to 2005 of each industry
w.r.t. GSDP obtained in Step I. However, keeping in mind future plans and
trajectories EETs were revised slightly upward for the periods 2005-10,
2010-15, 2015-20 and 2020-25 (Table 6.5).
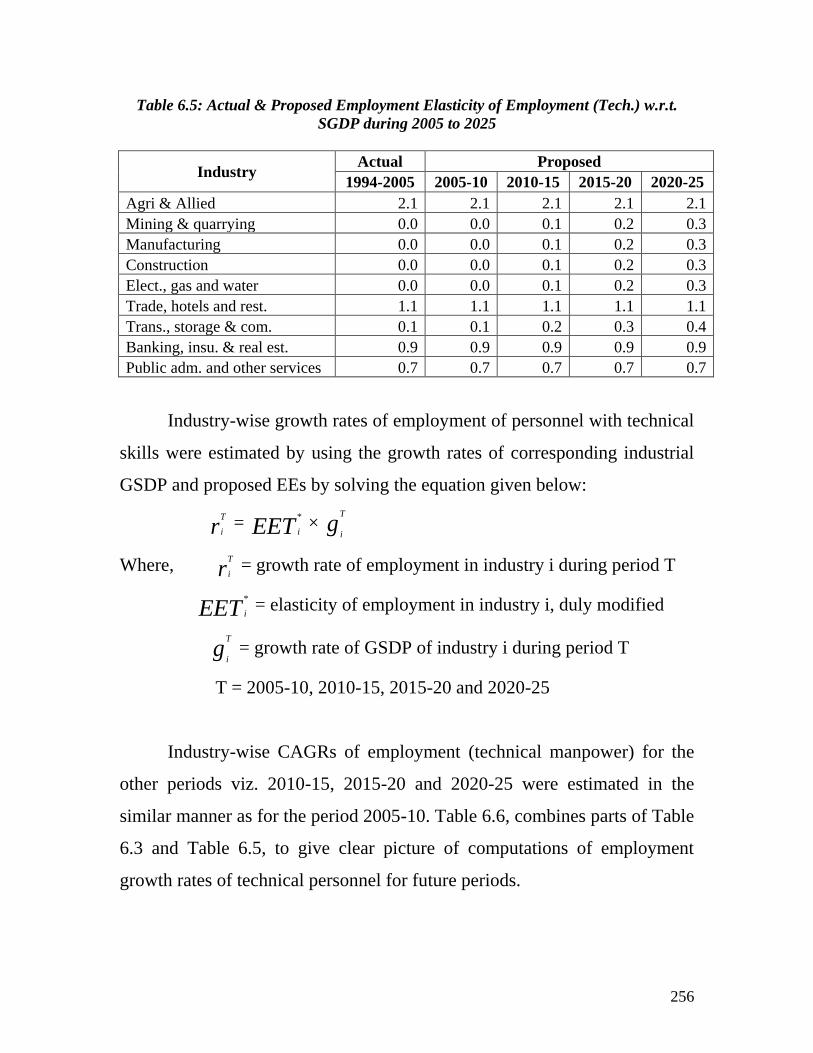
256
Table 6.5: Actual & Proposed Employment Elasticity of Employment (Tech.) w.r.t.
SGDP during 2005 to 2025
Industry Actual Proposed
1994-2005 2005-10 2010-15 2015-20 2020-25
Agri & Allied 2.1 2.1 2.1 2.1 2.1
Mining & quarrying 0.0 0.0 0.1 0.2 0.3
Manufacturing 0.0 0.0 0.1 0.2 0.3
Construction 0.0 0.0 0.1 0.2 0.3
Elect., gas and water 0.0 0.0 0.1 0.2 0.3
Trade, hotels and rest. 1.1 1.1 1.1 1.1 1.1
Trans., storage & com. 0.1 0.1 0.2 0.3 0.4
Banking, insu. & real est. 0.9 0.9 0.9 0.9 0.9
Public adm. and other services 0.7 0.7 0.7 0.7 0.7
Industry-wise growth rates of employment of personnel with technical
skills were estimated by using the growth rates of corresponding industrial
GSDP and proposed EEs by solving the equation given below:
rT
i = EET i
* × g
T
i
Where, rT
i = growth rate of employment in industry i during period T
EET i
* = elasticity of employment in industry i, duly modified
gT
i = growth rate of GSDP of industry i during period T
T = 2005-10, 2010-15, 2015-20 and 2020-25
Industry-wise CAGRs of employment (technical manpower) for the
other periods viz. 2010-15, 2015-20 and 2020-25 were estimated in the
similar manner as for the period 2005-10. Table 6.6, combines parts of Table
6.3 and Table 6.5, to give clear picture of computations of employment
growth rates of technical personnel for future periods.
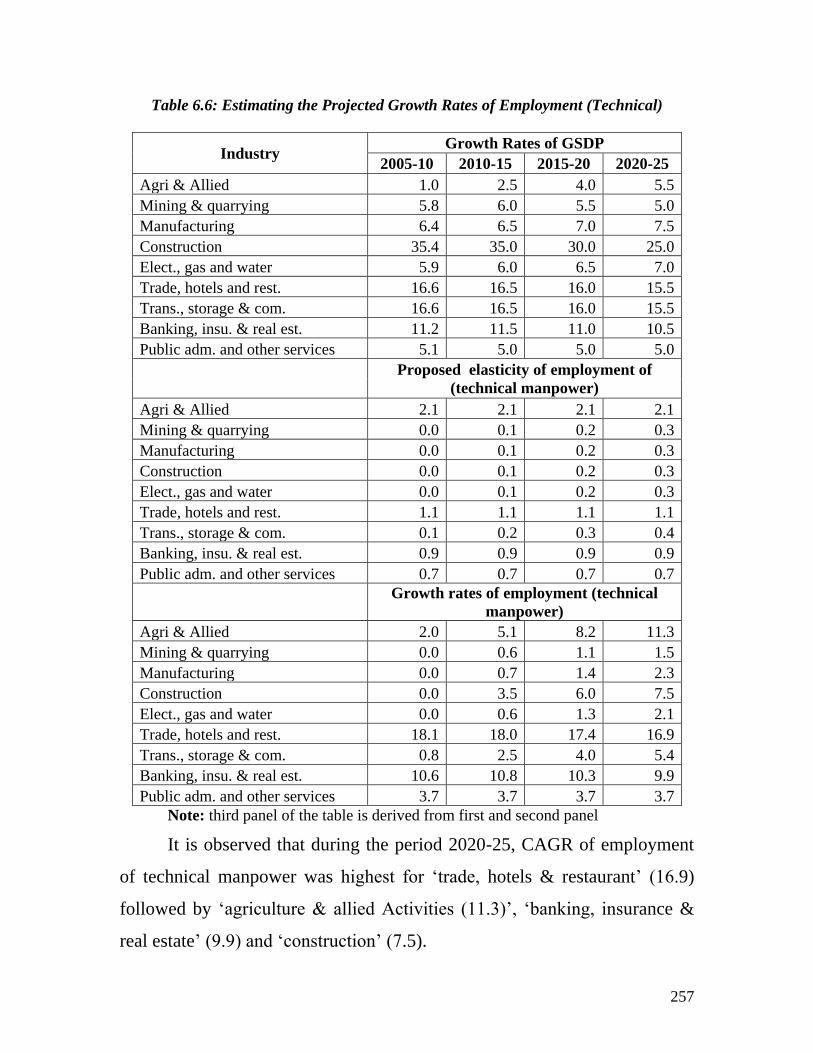
257
Table 6.6: Estimating the Projected Growth Rates of Employment (Technical)
Industry Growth Rates of GSDP
2005-10 2010-15 2015-20 2020-25
Agri & Allied 1.0 2.5 4.0 5.5
Mining & quarrying 5.8 6.0 5.5 5.0
Manufacturing 6.4 6.5 7.0 7.5
Construction 35.4 35.0 30.0 25.0
Elect., gas and water 5.9 6.0 6.5 7.0
Trade, hotels and rest. 16.6 16.5 16.0 15.5
Trans., storage & com. 16.6 16.5 16.0 15.5
Banking, insu. & real est. 11.2 11.5 11.0 10.5
Public adm. and other services 5.1 5.0 5.0 5.0
Proposed elasticity of employment of
(technical manpower)
Agri & Allied 2.1 2.1 2.1 2.1
Mining & quarrying 0.0 0.1 0.2 0.3
Manufacturing 0.0 0.1 0.2 0.3
Construction 0.0 0.1 0.2 0.3
Elect., gas and water 0.0 0.1 0.2 0.3
Trade, hotels and rest. 1.1 1.1 1.1 1.1
Trans., storage & com. 0.1 0.2 0.3 0.4
Banking, insu. & real est. 0.9 0.9 0.9 0.9
Public adm. and other services 0.7 0.7 0.7 0.7
Growth rates of employment (technical
manpower)
Agri & Allied 2.0 5.1 8.2 11.3
Mining & quarrying 0.0 0.6 1.1 1.5
Manufacturing 0.0 0.7 1.4 2.3
Construction 0.0 3.5 6.0 7.5
Elect., gas and water 0.0 0.6 1.3 2.1
Trade, hotels and rest. 18.1 18.0 17.4 16.9
Trans., storage & com. 0.8 2.5 4.0 5.4
Banking, insu. & real est. 10.6 10.8 10.3 9.9
Public adm. and other services 3.7 3.7 3.7 3.7
Note: third panel of the table is derived from first and second panel
It is observed that during the period 2020-25, CAGR of employment
of technical manpower was highest for ‗trade, hotels & restaurant‘ (16.9)
followed by ‗agriculture & allied Activities (11.3)‘, ‗banking, insurance &
real estate‘ (9.9) and ‗construction‘ (7.5).
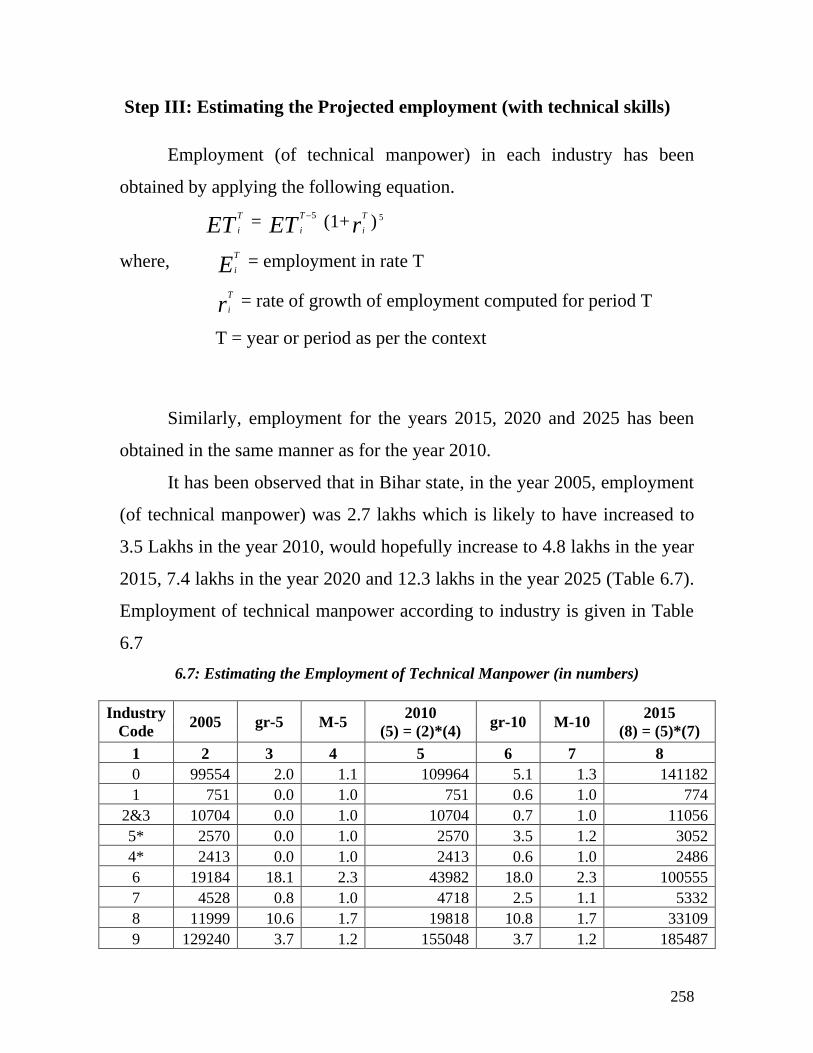
258
Step III: Estimating the Projected employment (with technical skills)
Employment (of technical manpower) in each industry has been
obtained by applying the following equation.
ETT
i = ET
T
i
5 (1+r
T
i) 5
where, ET
i = employment in rate T
rT
i = rate of growth of employment computed for period T
T = year or period as per the context
Similarly, employment for the years 2015, 2020 and 2025 has been
obtained in the same manner as for the year 2010.
It has been observed that in Bihar state, in the year 2005, employment
(of technical manpower) was 2.7 lakhs which is likely to have increased to
3.5 Lakhs in the year 2010, would hopefully increase to 4.8 lakhs in the year
2015, 7.4 lakhs in the year 2020 and 12.3 lakhs in the year 2025 (Table 6.7).
Employment of technical manpower according to industry is given in Table
6.7
6.7: Estimating the Employment of Technical Manpower (in numbers)
Industry
Code 2005 gr-5 M-5
2010
(5) = (2)*(4) gr-10 M-10
2015
(8) = (5)*(7)
1 2 3 4 5 6 7 8
0 99554 2.0 1.1 109964 5.1 1.3 141182
1 751 0.0 1.0 751 0.6 1.0 774
2&3 10704 0.0 1.0 10704 0.7 1.0 11056
5* 2570 0.0 1.0 2570 3.5 1.2 3052
4* 2413 0.0 1.0 2413 0.6 1.0 2486
6 19184 18.1 2.3 43982 18.0 2.3 100555
7 4528 0.8 1.0 4718 2.5 1.1 5332
8 11999 10.6 1.7 19818 10.8 1.7 33109
9 129240 3.7 1.2 155048 3.7 1.2 185487
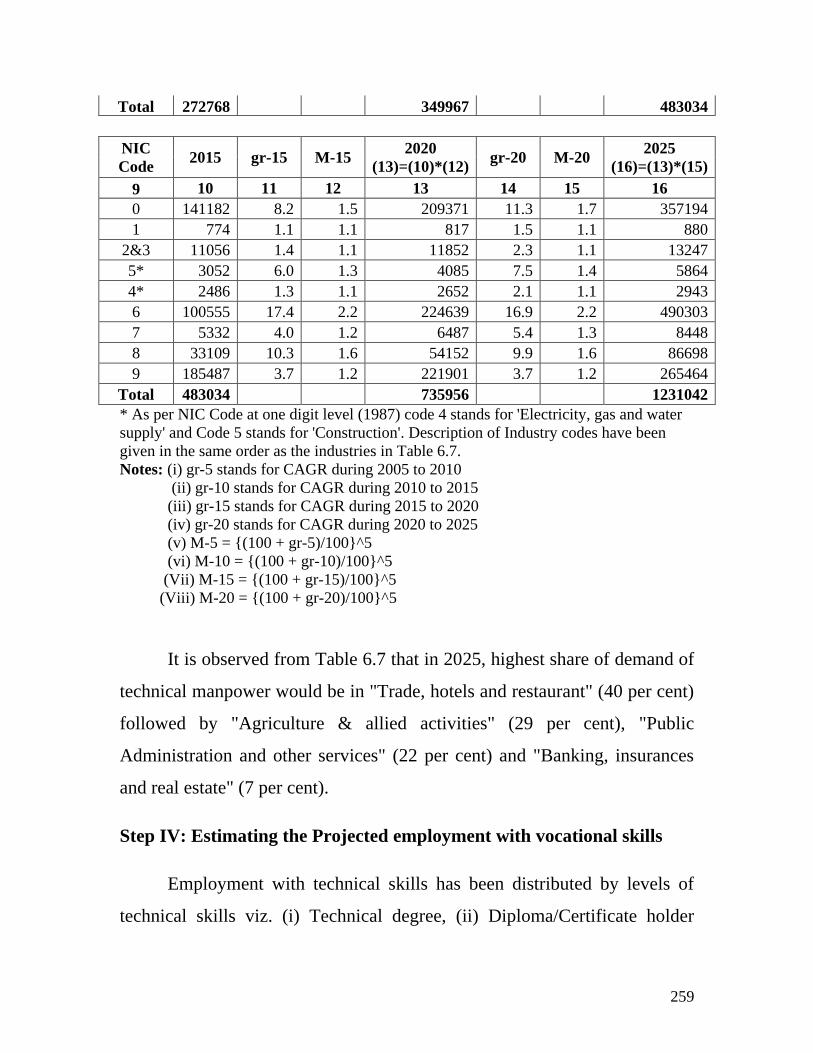
259
Total 272768 349967 483034
NIC
Code 2015 gr-15 M-15
2020
(13)=(10)*(12) gr-20 M-20
2025
(16)=(13)*(15)
9 10 11 12 13 14 15 16
0 141182 8.2 1.5 209371 11.3 1.7 357194
1 774 1.1 1.1 817 1.5 1.1 880
2&3 11056 1.4 1.1 11852 2.3 1.1 13247
5* 3052 6.0 1.3 4085 7.5 1.4 5864
4* 2486 1.3 1.1 2652 2.1 1.1 2943
6 100555 17.4 2.2 224639 16.9 2.2 490303
7 5332 4.0 1.2 6487 5.4 1.3 8448
8 33109 10.3 1.6 54152 9.9 1.6 86698
9 185487 3.7 1.2 221901 3.7 1.2 265464
Total 483034 735956 1231042
* As per NIC Code at one digit level (1987) code 4 stands for 'Electricity, gas and water
supply' and Code 5 stands for 'Construction'. Description of Industry codes have been
given in the same order as the industries in Table 6.7.
Notes: (i) gr-5 stands for CAGR during 2005 to 2010
(ii) gr-10 stands for CAGR during 2010 to 2015
(iii) gr-15 stands for CAGR during 2015 to 2020
(iv) gr-20 stands for CAGR during 2020 to 2025
(v) M-5 = {(100 + gr-5)/100}^5
(vi) M-10 = {(100 + gr-10)/100}^5
(Vii) M-15 = {(100 + gr-15)/100}^5
(Viii) M-20 = {(100 + gr-20)/100}^5
It is observed from Table 6.7 that in 2025, highest share of demand of
technical manpower would be in "Trade, hotels and restaurant" (40 per cent)
followed by "Agriculture & allied activities" (29 per cent), "Public
Administration and other services" (22 per cent) and "Banking, insurances
and real estate" (7 per cent).
Step IV: Estimating the Projected employment with vocational skills
Employment with technical skills has been distributed by levels of
technical skills viz. (i) Technical degree, (ii) Diploma/Certificate holder
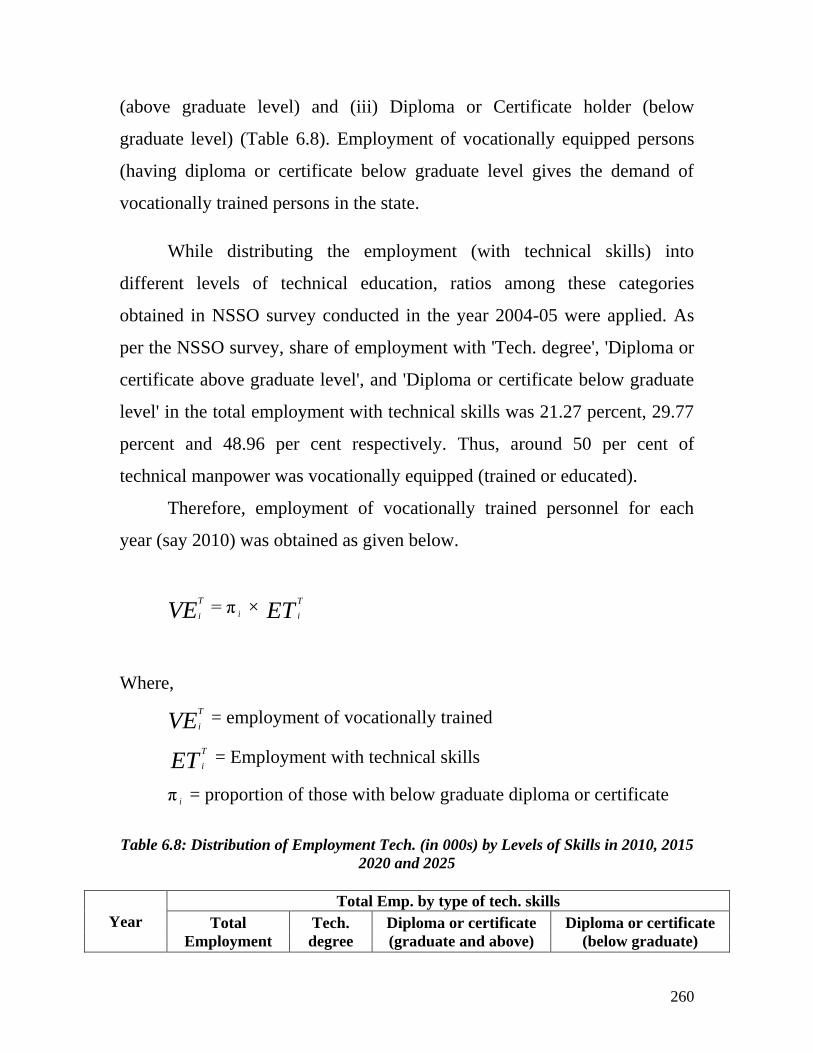
260
(above graduate level) and (iii) Diploma or Certificate holder (below
graduate level) (Table 6.8). Employment of vocationally equipped persons
(having diploma or certificate below graduate level gives the demand of
vocationally trained persons in the state.
While distributing the employment (with technical skills) into
different levels of technical education, ratios among these categories
obtained in NSSO survey conducted in the year 2004-05 were applied. As
per the NSSO survey, share of employment with 'Tech. degree', 'Diploma or
certificate above graduate level', and 'Diploma or certificate below graduate
level' in the total employment with technical skills was 21.27 percent, 29.77
percent and 48.96 per cent respectively. Thus, around 50 per cent of
technical manpower was vocationally equipped (trained or educated).
Therefore, employment of vocationally trained personnel for each
year (say 2010) was obtained as given below.
VET
i = π i × ET
T
i
Where,
VET
i = employment of vocationally trained
ETT
i = Employment with technical skills
π i = proportion of those with below graduate diploma or certificate
Table 6.8: Distribution of Employment Tech. (in 000s) by Levels of Skills in 2010, 2015
2020 and 2025
Year
Total Emp. by type of tech. skills
Total
Employment
Tech.
degree
Diploma or certificate
(graduate and above)
Diploma or certificate
(below graduate)
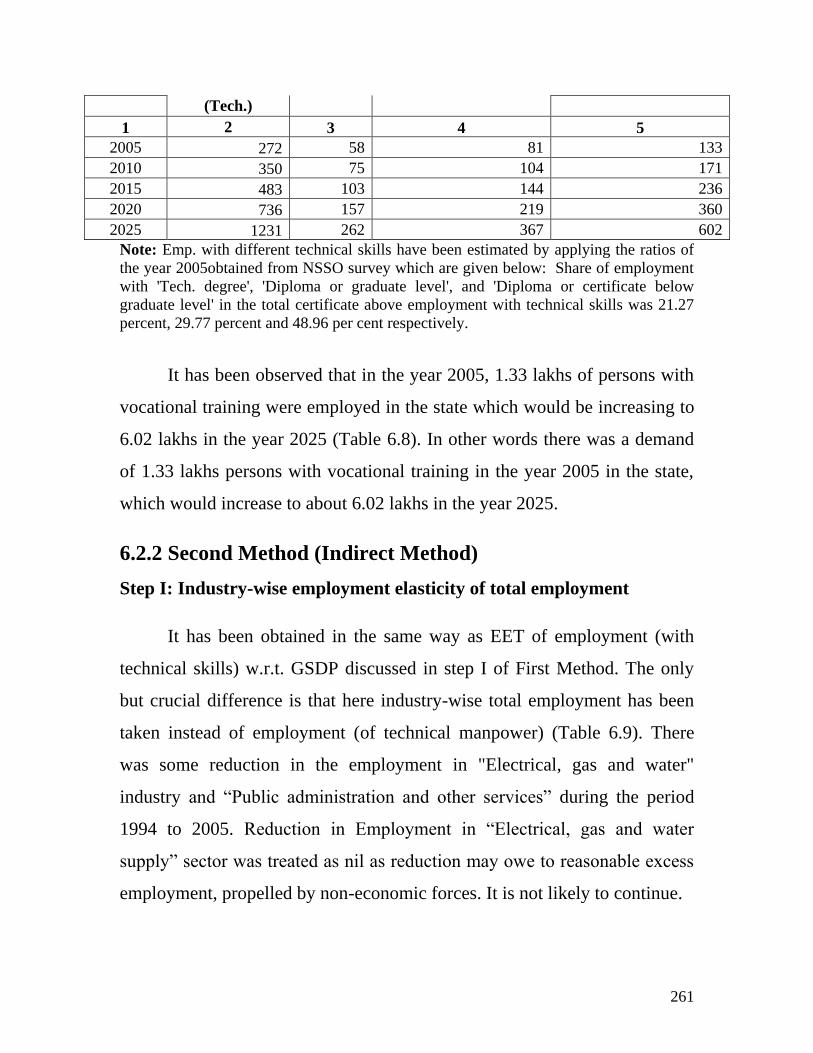
261
(Tech.)
1 2 3 4 5
2005 272 58 81 133
2010 350 75 104 171
2015 483 103 144 236
2020 736 157 219 360
2025 1231 262 367 602
Note: Emp. with different technical skills have been estimated by applying the ratios of
the year 2005obtained from NSSO survey which are given below: Share of employment
with 'Tech. degree', 'Diploma or graduate level', and 'Diploma or certificate below
graduate level' in the total certificate above employment with technical skills was 21.27
percent, 29.77 percent and 48.96 per cent respectively.
It has been observed that in the year 2005, 1.33 lakhs of persons with
vocational training were employed in the state which would be increasing to
6.02 lakhs in the year 2025 (Table 6.8). In other words there was a demand
of 1.33 lakhs persons with vocational training in the year 2005 in the state,
which would increase to about 6.02 lakhs in the year 2025.
6.2.2 Second Method (Indirect Method)
Step I: Industry-wise employment elasticity of total employment
It has been obtained in the same way as EET of employment (with
technical skills) w.r.t. GSDP discussed in step I of First Method. The only
but crucial difference is that here industry-wise total employment has been
taken instead of employment (of technical manpower) (Table 6.9). There
was some reduction in the employment in "Electrical, gas and water"
industry and ―Public administration and other services‖ during the period
1994 to 2005. Reduction in Employment in ―Electrical, gas and water
supply‖ sector was treated as nil as reduction may owe to reasonable excess
employment, propelled by non-economic forces. It is not likely to continue.
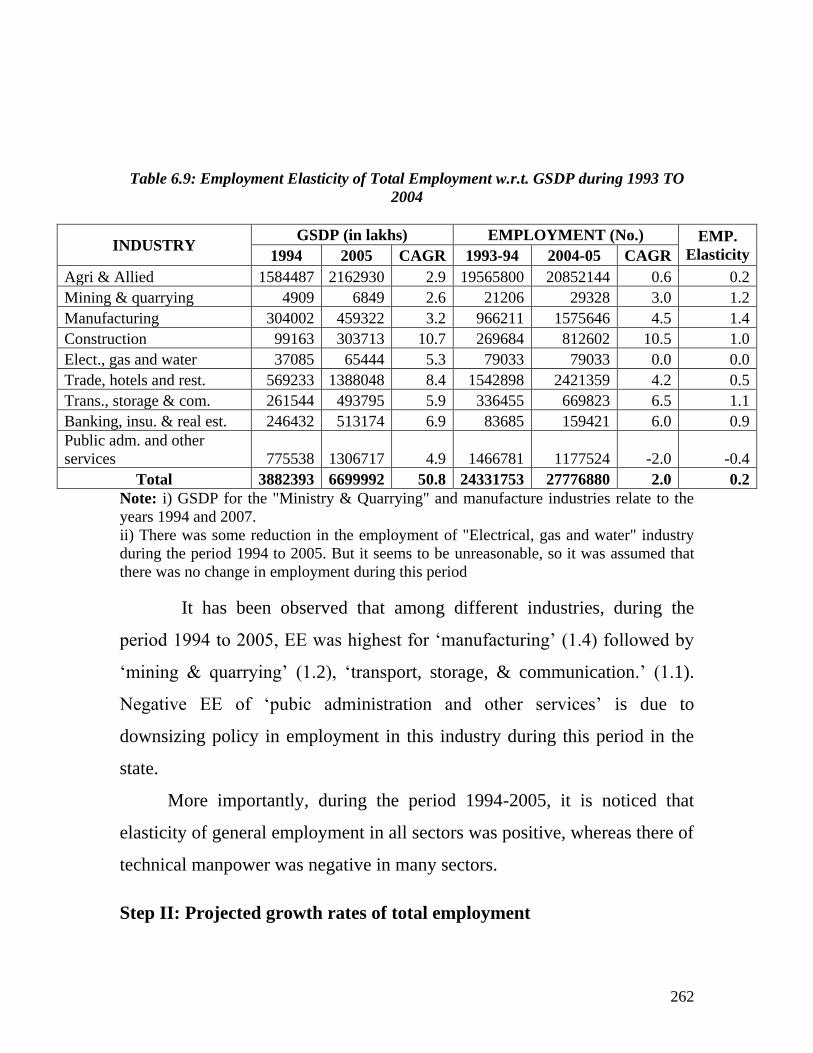
262
Table 6.9: Employment Elasticity of Total Employment w.r.t. GSDP during 1993 TO
2004
INDUSTRY GSDP (in lakhs) EMPLOYMENT (No.) EMP.
Elasticity 1994 2005 CAGR 1993-94 2004-05 CAGR
Agri & Allied 1584487 2162930 2.9 19565800 20852144 0.6 0.2
Mining & quarrying 4909 6849 2.6 21206 29328 3.0 1.2
Manufacturing 304002 459322 3.2 966211 1575646 4.5 1.4
Construction 99163 303713 10.7 269684 812602 10.5 1.0
Elect., gas and water 37085 65444 5.3 79033 79033 0.0 0.0
Trade, hotels and rest. 569233 1388048 8.4 1542898 2421359 4.2 0.5
Trans., storage & com. 261544 493795 5.9 336455 669823 6.5 1.1
Banking, insu. & real est. 246432 513174 6.9 83685 159421 6.0 0.9
Public adm. and other
services 775538 1306717 4.9 1466781 1177524 -2.0 -0.4
Total 3882393 6699992 50.8 24331753 27776880 2.0 0.2
Note: i) GSDP for the "Ministry & Quarrying" and manufacture industries relate to the
years 1994 and 2007.
ii) There was some reduction in the employment of "Electrical, gas and water" industry
during the period 1994 to 2005. But it seems to be unreasonable, so it was assumed that
there was no change in employment during this period
It has been observed that among different industries, during the
period 1994 to 2005, EE was highest for ‗manufacturing‘ (1.4) followed by
‗mining & quarrying‘ (1.2), ‗transport, storage, & communication.‘ (1.1).
Negative EE of ‗pubic administration and other services‘ is due to
downsizing policy in employment in this industry during this period in the
state.
More importantly, during the period 1994-2005, it is noticed that
elasticity of general employment in all sectors was positive, whereas there of
technical manpower was negative in many sectors.
Step II: Projected growth rates of total employment
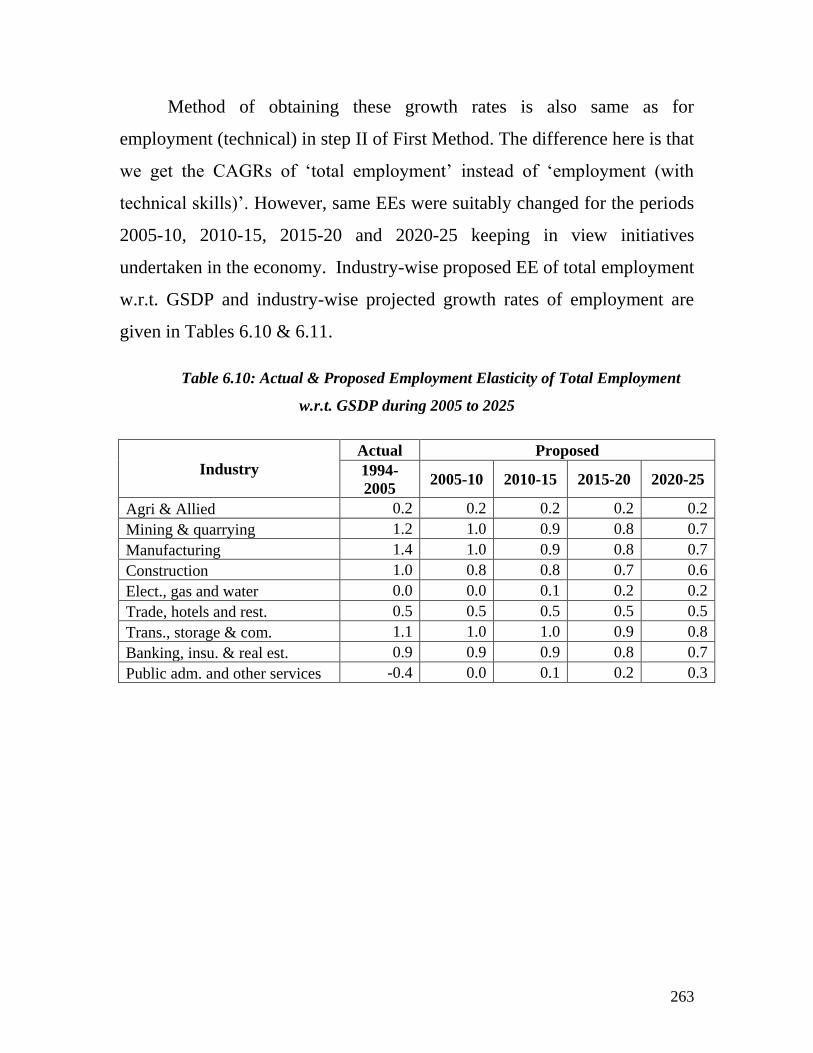
263
Method of obtaining these growth rates is also same as for
employment (technical) in step II of First Method. The difference here is that
we get the CAGRs of ‗total employment‘ instead of ‗employment (with
technical skills)‘. However, same EEs were suitably changed for the periods
2005-10, 2010-15, 2015-20 and 2020-25 keeping in view initiatives
undertaken in the economy. Industry-wise proposed EE of total employment
w.r.t. GSDP and industry-wise projected growth rates of employment are
given in Tables 6.10 & 6.11.
Table 6.10: Actual & Proposed Employment Elasticity of Total Employment
w.r.t. GSDP during 2005 to 2025
Industry
Actual Proposed
1994-
2005 2005-10 2010-15 2015-20 2020-25
Agri & Allied 0.2 0.2 0.2 0.2 0.2
Mining & quarrying 1.2 1.0 0.9 0.8 0.7
Manufacturing 1.4 1.0 0.9 0.8 0.7
Construction 1.0 0.8 0.8 0.7 0.6
Elect., gas and water 0.0 0.0 0.1 0.2 0.2
Trade, hotels and rest. 0.5 0.5 0.5 0.5 0.5
Trans., storage & com. 1.1 1.0 1.0 0.9 0.8
Banking, insu. & real est. 0.9 0.9 0.9 0.8 0.7
Public adm. and other services -0.4 0.0 0.1 0.2 0.3
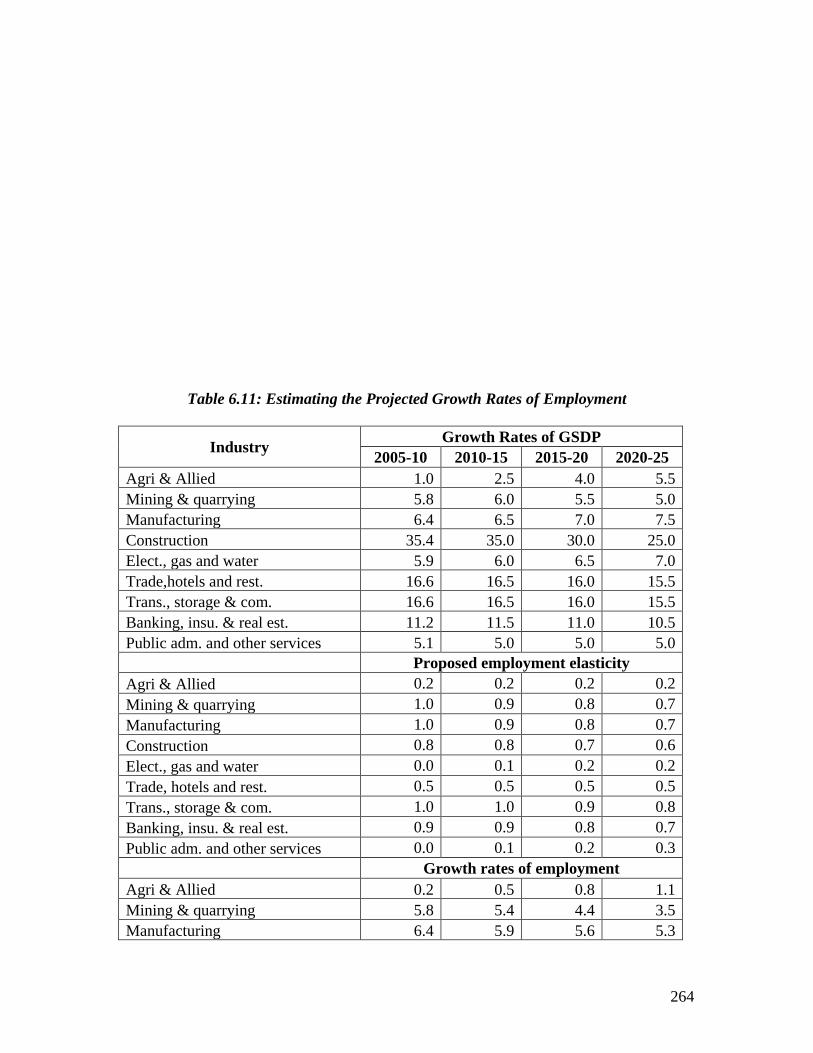
264
Table 6.11: Estimating the Projected Growth Rates of Employment
Industry Growth Rates of GSDP
2005-10 2010-15 2015-20 2020-25
Agri & Allied 1.0 2.5 4.0 5.5
Mining & quarrying 5.8 6.0 5.5 5.0
Manufacturing 6.4 6.5 7.0 7.5
Construction 35.4 35.0 30.0 25.0
Elect., gas and water 5.9 6.0 6.5 7.0
Trade,hotels and rest. 16.6 16.5 16.0 15.5
Trans., storage & com. 16.6 16.5 16.0 15.5
Banking, insu. & real est. 11.2 11.5 11.0 10.5
Public adm. and other services 5.1 5.0 5.0 5.0
Proposed employment elasticity
Agri & Allied 0.2 0.2 0.2 0.2
Mining & quarrying 1.0 0.9 0.8 0.7
Manufacturing 1.0 0.9 0.8 0.7
Construction 0.8 0.8 0.7 0.6
Elect., gas and water 0.0 0.1 0.2 0.2
Trade, hotels and rest. 0.5 0.5 0.5 0.5
Trans., storage & com. 1.0 1.0 0.9 0.8
Banking, insu. & real est. 0.9 0.9 0.8 0.7
Public adm. and other services 0.0 0.1 0.2 0.3
Growth rates of employment
Agri & Allied 0.2 0.5 0.8 1.1
Mining & quarrying 5.8 5.4 4.4 3.5
Manufacturing 6.4 5.9 5.6 5.3
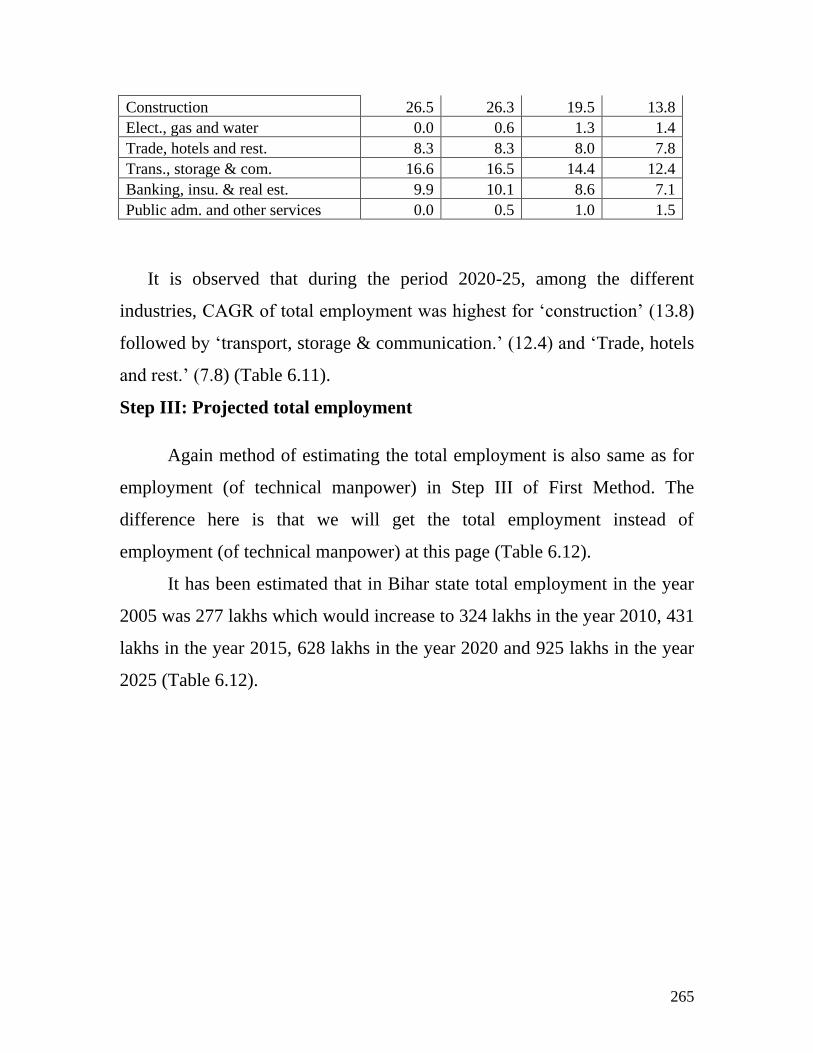
265
Construction 26.5 26.3 19.5 13.8
Elect., gas and water 0.0 0.6 1.3 1.4
Trade, hotels and rest. 8.3 8.3 8.0 7.8
Trans., storage & com. 16.6 16.5 14.4 12.4
Banking, insu. & real est. 9.9 10.1 8.6 7.1
Public adm. and other services 0.0 0.5 1.0 1.5
It is observed that during the period 2020-25, among the different
industries, CAGR of total employment was highest for ‗construction‘ (13.8)
followed by ‗transport, storage & communication.‘ (12.4) and ‗Trade, hotels
and rest.‘ (7.8) (Table 6.11).
Step III: Projected total employment
Again method of estimating the total employment is also same as for
employment (of technical manpower) in Step III of First Method. The
difference here is that we will get the total employment instead of
employment (of technical manpower) at this page (Table 6.12).
It has been estimated that in Bihar state total employment in the year
2005 was 277 lakhs which would increase to 324 lakhs in the year 2010, 431
lakhs in the year 2015, 628 lakhs in the year 2020 and 925 lakhs in the year
2025 (Table 6.12).
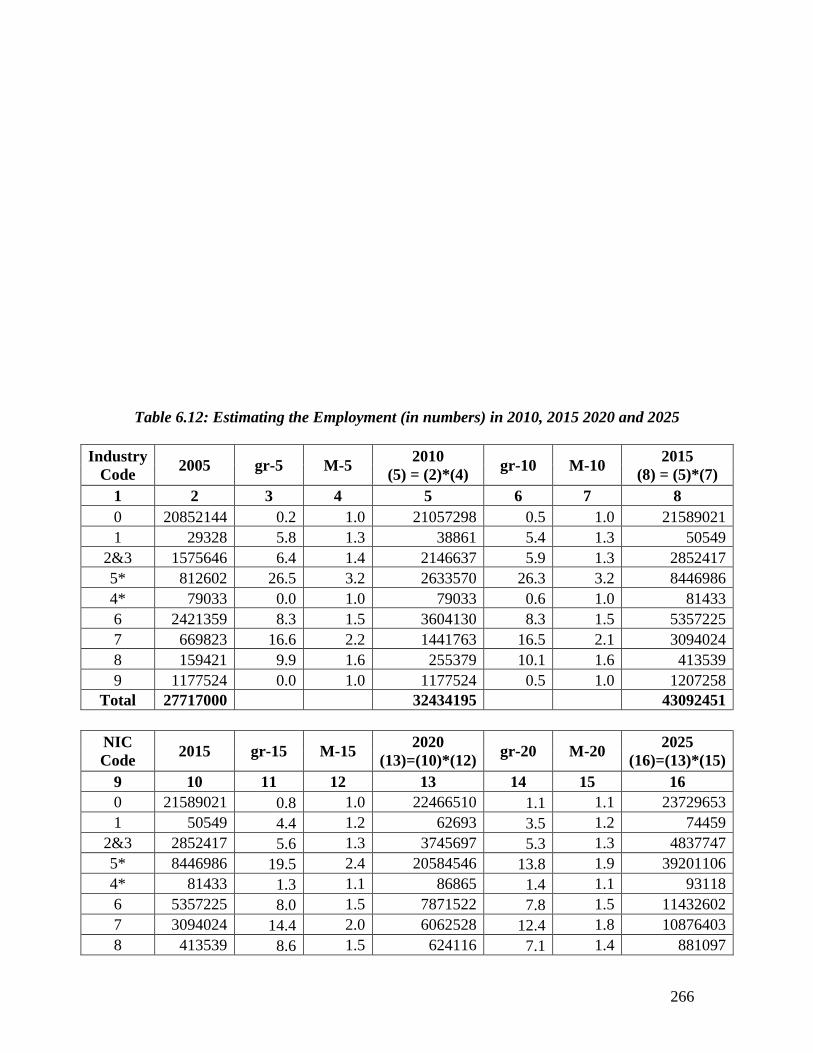
266
Table 6.12: Estimating the Employment (in numbers) in 2010, 2015 2020 and 2025
Industry
Code 2005 gr-5 M-5
2010
(5) = (2)*(4) gr-10 M-10
2015
(8) = (5)*(7)
1 2 3 4 5 6 7 8
0 20852144 0.2 1.0 21057298 0.5 1.0 21589021
1 29328 5.8 1.3 38861 5.4 1.3 50549
2&3 1575646 6.4 1.4 2146637 5.9 1.3 2852417
5* 812602 26.5 3.2 2633570 26.3 3.2 8446986
4* 79033 0.0 1.0 79033 0.6 1.0 81433
6 2421359 8.3 1.5 3604130 8.3 1.5 5357225
7 669823 16.6 2.2 1441763 16.5 2.1 3094024
8 159421 9.9 1.6 255379 10.1 1.6 413539
9 1177524 0.0 1.0 1177524 0.5 1.0 1207258
Total 27717000 32434195 43092451
NIC
Code 2015 gr-15 M-15
2020
(13)=(10)*(12) gr-20 M-20
2025
(16)=(13)*(15)
9 10 11 12 13 14 15 16
0 21589021 0.8 1.0 22466510 1.1 1.1 23729653
1 50549 4.4 1.2 62693 3.5 1.2 74459
2&3 2852417 5.6 1.3 3745697 5.3 1.3 4837747
5* 8446986 19.5 2.4 20584546 13.8 1.9 39201106
4* 81433 1.3 1.1 86865 1.4 1.1 93118
6 5357225 8.0 1.5 7871522 7.8 1.5 11432602
7 3094024 14.4 2.0 6062528 12.4 1.8 10876403
8 413539 8.6 1.5 624116 7.1 1.4 881097
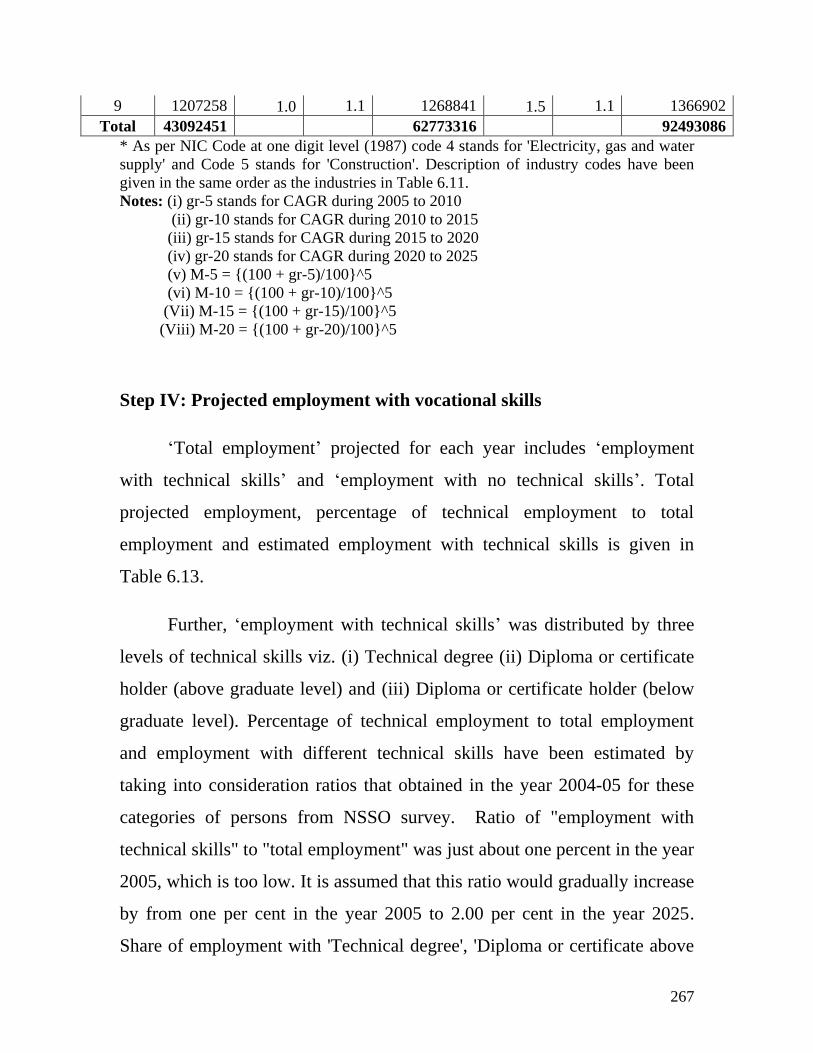
267
9 1207258 1.0 1.1 1268841 1.5 1.1 1366902
Total 43092451 62773316 92493086
* As per NIC Code at one digit level (1987) code 4 stands for 'Electricity, gas and water
supply' and Code 5 stands for 'Construction'. Description of industry codes have been
given in the same order as the industries in Table 6.11.
Notes: (i) gr-5 stands for CAGR during 2005 to 2010
(ii) gr-10 stands for CAGR during 2010 to 2015
(iii) gr-15 stands for CAGR during 2015 to 2020
(iv) gr-20 stands for CAGR during 2020 to 2025
(v) M-5 = {(100 + gr-5)/100}^5
(vi) M-10 = {(100 + gr-10)/100}^5
(Vii) M-15 = {(100 + gr-15)/100}^5
(Viii) M-20 = {(100 + gr-20)/100}^5
Step IV: Projected employment with vocational skills
‗Total employment‘ projected for each year includes ‗employment
with technical skills‘ and ‗employment with no technical skills‘. Total
projected employment, percentage of technical employment to total
employment and estimated employment with technical skills is given in
Table 6.13.
Further, ‗employment with technical skills‘ was distributed by three
levels of technical skills viz. (i) Technical degree (ii) Diploma or certificate
holder (above graduate level) and (iii) Diploma or certificate holder (below
graduate level). Percentage of technical employment to total employment
and employment with different technical skills have been estimated by
taking into consideration ratios that obtained in the year 2004-05 for these
categories of persons from NSSO survey. Ratio of "employment with
technical skills" to "total employment" was just about one percent in the year
2005, which is too low. It is assumed that this ratio would gradually increase
by from one per cent in the year 2005 to 2.00 per cent in the year 2025.
Share of employment with 'Technical degree', 'Diploma or certificate above
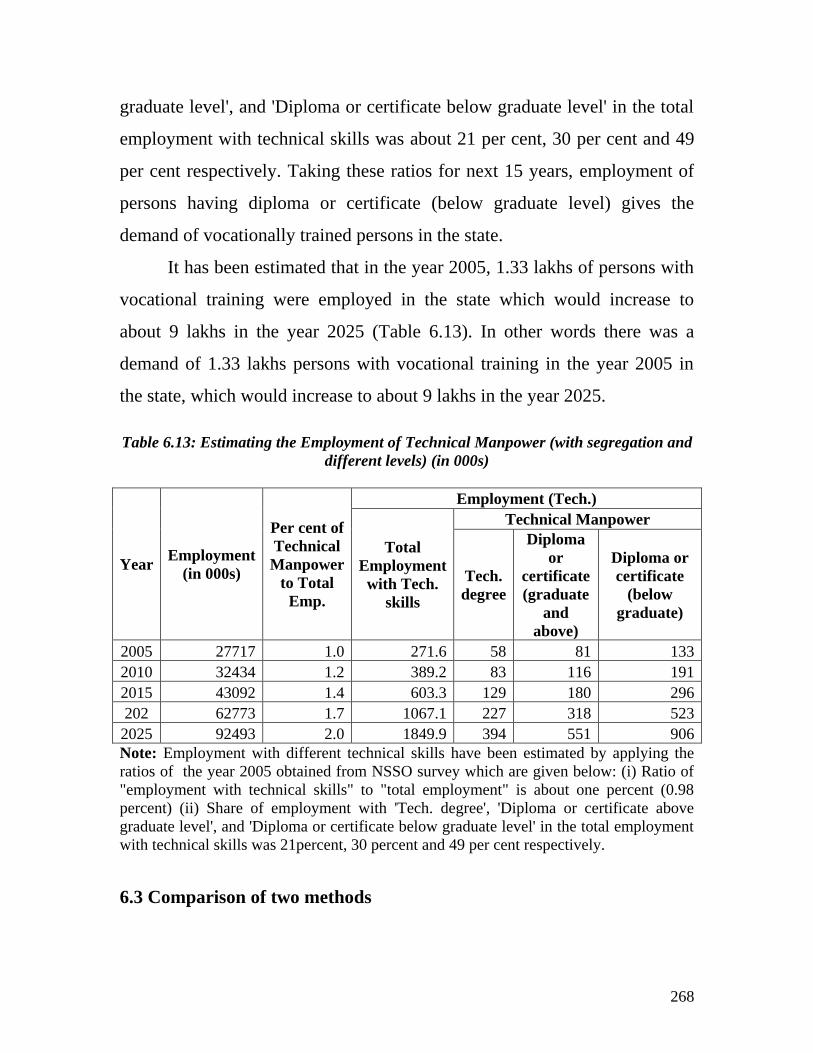
268
graduate level', and 'Diploma or certificate below graduate level' in the total
employment with technical skills was about 21 per cent, 30 per cent and 49
per cent respectively. Taking these ratios for next 15 years, employment of
persons having diploma or certificate (below graduate level) gives the
demand of vocationally trained persons in the state.
It has been estimated that in the year 2005, 1.33 lakhs of persons with
vocational training were employed in the state which would increase to
about 9 lakhs in the year 2025 (Table 6.13). In other words there was a
demand of 1.33 lakhs persons with vocational training in the year 2005 in
the state, which would increase to about 9 lakhs in the year 2025.
Table 6.13: Estimating the Employment of Technical Manpower (with segregation and
different levels) (in 000s)
Year Employment
(in 000s)
Per cent of
Technical
Manpower
to Total
Emp.
Employment (Tech.)
Total
Employment
with Tech.
skills
Technical Manpower
Tech.
degree
Diploma
or
certificate
(graduate
and
above)
Diploma or
certificate
(below
graduate)
2005 27717 1.0 271.6 58 81 133
2010 32434 1.2 389.2 83 116 191
2015 43092 1.4 603.3 129 180 296
202 62773 1.7 1067.1 227 318 523
2025 92493 2.0 1849.9 394 551 906
Note: Employment with different technical skills have been estimated by applying the
ratios of the year 2005 obtained from NSSO survey which are given below: (i) Ratio of
"employment with technical skills" to "total employment" is about one percent (0.98
percent) (ii) Share of employment with 'Tech. degree', 'Diploma or certificate above
graduate level', and 'Diploma or certificate below graduate level' in the total employment
with technical skills was 21percent, 30 percent and 49 per cent respectively.
6.3 Comparison of two methods
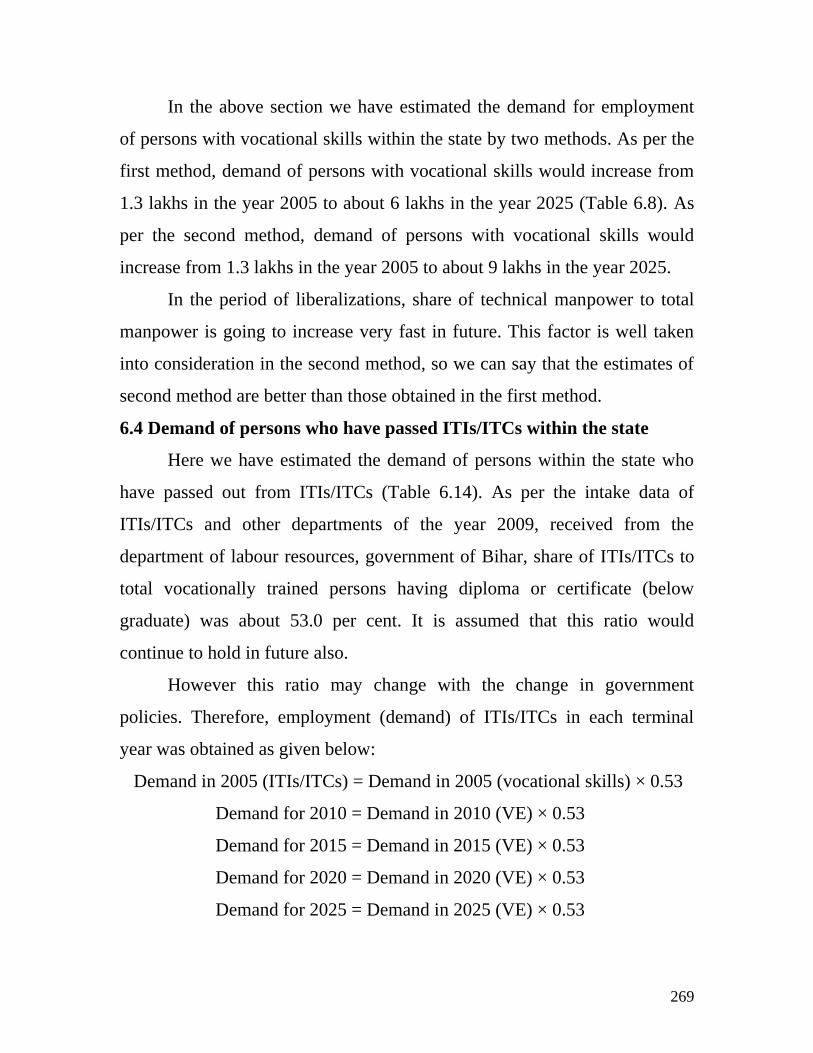
269
In the above section we have estimated the demand for employment
of persons with vocational skills within the state by two methods. As per the
first method, demand of persons with vocational skills would increase from
1.3 lakhs in the year 2005 to about 6 lakhs in the year 2025 (Table 6.8). As
per the second method, demand of persons with vocational skills would
increase from 1.3 lakhs in the year 2005 to about 9 lakhs in the year 2025.
In the period of liberalizations, share of technical manpower to total
manpower is going to increase very fast in future. This factor is well taken
into consideration in the second method, so we can say that the estimates of
second method are better than those obtained in the first method.
6.4 Demand of persons who have passed ITIs/ITCs within the state
Here we have estimated the demand of persons within the state who
have passed out from ITIs/ITCs (Table 6.14). As per the intake data of
ITIs/ITCs and other departments of the year 2009, received from the
department of labour resources, government of Bihar, share of ITIs/ITCs to
total vocationally trained persons having diploma or certificate (below
graduate) was about 53.0 per cent. It is assumed that this ratio would
continue to hold in future also.
However this ratio may change with the change in government
policies. Therefore, employment (demand) of ITIs/ITCs in each terminal
year was obtained as given below:
Demand in 2005 (ITIs/ITCs) = Demand in 2005 (vocational skills) × 0.53
Demand for 2010 = Demand in 2010 (VE) × 0.53
Demand for 2015 = Demand in 2015 (VE) × 0.53
Demand for 2020 = Demand in 2020 (VE) × 0.53
Demand for 2025 = Demand in 2025 (VE) × 0.53
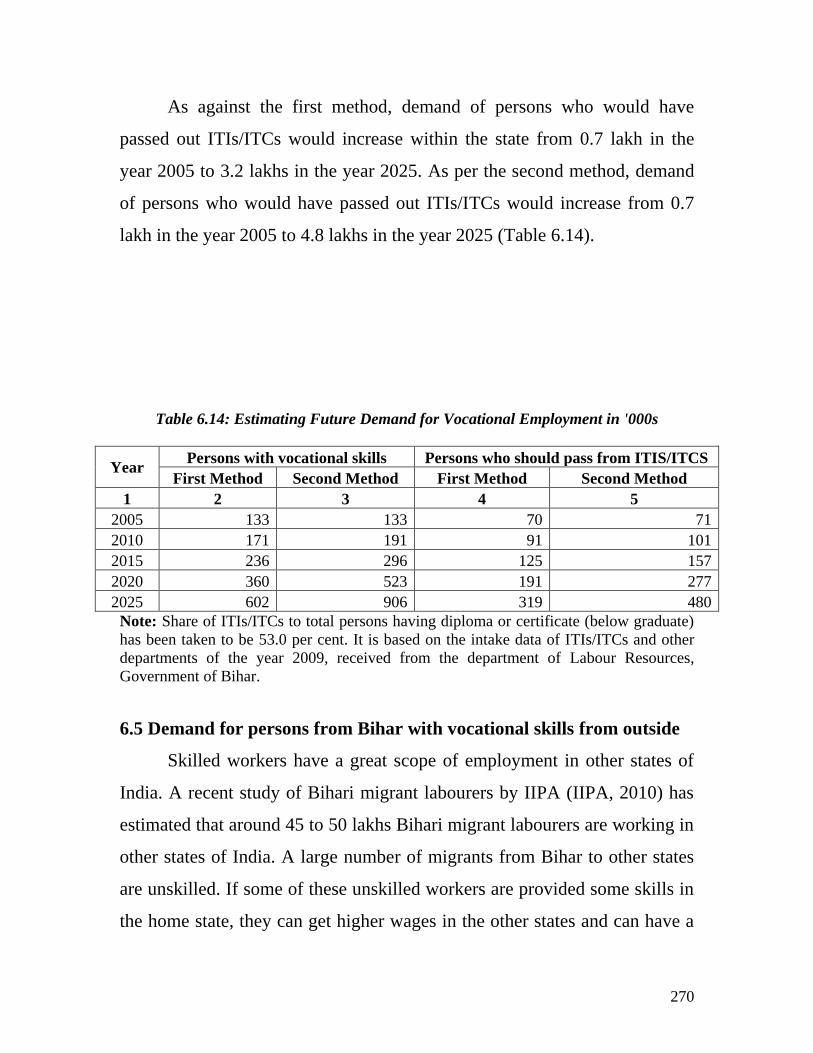
270
As against the first method, demand of persons who would have
passed out ITIs/ITCs would increase within the state from 0.7 lakh in the
year 2005 to 3.2 lakhs in the year 2025. As per the second method, demand
of persons who would have passed out ITIs/ITCs would increase from 0.7
lakh in the year 2005 to 4.8 lakhs in the year 2025 (Table 6.14).
Table 6.14: Estimating Future Demand for Vocational Employment in '000s
Year Persons with vocational skills Persons who should pass from ITIS/ITCS
First Method Second Method First Method Second Method
1 2 3 4 5
2005 133 133 70 71
2010 171 191 91 101
2015 236 296 125 157
2020 360 523 191 277
2025 602 906 319 480
Note: Share of ITIs/ITCs to total persons having diploma or certificate (below graduate)
has been taken to be 53.0 per cent. It is based on the intake data of ITIs/ITCs and other
departments of the year 2009, received from the department of Labour Resources,
Government of Bihar.
6.5 Demand for persons from Bihar with vocational skills from outside
Skilled workers have a great scope of employment in other states of
India. A recent study of Bihari migrant labourers by IIPA (IIPA, 2010) has
estimated that around 45 to 50 lakhs Bihari migrant labourers are working in
other states of India. A large number of migrants from Bihar to other states
are unskilled. If some of these unskilled workers are provided some skills in
the home state, they can get higher wages in the other states and can have a
271
better bargaining power. This would increase the demand of skilled labour
with vocational skills. Their remittances to home state would hopefully
trigger economic activity backyard or at least improve living conditions of
family members left behind. Multiplier would rejuvenate economic activity
in the state.
Skilled workers have a great scope of employment in other countries
also, particularly in the countries where dependency ratio is very high. In the
year 2001, about 43 percent of total population of the state was in the age-
group of below 15 years (Census of India, 2001). A high proportion of this
population has entered in the working population by now. Another
advantage is that with increasing participation of female work force in the
state, dependency ratio is going to decrease significantly in future. It would
increase per capita income of the state which may have a direct bearing on
the individuals demand for vocational training. Once they are trained, they
can have a great scope of employment in other countries and this way
Bihar‘s share in total outmigration from India to other countries can
increase.
There are two major sources which give estimates of the incidence of
migrations from Bihar. The first is the Population Census conducted every
tenth
years and the other is the periodic survey conducted by NSSO. Data for
estimating the extent of migration from Bihar to other states, along with the
background (i.e. age, qualification and sex etc.) of migrants and reasons of
migrations would be obtained from these two sources. Besides these two
official sources, there are a number of studies on ―Migration from Bihar
state‖. Main source of data on International Migration from India to different
countries is the Ministry of External Affairs, Government of India.
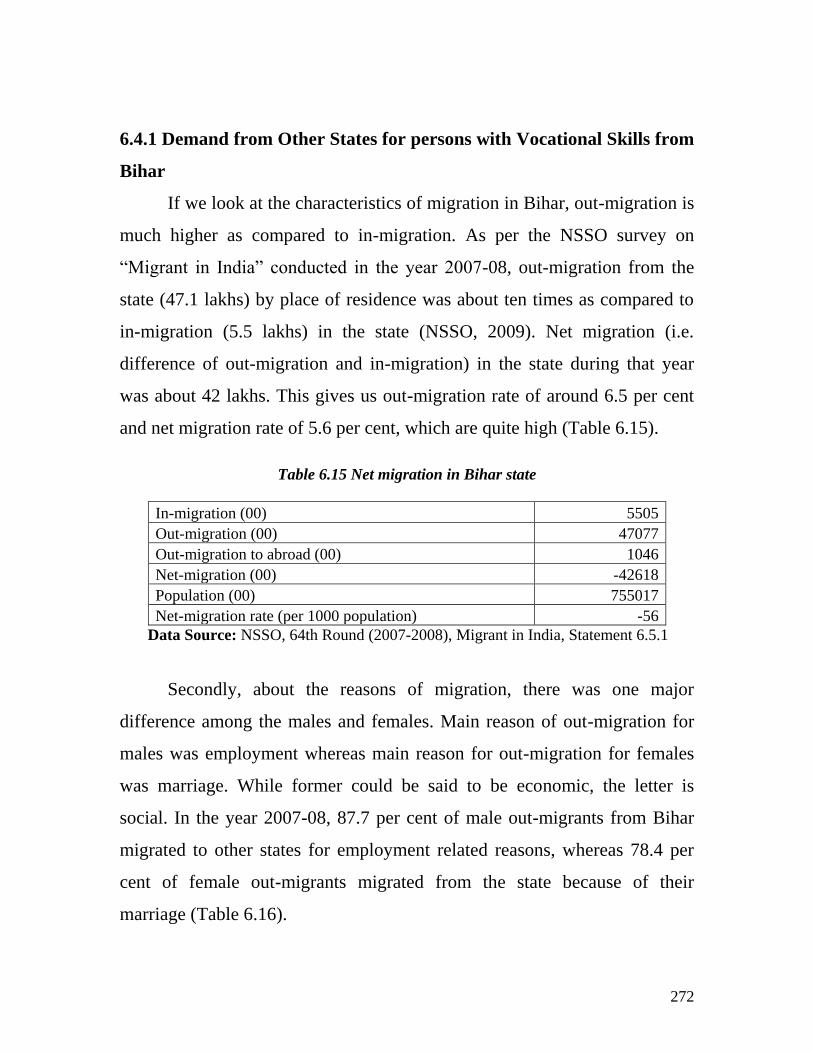
272
6.4.1 Demand from Other States for persons with Vocational Skills from
Bihar
If we look at the characteristics of migration in Bihar, out-migration is
much higher as compared to in-migration. As per the NSSO survey on
―Migrant in India‖ conducted in the year 2007-08, out-migration from the
state (47.1 lakhs) by place of residence was about ten times as compared to
in-migration (5.5 lakhs) in the state (NSSO, 2009). Net migration (i.e.
difference of out-migration and in-migration) in the state during that year
was about 42 lakhs. This gives us out-migration rate of around 6.5 per cent
and net migration rate of 5.6 per cent, which are quite high (Table 6.15).
Table 6.15 Net migration in Bihar state
In-migration (00) 5505
Out-migration (00) 47077
Out-migration to abroad (00) 1046
Net-migration (00) -42618
Population (00) 755017
Net-migration rate (per 1000 population) -56
Data Source: NSSO, 64th Round (2007-2008), Migrant in India, Statement 6.5.1
Secondly, about the reasons of migration, there was one major
difference among the males and females. Main reason of out-migration for
males was employment whereas main reason for out-migration for females
was marriage. While former could be said to be economic, the letter is
social. In the year 2007-08, 87.7 per cent of male out-migrants from Bihar
migrated to other states for employment related reasons, whereas 78.4 per
cent of female out-migrants migrated from the state because of their
marriage (Table 6.16).
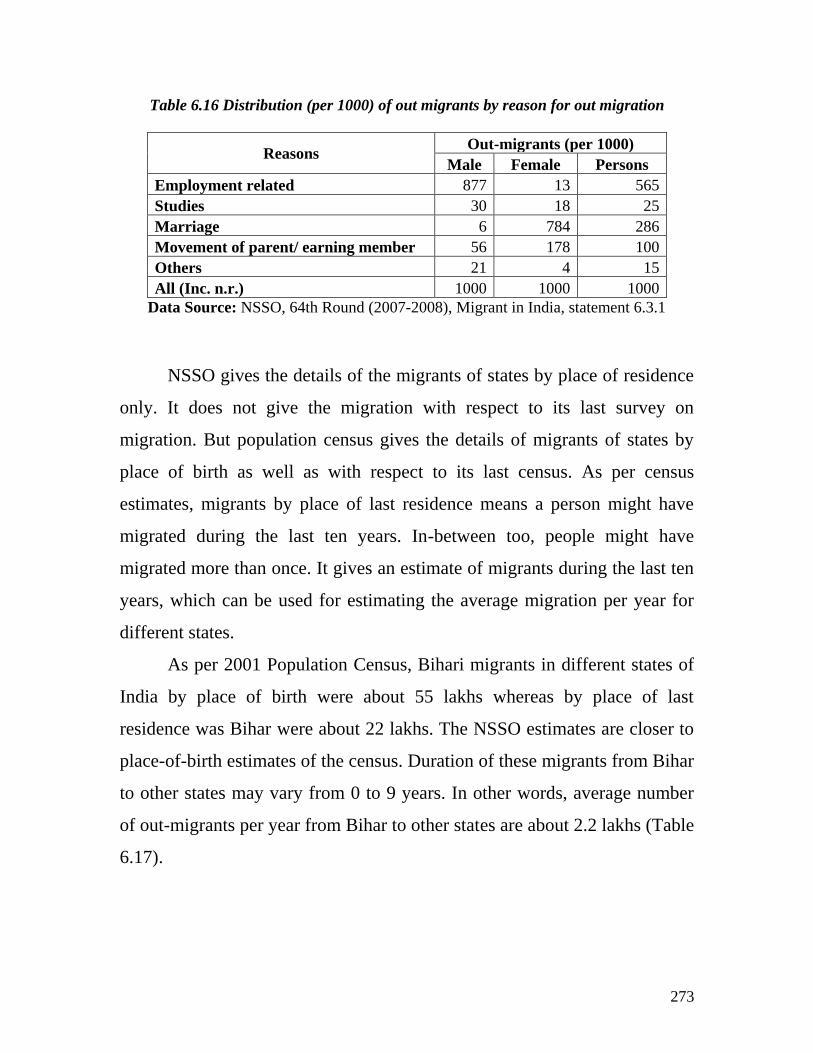
273
Table 6.16 Distribution (per 1000) of out migrants by reason for out migration
Reasons Out-migrants (per 1000)
Male Female Persons
Employment related 877 13 565
Studies 30 18 25
Marriage 6 784 286
Movement of parent/ earning member 56 178 100
Others 21 4 15
All (Inc. n.r.) 1000 1000 1000
Data Source: NSSO, 64th Round (2007-2008), Migrant in India, statement 6.3.1
NSSO gives the details of the migrants of states by place of residence
only. It does not give the migration with respect to its last survey on
migration. But population census gives the details of migrants of states by
place of birth as well as with respect to its last census. As per census
estimates, migrants by place of last residence means a person might have
migrated during the last ten years. In-between too, people might have
migrated more than once. It gives an estimate of migrants during the last ten
years, which can be used for estimating the average migration per year for
different states.
As per 2001 Population Census, Bihari migrants in different states of
India by place of birth were about 55 lakhs whereas by place of last
residence was Bihar were about 22 lakhs. The NSSO estimates are closer to
place-of-birth estimates of the census. Duration of these migrants from Bihar
to other states may vary from 0 to 9 years. In other words, average number
of out-migrants per year from Bihar to other states are about 2.2 lakhs (Table
6.17).
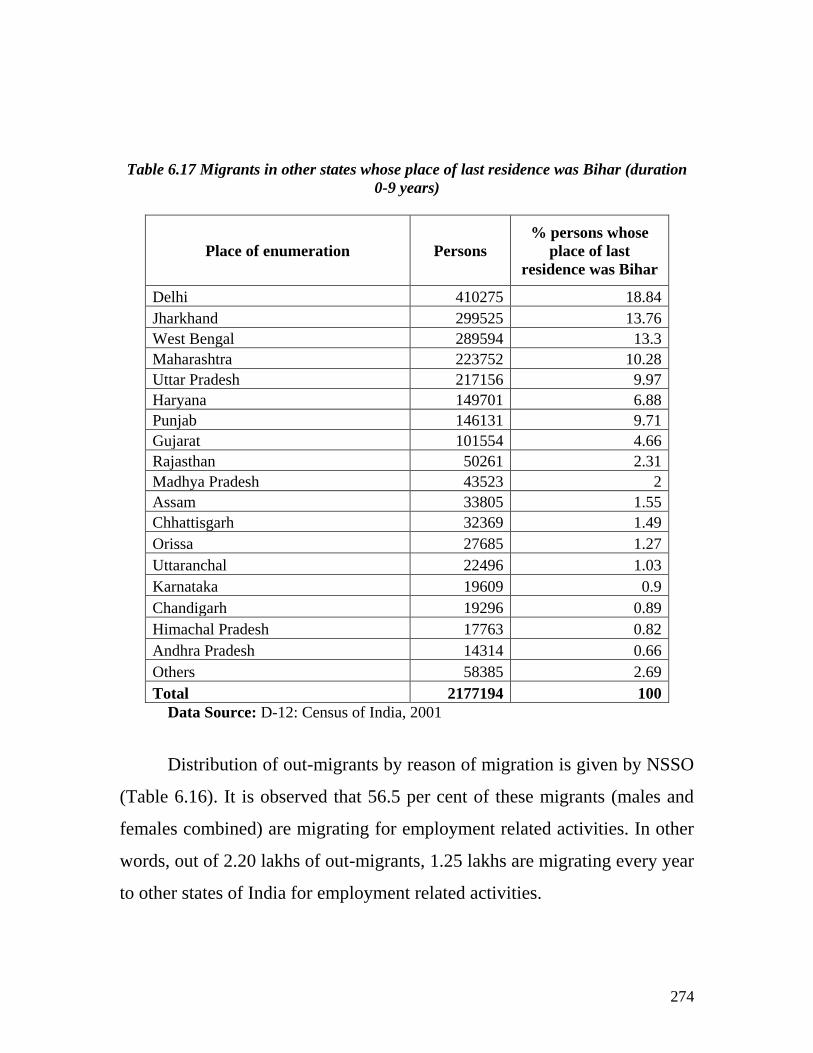
274
Table 6.17 Migrants in other states whose place of last residence was Bihar (duration
0-9 years)
Place of enumeration Persons
% persons whose
place of last
residence was Bihar
Delhi 410275 18.84
Jharkhand 299525 13.76
West Bengal 289594 13.3
Maharashtra 223752 10.28
Uttar Pradesh 217156 9.97
Haryana 149701 6.88
Punjab 146131 9.71
Gujarat 101554 4.66
Rajasthan 50261 2.31
Madhya Pradesh 43523 2
Assam 33805 1.55
Chhattisgarh 32369 1.49
Orissa 27685 1.27
Uttaranchal 22496 1.03
Karnataka 19609 0.9
Chandigarh 19296 0.89
Himachal Pradesh 17763 0.82
Andhra Pradesh 14314 0.66
Others 58385 2.69
Total 2177194 100
Data Source: D-12: Census of India, 2001
Distribution of out-migrants by reason of migration is given by NSSO
(Table 6.16). It is observed that 56.5 per cent of these migrants (males and
females combined) are migrating for employment related activities. In other
words, out of 2.20 lakhs of out-migrants, 1.25 lakhs are migrating every year
to other states of India for employment related activities.
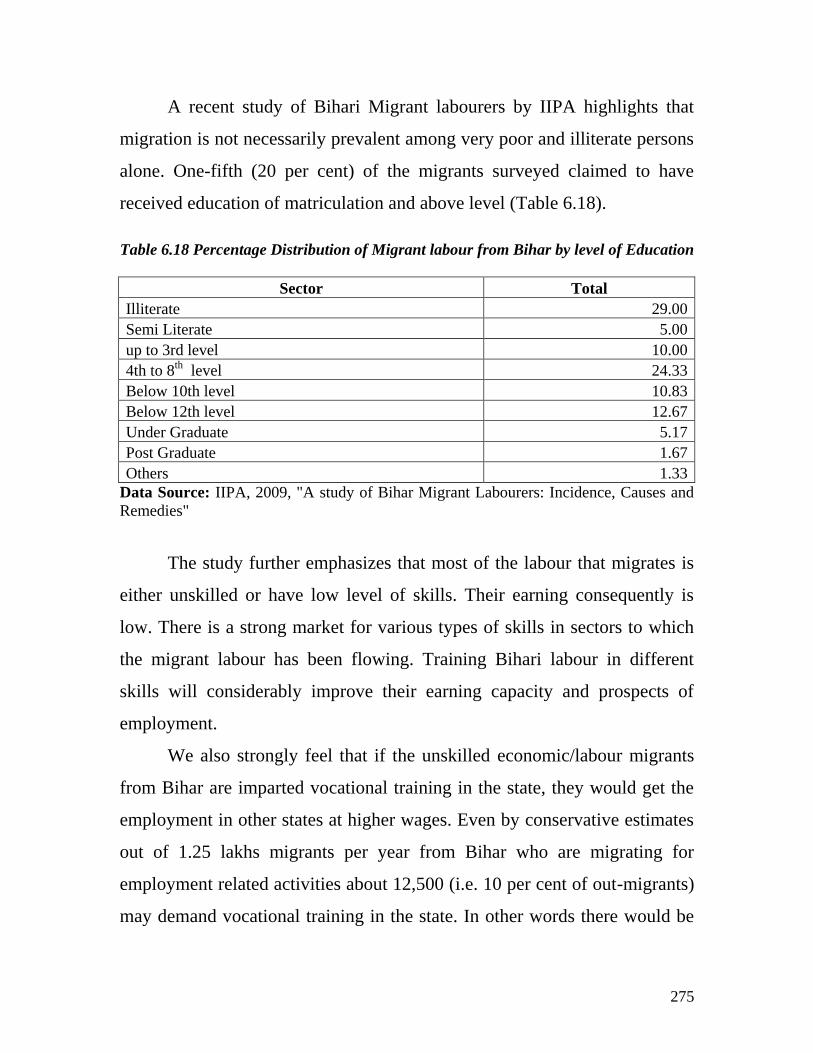
275
A recent study of Bihari Migrant labourers by IIPA highlights that
migration is not necessarily prevalent among very poor and illiterate persons
alone. One-fifth (20 per cent) of the migrants surveyed claimed to have
received education of matriculation and above level (Table 6.18).
Table 6.18 Percentage Distribution of Migrant labour from Bihar by level of Education
Sector Total
Illiterate 29.00
Semi Literate 5.00
up to 3rd level 10.00
4th to 8th
level 24.33
Below 10th level 10.83
Below 12th level 12.67
Under Graduate 5.17
Post Graduate 1.67
Others 1.33
Data Source: IIPA, 2009, "A study of Bihar Migrant Labourers: Incidence, Causes and
Remedies"
The study further emphasizes that most of the labour that migrates is
either unskilled or have low level of skills. Their earning consequently is
low. There is a strong market for various types of skills in sectors to which
the migrant labour has been flowing. Training Bihari labour in different
skills will considerably improve their earning capacity and prospects of
employment.
We also strongly feel that if the unskilled economic/labour migrants
from Bihar are imparted vocational training in the state, they would get the
employment in other states at higher wages. Even by conservative estimates
out of 1.25 lakhs migrants per year from Bihar who are migrating for
employment related activities about 12,500 (i.e. 10 per cent of out-migrants)
may demand vocational training in the state. In other words there would be
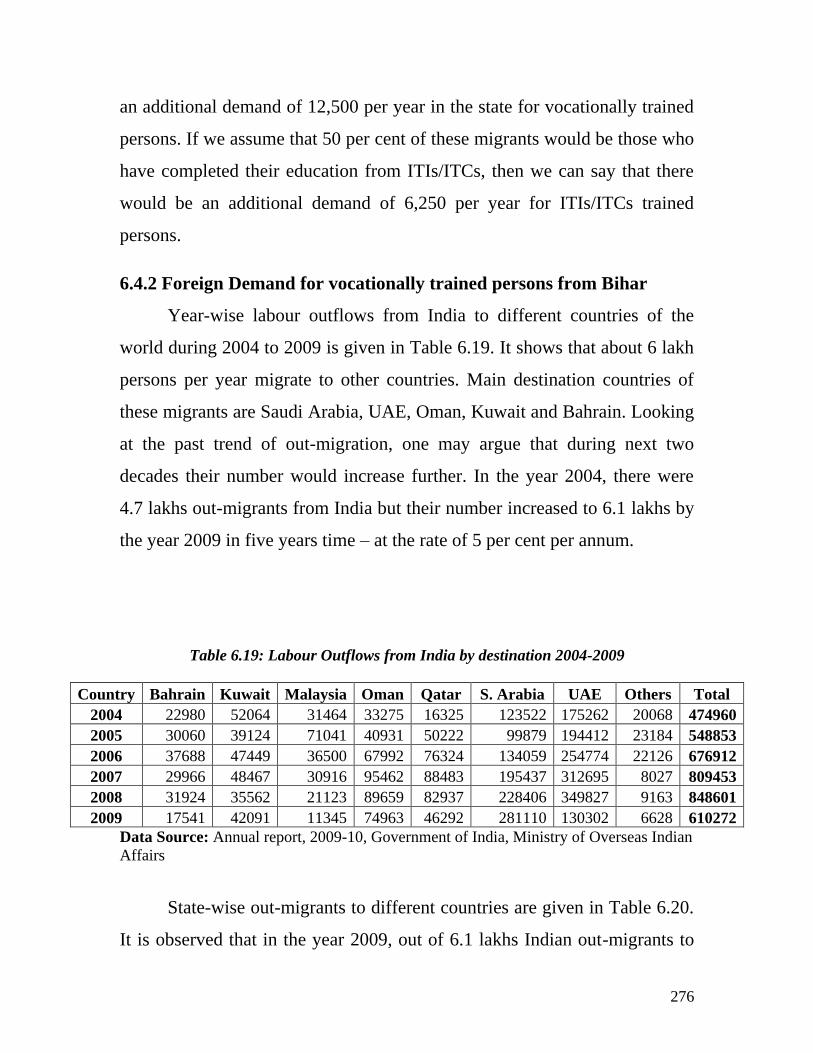
276
an additional demand of 12,500 per year in the state for vocationally trained
persons. If we assume that 50 per cent of these migrants would be those who
have completed their education from ITIs/ITCs, then we can say that there
would be an additional demand of 6,250 per year for ITIs/ITCs trained
persons.
6.4.2 Foreign Demand for vocationally trained persons from Bihar
Year-wise labour outflows from India to different countries of the
world during 2004 to 2009 is given in Table 6.19. It shows that about 6 lakh
persons per year migrate to other countries. Main destination countries of
these migrants are Saudi Arabia, UAE, Oman, Kuwait and Bahrain. Looking
at the past trend of out-migration, one may argue that during next two
decades their number would increase further. In the year 2004, there were
4.7 lakhs out-migrants from India but their number increased to 6.1 lakhs by
the year 2009 in five years time – at the rate of 5 per cent per annum.
Table 6.19: Labour Outflows from India by destination 2004-2009
Country Bahrain Kuwait Malaysia Oman Qatar S. Arabia UAE Others Total
2004 22980 52064 31464 33275 16325 123522 175262 20068 474960
2005 30060 39124 71041 40931 50222 99879 194412 23184 548853
2006 37688 47449 36500 67992 76324 134059 254774 22126 676912
2007 29966 48467 30916 95462 88483 195437 312695 8027 809453
2008 31924 35562 21123 89659 82937 228406 349827 9163 848601
2009 17541 42091 11345 74963 46292 281110 130302 6628 610272
Data Source: Annual report, 2009-10, Government of India, Ministry of Overseas Indian
Affairs
State-wise out-migrants to different countries are given in Table 6.20.
It is observed that in the year 2009, out of 6.1 lakhs Indian out-migrants to
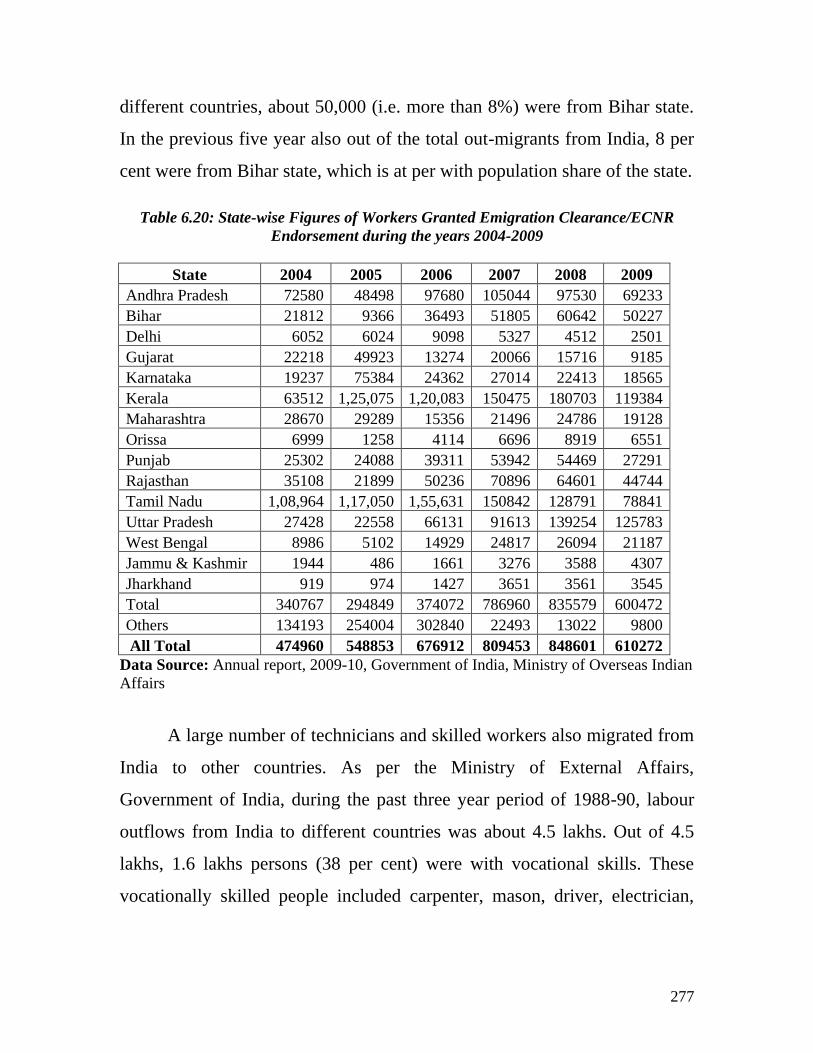
277
different countries, about 50,000 (i.e. more than 8%) were from Bihar state.
In the previous five year also out of the total out-migrants from India, 8 per
cent were from Bihar state, which is at per with population share of the state.
Table 6.20: State-wise Figures of Workers Granted Emigration Clearance/ECNR
Endorsement during the years 2004-2009
State 2004 2005 2006 2007 2008 2009
Andhra Pradesh 72580 48498 97680 105044 97530 69233
Bihar 21812 9366 36493 51805 60642 50227
Delhi 6052 6024 9098 5327 4512 2501
Gujarat 22218 49923 13274 20066 15716 9185
Karnataka 19237 75384 24362 27014 22413 18565
Kerala 63512 1,25,075 1,20,083 150475 180703 119384
Maharashtra 28670 29289 15356 21496 24786 19128
Orissa 6999 1258 4114 6696 8919 6551
Punjab 25302 24088 39311 53942 54469 27291
Rajasthan 35108 21899 50236 70896 64601 44744
Tamil Nadu 1,08,964 1,17,050 1,55,631 150842 128791 78841
Uttar Pradesh 27428 22558 66131 91613 139254 125783
West Bengal 8986 5102 14929 24817 26094 21187
Jammu & Kashmir 1944 486 1661 3276 3588 4307
Jharkhand 919 974 1427 3651 3561 3545
Total 340767 294849 374072 786960 835579 600472
Others 134193 254004 302840 22493 13022 9800
All Total 474960 548853 676912 809453 848601 610272
Data Source: Annual report, 2009-10, Government of India, Ministry of Overseas Indian
Affairs
A large number of technicians and skilled workers also migrated from
India to other countries. As per the Ministry of External Affairs,
Government of India, during the past three year period of 1988-90, labour
outflows from India to different countries was about 4.5 lakhs. Out of 4.5
lakhs, 1.6 lakhs persons (38 per cent) were with vocational skills. These
vocationally skilled people included carpenter, mason, driver, electrician,
278
mechanic (A/c), tailor, technician, welder, fixer/fabricator, plumber, painter
and operator.
At present, Ministry of Overseas Indian Affairs is the nodal ministry
for administration of Emigration Act, 1983. As per the latest Annual Report
(2009-10) of the Ministry, the demand for unskilled workers is declining in
the overseas employment market and the future belongs to the skilled
workers, preferably with multiple skills. It is, therefore important for India to
upgrade the skills of its young work force to meet the challenges of future
needs in the overseas employment market which is having flux of emigrant
labourers from neighboring countries.
Keeping the above facts in view, one may argue that, out of 6 lakh
persons who were migrating per year from India to other countries, about 2
lakh persons (33 per cent of total) were having vocational training. If we
assume the existing trend to continue, there would be a demand of more than
2 lakh persons per year of vocationally trained persons from India to other
countries.
In the total out-migration from India, Bihar state‘s share of migration
is about eight per cent. One may argue that, share of skilled workers who
would migrate from Bihar would be less as compared to All India. So even if
we go by conservative estimates, out of 2 lakh persons with vocational skills
who would have demand in other countries, 8,000 (i.e. 4 per cent of 2 lakhs)
would be from Bihar. Further, out of 8000 skilled persons of the state 4000
persons (i.e. 4000) may be from ITI/ITCs and remaining 4000 persons (i.e.
50 per cent) may be trained by Institutes/Centres run by other departments.
6.6 Projected Estimates of shortages and surpluses of ITI/ITC trained
279
We can project the estimates of shortages and surpluses of ―ITI/ITC
trained‖ (under the Labour Department, Government of Bihar) as well as of
the persons who would pass these skills from the ―Other Departments‖ of
the state. But because of the non-availability of data of pass out students
from the ―Other Departments‖ we could do this exercise for ―ITI/ITC‖ only.
6.6.1 Additional Demand on Five Yearly Basis
Estimates of shortages and surpluses of ITI/ITC passed are obtained
by comparing their demand and supply estimates. Demand estimates
obtained in Section 6.5 are of total demand (i.e. stock sense) but we don‘t
have the comparable estimates of stock of persons who are alive and have
passed out from ITIs/ITCs and are available for employment (i.e. supply in
the stock sense). But we can have the estimates of annual out-turn of
ITIs/ITCs in Bihar. This would give us an estimate of requirement of
additional supply of ITIs/ITCs in the state during a particular period.
Keeping this fact in view, additional demand of ITIs/ITCs during the
periods 2010-15, 2015-20 and 2020-25 (on five yearly basis) was obtained
(Table 6.21). Additional demand during the period 2010-15 was obtained by
taking the difference of demand during the years 2015 and 2010. Similarly,
estimates of additional demand for other two periods (viz. 2015-20 and
2020-25) were obtained. Secondly, additional demand has been obtained
separately for ‗within the state‘, ‗in other states of India‘ and ‗in other
countries of the world‘. Third important point worth mentioning is that total
demand within the state was obtained by two different methods, details of
which have been discussed in Section 6.4. So the total additional demand in
the state also gives two estimates. First estimate relate to first method of
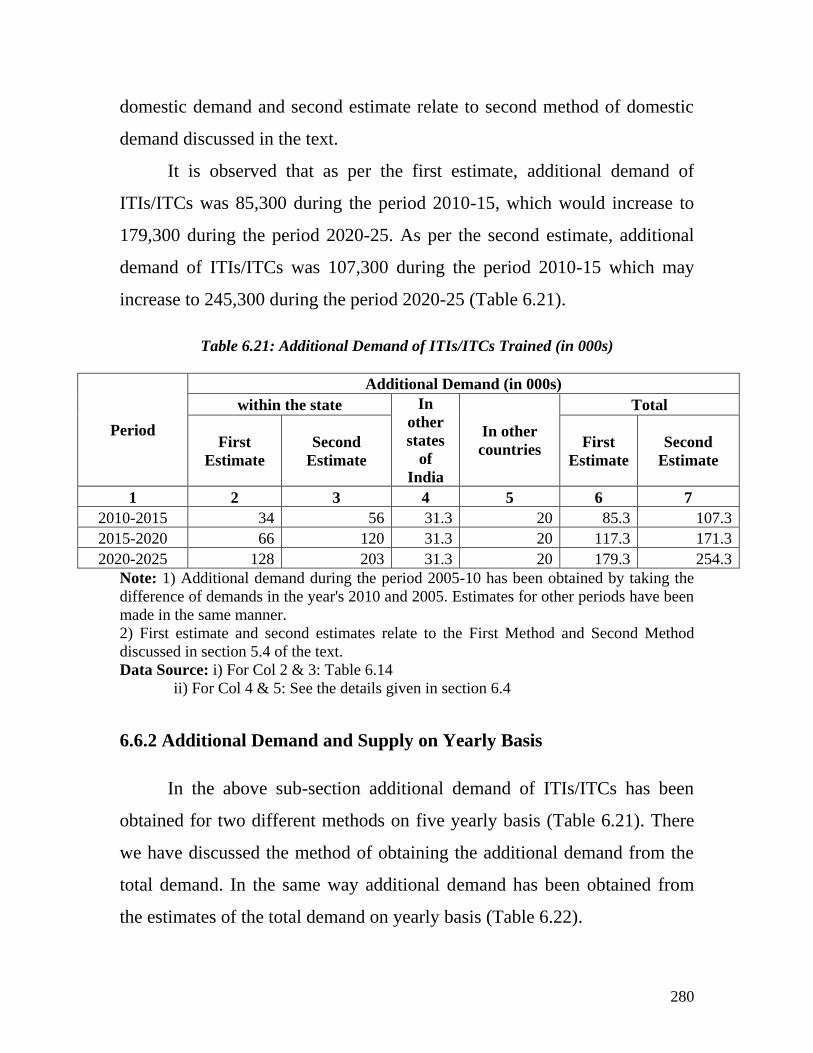
280
domestic demand and second estimate relate to second method of domestic
demand discussed in the text.
It is observed that as per the first estimate, additional demand of
ITIs/ITCs was 85,300 during the period 2010-15, which would increase to
179,300 during the period 2020-25. As per the second estimate, additional
demand of ITIs/ITCs was 107,300 during the period 2010-15 which may
increase to 245,300 during the period 2020-25 (Table 6.21).
Table 6.21: Additional Demand of ITIs/ITCs Trained (in 000s)
Period
Additional Demand (in 000s)
within the state In
other
states
of
India
In other
countries
Total
First
Estimate
Second
Estimate
First
Estimate
Second
Estimate
1 2 3 4 5 6 7
2010-2015 34 56 31.3 20 85.3 107.3
2015-2020 66 120 31.3 20 117.3 171.3
2020-2025 128 203 31.3 20 179.3 254.3
Note: 1) Additional demand during the period 2005-10 has been obtained by taking the
difference of demands in the year's 2010 and 2005. Estimates for other periods have been
made in the same manner.
2) First estimate and second estimates relate to the First Method and Second Method
discussed in section 5.4 of the text.
Data Source: i) For Col 2 & 3: Table 6.14
ii) For Col 4 & 5: See the details given in section 6.4
6.6.2 Additional Demand and Supply on Yearly Basis
In the above sub-section additional demand of ITIs/ITCs has been
obtained for two different methods on five yearly basis (Table 6.21). There
we have discussed the method of obtaining the additional demand from the
total demand. In the same way additional demand has been obtained from
the estimates of the total demand on yearly basis (Table 6.22).
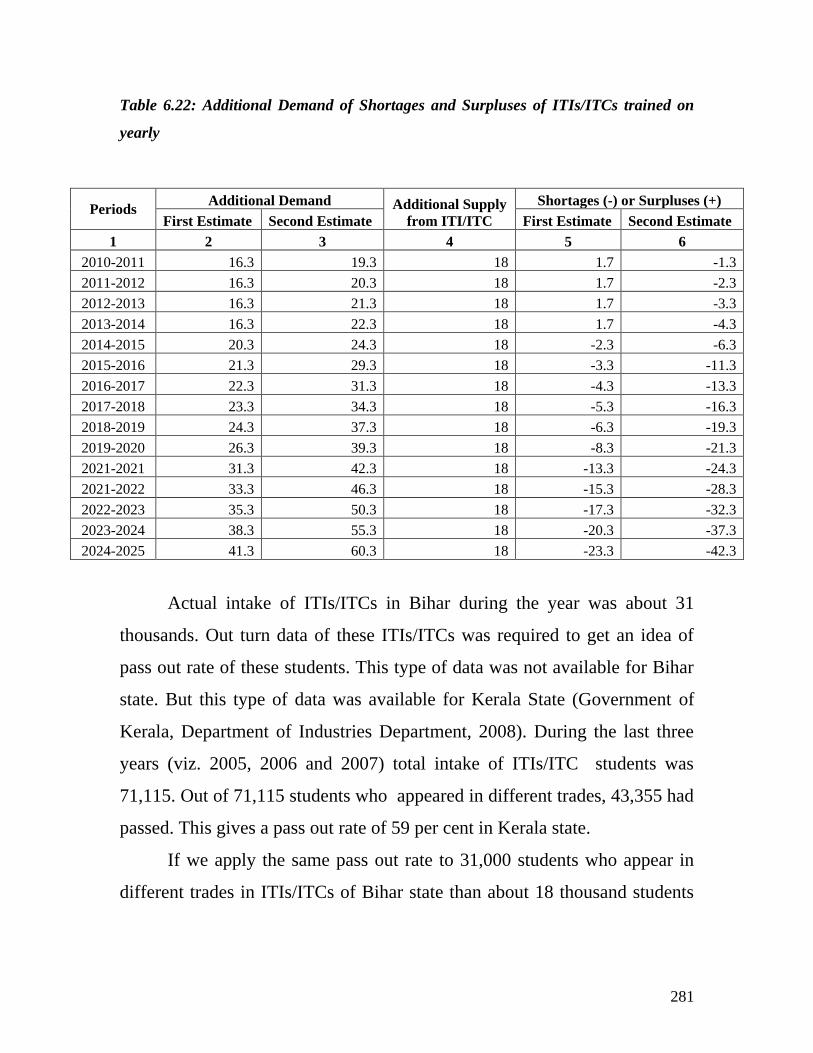
281
Table 6.22: Additional Demand of Shortages and Surpluses of ITIs/ITCs trained on
yearly
Periods Additional Demand Additional Supply
from ITI/ITC
Shortages (-) or Surpluses (+)
First Estimate Second Estimate First Estimate Second Estimate
1 2 3 4 5 6
2010-2011 16.3 19.3 18 1.7 -1.3
2011-2012 16.3 20.3 18 1.7 -2.3
2012-2013 16.3 21.3 18 1.7 -3.3
2013-2014 16.3 22.3 18 1.7 -4.3
2014-2015 20.3 24.3 18 -2.3 -6.3
2015-2016 21.3 29.3 18 -3.3 -11.3
2016-2017 22.3 31.3 18 -4.3 -13.3
2017-2018 23.3 34.3 18 -5.3 -16.3
2018-2019 24.3 37.3 18 -6.3 -19.3
2019-2020 26.3 39.3 18 -8.3 -21.3
2021-2021 31.3 42.3 18 -13.3 -24.3
2021-2022 33.3 46.3 18 -15.3 -28.3
2022-2023 35.3 50.3 18 -17.3 -32.3
2023-2024 38.3 55.3 18 -20.3 -37.3
2024-2025 41.3 60.3 18 -23.3 -42.3
Actual intake of ITIs/ITCs in Bihar during the year was about 31
thousands. Out turn data of these ITIs/ITCs was required to get an idea of
pass out rate of these students. This type of data was not available for Bihar
state. But this type of data was available for Kerala State (Government of
Kerala, Department of Industries Department, 2008). During the last three
years (viz. 2005, 2006 and 2007) total intake of ITIs/ITC students was
71,115. Out of 71,115 students who appeared in different trades, 43,355 had
passed. This gives a pass out rate of 59 per cent in Kerala state.
If we apply the same pass out rate to 31,000 students who appear in
different trades in ITIs/ITCs of Bihar state than about 18 thousand students
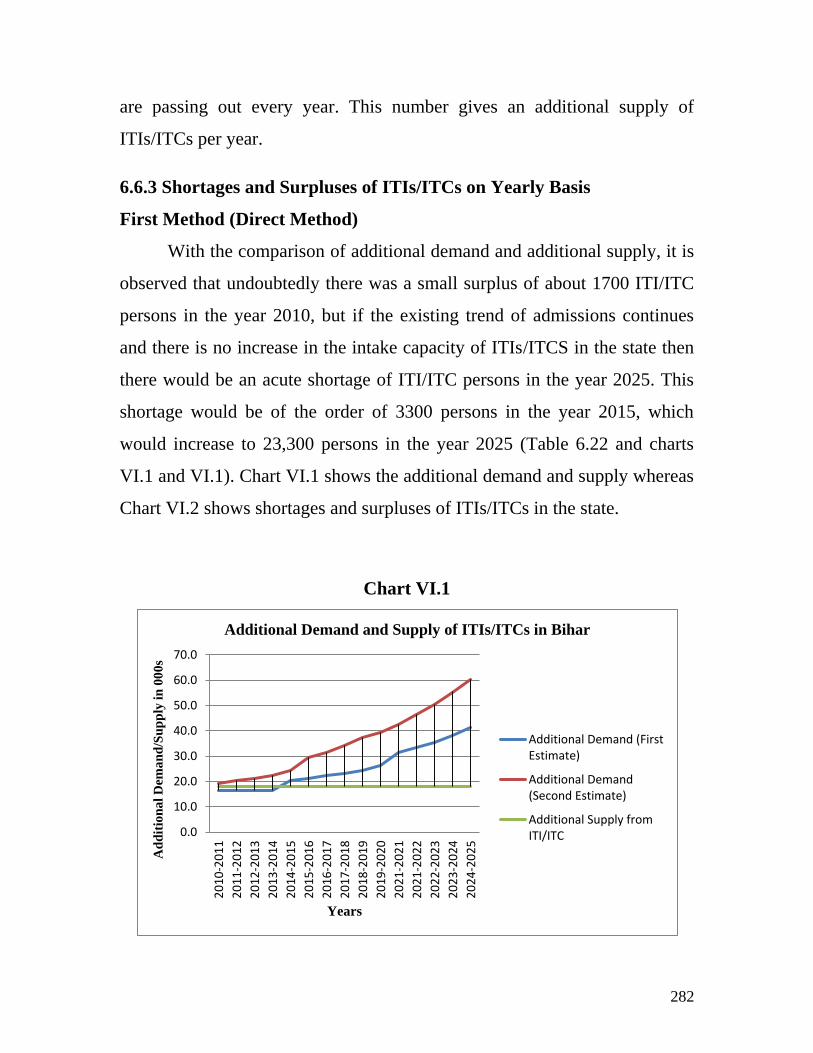
282
are passing out every year. This number gives an additional supply of
ITIs/ITCs per year.
6.6.3 Shortages and Surpluses of ITIs/ITCs on Yearly Basis
First Method (Direct Method)
With the comparison of additional demand and additional supply, it is
observed that undoubtedly there was a small surplus of about 1700 ITI/ITC
persons in the year 2010, but if the existing trend of admissions continues
and there is no increase in the intake capacity of ITIs/ITCS in the state then
there would be an acute shortage of ITI/ITC persons in the year 2025. This
shortage would be of the order of 3300 persons in the year 2015, which
would increase to 23,300 persons in the year 2025 (Table 6.22 and charts
VI.1 and VI.1). Chart VI.1 shows the additional demand and supply whereas
Chart VI.2 shows shortages and surpluses of ITIs/ITCs in the state.
Chart VI.1
0.0
10.0
20.0
30.0
40.0
50.0
60.0
70.0
20
10
-20
11
20
11
-20
12
20
12
-20
13
20
13
-20
14
20
14
-20
15
20
15
-20
16
20
16
-20
17
20
17
-20
18
20
18
-20
19
20
19
-20
20
20
21
-20
21
20
21
-20
22
20
22
-20
23
20
23
-20
24
20
24
-20
25
Ad
dit
ion
al
Dem
an
d/S
up
ply
in
00
0s
Years
Additional Demand and Supply of ITIs/ITCs in Bihar
Additional Demand (FirstEstimate)
Additional Demand(Second Estimate)
Additional Supply fromITI/ITC
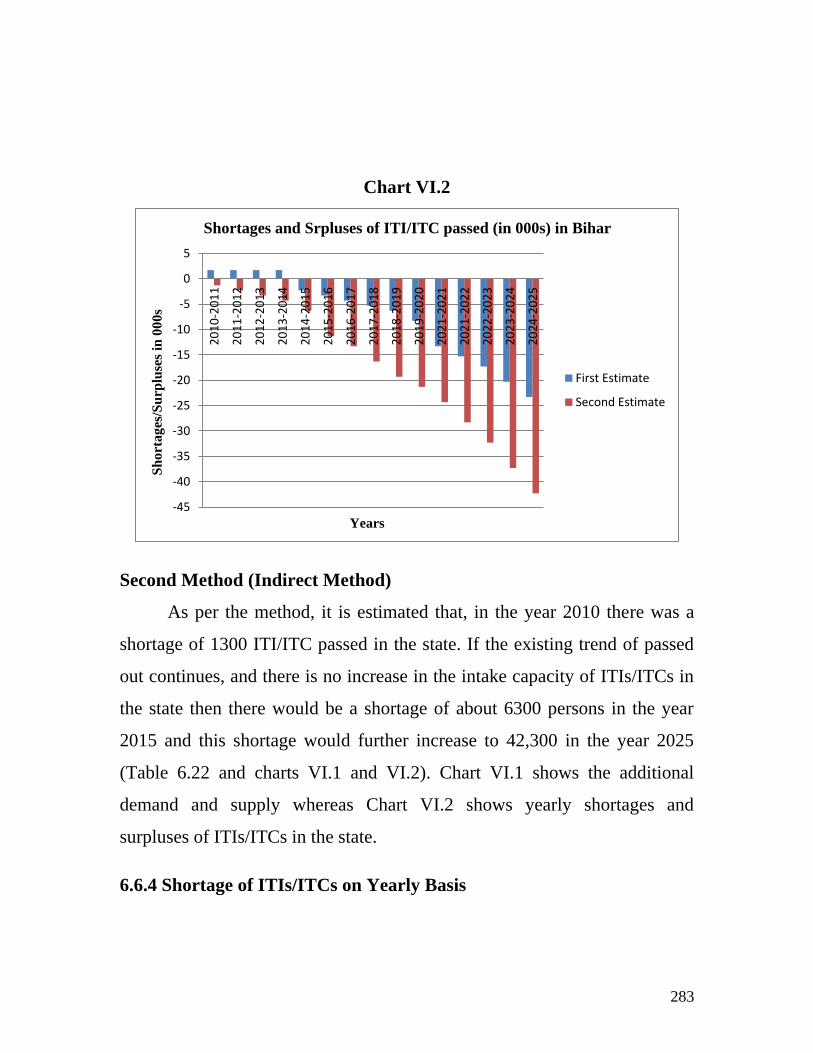
283
Chart VI.2
Second Method (Indirect Method)
As per the method, it is estimated that, in the year 2010 there was a
shortage of 1300 ITI/ITC passed in the state. If the existing trend of passed
out continues, and there is no increase in the intake capacity of ITIs/ITCs in
the state then there would be a shortage of about 6300 persons in the year
2015 and this shortage would further increase to 42,300 in the year 2025
(Table 6.22 and charts VI.1 and VI.2). Chart VI.1 shows the additional
demand and supply whereas Chart VI.2 shows yearly shortages and
surpluses of ITIs/ITCs in the state.
6.6.4 Shortage of ITIs/ITCs on Yearly Basis
-45
-40
-35
-30
-25
-20
-15
-10
-5
0
5
20
10
-20
11
20
11
-20
12
20
12
-20
13
20
13
-20
14
20
14
-20
15
20
15
-20
16
20
16
-20
17
20
17
-20
18
20
18
-20
19
20
19
-20
20
20
21
-20
21
20
21
-20
22
20
22
-20
23
20
23
-20
24
20
24
-20
25
Sh
orta
ges
/Su
rplu
ses
in 0
00s
Years
Shortages and Srpluses of ITI/ITC passed (in 000s) in Bihar
First Estimate
Second Estimate
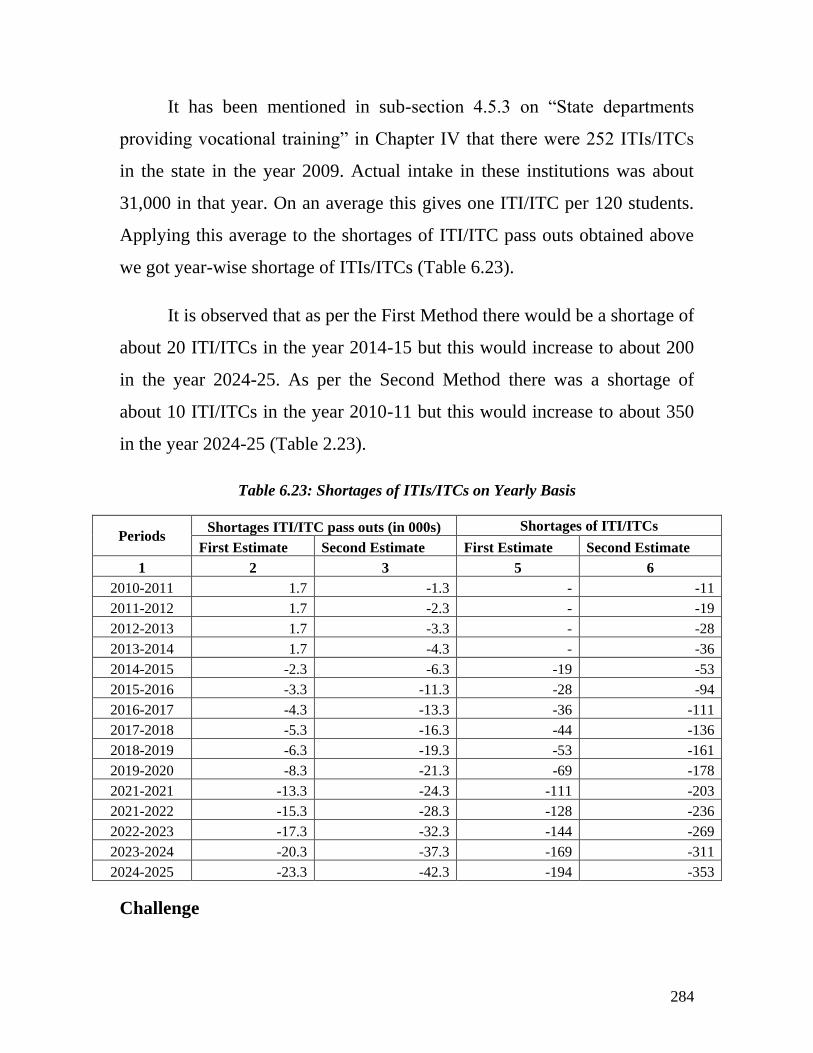
284
It has been mentioned in sub-section 4.5.3 on ―State departments
providing vocational training‖ in Chapter IV that there were 252 ITIs/ITCs
in the state in the year 2009. Actual intake in these institutions was about
31,000 in that year. On an average this gives one ITI/ITC per 120 students.
Applying this average to the shortages of ITI/ITC pass outs obtained above
we got year-wise shortage of ITIs/ITCs (Table 6.23).
It is observed that as per the First Method there would be a shortage of
about 20 ITI/ITCs in the year 2014-15 but this would increase to about 200
in the year 2024-25. As per the Second Method there was a shortage of
about 10 ITI/ITCs in the year 2010-11 but this would increase to about 350
in the year 2024-25 (Table 2.23).
Table 6.23: Shortages of ITIs/ITCs on Yearly Basis
Periods Shortages ITI/ITC pass outs (in 000s) Shortages of ITI/ITCs
First Estimate Second Estimate First Estimate Second Estimate
1 2 3 5 6
2010-2011 1.7 -1.3 - -11
2011-2012 1.7 -2.3 - -19
2012-2013 1.7 -3.3 - -28
2013-2014 1.7 -4.3 - -36
2014-2015 -2.3 -6.3 -19 -53
2015-2016 -3.3 -11.3 -28 -94
2016-2017 -4.3 -13.3 -36 -111
2017-2018 -5.3 -16.3 -44 -136
2018-2019 -6.3 -19.3 -53 -161
2019-2020 -8.3 -21.3 -69 -178
2021-2021 -13.3 -24.3 -111 -203
2021-2022 -15.3 -28.3 -128 -236
2022-2023 -17.3 -32.3 -144 -269
2023-2024 -20.3 -37.3 -169 -311
2024-2025 -23.3 -42.3 -194 -353
Challenge
285
It is possible that economy demand does not turn into individual
demand. An effort may have to be made that people demand vocational
education and training. The moment some of them are not admitted it will be
realized that there is demand. Then over time we need reassessment.
Chapter VIII Identification of Skill Sets in Bihar
8.1 Introduction
Beside this section the chapter has four more sections. Second section
gives the methodology for identification of skill-sets (trades). Third section
is about the sectors having concentration of skill-sets (trades) in future. It has
discussed (a) important trades in demand in India based on a study by FICCI
(b) industry-wise increase in demand of skilled persons in Bihar, and (c)
concentration of some selected trades in different industries in the State.
Fourth section is about the views of experts regarding the future demand of
286
vocational skills in India, in select sectors. Last section is about the existing
trades being taught and new trades which may be introduced in the state.
Chapter VI has detailed the sector-wise demand of skilled persons. In
the present chapter the main focus would be on identification of skill-sets
(trades), in which training should be imparted, through specially
development training modules delivered by the Departments dealing with
skill formation.
Bihar, due to peculiar socio-economic and governance reasons, ranked
at the bottom in literacy ladder in India; low enrolment rates and high
dropouts and absence of adequate number of schools and teachers in Bihar
are all cited in literature. Similar trend also exists in vocational education
and training. The dropout students' entry in labour market without formal
skill development creates mismatch between demand and supply, in the
skilled labour market. In the absence of a proper certificate, skilled and
semi-skilled workers of the state are subject to exploitation and their
mobility is very restricted. A basic problem with skill development system is
that the system is non-responsive to labour market, due to a demand-supply
mismatch on several counts viz. numbers, quantity and skill types.
It is also observed that the inflexibilities in the course/curriculum set-
up, lead to oversupply in some trades and shortages in others. To come out
of these problems it is necessary to create a pool of skilled personnel in
appropriate numbers with adequate skills in the line with the requirements of
the ultimate users such as the industry and service sectors. Such an effort is
necessary to support the employment expansion envisaged as a result of
inclusive growth, including in particular the shift of surplus labour from
agriculture to non-agriculture in the state of Bihar. In order to create a pool
of skilled personnel in the adequate numbers with appropriate skills in the
287
line with the employment requirements across entire economy with
particular emphasis on the high growth and high employment sectors, the
state government must look into the appropriate structures aimed at
enhancing training opportunities of new entrants to the labour force. The
state can capitalize on its demographic dividend only by up-gradation and
introduction of trades which have demand in the economy. Hence, one of the
important tasks is to make concrete plans in a mission mode towards
improving the educational attainment of the labour force.
8.2 Methodology for Identification of Skill-sets (Trades)
Planning Commission, Government of India has identified twenty
high growth sectors for vocational skills where employment can be
generated. These sectors are also relevant for Bihar state, where employment
can be generated in future and pass-outs of vocational institutes can be
absorbed. The list comprising of twenty growth sectors for vocational skills
is given at the end of this chapter in Annexure VIII.I.
Chapter IV of this report has discussed in detail about the resources of
Bihar state. It gives an idea about the area where employment could be
generated in future. In turn it also gives an idea of the trades specific to
growth sectors, which will be demanded. While doing this exercise we have
discussed the matter with officers of various departments of States and
Centre. Officials of industries and other offices located at Delhi viz. FICCI,
Planning Commission and DGE&T gave an idea about the high growth
sectors where employment could be generated and new trades could be
introduced. Reports, papers and articles published by different organizations
viz. DGE&T, IAMR, Department of Industries, Government of Bihar,
IGNOU were also consulted.
288
It was also important to know about the long duration trades (one year
and more duration) and short duration trades (less than one year duration)
which are taught in ITIs/ITCs and other Institutions/Departments of Bihar.
These trades were distributed among different growth sectors identified by
Planning Commission (in consultation with FICCI) to know about the
growth sectors which are not being covered, so far as training component is
concerned.
We also, consulted the reports of labour departments of two
developed states viz. Maharashtra and Gujarat for identifying the trades
which are being taught in these developed states but these are not being
taught in the state of Bihar though they have employment potential in the
state. List of such trades is given at the end of this chapter in Annexure
VIII.2.
A long list of courses under Modular Employment Scheme (MES)
approved by National Council of Vocational Trust (NCVT) is also available.
As per the latest data as on August, 2010, there are 1164 courses under 64
different sectors. It also gives the minimum educational qualification
required for admission in these courses, duration of the courses (in hours),
and test fee of the course. These details of the courses under MES were also
taken into consideration while identifying the new trades for Bihar. Sector-
wise number of courses, approved by NCVT are given in Annexure VIII.3.
8.3 Sectors having concentration of skill-sets (trades) in Future
8.3.1 All INDIA
As per the FICCI estimates on an average per year till 2022 about 12
million persons are expected to join the workforce every year, and with an
existing skill development capacity of about 3.4 million in the country there
exists a gap of about 8.6 million. It is thus required to enhance the skilling
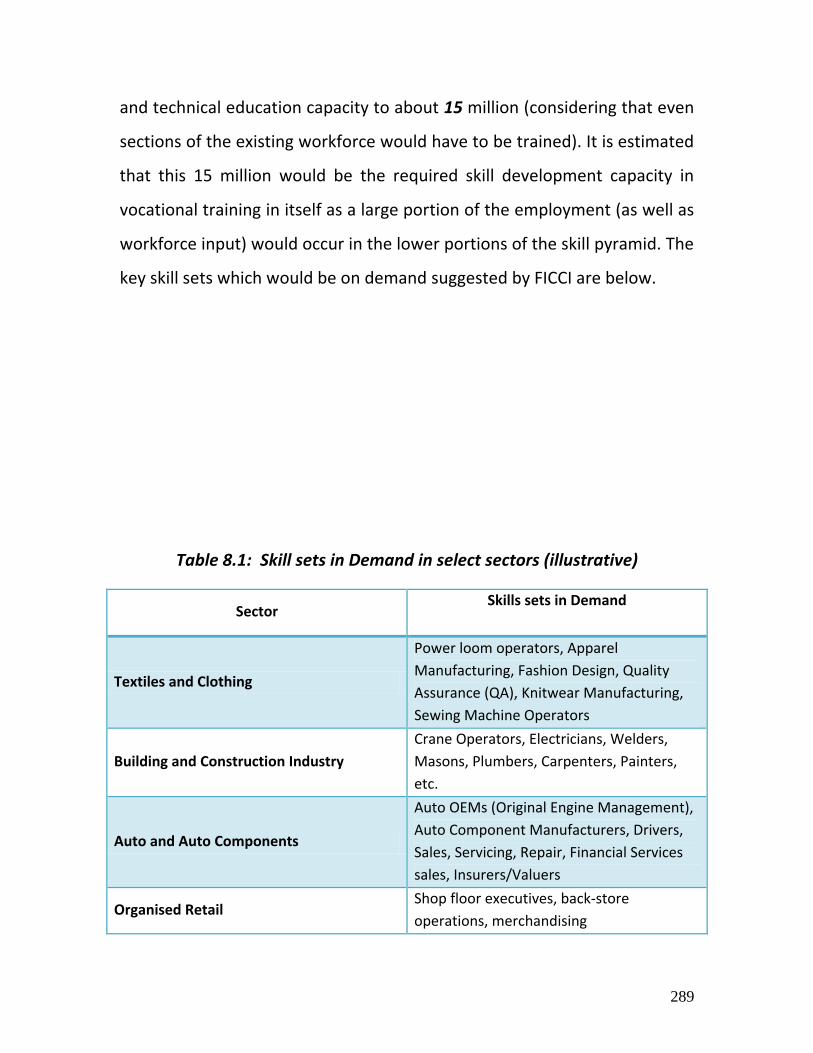
289
and technical education capacity to about 15 million (considering that even
sections of the existing workforce would have to be trained). It is estimated
that this 15 million would be the required skill development capacity in
vocational training in itself as a large portion of the employment (as well as
workforce input) would occur in the lower portions of the skill pyramid. The
key skill sets which would be on demand suggested by FICCI are below.
Table 8.1: Skill sets in Demand in select sectors (illustrative)
Sector Skills sets in Demand
Textiles and Clothing
Power loom operators, Apparel
Manufacturing, Fashion Design, Quality
Assurance (QA), Knitwear Manufacturing,
Sewing Machine Operators
Building and Construction Industry
Crane Operators, Electricians, Welders,
Masons, Plumbers, Carpenters, Painters,
etc.
Auto and Auto Components
Auto OEMs (Original Engine Management),
Auto Component Manufacturers, Drivers,
Sales, Servicing, Repair, Financial Services
sales, Insurers/Valuers
Organised Retail Shop floor executives, back-store
operations, merchandising
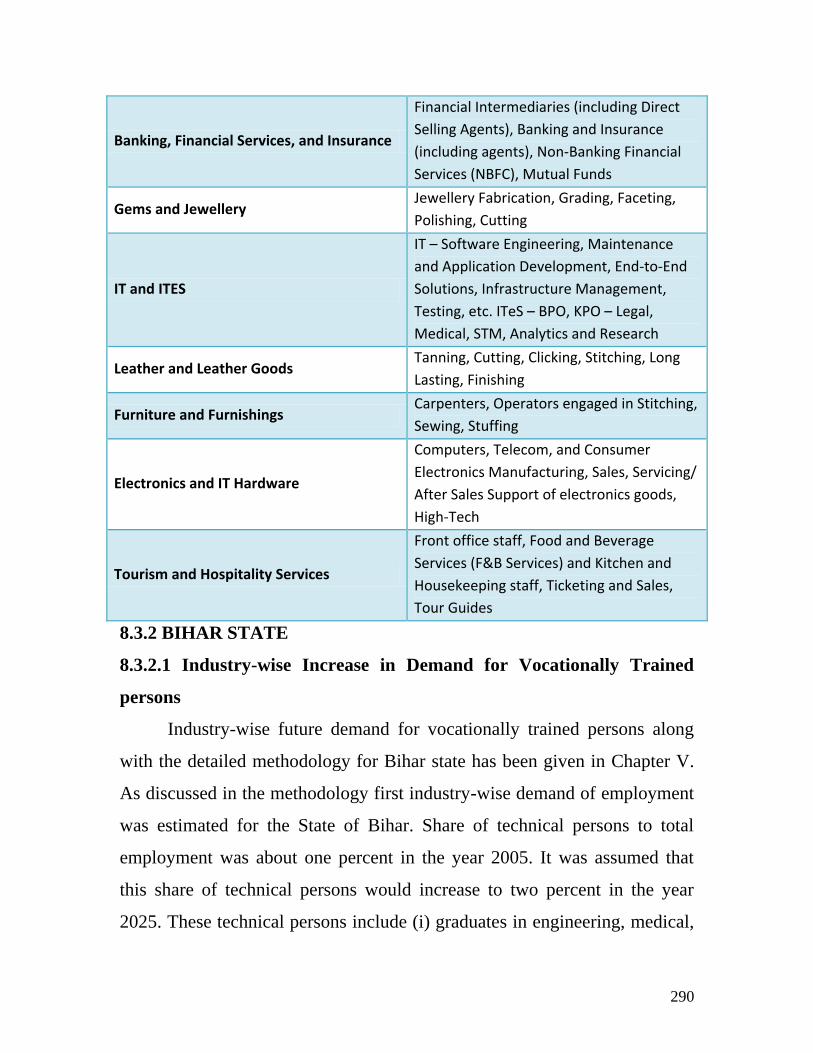
290
Banking, Financial Services, and Insurance
Financial Intermediaries (including Direct
Selling Agents), Banking and Insurance
(including agents), Non-Banking Financial
Services (NBFC), Mutual Funds
Gems and Jewellery Jewellery Fabrication, Grading, Faceting,
Polishing, Cutting
IT and ITES
IT – Software Engineering, Maintenance
and Application Development, End-to-End
Solutions, Infrastructure Management,
Testing, etc. ITeS – BPO, KPO – Legal,
Medical, STM, Analytics and Research
Leather and Leather Goods Tanning, Cutting, Clicking, Stitching, Long
Lasting, Finishing
Furniture and Furnishings Carpenters, Operators engaged in Stitching,
Sewing, Stuffing
Electronics and IT Hardware
Computers, Telecom, and Consumer
Electronics Manufacturing, Sales, Servicing/
After Sales Support of electronics goods,
High-Tech
Tourism and Hospitality Services
Front office staff, Food and Beverage
Services (F&B Services) and Kitchen and
Housekeeping staff, Ticketing and Sales,
Tour Guides
8.3.2 BIHAR STATE
8.3.2.1 Industry-wise Increase in Demand for Vocationally Trained
persons
Industry-wise future demand for vocationally trained persons along
with the detailed methodology for Bihar state has been given in Chapter V.
As discussed in the methodology first industry-wise demand of employment
was estimated for the State of Bihar. Share of technical persons to total
employment was about one percent in the year 2005. It was assumed that
this share of technical persons would increase to two percent in the year
2025. These technical persons include (i) graduates in engineering, medical,
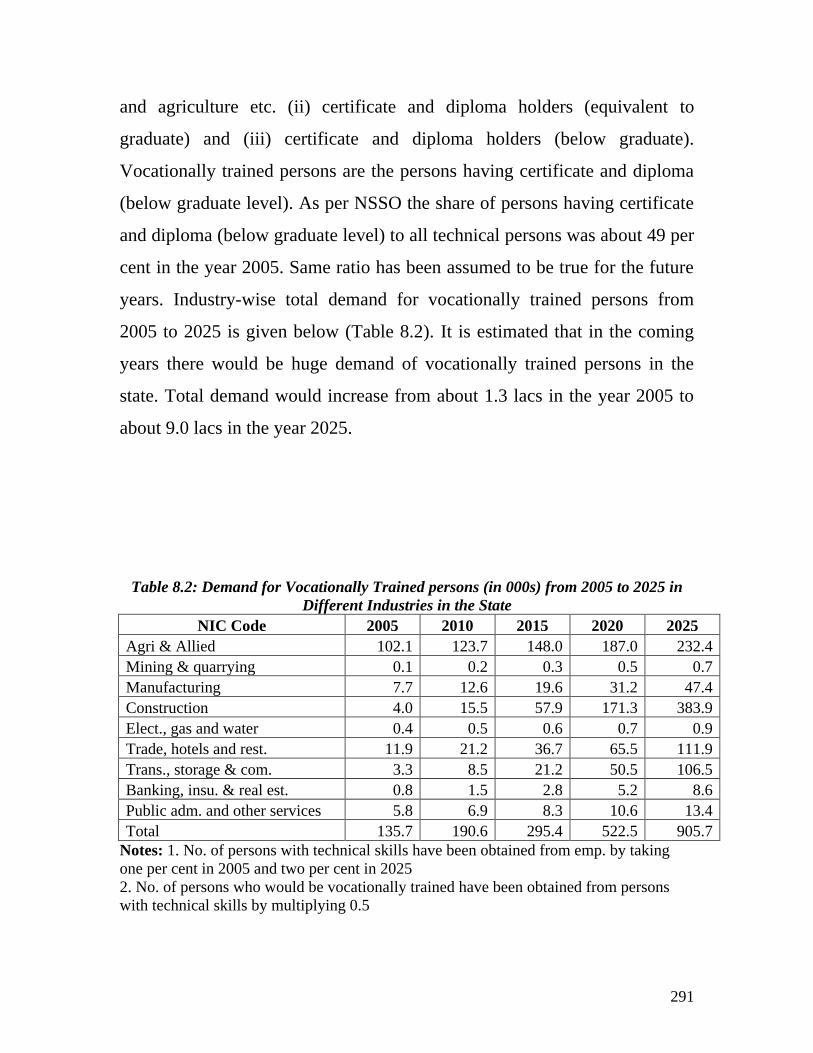
291
and agriculture etc. (ii) certificate and diploma holders (equivalent to
graduate) and (iii) certificate and diploma holders (below graduate).
Vocationally trained persons are the persons having certificate and diploma
(below graduate level). As per NSSO the share of persons having certificate
and diploma (below graduate level) to all technical persons was about 49 per
cent in the year 2005. Same ratio has been assumed to be true for the future
years. Industry-wise total demand for vocationally trained persons from
2005 to 2025 is given below (Table 8.2). It is estimated that in the coming
years there would be huge demand of vocationally trained persons in the
state. Total demand would increase from about 1.3 lacs in the year 2005 to
about 9.0 lacs in the year 2025.
Table 8.2: Demand for Vocationally Trained persons (in 000s) from 2005 to 2025 in
Different Industries in the State
NIC Code 2005 2010 2015 2020 2025
Agri & Allied 102.1 123.7 148.0 187.0 232.4
Mining & quarrying 0.1 0.2 0.3 0.5 0.7
Manufacturing 7.7 12.6 19.6 31.2 47.4
Construction 4.0 15.5 57.9 171.3 383.9
Elect., gas and water 0.4 0.5 0.6 0.7 0.9
Trade, hotels and rest. 11.9 21.2 36.7 65.5 111.9
Trans., storage & com. 3.3 8.5 21.2 50.5 106.5
Banking, insu. & real est. 0.8 1.5 2.8 5.2 8.6
Public adm. and other services 5.8 6.9 8.3 10.6 13.4
Total 135.7 190.6 295.4 522.5 905.7
Notes: 1. No. of persons with technical skills have been obtained from emp. by taking
one per cent in 2005 and two per cent in 2025
2. No. of persons who would be vocationally trained have been obtained from persons
with technical skills by multiplying 0.5
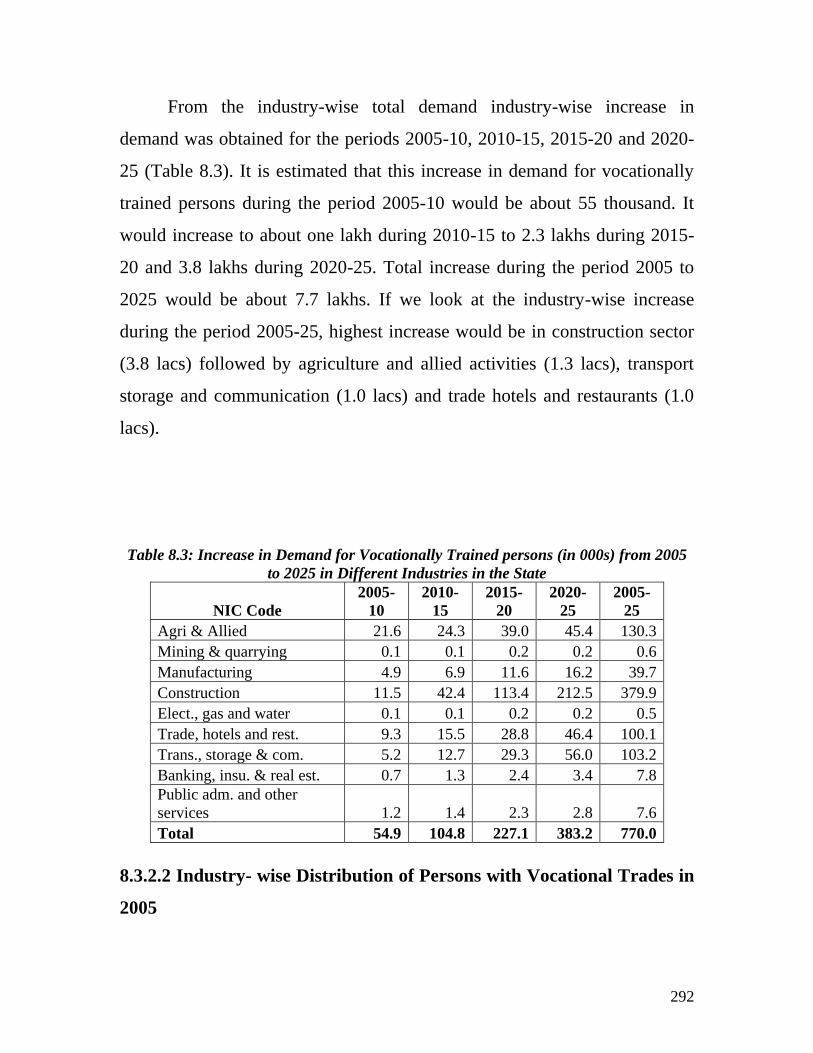
292
From the industry-wise total demand industry-wise increase in
demand was obtained for the periods 2005-10, 2010-15, 2015-20 and 2020-
25 (Table 8.3). It is estimated that this increase in demand for vocationally
trained persons during the period 2005-10 would be about 55 thousand. It
would increase to about one lakh during 2010-15 to 2.3 lakhs during 2015-
20 and 3.8 lakhs during 2020-25. Total increase during the period 2005 to
2025 would be about 7.7 lakhs. If we look at the industry-wise increase
during the period 2005-25, highest increase would be in construction sector
(3.8 lacs) followed by agriculture and allied activities (1.3 lacs), transport
storage and communication (1.0 lacs) and trade hotels and restaurants (1.0
lacs).
Table 8.3: Increase in Demand for Vocationally Trained persons (in 000s) from 2005
to 2025 in Different Industries in the State
NIC Code
2005-
10
2010-
15
2015-
20
2020-
25
2005-
25
Agri & Allied 21.6 24.3 39.0 45.4 130.3
Mining & quarrying 0.1 0.1 0.2 0.2 0.6
Manufacturing 4.9 6.9 11.6 16.2 39.7
Construction 11.5 42.4 113.4 212.5 379.9
Elect., gas and water 0.1 0.1 0.2 0.2 0.5
Trade, hotels and rest. 9.3 15.5 28.8 46.4 100.1
Trans., storage & com. 5.2 12.7 29.3 56.0 103.2
Banking, insu. & real est. 0.7 1.3 2.4 3.4 7.8
Public adm. and other
services 1.2 1.4 2.3 2.8 7.6
Total 54.9 104.8 227.1 383.2 770.0
8.3.2.2 Industry- wise Distribution of Persons with Vocational Trades in
2005
293
Industry-wise (as per NIC 1987, one digit level) percentage
distribution of employment in the selected occupations at three digit level (as
per 1968 NCO) was obtained for Bihar from NSSO survey for the year 2005
and is given in Table 8.4. These occupations were selected in such a way
that either they are exactly same or are very much similar to the trades being
covered in the State. Vocational trades covered by each selected occupation
is shown within the parenthesis. So we can say that this distribution of
employment in the selected occupations at three digit level also gives an idea
of industry-wise distribution of persons with vocation vocational trades in
that year.
As per this distribution, it is observed that 62 per cent of ―mechanic-
agriculture machinery persons‖ were employed in Agriculture & allied
industry in the year 2005. Similarly, 96 per cent of ―persons with foundry
trade‖, 100 per cent with ―fashion technology‖, 92 per cent with ―computer
aided embroidery and needle work‖ and 58 per cent with ―bakery and
confectionary trade‖ were employed in manufacturing industry.
Construction industry has employed 64 per cent of the persons of the
persons with ―Building maintenance‖, 95 per cent of ―painters‖ and 91 per
cent of ―masons‖ as their skill. Trade, hotels and restaurant industry has
employed a very high share of persons with ―Hotel and restaurant keepers‖
(100 per cent) and ―Leather foot wear‖ (71 per cent). Banking, insurance and
real estate industry employs ―Agents and salesman‖ (100 per cent), ―Agents,
brokers shares and real estate‖ (100 per cent). Similarly, Public
Administration and other services industry employed 100 per cent of
―Photography/digital photographer‖, 81 per cent of ―Steward‖ and ―Hospital
house keeping‖, 100 per cent of ―Ayahas & maids‖, 100 per cent of ―home
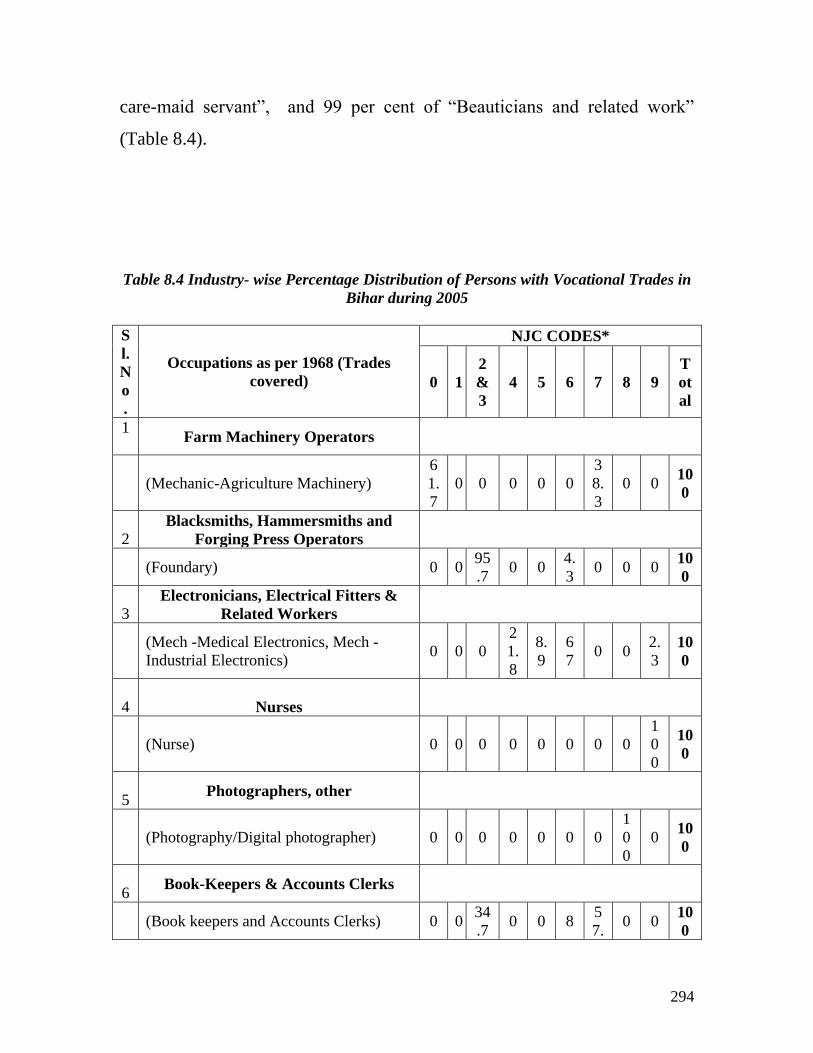
294
care-maid servant‖, and 99 per cent of ―Beauticians and related work‖
(Table 8.4).
Table 8.4 Industry- wise Percentage Distribution of Persons with Vocational Trades in
Bihar during 2005
S
l.
N
o
.
Occupations as per 1968 (Trades
covered)
NJC CODES*
0 1
2
&
3
4 5 6 7 8 9
T
ot
al
1
Farm Machinery Operators
(Mechanic-Agriculture Machinery)
6
1.
7
0 0 0 0 0
3
8.
3
0 0 10
0
2
Blacksmiths, Hammersmiths and
Forging Press Operators
(Foundary) 0 0
95
.7 0 0
4.
3 0 0 0
10
0
3
Electronicians, Electrical Fitters &
Related Workers
(Mech -Medical Electronics, Mech -
Industrial Electronics) 0 0 0
2
1.
8
8.
9
6
7 0 0
2.
3
10
0
4 Nurses
(Nurse) 0 0 0 0 0 0 0 0
1
0
0
10
0
5 Photographers, other
(Photography/Digital photographer) 0 0 0 0 0 0 0
1
0
0
0 10
0
6 Book-Keepers & Accounts Clerks
(Book keepers and Accounts Clerks) 0 0
34
.7 0 0 8
5
7.0 0
10
0
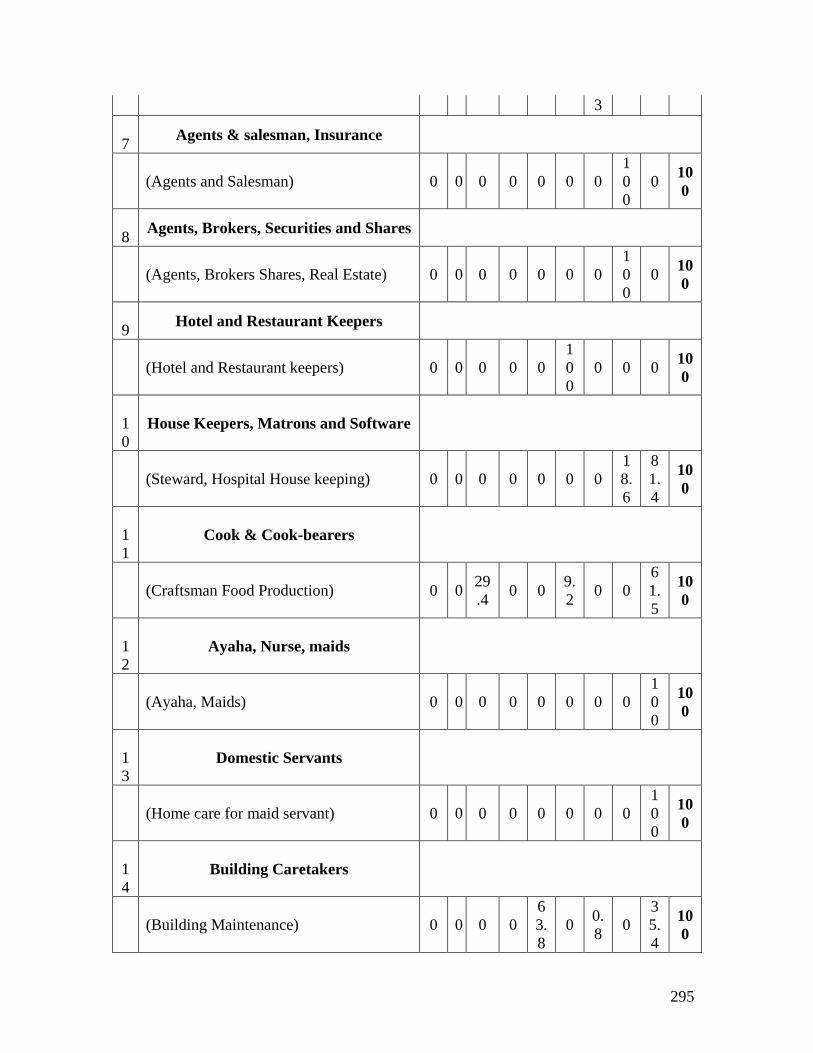
295
3
7 Agents & salesman, Insurance
(Agents and Salesman) 0 0 0 0 0 0 0
1
0
0
0 10
0
8 Agents, Brokers, Securities and Shares
(Agents, Brokers Shares, Real Estate) 0 0 0 0 0 0 0
1
0
0
0 10
0
9 Hotel and Restaurant Keepers
(Hotel and Restaurant keepers) 0 0 0 0 0
1
0
0
0 0 0 10
0
1
0
House Keepers, Matrons and Software
(Steward, Hospital House keeping) 0 0 0 0 0 0 0
1
8.
6
8
1.
4
10
0
1
1
Cook & Cook-bearers
(Craftsman Food Production) 0 0 29
.4 0 0
9.
2 0 0
6
1.
5
10
0
1
2
Ayaha, Nurse, maids
(Ayaha, Maids) 0 0 0 0 0 0 0 0
1
0
0
10
0
1
3
Domestic Servants
(Home care for maid servant) 0 0 0 0 0 0 0 0
1
0
0
10
0
1
4
Building Caretakers
(Building Maintenance) 0 0 0 0
6
3.
8
0 0.
8 0
3
5.
4
10
0
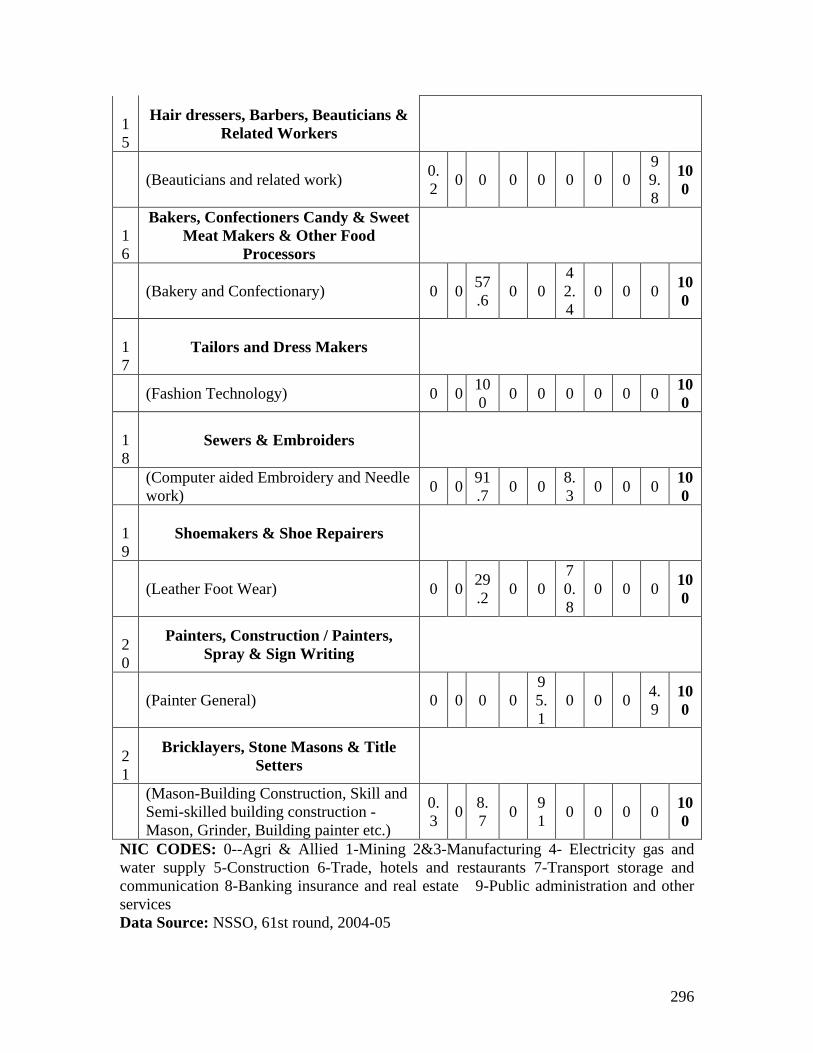
296
1
5
Hair dressers, Barbers, Beauticians &
Related Workers
(Beauticians and related work) 0.
2 0 0 0 0 0 0 0
9
9.
8
10
0
1
6
Bakers, Confectioners Candy & Sweet
Meat Makers & Other Food
Processors
(Bakery and Confectionary) 0 0 57
.6 0 0
4
2.
4
0 0 0 10
0
1
7
Tailors and Dress Makers
(Fashion Technology) 0 0
10
0 0 0 0 0 0 0
10
0
1
8
Sewers & Embroiders
(Computer aided Embroidery and Needle
work) 0 0
91
.7 0 0
8.
3 0 0 0
10
0
1
9
Shoemakers & Shoe Repairers
(Leather Foot Wear) 0 0 29
.2 0 0
7
0.
8
0 0 0 10
0
2
0
Painters, Construction / Painters,
Spray & Sign Writing
(Painter General) 0 0 0 0
9
5.
1
0 0 0 4.
9
10
0
2
1
Bricklayers, Stone Masons & Title
Setters
(Mason-Building Construction, Skill and
Semi-skilled building construction -
Mason, Grinder, Building painter etc.)
0.
3 0
8.
7 0
9
1 0 0 0 0
10
0
NIC CODES: 0--Agri & Allied 1-Mining 2&3-Manufacturing 4- Electricity gas and
water supply 5-Construction 6-Trade, hotels and restaurants 7-Transport storage and
communication 8-Banking insurance and real estate 9-Public administration and other
services
Data Source: NSSO, 61st round, 2004-05
297
8.4 Views of experts regarding the future demand of Vocational Skills in
Select Sectors
Vocationally trained persons in Bihar will have their demand within the
state as well as outside the state. Keeping this fact in mind, views of the
experts in this field for India as a whole as well as for Bihar state has been
given in three different boxes (Box I, Box II and Box III). First box has
discussed about the training activities of construction sector and other two
boxes have discussed about the training activities of manufacturing sector
and service sector.
Box I: Construction Sector
Ahona Ghosh has written in his article on ―Built to Scale‖ about
L&T construction company (E.T., November 25, 2010). It is a $9.8 billion
diversified conglomerate, a rare construction company in India. Its
infrastructure offices in seven states have Construction Training Institutes
(CSTIs) attached to them, with the capacity to train 7,000-8,500 a year.
With about 33 million, the construction industry is India‘s second-largest
employer, after agriculture. Yet, it has a huge deficit of qualified workers,
298
says S Natarajan, who oversees all CSTIs. ―By 2022, this deficit will be
170-180 million‖, he says.
Globalization has enabled the industry to adopt the latest
technologies, resulting in a growing demand for world-class workmanship.
With this in mind, L&T‘s programme incorporates the latest technology
with regular ground work. The Programme sets high standards for each
candidate, though the eligibility bar is low - starting from class V fail
(diploma and degree holders are barred). Everyone who clears the training
course is employed on contract at the company‘s work sites through sub-
contractors.
All the courses are designed for short-term vocational training. The
period varies from 200 hours spread over a month to 600 hours over three
months, depending on the trade. After a classroom session, the trainees
work on a mock construction site in the institute.
As one of the biggest players in construction, the company is in need
of skills like carpenters, bar benders, mason, welders, plumbers and
electricians for its frontline work. Moreover, it is bringing respectability to
a trade that has been looked down upon as a profession requiring no formal
skills.
In an another article on ―Rustomjee Group - The Slab Test‖ Percy
Chowdhry, director of Rustomjee Group says, ―We have 4.5 million sq ft of
construction work going on and we need a huge quantum of manpower to
be developed‖ (E.T., November 25, 2010).
Asian Development Bank is ready to channel a fresh $300 million
loan to Bihar for developing state roads. State‘s road construction
department secretary Pratyaya Amrit has said, ―Our mission is to develop
299
state highways so that one can travel to Patna from any part of Bihar within
six hours‖ (The Economic Times, December 7, 2010).
Box II : Manufacturing Sector
Arun Maira, an industry veteran and the member, in-charge of
Industry, Planning Commission, spoke to Malini Goyal, Correspondant
Economic Times about the layout of the broad contours of the 12th
Five-
Year Plan (E.T., November 26, 2010). He said, the Plan, still in
preparation, will have a clear and sharp manufacturing agenda. He
expressed his concern by saying that Imports from China of IT and telecom
equipment have surged on the back of the telecom boom. In the next five
years, we expect ICT hardware imports to cross the amount we spend on
petroleum imports. This should be of concern. Today, China‘s machine
tools industry is 55 times that of India – 25 years ago they were at the same
level. Biggest challenges to achieve this goal are infrastructure and
indigenous technology. Our machine tool segment, which is of strategic
importance, is weak. It is critical and needs to be strengthened.
He further mentioned that we need to create enabling environment
and build mother industry that will generate jobs in labour intensive sectors.
Assembling anything is the low-skill, low-wage activity and it can freely
cross borders when wage costs moves up. Singapore chose to encourage
only high-end knowledge-intensive economic activity. As we look globally,
it is clear countries will need to build depth in specific sectors to build a
robust manufacturing. China is doing it very well. While it began with low-
value products like toys etc, it has ended in high categories.
300
Institutes for competitiveness, Gurgaon dedicated to conducting
research in the core fields of strategy, economic development and
productivity, has mentioned that states can harness their population to grow
by making policies that make productive use of available resources. States
with healthy GDP and population growth rates, such as Haryana and Bihar
must focus on sectors where they are inherently competitive because of the
presence of natural resources or traditional skills and knowledge (E.T.
November 27, 2010). Because of large agricultural resources in Bihar, it
has good scope of industries relating to Food Processing (fruit, vegetables
and other food), Food Preservation, Preparation of Juice and drinks, Power
generation and fisheries sector.
Surat‘s diamond industry is facing server manpower crunch at a time
when demand for cut and polished diamonds from the US, China and other
markets is regaining momentum lost during the global recessions of 208-09.
Dinesh Navadia, President, Surat Diamond Association says that they are
facing a shortage of around 25 per cent of skilled workers (H.T., December
6, 2010). Chandrakant Sanghavi, head, Sanghavi exports, one of the largest
firms in Surat says that these shortages of skilled workers will worson if the
simply of rough diamond goes up.
India‘s solar sector is gearing up for huge capacity additions – plants
that will eventually generate about 20,000 MW of solar power, a whopping
Rs 4,337 crore in allocating. Ministry of New and Renewable Energy had
indicated that about one lakh trained and skilled personnel would be
required by 2020, the last year of National Solar Mission. Sanjay
Chandrakant from Ernst & Young says that for manufacturing, system
installation, R&D work and operations & maintenance technicians will be
301
needed (E.T., December 10, 2010).
Box III :Service Sector
(i) Information Technology & Information Technology enabled
services (IT & ITeS)
According to the study done by ICRA Management Consulting
Services for the National Skill Development Corporation, the IT and ITeS
sector is expected to employ about 7.5 million persons directly by 2022.
This means there would be an incremental requirement of about 5.3 million
persons in the sector till 2022. Nasscom estimates say that IT industry
spends about Rs 3000 crore every year for entry level training due to acute
talent shortage. If suitably trained persons are available industry can save a
large amount of money by employing them directly (E.T., December 12,
2010).
Rita Soni, the newly appointed CEO of Nasscom Foundation says we
are in talks with the National Skill Development Committee (NSDC) to
partner NSDC to provide training in the IT space. ―The IT sector is a $60
billion industry and will certainly need a lot of people. We are going to help
take this forward‖, says Soni.
Keeping in view the importance of IT and ITeS sector, Kerala
Government is developing a Techno park at the outskirts of
Thiruvanthapuram. Developed over 450 acres as an integrated township,
encompassing IT/ITeS infrastructure, residential apartments shopping
malls, hospitals, hotels, educational institutions, and other support facilities,
302
the project is expected to generate one lakh direct IT/ITeS jobs and another
four lakh indirect jobs (E.T., January 6, 2011).
(ii) Rural Marketing
Vikas Kumar writes about the rural jobs rush in India (E.T.
November 18, 2010). He says that host of services-driven companies in
emerging sectors - MFI, retail, telecom, ITES, healthcare, infrastructure and
logistics - are scouting for local talent in small towns or from boarding
villages. Further he illustrates about the future plans of employment by
some employing agencies in rural areas:
Telecom-tower maintenance firms: These firms could employ
200,000 people in the near future, is a good example. There are
about 140,000 towers in semi-urban locations. ―About 80% of
25,000 new towers to be added this year will be in rural and
remote areas‖; says Amarjit Gupta, executive VP-sales &
marketing, Acme Telepower, a company that provides energy-
management solutions to tower companies.
Their operations and maintenance are managed by specialist
firms like Chandigarh-based synergy telecom, which runs
5000 sites in rural areas. Maninder Nanda, CEO for this
business says that one technician can manage 5-6 rural sites.
These technicians are I.T.I certificate holders who join at a
monthly salary of Rs. 8000-10000.
Team lease: About half the 60,000 people this staffing firm
places every year are in upcountry jobs, especially in fast
moving consumer goods (FMCG), financial services, customer
303
durables and telecom. ―Rural sales force hiring by companies
is growing at 40% annually against 5% in the past‖, says
Manish Salharwal, Chairman, Team lease.
V-Shesh: The Chennai- based ‗Livelihood Exchange‘ places
rural youth as customer service agents or transaction
processing officers in rural BPOs, as loan officers in MFIs and
as rural market developers in FMCG and consumer durable
companies. It has trained and placed 850 people in the last two
years. It is targeting 2,000 placements in 2010-11.
FMCG Companies: As they renew their rural drive, FMCG
companies are hiring field staff in large number. Dabur plans
to hire 200 ‗feet on street‘ and indirect employees through
stockiests in villages and small towns. Marico has just finished
hiring 220 people. ITC, Nesle, Glaxo Smith Kline Consumer
and Emami speak of doubling their direct employee strength in
rural locations.
Archana Rai & Peerzada Abrar have mentioned in their article
on, ―India set to emerge as social innovation hub‖ about the
innovative business models that combine profit with social
good could well be the country‘s best known export in coming
years as India emerges as the social innovation hub of the
world (E.T. November 11, 2010).
They have also talked about AISECT, a company which
provides information and technology education in rural areas,
is now hawking products of computer firms, banks and
undertaking government projects through its network of 8000
304
rural education centers in over 30 states that run on franchise
model. ―By 2013, we aim to have 15,000 centres‖ says
Santosh Kumar Choubey, founder of this organisation.
(iii) Microfinance Institutions (MFIs)
Microfinance Institutions have great scope in India. Recently some
promoters of these institutions have exploited the poor beneficiaries, but
overall these institutions have done a great job in rural areas. Public sector
and rural banks have not achieved the goal of financial inclusion because of
their high human resources costs. Only MFIs provide a low-cost platform to
achieve it. The average cost per head of MFIs is about Rs 1 lakh per annum
compared with Rs. 5.6 lakh for PSU banks, Rs.5.3 lakh for private sector
banks, and Rs. 3.8 lakhs for regional rural banks (Sauabh Tripathi, E.T.
February, 4 2011). Alok Prashad has talked about the rural jobs in
Microfinance Institutions (The Hindu, Business Line, January 5, 2011). The
major MFIs have over 10,000 branches, which have a field staff of 60,000-
75,000. If other MFIs are also included, the number would go beyond one
lakh. Candidates join as relationship officers, disbursing loans to self help
groups and collecting repayments.
(iv) Business Processing Organizations (BPOs)
About Rural BPOs it is said that so far, there have largely been
experiments- now they are going mainstream (E.T. November 18, 2010).
For instance, Genpact; India‘s largest BPO has outsourced its internal
finance and accounts work to Rural Shores. Infosys BPO, Wipro BPO and
Aditya Minacs are looking to outsource some of their work to rural BPOs.
Five years from now, according to industry estimates about 1,000 rural
305
BPOs could employ 1,50,000 people.
(v) Organised Retail Sector:
Muralidhar Rao, chief executive of future of Future Group says that
frontline workforce for retail industry has a growing requirement of skilled
people. He further says that we need to increase focus on curses and
training programmes that are aimed at creating employability at the bottom-
of-the pyramid. Future group hires at least 2000 people every month in
retail (E.T., October 20 2010).
8.5 Existing and New Trades for the state
8.5.1 Existing Trades being taught in the state
In ITIs/ITCs, training was being imparted in 21 courses of two year
duration and 29 courses of one year duration (Table 8.5). In other
institutions/departments it was observed that three courses were of more
than six months duration, 21 courses were of six months duration and 23
courses were of less than 6 months duration. Some of the courses of other
institutions/departments were of very short duration (less than one month)
but their number was very less (8.6).
Secondly these trades concentrated in a few growth sectors. Out of
existing 97 trades, 78 trades are in 12 growth sectors identified by Planning
commission and 19 trades are in other growth sectors. Out of 78 trades
about one-third trades (i.e. 25 trades) are in ―Textile apparel and garments‖,
9 trades are in ―Automobile and auto component‖ , 8 trades are in
―Chemicals and pharmaceuticals‖ and 7 trdes are in ―Building and
construction industry‖ (Tables 8.5 and 8.6).
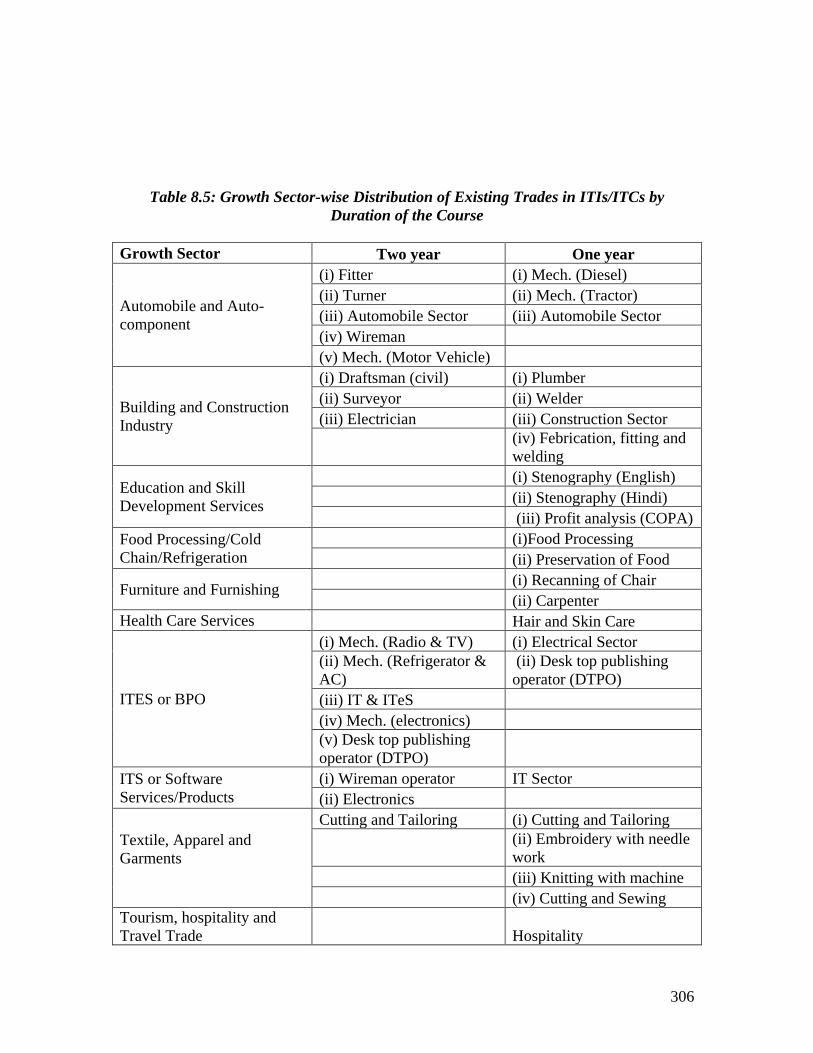
306
Table 8.5: Growth Sector-wise Distribution of Existing Trades in ITIs/ITCs by
Duration of the Course
Growth Sector Two year One year
Automobile and Auto-
component
(i) Fitter (i) Mech. (Diesel)
(ii) Turner (ii) Mech. (Tractor)
(iii) Automobile Sector (iii) Automobile Sector
(iv) Wireman
(v) Mech. (Motor Vehicle)
Building and Construction
Industry
(i) Draftsman (civil) (i) Plumber
(ii) Surveyor (ii) Welder
(iii) Electrician (iii) Construction Sector
(iv) Febrication, fitting and
welding
Education and Skill
Development Services
(i) Stenography (English)
(ii) Stenography (Hindi)
(iii) Profit analysis (COPA)
Food Processing/Cold
Chain/Refrigeration
(i)Food Processing
(ii) Preservation of Food
Furniture and Furnishing (i) Recanning of Chair
(ii) Carpenter
Health Care Services Hair and Skin Care
ITES or BPO
(i) Mech. (Radio & TV) (i) Electrical Sector
(ii) Mech. (Refrigerator &
AC)
(ii) Desk top publishing
operator (DTPO)
(iii) IT & ITeS
(iv) Mech. (electronics)
(v) Desk top publishing
operator (DTPO)
ITS or Software
Services/Products
(i) Wireman operator IT Sector
(ii) Electronics
Textile, Apparel and
Garments
Cutting and Tailoring (i) Cutting and Tailoring
(ii) Embroidery with needle
work
(iii) Knitting with machine
(iv) Cutting and Sewing
Tourism, hospitality and
Travel Trade Hospitality
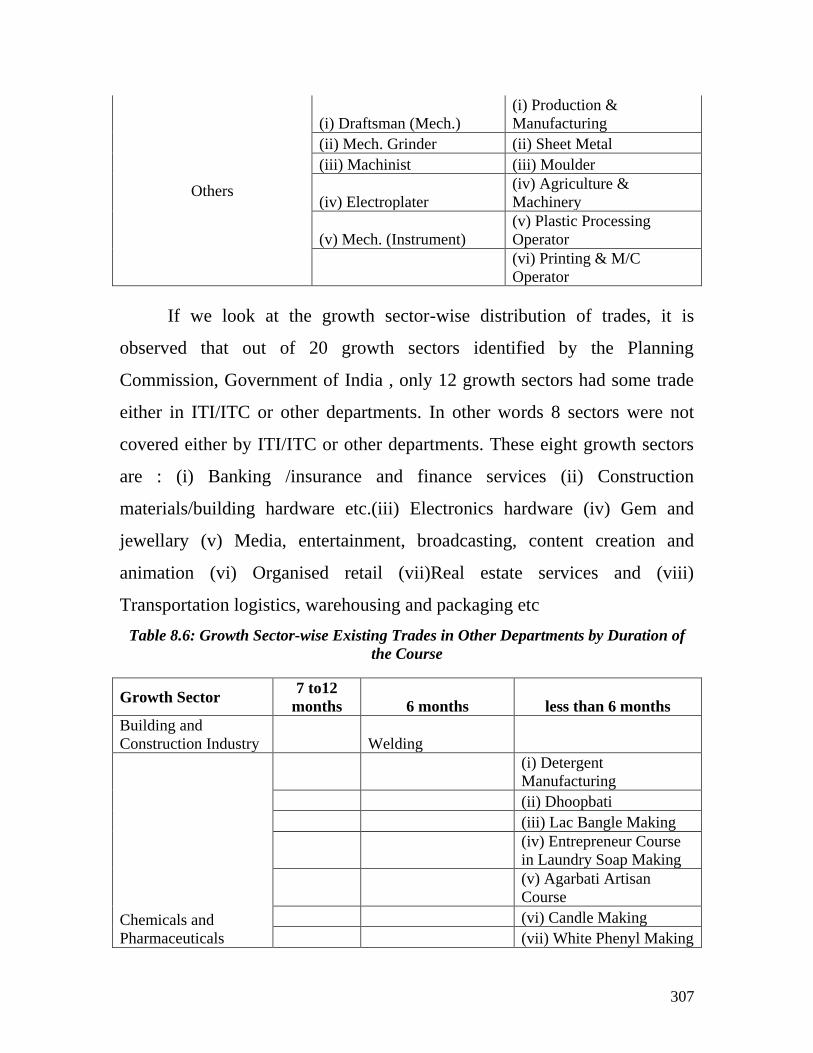
307
Others
(i) Draftsman (Mech.)
(i) Production &
Manufacturing
(ii) Mech. Grinder (ii) Sheet Metal
(iii) Machinist (iii) Moulder
(iv) Electroplater
(iv) Agriculture &
Machinery
(v) Mech. (Instrument)
(v) Plastic Processing
Operator
(vi) Printing & M/C
Operator
If we look at the growth sector-wise distribution of trades, it is
observed that out of 20 growth sectors identified by the Planning
Commission, Government of India , only 12 growth sectors had some trade
either in ITI/ITC or other departments. In other words 8 sectors were not
covered either by ITI/ITC or other departments. These eight growth sectors
are : (i) Banking /insurance and finance services (ii) Construction
materials/building hardware etc.(iii) Electronics hardware (iv) Gem and
jewellary (v) Media, entertainment, broadcasting, content creation and
animation (vi) Organised retail (vii)Real estate services and (viii)
Transportation logistics, warehousing and packaging etc
Table 8.6: Growth Sector-wise Existing Trades in Other Departments by Duration of
the Course
Growth Sector 7 to12
months 6 months less than 6 months
Building and
Construction Industry Welding
Chemicals and
Pharmaceuticals
(i) Detergent
Manufacturing
(ii) Dhoopbati
(iii) Lac Bangle Making
(iv) Entrepreneur Course
in Laundry Soap Making
(v) Agarbati Artisan
Course
(vi) Candle Making
(vii) White Phenyl Making
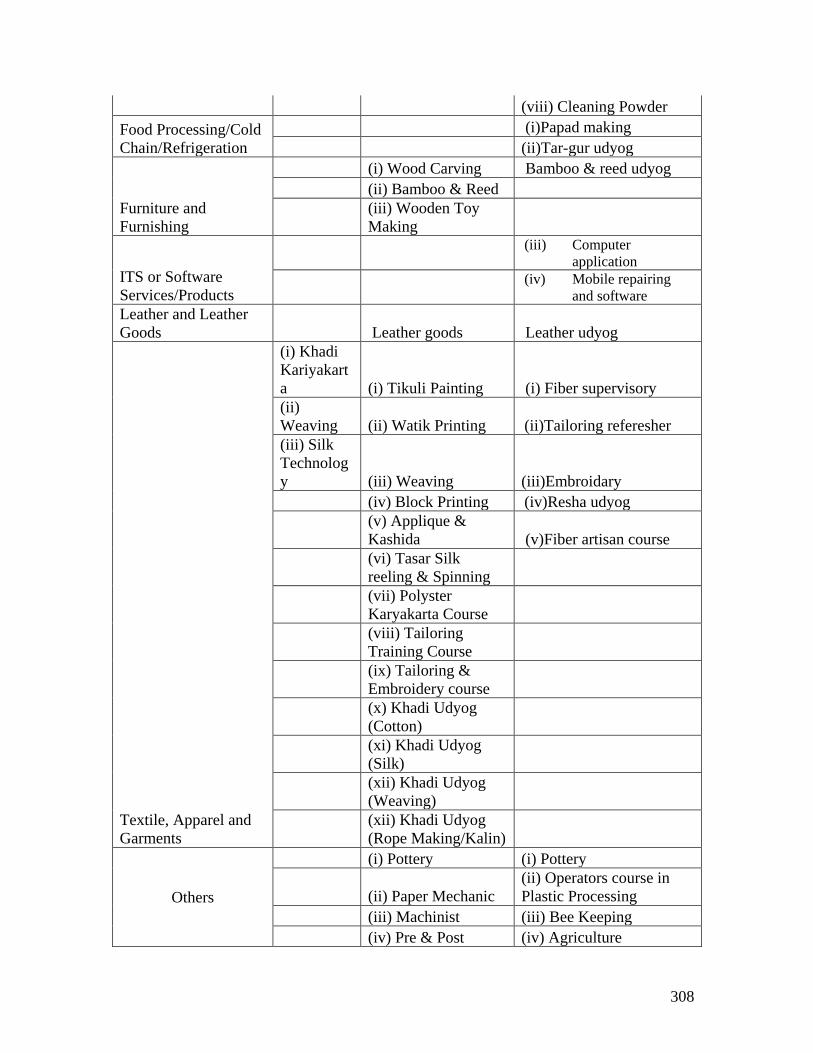
308
(viii) Cleaning Powder
Food Processing/Cold
Chain/Refrigeration
(i)Papad making
(ii)Tar-gur udyog
Furniture and
Furnishing
(i) Wood Carving Bamboo & reed udyog
(ii) Bamboo & Reed
(iii) Wooden Toy
Making
ITS or Software
Services/Products
(iii) Computer
application
(iv) Mobile repairing
and software
Leather and Leather
Goods Leather goods Leather udyog
Textile, Apparel and
Garments
(i) Khadi
Kariyakart
a (i) Tikuli Painting (i) Fiber supervisory
(ii)
Weaving (ii) Watik Printing (ii)Tailoring referesher
(iii) Silk
Technolog
y (iii) Weaving (iii)Embroidary
(iv) Block Printing (iv)Resha udyog
(v) Applique &
Kashida (v)Fiber artisan course
(vi) Tasar Silk
reeling & Spinning
(vii) Polyster
Karyakarta Course
(viii) Tailoring
Training Course
(ix) Tailoring &
Embroidery course
(x) Khadi Udyog
(Cotton)
(xi) Khadi Udyog
(Silk)
(xii) Khadi Udyog
(Weaving)
(xii) Khadi Udyog
(Rope Making/Kalin)
Others
(i) Pottery (i) Pottery
(ii) Paper Mechanic
(ii) Operators course in
Plastic Processing
(iii) Machinist (iii) Bee Keeping
(iv) Pre & Post (iv) Agriculture
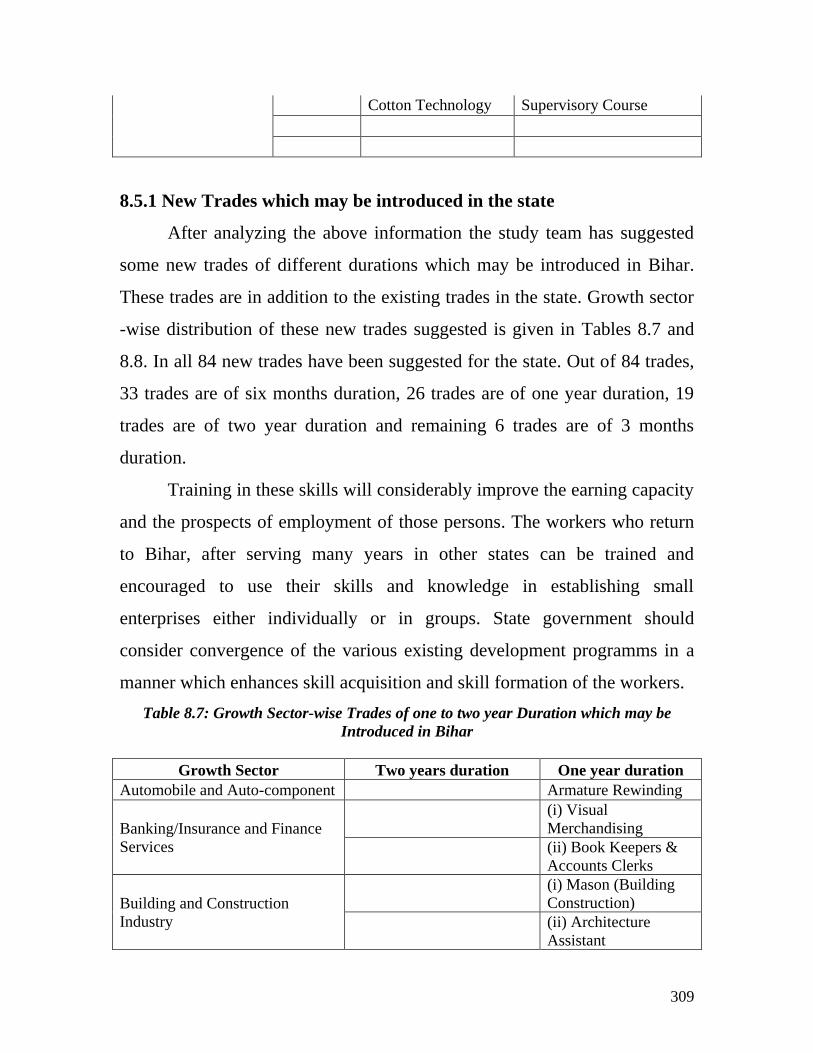
309
Cotton Technology Supervisory Course
8.5.1 New Trades which may be introduced in the state
After analyzing the above information the study team has suggested
some new trades of different durations which may be introduced in Bihar.
These trades are in addition to the existing trades in the state. Growth sector
-wise distribution of these new trades suggested is given in Tables 8.7 and
8.8. In all 84 new trades have been suggested for the state. Out of 84 trades,
33 trades are of six months duration, 26 trades are of one year duration, 19
trades are of two year duration and remaining 6 trades are of 3 months
duration.
Training in these skills will considerably improve the earning capacity
and the prospects of employment of those persons. The workers who return
to Bihar, after serving many years in other states can be trained and
encouraged to use their skills and knowledge in establishing small
enterprises either individually or in groups. State government should
consider convergence of the various existing development programms in a
manner which enhances skill acquisition and skill formation of the workers.
Table 8.7: Growth Sector-wise Trades of one to two year Duration which may be
Introduced in Bihar
Growth Sector Two years duration One year duration
Automobile and Auto-component Armature Rewinding
Banking/Insurance and Finance
Services
(i) Visual
Merchandising
(ii) Book Keepers &
Accounts Clerks
Building and Construction
Industry
(i) Mason (Building
Construction)
(ii) Architecture
Assistant
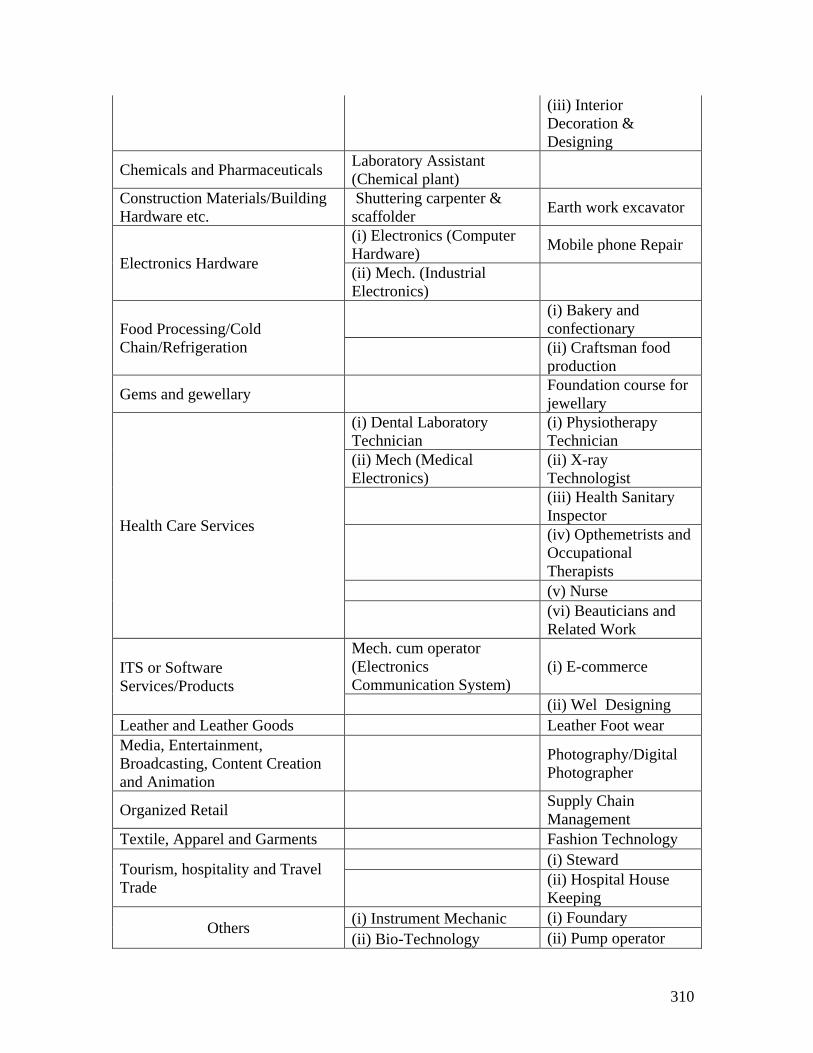
310
(iii) Interior
Decoration &
Designing
Chemicals and Pharmaceuticals Laboratory Assistant
(Chemical plant)
Construction Materials/Building
Hardware etc.
Shuttering carpenter &
scaffolder Earth work excavator
Electronics Hardware
(i) Electronics (Computer
Hardware) Mobile phone Repair
(ii) Mech. (Industrial
Electronics)
Food Processing/Cold
Chain/Refrigeration
(i) Bakery and
confectionary
(ii) Craftsman food
production
Gems and gewellary
Foundation course for
jewellary
Health Care Services
(i) Dental Laboratory
Technician
(i) Physiotherapy
Technician
(ii) Mech (Medical
Electronics)
(ii) X-ray
Technologist
(iii) Health Sanitary
Inspector
(iv) Opthemetrists and
Occupational
Therapists
(v) Nurse
(vi) Beauticians and
Related Work
ITS or Software
Services/Products
Mech. cum operator
(Electronics
Communication System)
(i) E-commerce
(ii) Wel Designing
Leather and Leather Goods Leather Foot wear
Media, Entertainment,
Broadcasting, Content Creation
and Animation
Photography/Digital
Photographer
Organized Retail
Supply Chain
Management
Textile, Apparel and Garments Fashion Technology
Tourism, hospitality and Travel
Trade
(i) Steward
(ii) Hospital House
Keeping
Others (i) Instrument Mechanic (i) Foundary
(ii) Bio-Technology (ii) Pump operator
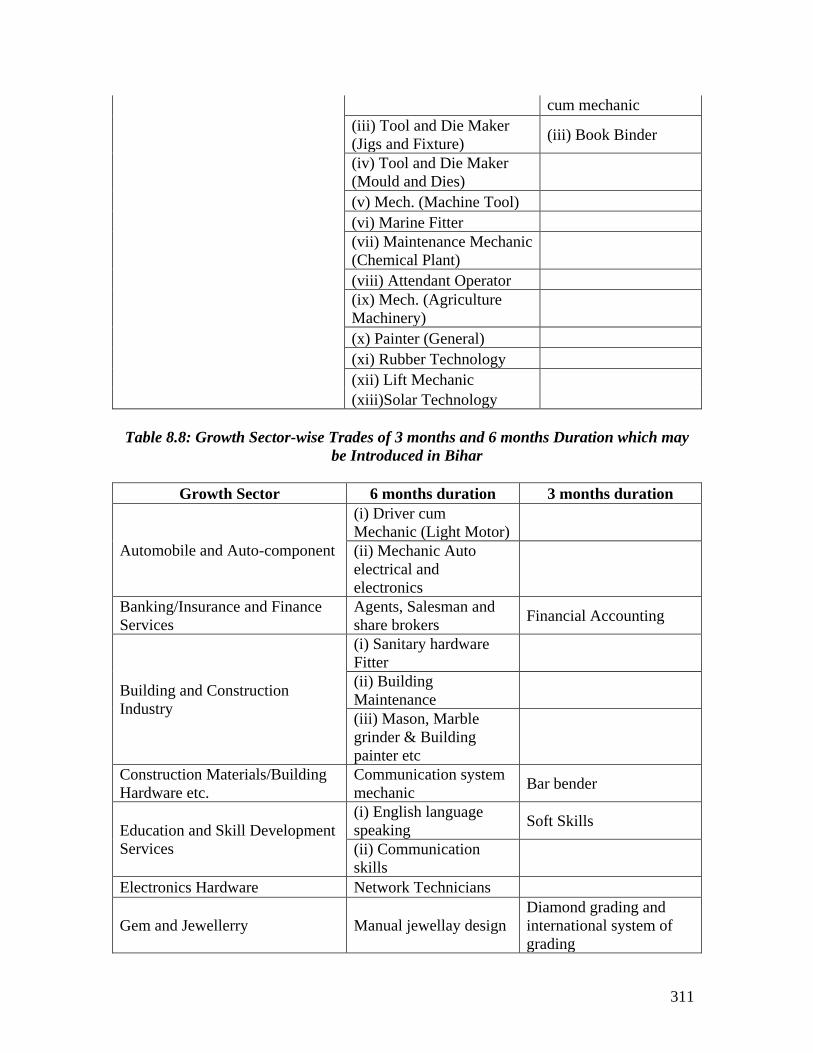
311
cum mechanic
(iii) Tool and Die Maker
(Jigs and Fixture) (iii) Book Binder
(iv) Tool and Die Maker
(Mould and Dies)
(v) Mech. (Machine Tool)
(vi) Marine Fitter
(vii) Maintenance Mechanic
(Chemical Plant)
(viii) Attendant Operator
(ix) Mech. (Agriculture
Machinery)
(x) Painter (General)
(xi) Rubber Technology
(xii) Lift Mechanic
(xiii)Solar Technology
Table 8.8: Growth Sector-wise Trades of 3 months and 6 months Duration which may
be Introduced in Bihar
Growth Sector 6 months duration 3 months duration
Automobile and Auto-component
(i) Driver cum
Mechanic (Light Motor)
(ii) Mechanic Auto
electrical and
electronics
Banking/Insurance and Finance
Services
Agents, Salesman and
share brokers Financial Accounting
Building and Construction
Industry
(i) Sanitary hardware
Fitter
(ii) Building
Maintenance
(iii) Mason, Marble
grinder & Building
painter etc
Construction Materials/Building
Hardware etc.
Communication system
mechanic Bar bender
Education and Skill Development
Services
(i) English language
speaking Soft Skills
(ii) Communication
skills
Electronics Hardware Network Technicians
Gem and Jewellerry Manual jewellay design
Diamond grading and
international system of
grading
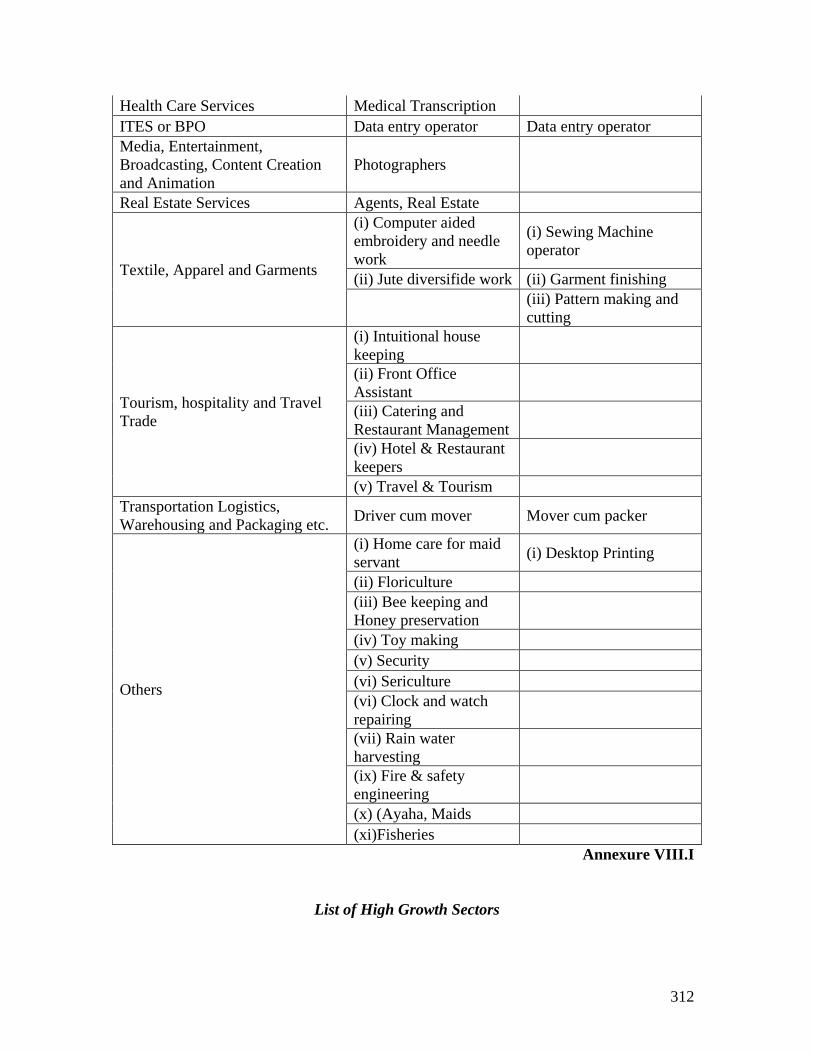
312
Health Care Services Medical Transcription
ITES or BPO Data entry operator Data entry operator
Media, Entertainment,
Broadcasting, Content Creation
and Animation
Photographers
Real Estate Services Agents, Real Estate
Textile, Apparel and Garments
(i) Computer aided
embroidery and needle
work
(i) Sewing Machine
operator
(ii) Jute diversifide work (ii) Garment finishing
(iii) Pattern making and
cutting
Tourism, hospitality and Travel
Trade
(i) Intuitional house
keeping
(ii) Front Office
Assistant
(iii) Catering and
Restaurant Management
(iv) Hotel & Restaurant
keepers
(v) Travel & Tourism
Transportation Logistics,
Warehousing and Packaging etc. Driver cum mover Mover cum packer
Others
(i) Home care for maid
servant (i) Desktop Printing
(ii) Floriculture
(iii) Bee keeping and
Honey preservation
(iv) Toy making
(v) Security
(vi) Sericulture
(vi) Clock and watch
repairing
(vii) Rain water
harvesting
(ix) Fire & safety
engineering
(x) (Ayaha, Maids
(xi)Fisheries
Annexure VIII.I
List of High Growth Sectors
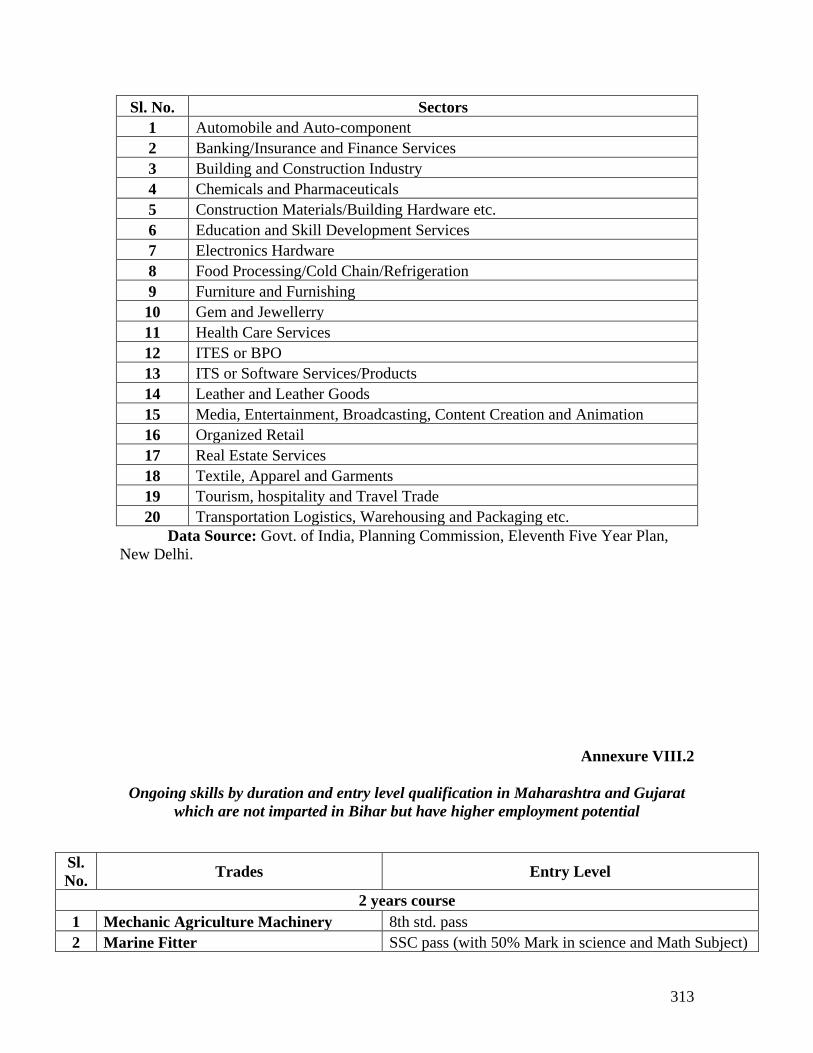
313
Sl. No. Sectors
1 Automobile and Auto-component
2 Banking/Insurance and Finance Services
3 Building and Construction Industry
4 Chemicals and Pharmaceuticals
5 Construction Materials/Building Hardware etc.
6 Education and Skill Development Services
7 Electronics Hardware
8 Food Processing/Cold Chain/Refrigeration
9 Furniture and Furnishing
10 Gem and Jewellerry
11 Health Care Services
12 ITES or BPO
13 ITS or Software Services/Products
14 Leather and Leather Goods
15 Media, Entertainment, Broadcasting, Content Creation and Animation
16 Organized Retail
17 Real Estate Services
18 Textile, Apparel and Garments
19 Tourism, hospitality and Travel Trade
20 Transportation Logistics, Warehousing and Packaging etc.
Data Source: Govt. of India, Planning Commission, Eleventh Five Year Plan,
New Delhi.
Annexure VIII.2
Ongoing skills by duration and entry level qualification in Maharashtra and Gujarat
which are not imparted in Bihar but have higher employment potential
Sl.
No. Trades Entry Level
2 years course
1 Mechanic Agriculture Machinery 8th std. pass
2 Marine Fitter SSC pass (with 50% Mark in science and Math Subject)
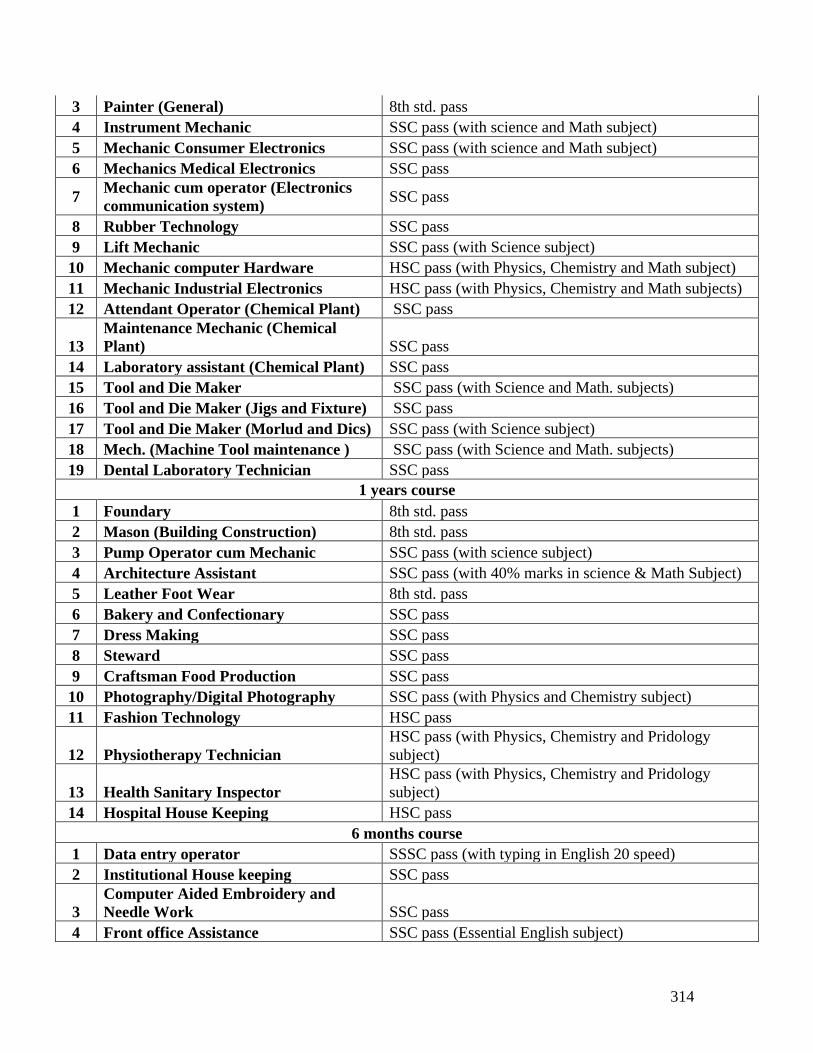
314
3 Painter (General) 8th std. pass
4 Instrument Mechanic SSC pass (with science and Math subject)
5 Mechanic Consumer Electronics SSC pass (with science and Math subject)
6 Mechanics Medical Electronics SSC pass
7 Mechanic cum operator (Electronics
communication system) SSC pass
8 Rubber Technology SSC pass
9 Lift Mechanic SSC pass (with Science subject)
10 Mechanic computer Hardware HSC pass (with Physics, Chemistry and Math subject)
11 Mechanic Industrial Electronics HSC pass (with Physics, Chemistry and Math subjects)
12 Attendant Operator (Chemical Plant) SSC pass
13
Maintenance Mechanic (Chemical
Plant) SSC pass
14 Laboratory assistant (Chemical Plant) SSC pass
15 Tool and Die Maker SSC pass (with Science and Math. subjects)
16 Tool and Die Maker (Jigs and Fixture) SSC pass
17 Tool and Die Maker (Morlud and Dics) SSC pass (with Science subject)
18 Mech. (Machine Tool maintenance ) SSC pass (with Science and Math. subjects)
19 Dental Laboratory Technician SSC pass
1 years course
1 Foundary 8th std. pass
2 Mason (Building Construction) 8th std. pass
3 Pump Operator cum Mechanic SSC pass (with science subject)
4 Architecture Assistant SSC pass (with 40% marks in science & Math Subject)
5 Leather Foot Wear 8th std. pass
6 Bakery and Confectionary SSC pass
7 Dress Making SSC pass
8 Steward SSC pass
9 Craftsman Food Production SSC pass
10 Photography/Digital Photography SSC pass (with Physics and Chemistry subject)
11 Fashion Technology HSC pass
12 Physiotherapy Technician
HSC pass (with Physics, Chemistry and Pridology
subject)
13 Health Sanitary Inspector
HSC pass (with Physics, Chemistry and Pridology
subject)
14 Hospital House Keeping HSC pass
6 months course
1 Data entry operator SSSC pass (with typing in English 20 speed)
2 Institutional House keeping SSC pass
3
Computer Aided Embroidery and
Needle Work SSC pass
4 Front office Assistance SSC pass (Essential English subject)
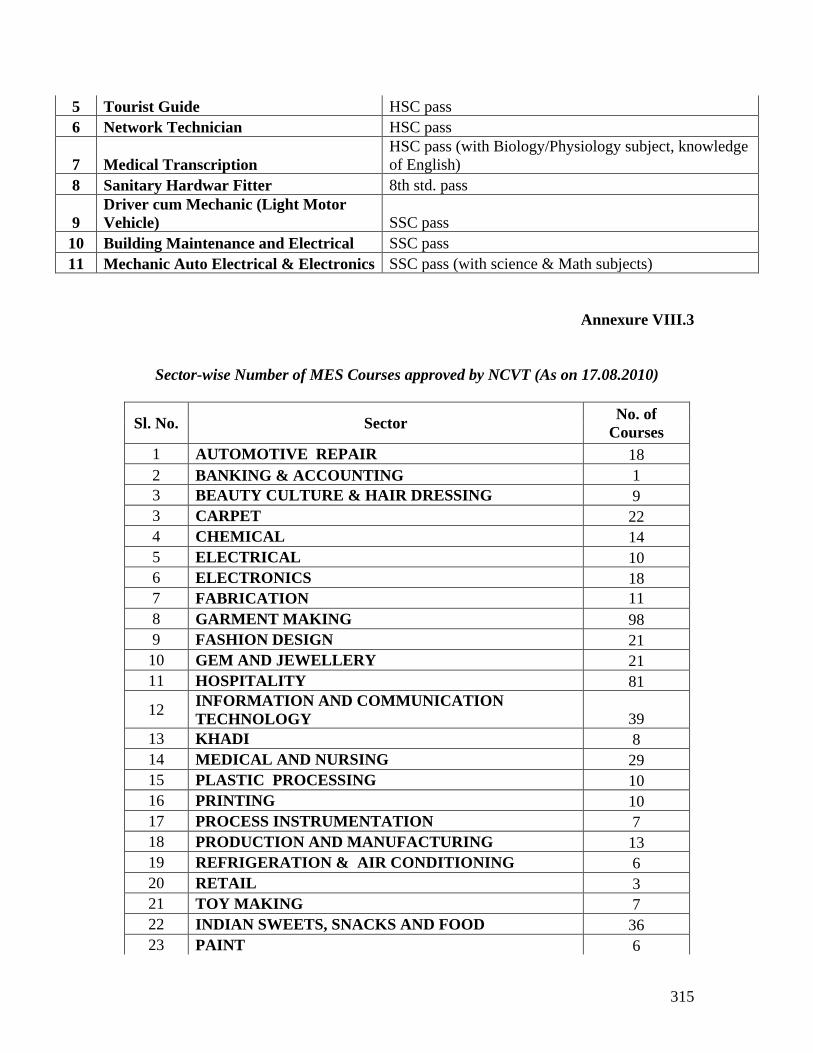
315
5 Tourist Guide HSC pass
6 Network Technician HSC pass
7 Medical Transcription
HSC pass (with Biology/Physiology subject, knowledge
of English)
8 Sanitary Hardwar Fitter 8th std. pass
9
Driver cum Mechanic (Light Motor
Vehicle) SSC pass
10 Building Maintenance and Electrical SSC pass
11 Mechanic Auto Electrical & Electronics SSC pass (with science & Math subjects)
Annexure VIII.3
Sector-wise Number of MES Courses approved by NCVT (As on 17.08.2010)
Sl. No. Sector No. of
Courses
1 AUTOMOTIVE REPAIR 18
2 BANKING & ACCOUNTING 1
3 BEAUTY CULTURE & HAIR DRESSING 9
3 CARPET 22
4 CHEMICAL 14
5 ELECTRICAL 10
6 ELECTRONICS 18
7 FABRICATION 11
8 GARMENT MAKING 98
9 FASHION DESIGN 21
10 GEM AND JEWELLERY 21
11 HOSPITALITY 81
12 INFORMATION AND COMMUNICATION
TECHNOLOGY 39
13 KHADI 8
14 MEDICAL AND NURSING 29
15 PLASTIC PROCESSING 10
16 PRINTING 10
17 PROCESS INSTRUMENTATION 7
18 PRODUCTION AND MANUFACTURING 13
19 REFRIGERATION & AIR CONDITIONING 6
20 RETAIL 3
21 TOY MAKING 7
22 INDIAN SWEETS, SNACKS AND FOOD 36
23 PAINT 6
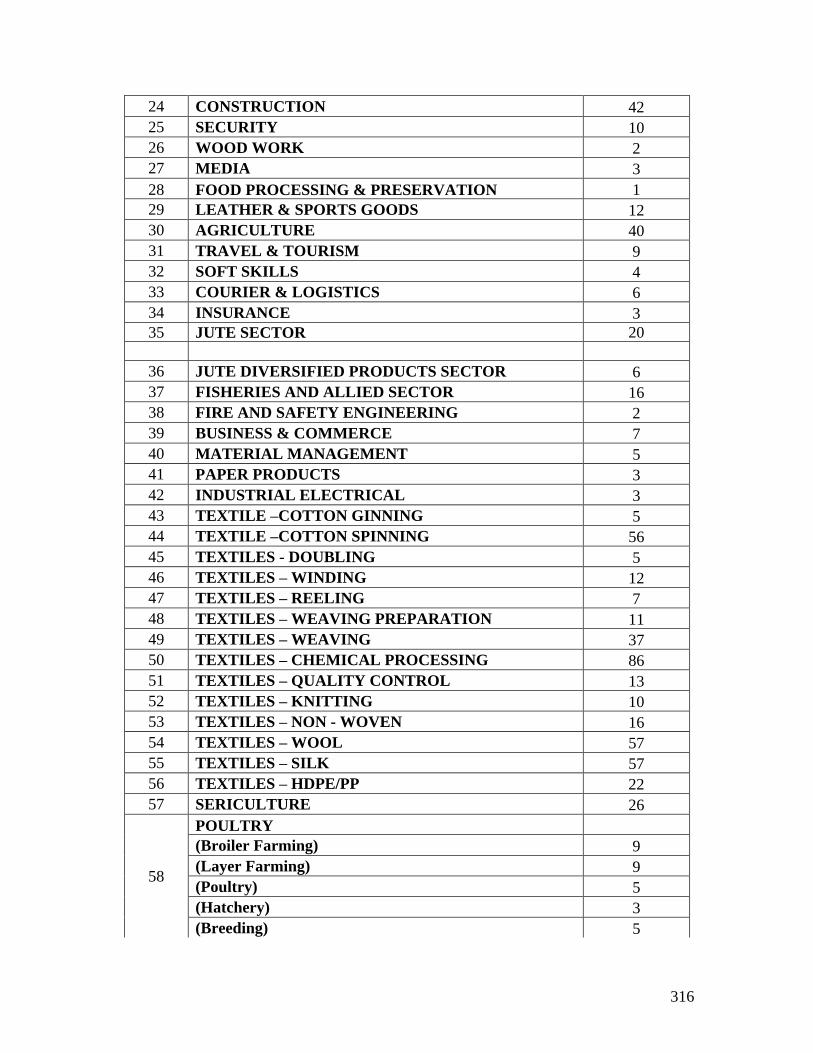
316
24 CONSTRUCTION 42
25 SECURITY 10
26 WOOD WORK 2
27 MEDIA 3
28 FOOD PROCESSING & PRESERVATION 1
29 LEATHER & SPORTS GOODS 12
30 AGRICULTURE 40
31 TRAVEL & TOURISM 9
32 SOFT SKILLS 4
33 COURIER & LOGISTICS 6
34 INSURANCE 3
35 JUTE SECTOR 20
36 JUTE DIVERSIFIED PRODUCTS SECTOR 6
37 FISHERIES AND ALLIED SECTOR 16
38 FIRE AND SAFETY ENGINEERING 2
39 BUSINESS & COMMERCE 7
40 MATERIAL MANAGEMENT 5
41 PAPER PRODUCTS 3
42 INDUSTRIAL ELECTRICAL 3
43 TEXTILE –COTTON GINNING 5
44 TEXTILE –COTTON SPINNING 56
45 TEXTILES - DOUBLING 5
46 TEXTILES – WINDING 12
47 TEXTILES – REELING 7
48 TEXTILES – WEAVING PREPARATION 11
49 TEXTILES – WEAVING 37
50 TEXTILES – CHEMICAL PROCESSING 86
51 TEXTILES – QUALITY CONTROL 13
52 TEXTILES – KNITTING 10
53 TEXTILES – NON - WOVEN 16
54 TEXTILES – WOOL 57
55 TEXTILES – SILK 57
56 TEXTILES – HDPE/PP 22
57 SERICULTURE 26
58
POULTRY
(Broiler Farming) 9
(Layer Farming) 9
(Poultry) 5
(Hatchery) 3
(Breeding) 5
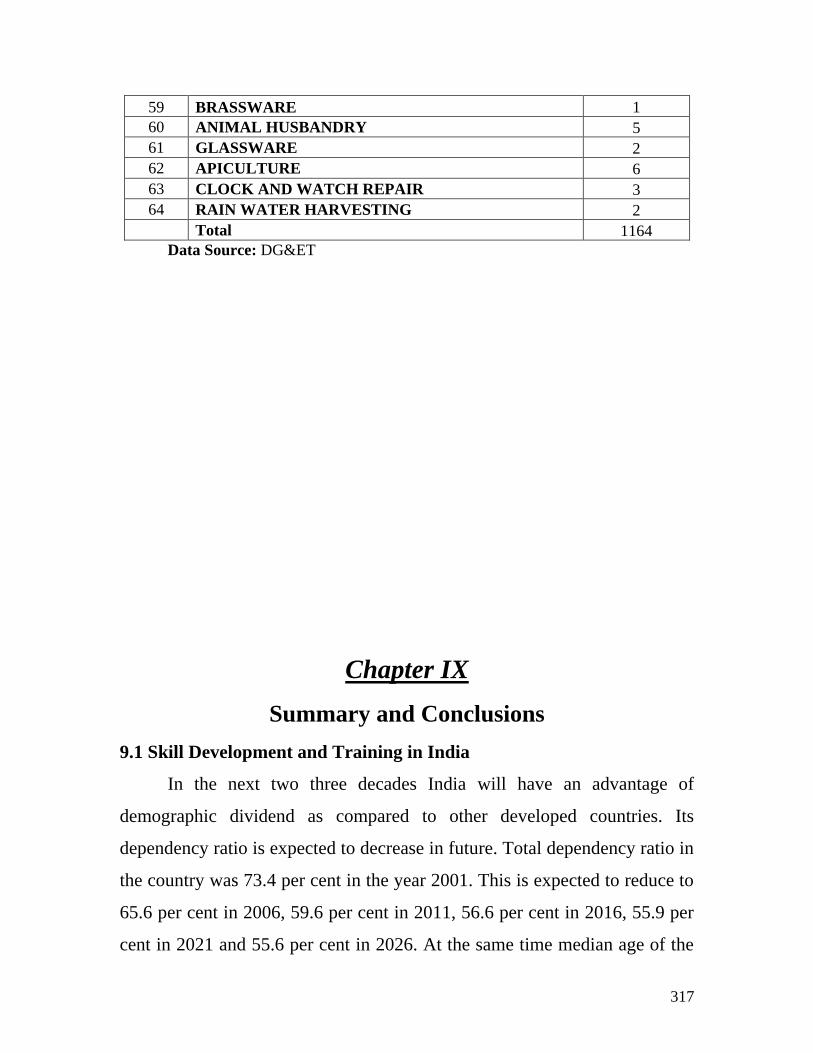
317
59 BRASSWARE 1
60 ANIMAL HUSBANDRY 5
61 GLASSWARE 2
62 APICULTURE 6
63 CLOCK AND WATCH REPAIR 3
64 RAIN WATER HARVESTING 2
Total 1164
Data Source: DG&ET
Chapter IX
Summary and Conclusions
9.1 Skill Development and Training in India
In the next two three decades India will have an advantage of
demographic dividend as compared to other developed countries. Its
dependency ratio is expected to decrease in future. Total dependency ratio in
the country was 73.4 per cent in the year 2001. This is expected to reduce to
65.6 per cent in 2006, 59.6 per cent in 2011, 56.6 per cent in 2016, 55.9 per
cent in 2021 and 55.6 per cent in 2026. At the same time median age of the
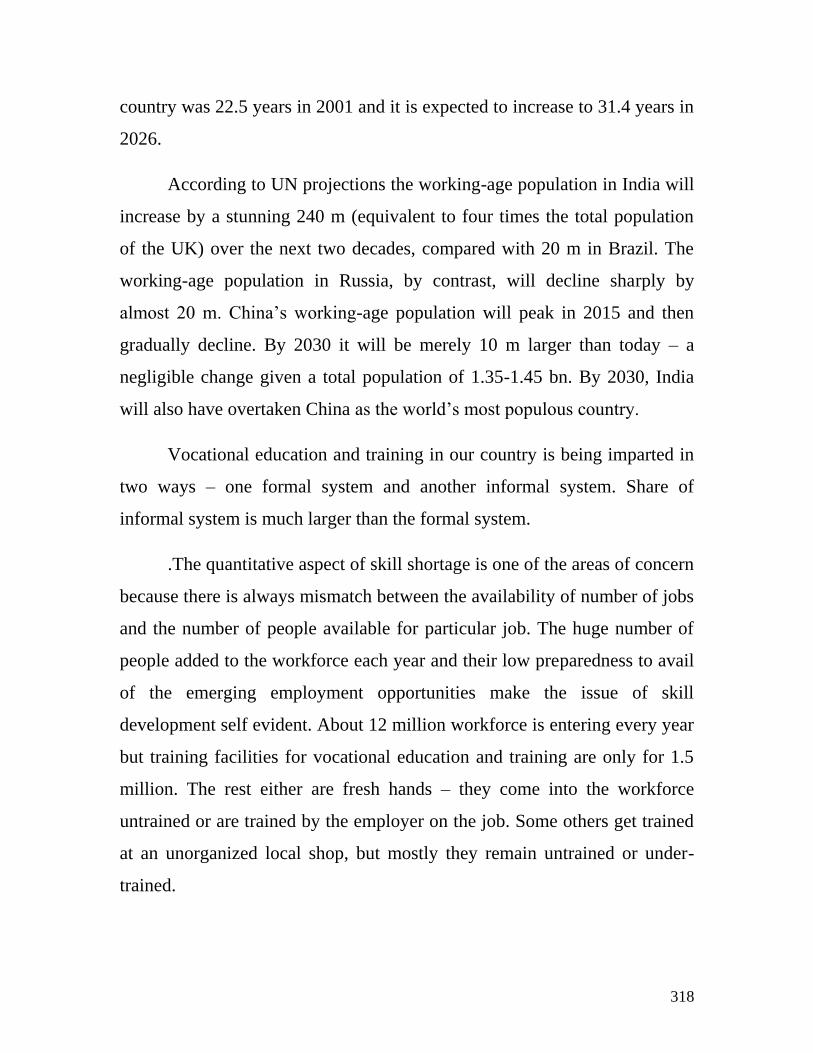
318
country was 22.5 years in 2001 and it is expected to increase to 31.4 years in
2026.
According to UN projections the working-age population in India will
increase by a stunning 240 m (equivalent to four times the total population
of the UK) over the next two decades, compared with 20 m in Brazil. The
working-age population in Russia, by contrast, will decline sharply by
almost 20 m. China‘s working-age population will peak in 2015 and then
gradually decline. By 2030 it will be merely 10 m larger than today – a
negligible change given a total population of 1.35-1.45 bn. By 2030, India
will also have overtaken China as the world‘s most populous country.
Vocational education and training in our country is being imparted in
two ways – one formal system and another informal system. Share of
informal system is much larger than the formal system.
.The quantitative aspect of skill shortage is one of the areas of concern
because there is always mismatch between the availability of number of jobs
and the number of people available for particular job. The huge number of
people added to the workforce each year and their low preparedness to avail
of the emerging employment opportunities make the issue of skill
development self evident. About 12 million workforce is entering every year
but training facilities for vocational education and training are only for 1.5
million. The rest either are fresh hands – they come into the workforce
untrained or are trained by the employer on the job. Some others get trained
at an unorganized local shop, but mostly they remain untrained or under-
trained.
319
For quite some time now concern has been expressed about the
mismatch between the job market‘s requirements on the one hand and the
inputs provided by our education system in general on the other hand. The
quality of technical education which is given in our country is not up to
mark and it is not fulfilling the market requirement.
Prioritization of skill building and vocational training is another
important aspect for consideration. There is an urgent need to identify the
priority areas in selected sections of the labour force to render appropriate
training and skill. The first priority should be given to the new entrants
(from class VIII, IX, X and XI) in the labour force. All these entrants need
gainful employment. The second priority group is the incremental educated
youth, with a high unemployment rate against the national average. Third
priority group is all the other youth who are in the labour force, whether
illiterate or semi literate. The fourth identified section largely comprise of
underemployed working people.
There has to be a drastic shift in the national policy on skill
development with the private sector playing a lead role instead of the
government, as they are the job providers. The government‘s role would
have to change from being a vocational training provider to a partner and
facilitator.
The eleventh five year plan is emphasizing on creating a pool of
skilled personnel in appropriate numbers and skills in line with the
requirements of ultimate users such as industry, trade and services sector.
―Skill development mission" with an outlay of Rs. 22800 crores has been
launched to achieve this goal. The mission would also create a surplus of
320
skilled persons to meet the requirement of other aging economies in the
world.
The mission is to ensure that our supply side responses are moving in
the same way as our demand. These responses should move in the same way
as demand not only in the present but the future also. For this the mission
will involve both public and private sectors in such a way that it is beneficial
to both.
Vocational training is a concurrent subject and both Central
Government and the State Governments share responsibilities. At the
national level, Director General of Employment & Training (DGE&T),
Ministry of Labour is the nodal department for formulating policies, laying
down standards, conducting trade testing and certification, etc. in the field of
vocational training. At the State level, the State government departments are
responsible for vocational training programmes.
9.2 The Study
It is in context that the Government of Bihar has sponsored the study
on ―Assessing the Demand for Skill Sets in Domestic/National and Overseas
Markets by the Year 2025 in Bihar State‖. The IIPA at the request of Labour
Department, Government of Bihar has carried out the study. The objectives
and methodology of the study have been discussed in the following
paragraphs.
9.3 Objectives
13. To estimate the Industry-wise demand of persons with Vocational
Education and Training in Bihar by the years 2009-10, 2014-15, 2019-
20 and 2024-25.
321
14. To estimate the demand of persons with Vocational Training from
ITIs/ITCs of Bihar by the years 200-10, 2014-15, 2019-20 and 2024-
25.
15. Identification of new trades (Skill-sets) having employment potential
in which training should be imparted by the different departments of
the state.
9.4 Methodology
This study is based on the secondary data analysis. In this study our
concern of training is in vocational training, not in high level skills provided
in professional colleges (viz. engineering colleges, medical colleges,
agriculture colleges, polytechnics and other professional colleges) which
should be estimated on the basis of demand by the economy or individuals
(potential trainees). Our concern of vocational training here is to provide the
skills to make them employable whenever the opportunity exists in the state
or outside the state and earn the income which can meet the basic needs of
their families. Millions of the unskilled laborers who are going every year
from Bihar to other developed states should go as skilled workers so that
they can have a better bargaining power.
Keeping in view the surplus labour in the state, ―the demand of
persons to be trained‖ as well as ―requirement of the persons, who should be
trained in vocational skills‖ have been estimated, and for this four exercises
given below have been attempted.
5. Estimating the industry-wise demand of persons with vocational
education and training in the state in the years 2010, 2015, 2020 and
2025.
322
6. Estimating the total number of persons required to be trained in
vocational education and training in the years 2010, 2015, 2020 and
2025.
7. Distributing the demand and requirement of persons with vocational
education and training to be trained in ITIs and ITCs and in other
departments of the state in the years 2010, 2015, 2020 and 2025.
8. Identification of new trades having employment potential in the state.
Methodology adopted in carrying out the above four exercises is given
below in four sub-sections.
9.4.1 Industry-wise Demand for Vocational Educational and Training
9.4.1.1 Demand of persons with vocational training within state
Demand of vocationally trained persons within the state was projected
by two methods:
First Method (Direct Method)
In this method industry-wise employment elasticity (of technical
persons) with respect to GSDP was obtained for the period 1993-94 to 2004-
05. Employment (of technical persons) for the years 1993-94 and 2004-05
was obtained from NSSO surveys and GSDP was obtained from the
department of Statistics, Govt. of Bihar. Industry-wise CAGRs of GSDP for
the periods 2010-15, 2015-20 and 2020-25 were projected on the basis of
past achievements during the period 2000 to 2010, targets of Eleventh Five
Year Plan (2007-12) of the state and future economic agenda of the newly
elected government of Bihar. It was assumed that industry-wise EEs of
technical persons with respect to GSDP would remain more or less same
during the projected period. Then industry-wise employment (of technical
323
persons) was estimated for this period by using the projected EEs and
projected GSDP.
Projected employment of vocationally trained persons was obtained
from the projected employment of technical persons by applying the same
ratio as obtained from the latest survey on Employment and Unemployment
conducted in the year 2004-05. This projected employment of vocationally
trained persons gave the demand of vocationally trained persons within the
state.
Second Method (Indirect Method)
In this method first Industry-wise employment was projected in the
same way as industry-wise employment (of technical persons) has been
projected in the first method. Then projected employment of technical
persons was obtained from the projected total employment by assuming that
the existed share of employment of technical persons to total employment in
the year 2004-05 would be doubled in the year 2024-2025. Further projected
employment of vocationally trained persons was obtained from the projected
employment of technical persons by applying the same ratio as obtained
from the latest survey on Employment and Unemployment conducted in the
year 2004-05. Again this projected employment of vocationally trained
persons gave the estimate of demand of vocationally trained persons within
the state.
9.4.1.2 Demand of persons with vocational training outside the state
There are two major sources which give estimates of the incidence of
migrations from Bihar. The first is the Population Census conducted after
every ten years and the other is the surveys conducted by NSSO. Extent of
migration from Bihar to other states, along with the background (i.e. age,
324
qualification and sex etc.) of migrants and reasons of migrations was
obtained from these two sources. Besides these two official sources, there
are a number of studies on ―Migration from Bihar state‖. Ministry of
External Affairs and the newly constituted Ministry of Overseas Affaires
provide data on International Migration from India to different countries.
Demand of persons with vocational training outside the state was projected
on the basis of the past trend of migration, reasons of migration, and the
demographic dividend of the state.
9.4.2: Estimating the total number of persons required to be trained in
vocational education and training
There are different ways to look at the scene of how many people
ought to be trained. Here we have compared the present status of vocational
training in Bihar with that of other states. We find that the situation in Bihar
is very unsatisfactory as compared to other states. Keeping this fact in view
we fixed up some target year by which Bihar state would achieve the present
status of some state having some similarities to Bihar and is one of the
highest producing students through formal/non-formal vocational training.
Major states having some similarities to Bihar were identified by comparing
the share of employment in agriculture and allied activities in the year 2004-
05.
9.4.3: Demand for Vocationally Trained in ITIs and ITCs
Above two sub-sections (sub-section 9.3.1 and 9.3.2) give the
estimates of students demanded/required to be trained in all the
institutes/departments of the state. Keeping in view the past trend of the
share of students who were admitted in ITIs/ITCs to the total students
admitted in all institutes/departments and the policies of the state
325
government, persons to be trained in ITIs/ITCs for the terminal years were
obtained.
9.4.4: Identification of Trades with Employment Potential in the State
Eleventh Five Year Plan of India has identified 20 growth sectors
having high employment potential in the country. These growth sectors have
employment potential in the state also. The trades in which vocational
training is being provided in the state and have employment potential were
classified, under these growth sectors. It was observed that some of the
growth sectors were not covered by the existing trades. Effort was made to
identify some trades under these left out growth sectors.
The trades in which vocational training is being provided in developed
states (viz. Gujarat, and Maharashtra) and the courses under Modular
Employable Scheme (MES) approved by National Council of Vocational
Training (NCVT) but are not covered in Bihar state were also taken into
consideration. However before including these trades in the list of skill-sets
it was ensured that these trades should have employment potential in the
state. Duration and minimum qualification required for each trade were also
suggested. Scope of employment potential of trades suggested was analysed,
keeping in view the market demand, infrastructure facilities and resources of
the State.
Before finalizing the trades, opinion of the experts published in news
papers and reports were kept in view. Team members have also met some
experts in the area and obtained their views.
9.5 Status of Vocational Education and Training in Bihar
9.5.1 Training Institutes/Centers Under Different Departments
326
There are many training institutes/centres, though not adequate yet,
under different departments in Bihar for imparting the vocational training
programmes to make supply of skilled personnel to the industrial sectors.
The purpose of these institutes is to generate skilled manpower to fulfill the
demand of industries. The skills imparted by ITIs/ITCs are to keep pace with
the technological demands of economy and the expanding universe of
knowledge. There were 45 Govt. ITIs and 207 private Industrial Training
Centers (ITCs) in the state in the year 2010.
Actual intake in different trades of ITIs during the year 2009 was
12,143 out of which 5,769 took admissions in one year courses and the
remaining students 6,374 took admissions in two year courses. Similarly in
ITCs actual intake in different trades during that year was 18,859 out of
which 2,625 took admissions in one year courses and the remaining 16,234
students took admissions in two year courses.
Beside ITI/ITCs there are other departments of the state which
provide vocational and educational training. Actual intake in other
departments during the year 2009 was about 20 thousands. In Education
Department about 7000 students have taken admission in schools for
vocational courses.
.5.2 Status of Vocational Training as per NSSO Survey in 2004-05
9.5.2.1 Vocation Training Received/being Received
In Bihar state, of the persons of age 15-29 years, during the year
2004-05 (i) only 0.3 per cent was receiving formal vocational training, (ii)
0.2 per cent reported to have received formal vocational training and (iii)
another 1.3 percent reported to have received non-formal vocational training.
If we assume that another one per cent of the persons were receiving the
non-formal vocational training than we can say that only 3 per cent of the
327
persons in this age group were either receiving any vocational training or
they have received any vocational training (formal or non-formal), which is
very low percentage. The proportion of the persons who received/being
received the vocational training was lower in the case of females than in the
case of males in both the rural and urban areas. Moreover, as expected, the
proportion was higher in the urban areas than that of rural areas.
9.5.2.2 Field of Formal Vocational Training
Field of training signifies the specific area of the training that a person
has obtained in the past and tallies broadly with the specific trade. In the
2004-05 survey, data in respect of 21 specific areas of trade were collected.
But in case of Bihar state a large proportion (i.e. 44 per cent) of persons
were non-respondent compare to all India rate of 1.5 per cent.
Usually, vocational training has been oriented towards a number of
engineering and technical trades. Though they continue to form the core of
vocational training, its scope was considerably widened to include many
non-engineering trades also. In Bihar state, there was a limited choice for
different trades. In case of males, the most demanded field of training was
found to be ‗Mechanical engineering trades‘ (32 per cent) followed by
‗Electrical and electronic engineering trades‘ (12 per cent) in the rural areas;
and ‗Computer trades‘ (31 per cent) followed by ‗Electrical and electronic
engineering trades‘ (21 per cent) in the urban areas. Among rural female
youths, the demand was a little different. About 21 per cent of them, in the
rural areas, the highest proportion among all fields had formal vocational
training in the field of ‗Computer trades‘. Among the urban female youths,
the most important choices in terms of proportions were: ‗Textile related
trades‘ and ‗Artisan/Craftsman/Handicraft and cottage based production
328
trades‘. Each of these two trades had a share of about 31 per cent of total
urban females in this age-group.
9.5.2.3 Institution of Formal Vocational Training
Some of the major sources from where vocational training could be
received were collected in the survey (2004-05). These sources were
classified into 24 different types of institutes. It is important to note that in
case of Bihar the proportion of non-respondents (i.e.44 per cent) was very
large. Beside this about 20 per cent of the respondents in the state reported
their institute of training as ‗Other institutes‘.
In Bihar state Industrial training institutes (ITIs)/ Industrial training
centers (ITCs) played the major role in providing training to male youths.
The institutes of ‗Tailoring, embroidery and stitch craft‘ and
‗Handloom/handicraft design training centers/KVIC‘ together played the
major role in providing training to female youths.
As compared to Bihar state, at all India level Industrial training
institutes (ITIs)/ Industrial training centers (ITCs), recognized Motor driving
schools, Schools offering vocational courses, Polytechnics, Institutes run by
Companies/Corporations, UGC together played the major role in providing
training to male youths. The Craft institutes, Industrial training institutes
(ITIs)/ Industrial training centers (ITCs), Schools offering vocational
courses, Nursing institutes, Hospital and medical training institutes,
Institutes run by Companies/Corporations and Nursery teacher‘s training
institutes together played the major role in providing training to female
youths in the country.
329
9.6 Estimating the Demand of persons with vocational training in Bihar
9.6.1 Demand of persons with vocational training within state
Demand of persons in the economy is considered as the persons who
are employed by different industries in the economy. Projected demand of
persons with vocational skills would be the number of vocationally trained
persons who would be getting employment in these industries. It was
obtained by two different methods. In the first method, we projected the
demand of persons with technical skills, using the past employment
elasticity of technical persons with respect to GSDP. In the second method,
first we projected the demand of total persons, using the past employment
elasticity of total employment with respect to GSDP and then separated the
share of technical persons from the total employment. ‗Total employment‘
includes ‗employment with technical skills‘ and ‗employment with no
technical skills‘. In both the methods share of vocationally trained persons
was obtained from the projected values of technical persons.
First Method:
It has been observed that in the year 2005, 1.33 lakhs of persons with
vocational training were employed in the state which would be increasing to
about 6 lakhs in the year 2025. In other words there was a demand of 1.33
lakhs persons with vocational training in the year 2005 in the state, which
would be increasing to about 6 lakhs in the year 2025.
Second Method
It has been estimated that in the year 2005, 1.33 lakhs of persons with
vocational training were employed in the state which would be increasing to
330
about 9 lakhs in the year 2025. In other words there was a demand of 1.33
lakhs persons with vocational training in the year 2005 in the state, which
would be increasing to about 9 lakhs in the year 2025.
Comparison of the estimates by two methods
We have estimated above the demand of persons with vocational skills
within the state by two methods. As per the first method there was a demand
of 1.33 lakhs persons with vocational training in the year 2005 in the state,
which would be increasing to about 6 lakhs in the year 2025. As per the
second method there was a demand of 1.33 lakhs persons with vocational
training in the year 2005 in the state, which would be increasing to about 9
lakhs in the year 2025.However out of the two methods second method was
considered to be better than the first method. In the second method we have
assumed that share of personnel employed with technical skills would be
doubled during the period 2010 to 2025.
9.6.2 Demand of persons who have passed ITIs/ITCs within the state
In the above section we have estimated the demand of persons with
vocational skills within the state by two methods. It includes the demand of
ITIs as well as from other departments. From this we have estimated the
demand of persons within the state who have passed out ITIs/ITCs. As per
the intake data of ITIs/ITCs and other departments of the year 2009,
received from the department of labour resources, government of Bihar,
share of ITIs/ITCs to total vocationally trained persons having diploma or
certificate (below graduate) was about 53 per cent. It is assumed that this
ratio would continue in the future years also.
As per the first method, demand of persons with I.T.Is/I.T.Cs would increase
from 0.7 lakh in the year 2005 to 3.2 lakhs in the year 2025. As per the
331
second method, demand of persons with vocational skills would increase
from 0.7 lakhs in the year 2005 to 4.8 lakhs in the year 2025.
9.6.3 Out of State Demand for persons from Bihar with Vocational
Skills
As per 2001 Population Census, Bihari migrants in different states of
India whose place of last residence was Bihar were about 22 lakhs. Duration
of these migrants from Bihar to other states may vary from 0 to 9 years. In
other words, average numbers of out-migrants per year from Bihar to other
states are about 2.2 lakhs. As per NSSO estimates it is observed that 56.5 per
cent of these migrants (males and females combined) are migrating for
employment related activities. In other words, out of 2.20 lakhs of out-
migrants, 1.25 lakhs are migrating per year to other states of India for
employment related activities.
Even if we go by conservative estimates, out of 1.25 lakhs economic
labour migrants per year from Bihar about 12,500 (i.e. 10 per cent of out-
migrants) may be imparted vocational training in the state. In other words
there would be an additional demand of 12,500 per year in the state for
vocationally trained persons. If we assume that 50 per cent of these migrants
would be those who have completed their education from ITIs/ITCs, then we
can say that there would be an additional demand of 6,250 per year for
ITIs/ITCs trained persons.
Year-wise labour outflows from India to different countries of the
world during 2004 to 2009 shows that about 6 lakhs persons per year
migrated to other countries. Main destination countries of these migrants are
Saudi Arabia, UAE, Oman, Kuwait and Bahrain. Looking at the past trend
of out-migration, one may argue that during next two decades their number
332
would increase further. State-wise out-migrants to different countries shows
that in the year 2009, out of 6.1 lakhs Indian out-migrants to different
countries, about 50,000 (i.e. more than 8%) were from Bihar state, which is
at par with the population share of the state. In the previous five years also
about same percentage of total out migrants were from Bihar.
A large number of technicians and skilled workers also migrate from
India to other countries. As per the Ministry of External Affairs,
Government of India, (Presently Ministry of Overseas Indian Affairs) during
the past three year period of 1988-90, labour outflows from India to different
countries was about 4.5 lakhs.
Out of 4.5 lakhs, 1.6 lakhs persons (38 per cent) were with vocational skills.
These vocational skills included carpenter, mason, driver, electrician,
Mechanic (A/c), tailor, technician, welder, fixer/fabricator, plumber, painter
and operator.
Though this data is quite old, one may argue that this ratio of vocationally
trained persons to total labour outflow is not going to decrease because
nowadays more skilled workers are in demand as compared to unskilled
persons. Even if apply the same old ratio we can say that out of 6 lakh
persons who are migrating per year from India to other countries, about 2
lakh persons (33 per cent of total) would be with vocational training. If we
assume the existing trend to continue, there would be a demand of more than
2 lakh persons per year of vocationally trained persons from India to other
countries.
In the total out-migration from India, Bihar state‘s share of migration
is about eight per cent. One may argue that, share of skilled workers who
would migrate from Bihar would be less as compared to All India. So even if
we go by conservative estimates, out of 2 lakh persons with vocational skills
333
who would have demand in other countries, 8,000 (i.e. 4 per cent of 2 lakhs)
would be from Bihar. Further, out of 8000 skilled persons of the state 4000
persons (i.e. 4000) may be from ITI/ITCs and remaining 4000 persons (i.e.
50 per cent) may be trained by institutes/centers run by other departments.
9.6.4 Projected Estimates of shortages and surpluses of ITIs/ITCs
passed in Bihar
Estimates of shortages and surpluses of ―ITI/ITC passed‖ (under the
Labour Department, Government of Bihar) as well as of the persons who
would pass these skills from the ―Other Departments‖ of the state can be
projected. But because of the non-availability of data of pass out students
from the ―Other Departments‖ we could do this exercise for ―ITI/ITC‖ only.
9.6.4.1 Additional Demand on Yearly Basis
First additional demand on five yearly basis was obtained. Then this
additional demand was converted into yearly basis. Additional demand of
ITIs/ITCs within the state for the period 2010-15 was obtained by taking the
difference of demand during the years 2015 and 2010. Similarly, estimates
of additional demand for other two periods (viz. 2015-20 and 2020-25) were
obtained. Secondly, additional demand has been obtained directly for ‗other
states of India‘ and ‗other countries of the world‘. Third important point
worth mentioning is that total demand within the state was obtained by two
different methods, details of which have been discussed in chapter VI. So
the additional demand in the state also has two estimates. First estimate
relate to first method and second estimate relate to second method discussed
in the text.
It is observed that as per the first estimate, additional demand of ITIs/ITCs
was 85,300 during the period 2010-15, which would increase to 179,300
during the period 2020-25. As per the second estimate, additional demand of
334
ITIs/ITCs was 107,300 during the period 2010-15 which may increase to
245,300 during the period 2020-25.
9.6.4.2 Additional Supply on Yearly Basis
Actual intake of ITIs/ITCs in Bihar during the year was about 31
thousands. Out turn data of these ITIs/ITCs was required to get an idea of
pass out rate of these students. This type of data was not available for Bihar
state. But this type of data was available for Kerala State. During the last
three years (viz. 2005, 2006 and 2007) total intake of ITIs/ITC students was
71,115. Out of 71,115 students appeared in different trades, 43,355 had
passed. This gives a pass out rate of 59 per cent in Kerala state.
If we apply the same pass out rate to 31,000 students who appear in
different trades in ITIs/ITCs of Bihar state than about 18 thousand students
are passing out every year. This number gives an additional supply of
ITIs/ITCs per year.
9.6.4.3 Shortages and Surpluses of ITIs/ITCs on Yearly Basis:
First Method
With the comparison of additional demand and additional supply, it is
observed that undoubtedly there was a small surplus of about 1700
ITIs/ITCs persons in the year 2010, but if the existing trend of admissions
continues and there is no change in the intake capacity of ITIs/ITCs in the
state than there would be an acute shortage of ITI/ITC persons in the year
2025. This shortage would be of the order of 3,300 persons in the year 2015,
which would increase to 23,300 persons in the year 2025.
Second Method
As per this method it is estimated that, in the year 2010 there was a
shortage of 1300 ITIs/ITCs passed in the state. If the existing trend of passed
335
out continues, and there is no change in the intake capacity of ITIs/ITCs in
the state then there would be a shortage of about 6300 persons in the year
2015 and this shortage would further increase to 42300 in the year 2025.
9.7 Estimating the requirement of Vocational Education and Training
in Bihar
Here we have fixed up some target years by which Bihar state should
achieve the present level of vocational training of some other state. However
the targeted states should have
(v) some similarities to Bihar state and
(vi) a high level of vocational education and training.
Five steps involved for estimating the requirement of vocational
education and training in this method are discussed below
Step I: Selecting the states with some similarities to Bihar and having
high level of Vocational Education and Training.
Taking the share of employment in agriculture and allied activities as
a similarity among the states, there are four states viz. Asham (66 per cent),
Chhattisgarh (75 per cent), Madhya Pradesh (67 per cent) and Orissa (63 per
cent) which have percentage employment in ―Agriculture and allied
activities‖ in the range of ±10 per cent to that of Bihar state (73 per cent).
Step II: Fixing the Targets of Vocational Education and Training for
Bihar state
Among the four states having employment in agriculture and allied
activities close to that of Bihar, Chhattisgarh (10.4 per cent), Madhya
Pradesh (20.7 per cent) and Orissa (10.1 per cent) have much higher
percentage of persons in the age-group of 15-29 years who have received or
336
were receiving any vocational training as compared to Bihar state (1.8 per
cent) in the year 2005. Keeping this fact in view we have assumed that
following two targets for Bihar which can be achieved with some efforts by
the state government.
(v) Bihar can achieve the target of 10 per cent persons in the age-group of
15-29 years who would have received or would be receiving the
vocational education and training by the year 2020. This is the present
level of Chhattisgarh and Orissa states.
(vi) Bihar can achieve the target of 20 per cent persons in the age-group
of 15-29 years who would have received or would be receiving the
vocational education and training by the year 2030. This is the
present level of Madhya Pradesh state.
Step III: Projecting the Persons in the age-group 15-29 years who would
require Vocational Training
Total persons who require vocational education and training have
been obtained by applying the percentage of persons (as per the targets fixed
above) who require vocational training to the total projected population in
different years. It has been estimated that if the state achieves the proposed
targets then the number of persons who require vocational education and
training would increase about ten times in the year 2025 (46.6 lakhs) as
compared to the number of persons who were getting training in the year
2005 (4.2 lakhs).
Step IV: Distribution of persons who require Vocational Training by
broad sectors in different years
As discussed above about 30 per cent of the persons were getting the
training from formal system of training in the state, in the year 2005.
337
Remaining 70 per cent of the persons were getting their training from the
informal system of training. If the existing ratios of formal and informal
system are applied to the total persons required to be trained in different
years than the distribution of the total persons by formal and informal
system was achieved.
It is estimated that in formal system their number would increase from 1.2
lakhs to 14.0 lakhs and in informal system their number would increase from
2.9 lakhs to 32.6 lakhs during the period 2005 to 2025.
Step V: Distribution of persons who would require vocational training
from ITIs/ITCs and other institutions/departments
As discussed above in the year 2009, about 53 percent of the total
intake was from the ITIs/ITCs. During the last five years (i.e. 2005 to 2010)
there has been huge expansion of ITIs/ITCs in the state. The share of
ITIs/ITCs in the year 2010 was quite large and it may be assumed that the
existing percentage of ITIs/ITCs would be stabilized and would remain same
in the future years also. Applying this percentage to the total number of
persons who would get the training from formal system, we would get
required number of persons to be trained in ITIs/ITCs in different years.
It is estimated that their number would increase from about 0.7 lakh in
the year 2005 to 7.4 lakhs in the year 2025. Similarly, number of persons
who would require vocational training from institutions/departments other
than ITIs/ITCs would increase from 0.6 lakh in the year 2005 to 6.6 lakhs in
the year 2025.
338
9.8: Identification of Trades in Bihar
9.8.1: Methodology for Identification of Trades
Resources of Bihar state gave an idea about the areas of employment
that should be targeted in future. In turn it also gave an idea of the trades
which will be demanded. Planning Commission, Government of India has
identified 20 Growth Sectors which have employment potential in the
country. While doing this exercise we have kept in view the Growth Sectors
identified by Planning Commission, and discussed the matter with officers
of various departments of States and Centre. Officials of industries and other
offices located at Delhi viz. FICCI, Planning Commission and DGE&T also
gave an idea about the high growth sectors where employment could be
generated and new trades could be introduced or vice versa. Reports, papers
and articles published by different organizations viz. DGE&T, IAMR,
Department of Industries, Government of Bihar, IGNOU were also
consulted. It was also important to know about the long duration trades (one
year and more duration) and short duration trades (less than one year
duration) which are taught in ITIs/ITCs and other Institutions/Departments
of Bihar . We also, consulted the reports of labour departments of two
developed states viz. Maharashtra and Gujarat for knowing the trades which
are at this moment covered by these developed states but are not available in
the state of Bihar and have employment potential in the state of Bihar.
9.8.2 Sectors having concentration of Trades in Future
Vocationally trained persons in Bihar will have their demand within
the state as well as outside the state. Keeping this fact in mind, sectors and
trades in demand at all India level as well as Bihar has been discussed.
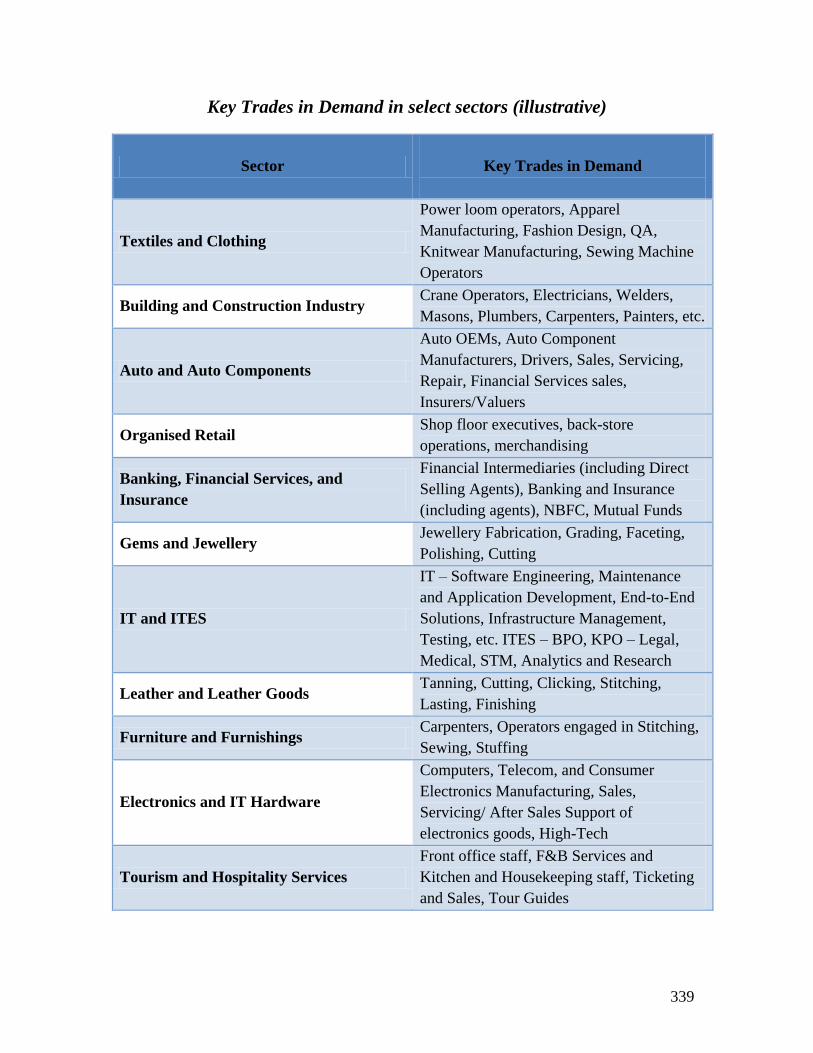
339
Key Trades in Demand in select sectors (illustrative)
Sector
Key Trades in Demand
Textiles and Clothing
Power loom operators, Apparel
Manufacturing, Fashion Design, QA,
Knitwear Manufacturing, Sewing Machine
Operators
Building and Construction Industry Crane Operators, Electricians, Welders,
Masons, Plumbers, Carpenters, Painters, etc.
Auto and Auto Components
Auto OEMs, Auto Component
Manufacturers, Drivers, Sales, Servicing,
Repair, Financial Services sales,
Insurers/Valuers
Organised Retail Shop floor executives, back-store
operations, merchandising
Banking, Financial Services, and
Insurance
Financial Intermediaries (including Direct
Selling Agents), Banking and Insurance
(including agents), NBFC, Mutual Funds
Gems and Jewellery Jewellery Fabrication, Grading, Faceting,
Polishing, Cutting
IT and ITES
IT – Software Engineering, Maintenance
and Application Development, End-to-End
Solutions, Infrastructure Management,
Testing, etc. ITES – BPO, KPO – Legal,
Medical, STM, Analytics and Research
Leather and Leather Goods Tanning, Cutting, Clicking, Stitching,
Lasting, Finishing
Furniture and Furnishings Carpenters, Operators engaged in Stitching,
Sewing, Stuffing
Electronics and IT Hardware
Computers, Telecom, and Consumer
Electronics Manufacturing, Sales,
Servicing/ After Sales Support of
electronics goods, High-Tech
Tourism and Hospitality Services
Front office staff, F&B Services and
Kitchen and Housekeeping staff, Ticketing
and Sales, Tour Guides
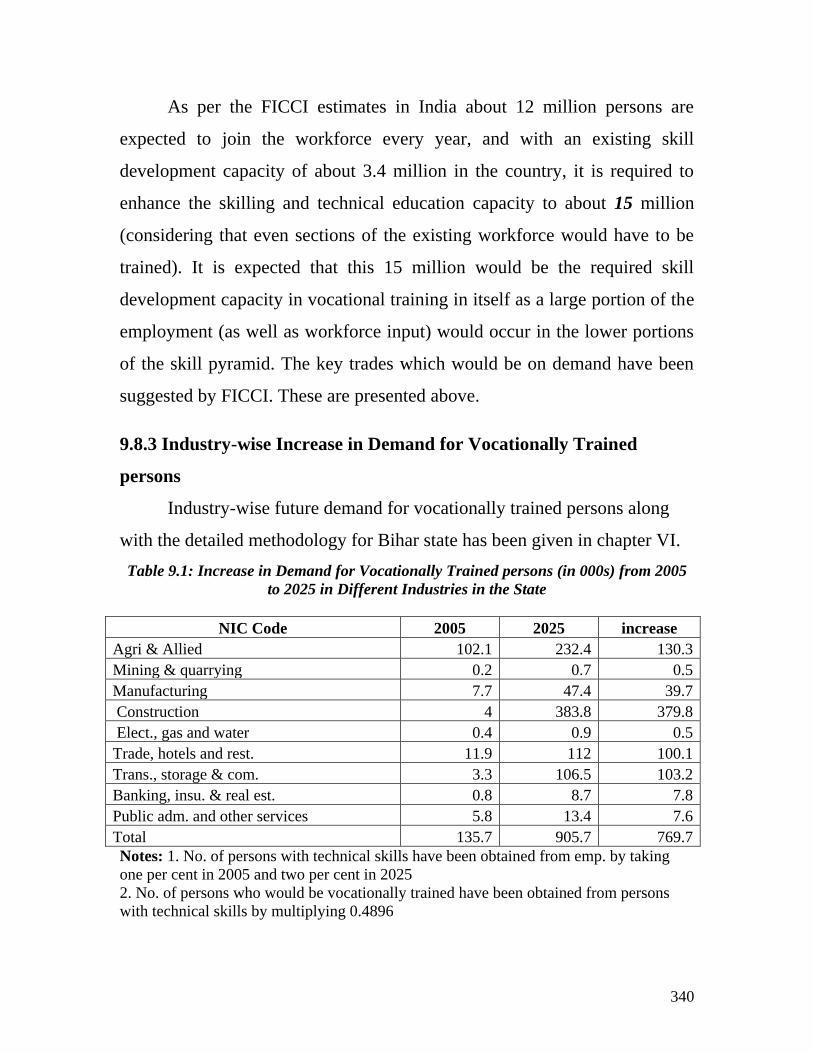
340
As per the FICCI estimates in India about 12 million persons are
expected to join the workforce every year, and with an existing skill
development capacity of about 3.4 million in the country, it is required to
enhance the skilling and technical education capacity to about 15 million
(considering that even sections of the existing workforce would have to be
trained). It is expected that this 15 million would be the required skill
development capacity in vocational training in itself as a large portion of the
employment (as well as workforce input) would occur in the lower portions
of the skill pyramid. The key trades which would be on demand have been
suggested by FICCI. These are presented above.
9.8.3 Industry-wise Increase in Demand for Vocationally Trained
persons
Industry-wise future demand for vocationally trained persons along
with the detailed methodology for Bihar state has been given in chapter VI.
Table 9.1: Increase in Demand for Vocationally Trained persons (in 000s) from 2005
to 2025 in Different Industries in the State
NIC Code 2005 2025 increase
Agri & Allied 102.1 232.4 130.3
Mining & quarrying 0.2 0.7 0.5
Manufacturing 7.7 47.4 39.7
Construction 4 383.8 379.8
Elect., gas and water 0.4 0.9 0.5
Trade, hotels and rest. 11.9 112 100.1
Trans., storage & com. 3.3 106.5 103.2
Banking, insu. & real est. 0.8 8.7 7.8
Public adm. and other services 5.8 13.4 7.6
Total 135.7 905.7 769.7
Notes: 1. No. of persons with technical skills have been obtained from emp. by taking
one per cent in 2005 and two per cent in 2025
2. No. of persons who would be vocationally trained have been obtained from persons
with technical skills by multiplying 0.4896
341
It is estimated that in the coming years, there would be huge demand
of vocationally trained persons in the state. It would increase from about 1.3
lakhs in the year 2005 to about 9.0 lakhs in the year 2025. Thus there would
be an increase of 7.7 lakhs during this period (Table 9.1). Highest increase
would be in construction sector (3.8 lakhs) followed by agriculture and
allied activities (1.3 lakhs), transport storage and communication (1.0 lacs)
and trade hotels and restaurants (1.0 lakhs).
9.8.4 Identification of Skill-Sets having Future Demand in the State
Keeping the above facts in view and having detailed discussions with
various officials and going through different publications the study team has
suggested the introduction of some new trades of long duration and short
duration for Bihar State. Trades names along with the duration which may
be introduced in the state are given in the previous chapter.
REFERENCES
Archana Rai & Peerzada Abrar (2010), ―India set to emerge as social innovation hub‖,
Economy Times, November 11, 2010, Delhi.
Arora, Sant Lal (2003), Promotion of Self –employment in India, IAMR, New Delhi
Arora, Sant Lal and V. K. Saxena (2004), Sector- wise Trends of Productivity in India, Working
Paper no. 3/2003, IAMR, New Delhi.
342
Chaubey P.K.(2000), ―Poverty‖ in Two Years of Market Fundamentalism, Alternative Economic
Survey 1998-2000, India, Alternative Survey Group, New-Delhi.
Chaubey P.K.(2000), ―Youth and Unemployment in Perspective: The Indian Context‖, in Indian
Journal of Labour Economics, Vol.43, No.4, October-December, 2000.
Chaubey P.K.(2001), ―Employment-Unemployment‖ in Second Generation Reforms: Delusion of
Development, Alternative Economic Survey 2000-01, India, Alternative Survey Group,
New-Delhi.
Chaubey P.K.(2003), ―Human Development‖ in Alternative Survey Group 2002-03, New-Delhi.
CSO (1983), Economic Census 1980: All India Report, CSO, New Delhi
CSO (1987) Revised National Industrial Classification of All Economic Activities: 1987, CSO,
New Delhi.
CSO (1998), National Industrial Classification (All Economic Activities) 1998, CSO, New Delhi.
CSO (1999), New Series On National Accounts Statistics, Base year1993-94, ..ibid….
CSO (2005), ―Economic Census 2005: All India report‖, CSO, New Delhi.
Ghosh, Ahona (2010), ―Rural Server: It‟s driving IT training in rural and semi-urban
areas‖, Economic Times, November 27, 2010, Delhi.
Ghosh, Ahona (2010), “Hands on the Wheel”, Economy Times, November 26, 2010,
New Delhi.
Ghosh, Ahona (2010), ―Licence to Skill‖, Economic Times, November 25, 2010, New
Delhi.
Ghosh, Ahona (2010), ―Built To Scale‖, Economic Times, November 25, 2010, New
Delhi.
Government of Bihar, Department of Labour Resource (2010).
Government of Bihar, Department of Industries, ―Leather and Allied Industries in Bihar – An
Overview and Prospects‖, Patna.
Government of Bihar, Department of Industries, ―Bihar: A Land of Immense Opportunities for
Food Processing Industry‖, Patna.
Government of Bihar, Industries Department, ―A Presentation on Leather Industries in Bihar and
Its potential‖, Patna.
Government of Bihar, Planning and Development Department (2008), ― Approach to 11th Five
Year Plan (Bihar): Vision for Accelerated Inclusive Growth‖, Patna.
Government of Bihar, Directorate of Statistics and Evaluation (2003), ―Bihar at a Glance, 2003‖,
Patna.
343
Government of Bihar, Directorate of Statistics and Evaluation (2005), ―Bihar at a Glance, 2005‖,
Patna.
Government of Bihar, Directorate of Statistics and Evaluation (2007), ―Bihar at a Glance, 2007‖,
Patna.
Government of Bihar, Directorate of Statistics and Evaluation (2008), ―Bihar at a Glance, 2008‖,
Patna.
Government of India, Ministry of HRD, Selected Educational Statistics, 2004-05 and 2006-07.
Government of India, Ministry of Health and Family Planning, National Family and Health
Survey (NFHS)-III, 2005-06.
Government of India, Ministry of Labour (1999), Report of the Task Force on Social Security,
Ministry of Labour, New Delhi
Government of India, Ministry of Labour (2002) Report of the National Commission on Labour,
Vol II (Conclusions and Recommendations), Ministry of Labour, New Delhi.
Government of India, Ministry of Labour, Director General of Employment and Training (2002),
Employment Review – 1998, DGE&T, New Delhi.
Govt. of India, Planning Commission (2002), Report of the Special Group on Targeting Ten
Million Employment Opportunities per year over the Tenth Plan Period , Planning
Commission, Govt. of India, New Delhi.
Government of India, Planning Commission (2008), ―Eleventh Five Year Plan: 2007-2012,
Volume I, Inclusive Growth‖, New Delhi.
Gupta, S.P. (2006), Globalisation, Economic Reforms and Employment „Strategy in India,
Academic Foundation, New Delhi.
ILO (1994), The Urban Informal Sector in Asia: Policies and Strategies, Geneva.
Indian Bureau of Mines, Statistical Pocket Book, India (2003), Indian Bureau of Mines, Nagpur.
Infrastructure Leasing and Financial Services (2009), ―Food Processing in Bihar, The Road
Ahead‖ ILFS, Bombay.
Institute of Applied Manpower Research (2002), Manpower Profile India: Year Book 2002,
Concept Publishing Company, New Delhi
Institute of Applied Manpower Research (2007), Manpower Profile India; Year Book 2007,
Manak Publications, Delhi
344
Institute for Competitiveness, Gurgaon (2010),―States can harness their population to
grow: Policies that make productive use of available resources are critical”),
Economy Times, November 27, 2010, New Delhi.
Kasturi, C.S. (2010), ―ITI alumni launch unique job scheme‖, The Hindustan Times,
October 29, 2010, New Delhi.
Kishore, Avinash (2004): ―Understanding Agrarian Impression in Bihar,‖ Economic and Political
Weekly, July 31, 2010.
Kundu, A, N. Lalitha, and Sant Lal Arora, (2001), “Growth Dynamics of Informal Manufacturing
Sector in Urban India: An Analysis of Interdependencies”, in Kundu, A. and Sharma, A.
N. (eds.), Informal Sector in India: Perspectives and Policies, IHD and IAMR, New
Delhi.
Kundu, A, N. Thakor and Sant Lal Arora (2004), “Trends and composition of Informal Sector :
An Analysis in the Context of Develping a Comprehensive Social Security System”, in
Shah, Jayshree and R.G. Nambiar (eds), Informal Sector in India : Pathways to viability
and Growth, Sardar Patel Institute for Economic and Social Research, Ahmedabad
Maira, Arun (2010), ―Jobs, local demand pillars of manufacturing policy‖, Economic
Times, November 26, 2010, Delhi.
National Commission for Enterprises in the Unorganised Sector (2006), Social Security for
unorganised Workers, NCEUS, New Delhi.
National Commission for Enterprises in the Unorganised Sector (2007), Report on Conditions of
Work and Promotion of Livelihoods in the Unorganised Sector, NCEUS, New Delhi.
NSSO (2006), Employment and Unemployment Situation in India, 2004-05 (Part I). NSS 61st
Round (July 2004-June 2005), Report No. 515 (61/10/1), NSSO, New Delhi
NSSO (2006), Employment and Unemployment Situation in India, 2004-05 (Part II). NSS 61st
Round (July 2004-June 2005), Report No. 515 (61/10/1), NSSO, New Delhi.
NSSO (2001), Employment and Unemployment Situation in India, 1999-2000 (Part I). NSS 55th
Round (July 1999- June 2000), Report No. 458(55/10/2) NSSO, New Delhi.
NSSO (2001), Informal Sector in India, 1999-2000 Salient Features. NSS 55th Round (July 1999-
June 2000), Report No. 459(55/2.0/2) NSSO, New Delhi.
NSSO (2001), Employment and Unemployment Situation in India, 1999-2000 (Part II) NSS 55th
Round (July 1999-June 2000), Report No. 458 (55/10/2) NSSO, New Delhi.
345
NSSO (1995), Employment and Unemployment Situation in India: 1993-94 NSSO 50th Round
(July 1993- June 1994)…ibid…
NSSO (1990), Employment and Unemployment Situation in India: 1978 NSSO 43rd Round June
(July 1987-June 1988)…ibid…
Rawal, U.D. (2010), ―Back to village‖, The Hindustan Times, November 23, 2010, New
Delhi.
Ramachandran H. and Sant Lal Arora (2004), ―Employment‖ in Magnifying Mal-Development,
Alternative Economic Survey, India, Alternative Survey Group, New-Delhi.
Registrar General and Census Commissioner, India (2003), Census of India 2001, Series I, India:
Tables on Houses, Household Amenities and Assets, Registrar General and Census
Commissioner, New Delhi.
Registrar General and Census Commissioner, India (2004a), Census of India 2001, Series – I,
India: Part II-B (i), Volume II, Primary Census Abstract,…ibid…
Registrar General and Census Commissioner, India (2004b), Census of India 2001, Series I,
India: Final Population Tables…ibid…
Registrar General and Census Commissioner, India, (1987), Census of India 1981: Series -1,
India Part III B General Economic Tables, Registrar General and Census Commissioner,
New Delhi.
Registrar General and Census Commissioner, India,(2006), ―State-wise Projected Population‖,
2006, Registrar General and Census Commissioner, New Delhi.
Vikas, K. (2010), ―The Rural Jobs Rush‖, Economy Times, November 18, 2010, Delhi.
Writankar, M. and Basu, B.D.(2010) ―Social sector draws GenY‖, Economy Times,
November 26, 2010, Delhi.

346