Embed Size (px)
Citation preview
http://inp.sagepub.com/Studies in Indian Politics
http://inp.sagepub.com/content/2/1/1The online version of this article can be found at:
DOI: 10.1177/2321023014526023
2014 2: 1Studies in Indian PoliticsSrikrishna Ayyangar and Suraj Jacob
Studying the Indian Legislature: What does Question Hour Reveal?
Published by:
http://www.sagepublications.com
On behalf of:
LOKNITI, Centre For The Study Of Developing Societies (CSDS)
can be found at:Studies in Indian PoliticsAdditional services and information for
http://inp.sagepub.com/cgi/alertsEmail Alerts:
http://inp.sagepub.com/subscriptionsSubscriptions:
http://www.sagepub.com/journalsReprints.navReprints:
http://www.sagepub.com/journalsPermissions.navPermissions:
http://inp.sagepub.com/content/2/1/1.refs.htmlCitations:
What is This?
- Jun 2, 2014Version of Record >>
at Istanbul Universitesi on November 4, 2014inp.sagepub.comDownloaded from at Istanbul Universitesi on November 4, 2014inp.sagepub.comDownloaded from
Military-Madrasa-Mullah Complex 1
India Quarterly, 66, 2 (2010): 133–149
A Global Threat 1Article
Studying the Indian Legislature: What does Question Hour Reveal?
Srikrishna AyyangarSuraj Jacob
Abstract
This article explores legislator behaviour during the Question Hour in the lower house of India’s parliament (the Lok Sabha) over a 30-year period (1980–2009). It establishes that there is consider-able variation in the volume of legislator activity, with some Members of Parliament (MPs) remaining silent throughout their tenures (even as opposition MPs over full Lok Sabha terms), while others use the Question Hour much more effectively. Surprisingly, the activity of government backbenchers is only a little behind that of opposition MPs. The article constructs stylized facts regarding the relationship of three sets of covariates with the number of parliamentary questions asked by legislators: personal characteristics of MPs, legislative roles of MPs and the states represented by the MPs. The picture which emerges is that there is a disjuncture between symbolic and substantive representation. Despite increased symbolic representation, some groups—such as women and Scheduled Tribe MPs, but not Scheduled Caste MPs—still participate below par. At the same time, Question Hour is used more effectively by other groups—men and upper caste MPs, but also younger MPs and those with college education. Further, we uncover some puzzling state patterns: MPs from Orissa, Gujarat and Maharashtra seem to participate more than MPs from Punjab, Tamil Nadu and the Northeastern states.
Keywords
Legislature, political parties, Question Hour, representation, India, sub nationalism
Although the Indian parliament represents the world’s largest democracy, legislative processes in India have received far less scholarly attention than several other parliaments.1 Both the extant literature and popular sentiment suggest that while India’s parliament is increasingly representative of the country’s diverse democracy, this has not been accompanied by greater efficacy in the institution’s deliberative functions. However, this overall impression needs to be carefully examined. National Social Watch reports that the top 15 participants during Question Hour received relatively low media coverage (National Social Watch, 2009), suggesting that much more happens in parliament than meets the public eye. Similarly, a Member of Parliament (MP) notes that one can witness two different parliaments in the same day, ‘the first from 11am to 1pm, and the second in the afternoon where there are debates, where there are discussions on various Bills, with scholarly and masterly speeches’ (quoted in Spary, 2010, p. 344). Therefore, we need to separately examine the various legislative instruments that make up
Srikrishna Ayyangar, Azim Premji University, Bangalore, India. E-mail: [email protected] Jacob, Justice Studies Department, James Madison University, Virginia, USA. E-mail: [email protected]
Studies in Indian Politics2(1) 1–19
© 2014 Lokniti, Centre for the Study of Developing Societies
SAGE PublicationsLos Angeles, London,
New Delhi, Singapore, Washington DC
DOI: 10.1177/2321023014526023http://inp.sagepub.com
at Istanbul Universitesi on November 4, 2014inp.sagepub.comDownloaded from
2 Srikrishna Ayyangar and Suraj Jacob
Studies in Indian Politics, 2, 1 (2014): 1–19
the parliament before a conclusive summary can be composed. In this study, we explore one such legislative instrument, the Question Hour, in the lower house of the Indian parliament (the Lok Sabha).
The Question Hour in the Lok Sabha is a particularly interesting legislative instrument of accountabil-ity because it is the only open plenary where MPs are not formally subject to party whip or other stric-tures. However, despite its importance in providing legislative oversight, it has not been systematically studied previously.2 We assemble a data set of Question Hour activity spanning 30 years (1980–2009) comprising several individual attributes of legislators to produce a comprehensive descriptive analysis over a crucial period of Indian democracy. We hold the modest objective of exploring intuitive covariates of the volume of legislative activity, as proxied by the number of questions asked by legislators during Question Hour, hoping that this exploratory exercise will spur efforts to engage with theory-building currently informed primarily by other legislatures.
Over a 30-year period (1980–2009), on average an MP asked 0.42 questions per session per day, cumulating to over half a million questions over the 30-year period, indicating that a voluminous amount of information is being sought from the national government. While there is a trend towards fewer questions asked over time, this has been mild and uneven. Unsurprisingly, opposition MPs ask more questions, although the difference (60 per cent more questions than governing party MPs) is not as large as we expected. Further, there is considerable variation in the volume of activity across MPs. A striking number was silent throughout their Lok Sabha terms; even among opposition MPs who sat through full terms, 10 per cent asked no questions while the remaining 90 per cent averaged 217 questions.
We also parse legislative behaviour by different attributes. In keeping with popular perceptions, we find that substantially fewer questions are asked by MPs from historically marginalized groups (women and STs, but not SCs), and marginalized states (Northeastern states). MPs with college degrees engage in more activity, but surprisingly this is not the case for those with law degrees. Question Hour activity is positively correlated with age until the peak of around 50 years, after which the correlation turns nega-tive. Expectedly, MPs with previous Lok Sabha experience are more active, but surprisingly previous state legislative experience does not appear to matter. Previous ministerial experience dampens legisla-tive activity even of opposition MPs, and this is all the more severe for those with previous high-status (cabinet) ministerial experience. This suggests that MPs may use Question Hour to signal their abilities to party selectorates, although it also appears wasteful that those with rich experience do not translate it readily into oversight activity. Finally, the state-wise results throw up some intriguing patterns; for instance, MPs from Orissa ask the most questions and MPs from Punjab ask the least questions. Taken together, we believe that the rich set of descriptive results generated by the study offer an in-depth perspective on an important arena of parliamentary procedure.
An implication of these findings is that even if the Lok Sabha has become more inclusive, this has not inevitably translated into equal participation; some groups still remain marginal. Further, to the extent that the volume of questions is a proxy for the extent of legislative oversight, we show that some groups—such as men, non-STs, MPs with prior legislative experience and MPs from certain states—seem to engage in greater oversight than others. This suggests that the Lok Sabha’s inclusive representa-tion has not translated into equal participation yet, and it seems clear that the Question Hour is a more effective mechanism of accountability for some groups compared to others.
The remainder of this article is organized as follows: The next section surveys the literature on representation and effectiveness in the Indian legislature. We then canvass the literature on legislative
at Istanbul Universitesi on November 4, 2014inp.sagepub.comDownloaded from
Studying the Indian Legislature 3
Studies in Indian Politics, 2, 1 (2014): 1–19
behaviour to develop expectations regarding the relationship between parliamentary questions and legislator attributes and roles in the Indian context. Following that, we move to the empirical sections. We describe our data set on the Question Hour and legislator attributes. The analysis section uses negative binomial regression models to estimate the effects of three sets of covariates on the volume of Question Hour activity: personal attributes of MPs, state-wise effects and legislative roles of MPs. In the concluding section, we take stock of our results and offer some thoughts on further study of the Indian legislature.
Symbolic and Substantive Representation in the Indian Parliament
Increasing Representation. There is no gainsaying that the Lok Sabha has grown more inclusive of previously marginalized social groups and parties (Arora, 1973; Dutta, 1969; Jhunjhunwala, 1975). From the 1950s to the 1990s, Scheduled Castes (SCs) and Scheduled Tribes (STs) have maintained their representation in proportion to their mandate under reservations (Jayal, 2006),3 and the Other Backward Castes doubled their representation from 14.3 per cent in 1971 to 23.7 per cent in 1991. Representation of Brahmins has been on a steady decline and reached a low of 7.6 per cent in 1991, although the share of non-Brahmin upper castes remained high at around 33 per cent for the same period.4
However,
Muslims have been consistently under-represented with only about 5 per cent Lok Sabha representation although they represent 12 per cent of the population, because the first-past-the-post system tends to exclude minorities that are not geographically concentrated.
Although the number of women MPs continues to be shockingly low, their share more than doubled from 4.4 per cent in 1952 to 9.9 per cent in 1999, and has not dropped below 7 per cent since 1991. Occupational backgrounds have become more diverse over time. The proportion of lawyers has been on a decline since the 1950s, reaching a low of 10 per cent in 1998; the share of agriculturalists has increased, and reached a high of 49 per cent in the same Lok Sabha. MPs belonging to business, indus-trial and management classes have made their presence felt since 1991 with their share touching 9 per cent in 2004. There has also been a significant increase in the proportion of graduates, postgraduates and doctorate holders since the 1980s. The percentage of graduate MPs hovered around the mid-30s until the mid-1970s, touching 49 per cent in 1989, and has not fallen below 40 per cent since 1979 (Shankar & Rodrigues, 2010).5
Besides general trends of ‘upsurge’ of previously marginalized groups, more inclusive representation has also been driven by increasing political competition. The disproportionality between vote share and seat share has reduced (with the exception of ruling parties) and parties seeking to carve out niche support end up extending legislative representation to more groups (Kaushik & Pal, 2012).6
Decreasing Effectiveness? Much of the literature borders on despair when it reflects upon the quality of the institution in recent decades, with words such as ‘decline’ (Rubinoff, 1996), ‘corrosion’ (National Social Watch, 2009), ‘atrophy’ (Sanghvi, 1987), ‘endangerment’ (Banerjee, 2006) and ‘death’ (EPW Editorial, 2009) being used to describe its functioning.7
Banerjee (2006) argues that the erosion set
in with the seventh Lok Sabha when a new breed of rambunctious governing party MPs handpicked by Sanjay Gandhi started the trend of shouting down opposition MPs. Scholars point to decline in the num-ber of Lok Sabha sittings because of frequent disruptions, chronic absenteeism, lack of debate and
at Istanbul Universitesi on November 4, 2014inp.sagepub.comDownloaded from
4 Srikrishna Ayyangar and Suraj Jacob
Studies in Indian Politics, 2, 1 (2014): 1–19
discussion during business hours or before the passage of bills (Kashyap, 1990; Wallack, 2008), and the decreasing importance of the Question Hour where members come with little background preparation and ministers provide casual and rudimentary answers (National Social Watch, 2009). Others point to a trend towards constrained time affecting the quality of questions (Agrawal, 2005) and the structural weaknesses of the committee system because of their composition and lack of organizational heft (Kapur & Mehta, 2006; Rubinoff, 1996). Convergence of money power with the increasing presence of MPs with criminal cases deepens the sense of despair (Paul & Vivekananda, 2004). Further, the perks of being a career politician are also on the wane since more than 90 per cent of MPs have served three or less terms (Kapur & Mehta, 2006).
Several reasons have been identified behind this decline. Agrawal (2005) blames the lack of executive accountability on Congress Party dominance in the initial decades. Congress Party dominance not only marginalized the opposition but also dispensed with institutional process, a phenomenon not atypical of one-party-dominant fledgling democracies in Africa and Latin America. Placing the onus for parlia-mentary decline on institutional rules, Wallack (2008) argues that they skew control in favour of the government, leaving the opposition with no option but to disrupt and stall legislative activity, which consequently increases public apathy towards the Lok Sabha. Committees that could provide consensual and expert informed advice are controlled by the government only to stymie proposals that come from the legislature, and in any case are vastly under-resourced compared to other countries. Opposition per-spectives are rarely considered and government bills are rarely subject to parliamentary scrutiny. Further, increasingly, most of the organizational decisions are passed on to the bureaucracy. Any chance of delib-erative dissent is further prevented because of the anti-defection law. Kapur and Mehta (2006) and Rubinoff (1996) attribute the decline in executive accountability to party system fragmentation and the nature of party recruitment. Coalition politics has enabled smaller parties to extract concessions in lieu of credible threats to initiate no-confidence motions, so that such motions have become opportunities to hold the government to ransom rather than opportunities to hold it accountable. Perhaps not unlike many other legislatures, Kapur and Mehta (2006) regret that the Lok Sabha has become a site for adversarial combat instead of deliberative clarity as opposition parties are mostly reactive instead of being agenda-setters: there are higher pay-offs to seizing the political moment of the day rather than assiduously engaging in oversight of the executive. Finally, parties have a stranglehold over their MPs since they decide tickets, committee memberships and ministerships; this stranglehold is at the cost of legislative work because it signals to legislators that toeing the party line is more important than the legislative skills of deliberation and oversight.
While most scholars provide a dismal picture, Hewitt and Rai (2010) challenge conventional theoreti-cal frameworks by pointing out several instances when the opposition has become innovative as a reaction to ruling parties closing off formal spaces for opposition intervention. In hindsight, these inno-vations have complemented—rather than eclipsed—parliamentary institutions. For instance, while dhar-nas and walk-outs seem disruptive and therefore get disproportionate media coverage, they have forced the Speaker to resolve issues quickly. Opposition MPs have also found ways of holding to account governments that avoid plenaries by resorting to ‘excessive legalism’ (by questioning legislation on its form, timing or some other legal technicality).
In sum, while the general impression of parliamentary decline may be difficult to dispel, drawing attention to its constituent parts reveals that several legislators and parties have found ways to think beyond the legislative procedural box to meet the expectations of their roles and agendas.
at Istanbul Universitesi on November 4, 2014inp.sagepub.comDownloaded from
Studying the Indian Legislature 5
Studies in Indian Politics, 2, 1 (2014): 1–19
Related Literature and Hypotheses
We explore the relationship between the legislative roles of MPs and their personal characteristics on the one hand, and the number of parliamentary questions asked by them on the other. While our strategy is primarily empirical, below we sketch out some of our priors based on the extant literature.
The government–opposition divide and its legislative implications have been widely discussed in the literature (Hix & Noury, 2011). Opposition MPs are more likely to challenge ministers on policy and related matters, so it is natural to expect their Question Hour activity to be greatest. However, govern-ment backbencher MPs may ask soft questions to counter opposition MPs and to highlight government achievements (Saalfeld, 2011). Thus, while we expect backbenchers to ask fewer questions than opposi-tion MPs, past work does not generate clear-cut expectations regarding the size of the gap. Further, all MPs are likely to ask questions to enhance their reputations and engage in constituency service (Russo & Wiberg, 2010), activities which are not directly related to the government-opposition divide.8
The literature on legislative behaviour and personal legislator characteristics is wide and varied. In the context of parliamentary questions specifically, some prior research suggests minimal gender differences—Murray (2010, France) and Rasch (2011, Norway)—although Bird (2005, Britain) concludes that gender does make a difference. In India women politicians are sometimes dismissed as biwi–beti–bahus (wives, daughters, daughters-in-law, respectively); in interviews with Indian legisla-tors, Kaushik (1992, p. 40) notes a general complaint that ‘[w]omen legislators are not taken seriously or given responsible tasks like introducing motions’. This would lead us to expect women to be less active in Question Hour. Similar considerations suggest that Scheduled Tribe (ST) legislators, who represent another historically marginalized group, would ask fewer parliamentary questions. By contrast, Scheduled Castes (SCs), although historically marginalized, have made greater political strides in recent decades (Jaffrelot, 2003; Pai, 2002). This leads us to expect that Question Hour participation of SC legislators may lie between that of ST and non-SC/ST legislators.9
In principle, parliamentary questioning—as opposed to, say, parliamentary debates—need not depend upon educational backgrounds of legislators. Nevertheless it is possible that education matters, and that it is correlated with legislative skills or simply confidence in navigating the parliamentary milieu. Accordingly, our working hypothesis is that the volume of questions is positively associated with level of education. We would expect those with law degrees, in particular, to have an advantage. For the Honduran Congress, Taylor-Robinson and David (2002, p. 21) note: ‘In a congress where many deputies lack a college education, lawyers are often looked to for advice and opinion by other deputies due to their specialized knowledge and expertise in legal codes.’ The literature has also explored the role of legislator experience in affecting legislator behaviour. Hibbing (1991, US) and Taylor-Robinson and David (2002, Honduras) observe that legislative experience increases legislative activity, and we hold a similar expectation in the Indian context as well. However, in the case of senior legislators, the literature suggests two opposing possibilities. On the one hand, Salmond (2004) observes that opposition party leaders in New Zealand tend to ask more questions over time in consonance with the increasing presi-dential nature of politics. On the other hand, senior leaders may have less need to garnish their standing, and more importantly, ‘longer serving and more experienced parliamentarians [may] choose different means of communicating their opinions and realizing their ideas’ (Bailer, 2011, p. 310). We try to iden-tify senior legislators as those with prior ministerial experience. Given that the literature has opposing views on this, we develop no clear-cut expectations regarding the relative volume of questions asked by senior legislators.
at Istanbul Universitesi on November 4, 2014inp.sagepub.comDownloaded from
6 Srikrishna Ayyangar and Suraj Jacob
Studies in Indian Politics, 2, 1 (2014): 1–19
Question Hour Data
We focus on the Question Hour in the Lok Sabha because it is an unrestricted plenary space where legislators are not subject to party whip, debate, vote or motion that would require party regulation or oversight. Studies from Western legislatures show that studying the Question Hour does reveal some patterns—for instance, MPs from ethnic majority constituencies ask more questions (Saalfeld, 2011, England), focus on local issues such as agriculture and the local economic resource base when their electoral victory margins are lower (Blidook & Kerby, 2011, Canada) and are more active when they are young and belong to ideologically extreme parties (Bailer, 2011, Switzerland).10 In India, Question Hour is the first hour of business (11am to noon) when the Lok Sabha is in session. Each MP can request to ask five questions (one oral) per session day, but the Speaker will allow a maximum of only 250 ques-tions (20 oral) from the pool. Legislators submit questions in writing 21 days in advance, and if they are lucky in the random balloting process to get their question on the roster, they can ask it orally and request oral (‘starred’) or written (‘unstarred’) answers from government ministers.
We construct a unique data set of Question Hour activity and its covariates for the Lok Sabha over three decades (1980–2009). Below, we introduce the data and summarize the overall trends.
Questions in Parliament. The key variable is the number of questions asked by an MP over the length of a Lok Sabha, constructed from Statement 28 of the end-of-term reports issued by the Lok Sabha secretariat.11
Questions are categorized as ‘starred’ (oral), ‘unstarred’ (written) and ‘short notice’
(written submissions with shorter notice period) questions. We aggregated them because the underlying motive behind oral questions—to provide publicity to the MP and ensure an immediate oral response from a minister—is not relevant to our analysis; all we want to explore is whether a question was posed irrespective of how the answer was delivered, so we focus on the volume of questions per MP.12 There were eight distinct Lok Sabhas in the three decades we cover (1980–1985, 1985–1989, 1989–1991, 1991–1996, 1996–1998, 1998–1999, 1999–2004 and 2004–2009), with lengths varying between one and five years. Lok Sabha duration is likely to affect the number of questions asked by a legislator, and we account for this in the empirical analysis.
Data on MPs’ Personal Characteristics and Legislative Roles. The data set also contains several potential covariates of the volume of legislative activity: age; gender; special minority categories (Scheduled Caste and Scheduled Tribe); education; prior political experience in the state legislature, national legislature and national government; state and year of election and an MP’s opposition/ government status.
We construct multiple categorical variables for education: no formal schooling, high school, bache-lors degree, higher degrees and law degree. In the case of previous experience in national government, we code ministerial portfolios by status: cabinet minister, minister of state and deputy minister. In the case of legislative role of MPs, we distinguish the following categories: MPs from single-party govern-ment and coalition government, and within them, status as minister or government backbencher; MPs providing ‘outside support’ and opposition MPs.13
Data for gender, minority categories, prior experience in winning Lok Sabha elections, states and party affiliations, all come from the Statistical Reports compiled by the Election Commission of India (ECI) and Lok Sabha bulletins;14
and information on personal background of MPs, such as age, education
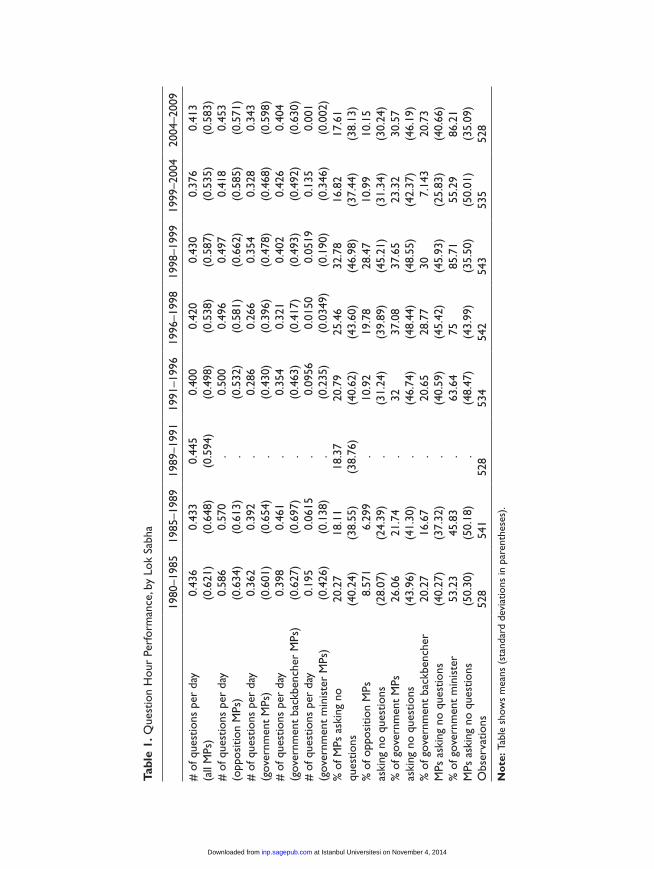
and legislative experience come from Who’s Who volumes (Lok Sabha Secretariat, 2003, 2004). Descriptive Statistics. Table 1 presents some descriptive statistics. The average number of
questions asked by an MP per day has changed little over three decades (although there is a mild, uneven
at Istanbul Universitesi on November 4, 2014inp.sagepub.comDownloaded from
Tabl
e 1.
Que
stio
n H
our
Perf
orm
ance
, by
Lok
Sabh
a
1980
–198
519
85–1
989
1989
–199
119
91–1
996
1996
–199
819
98–1
999
1999
–200
420
04–2
009
# o
f que
stio
ns p
er d
ay
(all
MPs
)0.
436
0.43
30.
445
0.40
00.
420
0.43
00.
376
0.41
3(0
.621
)(0
.648
)(0
.594
)(0
.498
)(0
.538
)(0
.587
)(0
.535
)(0
.583
)#
of q
uest
ions
per
day
(o
ppos
ition
MPs
)0.
586
(0.6
34)
0.57
0.
0.50
00.
496
0.49
70.
418
0.45
3(0
.613
).
(0.5
32)
(0.5
81)
(0.6
62)
(0.5
85)
(0.5
71)
# o
f que
stio
ns p
er d
ay
(gov
ernm
ent
MPs
)0.
362
0.39
2.
0.28
60.
266
0.35
40.
328
0.34
3(0
.601
)(0
.654
).
(0.4
30)
(0.3
96)
(0.4
78)
(0.4
68)
(0.5
98)
# o
f que
stio
ns p
er d
ay
(gov
ernm
ent
back
benc
her
MPs
)0.
398
0.46
1.
0.35
40.
321
0.40
20.
426
0.40
4(0
.627
)(0
.697
).
(0.4
63)
(0.4
17)
(0.4
93)
(0.4
92)
(0.6
30)
# o
f que
stio
ns p
er d
ay
(gov
ernm
ent
min
iste
r M
Ps)
0.19
50.
0615
.0.
0956
0.01
500.
0519
0.13
50.
001
(0.4
26)
(0.1
38)
.(0
.235
)(0
.034
9)(0
.190
)(0
.346
)(0
.002
)%
of M
Ps a
skin
g no
qu
estio
ns20
.27
18.1
118
.37
20.7
925
.46
32.7
816
.82
17.6
1(4
0.24
)(3
8.55
)(3
8.76
)(4
0.62
)(4
3.60
)(4
6.98
)(3
7.44
)(3
8.13
)%
of o
ppos
ition
MPs
as
king
no
ques
tions
8.57
16.
299
.10
.92
19.7
828
.47
10.9
910
.15
(28.
07)
(24.
39)
.(3
1.24
)(3
9.89
)(4
5.21
)(3
1.34
)(3
0.24
)%
of g
over
nmen
t M
Ps
aski
ng n
o qu
estio
ns26
.06
21.7
4.
3237
.08
37.6
523
.32
30.5
7(4
3.96
)(4
1.30
).
(46.
74)
(48.
44)
(48.
55)
(42.
37)
(46.
19)
% o
f gov
ernm
ent
back
benc
her
MPs
ask
ing
no q
uest
ions
20.2
716
.67
.20
.65
28.7
730
7.14
320
.73
(40.
27)
(37.
32)
.(4
0.59
)(4
5.42
)(4
5.93
)(2
5.83
)(4
0.66
)%
of g
over
nmen
t m
inis
ter
M
Ps a
skin
g no
que
stio
ns53
.23
45.8
3.
63.6
475
85.7
155
.29
86.2
1(5
0.30
)(5
0.18
).
(48.
47)
(43.
99)
(35.
50)
(50.
01)
(35.
09)
Obs
erva
tions
528
54
152
853
454
254
353
552
8
No
te: T
able
sho
ws
mea
ns (
stan
dard
dev
iatio
ns in
par
enth
eses
).
at Istanbul Universitesi on November 4, 2014inp.sagepub.comDownloaded from
8 Srikrishna Ayyangar and Suraj Jacob
Studies in Indian Politics, 2, 1 (2014): 1–19
trend of decline) despite changes in the composition of parliament, legislative tenures and quality of legislative business. It is clear and unsurprising that opposition MPs tend to ask more questions than governing party MPs, and non-ministers (backbenchers) among the latter ask more questions than ministers.15 Over time, government backbenchers have stepped up the number of questions asked while opposition MPs have reduced them (in both cases, fairly mildly); indeed, in the case of the 1999–2004 Lok Sabha, backbenchers asked more questions than opposition MPs on average. And lastly, about 21 per cent of MPs in the data set did not ask a single question in their respective Lok Sabhas. This figure is remarkable. Even when we confine ourselves to opposition MPs in Lok Sabhas that met for their full terms, fully 10 per cent asked zero questions, while the remaining 90 per cent averaged 217 questions.
Covariates of the Volume of Legislative Activity
We now turn to statistical analysis of several key covariates of the volume of questions asked during Question Hour. We present three sets of covariates: personal characteristics of MPs, state-wise differ-ences and legislative roles of MPs. The analysis relies on negative binomial regression (NBR) models where the dependent variable is number of questions asked by an MP. As this is over-dispersed count data (that is, where the variance exceeds the mean), the NBR model is superior to OLS (Hausman, Hall & Griliches, 1984) and is the standard model used in the literature.16 The NBR model includes an exposure variable for the length of each Lok Sabha since the eight Lok Sabhas had differing lengths. We include dummy variables for years to account for influences that are common across legislators but differ across Lok Sabhas. As a robustness check of the NBR specification, we also employ an OLS model where the dependent variable is the number of questions asked by a legislator per day that a Lok Sabha is in session.
Personal Characteristics of MPs
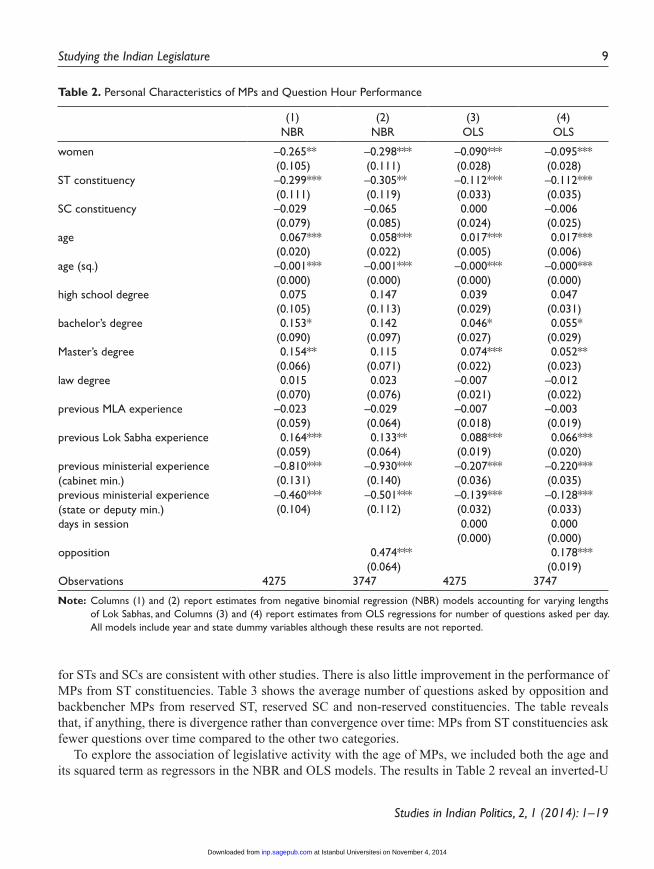
Table 2 presents results for the covariates of the volume of questions. The first two columns present NBR estimation results for the number of questions asked. The main results are in Column (1), and Column (2) includes a control variable for government/opposition status of legislators as a simple robustness check. NBR results are easier to interpret as incidence rate ratios (IRRs, that is, expo-nentiated coefficients), and all NBR interpretations in this section pertain to IRRs. Finally, as a specification check, Columns (3) and (4) present OLS results for the number of questions asked per day. Since the overall results from OLS agree with the NBR results, below we confine the discussion to the NBR results.17
The results in Table 2 indicate that the estimated coefficient for women varies between –0.27 and –0.30 and is significant at the 95 per cent confidence level. The IRRs are 0.77 and 0.74, implying that women ask 23–26 per cent fewer questions compared to men, which makes for a substantial differ-ence. MPs from reserved ST constituencies ask 26 per cent fewer questions than MPs from unreserved constituencies, and again the result is significant at the 95 per cent level. By contrast, MPs from reserved SC constituencies are statistically similar to MPs from unreserved constituencies. The contrasting results
at Istanbul Universitesi on November 4, 2014inp.sagepub.comDownloaded from
Studying the Indian Legislature 9
Studies in Indian Politics, 2, 1 (2014): 1–19
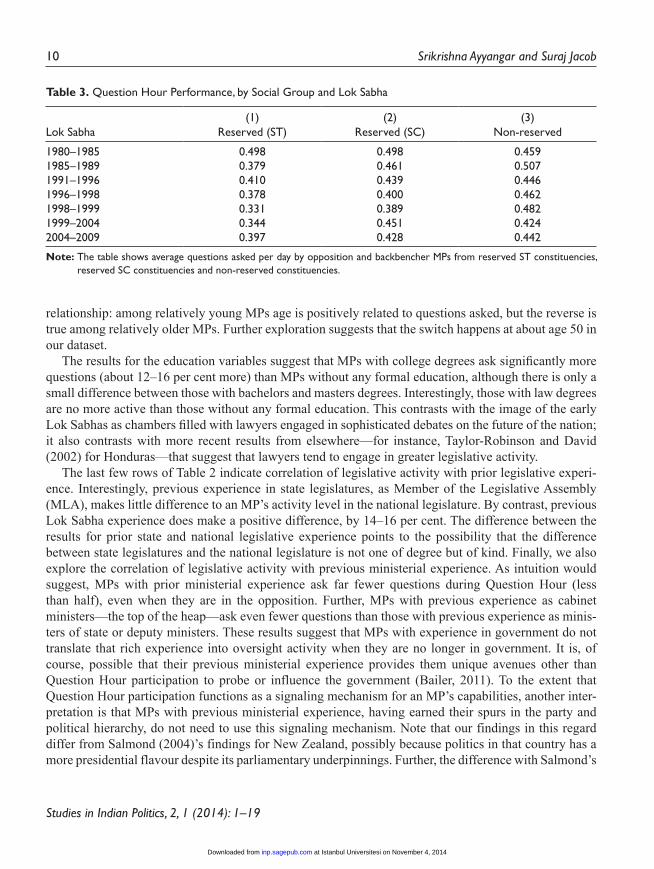
for STs and SCs are consistent with other studies. There is also little improvement in the performance of MPs from ST constituencies. Table 3 shows the average number of questions asked by opposition and backbencher MPs from reserved ST, reserved SC and non-reserved constituencies. The table reveals that, if anything, there is divergence rather than convergence over time: MPs from ST constituencies ask fewer questions over time compared to the other two categories.
To explore the association of legislative activity with the age of MPs, we included both the age and its squared term as regressors in the NBR and OLS models. The results in Table 2 reveal an inverted-U
Table 2. Personal Characteristics of MPs and Question Hour Performance
(1)NBR
(2)NBR
(3)OLS
(4)OLS
women –0.265** –0.298*** –0.090*** –0.095***(0.105) (0.111) (0.028) (0.028)
ST constituency –0.299*** –0.305** –0.112*** –0.112***(0.111) (0.119) (0.033) (0.035)
SC constituency –0.029 –0.065 0.000 –0.006(0.079) (0.085) (0.024) (0.025)
age 0.067*** 0.058*** 0.017*** 0.017***(0.020) (0.022) (0.005) (0.006)
age (sq.) –0.001*** –0.001*** –0.000*** –0.000***(0.000) (0.000) (0.000) (0.000)
high school degree 0.075 0.147 0.039 0.047(0.105) (0.113) (0.029) (0.031)
bachelor’s degree 0.153* 0.142 0.046* 0.055*(0.090) (0.097) (0.027) (0.029)
Master’s degree 0.154** 0.115 0.074*** 0.052**(0.066) (0.071) (0.022) (0.023)
law degree 0.015 0.023 –0.007 –0.012(0.070) (0.076) (0.021) (0.022)
previous MLA experience –0.023 –0.029 –0.007 –0.003(0.059) (0.064) (0.018) (0.019)
previous Lok Sabha experience 0.164*** 0.133** 0.088*** 0.066***(0.059) (0.064) (0.019) (0.020)
previous ministerial experience (cabinet min.)
–0.810*** –0.930*** –0.207*** –0.220***(0.131) (0.140) (0.036) (0.035)
previous ministerial experience (state or deputy min.)
–0.460*** –0.501*** –0.139*** –0.128***(0.104) (0.112) (0.032) (0.033)
days in session 0.000 0.000(0.000) (0.000)
opposition 0.474*** 0.178***(0.064) (0.019)
Observations 4275 3747 4275 3747
Note: Columns (1) and (2) report estimates from negative binomial regression (NBR) models accounting for varying lengths of Lok Sabhas, and Columns (3) and (4) report estimates from OLS regressions for number of questions asked per day. All models include year and state dummy variables although these results are not reported.
at Istanbul Universitesi on November 4, 2014inp.sagepub.comDownloaded from
10 Srikrishna Ayyangar and Suraj Jacob
Studies in Indian Politics, 2, 1 (2014): 1–19
relationship: among relatively young MPs age is positively related to questions asked, but the reverse is true among relatively older MPs. Further exploration suggests that the switch happens at about age 50 in our dataset.
The results for the education variables suggest that MPs with college degrees ask significantly more questions (about 12–16 per cent more) than MPs without any formal education, although there is only a small difference between those with bachelors and masters degrees. Interestingly, those with law degrees are no more active than those without any formal education. This contrasts with the image of the early Lok Sabhas as chambers filled with lawyers engaged in sophisticated debates on the future of the nation; it also contrasts with more recent results from elsewhere—for instance, Taylor-Robinson and David (2002) for Honduras—that suggest that lawyers tend to engage in greater legislative activity.
The last few rows of Table 2 indicate correlation of legislative activity with prior legislative experi-ence. Interestingly, previous experience in state legislatures, as Member of the Legislative Assembly (MLA), makes little difference to an MP’s activity level in the national legislature. By contrast, previous Lok Sabha experience does make a positive difference, by 14–16 per cent. The difference between the results for prior state and national legislative experience points to the possibility that the difference between state legislatures and the national legislature is not one of degree but of kind. Finally, we also explore the correlation of legislative activity with previous ministerial experience. As intuition would suggest, MPs with prior ministerial experience ask far fewer questions during Question Hour (less than half), even when they are in the opposition. Further, MPs with previous experience as cabinet ministers—the top of the heap—ask even fewer questions than those with previous experience as minis-ters of state or deputy ministers. These results suggest that MPs with experience in government do not translate that rich experience into oversight activity when they are no longer in government. It is, of course, possible that their previous ministerial experience provides them unique avenues other than Question Hour participation to probe or influence the government (Bailer, 2011). To the extent that Question Hour participation functions as a signaling mechanism for an MP’s capabilities, another inter-pretation is that MPs with previous ministerial experience, having earned their spurs in the party and political hierarchy, do not need to use this signaling mechanism. Note that our findings in this regard differ from Salmond (2004)’s findings for New Zealand, possibly because politics in that country has a more presidential flavour despite its parliamentary underpinnings. Further, the difference with Salmond’s
Table 3. Question Hour Performance, by Social Group and Lok Sabha
Lok Sabha (1)
Reserved (ST) (2)
Reserved (SC) (3)
Non-reserved
1980–1985 0.498 0.498 0.459 1985–1989 0.379 0.461 0.507 1991–1996 0.410 0.439 0.446 1996–1998 0.378 0.400 0.462 1998–1999 0.331 0.389 0.482 1999–2004 0.344 0.451 0.424 2004–2009 0.397 0.428 0.442
Note: The table shows average questions asked per day by opposition and backbencher MPs from reserved ST constituencies, reserved SC constituencies and non-reserved constituencies.
at Istanbul Universitesi on November 4, 2014inp.sagepub.comDownloaded from
Studying the Indian Legislature 11
Studies in Indian Politics, 2, 1 (2014): 1–19
findings may also reflect the increasing centrifugal diffusion of power in the Indian legislature where marginal parties find it easier to keep tabs on the majority incumbent party through extractions in highly publicized cliff-hanger moments and within enclaves outside the floor of the Lok Sabha.
Differences across States
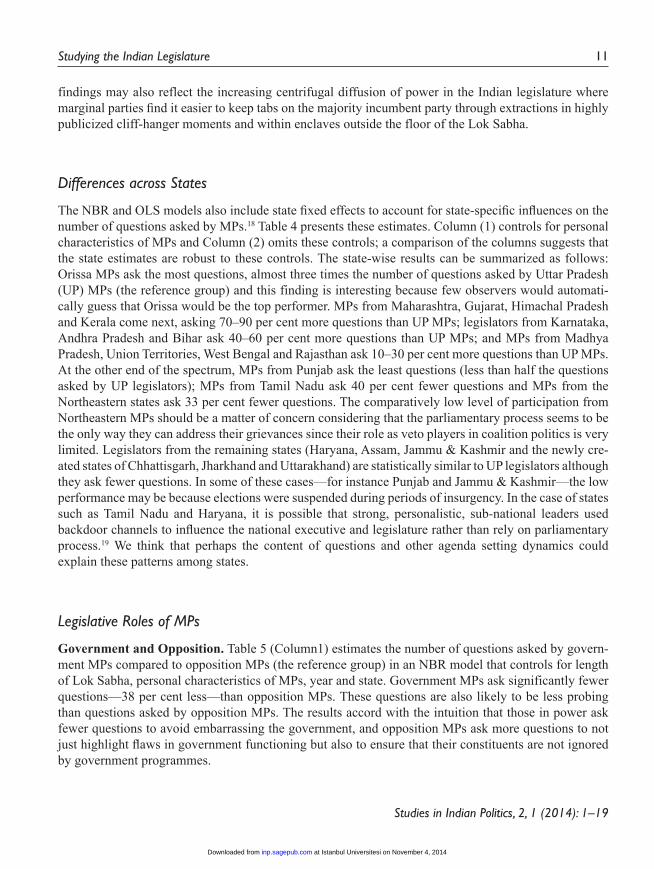
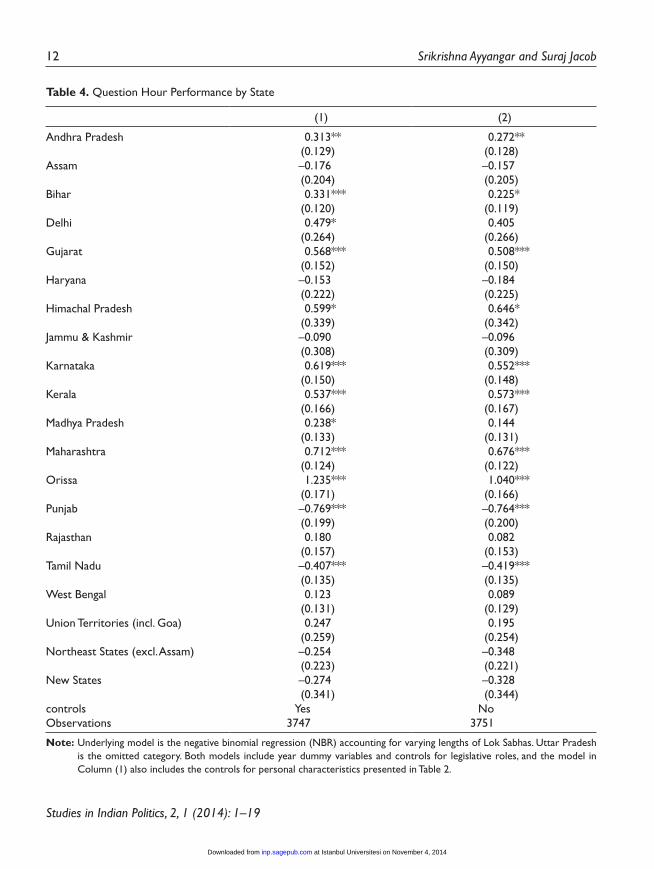
The NBR and OLS models also include state fixed effects to account for state-specific influences on the number of questions asked by MPs.18 Table 4 presents these estimates. Column (1) controls for personal characteristics of MPs and Column (2) omits these controls; a comparison of the columns suggests that the state estimates are robust to these controls. The state-wise results can be summarized as follows: Orissa MPs ask the most questions, almost three times the number of questions asked by Uttar Pradesh (UP) MPs (the reference group) and this finding is interesting because few observers would automati-cally guess that Orissa would be the top performer. MPs from Maharashtra, Gujarat, Himachal Pradesh and Kerala come next, asking 70–90 per cent more questions than UP MPs; legislators from Karnataka, Andhra Pradesh and Bihar ask 40–60 per cent more questions than UP MPs; and MPs from Madhya Pradesh, Union Territories, West Bengal and Rajasthan ask 10–30 per cent more questions than UP MPs. At the other end of the spectrum, MPs from Punjab ask the least questions (less than half the questions asked by UP legislators); MPs from Tamil Nadu ask 40 per cent fewer questions and MPs from the Northeastern states ask 33 per cent fewer questions. The comparatively low level of participation from Northeastern MPs should be a matter of concern considering that the parliamentary process seems to be the only way they can address their grievances since their role as veto players in coalition politics is very limited. Legislators from the remaining states (Haryana, Assam, Jammu & Kashmir and the newly cre-ated states of Chhattisgarh, Jharkhand and Uttarakhand) are statistically similar to UP legislators although they ask fewer questions. In some of these cases—for instance Punjab and Jammu & Kashmir—the low performance may be because elections were suspended during periods of insurgency. In the case of states such as Tamil Nadu and Haryana, it is possible that strong, personalistic, sub-national leaders used backdoor channels to influence the national executive and legislature rather than rely on parliamentary process.19 We think that perhaps the content of questions and other agenda setting dynamics could explain these patterns among states.
Legislative Roles of MPs
Government and Opposition. Table 5 (Column1) estimates the number of questions asked by govern-ment MPs compared to opposition MPs (the reference group) in an NBR model that controls for length of Lok Sabha, personal characteristics of MPs, year and state. Government MPs ask significantly fewer questions—38 per cent less—than opposition MPs. These questions are also likely to be less probing than questions asked by opposition MPs. The results accord with the intuition that those in power ask fewer questions to avoid embarrassing the government, and opposition MPs ask more questions to not just highlight flaws in government functioning but also to ensure that their constituents are not ignored by government programmes.
at Istanbul Universitesi on November 4, 2014inp.sagepub.comDownloaded from
12 Srikrishna Ayyangar and Suraj Jacob
Studies in Indian Politics, 2, 1 (2014): 1–19
Table 4. Question Hour Performance by State
(1) (2)
Andhra Pradesh 0.313** 0.272**(0.129) (0.128)
Assam –0.176 –0.157(0.204) (0.205)
Bihar 0.331*** 0.225*(0.120) (0.119)
Delhi 0.479* 0.405(0.264) (0.266)
Gujarat 0.568*** 0.508***(0.152) (0.150)
Haryana –0.153 –0.184(0.222) (0.225)
Himachal Pradesh 0.599* 0.646*(0.339) (0.342)
Jammu & Kashmir –0.090 –0.096(0.308) (0.309)
Karnataka 0.619*** 0.552***(0.150) (0.148)
Kerala 0.537*** 0.573***(0.166) (0.167)
Madhya Pradesh 0.238* 0.144(0.133) (0.131)
Maharashtra 0.712*** 0.676***(0.124) (0.122)
Orissa 1.235*** 1.040***(0.171) (0.166)
Punjab –0.769*** –0.764***(0.199) (0.200)
Rajasthan 0.180 0.082(0.157) (0.153)
Tamil Nadu –0.407*** –0.419***(0.135) (0.135)
West Bengal 0.123 0.089(0.131) (0.129)
Union Territories (incl. Goa) 0.247 0.195(0.259) (0.254)
Northeast States (excl. Assam) –0.254 –0.348(0.223) (0.221)
New States –0.274 –0.328(0.341) (0.344)
controls Yes NoObservations 3747 3751
Note: Underlying model is the negative binomial regression (NBR) accounting for varying lengths of Lok Sabhas. Uttar Pradesh is the omitted category. Both models include year dummy variables and controls for legislative roles, and the model in Column (1) also includes the controls for personal characteristics presented in Table 2.
at Istanbul Universitesi on November 4, 2014inp.sagepub.comDownloaded from
Studying the Indian Legislature 13
Studies in Indian Politics, 2, 1 (2014): 1–19
Single-party Government, Coalition Government, Outside Support to Government and Opposition. Government MPs can be divided into single-party or coalition government MPs. Further, in the Indian context, opposition MPs can be divided into those who provide ‘outside support’ to the government—that is, those who provide legislative support to a party or coalition that forms the govern-ment without formally entering the cabinet—and those who are fully in the opposition.20 We expect governing single-party MPs to ask the least questions, followed by governing coalition, outside support and full opposition MPs, with a wide difference between the first two and last two categories. Those who formally enter coalitions are expected to exhibit behaviour closer to governing single parties since they have a stake in ensuring the survival of the government. By contrast, those providing outside support would tend to behave more like the opposition to ensure that a ruling party does not transgress programmatic agreements.
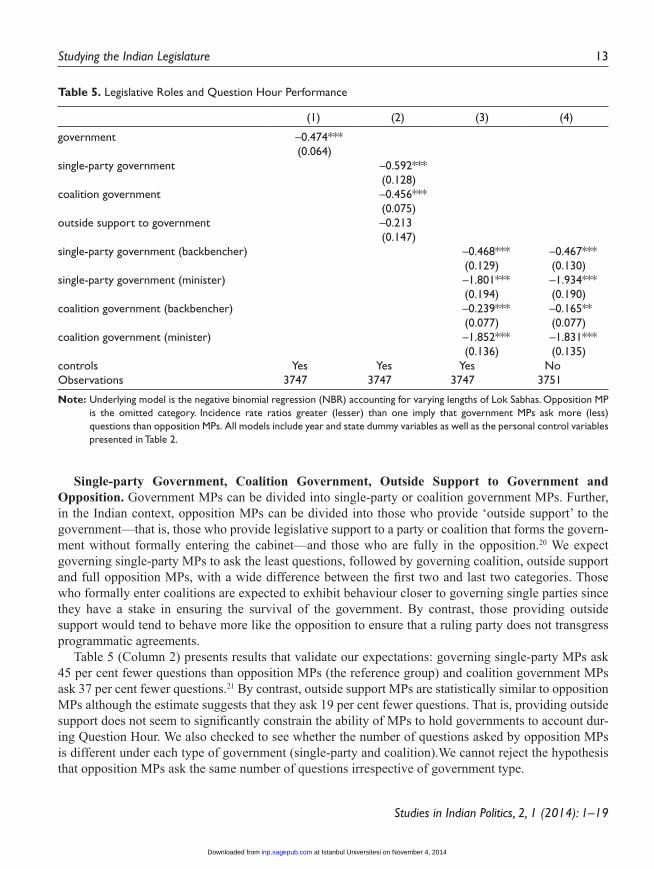
Table 5 (Column 2) presents results that validate our expectations: governing single-party MPs ask 45 per cent fewer questions than opposition MPs (the reference group) and coalition government MPs ask 37 per cent fewer questions.21 By contrast, outside support MPs are statistically similar to opposition MPs although the estimate suggests that they ask 19 per cent fewer questions. That is, providing outside support does not seem to significantly constrain the ability of MPs to hold governments to account dur-ing Question Hour. We also checked to see whether the number of questions asked by opposition MPs is different under each type of government (single-party and coalition).We cannot reject the hypothesis that opposition MPs ask the same number of questions irrespective of government type.
Table 5. Legislative Roles and Question Hour Performance
(1) (2) (3) (4)
government –0.474***(0.064)
single-party government –0.592***(0.128)
coalition government –0.456***(0.075)
outside support to government –0.213(0.147)
single-party government (backbencher) –0.468*** –0.467***(0.129) (0.130)
single-party government (minister) –1.801*** –1.934***(0.194) (0.190)
coalition government (backbencher) –0.239*** –0.165**(0.077) (0.077)
coalition government (minister) –1.852*** –1.831***(0.136) (0.135)
controls Yes Yes Yes NoObservations 3747 3747 3747 3751
Note: Underlying model is the negative binomial regression (NBR) accounting for varying lengths of Lok Sabhas. Opposition MP is the omitted category. Incidence rate ratios greater (lesser) than one imply that government MPs ask more (less) questions than opposition MPs. All models include year and state dummy variables as well as the personal control variables presented in Table 2.
at Istanbul Universitesi on November 4, 2014inp.sagepub.comDownloaded from
14 Srikrishna Ayyangar and Suraj Jacob
Studies in Indian Politics, 2, 1 (2014): 1–19
Ministers and Backbenchers in Government. Table 5 (Column 3) shows results for governing single-party and coalition MPs differentiated by ministerial status (MPs from the governing party who are not ministers are termed ‘backbenchers’). As expected, ministers ask significantly fewer questions than backbenchers. Interestingly, while single-party backbenchers ask 38 per cent fewer questions than opposition MPs, coalition backbenchers ask only 21 per cent fewer questions. This is consistent with the possibility that in coalition government, backbenchers from one party are likely to probe ministers from other parties.
Column (4) of Table 5 presents estimates of the same model as Column (3) except the personal char-acteristics that control variables (presented in Table 2) are omitted. Comparing the two columns, it is apparent that the results for legislative roles are robust to the inclusion of MPs’ personal characteristics. This suggests that personal characteristics do not influence how legislative activity is affected by an MP’s legislative status.
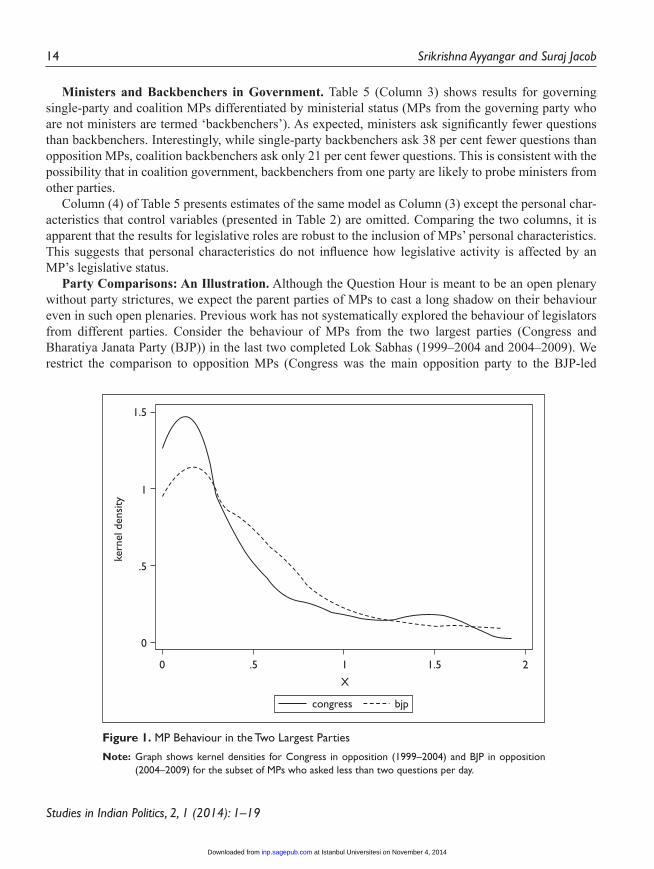
Party Comparisons: An Illustration. Although the Question Hour is meant to be an open plenary without party strictures, we expect the parent parties of MPs to cast a long shadow on their behaviour even in such open plenaries. Previous work has not systematically explored the behaviour of legislators from different parties. Consider the behaviour of MPs from the two largest parties (Congress and Bharatiya Janata Party (BJP)) in the last two completed Lok Sabhas (1999–2004 and 2004–2009). We restrict the comparison to opposition MPs (Congress was the main opposition party to the BJP-led
Figure 1. MP Behaviour in the Two Largest Parties
Note: Graph shows kernel densities for Congress in opposition (1999–2004) and BJP in opposition (2004–2009) for the subset of MPs who asked less than two questions per day.
at Istanbul Universitesi on November 4, 2014inp.sagepub.comDownloaded from
Studying the Indian Legislature 15
Studies in Indian Politics, 2, 1 (2014): 1–19
government of 1999–2004, and BJP was the main opposition party to the Congress-led government of 2004–2009). While on average Congress and BJP MPs asked the same number of questions in opposi-tion (160), the distributions are different. The kernel densities shown in Figure 1 suggest that compared to BJP MPs, Congress MPs displayed a wider distribution (more MPs asking both few questions and a large number of questions), possibly hinting at differences in party organization. While this is only an illustration of the potential of party comparisons in the Lok Sabha, we believe that systematic comparisons along these lines can reveal deeper patterns of party behaviour.
Conclusion
The disaggregated view of the Lok Sabha reveals that electoral representation need not automatically translate into participation. Importantly, the Lok Sabha cannot be characterized as an ineffective instru-ment for all its legislators—clearly, some legislators find greater value in making use of the Question Hour than others. Our analysis of the Question Hour reveals that it has been an important instrument for executive accountability—on average MPs ask more than one question every three days, and this has not reduced substantially over time, in contrast to what the literature reports on other legislative instruments of the Lok Sabha. As the literature has documented, the fact that MPs from historically marginalized groups are present in ever larger numbers in the Lok Sabha speaks to the symbolic representative strength of the Lok Sabha as a democratic institution. However, our findings reveal that some groups, such as women, those from reserved Scheduled Tribe constituencies, and MPs having less than a college educa-tion, tend to participate systematically less than their counterparts, suggesting that the substantive repre-sentation of some historically marginalized groups lags behind symbolic representation. Further, the performance gap appears not to have reduced over time. MPs with previous experience, those with a college education, are male, or belong to privileged castes seem to find the Question Hour effective and tend to still dominate the proceedings.
This study was designed as a means to generate stylized facts about trends in, and covariates of, the volume of legislative activity as proxied by the Question Hour. We hope that this study opens up further lines of enquiry to reveal deeper features of legislative activity, and political behaviour more generally. In particular, we have identified three potential areas for further research. First, why do MPs from some social groups participate more than others in Lok Sabha proceedings? Are social groups merely place-holders for some other attributes that drive one set of MPs to participate less and another to participate more? Second, what explains the puzzling state patterns that we uncover? Are state effects picking up some other attributes, or is there something about regional background that affects legislative behav-iour? Third, independently of the legislative status of MPs (opposition/government), what is the role of political parties in influencing legislator behaviour? Presumably, parties are not simply instruments of representation, but also instruments of collective action, so that it is important to know how their floor strategies differ, how they time their interventions and in general the relationship between party legislative organizations and legislator imperatives.
Further, branching out beyond the volume of parliamentary questions, it would be useful to explore the subject matter of questions, the timing of questions and the ministries to which questions are posed. Such lines of enquiry can reveal agenda-setting dynamics within the Indian political system. Posing these questions is indeed significant to illuminate the deliberative and political space that exists beyond
at Istanbul Universitesi on November 4, 2014inp.sagepub.comDownloaded from
16 Srikrishna Ayyangar and Suraj Jacob
Studies in Indian Politics, 2, 1 (2014): 1–19
the confines of rules and formal arenas, and it can help reveal systematic patterns of how agendas are set, controlled and compromised.
Notes
1. We wish to thank the staff at the Mortensen library at the University of Hartford for procuring all the Lok Sabha volumes; and Mathew Idiculla for valuable research assistance.
2. We note some exceptions. Datta (2008) studies television coverage and argues that it creates incen tives for senior party members to crowd out junior members from being telecast live during Question Hour. And Haritash and Gupta (2002) survey party participation with regard to science and technology issues in the 10th Lok Sabha.
3. SCs have had 2 per cent and STs 0.5 per cent more seats than their reserved quota (Jayal, 2006). 4. Their share has averaged about 50 per cent of parliament; it is higher among constituencies in the Eastern states
and considerably lower in constituencies from the Southern and Northeastern states (Jayal, 2006). Data on caste representation are from Tables 2.9, 2.11 and 2.13 of Shankar and Rodrigues (2010). For an analysis of represen-tation in state legislatures, especially in terms of the declining importance of upper castes, see the edited volume by Jaffrelot and Kumar (2012). Geographic inequalities also exist because some states, and Union Territories have fewer MPs per population than others (Joshi, 2012).
5. The data reported in this paragraph are from Tables 2.1, 2.2, 2.7, 2.8 and 2.14 of Shankar and Rodrigues (2010). 6. See Chhibber and Nooruddin (2004) for an argument on how party system fragmentation affects constituency
service. At the national level, Nooruddin (2011) questions the stereotype that equates coali tion governments with ineffectiveness.
7. However, there are some exceptions. Some studies examining the performance of hitherto marginal ized groups such as the Scheduled Castes (Kumar 2008; Narayana 1978) point out that such groups were much more effec-tive than average MPs in representing the interests of their constituents by establishing, monitoring and resisting cutbacks to preferential policies (Galanter, 1979).
8. The literature has also explored party effects on parliamentary questions—the role of individual parties (Blidook & Kerby, 2011; Rasch, 2011), party size and ideology (Bailer, 2011), congruence in behaviour of legislators from the same party (Depauw & Martin, 2008), and party discipline (Dandoy, 2011).
9. Other than the issue of overall legislative participation, there is also a literature which explores the more specific question of whether legislators belonging to specific groups ask more questions on policies/issues pertinent to that group. For instance, women may ‘feel a particular, gendered duty to represent women’s perspectives on issues popularly construed as “women’s issues”’ (Catalano, 2009, p. 47). Saalfeld (2011) finds that in England, minority ethnic legislators ask more parliamentary questions on minority-related issues. However, since we explore only volume of questions and not question content, we do not engage with this part of the literature.
10. See the special issue on the Question Hour of The Journal of Legislative Studies (17:3), 2011. 11. The secretariat publishes end-of-term reports, or ‘statements’, detailing duration of sittings, enact ments, budget-
ary legislation transacted, the status of motions, discussions and resolutions. Statement 28 of each report con-tains information on questions admitted from each MP during the term of that particular Lok Sabha.
12. Data are not available to differentiate between questions scheduled to be asked and those that were actually asked.
13. We exclude the Lok Sabha between 1989 and 1991 because opposition status of parties was unclear during that period. The 1989–91 Lok Sabha was run by a coalition government (the National Front coalition) with outside support from left parties and the BJP, but in 1990a group of breakaway MPs under Chandrasekhar formed the government with outside support from the Congress Party.
14. While the quality of data provided by the Election Commission is generally very good, often the names of candidates were not standardized across elections. We used an algorithm to match the names of candidates across elections and districts to generate the variables for MPs’ prior experience. We thank Naveen Singhal for
at Istanbul Universitesi on November 4, 2014inp.sagepub.comDownloaded from
Studying the Indian Legislature 17
Studies in Indian Politics, 2, 1 (2014): 1–19
devising the algorithm. The values generated by the algorithm were double-checked manually to eliminate false positives.
15. We define a minister to be an MP who was minister at any point in the corresponding Lok Sabha, but since many MPs go in and out of ministership in the duration of the same Lok Sabha, this over-estimates the minister effect and under-estimates the backbencher effect.
16. For instance, see the articles in the special issue of The Journal of Legislative Studies (17:3) devoted to par-liamentary questions. NBR is a generalization of the Poisson regression since it has the same mean structure but an extra parameter to model the over-dispersion. After model estimation, we ran likelihood ratio tests for a = 0 to check whether NBR is more appropriate than the Poisson model. In all cases, we reject the hypothesis that a = 0.
17. To see that the NBR and OLS results are similar, consider the case of MPs from ST constituencies. The NBR coefficient in Column (1) is –0.299, which produces an IRR (exponentiated coefficient) of 26 per cent fewer questions than MPs from unreserved constituencies. The OLS coefficient in Column (3) is –0.112. Given that the average number of questions asked per day is 0.42, this works out to –0.112/0.42 = 26.7 per cent fewer questions from MPs from ST constituencies, making the figure comparable to the estimate of 26 per cent in Column (1).
18. The models also include year fixed effects to account for influences that are common across legis lators but differ across Lok Sabhas. The estimates show that there is a mild, uneven time trend towards fewer questions, with MPs in the 1991–1996 and 1999–2004 in particular asking fewer questions (about 18 per cent fewer questions than legislators from the 1980–1985 or 1985–1989 Lok Sabhas), as discussed previously (Table 1). For reasons of space, we do not present these results here.
19. We also uncovered other intriguing patterns not reported here. For instance, MPs from Kerala, Himachal Pradesh, Haryana and the Union Territories tend to ask fewer questions when they are in opposition than when they are in government.
20. In the eight Lok Sabhas in 1980–2009, there are two instances of single-party governments (1980–1985 and 1985–1989); three instances of coalition governments (1991–1996, 1999–2004 and 2004–2009) and five instances of substantial ‘outside support’ for a coalition government (December 1989–November 1990) under V. P. Singh with support from the Left Front and the BJP, November 1990–June 1991 under Chandrashekhar with support from the Congress Party, June 1996–April 1997 under Deve Gowda and April 1997–March 1998 under I. K. Gujral (both with Congress Party support) and March 1998–Apr 1999 under Vajpayee with outside support from TDP and the Trinamool Congress). See Arora (2004) for a discussion of this phenomenon.
21. Further tests reveal that the difference between governing single-party and coalition MPs is not statistically significant.
References
Agrawal, A. (2005). The Indian Parliament. In Kapur, D., & Mehta, P. B. (Eds.), Public institutions in India: Performance and design (pp. 28–42). New Delhi: Oxford University Press.
Arora, B. (2004). The political parties and the party system: The emergence of new coalitions. In Hasan, Z. (Ed.), Parties and party politics in India (pp. 475–503). New Delhi: Oxford University Press.
Arora, S. K. (1973). Social background of the fifth Lok Sabha. Economic and Political Weekly, 8(31/33), 1433–1440. Bailer, S. (2011). People’s voice or information pool? The role of, and reasons for, parliamentary questions in the
Swiss Parliament. The Journal of Legislative Studies, 17(3), 302–314. Banerjee, S. (2006). Salvaging an endangered institution. Economic and Political Weekly, 41(36), 3837–3841. Bird, K. (2005). Gendering parliamentary questions. British Journal of Politics and International Relations, 7(3),
353–370. Blidook, K., & Kerby, M. (2011). Constituency influence on ‘constituency members’: The adaptability of roles to
electoral realities in the Canadian case. The Journal of Legislative Studies, 17(3), 327–339.
at Istanbul Universitesi on November 4, 2014inp.sagepub.comDownloaded from
18 Srikrishna Ayyangar and Suraj Jacob
Studies in Indian Politics, 2, 1 (2014): 1–19
Catalano, A. (2009). Women acting for women? An analysis of gender and debate participation in the British House of Commons, 2005–2007. Politics & Gender, 5(1), 45–68.
Chhibber, P., & Nooruddin, I. (2004). Do party systems count? The number of parties and government performance in the Indian states. Comparative Political Studies, 37(2), 152–187.
Dandoy, R. (2011). Parliamentary questions in Belgium: Testing for party discipline. The Journal of Legislative Studies, 17(3), 315–326.
Datta, S. (2008). Television coverage and political voice: Evidence from parliamentary Question Hour in India. Working Paper 1281627, Social Science Research Network (SSRN).
Depauw, S., & Martin, S. (2008). Legislative party discipline and cohesion in comparative perspective. In Giannetti, D., & Benoit, K. (Eds.), Intra-Party Politics and Coalition Government (pp. 103–120). London: Routledge.
Dutta, R. (1969). The party representative in fourth Lok Sabha. Economic and Political Weekly, 4(1/2), 179–189. EPW Editorial. (2009). Decline or death of parliament? Economic and Political Weekly, 48(2), 6. Galanter, M. (1979). Compensatory discrimination in political representation: A preliminary assessment of India’s
thirty-year experience with reserved seats in legislatures. Economic and Political Weekly, 14(7/8), 437–454. Haritash, N., & Gupta, B. M. (2002). Mapping of S & T issues in the Indian parliament: A scientometric analysis of
questions raised in both houses of the parliament. Scientometrics, 54(1), 91–102. Hausman, J. A., Hall, B. H., & Griliches, Z. (1984). Econometric models for count data with an application to the
patents – R & D relationship. Econometrica, 52(4), 909–938.Hewitt, V., & Rai, S. M. (2010). The Indian parliament. In Jayal, N. G., & Mehta, P. B. (Eds.), The Oxford Companion
to Politics in India (pp. 28–42). New Delhi: Oxford University Press. Hibbing, J. R. (1991). Congressional careers: Contours of life in the U.S. House of Representatives. Chapel Hill,
NC: University of North Carolina Press. Hix, S., & Noury, A. (2011). Government-opposition or left-right? The institutional determinants of voting in leg-
islatures (Unpublished).Jaffrelot, C. (2003). India’s silent revolution: The rise of the low castes in North Indian politics. New Delhi:
Permanent Black. Jaffrelot, C., & Kumar, S. (2012). Rise of the plebeians?: The changing face of the Indian legislative assemblies.
New Delhi: Routledge. Jayal, N. G. (2006). Representing India: Ethnic diversity and the governance of public institutions. Basingstoke:
Palgrave Macmillan. Jhunjhunwala, B. (1975). Parliamentary process as a stabilization mechanism. Social Scientist, 3(6/7), 112–121. Joshi, D. (2012). Who gets unequal parliamentary representation? A comparison of India and Sri Lanka.
Contemporary South Asia, 20(3), 401–406. Kapur, D., & Mehta, P. B. (2006). The Indian Parliament as an institution of accountability. Geneva, Switzerland:
United Nations Research Institute for Social Development. Kashyap, S. C. (1990). A new parliamentary initiative: Subject-based standing committees of parliament. Economic
and Political Weekly, 25(40), 2273–2279. Kaushik, A., & Pal, R. (2012). How representative has the Lok Sabha been? Economic & Political Weekly,
47(19), 75. Kaushik, S. (1992). Women and political participation. In Sankaran, K. (Ed.), Women in politics: Forms and pro-
cesses (pp. 35–54). New Delhi: Friedrich Ebert Stiftung. Kumar, N. (2008). Formulation of inclusive policies in parliament. Economic and Political Weekly, 43(29), 80–87. Lok Sabha Secretariat. (2003). Indian parliamentary companion: Who’s who of members of Lok Sabha: First to
thirteenth Lok Sabha. Delhi: Lok Sabha Secretariat. ———. (2004). Council of Ministers, 1947–2004: Names and portfolios of the members of the Union Council of
Ministers, from15 August 1947 to 25 May 2004. Delhi: Lok Sabha Secretariat. Murray, R. (2010). Second among unequals? A study of whether France’s ‘quota women’ are up to the job. Politics
& Gender, 6(1), 93–118.
at Istanbul Universitesi on November 4, 2014inp.sagepub.comDownloaded from
Studying the Indian Legislature 19
Studies in Indian Politics, 2, 1 (2014): 1–19
Narayana, G. (1978). Social background of Scheduled Caste Lok Sabha members, 1962–71. Economic and Political Weekly, 13(37), 1603–1608.
National Social Watch. (2009). Citizens report on governance and development 2008. New Delhi: National Social Watch.
Nooruddin, I. (2011). Coalition politics and economic development: Credibility and the strength of weak govern-ments. Cambridge, UK: Cambridge University Press.
Pai, S. (2002). Dalit assertion and the unfinished democratic revolution: The Bahujan Samaj Party in Uttar Pradesh. New Delhi: SAGE.
Paul, S., & Vivekananda, M. (2004). Holding a mirror to the new Lok Sabha. Economic and Political Weekly, 39(45), 4927–4934.
Rasch, B. E. (2011). Behavioural consequences of restrictions on plenary access: Parliamentary questions in the Norwegian Storting. The Journal of Legislative Studies, 17(3), 382–393.
Rubinoff, A. G. (1996). India’s new subject-based parliamentary standing committees. Asian Survey, 36(7), 723–738. Russo, F., & Wiberg, M. (2010). Parliamentary questioning in 17 European parliaments: Some steps towards com-
parison. The Journal of Legislative Studies, 16(2), 215–232. Saalfeld, T. (2011). Parliamentary questions as instruments of substantive representation: Visible minorities in the
UK House of Commons, 2005–10. The Journal of Legislative Studies, 17(3), 271–289. Salmond, R. (2004). Grabbing governments by the throat: Question time and leadership in New Zealand’s parlia-
mentary opposition. Political Science, 56(2), 75–90. Sanghvi, N. (1987). Creeping atrophy. Economic and Political Weekly, 22(10), 398–399. Shankar, B. L., & Rodrigues, V. (2010). The Indian Parliament: A democracy at work. New Delhi: Oxford University
Press. Spary, C. (2010). Disrupting rituals of debate in the Indian Parliament. The Journal of Legislative Studies, 16(3),
338–351. Taylor-Robinson, M. M., & David, S. J. (2002). Who participates and who is seen and not heard? Evidence from the
Honduran Congress. The Journal of Legislative Studies, 8(1), 10–36.Wallack, J. S. (2008). India’s parliament as a representative institution. India Review, 7(2), 91–114.
at Istanbul Universitesi on November 4, 2014inp.sagepub.comDownloaded from