Embed Size (px)
Citation preview
Fruit South Africa Submission to the Ports Regulator iro TNPA Tariff Application 2015/16 Page 1
The Chairman
Ports Regulator of South Africa
Private Bag X54322
Durban
4000
By Email: [email protected]
Submission to the National Ports Regulator of South
Africa
Reference: Transnet National Ports Authority (TNPA)
Tariff Application 2015/16
Submission 1: 16th October 2014
Presented by: The FSA Port Tariffs and Regulatory Committee
Committee Members: Dr Konanani Liphadzi (FSA), Mr Anton Kruger (FPEF), Mr Andy
Connell (FPEF), Mr Geoff Croxford (FPEF), Mr Andre van Wyk (SATI) and Mr Mitchell Brooke
(CGA)
Author: ML Brooke
Email: [email protected]
Fruit South Africa Submission to the Ports Regulator iro TNPA Tariff Application 2015/16 Page 2
Table of Figures
Figure 1: Transnet 2013 MDS Volume Forecast Projections FY2012/13 – FY2018/19 (Source:
MDS) ......................................................................................................................................... 6
Figure 2: Chart reflecting container projections to be handled at South African ports
FY2011/12 – FY2018/19. (Source: The MDS vs. the TNPA Tariff Application FY2015/16) ...... 7
Figure 3: TNPA CAPEX Allocation per Region ......................................................................... 10
Figure 4: TNPA Total CAPEX allocation per tariff application ................................................ 10
Figure 5: Average South African Fruit Export Logistics Costs for container of fruit to Europe
Market (Source: FSA Data) ..................................................................................................... 20
Table of Tables
Table 1: TNPA Volume Projections FY2011/12 – FY2017/18 (Source: TNPA Tariff Applications)
.................................................................................................................................................. 8
Table 2: TNPA Capex Allocation FY2014/15 - 2020/21 (Source: TNPA Tariff Application
FY2015/16) ............................................................................................................................... 8
Table 3: CAPEX indications from TNPA tariff applications (Source: TNPA Tariff Applications) 9
Table 4: Return on Capital Projections .................................................................................. 12
Table 5: TNPA Operating Expenditure between FY 2013/14 – FY2017/18 ............................ 15
Table 6: FSA Committee’s proposed changes to the tariff base ............................................ 18
Table 7: Comparison of Fruit tariff vs. Mineral tariff FY2014/15 ........................................... 19
Table 8: Comparison of fruit export containerized cargo due tariffs vs. Break-bulk cargo dues
tariffs FY2014/15 .................................................................................................................... 19
Table 9: Transnet SOC Gross Tariff Revenue Generation from Fruit Exports (Source: PPECB)
................................................................................................................................................ 22
Preamble
The Fruit South Africa (FSA) Port Tariffs and Regulatory Committee (hereon referred to as
The Committee) has drafted this submission on behalf of constituents of Fruit South Africa.
Constituents of FSA comprise The Citrus Growers Association of Southern Africa (CGA), The
South African Table Grape Industry (SATGI), Hortgro Services (HORTGRO), The Subtropical
Association of South Africa (SUBTROPS) and The Fresh Produce Exporters Forum (FPEF).
Members of these associations comprise all producers and marketing agents of fruit for
exporting purposes; this is a statutory requirement as approved by the Minister of the
Fruit South Africa Submission to the Ports Regulator iro TNPA Tariff Application 2015/16 Page 3
Department of Agriculture, Forestry and Fisheries in terms of sections 15, 18 and 19 of the
Marketing of Agricultural Products Act no. 47 of 1996.
The Committee urges the Ports Regulator to exercise due diligence in consideration of the
Authorities tariff application for 2015/16. The Committee further implores the Regulator to
exercise its mandate to ensure that utilization of the national asset “the ports” is
commensurate to the Authorities policy statement, “Transnet’s commitment to reducing the
cost of doing business in South Africa”.
The Committee has identified the following criteria to be of importance in response to the
2015/16 tariff application by the Authority,
1. Comments on the National Ports Act, 2005 (Act No. 12 of 2005) and the
Implementation of the Requirements by the Authority in Adhering to the Act,
2. Comments on the Transnet SOC Market Demand Strategy (MDS) in Relation to the
TNPA Capital Expenditure Projections,
3. Comments on the Ports Regulator of South Africa Regulatory Manual for the Tariff
Years 2015/16 – 2017/18.
4. Comments on the Authorities (TNPA) Application for FY 2015/16,
4.1. Comments on the Revenue Required (RR) Components in the Context of the
Application,
4.2. Comments on the Authorities Operating Expenditure,
4.3. Comments on the Authorities Cargo Volume Projections,
5. Submission on Fruit Export Port Tariff Charges,
6. Submission on Fruit Export Related Supply Chain Costs with Special Emphasis on
Transnet SOC Revenue Generated from Fruit Exports,
7. Conclusions and Key Recommendations
These points are considered hereunder.
Fruit South Africa Submission to the Ports Regulator iro TNPA Tariff Application 2015/16 Page 4
1. Comments on the National Ports Act, 2005 (Act No. 12 of 2005) and the
Implementation of the Requirements by the Authority in Adhering to the Act
In terms of section (2) of the Act, the Committee wishes to express that it is of the view that
the Authority has not effectively met certain objectives as outlined in the Act, specifically
with regards to-
a) not sufficiently promoting an effective and productive South Africa ports industry
that is capable of contributing to the economic growth and development of our
country; specifically in regards to the Durban port system,
b) promote and improve efficiency and performance in the management and operation
of ports; specifically in regards to the Durban port system,
c) facilitate the development of technology, information systems and managerial
expertise through private sector involvement and participation, and
d) promote the development of an integrated regional production and distribution
system in support of government’s policies.
It must be further brought to the attention of the Regulator that proposals have been tabled
with the Authority to introduce a truck staging zone in the Durban port for the staging of port
bound cargo. This to effectively control frequent and continued congestion in and around
the port of Durban. This proposal has not been acknowledged by the Authority. Furthermore
the Authority as landlord of space located within the port precinct of Durban, has not
adequately apportioned the use of land and entered into lease agreements with tenants so
as to mitigate the continued congestion in the port of Durban. Specific mention can be drawn
on the Bayhead precinct in the Durban port which by virtue of the tenant base and the
business conducted by those tenants as being a main contributor to the continued and
ongoing congestion in the Bayhead precinct.
In terms of Section 12 (c) of the Act, it stipulates that the aim of the Authority is to - enable
the port users to access the port system in the most efficient way possible. The Committee
wishes to highlight the continual and reoccurring congestion in the Durban port. It is deemed
by the Committee that the Authority has not applied sufficient measures to adhere to this
requirement as required by the Act.
In terms of Section 72 (1) (a) of the Act, Transnet National Ports Authority, a division of
Transnet SOC Limited is required, with the approval of the Ports Regulator, to determine
tariffs for services and facilities offered by the Authority and to annually publish a tariff book
Fruit South Africa Submission to the Ports Regulator iro TNPA Tariff Application 2015/16 Page 5
containing those tariffs. The Port Directives were approved on 13 July 2009 (gazetted on 06
August 2009) and amended on 29 January 2010. In terms of these Directives, when
considering the proposed tariffs for the Authority, the Regulator must ensure that such tariffs
allow the Authority to:
I. Recover its investment in owning, managing, controlling and administering Ports and
its investment in port services and facilities;
II. Recover its costs in maintaining, operating, managing, controlling and administering
Ports and its costs in providing port services and facilities; and
III. Earn a return commensurate with the risk of owning, managing, controlling and
administering ports and of providing port services and facilities.
The Committee agrees in part that the authority should:
I. Recover its investment in port services and facilities; provided the recovery is not
deemed excessive and a burden to the country. The Committee wishes to express
that the cost of the Regulatory Asset Base (RAB) as determined in the ports Tariff
Methodology contained within the Required Revenue (RR) methodology is
considered excessive.
II. Recover its cost of operations to provide a service; provided the recovery is fair and
equitable and in line with those services rendered to operate the ports efficiently
and effectively. The committee would like to convey that the Authorities annual
increase in Operating Costs grossly exceeds that of inflation.
The Committee however does not agree in full that the authority should:
I. Earn a return commensurate with the risk of owning, managing, controlling and
administering ports and of providing port services and facilities. The South African
ports are national strategic asset operated to facilitate trade. The cost for services
provided by the authority should be an enabler and contributor toward the
competitiveness of South African trade. The financial structure of the national
strategic asset should not be balanced against the recovery of opportunity cost of
capital employed but rather be structured to enhance the competitiveness of the
economy. The Committee calls for a review of this directive with the view of an
amendment of such directive in the interest of protecting and enhancing the
competitiveness of Southern African trade.
Fruit South Africa Submission to the Ports Regulator iro TNPA Tariff Application 2015/16 Page 6
2. Comments on the Transnet SOC Market Demand Strategy (MDS) in Relation to the
TNPA Capital Expenditure Projections
The South African fruit export business utilizes 90% of containerized sea transport to export
fruit to global markets. The specific services and infrastructure rendered by the Transnet SOC
Limited operating divisions for containerized cargo, is a key component in consideration of
the Transnet MDS. In terms of the MDS initiated and presented in 2013, Transnet forecast a
capital expenditure plan of R307bn over the period of 7 years FY2012/13 – FY2018/19. A
planned Capital Expenditure (Capex) of R47bn (15.6%) is shown to be allocated by TNPA
which to be funded by financing of cargo dues and other. R24bn (8%) is reflected to be
allocated towards containerized services and infrastructure projects across all operating
divisions. Transnet Port Terminals (TPT) is shown to allocate R9.8bn (3.3%) towards
containerized business projects specifically and this Capex will be financed through Terminal
Handling Charges (THC’s) and other. In summary the Transnet MDS Capex program was
shown to be allocated primarily to non-containerized business. Of the 8 ports (transit
corridors) in which TNPA operate, R146.8bn was to be allocated of which R78.5bn (53.4%) is
reflected as non-containerized business in the ports of Saldanha and Richards Bay.
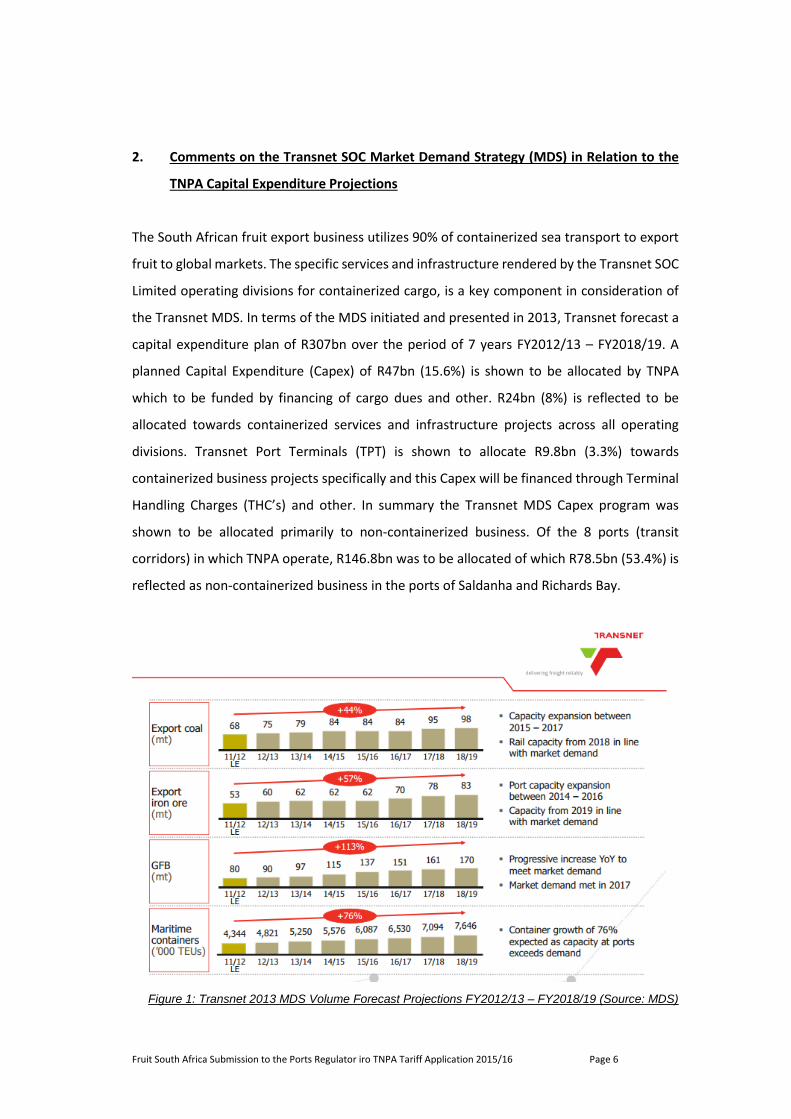
Figure 1: Transnet 2013 MDS Volume Forecast Projections FY2012/13 – FY2018/19 (Source: MDS)
Fruit South Africa Submission to the Ports Regulator iro TNPA Tariff Application 2015/16 Page 7
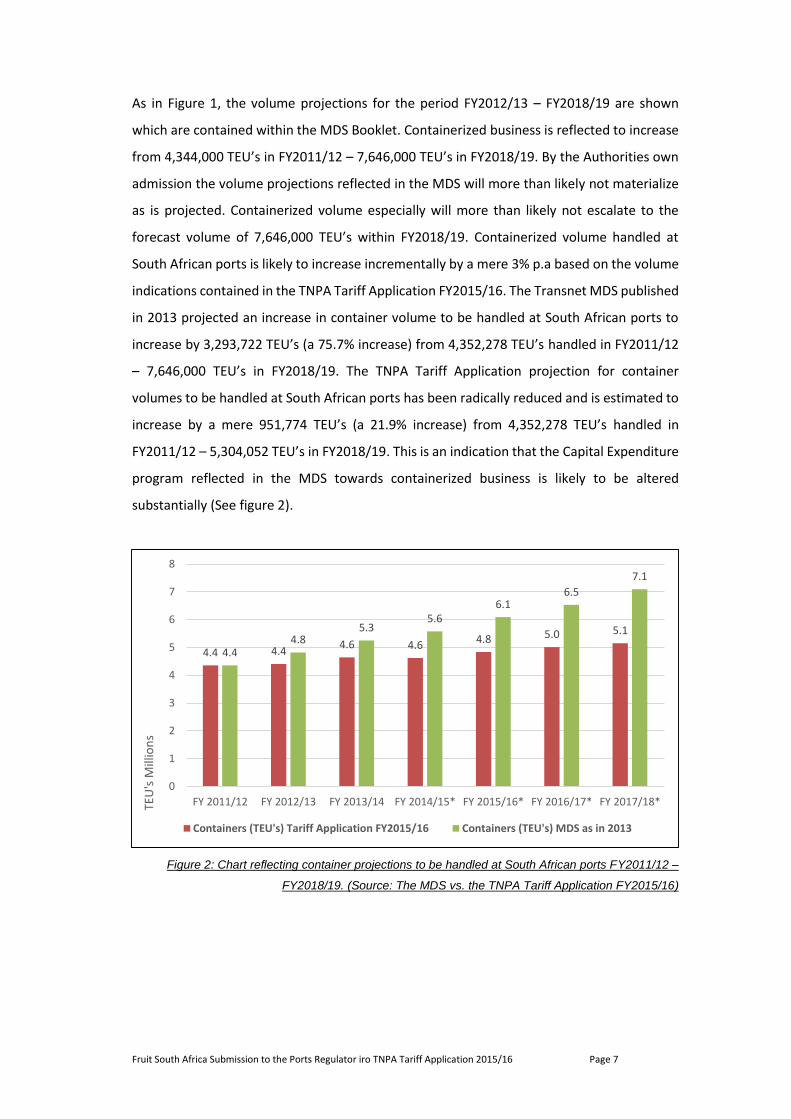
As in Figure 1, the volume projections for the period FY2012/13 – FY2018/19 are shown
which are contained within the MDS Booklet. Containerized business is reflected to increase
from 4,344,000 TEU’s in FY2011/12 – 7,646,000 TEU’s in FY2018/19. By the Authorities own
admission the volume projections reflected in the MDS will more than likely not materialize
as is projected. Containerized volume especially will more than likely not escalate to the
forecast volume of 7,646,000 TEU’s within FY2018/19. Containerized volume handled at
South African ports is likely to increase incrementally by a mere 3% p.a based on the volume
indications contained in the TNPA Tariff Application FY2015/16. The Transnet MDS published
in 2013 projected an increase in container volume to be handled at South African ports to
increase by 3,293,722 TEU’s (a 75.7% increase) from 4,352,278 TEU’s handled in FY2011/12
– 7,646,000 TEU’s in FY2018/19. The TNPA Tariff Application projection for container
volumes to be handled at South African ports has been radically reduced and is estimated to
increase by a mere 951,774 TEU’s (a 21.9% increase) from 4,352,278 TEU’s handled in
FY2011/12 – 5,304,052 TEU’s in FY2018/19. This is an indication that the Capital Expenditure
program reflected in the MDS towards containerized business is likely to be altered
substantially (See figure 2).
Figure 2: Chart reflecting container projections to be handled at South African ports FY2011/12 –
FY2018/19. (Source: The MDS vs. the TNPA Tariff Application FY2015/16)
4.4 4.44.6 4.6 4.8 5.0 5.1
4.44.8
5.35.6
6.16.5
7.1
0
1
2
3
4
5
6
7
8
FY 2011/12 FY 2012/13 FY 2013/14 FY 2014/15* FY 2015/16* FY 2016/17* FY 2017/18*TEU
's M
illio
ns
Containers (TEU's) Tariff Application FY2015/16 Containers (TEU's) MDS as in 2013
Fruit South Africa Submission to the Ports Regulator iro TNPA Tariff Application 2015/16 Page 8
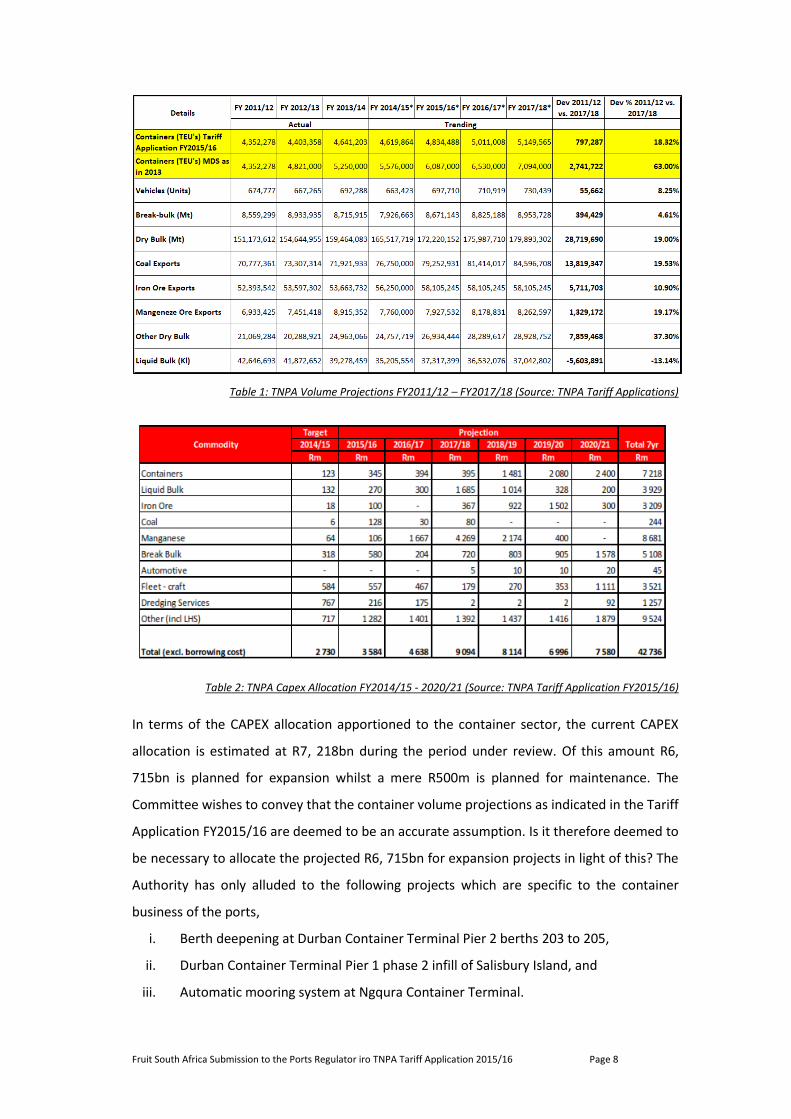
Table 1: TNPA Volume Projections FY2011/12 – FY2017/18 (Source: TNPA Tariff Applications)
Table 2: TNPA Capex Allocation FY2014/15 - 2020/21 (Source: TNPA Tariff Application FY2015/16)
In terms of the CAPEX allocation apportioned to the container sector, the current CAPEX
allocation is estimated at R7, 218bn during the period under review. Of this amount R6,
715bn is planned for expansion whilst a mere R500m is planned for maintenance. The
Committee wishes to convey that the container volume projections as indicated in the Tariff
Application FY2015/16 are deemed to be an accurate assumption. Is it therefore deemed to
be necessary to allocate the projected R6, 715bn for expansion projects in light of this? The
Authority has only alluded to the following projects which are specific to the container
business of the ports,
i. Berth deepening at Durban Container Terminal Pier 2 berths 203 to 205,
ii. Durban Container Terminal Pier 1 phase 2 infill of Salisbury Island, and
iii. Automatic mooring system at Ngqura Container Terminal.
Fruit South Africa Submission to the Ports Regulator iro TNPA Tariff Application 2015/16 Page 9
The Committee wishes to express that the allocation of CAPEX to the Pier 1 infill phase 2
should not commence prior to the reconstruction of the entry lanes along Bayhead Road to
DCT Pier 1 and 2. Another point to allude on is whether it is necessary to expand the capacity
of Pier 1. Increased productivity and proactive planning of both DCT Pier 1 and Pier 2 would
increase the terminal throughput thus increasing the overall capacity of both terminals.
Increasing berthing capacity at DCT Pier 1 will cause additional congestion on the already
over congested entry lanes along Bayhead road leading to the Bayhead precinct, DCT Pier 2,
DCT Pier 1 and the Cutler Complex (Island View).
A further point of consideration is to ring-fence the CAPEX allocated to non-containerized
business where specific commodities are allocated higher tariff increases relative to the
CAPEX allocation. E.g. the CAPEX allocation for the transfer of the Manganese and Liquid Bulk
commodities handled at Port Elizabeth to newly constructed terminals at Ngqura. The
Authority has indicated in presentations that the Manganese and Liquid Bulk terminals in
Port Elizabeth are to be replaced by an additional RoRo terminal. The Committee asks is it
necessary to incur such an expense in light of the Authorities forecasted volume of
Manganese and Liquid Bulk?
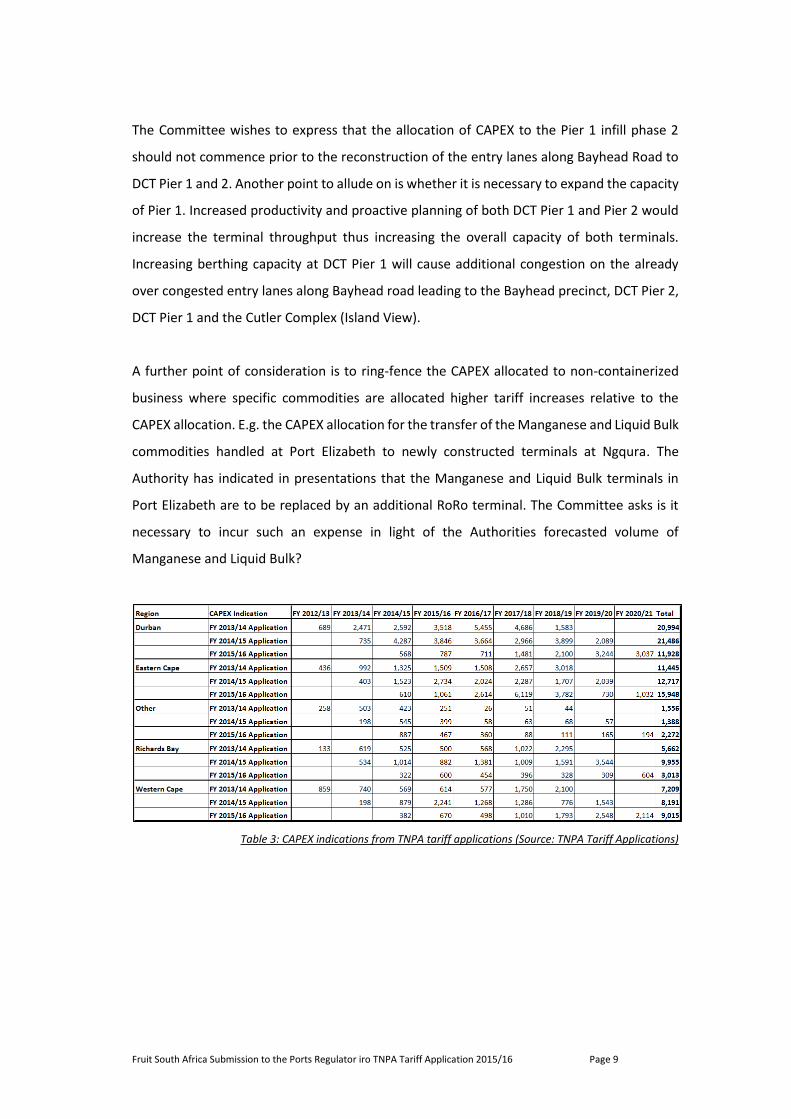
Table 3: CAPEX indications from TNPA tariff applications (Source: TNPA Tariff Applications)
Fruit South Africa Submission to the Ports Regulator iro TNPA Tariff Application 2015/16 Page 10
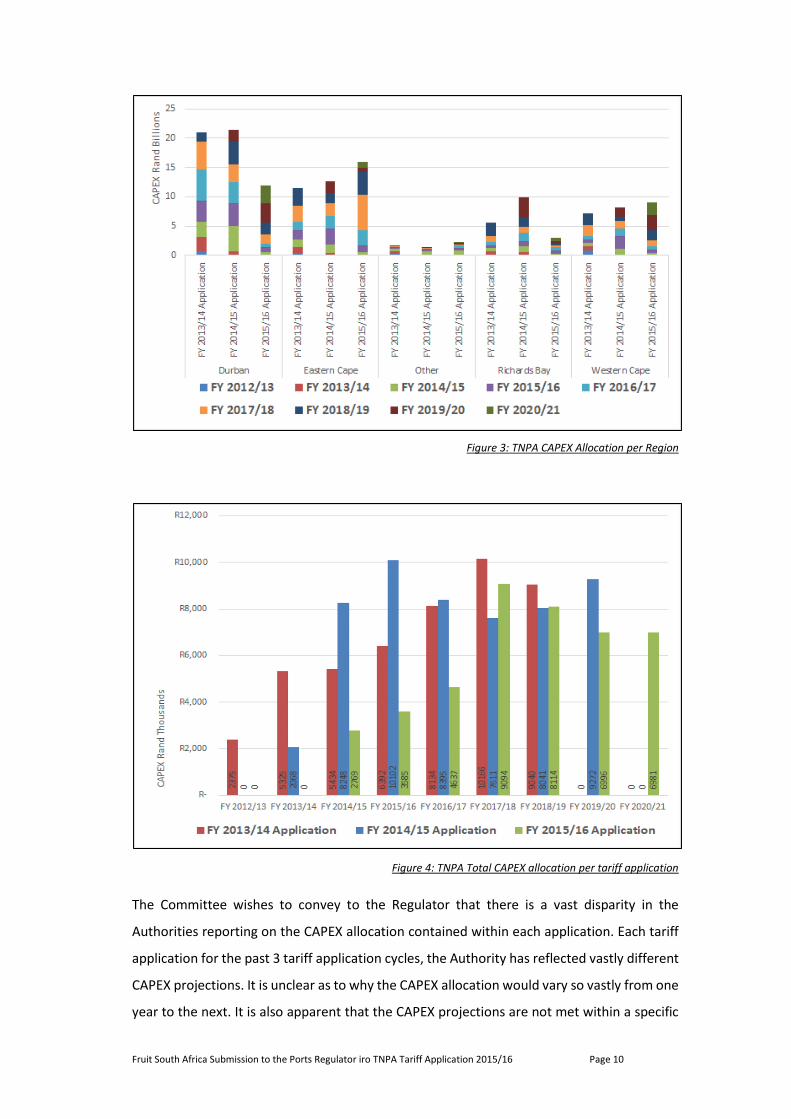
Figure 3: TNPA CAPEX Allocation per Region
Figure 4: TNPA Total CAPEX allocation per tariff application
The Committee wishes to convey to the Regulator that there is a vast disparity in the
Authorities reporting on the CAPEX allocation contained within each application. Each tariff
application for the past 3 tariff application cycles, the Authority has reflected vastly different
CAPEX projections. It is unclear as to why the CAPEX allocation would vary so vastly from one
year to the next. It is also apparent that the CAPEX projections are not met within a specific
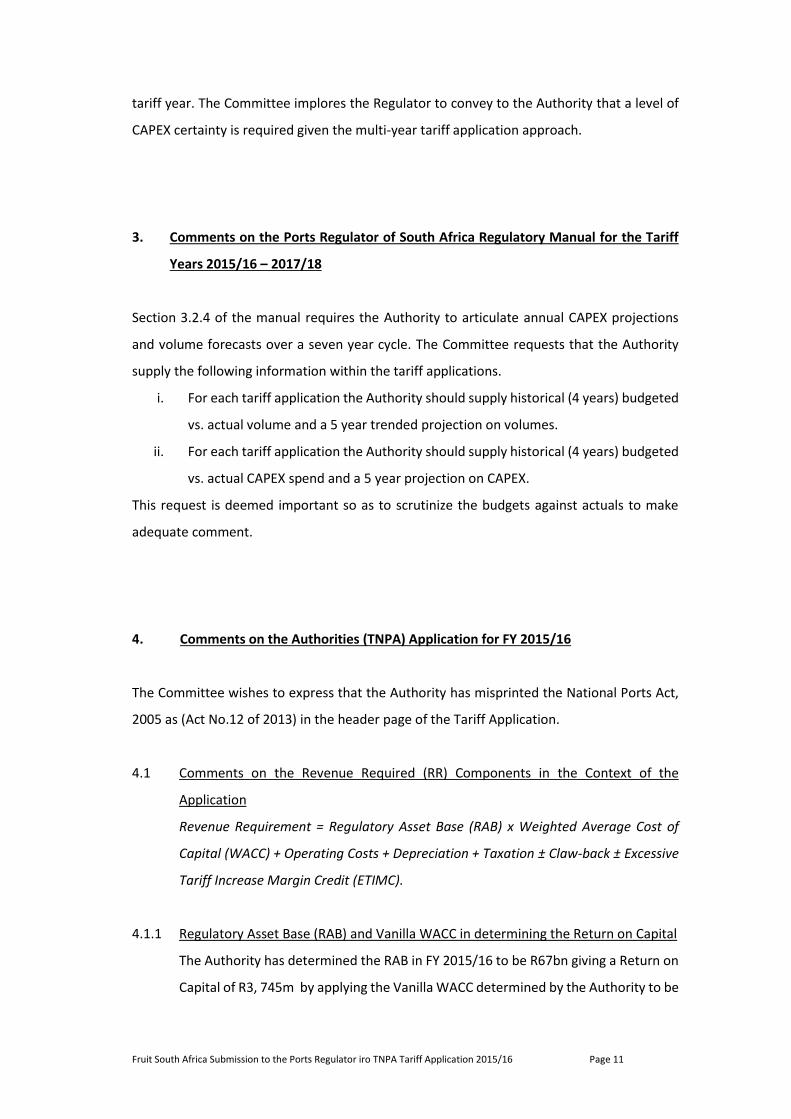
Fruit South Africa Submission to the Ports Regulator iro TNPA Tariff Application 2015/16 Page 11
tariff year. The Committee implores the Regulator to convey to the Authority that a level of
CAPEX certainty is required given the multi-year tariff application approach.
3. Comments on the Ports Regulator of South Africa Regulatory Manual for the Tariff
Years 2015/16 – 2017/18
Section 3.2.4 of the manual requires the Authority to articulate annual CAPEX projections
and volume forecasts over a seven year cycle. The Committee requests that the Authority
supply the following information within the tariff applications.
i. For each tariff application the Authority should supply historical (4 years) budgeted
vs. actual volume and a 5 year trended projection on volumes.
ii. For each tariff application the Authority should supply historical (4 years) budgeted
vs. actual CAPEX spend and a 5 year projection on CAPEX.
This request is deemed important so as to scrutinize the budgets against actuals to make
adequate comment.
4. Comments on the Authorities (TNPA) Application for FY 2015/16
The Committee wishes to express that the Authority has misprinted the National Ports Act,
2005 as (Act No.12 of 2013) in the header page of the Tariff Application.
4.1 Comments on the Revenue Required (RR) Components in the Context of the
Application
Revenue Requirement = Regulatory Asset Base (RAB) x Weighted Average Cost of
Capital (WACC) + Operating Costs + Depreciation + Taxation ± Claw-back ± Excessive
Tariff Increase Margin Credit (ETIMC).
4.1.1 Regulatory Asset Base (RAB) and Vanilla WACC in determining the Return on Capital
The Authority has determined the RAB in FY 2015/16 to be R67bn giving a Return on
Capital of R3, 745m by applying the Vanilla WACC determined by the Authority to be
Fruit South Africa Submission to the Ports Regulator iro TNPA Tariff Application 2015/16 Page 12
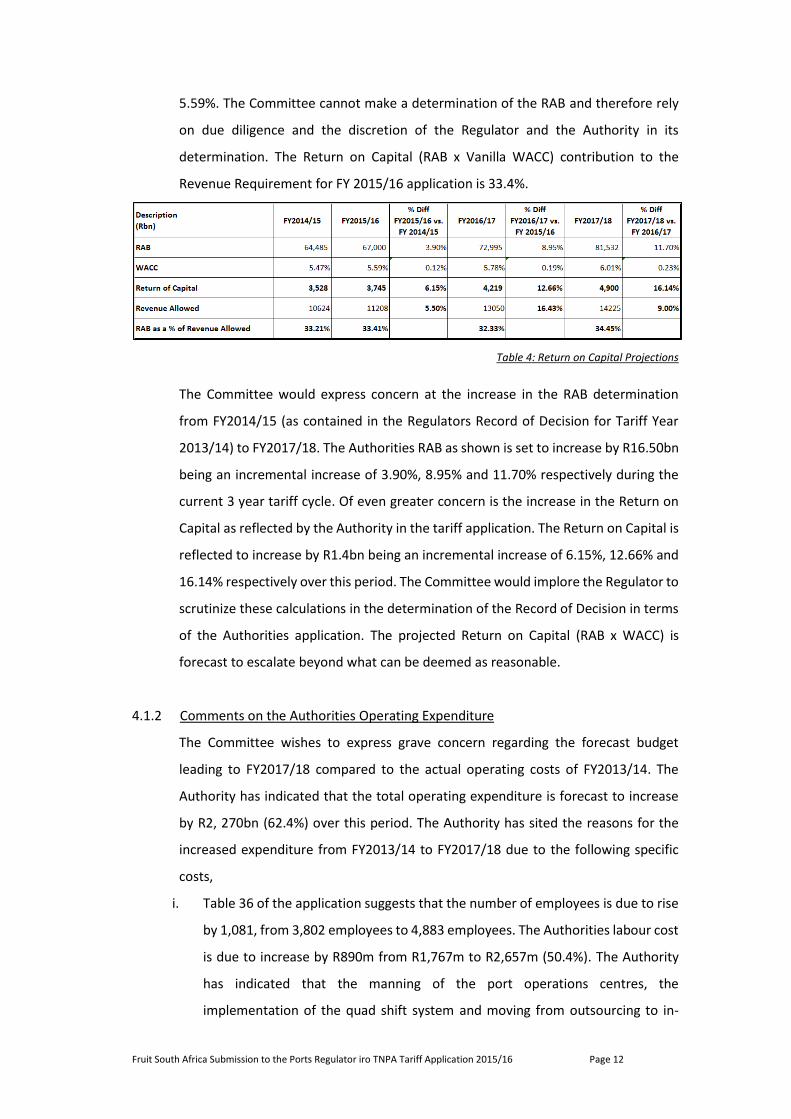
5.59%. The Committee cannot make a determination of the RAB and therefore rely
on due diligence and the discretion of the Regulator and the Authority in its
determination. The Return on Capital (RAB x Vanilla WACC) contribution to the
Revenue Requirement for FY 2015/16 application is 33.4%.
Table 4: Return on Capital Projections
The Committee would express concern at the increase in the RAB determination
from FY2014/15 (as contained in the Regulators Record of Decision for Tariff Year
2013/14) to FY2017/18. The Authorities RAB as shown is set to increase by R16.50bn
being an incremental increase of 3.90%, 8.95% and 11.70% respectively during the
current 3 year tariff cycle. Of even greater concern is the increase in the Return on
Capital as reflected by the Authority in the tariff application. The Return on Capital is
reflected to increase by R1.4bn being an incremental increase of 6.15%, 12.66% and
16.14% respectively over this period. The Committee would implore the Regulator to
scrutinize these calculations in the determination of the Record of Decision in terms
of the Authorities application. The projected Return on Capital (RAB x WACC) is
forecast to escalate beyond what can be deemed as reasonable.
4.1.2 Comments on the Authorities Operating Expenditure
The Committee wishes to express grave concern regarding the forecast budget
leading to FY2017/18 compared to the actual operating costs of FY2013/14. The
Authority has indicated that the total operating expenditure is forecast to increase
by R2, 270bn (62.4%) over this period. The Authority has sited the reasons for the
increased expenditure from FY2013/14 to FY2017/18 due to the following specific
costs,
i. Table 36 of the application suggests that the number of employees is due to rise
by 1,081, from 3,802 employees to 4,883 employees. The Authorities labour cost
is due to increase by R890m from R1,767m to R2,657m (50.4%). The Authority
has indicated that the manning of the port operations centres, the
implementation of the quad shift system and moving from outsourcing to in-
Fruit South Africa Submission to the Ports Regulator iro TNPA Tariff Application 2015/16 Page 13
house functions of aviation and security functions. The Committee cannot
determine the value of the increased employment as there are no indications as
to which operating expenses will decrease as a result of functions becoming in-
house. This requires further substantiation.
ii. Maintenance costs are indicated to increase by R243m from R296m to R539m
(82.1%). The Authority sites the expenditure to ensure efficient continuity of
operations.
iii. Energy costs are indicated to increase by R212m from R399m to R611m (53.1%).
The Authority sites rising electricity costs and rising fuel costs as to the reason
for the forecast increase. The Committee wishes to express that the global call
for reduced carbon emissions must similarly be emphasized and adopted by the
Authority. The increased energy costs cannot be justified on any basis and
especially in relation to volume growth forecasts being revised downwards in
recent times. The Committee would request the Regulator to bring a level of
oversight to the consumption of electricity and fuel by the Authority. The
Authority should report within tariff applications appropriate measures adopted
to reduce the overall energy consumption.
iv. The cost allocation to pre-feasibility studies is somewhat of a contentious issue
since pre-feasibility studies for CAPEX projects should be funded directly by the
Authority. Pre-feasibility costs are indicated to increase by R143m from R47m to
R190m (304.3%). The Authority sites that the pre-feasibility studies are in
relation to 1) deepening and widening of the entrance channel at port of East
London, 2) Edwin Swales Link Road FEL4, and 3) constitution of Berth A100 at
Ngqura port.
v. The Authority sites sundry operating costs as being generalized operating costs.
Sundry operating costs are indicated to increase by R219m from R51m to R270m
(429.4%).
vi. The Authority has forecast that the Transnet SOC Group costs are to increase by
R283m from an actual cost of R398m in FY2013/14 to a forecasted cost of R681m
(71.1%) over this period. There are various anomalies in the corporate overhead
costs, the most prevalent being the variances between budgeted costs and actual
expenditure. The Committee would implore the Regulator to give substantive
oversight to the decreed group overhead cost allocation to the Authority.
Fruit South Africa Submission to the Ports Regulator iro TNPA Tariff Application 2015/16 Page 14
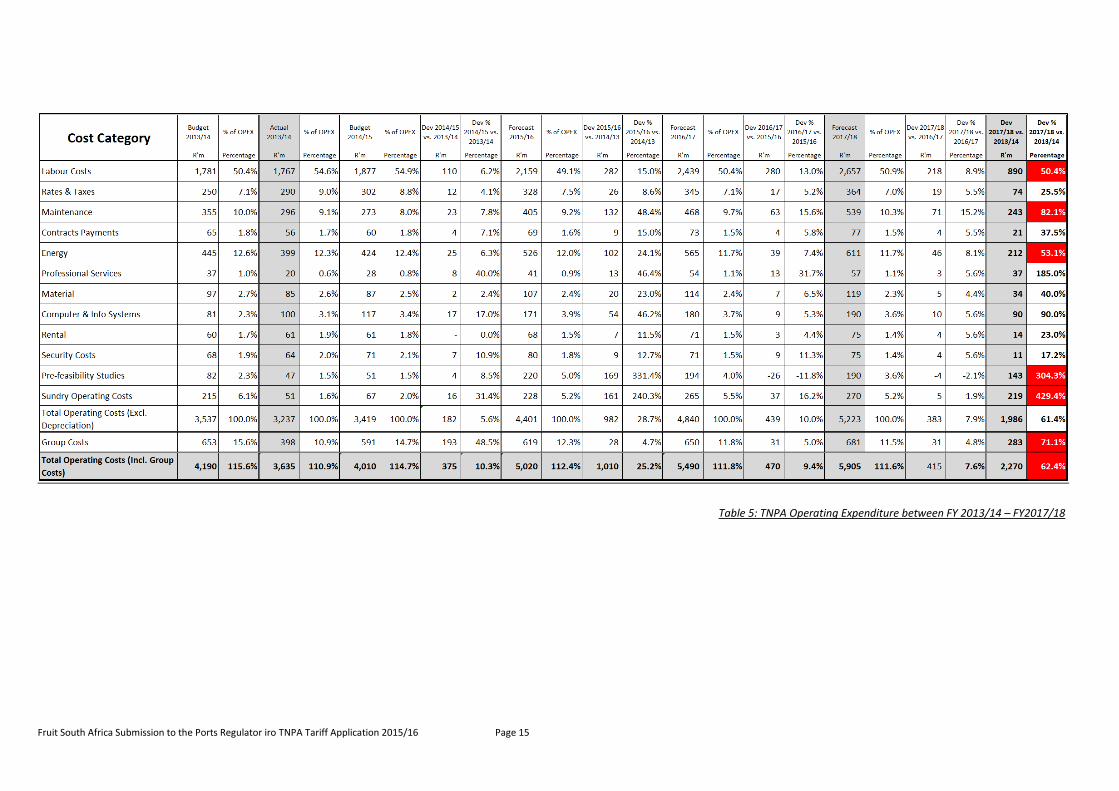
In summary and as illustrated in table 5 below, the Authorities forecast on
budgeted operating costs are specified to increase by R2,270m from an actual
total operating cost of R3,635m in FY2013/14 to R5.905m in FY2017/18 (62.4%).
The Committee wishes to express that the Authorities reporting on operating
costs are unduly and severely overstated. The cost items as highlighted above
must come under strict review by the Regulator to ensure that operating
expenses reported are defendable.
Fruit South Africa Submission to the Ports Regulator iro TNPA Tariff Application 2015/16 Page 15
Table 5: TNPA Operating Expenditure between FY 2013/14 – FY2017/18
Fruit South Africa Submission to the Ports Regulator iro TNPA Tariff Application 2015/16 Page 16
4.1.3 Comments on the Authorities Cargo Volume Projections
Figure 1 and Table 1 above highlights the volumes as indicated by the Transnet MDS
and the revised volumes contained in the present tariff application. It is apparent
that the volumes as depicted in the MDS were grossly overstated and have been
revised downwards. The anomaly which arises is that although the volumes between
the two are vastly differing, the CAPEX program of in excess of R46bn still persists.
The Committee is of the view that if the volumes as indicated in the present tariff
application are reflective of the current volume assumption, then the Authorities
CAPEX program must similarly be revised downwards; in line with the trended
volume forecasts.
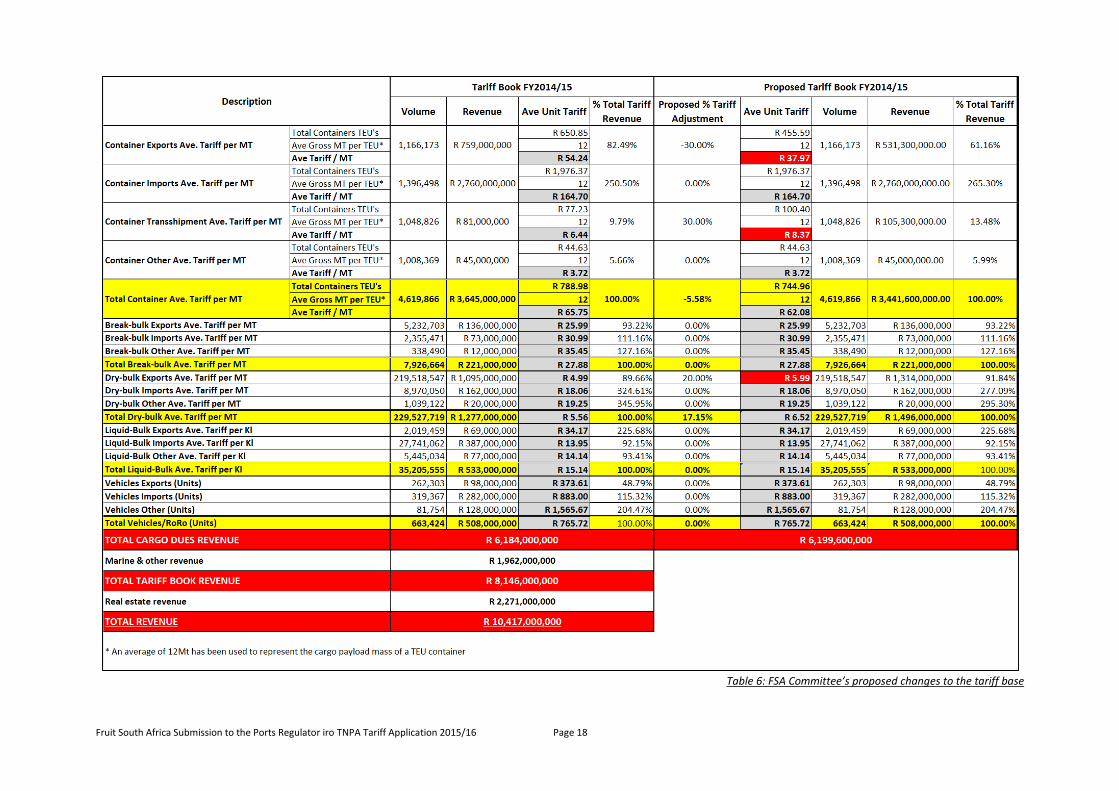
Table 6 below represents the Authorities volumes and the revenue earned from
those volumes. For purposes of comparisons of the tariff charges for containers and
other dry and break-bulk, a cargo payload mass of 12tons per TEU has been used to
simulate the container tariff charged per Mt. As can be seen from this exercise that
the tariff charged for containers when converting the payload mass to equate the
per unit (Mt) cost, that the average tariff charge for full export TEU container grossly
exceeds that of all other export related average tariffs. To illustrate, the unit Mt
average tariff charged for full export containers equates to R54.24. The average
break-bulk, dry-bulk and liquid-bulk export tariff is R21.72, by comparison there is
more than twice the tariff charged for full export containers. The Committee
proposes to the Regulator and the Authority the following adjustments to the tariff
book based on the FY2014/15 tariff charges-
i. A 30% reduction in the tariff charged for full export containers,
ii. A 30% increase in the tariff charged for Transhipped containers (the average
tariff charged for transhipped containers is considered to be grossly
discriminatory), and
iii. A 20% increase in the tariff charged for Dry-bulk cargo.
The proposed amendments to the tariff book would decrease the current imbalances and
disparities between the excessive tariffs charged for full export containers and the perplexed
tariffs charged for Dry-bulk commodities. I.e. Coal exports, Manganese exports and Iron Ore
Exports.
Fruit South Africa Submission to the Ports Regulator iro TNPA Tariff Application 2015/16 Page 17
The Committee wishes to bring to the Regulator and the Authorities attention that the Total
Dry-Bulk calculations appear to be erroneous as contained in table 20 of page 45 of the
Authorities tariff application FY2015/16. The reported budget volume for Dry-Bulk is
reflected as 165,517,719 (Tons) when the correct calculation should be 229,527,719 (tons).
The oversight may alter the budgeted Cargo Dues Revenue for FY2014/15 and FY2015/16
considerably as the cargo dues revenue calculations for FY2014/15 appears to be
understated by R363m. The total forecast revenue for FY2014/15 would then change from
R10, 054bn to R10, 417bn.
If the Committee is correct in the assumption of the miscalculation, it is expected that the
Authority resubmit the tariff application for the FY2015/16 – FY2017/18 taking into account
the errors. Being that the calculations are indeed recorded as being correct, the Committee
requests clarification from the Authority on the method of the calculations.
Fruit South Africa Submission to the Ports Regulator iro TNPA Tariff Application 2015/16 Page 18
Table 6: FSA Committee’s proposed changes to the tariff base
Fruit South Africa Submission to the Ports Regulator iro TNPA Tariff Application 2015/16 Page 19
5. Submission on Fruit Export Port Tariff Charges
The TNPA are in a process of implementing (as approved by the Ports Regulator) a port pricing
strategy aimed at restructuring costs recovered from Leases, Marine Services and Port Cargo
Tariffs. The issue of the beneficiation discount program is a relative one to the fruit sector
whereby the harvesting and production of export fruit is in a final stage of beneficiation. The
fruit sector should thereby be included in the beneficiation program as representative of the
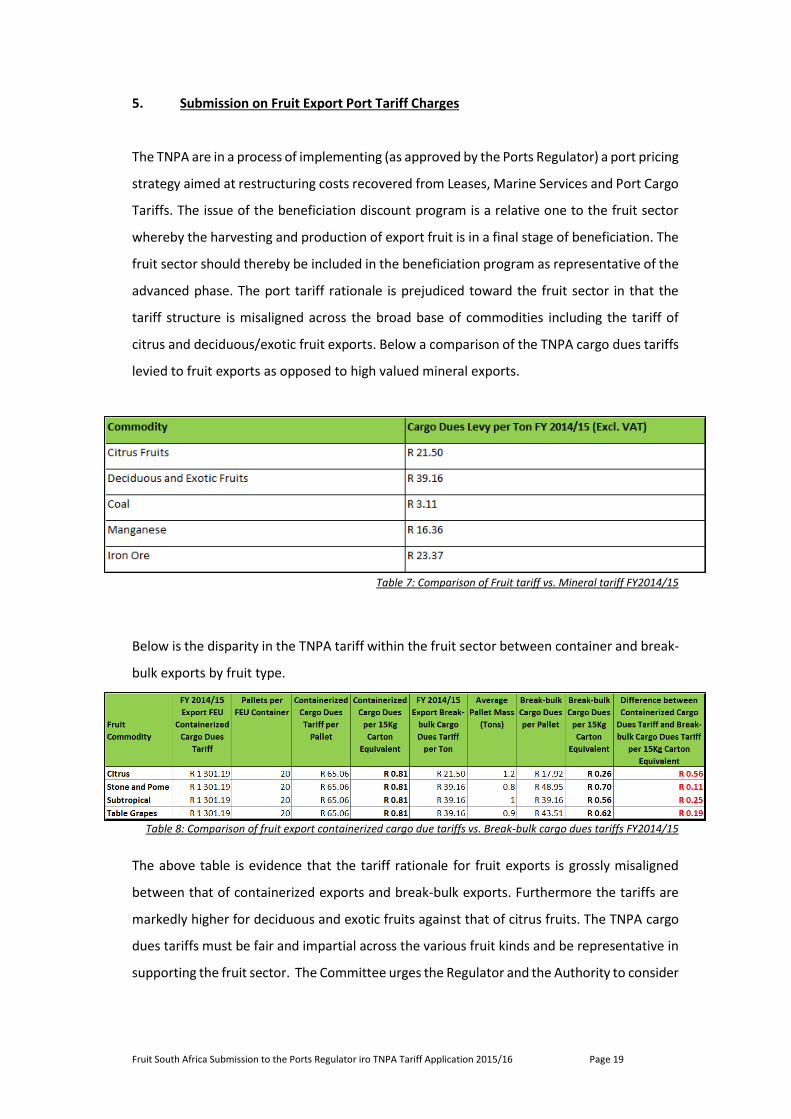
advanced phase. The port tariff rationale is prejudiced toward the fruit sector in that the
tariff structure is misaligned across the broad base of commodities including the tariff of
citrus and deciduous/exotic fruit exports. Below a comparison of the TNPA cargo dues tariffs
levied to fruit exports as opposed to high valued mineral exports.
Table 7: Comparison of Fruit tariff vs. Mineral tariff FY2014/15
Below is the disparity in the TNPA tariff within the fruit sector between container and break-
bulk exports by fruit type.
Table 8: Comparison of fruit export containerized cargo due tariffs vs. Break-bulk cargo dues tariffs FY2014/15
The above table is evidence that the tariff rationale for fruit exports is grossly misaligned
between that of containerized exports and break-bulk exports. Furthermore the tariffs are
markedly higher for deciduous and exotic fruits against that of citrus fruits. The TNPA cargo
dues tariffs must be fair and impartial across the various fruit kinds and be representative in
supporting the fruit sector. The Committee urges the Regulator and the Authority to consider
Fruit South Africa Submission to the Ports Regulator iro TNPA Tariff Application 2015/16 Page 20
a proposal to reduce the break-bulk tariff for Deciduous and Exotic fruits in line with the tariff
for citrus exports (R21.50 per ton FY 2014/2015).
6. Submission on Fruit Export Related Supply Chain Costs with Special Emphasis on
Transnet SOC Revenue Generated from Fruit Exports
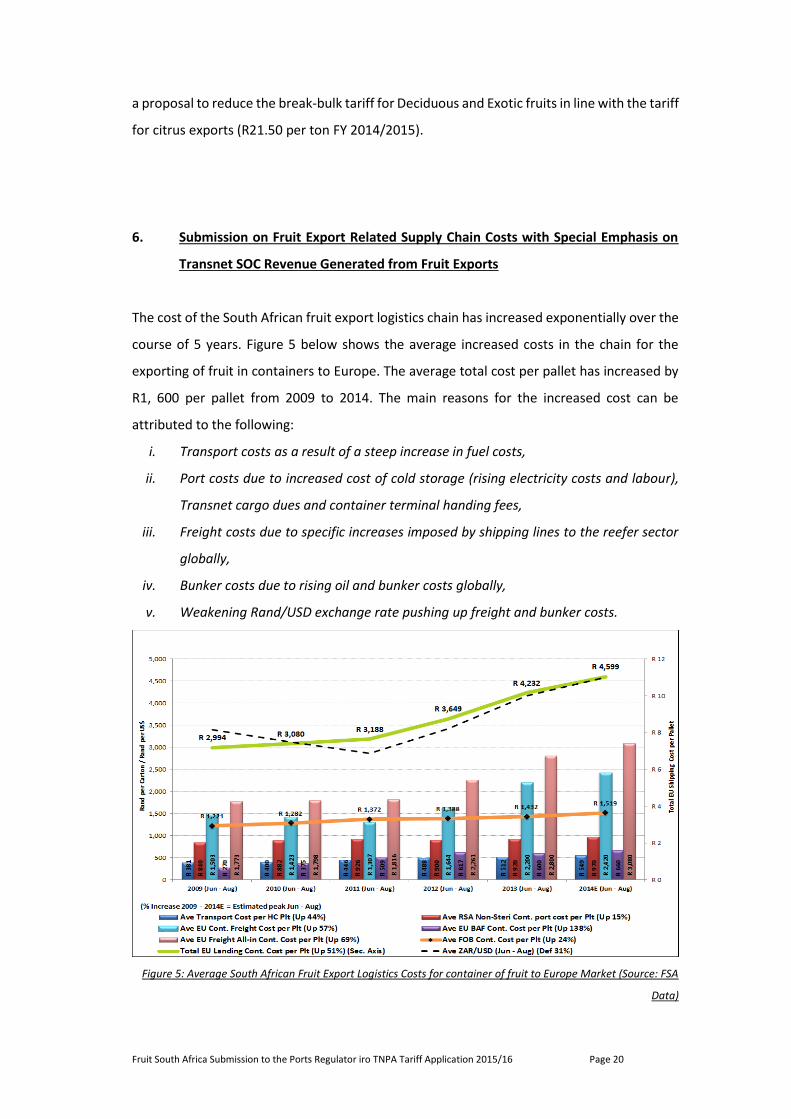
The cost of the South African fruit export logistics chain has increased exponentially over the
course of 5 years. Figure 5 below shows the average increased costs in the chain for the
exporting of fruit in containers to Europe. The average total cost per pallet has increased by
R1, 600 per pallet from 2009 to 2014. The main reasons for the increased cost can be
attributed to the following:
i. Transport costs as a result of a steep increase in fuel costs,
ii. Port costs due to increased cost of cold storage (rising electricity costs and labour),
Transnet cargo dues and container terminal handing fees,
iii. Freight costs due to specific increases imposed by shipping lines to the reefer sector
globally,
iv. Bunker costs due to rising oil and bunker costs globally,
v. Weakening Rand/USD exchange rate pushing up freight and bunker costs.
Figure 5: Average South African Fruit Export Logistics Costs for container of fruit to Europe Market (Source: FSA
Data)
Fruit South Africa Submission to the Ports Regulator iro TNPA Tariff Application 2015/16 Page 21
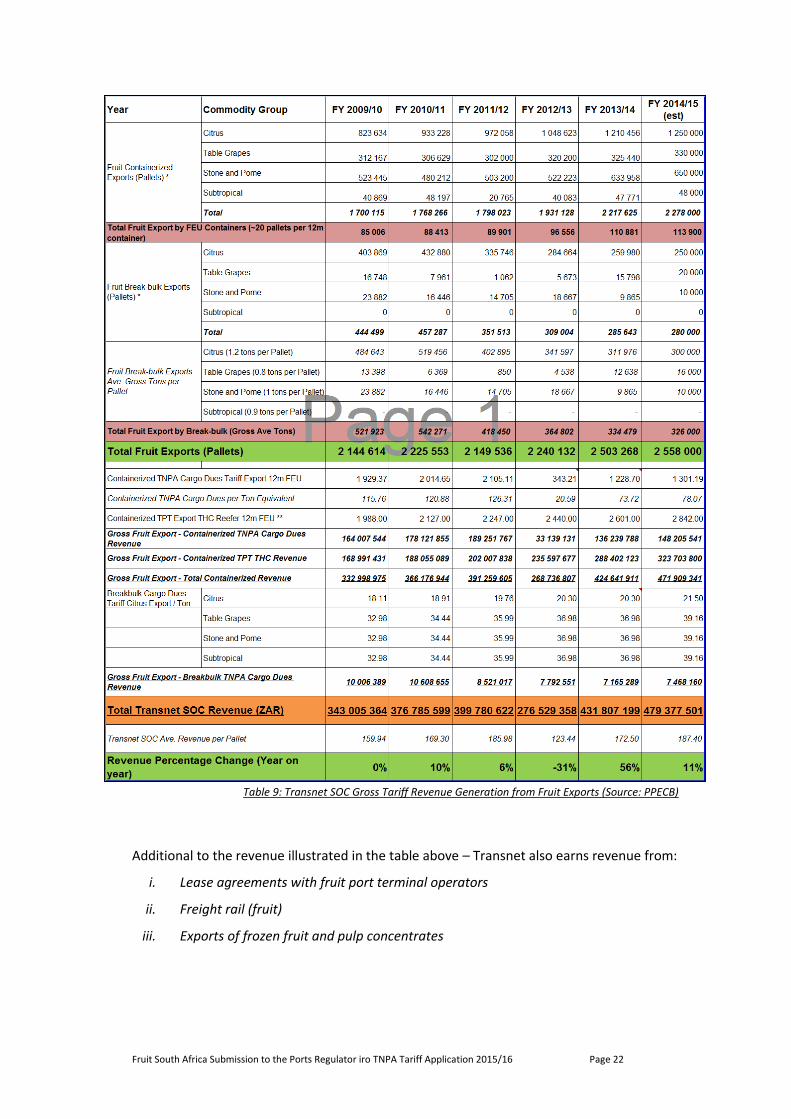
Transnet SOC port revenue from fruit exports increased by 40% from R343 million in
FY2009/10 to a calculated R480 million in FY 2014/15 – mainly due but not limited to-
i. Increased fruit export volumes by 17%,
ii. Increased fruit containerized volume by 32%,
iii. containerized cost per pallet is R207.16 as opposed to R22.91 for break-bulk reefer
exports,
iv. Transnet increased revenue per pallet basis from R159.94 to R187.40 (17%).
The trends in pallets exported by the fruit industry (six year period) and Transnet’s revenue
from these exports are illustrated in the figure below.
Fruit South Africa Submission to the Ports Regulator iro TNPA Tariff Application 2015/16 Page 22
Table 9: Transnet SOC Gross Tariff Revenue Generation from Fruit Exports (Source: PPECB)
Additional to the revenue illustrated in the table above – Transnet also earns revenue from:
i. Lease agreements with fruit port terminal operators
ii. Freight rail (fruit)
iii. Exports of frozen fruit and pulp concentrates
Fruit South Africa Submission to the Ports Regulator iro TNPA Tariff Application 2015/16 Page 23
7. Conclusions and Key Recommendations
I. A major component of the increased operating costs going forward relates to the labour,
resources and equipment components in implementing the Operations Centres so that
the Authority can fulfil the requirements of the Ports Act. The Committee wishes to
convey that the implementation of operations centres and the cost allocation of such
must be clearly defendable and clearly illustrate how the benefits will be relayed back to
the beneficiaries’ of the ports (the cargo owners and users of the ports). If the Authority
cannot guarantee that there will be savings in an aspect of the port system given the
level of expenditure in implementing the operations centres, the cost of such should not
be bourn onto port users but directly to the Authority.
II. The Authorities CAPEX program as contained in the Transnet MDS must be aligned to the
current volume projections and not be overstated. Each tariff application cycle reflects a
vastly differing CAPEX program with major CAPEX projects being altered and/or shifted.
The Authority must produce a CAPEX program aligned to increasing capacity where
capacity is required in terms of credible volume projections.
III. The components determining the Authorities Cost of Capital must be given attention.
This specific aspect in the tariff application cycle; by indication of the Authority, is due to
increase beyond what can be deemed as reasonable and fair.
IV. The cost of exporting fruit from South Africa to Europe (representing 70% of the export
volume) has escalated exponentially. The increased cargo dues tariff as contained in the
tariff application cycle contributes to increased costs and goes against certain sections
contained in the National Ports Act.
V. It is common knowledge that containerized cargo subsidizes the ports revenue base. The
Committee is of the view that increasing containerized cargo dues cannot be
substantiated given the current low level of cargo dues for Dry-bulk exports of Coal, Iron
Ore and Manganese commodities. A proposal has been presented by the Committee to
the Regulator and the Authority to amend the tariffs for full export containers (decrease
by 30%), transhipment containers (increase by 30%) and dry-bulk exports (increase by
20%).
VI. The CAPEX allocation for the proposed transfer of the Manganese and Liquid Bulk
terminals from Port Elizabeth to Ngqura must be given due attention in correctly
apportioning of potential tariff increases as is indicated above.
Fruit South Africa Submission to the Ports Regulator iro TNPA Tariff Application 2015/16 Page 24
VII. Furthermore, the Committee requests that the Regulator and the Authority consider the
tariffs specific to the fruit sector by equalizing the break-bulk tariffs for Deciduous and
Exotic fruits to that of the Citrus tariffs.
***************************************************************************