Embed Size (px)
Citation preview
Successful Black Immigrants Narrow Black-White
Achievement Gaps*
Alison Rauh**
This Version: October 15, 2013
Abstract
The number of black immigrants in the US quadrupled from 1980 to 2010, increasing their share ofthe black population from 4% to 10%. During that time period the black-white wage and employmentgap widened substantially. This paper explores the extent native blacks differ from immigrant blacks.Additionally it determines in how far increased selective immigration masks an even greater deteriorationin the economic condition of native blacks. In 2011, excluding black immigrants increases the white-blackwage gap by 4% for men and 9% for women. It increases the employment gap by 13% and 19% for menand women respectively.
*I am grateful to Erik Hurst and Kerwin Charles for their support at all stages of the project. I also thank Steven Durlauf,Steven Levitt, Alessandra Voena, James Heckman, Steven Davis, Dan Black, Keith Henwood, Christopher Rauh, the University ofChicago Microlunch and Lifecycle Working Group for helpful comments. This material is based upon work supported by the NationalScience Foundation Graduate Research Fellowship under Grant No. (DGE-1144082). Any opinion, findings, and conclusions orrecommendations expressed in this material are those of the author and do not necessarily reflect the views of the National ScienceFoundation.
** University of Chicago, [email protected].
1
1 Introduction
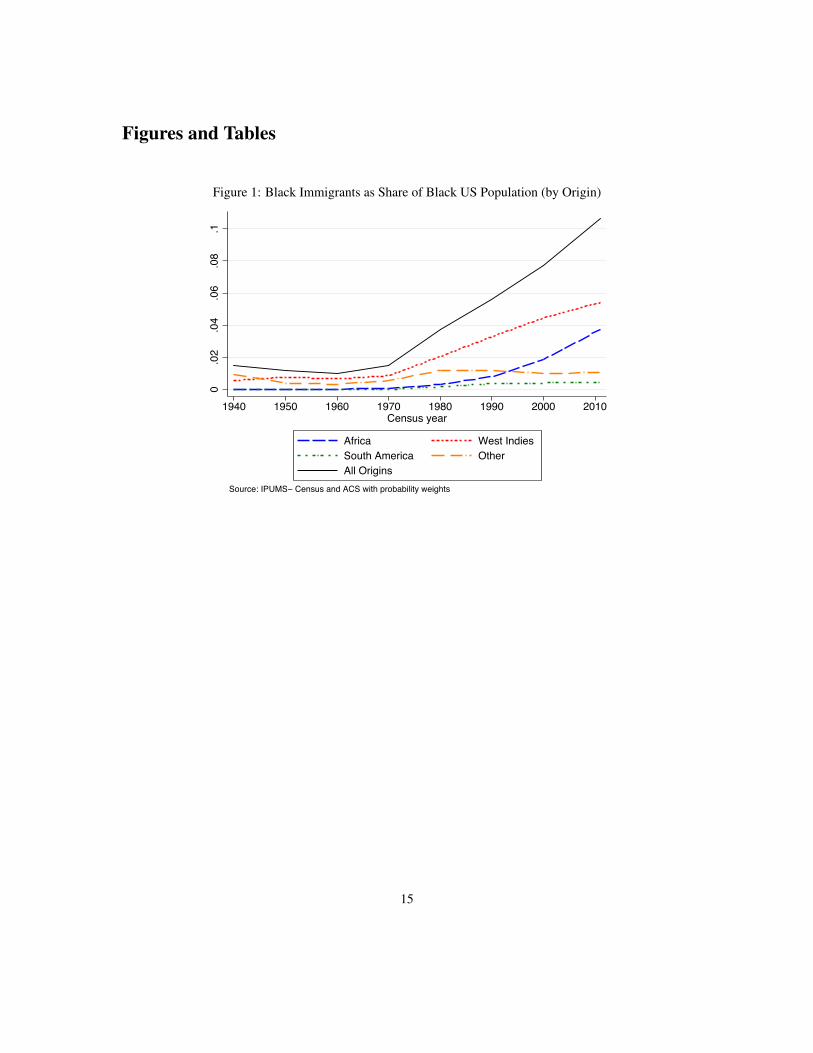
During the 1960s and linked to the Civil Rights Act of 1964 many elite school started various affirmativeaction measures in order to increase the enrollment of African Americans. The emphasis on diversity notonly increased the number of native blacks but also led to a sharp increase in the representation of blacksof immigrant origin. This spurred a controversial debate about the purpose and effect of affirmative actionpolicies. At the 2004 reunion of Harvard’s black alumni, Henry Louis Gates and Lani Guinier pointed outthat while Harvard’s undergraduates were 8% black, the majority of them were West Indian and Africanimmigrants or their children (Rimer and Arenson 2004). They said that only about one third of AfricanAmericans at Harvard were descendants of slaves with all four grandparents born in the US.1
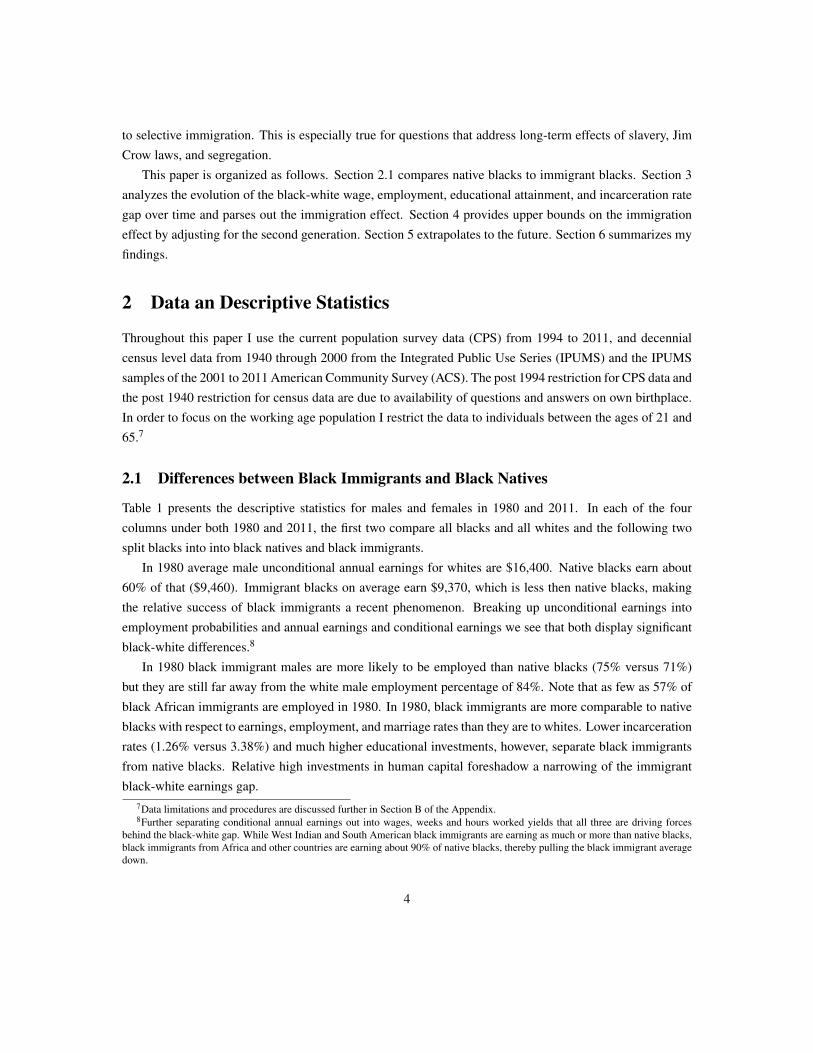
Figure 1 illustrates how black immigration from the West Indies and Africa exploded over the last fewdecades. The number of black immigrants living in the US has increased 13-fold from 1970 to 2010, in-creasing their share of the black population from 1% to 10%. Figure 1 suggests that this number continuesto grow. Note that black immigrants also have a higher fertility rate than native blacks, which will naturallyincrease the share of second generation blacks. In 2011, a black immigrant female above the age of 16 hada 48% higher probability of having a child than a native black female. While black immigrant women havea larger total fertility rate compared to native black women, their teenage pregnancy rates are half as high.2
This paper explores the extent to which native blacks differ from immigrant blacks. Additionally itdetermines whether the relative success of the increasing subgroup of black immigrants masks even largerblack-white earnings and education gaps. To do this, blacks are split into blacks born in the US and blacksborn abroad. For convenience I refer to them as “native blacks” and “immigrant blacks”, respectively.3 Thispaper looks at gaps in education, earnings, employment and incarceration rates between whites and blacksin the US since 1980.
In 2011, black immigrant men earned close to $10,000 or 40% more than black native men. This pre-mium shrinks to $3,000 or 7% once we condition on being employed. The analysis of employment, ed-ucation, incarceration, and marriage outcomes, confirms that we are dealing with two completely differentsubsets of the population. Black immigrant men are much more likely than native black men to be employed,married, and not incarcerated. Schooling patterns point towards much higher college completion percent-ages and less high school dropouts for black immigrant men. Similar analysis applies to women though thevariation in outcomes is generally compressed.
While immigrants of other races and ethnicities outperform natives as well, their premium is muchsmaller. White and asian immigrant men earn 24% and 10% more than their native counterparts, respectively.
1Vigorous debates about the purpose of affirmative action followed and some say black immigrants are not the appropriate benefi-ciaries of affirmative action policies that intended to help those disadvantaged by the legacy of Jim Crow laws. Massey et al. (2007)find that the representation of immigrant-origin blacks at selective institutions is roughly double their share in the population. For ivyleague schools it is almost four-fold.
2In 2011, 4.2% of black native teenage girls had a child, while only 2.2% of black immigrant teenage girls did (based on author’scalculations using ACS data).
3Ideally one would like to include the second generation but the census and ACS do not record parents’ birthplace. In Section 4,CPS data with much smaller sample sizes is used to explore the importance of second generation blacks.
2
Hispanic immigrants, however, earn 13% less. Black immigrants, now 11% of the black population, havereached a large enough mass that any systematic difference in social and economic outcomes changes ourestimates from purely native black-white inequality measures. Excluding first generation black immigrantsfrom black-white wage, employment, college completion, and incarceration gap calculations substantiallywidens these inequality measures. For example, in 2011, the male log wage gap increases by 4%, theemployment gap by 13%, the college completion gap by 13%, and the incarceration rate gap by 13%.
Analyzing the income distributions of all black and whites yields that the 1940-1980 convergence sloweddown and almost halted completely in 1990 and beyond. Excluding immigrants, however, demonstrates thatincome distributions between whites and native blacks have diverged during the latter period. Schoolingdifferences between black natives and black immigrants extend beyond college completion to major choices.Black immigrants, both men and women, are much more likely than native blacks to major in more technicalfields such as engineering, natural sciences, economics, and health sciences compared to less technical fieldssuch as social sciences, humanities, and education.
Thomas Sowell (1978) was one of the first authors to compare economic outcomes of immigrant andnative blacks. He argued that black immigrants are a natural comparison group for black natives. Using the1970 census, he finds a positive earnings gap between West Indian immigrants and native-born blacks andargues that “color alone, or racism alone, is clearly not a sufficient explanation of the disparities within theblack population or between the black and white populations”. He concludes that “cultural traditions” ofnative-born blacks stand in the way of economic achievement.4
The black-white wage gap has been studied extensively for the 1940-1980 period and economists havedocumented the large gains made by blacks.5 Black-white wage convergence halted in 1980 but the evolutionsince has been studied relatively little.6 A phenomenon that played no role for black white convergencebefore 1980 but does now is black immigration. In 1985, 816,00 foreign black men lived in the US. By 2005,this number had grown to 2,815,000 (Kent 2007). The beginning of sizable immigration flows from the WestIndies was noticed and studied by multiple authors in the 1990s. After that, there was little additional workon this topic, which is ironic since black immigration as a true economic force had just begun.
In studies up until today blacks comprise both native blacks as well as the first and second generation.Being phenotypically similar does not translate into comparable labor market outcomes and the inclusion ofimmigrants clouds our understanding of native blacks’ economic and social condition in the US. We mustnot confuse black economic progress driven by internal factors with population composition changes due
4Since Sowell (1978) a few studies used the 1980 and 1990 census to evaluate the relative success of black immigrants from theCaribbean (Butcher 1994, Kalmijn 1996) and from Africa (Kollehlon and Eule 2003). Butcher (1994) finds that while male annualearnings of black immigrants overall are slightly below those of native blacks, the subgroup of West indian men already display higherearnings. Kalmijn (1996) finds that success of black Caribbean immigrants is limited to British Caribbeans. Butler and Herring (1991)and Bogan and Darity (2008) evaluate entrepreneurship among black immigrants and find that self-employment rates are higher forimmigrant blacks than native blacks. Hamilton (2012) is one of the only researchers to use post 2000 data to evaluate labor marketdifferences of black immigrants and black natives. None of the above studies link their findings to black white inequality measures.
5A large literature provides a more complete analysis. See Smith and Welsh (1989), Card and Krueger (1992), Freeman (1973),Vroman (1974), and Donohue and Heckman (1991) for evidence.
6Some important work includes Wilson (1987), Bound and Holzer (1993), and Bound and Freeman (1992).
3
to selective immigration. This is especially true for questions that address long-term effects of slavery, JimCrow laws, and segregation.
This paper is organized as follows. Section 2.1 compares native blacks to immigrant blacks. Section 3analyzes the evolution of the black-white wage, employment, educational attainment, and incarceration rategap over time and parses out the immigration effect. Section 4 provides upper bounds on the immigrationeffect by adjusting for the second generation. Section 5 extrapolates to the future. Section 6 summarizes myfindings.
2 Data an Descriptive Statistics
Throughout this paper I use the current population survey data (CPS) from 1994 to 2011, and decennialcensus level data from 1940 through 2000 from the Integrated Public Use Series (IPUMS) and the IPUMSsamples of the 2001 to 2011 American Community Survey (ACS). The post 1994 restriction for CPS data andthe post 1940 restriction for census data are due to availability of questions and answers on own birthplace.In order to focus on the working age population I restrict the data to individuals between the ages of 21 and65.7
2.1 Differences between Black Immigrants and Black Natives
Table 1 presents the descriptive statistics for males and females in 1980 and 2011. In each of the fourcolumns under both 1980 and 2011, the first two compare all blacks and all whites and the following twosplit blacks into into black natives and black immigrants.
In 1980 average male unconditional annual earnings for whites are $16,400. Native blacks earn about60% of that ($9,460). Immigrant blacks on average earn $9,370, which is less then native blacks, makingthe relative success of black immigrants a recent phenomenon. Breaking up unconditional earnings intoemployment probabilities and annual earnings and conditional earnings we see that both display significantblack-white differences.8
In 1980 black immigrant males are more likely to be employed than native blacks (75% versus 71%)but they are still far away from the white male employment percentage of 84%. Note that as few as 57% ofblack African immigrants are employed in 1980. In 1980, black immigrants are more comparable to nativeblacks with respect to earnings, employment, and marriage rates than they are to whites. Lower incarcerationrates (1.26% versus 3.38%) and much higher educational investments, however, separate black immigrantsfrom native blacks. Relative high investments in human capital foreshadow a narrowing of the immigrantblack-white earnings gap.
7Data limitations and procedures are discussed further in Section B of the Appendix.8Further separating conditional annual earnings out into wages, weeks and hours worked yields that all three are driving forces
behind the black-white gap. While West Indian and South American black immigrants are earning as much or more than native blacks,black immigrants from Africa and other countries are earning about 90% of native blacks, thereby pulling the black immigrant averagedown.
4
For women the relative success of black immigrant women in the labor market is already apparent in1980. In 1980 black immigrant females have the highest probability of being employed (67%) compared tonative black women (58%) and white women (56%). Average female earnings conditional on working forblack immigrants are above those of native blacks and right behind those of whites.
In 2011 average male unconditional annual earnings conditional on working for whites are $48,500. Na-tive black workers earn about half of that equaling $23,500. Black immigrant workers average unconditionalannual earnings equal $32,900 and therefore now earn about $10,000 or 40% more per year than native blackworkers. 9
While the gaps in conditional earnings between black immigrants and natives are rather small, theyare immense in employment, incarceration, marriage, and schooling outcomes. 76% of both white malesand black immigrant males aged 21-65 were employed in 2011. Only 59% of black males aged 21-65 wereemployed, a number that drops to 57% when black immigrants are excluded. 59% of native blacks’ educationis a high school degree or less, while only 43% of both whites and immigrant blacks fall into this category.14% of native blacks obtain a college degree while 32% of whites and 30% of immigrant blacks obtain acollege degree or more.10 Incarceration probabilities of males display the greatest differences. Incarcerationprobabilities for white males and black immigrant males lie in between 1% and 2% while native black maleshave an over 8% chance of being imprisoned in 2011. A much higher fraction of black immigrant males andwhite males than native black males is married (53% and 57% versus 34%).
The African subgroup of black immigrant males display very interesting characteristics (see Table A.1for break-down by country of origin). From 1980 to 2011 Africans went from being the least likely blackimmigrant group to be employed to being the most likely black immigrant group to be employed. Exceptfor conditional earnings, which are close to the black immigrant average, black African immigrants outper-form not only black natives but also whites in most outcomes. Black African males have a much higherchance of employment (80% versus 57%), lower chance of incarceration (1.05% versus 8.35%), and morecollege graduates (43% versus 14%) than black native males. Starting with Sowell in 1978 and followed bynumerous studies in the 1990s, authors examined whether West Indian immigrants are more successful thannative blacks and Model’s 2008 book title asked the pertinent question “West Indian Immigrants: A blacksuccess story?” (Model 1991, 1995, 2008, Butcher 1994, Kalmijn 1997, Waters 1999). These results raisethe possibility of a new question: “African Immigrants: The black success story?” 11
9Analyzing conditional annual earnings and employment we see that the difference between native and immigrant blacks is mostlydriven by employment probabilities. Separating annual earnings as before, we see that the black-white gaps in weeks and hours workedhave narrowed. Hence it is primarily wages and to a lesser degree hours and weeks worked that are driving the black-white conditionalearnings gap. The same is true for the native black-immigrant black conditional earnings gap.
10While the high school and college degree categories include individuals with the relevant degree, the graduate school categorysimply implies that individuals continued school after college (whether they graduated form their program or not.)
11There are several reasons to be cautious about these results and they certainly require further investigation. First, many Africanimmigrants come to the US to attend college or graduate school so they are a very select group. This is not a problem with my resultsper se since self-selectivity of immigrants is part of the reason black-white gaps are underestimated. Second, immigrants that do notbecome naturalized are likely to be deported for severe crimes. Hence we would expect immigrants’ incarceration probabilities tobe lower even if their probability of being convicted of a crime that would lead to incarceration were identical. This bias should benegligible.
5
Panel B of Table 1 displays the same mean outcomes for women in 2011. At first glance, we canalready see that the variation in outcomes across groups is much less than that of men. Conditional andunconditional annual earnings of native black women are at 91% and 78% of those of white women, whichpoints to a much more equal distribution than that of men (64% and 48%). The gap in the fraction employedbetween whites and native blacks falls from 20 percentage points to 5 points. Incarceration probabilities forfemales are below 1% for all subgroups but native black women are still two and a half times more likelyto be imprisoned than white women. Educational patterns display the same relations as those for men butthe variability is compressed. Differences in marriage probabilities are an exception. White women aged21-65 are more than twice as likely to be married as native black women (59% and 28%), while the blackimmigrant female marriage probability lies in between these two rates (45%).12
3 Adjusting Black-White Inequality Measures
3.1 Labor Market Gaps
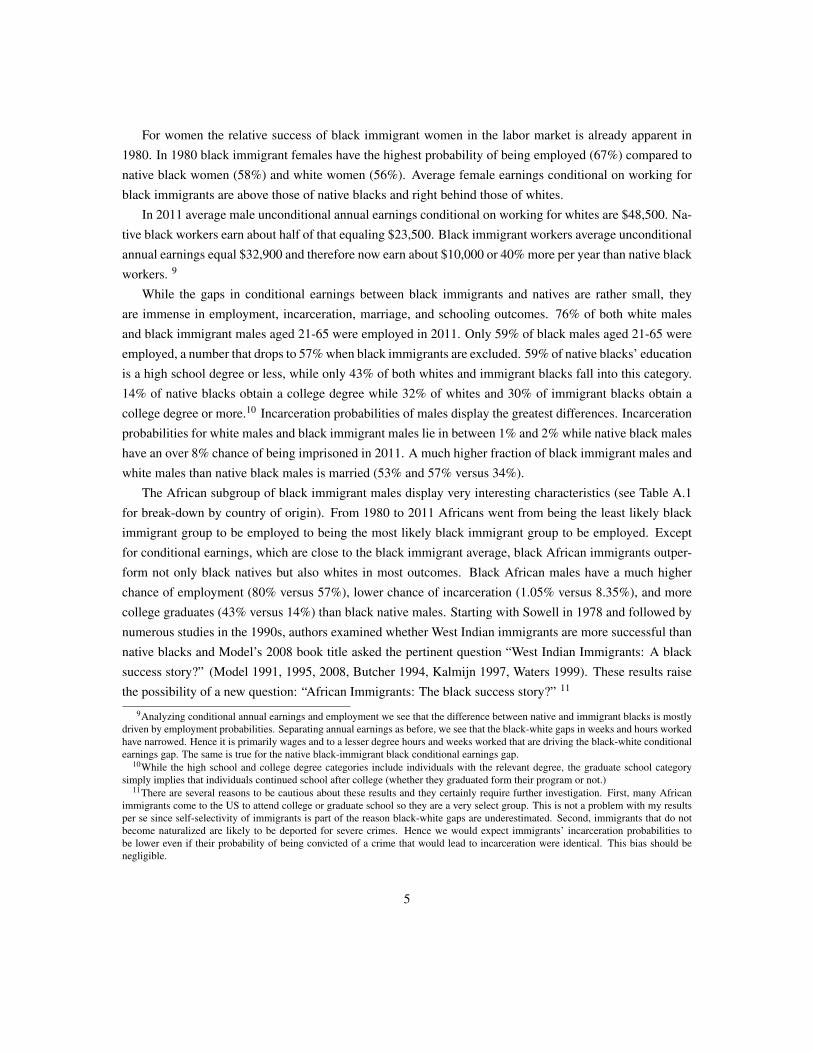
Figure 2 displays yearly white-black and white-native black log wage gaps for men controlling for age.13
From 1940 to 1980 black men made significant gains compared to white men. Log wage gaps decreasedfrom 0.80 to 0.27. In other words whites went from earning 2.2 times as much as blacks to earning 1.3times as much. For the 1940-1980 time period the black-white log wage differences look almost identical tonative black-white since black immigration was very limited. The convergence of the wages between blacksand white halted in 1980. The right plot in figure 2 demonstrates that wage gaps have mostly remainedconstant or grown since 1980. Excluding black immigrants and focusing on black natives alone exacerbatesthis phenomenon and increases the 2011 white-black log wage gap by as much as 4% (from 27.2 to 28.3 logpoints).
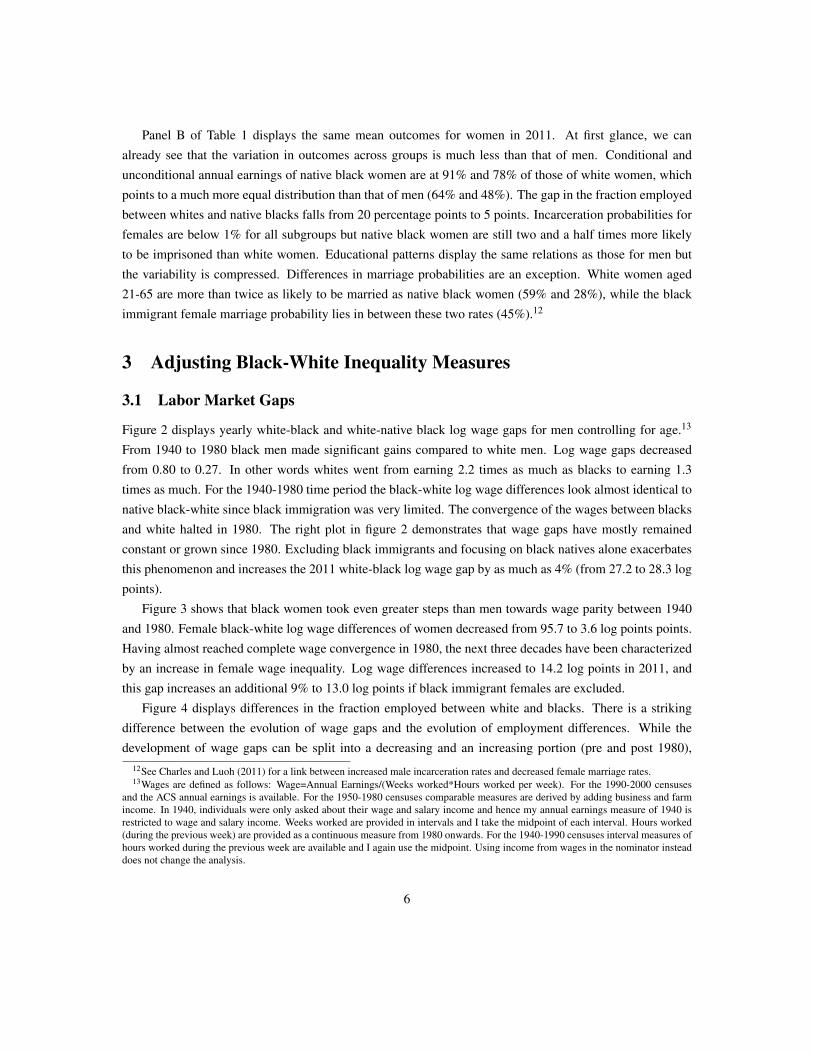
Figure 3 shows that black women took even greater steps than men towards wage parity between 1940and 1980. Female black-white log wage differences of women decreased from 95.7 to 3.6 log points points.Having almost reached complete wage convergence in 1980, the next three decades have been characterizedby an increase in female wage inequality. Log wage differences increased to 14.2 log points in 2011, andthis gap increases an additional 9% to 13.0 log points if black immigrant females are excluded.
Figure 4 displays differences in the fraction employed between white and blacks. There is a strikingdifference between the evolution of wage gaps and the evolution of employment differences. While thedevelopment of wage gaps can be split into a decreasing and an increasing portion (pre and post 1980),
12See Charles and Luoh (2011) for a link between increased male incarceration rates and decreased female marriage rates.13Wages are defined as follows: Wage=Annual Earnings/(Weeks worked*Hours worked per week). For the 1990-2000 censuses
and the ACS annual earnings is available. For the 1950-1980 censuses comparable measures are derived by adding business and farmincome. In 1940, individuals were only asked about their wage and salary income and hence my annual earnings measure of 1940 isrestricted to wage and salary income. Weeks worked are provided in intervals and I take the midpoint of each interval. Hours worked(during the previous week) are provided as a continuous measure from 1980 onwards. For the 1940-1990 censuses interval measures ofhours worked during the previous week are available and I again use the midpoint. Using income from wages in the nominator insteaddoes not change the analysis.
6
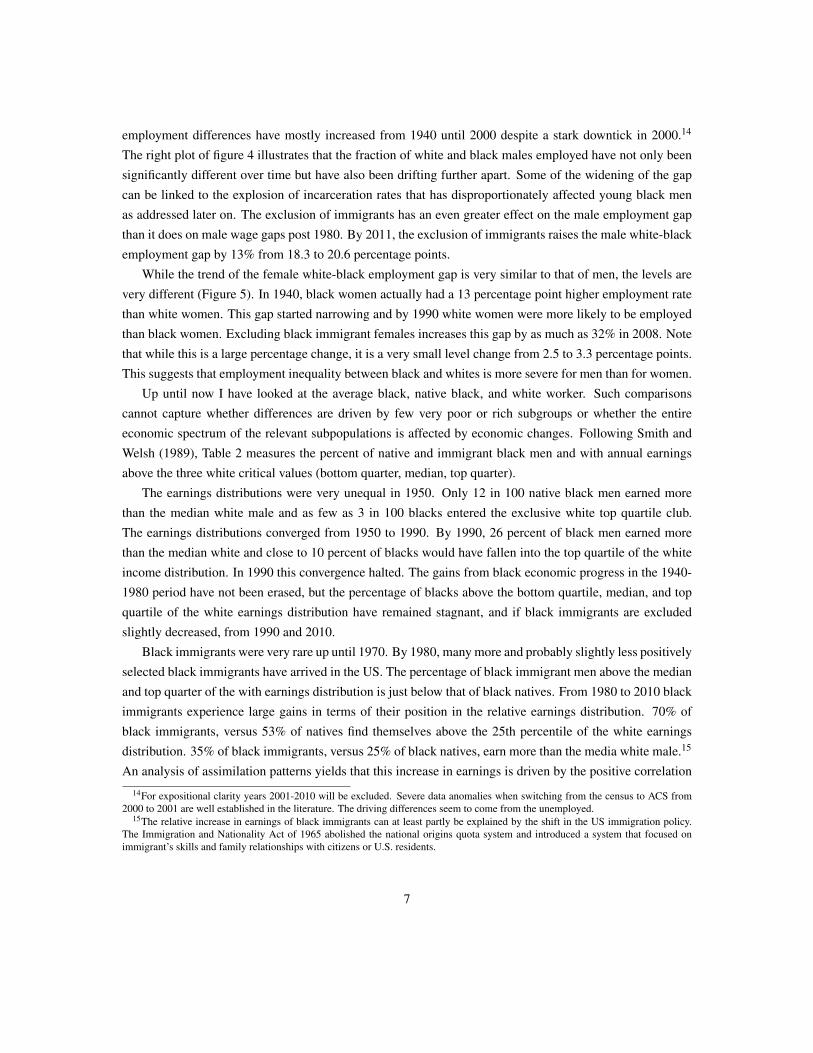
employment differences have mostly increased from 1940 until 2000 despite a stark downtick in 2000.14
The right plot of figure 4 illustrates that the fraction of white and black males employed have not only beensignificantly different over time but have also been drifting further apart. Some of the widening of the gapcan be linked to the explosion of incarceration rates that has disproportionately affected young black menas addressed later on. The exclusion of immigrants has an even greater effect on the male employment gapthan it does on male wage gaps post 1980. By 2011, the exclusion of immigrants raises the male white-blackemployment gap by 13% from 18.3 to 20.6 percentage points.
While the trend of the female white-black employment gap is very similar to that of men, the levels arevery different (Figure 5). In 1940, black women actually had a 13 percentage point higher employment ratethan white women. This gap started narrowing and by 1990 white women were more likely to be employedthan black women. Excluding black immigrant females increases this gap by as much as 32% in 2008. Notethat while this is a large percentage change, it is a very small level change from 2.5 to 3.3 percentage points.This suggests that employment inequality between black and whites is more severe for men than for women.
Up until now I have looked at the average black, native black, and white worker. Such comparisonscannot capture whether differences are driven by few very poor or rich subgroups or whether the entireeconomic spectrum of the relevant subpopulations is affected by economic changes. Following Smith andWelsh (1989), Table 2 measures the percent of native and immigrant black men and with annual earningsabove the three white critical values (bottom quarter, median, top quarter).
The earnings distributions were very unequal in 1950. Only 12 in 100 native black men earned morethan the median white male and as few as 3 in 100 blacks entered the exclusive white top quartile club.The earnings distributions converged from 1950 to 1990. By 1990, 26 percent of black men earned morethan the median white and close to 10 percent of blacks would have fallen into the top quartile of the whiteincome distribution. In 1990 this convergence halted. The gains from black economic progress in the 1940-1980 period have not been erased, but the percentage of blacks above the bottom quartile, median, and topquartile of the white earnings distribution have remained stagnant, and if black immigrants are excludedslightly decreased, from 1990 and 2010.
Black immigrants were very rare up until 1970. By 1980, many more and probably slightly less positivelyselected black immigrants have arrived in the US. The percentage of black immigrant men above the medianand top quarter of the with earnings distribution is just below that of black natives. From 1980 to 2010 blackimmigrants experience large gains in terms of their position in the relative earnings distribution. 70% ofblack immigrants, versus 53% of natives find themselves above the 25th percentile of the white earningsdistribution. 35% of black immigrants, versus 25% of black natives, earn more than the media white male.15
An analysis of assimilation patterns yields that this increase in earnings is driven by the positive correlation14For expositional clarity years 2001-2010 will be excluded. Severe data anomalies when switching from the census to ACS from
2000 to 2001 are well established in the literature. The driving differences seem to come from the unemployed.15The relative increase in earnings of black immigrants can at least partly be explained by the shift in the US immigration policy.
The Immigration and Nationality Act of 1965 abolished the national origins quota system and introduced a system that focused onimmigrant’s skills and family relationships with citizens or U.S. residents.
7
between time spent in the US and earnings, and not by an increase in cohort quality.
3.2 College Attainment Gap
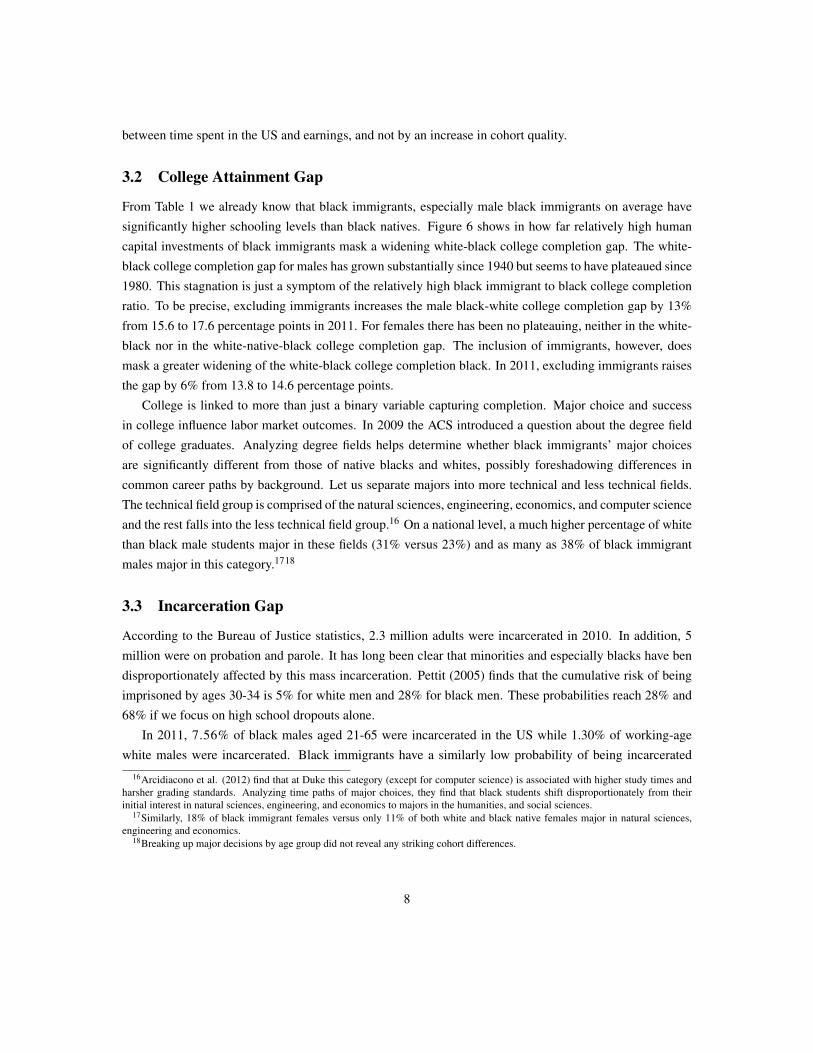
From Table 1 we already know that black immigrants, especially male black immigrants on average havesignificantly higher schooling levels than black natives. Figure 6 shows in how far relatively high humancapital investments of black immigrants mask a widening white-black college completion gap. The white-black college completion gap for males has grown substantially since 1940 but seems to have plateaued since1980. This stagnation is just a symptom of the relatively high black immigrant to black college completionratio. To be precise, excluding immigrants increases the male black-white college completion gap by 13%from 15.6 to 17.6 percentage points in 2011. For females there has been no plateauing, neither in the white-black nor in the white-native-black college completion gap. The inclusion of immigrants, however, doesmask a greater widening of the white-black college completion black. In 2011, excluding immigrants raisesthe gap by 6% from 13.8 to 14.6 percentage points.
College is linked to more than just a binary variable capturing completion. Major choice and successin college influence labor market outcomes. In 2009 the ACS introduced a question about the degree fieldof college graduates. Analyzing degree fields helps determine whether black immigrants’ major choicesare significantly different from those of native blacks and whites, possibly foreshadowing differences incommon career paths by background. Let us separate majors into more technical and less technical fields.The technical field group is comprised of the natural sciences, engineering, economics, and computer scienceand the rest falls into the less technical field group.16 On a national level, a much higher percentage of whitethan black male students major in these fields (31% versus 23%) and as many as 38% of black immigrantmales major in this category.1718
3.3 Incarceration Gap
According to the Bureau of Justice statistics, 2.3 million adults were incarcerated in 2010. In addition, 5million were on probation and parole. It has long been clear that minorities and especially blacks have bendisproportionately affected by this mass incarceration. Pettit (2005) finds that the cumulative risk of beingimprisoned by ages 30-34 is 5% for white men and 28% for black men. These probabilities reach 28% and68% if we focus on high school dropouts alone.
In 2011, 7.56% of black males aged 21-65 were incarcerated in the US while 1.30% of working-agewhite males were incarcerated. Black immigrants have a similarly low probability of being incarcerated
16Arcidiacono et al. (2012) find that at Duke this category (except for computer science) is associated with higher study times andharsher grading standards. Analyzing time paths of major choices, they find that black students shift disproportionately from theirinitial interest in natural sciences, engineering, and economics to majors in the humanities, and social sciences.
17Similarly, 18% of black immigrant females versus only 11% of both white and black native females major in natural sciences,engineering and economics.
18Breaking up major decisions by age group did not reveal any striking cohort differences.
8
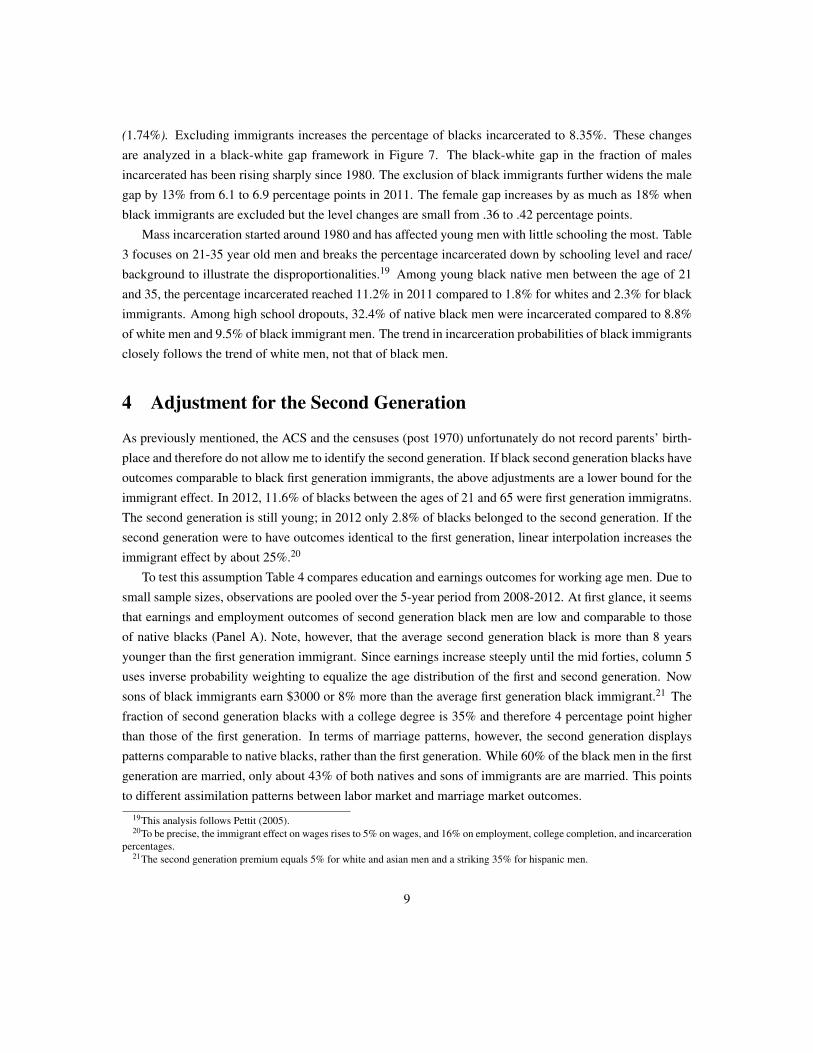
(1.74%). Excluding immigrants increases the percentage of blacks incarcerated to 8.35%. These changesare analyzed in a black-white gap framework in Figure 7. The black-white gap in the fraction of malesincarcerated has been rising sharply since 1980. The exclusion of black immigrants further widens the malegap by 13% from 6.1 to 6.9 percentage points in 2011. The female gap increases by as much as 18% whenblack immigrants are excluded but the level changes are small from .36 to .42 percentage points.
Mass incarceration started around 1980 and has affected young men with little schooling the most. Table3 focuses on 21-35 year old men and breaks the percentage incarcerated down by schooling level and race/background to illustrate the disproportionalities.19 Among young black native men between the age of 21and 35, the percentage incarcerated reached 11.2% in 2011 compared to 1.8% for whites and 2.3% for blackimmigrants. Among high school dropouts, 32.4% of native black men were incarcerated compared to 8.8%of white men and 9.5% of black immigrant men. The trend in incarceration probabilities of black immigrantsclosely follows the trend of white men, not that of black men.
4 Adjustment for the Second Generation
As previously mentioned, the ACS and the censuses (post 1970) unfortunately do not record parents’ birth-place and therefore do not allow me to identify the second generation. If black second generation blacks haveoutcomes comparable to black first generation immigrants, the above adjustments are a lower bound for theimmigrant effect. In 2012, 11.6% of blacks between the ages of 21 and 65 were first generation immigratns.The second generation is still young; in 2012 only 2.8% of blacks belonged to the second generation. If thesecond generation were to have outcomes identical to the first generation, linear interpolation increases theimmigrant effect by about 25%.20
To test this assumption Table 4 compares education and earnings outcomes for working age men. Due tosmall sample sizes, observations are pooled over the 5-year period from 2008-2012. At first glance, it seemsthat earnings and employment outcomes of second generation black men are low and comparable to thoseof native blacks (Panel A). Note, however, that the average second generation black is more than 8 yearsyounger than the first generation immigrant. Since earnings increase steeply until the mid forties, column 5uses inverse probability weighting to equalize the age distribution of the first and second generation. Nowsons of black immigrants earn $3000 or 8% more than the average first generation black immigrant.21 Thefraction of second generation blacks with a college degree is 35% and therefore 4 percentage point higherthan those of the first generation. In terms of marriage patterns, however, the second generation displayspatterns comparable to native blacks, rather than the first generation. While 60% of the black men in the firstgeneration are married, only about 43% of both natives and sons of immigrants are are married. This pointsto different assimilation patterns between labor market and marriage market outcomes.
19This analysis follows Pettit (2005).20To be precise, the immigrant effect on wages rises to 5% on wages, and 16% on employment, college completion, and incarceration
percentages.21The second generation premium equals 5% for white and asian men and a striking 35% for hispanic men.
9
For women both of these trends seem to be even more pronounced (Panel B). The second generation,once adjusted to have the same age distribution as the first generation, has an earnings premium of $8,600over native blacks, $6,700 over first generation, and $3,600 over whites. Only 38% of women in the secondgeneration are married, which is close to the average of native blacks (39%) and much lower than marriageprobabilities of the women of the first generation (57%) and white women (65%).
5 Extrapolation to the Future
There are three reasons that suggest that black first and second generation will make up a greater share of theblack population in the future than they do today. First, as mentioned above, the share of second generationblacks of working age is still low compared to first generation immigrants. Since black immigration ofnotable size did not start until 1980 most immigrants are not old enough to have had working age childrentoday. Second, black immigration has been steadily increasing since 1980 and it is reasonable to assume thatit will either continue to increase or remain constant but probably not decrease sharply. Third, black firstgeneration immigrants have a higher fertility rate than native blacks, which naturally increases the share ofsecond generation blacks.
In addition to an increase in black immigrants, I expect annual earnings of black immigrants to increasesignificantly over the next decades. The education attainment gaps between native and immigrant blacks arecurrently larger than the earnings gaps. The second generation black population is currently very young whencompared to the native population (18 versus 34 years) and they have not reaped the returns of increasedhuman capital investments yet.22
If these two developments progress as laid out above, and the average outcomes of whites do not changedramatically, extrapolation suggests that black immigration will have a strong positive effect on black whitewage ratios. This could manifest itself in two ways: Either black white wage ratios increase, which could bemisinterpreted as an decrease in native black-white inequality if the immigration channel is ignored or blackwhite wage ratios fall or remain constant and the immigration channel is masking an even greater increasein inequality.
6 Conclusion
This paper adds to the existing literature on three dimensions. First, it lays out the fact that black immigrantshave become a large part of the black population in the last decades. Second, it demonstrates that thecharacteristics of immigrant blacks are very different from those of native blacks. Third, it adjusts inequalitygaps to stress how the inclusion of immigrants has painted a false picture of native black progress.
The share of the black immigrants among the black population in the US has increased from 1% in the22The source is the Public Use Sample of the Current Population Survey from 2012. Weights are used to reflect sampling.
10
1970s to 11% in 2011. Black immigrant males’ earnings and wages are higher than those of native blacksbut the premium is small once we condition on being employed. Employment, education, incarceration,and marriage outcomes confirm that we are dealing with two completely different subsets of the population.Black immigrants are much more likely then native blacks to be employed, married, highly educated andnot incarcerated. The 1980 to 2010 period represents a widening of the black-white wage, employment,college completion, and incarceration gap. This deterioration of blacks’ relative economic position is furtherexacerbated when black immigrants are excluded and native blacks are compared to whites.
In summary, the inclusion of black immigrants when analyzing black-white achievement gaps cloudsour understanding of the economic and social condition of native blacks. This channel is likely to gain inimportance as black immigration continues to increase and second generation blacks grow old enough toreap the rewards of their relatively high human capital investments. Hence, future research on black-whiteinequality should be aware of this effect in order to not overestimate native black economic progress. Myintention is not to dismiss black immigration as a purely confounding factor. On the contrary, selective blackmigration has the potential to spur upward mobility for all blacks in the US. Nevertheless, confusing blackeconomic progress driven by internal factors with population composition changes due to immigration flowsis a pitfall that future research needs to avoid. This is especially true for questions that address long-termeffects of slavery, Jim Crow laws, and segregation.
References
Arcidiacono, Peter, Aucejo, Esteban, & Spenner, Ken. 2012. What happens after enrollment? An analysisof the time path of racial differences in GPA and major choice. IZA Journal of Labor Economics 1, no. 5.
Bogan, Vicki, and William Darity Jr. 2008. Culture and entrepreneurship? African American andimmigrant self-employment in the United States. Journal of Socio-Economics 37: 1999-2019.
Bollinger, Christopher R., and Hirsch, Barry T. 2006. Match Bias from Earnings Imputation in the Cur-rentPopulation Survey: The Case of Imperfect Matching. Journal of Labor Economics 4, no. 3: 483– 520.
Bound, John and Richard Freeman. 1992. What Went Wrong? The Erosion of Relative Earnings andEmployment Among Young Black Men in the 1980s. Quarterly Journal of Economics 107, no. 1:201-232.
Bound, John, and Harry Holzer. 1993. Industrial Shifts, Skills Levels, and the Labor Market for White andBlack Males. The Review of Economics and Statistics 75, no. 3:387-396.
11
Bureau of Justice Statistics. 2011. Correctional Population in the United States, 2010.
Butcher, Kristin. 1994. Black Immigrants in the United States: A Comparison with Native Blacks andOther Immigrants. Industrial and Labor Relations 47, no. 2.
Butcher, Kirsten, and Anne Morrison Piehl. 1998. Recent Immigrants: Unexpected Implications for Crimeand Incarceration. Industrial and Labor Relations Review. 51, no. 4:654- 679.
Butler, John Sibley, and Cedric Herring. 1991. Ethnicity and Entrepreneurship in America: Toward anExplanation of Racial and Ethnic Group Variations in Self-Employment. Sociological Perspectives
34:79-94.
Card, David, and Alan B. Krueger. 1992. School Quality and Black-White Relative Earnings: A DirectAssessment. Quarterly Journal of Economics 107:151–200.
Carliner, Geoffrey. 1980. Wages, Earnings, and Hours of First, Second, and Third Generation AmericanMales. Economic Inquiry 18:87-102.v
Chandra, Amitabh. 2003. Is the convergence in the racial wage gap illusory? NBER Working Paper 9476.
Charles, Kerwin and Ming-Ching Luoh. 2010. Male Incarceration, the Marriage Market, and FemaleOutcomes. The Review of Economics and Statistics. 92, no. 3: 614-627.
Donohue, John J., and James Heckman. 1991. Continuous versus Episodic Change: The Impact of CivilRights Policy on the Economic Status of Blacks. Journal of Economic Literature 29:1603–1643.
Freeman, Richard. 1973. Decline of Labor Market Discrimination and Economic Analysis. American
Economic Review 63, no. 2:280-286.
Hamilton, Tod. 2010. Differences in Labor Market Experiences of Black Immigrants and Black Natives:The Impact of Migration Selectivity. Working Paper.
12
Johnson, Rucker and Steven Raphael. 2006. The Effects of Male Incarceration Dynamics on AIDSInfection Rates among African American Women and Men. Working Paper 22, National Poverty Center,University of Michigan.
Kalmijn, Matthijs. 1996. The Socioeconomic Assimilation of Caribbean American Blacks. Social Forces
74: 911-930.
Kasinitz, Philip, Juan Battle, and Inés Myares. 2001. Fade to Black? The West Indian Immigrants inSouthern Florida. Ethnicities: Children of Immigrants in America, edited by Rubén Rumbaut, andAlejandro Portes. University of California Press. Russel Sage Foundation, New York.
Kent, M.M. 2007. Immigration and America’s Black Population. Population Bulletin 62.
King, Miriam, Steven Ruggles, J. Trent Alexander, Sarah Flood, Katie Genadek, Matthew B. Schroeder,Brandon Trampe, and Rebecca Vick. Integrated Public Use Microdata Series, Current Population Survey:Version 3.0. [Machine-readable database]. Minneapolis: University of Minnesota, 2010.
Kollehlon, Konia T., and Edward E. Eule. 2003. The Socioeconotnic Attainment Patterns of Africans in theUnited States. International Migration Review 37:1163-1190.
Massey, Douglas, Margarita Mooney, Kimberly Torres, and Camillez Z. Charles. 2007. Black Immigrantsand Black Natives Attending Selective Colleges and Universities in the United States. American Journal of
Education 113:243-271.
Model, Suzanne. 1991. Caribbean Immigrants: A Black Success Story? International Migration Review
25. Model, Suzanne. 1995. West Indian Prosperity: Fact or Friction? Social Problems 42:535-553.
Model, Suzanne. 2008. West Indian Immigrants: A Black Success Story? New York: Russell SageFoundation.
Pettit, Becky. 2012. Invisible Men: mass incarceration and the myth of black progress. New York: RusselSage Foundation
13
Rimer, Sara, and Karen Arenson. 2004. Top Colleges Take More Blacks, but Which Ones? New York
Times, June 24.
Ruggles, Steven, J. Trent Alexander, Katie Genadek, Ronald Goeken, Matthew B. Schroeder, and MatthewSobek. Integrated Public Use Microdata Series: Version 5.0 [Machine-readable database]. Minneapolis:University of Minnesota, 2010.
Smith, James P., and Finis R. Welch. 1989. Black Economic Progress after Myrdal. Journal of Economic
Literature 27:519–64.
Sowell, Thomas. 1978. Three Black Histories. Essays and Data on American Ethnic Groups. WashingtonD.C.: The Urban Institute: 41-48.
Vroman, Wayne, 1986. The Relative Earnings of Black Men: An Analysis of the Sample Selection
Hypothesis. Washington DC: The Urban Institute.
Waters, Mary. 1999. Black Identities: West Indian Immigrant Dreams and American Realities. New York:
Russell Sage Foundation.
14
Figures and Tables
Figure 1: Black Immigrants as Share of Black US Population (by Origin)0
.02
.04
.06
.08
.1
1940 1950 1960 1970 1980 1990 2000 2010Census year
Africa West IndiesSouth America OtherAll Origins
Source: IPUMS− Census and ACS with probability weights
15
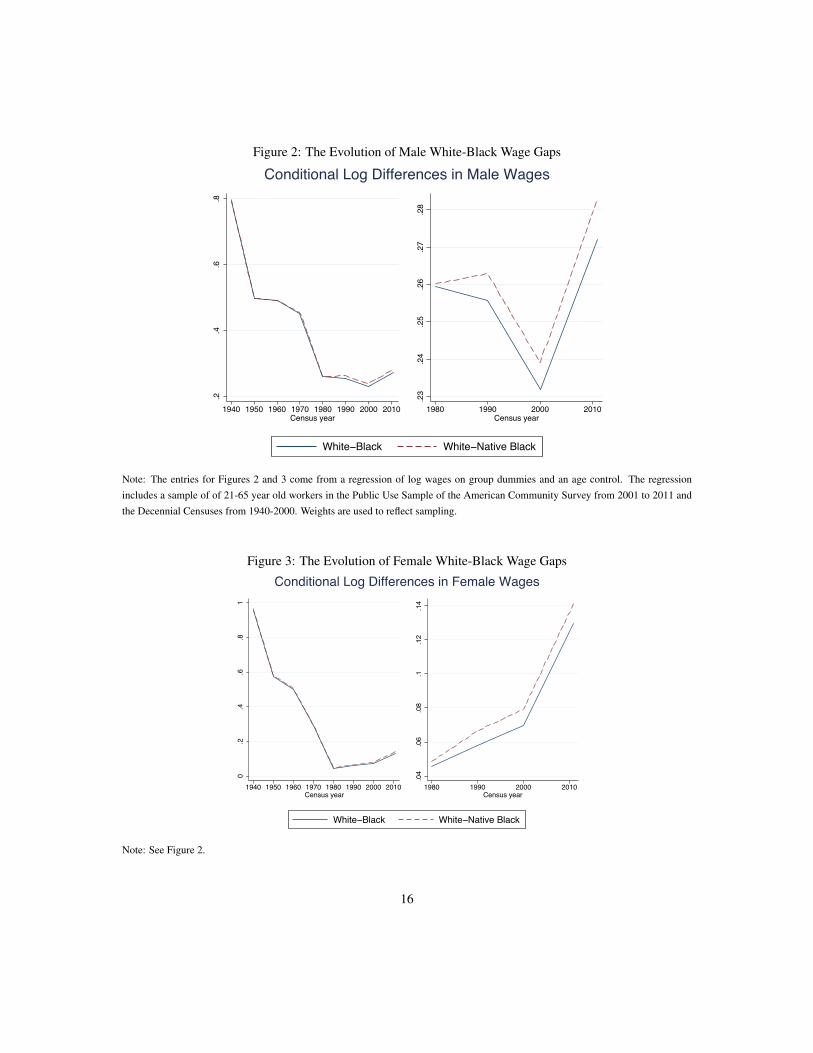
Figure 2: The Evolution of Male White-Black Wage Gaps
.2.4
.6.8
1940 1950 1960 1970 1980 1990 2000 2010Census year
.23
.24
.25
.26
.27
.28
1980 1990 2000 2010Census year
Conditional Log Differences in Male Wages
White−Black White−Native Black
Note: The entries for Figures 2 and 3 come from a regression of log wages on group dummies and an age control. The regressionincludes a sample of of 21-65 year old workers in the Public Use Sample of the American Community Survey from 2001 to 2011 andthe Decennial Censuses from 1940-2000. Weights are used to reflect sampling.
Figure 3: The Evolution of Female White-Black Wage Gaps
0.2
.4.6
.81
1940 1950 1960 1970 1980 1990 2000 2010Census year
.04
.06
.08
.1.1
2.1
4
1980 1990 2000 2010Census year
Conditional Log Differences in Female Wages
White−Black White−Native Black
Note: See Figure 2.
16
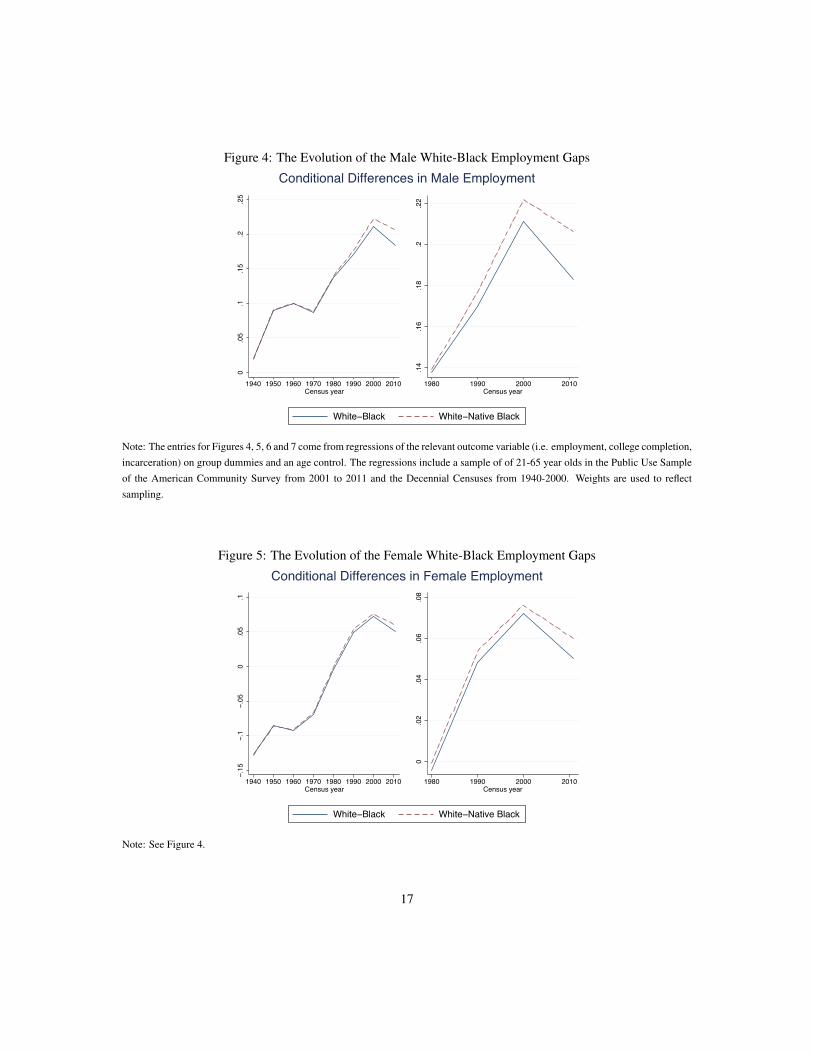
Figure 4: The Evolution of the Male White-Black Employment Gaps
0.0
5.1
.15
.2.2
5
1940 1950 1960 1970 1980 1990 2000 2010Census year
.14
.16
.18
.2.2
2
1980 1990 2000 2010Census year
Conditional Differences in Male Employment
White−Black White−Native Black
Note: The entries for Figures 4, 5, 6 and 7 come from regressions of the relevant outcome variable (i.e. employment, college completion,incarceration) on group dummies and an age control. The regressions include a sample of of 21-65 year olds in the Public Use Sampleof the American Community Survey from 2001 to 2011 and the Decennial Censuses from 1940-2000. Weights are used to reflectsampling.
Figure 5: The Evolution of the Female White-Black Employment Gaps
−.15
−.1
−.05
0.0
5.1
1940 1950 1960 1970 1980 1990 2000 2010Census year
0.0
2.0
4.0
6.0
8
1980 1990 2000 2010Census year
Conditional Differences in Female Employment
White−Black White−Native Black
Note: See Figure 4.
17
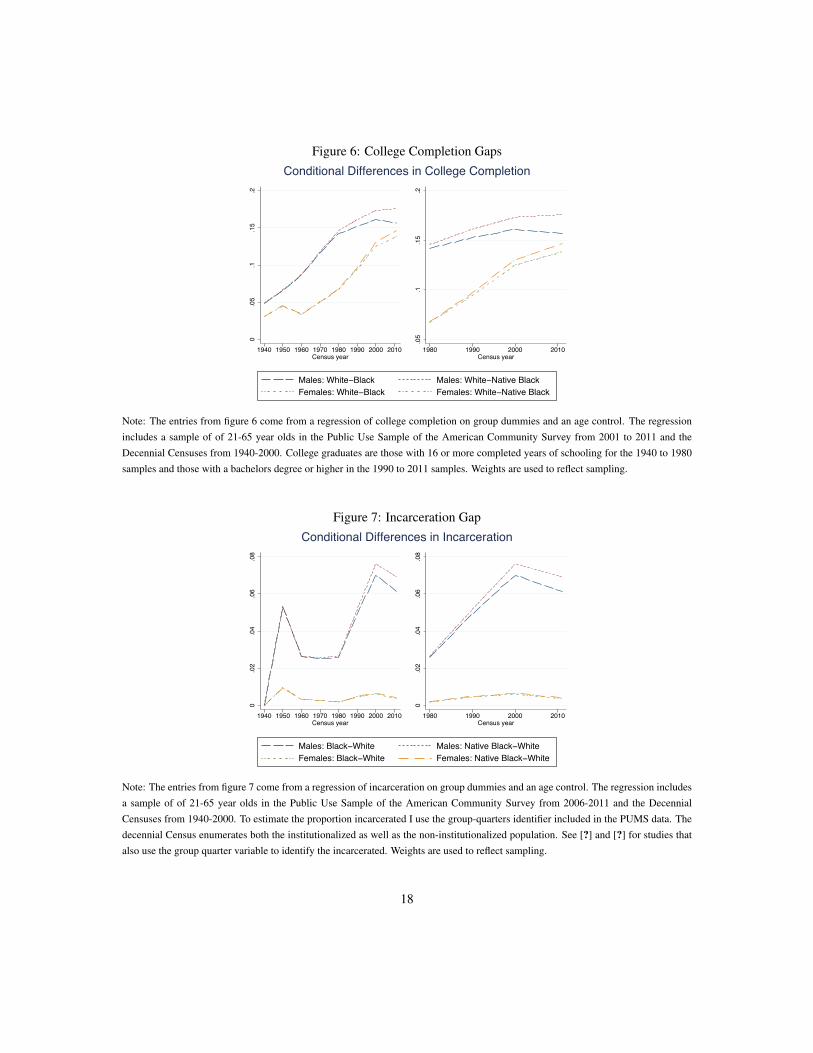
Figure 6: College Completion Gaps
0.0
5.1
.15
.2
1940 1950 1960 1970 1980 1990 2000 2010Census year
.05
.1.1
5.2
1980 1990 2000 2010Census year
Conditional Differences in College Completion
Males: White−Black Males: White−Native BlackFemales: White−Black Females: White−Native Black
Note: The entries from figure 6 come from a regression of college completion on group dummies and an age control. The regressionincludes a sample of of 21-65 year olds in the Public Use Sample of the American Community Survey from 2001 to 2011 and theDecennial Censuses from 1940-2000. College graduates are those with 16 or more completed years of schooling for the 1940 to 1980samples and those with a bachelors degree or higher in the 1990 to 2011 samples. Weights are used to reflect sampling.
Figure 7: Incarceration Gap
0.0
2.0
4.0
6.0
8
1940 1950 1960 1970 1980 1990 2000 2010Census year
0.0
2.0
4.0
6.0
8
1980 1990 2000 2010Census year
Conditional Differences in Incarceration
Males: Black−White Males: Native Black−WhiteFemales: Black−White Females: Native Black−White
Note: The entries from figure 7 come from a regression of incarceration on group dummies and an age control. The regression includesa sample of of 21-65 year olds in the Public Use Sample of the American Community Survey from 2006-2011 and the DecennialCensuses from 1940-2000. To estimate the proportion incarcerated I use the group-quarters identifier included in the PUMS data. Thedecennial Census enumerates both the institutionalized as well as the non-institutionalized population. See [?] and [?] for studies thatalso use the group quarter variable to identify the incarcerated. Weights are used to reflect sampling.
18
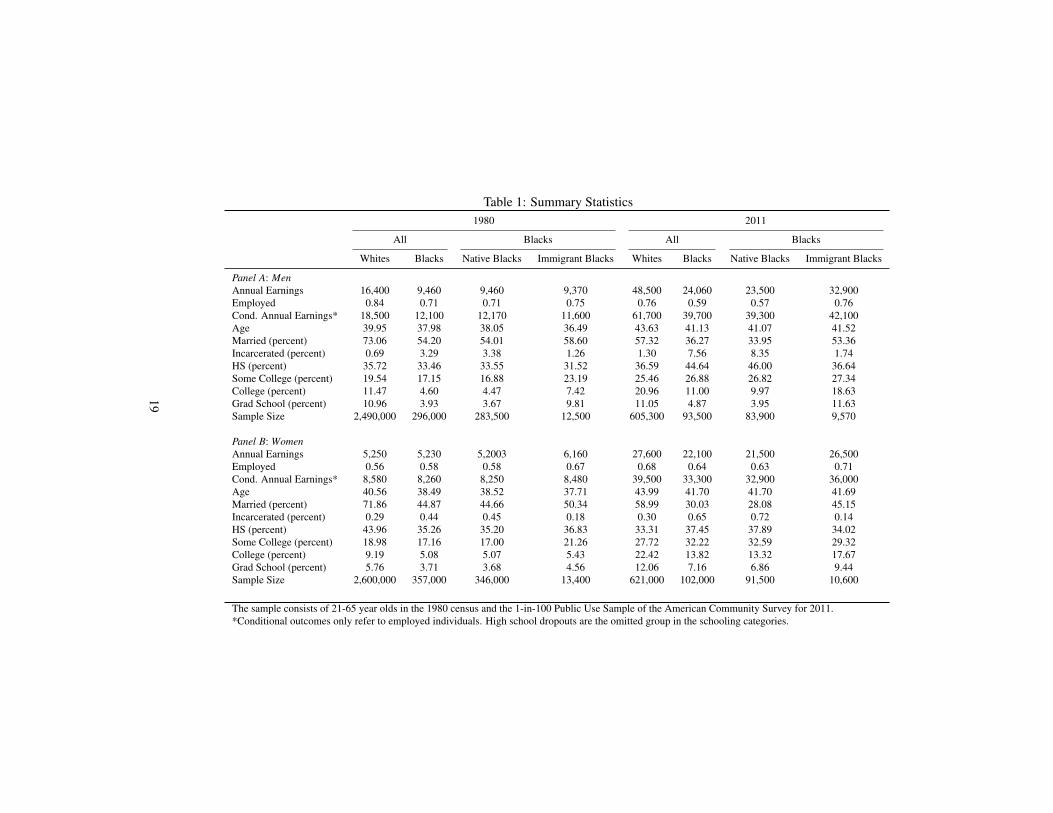
Table 1: Summary Statistics1980 2011
All Blacks All Blacks
Whites Blacks Native Blacks Immigrant Blacks Whites Blacks Native Blacks Immigrant Blacks
Panel A: MenAnnual Earnings 16,400 9,460 9,460 9,370 48,500 24,060 23,500 32,900Employed 0.84 0.71 0.71 0.75 0.76 0.59 0.57 0.76Cond. Annual Earnings* 18,500 12,100 12,170 11,600 61,700 39,700 39,300 42,100Age 39.95 37.98 38.05 36.49 43.63 41.13 41.07 41.52Married (percent) 73.06 54.20 54.01 58.60 57.32 36.27 33.95 53.36Incarcerated (percent) 0.69 3.29 3.38 1.26 1.30 7.56 8.35 1.74HS (percent) 35.72 33.46 33.55 31.52 36.59 44.64 46.00 36.64Some College (percent) 19.54 17.15 16.88 23.19 25.46 26.88 26.82 27.34College (percent) 11.47 4.60 4.47 7.42 20.96 11.00 9.97 18.63Grad School (percent) 10.96 3.93 3.67 9.81 11.05 4.87 3.95 11.63Sample Size 2,490,000 296,000 283,500 12,500 605,300 93,500 83,900 9,570
Panel B: WomenAnnual Earnings 5,250 5,230 5,2003 6,160 27,600 22,100 21,500 26,500Employed 0.56 0.58 0.58 0.67 0.68 0.64 0.63 0.71Cond. Annual Earnings* 8,580 8,260 8,250 8,480 39,500 33,300 32,900 36,000Age 40.56 38.49 38.52 37.71 43.99 41.70 41.70 41.69Married (percent) 71.86 44.87 44.66 50.34 58.99 30.03 28.08 45.15Incarcerated (percent) 0.29 0.44 0.45 0.18 0.30 0.65 0.72 0.14HS (percent) 43.96 35.26 35.20 36.83 33.31 37.45 37.89 34.02Some College (percent) 18.98 17.16 17.00 21.26 27.72 32.22 32.59 29.32College (percent) 9.19 5.08 5.07 5.43 22.42 13.82 13.32 17.67Grad School (percent) 5.76 3.71 3.68 4.56 12.06 7.16 6.86 9.44Sample Size 2,600,000 357,000 346,000 13,400 621,000 102,000 91,500 10,600
The sample consists of 21-65 year olds in the 1980 census and the 1-in-100 Public Use Sample of the American Community Survey for 2011.*Conditional outcomes only refer to employed individuals. High school dropouts are the omitted group in the schooling categories.
19
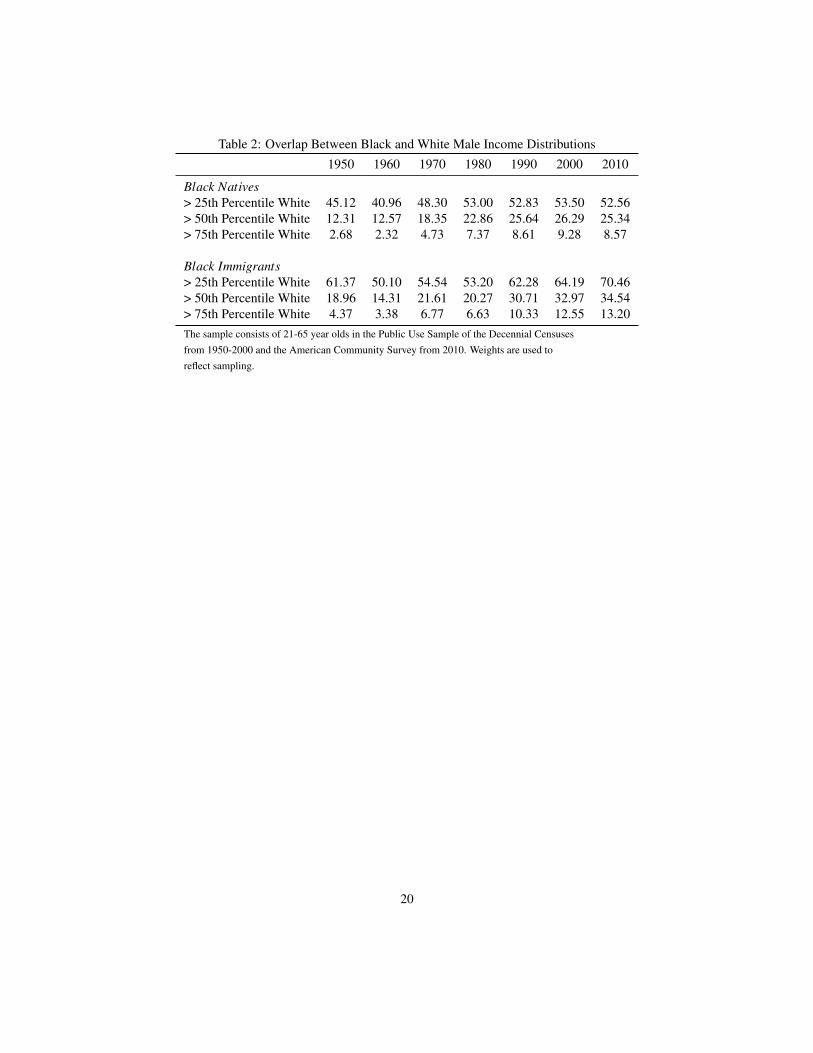
Table 2: Overlap Between Black and White Male Income Distributions1950 1960 1970 1980 1990 2000 2010
Black Natives> 25th Percentile White 45.12 40.96 48.30 53.00 52.83 53.50 52.56> 50th Percentile White 12.31 12.57 18.35 22.86 25.64 26.29 25.34> 75th Percentile White 2.68 2.32 4.73 7.37 8.61 9.28 8.57
Black Immigrants> 25th Percentile White 61.37 50.10 54.54 53.20 62.28 64.19 70.46> 50th Percentile White 18.96 14.31 21.61 20.27 30.71 32.97 34.54> 75th Percentile White 4.37 3.38 6.77 6.63 10.33 12.55 13.20The sample consists of 21-65 year olds in the Public Use Sample of the Decennial Censusesfrom 1950-2000 and the American Community Survey from 2010. Weights are used toreflect sampling.
20
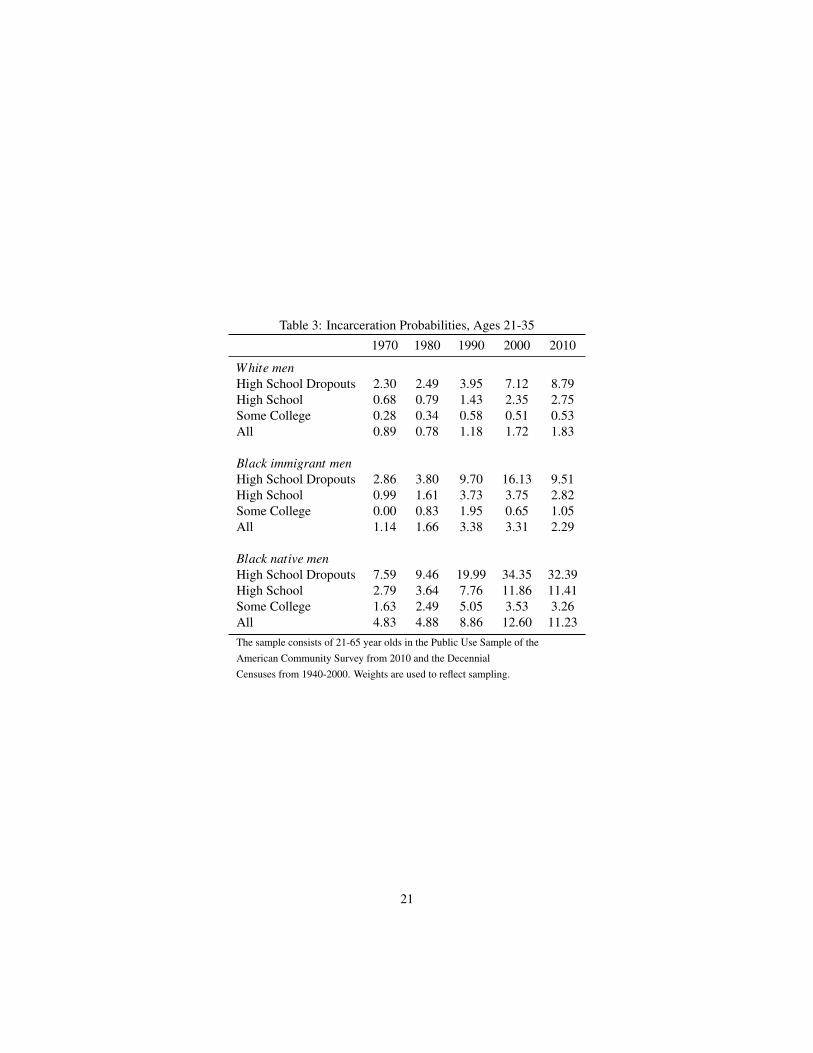
Table 3: Incarceration Probabilities, Ages 21-351970 1980 1990 2000 2010
White menHigh School Dropouts 2.30 2.49 3.95 7.12 8.79High School 0.68 0.79 1.43 2.35 2.75Some College 0.28 0.34 0.58 0.51 0.53All 0.89 0.78 1.18 1.72 1.83
Black immigrant menHigh School Dropouts 2.86 3.80 9.70 16.13 9.51High School 0.99 1.61 3.73 3.75 2.82Some College 0.00 0.83 1.95 0.65 1.05All 1.14 1.66 3.38 3.31 2.29
Black native menHigh School Dropouts 7.59 9.46 19.99 34.35 32.39High School 2.79 3.64 7.76 11.86 11.41Some College 1.63 2.49 5.05 3.53 3.26All 4.83 4.88 8.86 12.60 11.23The sample consists of 21-65 year olds in the Public Use Sample of theAmerican Community Survey from 2010 and the DecennialCensuses from 1940-2000. Weights are used to reflect sampling.
21
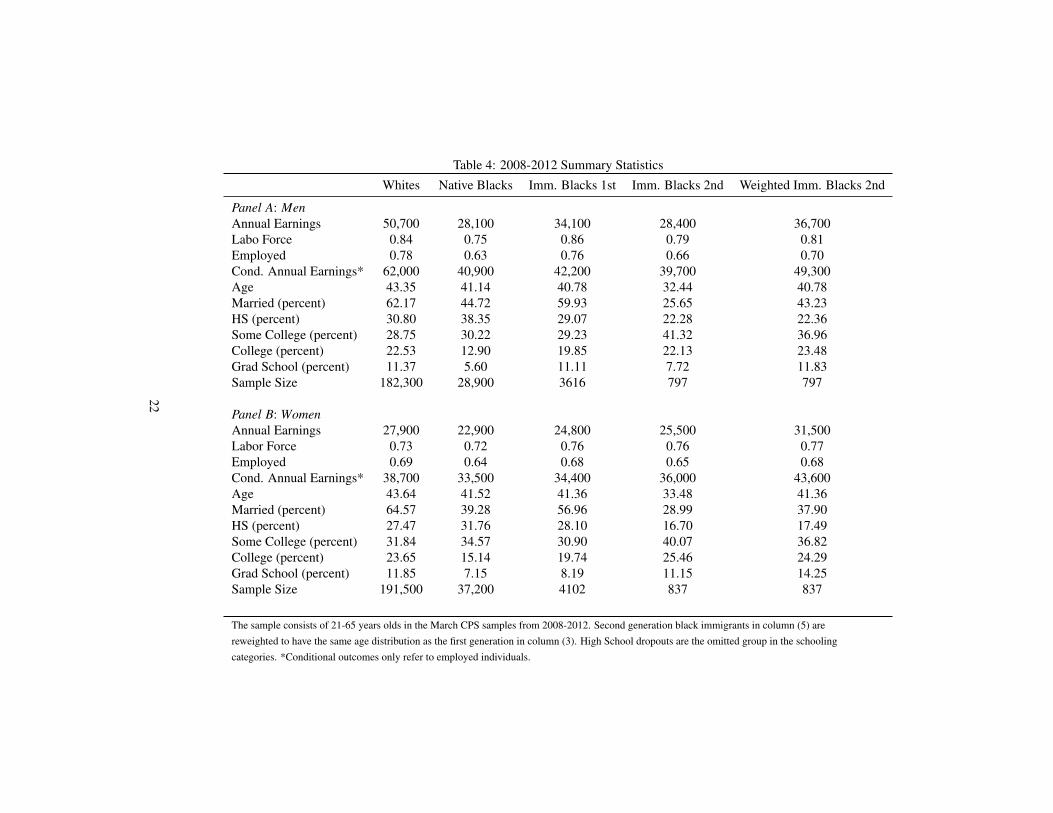
Table 4: 2008-2012 Summary StatisticsWhites Native Blacks Imm. Blacks 1st Imm. Blacks 2nd Weighted Imm. Blacks 2nd
Panel A: MenAnnual Earnings 50,700 28,100 34,100 28,400 36,700Labo Force 0.84 0.75 0.86 0.79 0.81Employed 0.78 0.63 0.76 0.66 0.70Cond. Annual Earnings* 62,000 40,900 42,200 39,700 49,300Age 43.35 41.14 40.78 32.44 40.78Married (percent) 62.17 44.72 59.93 25.65 43.23HS (percent) 30.80 38.35 29.07 22.28 22.36Some College (percent) 28.75 30.22 29.23 41.32 36.96College (percent) 22.53 12.90 19.85 22.13 23.48Grad School (percent) 11.37 5.60 11.11 7.72 11.83Sample Size 182,300 28,900 3616 797 797
Panel B: WomenAnnual Earnings 27,900 22,900 24,800 25,500 31,500Labor Force 0.73 0.72 0.76 0.76 0.77Employed 0.69 0.64 0.68 0.65 0.68Cond. Annual Earnings* 38,700 33,500 34,400 36,000 43,600Age 43.64 41.52 41.36 33.48 41.36Married (percent) 64.57 39.28 56.96 28.99 37.90HS (percent) 27.47 31.76 28.10 16.70 17.49Some College (percent) 31.84 34.57 30.90 40.07 36.82College (percent) 23.65 15.14 19.74 25.46 24.29Grad School (percent) 11.85 7.15 8.19 11.15 14.25Sample Size 191,500 37,200 4102 837 837
The sample consists of 21-65 years olds in the March CPS samples from 2008-2012. Second generation black immigrants in column (5) arereweighted to have the same age distribution as the first generation in column (3). High School dropouts are the omitted group in the schoolingcategories. *Conditional outcomes only refer to employed individuals.
22

A Supplemental Tables
23
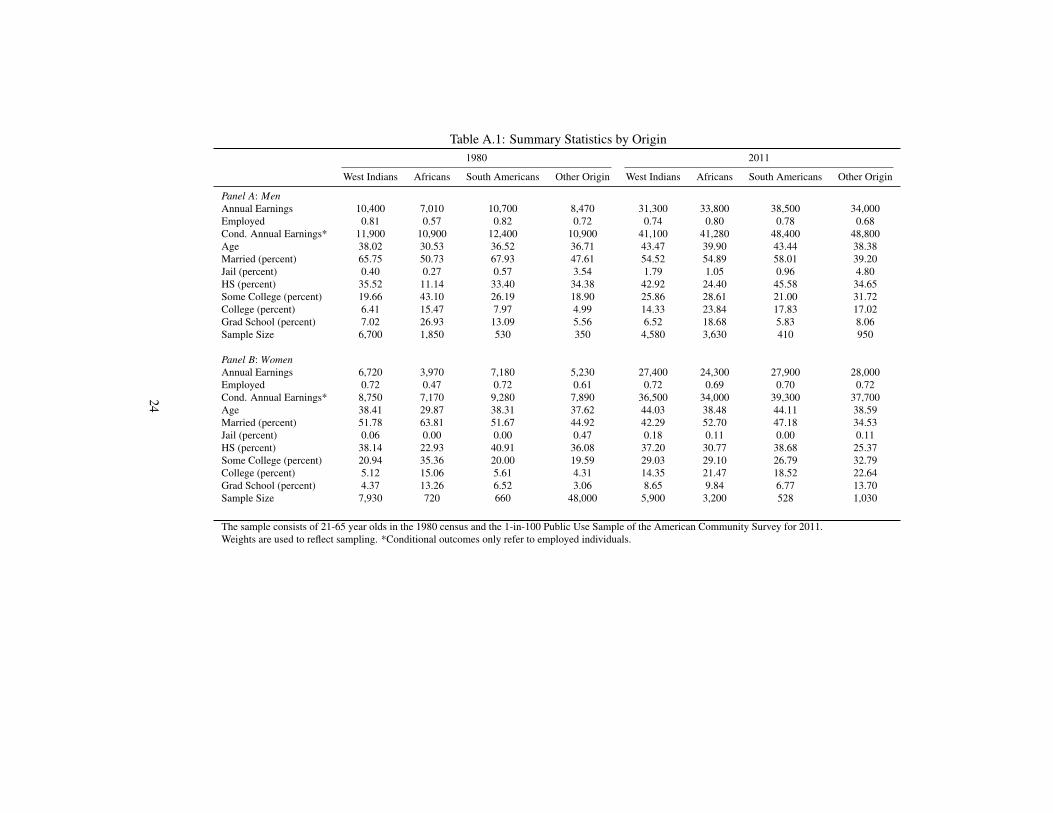
Table A.1: Summary Statistics by Origin1980 2011
West Indians Africans South Americans Other Origin West Indians Africans South Americans Other Origin
Panel A: MenAnnual Earnings 10,400 7,010 10,700 8,470 31,300 33,800 38,500 34,000Employed 0.81 0.57 0.82 0.72 0.74 0.80 0.78 0.68Cond. Annual Earnings* 11,900 10,900 12,400 10,900 41,100 41,280 48,400 48,800Age 38.02 30.53 36.52 36.71 43.47 39.90 43.44 38.38Married (percent) 65.75 50.73 67.93 47.61 54.52 54.89 58.01 39.20Jail (percent) 0.40 0.27 0.57 3.54 1.79 1.05 0.96 4.80HS (percent) 35.52 11.14 33.40 34.38 42.92 24.40 45.58 34.65Some College (percent) 19.66 43.10 26.19 18.90 25.86 28.61 21.00 31.72College (percent) 6.41 15.47 7.97 4.99 14.33 23.84 17.83 17.02Grad School (percent) 7.02 26.93 13.09 5.56 6.52 18.68 5.83 8.06Sample Size 6,700 1,850 530 350 4,580 3,630 410 950
Panel B: WomenAnnual Earnings 6,720 3,970 7,180 5,230 27,400 24,300 27,900 28,000Employed 0.72 0.47 0.72 0.61 0.72 0.69 0.70 0.72Cond. Annual Earnings* 8,750 7,170 9,280 7,890 36,500 34,000 39,300 37,700Age 38.41 29.87 38.31 37.62 44.03 38.48 44.11 38.59Married (percent) 51.78 63.81 51.67 44.92 42.29 52.70 47.18 34.53Jail (percent) 0.06 0.00 0.00 0.47 0.18 0.11 0.00 0.11HS (percent) 38.14 22.93 40.91 36.08 37.20 30.77 38.68 25.37Some College (percent) 20.94 35.36 20.00 19.59 29.03 29.10 26.79 32.79College (percent) 5.12 15.06 5.61 4.31 14.35 21.47 18.52 22.64Grad School (percent) 4.37 13.26 6.52 3.06 8.65 9.84 6.77 13.70Sample Size 7,930 720 660 48,000 5,900 3,200 528 1,030
The sample consists of 21-65 year olds in the 1980 census and the 1-in-100 Public Use Sample of the American Community Survey for 2011.Weights are used to reflect sampling. *Conditional outcomes only refer to employed individuals.
24
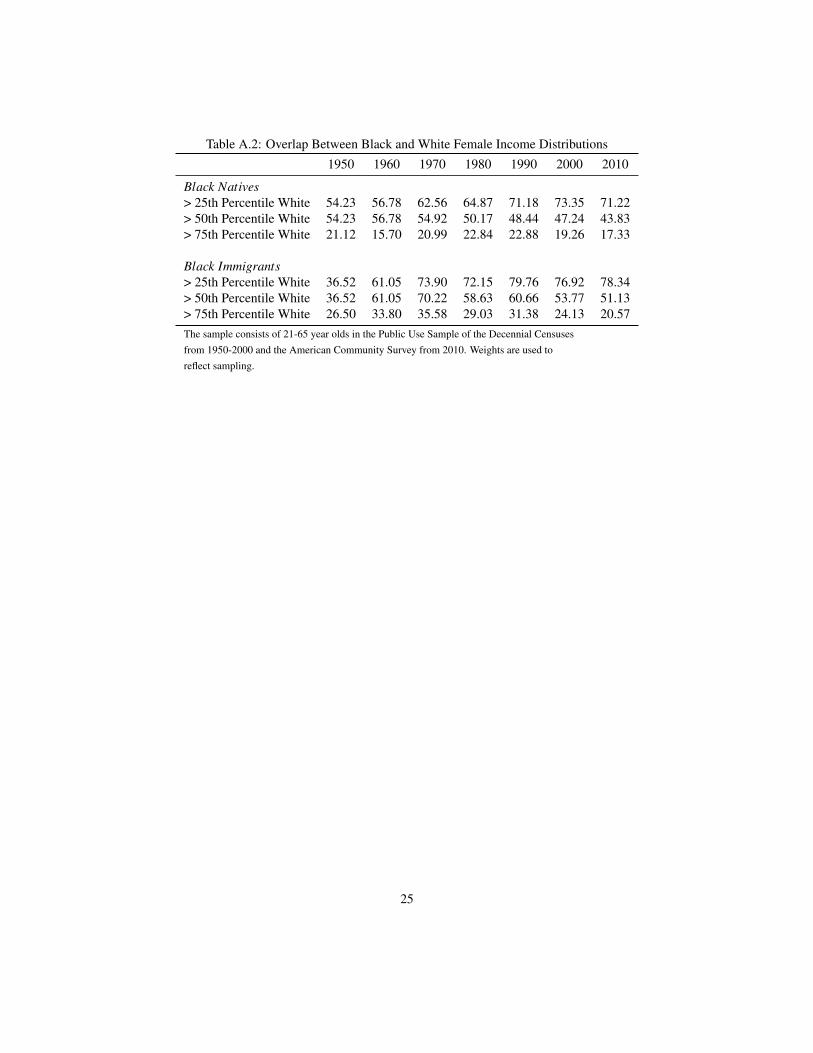
Table A.2: Overlap Between Black and White Female Income Distributions1950 1960 1970 1980 1990 2000 2010
Black Natives> 25th Percentile White 54.23 56.78 62.56 64.87 71.18 73.35 71.22> 50th Percentile White 54.23 56.78 54.92 50.17 48.44 47.24 43.83> 75th Percentile White 21.12 15.70 20.99 22.84 22.88 19.26 17.33
Black Immigrants> 25th Percentile White 36.52 61.05 73.90 72.15 79.76 76.92 78.34> 50th Percentile White 36.52 61.05 70.22 58.63 60.66 53.77 51.13> 75th Percentile White 26.50 33.80 35.58 29.03 31.38 24.13 20.57The sample consists of 21-65 year olds in the Public Use Sample of the Decennial Censusesfrom 1950-2000 and the American Community Survey from 2010. Weights are used toreflect sampling.
25
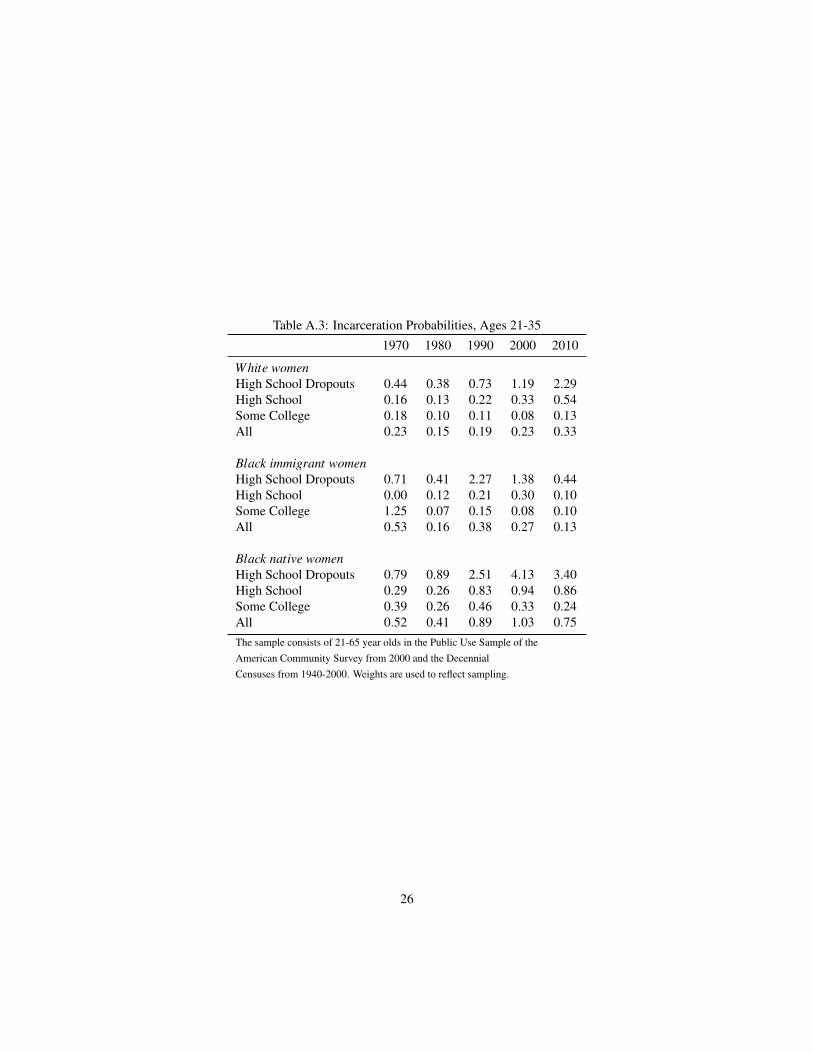
Table A.3: Incarceration Probabilities, Ages 21-351970 1980 1990 2000 2010
White womenHigh School Dropouts 0.44 0.38 0.73 1.19 2.29High School 0.16 0.13 0.22 0.33 0.54Some College 0.18 0.10 0.11 0.08 0.13All 0.23 0.15 0.19 0.23 0.33
Black immigrant womenHigh School Dropouts 0.71 0.41 2.27 1.38 0.44High School 0.00 0.12 0.21 0.30 0.10Some College 1.25 0.07 0.15 0.08 0.10All 0.53 0.16 0.38 0.27 0.13
Black native womenHigh School Dropouts 0.79 0.89 2.51 4.13 3.40High School 0.29 0.26 0.83 0.94 0.86Some College 0.39 0.26 0.46 0.33 0.24All 0.52 0.41 0.89 1.03 0.75The sample consists of 21-65 year olds in the Public Use Sample of theAmerican Community Survey from 2000 and the DecennialCensuses from 1940-2000. Weights are used to reflect sampling.
26
B Data Description
Data Limitations
There are some very unfortunate data limitations with the CPS, ACS, and census data. The CPS asks re-spondents about the birthplace of their parents starting in 1994. In 2012 the sample includes over 200,000individuals. Roughly 22,700 of the sample identified themselves as non-Hispanic black, 2100 as first gener-ation immigrant non-Hispanic black, and only 1200 as second generation non-Hispanic black. If we restrictour sample to the working age population the number of first and second generation members in the sam-ple drop to 1600 and 340 respectively. Substantial black immigration is a very recent phenomenon and itaccelerated massively over the past 30 years. Hence many immigrants have not had children that are oldenough to be in the sample. Consequently the sample size is very small for calculating average annual wage,employment status, and educational attainment rates. Furthermore, the CPS coverage does not include mil-itary and institutional populations and is therefore not helpful in providing insights about the black-whitedifferences in incarceration rates.
The sample size for the ACS is much larger averaging about 3 million addresses per year. It includesboth military and institutional populations. Neither the census not the ACS, however, ask respondents abouttheir parents’ place of birth after 1970 so I can infer very little about second- or later generations from theACS and census and am limited to first generation immigrants. My method is to mostly use the ACS andcensus due to its sample size and more inclusive coverage, but infer second generation characteristics fromthe CPS and subsequently adjust my ACS/ census estimates.
Besides data limitations there are technical problems with both the CPS and the ACS/census. First,earnings are capped at different values in different years. This biases wage gaps since disproportionatelymany whites are high earners. Second, both the CPS and ACS oversample certain populations and sampleweights are necessary. Third, both the CPS and ACS/census have started a hot-decking procedure thatimputes earnings and other characteristics for individuals who do not report the relevant statistics. Droppingthese observations would delete a disproportionate number of young low-skill blacks and cause illusoryconvergence (Chandra 2003), leading to the inclusion of imputed data by most researchers. Bollinger andHirsch (2006) show that this introduces substantial bias due to mismatch in the imputation process.
In this paper, I estimated my results including imputed data. The ACS/census is a much larger data setthan the CPS and the bias is smaller. Dropping individuals with imputed information on age, race, sex,education, weeks worked or income does not change the results. One exception is that the hump in blackincarcerated men in 1950 in Figure 7 disappears.
Census and ACS Data
This paper uses data from the decennial censuses from 1940 to 2000. The 1940 sample is a subsamplerepresenting 1% of the population. The 1950 sample is a 1% sample of the population and includes sample-
27
line persons (who answered additional census questions for the entire household). The 1960 sample isa subsample representing 1% of the population. The 1970 sample consist of two IPUMS self-weightingsubsamples: the 1% State sample (5% form) and the 1% State sample (15%) form, which together represent2% of the population. The 1980, 1990, and 2000 samples are 5% Public use Samples. While the 1980 sampleis self-weighting, the 1990 and 2000 sample are not and weights are used to return to random proportions.The 2001-2011 ACS sample represent about .4% of the population in years 2001-2004 and 1% thereafter.
Sample Restrictions
• Age: The sample includes individuals aged 21-65 in order to focus on the working-age population.
• Race: Only individuals reported as being black or white and non-hispanic are included the analysis.
• Earnings: In the results presented I exclude persons with negative earnings. Only a very small fractionof individuals have negative earnings.
Constructed Variables
• Wages: Wage=Annual Earnings/(Weeks worked*Hours worked per week). For the 1990-2000 cen-suses and the ACS annual earnings is available. For the 1950-1980 censuses comparable measuresare derived by adding business and farm income. In 1940, individuals were only asked about theirwage and salary income and hence my annual earnings measure of 1940 is restricted to wage andsalary income. Weeks worked are provided in intervals and I take the midpoint of each interval. Hoursworked (during the previous week) are provided as a continuous measure from 1980 onwards. For the1940-1970 censuses interval measures of hours worked during the previous week are available and Iagain use the midpoint.
• Schooling: High school dropouts are those with less than 12 years of schooling for the 1940 to 1980samples and those with less than a high school degree in the 1990 to 2011 samples. High school(College) graduates are those with 12 (16) or more completed years of schooling for the 1940 to1980 samples and those with a high school (bachelors) degree or higher in the 1990 to 2011 samples.Graduate school attendants/graduates are those with more than 16 years of schooling for the 1940 to1980 samples and those with schooling beyond college in the 1990 to 2011 samples. “Some college”individuals have in between 13 and 15 years of schooling for the 1940 to 1980 census and a highschool but no college degree in the 1990 to 2011 samples.
• Labor force participation and employment are two important variables in the analysis. Both variablesare coded refering to the individual ’s status in the “previous week”. This does not have to be the sameweek for all respondents, since the census or survey was taken over a period of time. In all years, laborforce participants consist of employed and unemployed persons. Individuals are considered employedunder three different circumstances:
28
1. They worked at least one hour for pay or profit during the reference period.
2. They worked at least 15 hours as "unpaid family workers".
3. They had a job from which they were temporarily absent (e.g., because of illness or vacation time).
• Incarceration: To estimate the proportion incarcerated I use the group-quarters identifier includedin the PUMS data. The decennial Census enumerates both the institutionalized as well as the non-institutionalized population. See Butcher & Piehl (1998) and Johnson & Raphael (2006) for studiesthat also use the group quarter variable to identify the incarcerated.
CPS Data
This paper pools the 2008-2012 March CPS samples. Each sample year includes about 200,000 individualsfrom the non-institutionalized population. Weights are included to reflect sampling. Observations withimputed values are included but dropping them has minimal effects on the results.
Sample Restrictions
• Age: The sample includes individuals aged 21-65 in order to focus on the working-age population.
• Race: Only individuals reported as being black or white and non-hispanic are included the analysis.
• Earnings: In the results presented I excluded persons with negative earnings. Only a very smallfraction of individuals have negtive earnings.
Constructed variables
• Wages: Wage=Annual Earnings/(Weeks worked*Hours worked per week). Annual earnings includeearnings, farm and business income. Weeks worked and hours worked are provided as continuousmeasures.
• Schooling: Data on high school, college, and graduate school degrees are available. Individuals withmore than an high school degree and less than a college degree fall into the “some college” category.Individuals with more than a college degree (whether they complete graduate school or not) count asgraduate school attendants/ completers.
• Labor force participation and employment are comparable to those in the ACS/census.
29