Embed Size (px)
Citation preview
Summary of Fitness Test Principles
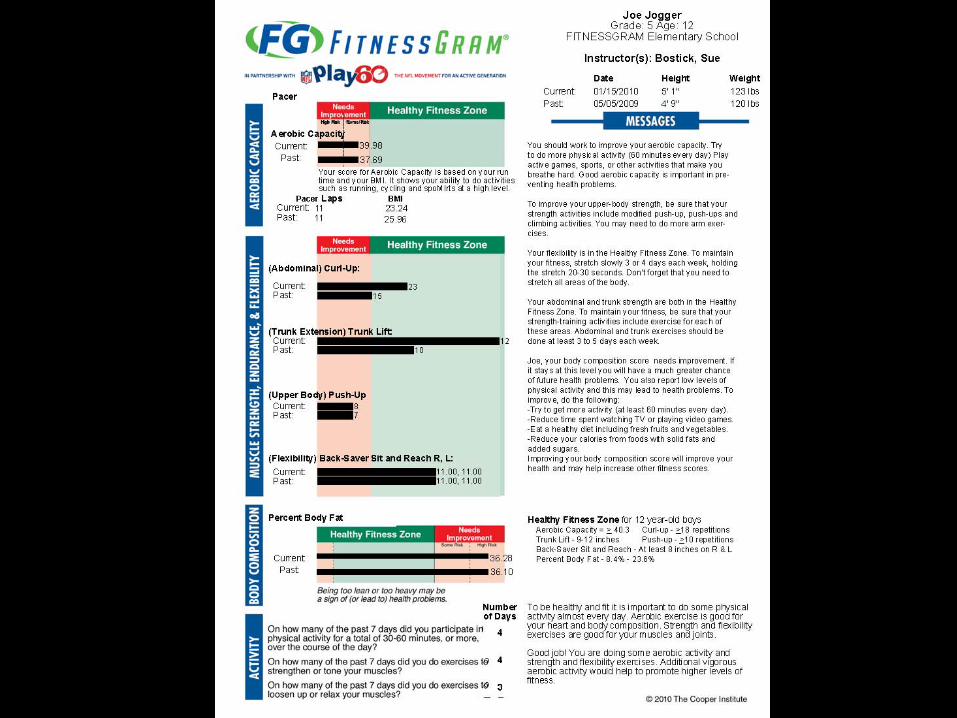
The primary reason for testing is to provide the student with personal information that may be used in planning a personal fitness program and developing motivation to take care of their health to reach their maximum potential.
FITNESSGRAM® is just an assessment; it is what the teachers do with the information that is truly
valuable.
Physical fitness testing should not become a competitive sport.
The performance of one student should not be compared to that of another student.
The performance level on fitness tests should not be used as a basis for grading.
The physical fitness experience should always be fun and enjoyable.
Students should not be encouraged to perform beyond the benchmarks.
2
6
3
4
5
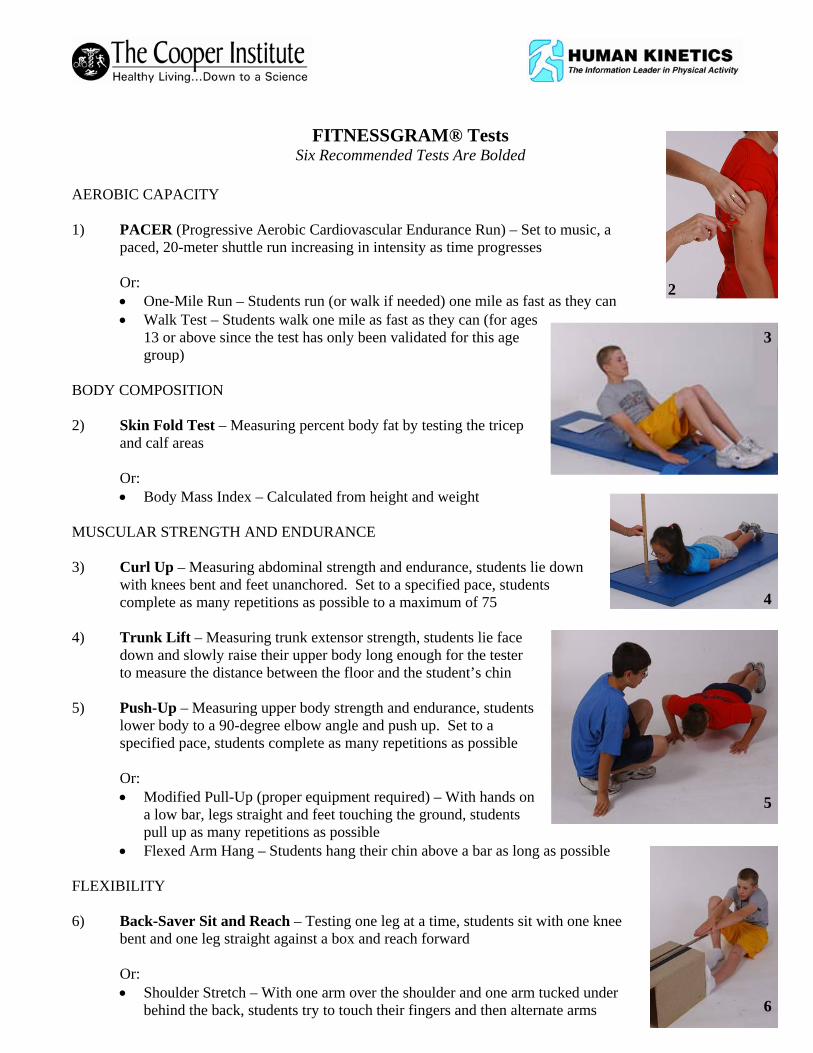
FITNESSGRAM® Tests Six Recommended Tests Are Bolded
AEROBIC CAPACITY
1) PACER (Progressive Aerobic Cardiovascular Endurance Run) – Set to music, a
paced, 20-meter shuttle run increasing in intensity as time progresses Or: • One-Mile Run – Students run (or walk if needed) one mile as fast as they can • Walk Test – Students walk one mile as fast as they can (for ages
13 or above since the test has only been validated for this age group)
BODY COMPOSITION
2) Skin Fold Test – Measuring percent body fat by testing the tricep
and calf areas
Or: • Body Mass Index – Calculated from height and weight
MUSCULAR STRENGTH AND ENDURANCE
3) Curl Up – Measuring abdominal strength and endurance, students lie down with knees bent and feet unanchored. Set to a specified pace, students complete as many repetitions as possible to a maximum of 75
4) Trunk Lift – Measuring trunk extensor strength, students lie face
down and slowly raise their upper body long enough for the tester to measure the distance between the floor and the student’s chin
5) Push-Up – Measuring upper body strength and endurance, students lower body to a 90-degree elbow angle and push up. Set to a specified pace, students complete as many repetitions as possible Or: • Modified Pull-Up (proper equipment required) – With hands on
a low bar, legs straight and feet touching the ground, students pull up as many repetitions as possible
• Flexed Arm Hang – Students hang their chin above a bar as long as possible
FLEXIBILITY
6) Back-Saver Sit and Reach – Testing one leg at a time, students sit with one knee bent and one leg straight against a box and reach forward Or: • Shoulder Stretch – With one arm over the shoulder and one arm tucked under
behind the back, students try to touch their fingers and then alternate arms
Test Administration Protocols
Testing Protocols are available in the FitnessGram® Test Administration Manual. A Test Administration Manual was included with the original software. Copies of the FitnessGram® Test Administration Manual-4th Edition can be found at http://www.fitnessgram.net/showproduct/?isbn=9780736068567 . This fully updated manual now includes a CD-ROM of the Pacer cadences and also contains a DVD with video clips to help teachers administer the FitnessGram assessments. The DVD features video clips showing all test protocols, including common errors and corrections. It includes reproducible forms, charts, certificates and reports needed to conduct the tests, record the results, and communicate to administrators, students, and parents. The manual introduces teachers to the program components and the mission, goals, and philosophy behind the program. It provides information on fitness education and assessment guidelines, and details the assessment process step-by-step. It also explores ways to promote physical education. The manual focuses on various aspects of FitnessGram® and takes teachers through test administrations issues, including safety guidelines, considerations for special populations, and administration to primary grades. It provides tests for aerobic capacity, explains how to determine body composition through several methods, and shows how to test for muscular strength, endurance, and flexibility. It also answers questions related to FitnessGram® and guides teachers in interpreting results. There is also a section that provides an assessment model for ActivityGram® that outlines administration of the program and how to interpret results in order to provide feedback to students. Appendixes provide guidelines on where to find testing equipment and how to use it, answers to frequently asked questions, and health-related fitness charts and copy masters of forms and reports.
Fitnessgram® Healthy Fitness Zone Standards Frequently Asked Questions
Redefined Fitnessgram criterion-referenced standards (the Healthy Fitness Zone standards) for body composition and aerobic capacity have been developed. You should begin using these new standards for the 2010-2011 school year. Answers to frequently asked questions regarding the new standards can be viewed at: http://www.fitnessgram.net/newstandards/
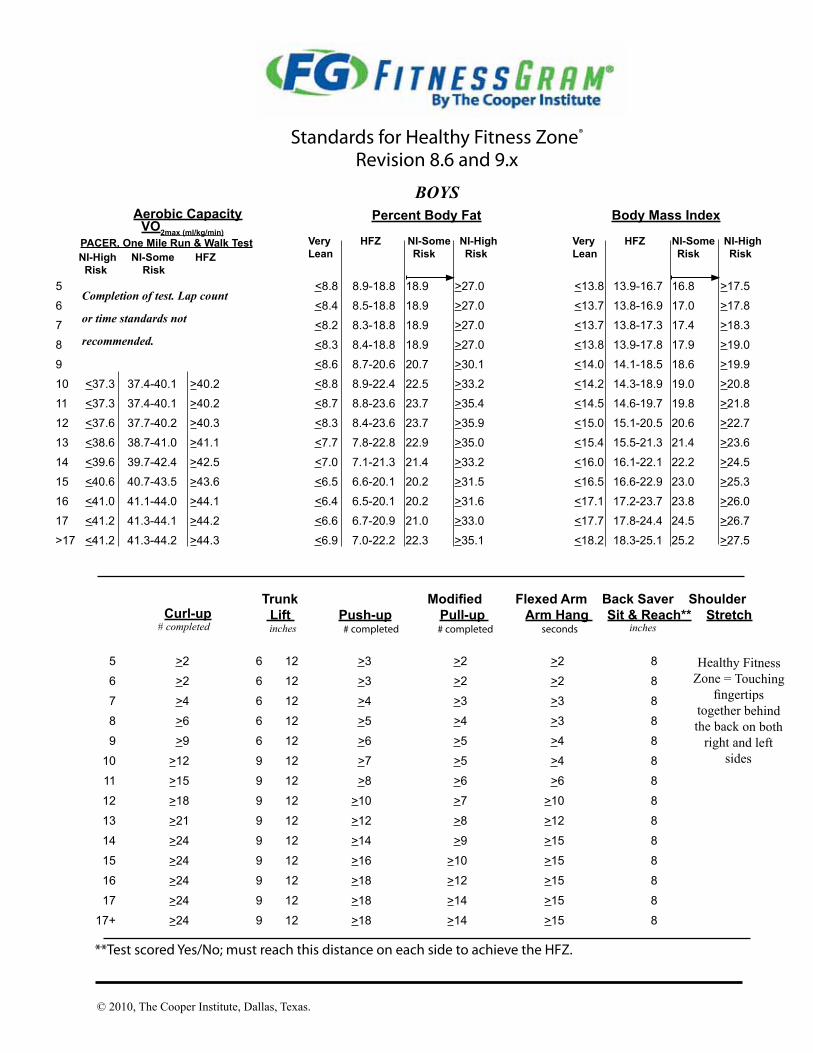
Standards for Healthy Fitness Zone®
Revision 8.6 and 9.x
BOYS
5 <8.8 8.9-18.8 18.9 >27.0 <13.8 13.9-16.7 16.8 >17.5
6 <8.4 8.5-18.8 18.9 >27.0 <13.7 13.8-16.9 17.0 >17.8
7 <8.2 8.3-18.8 18.9 >27.0 <13.7 13.8-17.3 17.4 >18.3
8 <8.3 8.4-18.8 18.9 >27.0 <13.8 13.9-17.8 17.9 >19.0
9 <8.6 8.7-20.6 20.7 >30.1 <14.0 14.1-18.5 18.6 >19.9
10 <37.3 37.4-40.1 >40.2 <8.8 8.9-22.4 22.5 >33.2 <14.2 14.3-18.9 19.0 >20.8
11 <37.3 37.4-40.1 >40.2 <8.7 8.8-23.6 23.7 >35.4 <14.5 14.6-19.7 19.8 >21.8
12 <37.6 37.7-40.2 >40.3 <8.3 8.4-23.6 23.7 >35.9 <15.0 15.1-20.5 20.6 >22.7
13 <38.6 38.7-41.0 >41.1 <7.7 7.8-22.8 22.9 >35.0 <15.4 15.5-21.3 21.4 >23.6
14 <39.6 39.7-42.4 >42.5 <7.0 7.1-21.3 21.4 >33.2 <16.0 16.1-22.1 22.2 >24.5
15 <40.6 40.7-43.5 >43.6 <6.5 6.6-20.1 20.2 >31.5 <16.5 16.6-22.9 23.0 >25.3
16 <41.0 41.1-44.0 >44.1 <6.4 6.5-20.1 20.2 >31.6 <17.1 17.2-23.7 23.8 >26.0
17 <41.2 41.3-44.1 >44.2 <6.6 6.7-20.9 21.0 >33.0 <17.7 17.8-24.4 24.5 >26.7
>17 <41.2 41.3-44.2 >44.3 <6.9 7.0-22.2 22.3 >35.1 <18.2 18.3-25.1 25.2 >27.5
**Test scored Yes/No; must reach this distance on each side to achieve the HFZ.
Trunk Modified Flexed Arm Back Saver Shoulder Lift Push-up Pull-up Arm Hang Sit & Reach** Stretch
inches # completed# completed seconds inches
© 2010, The Cooper Institute, Dallas, Texas.
5 >2 6 12 >3 >2 >2 8
6 >2 6 12 >3 >2 >2 8
7 >4 6 12 >4 >3 >3 8
8 >6 6 12 >5 >4 >3 8
9 >9 6 12 >6 >5 >4 8
10 >12 9 12 >7 >5 >4 8
11 >15 9 12 >8 >6 >6 8
12 >18 9 12 >10 >7 >10 8
13 >21 9 12 >12 >8 >12 8
14 >24 9 12 >14 >9 >15 8
15 >24 9 12 >16 >10 >15 8
16 >24 9 12 >18 >12 >15 8
17 >24 9 12 >18 >14 >15 8
17+ >24 9 12 >18 >14 >15 8
Body Mass IndexPercent Body FatVO2max (ml/kg/min)
Healthy Fitness Zone = Touching
fingertipstogether behind the back on both
right and left sides
# completedCurl-up
Aerobic Capacity
PACER, One Mile Run & Walk TestNI-High NI-Some HFZ Risk Risk
Very HFZ NI-Some NI-High Lean Risk Risk
Very HFZ NI-Some NI-High Lean Risk Risk
Completion of test. Lap count
or time standards not
recommended.
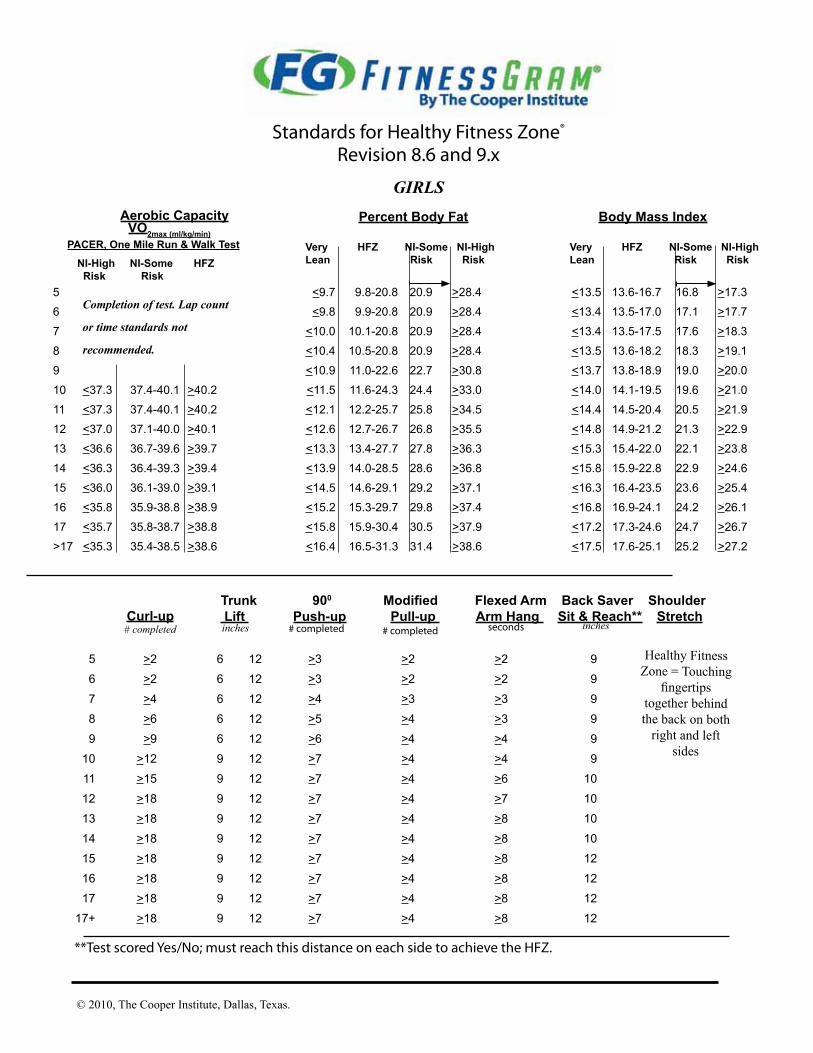
Standards for Healthy Fitness Zone®
Revision 8.6 and 9.x
GIRLS
**Test scored Yes/No; must reach this distance on each side to achieve the HFZ.
Trunk 900 Modified Flexed Arm Back Saver Shoulder Lift Push-up Pull-up Arm Hang Sit & Reach** Stretch
inches # completed # completed seconds inches
© 2010, The Cooper Institute, Dallas, Texas.
5 >2 6 12 >3 >2 >2 9
6 >2 6 12 >3 >2 >2 9
7 >4 6 12 >4 >3 >3 9
8 >6 6 12 >5 >4 >3 9
9 >9 6 12 >6 >4 >4 9
10 >12 9 12 >7 >4 >4 9
11 >15 9 12 >7 >4 >6 10
12 >18 9 12 >7 >4 >7 10
13 >18 9 12 >7 >4 >8 10
14 >18 9 12 >7 >4 >8 10
15 >18 9 12 >7 >4 >8 12
16 >18 9 12 >7 >4 >8 12
17 >18 9 12 >7 >4 >8 12
17+ >18 9 12 >7 >4 >8 12
Healthy Fitness Zone = Touching
fingertipstogether behind the back on both
right and left sides
# completedCurl-up
Body Mass IndexPercent Body FatVO2max (ml/kg/min)
Aerobic Capacity
PACER, One Mile Run & Walk Test
5 <9.7 9.8-20.8 20.9 >28.4 <13.5 13.6-16.7 16.8 >17.3
6 <9.8 9.9-20.8 20.9 >28.4 <13.4 13.5-17.0 17.1 >17.7
7 <10.0 10.1-20.8 20.9 >28.4 <13.4 13.5-17.5 17.6 >18.3
8 <10.4 10.5-20.8 20.9 >28.4 <13.5 13.6-18.2 18.3 >19.1
9 <10.9 11.0-22.6 22.7 >30.8 <13.7 13.8-18.9 19.0 >20.0
10 <37.3 37.4-40.1 >40.2 <11.5 11.6-24.3 24.4 >33.0 <14.0 14.1-19.5 19.6 >21.0
11 <37.3 37.4-40.1 >40.2 <12.1 12.2-25.7 25.8 >34.5 <14.4 14.5-20.4 20.5 >21.9
12 <37.0 37.1-40.0 >40.1 <12.6 12.7-26.7 26.8 >35.5 <14.8 14.9-21.2 21.3 >22.9
13 <36.6 36.7-39.6 >39.7 <13.3 13.4-27.7 27.8 >36.3 <15.3 15.4-22.0 22.1 >23.8
14 <36.3 36.4-39.3 >39.4 <13.9 14.0-28.5 28.6 >36.8 <15.8 15.9-22.8 22.9 >24.6
15 <36.0 36.1-39.0 >39.1 <14.5 14.6-29.1 29.2 >37.1 <16.3 16.4-23.5 23.6 >25.4
16 <35.8 35.9-38.8 >38.9 <15.2 15.3-29.7 29.8 >37.4 <16.8 16.9-24.1 24.2 >26.1
17 <35.7 35.8-38.7 >38.8 <15.8 15.9-30.4 30.5 >37.9 <17.2 17.3-24.6 24.7 >26.7
>17 <35.3 35.4-38.5 >38.6 <16.4 16.5-31.3 31.4 >38.6 <17.5 17.6-25.1 25.2 >27.2
NI-High NI-Some HFZ Risk Risk
Very HFZ NI-Some NI-High Lean Risk Risk
Very HFZ NI-Some NI-High Lean Risk Risk
Completion of test. Lap count
or time standards not
recommended.
NewFITNESSGRAM ®
Healthy Fitness Zone®
Standards

Scientific Advisors
Charles B. Corbin, Ph.D.Kirk J. Cureton, Ph.D.Scott Going, Ph.D.Dolly Lambdin, Ed.D.Matthew T. Mahar, Ed.D.James R. Morrow, Jr., Ph.D.Robert P. Pangrazi, Ph.D.Russell R. Pate, Ph.D.
Sharon A. Plowman, Ph.D.Jodi Prochaska, Ph.D.Georgi Roberts, M.S.Weimo Zhu, Ph.D.
StaffCharles L. Sterling, Ed.D.Marilu D. Meredith, Ed.D.Gregory J. Welk, Ph.D.
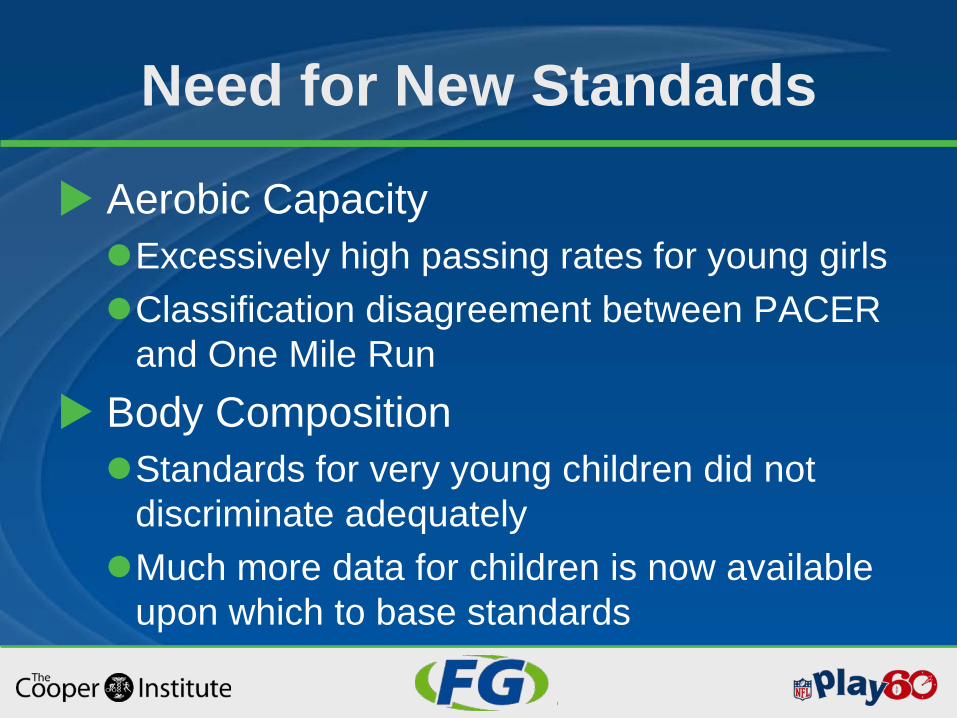
Need for New Standards
Aerobic CapacityExcessively high passing rates for young girlsClassification disagreement between PACER
and One Mile Run Body CompositionStandards for very young children did not
discriminate adequatelyMuch more data for children is now available
upon which to base standards
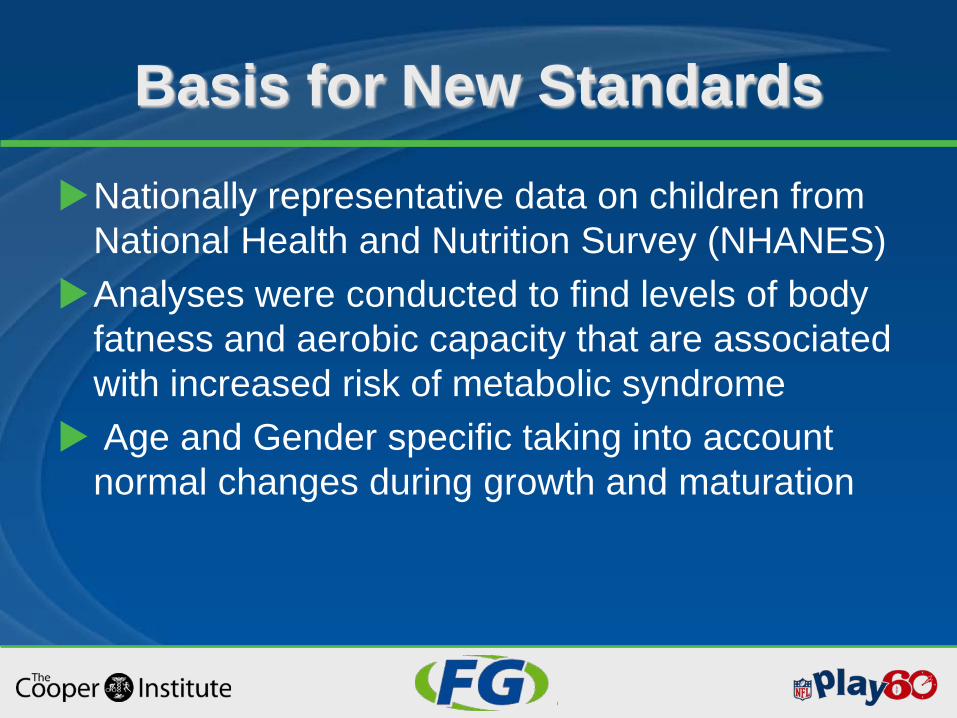
Basis for New Standards
Nationally representative data on children from National Health and Nutrition Survey (NHANES)
Analyses were conducted to find levels of body fatness and aerobic capacity that are associated with increased risk of metabolic syndrome
Age and Gender specific taking into account normal changes during growth and maturation
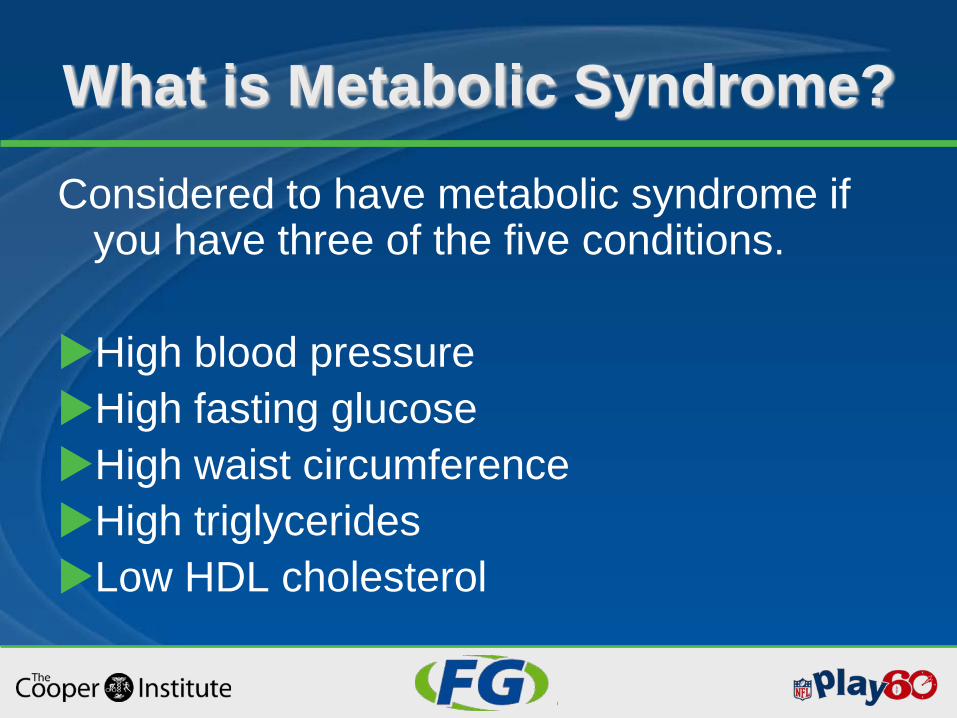
What is Metabolic Syndrome?
Considered to have metabolic syndrome if you have three of the five conditions.
High blood pressureHigh fasting glucoseHigh waist circumferenceHigh triglyceridesLow HDL cholesterol
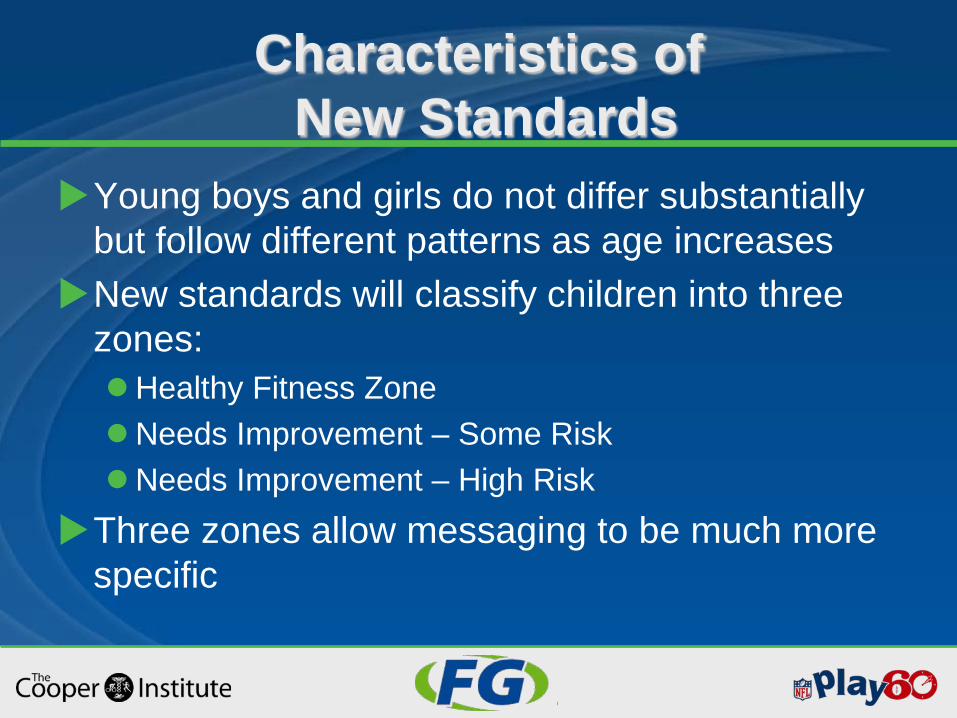
Characteristics ofNew Standards
Young boys and girls do not differ substantially but follow different patterns as age increases
New standards will classify children into three zones:Healthy Fitness ZoneNeeds Improvement – Some RiskNeeds Improvement – High Risk
Three zones allow messaging to be much more specific
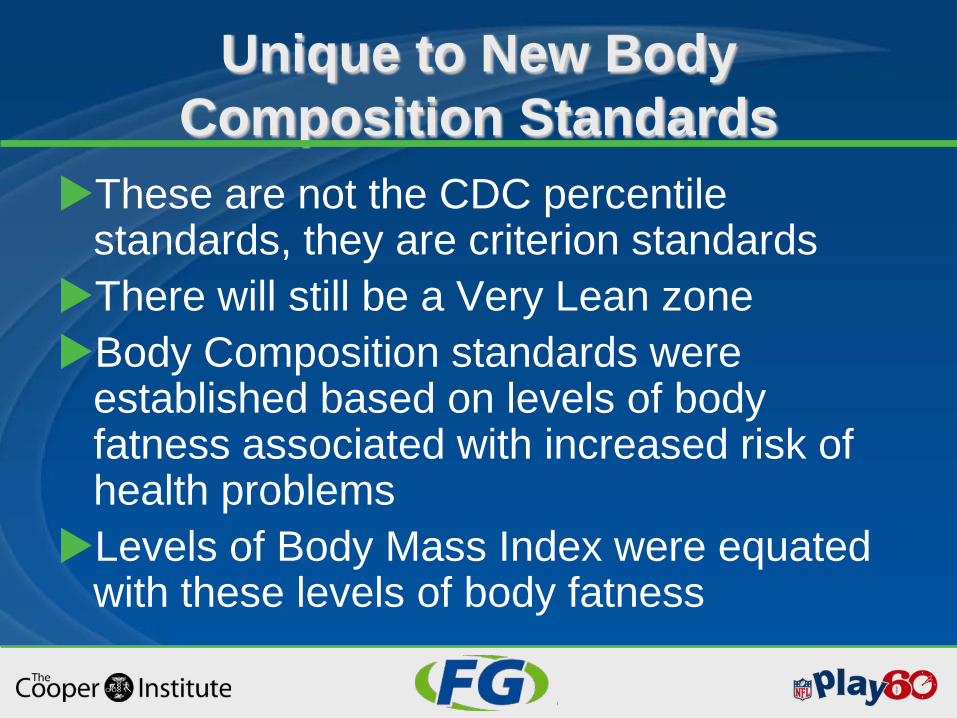
Unique to New Body Composition Standards
These are not the CDC percentile standards, they are criterion standards
There will still be a Very Lean zoneBody Composition standards were
established based on levels of body fatness associated with increased risk of health problems
Levels of Body Mass Index were equated with these levels of body fatness
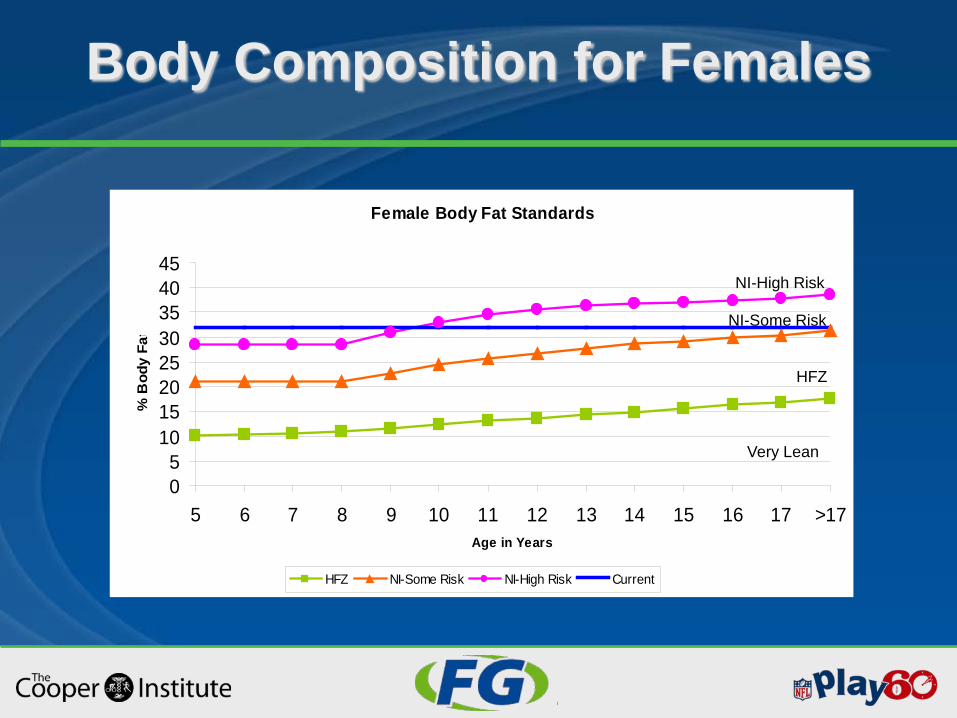
Body Composition for Females
Female Body Fat Standards
05
1015202530354045
5 6 7 8 9 10 11 12 13 14 15 16 17 >17Age in Years
% B
ody
Fat
HFZ NI-Some Risk NI-High Risk Current
HFZ
NI-Some Risk
NI-High Risk
Very Lean
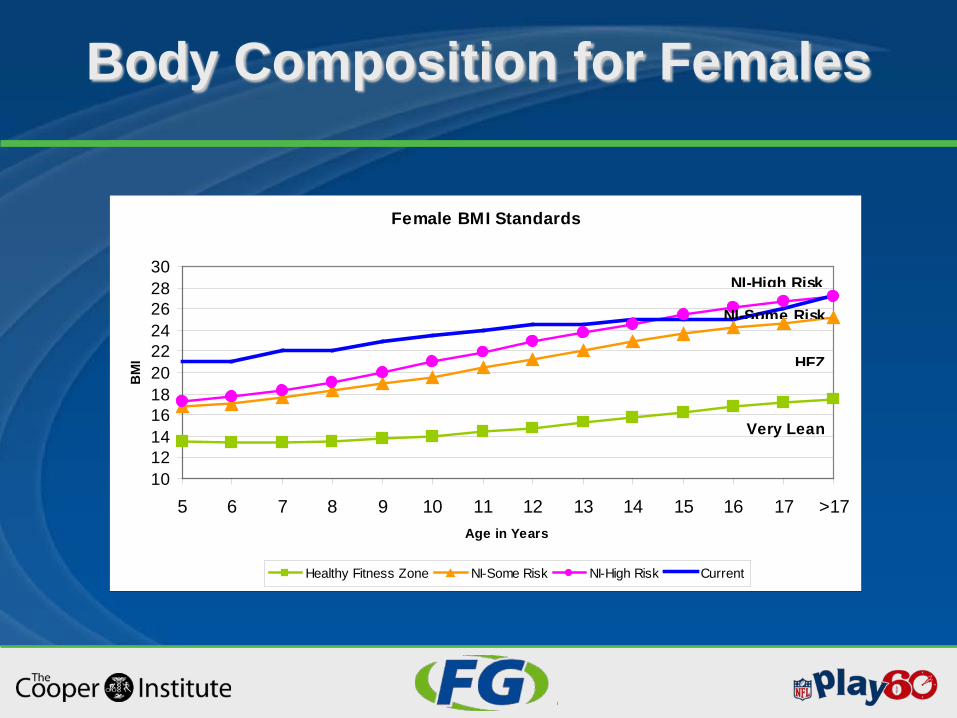
Body Composition for Females
Female BMI Standards
1012141618202224262830
5 6 7 8 9 10 11 12 13 14 15 16 17 >17Age in Years
BM
I
Healthy Fitness Zone NI-Some Risk NI-High Risk Current
HFZ
NI-High Risk
NI-Some Risk
Very Lean
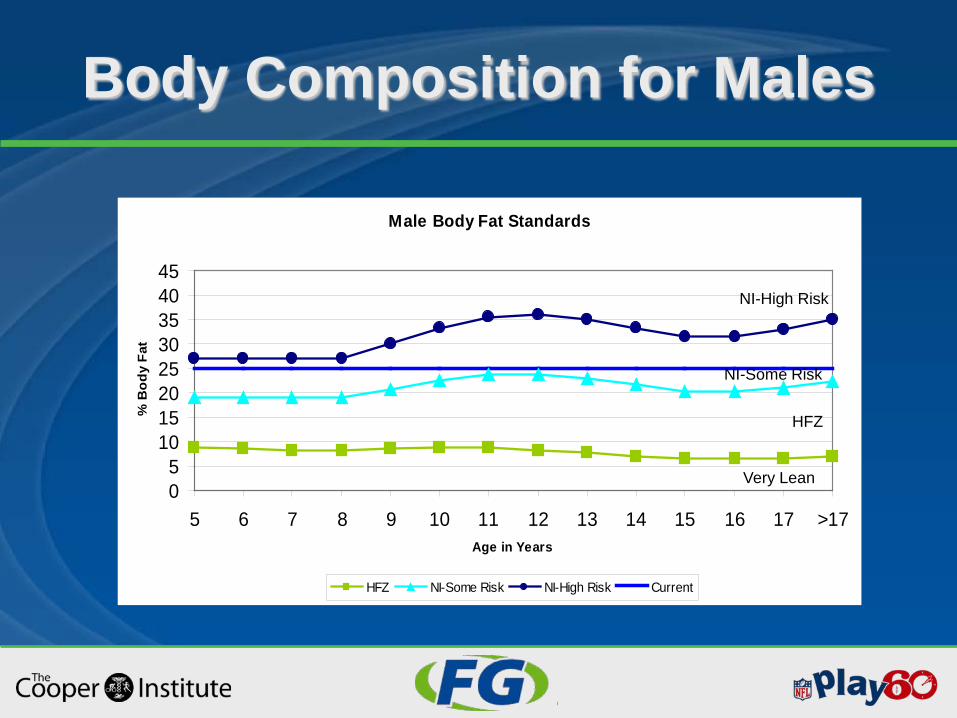
Body Composition for Males
Male Body Fat Standards
05
1015202530354045
5 6 7 8 9 10 11 12 13 14 15 16 17 >17Age in Years
% B
ody
Fat
HFZ NI-Some Risk NI-High Risk Current
HFZ
NI-High Risk
Very Lean
NI-Some Risk
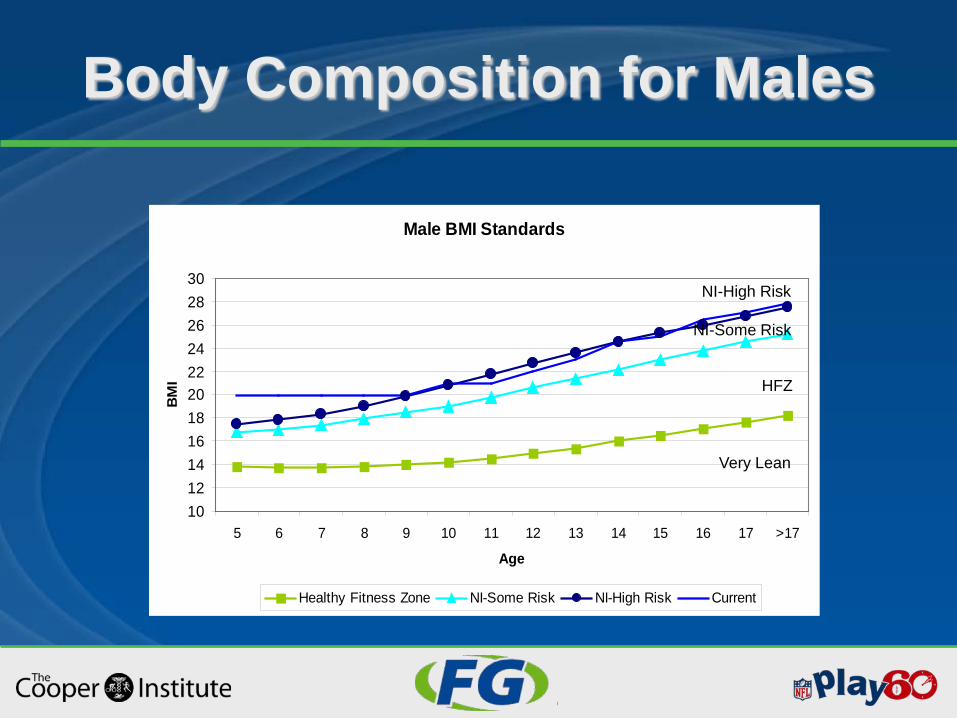
Body Composition for Males
Male BMI Standards
1012141618202224262830
5 6 7 8 9 10 11 12 13 14 15 16 17 >17
Age
BM
I
Healthy Fitness Zone NI-Some Risk NI-High Risk Current
NI-High Risk
NI-Some Risk
HFZ
Very Lean
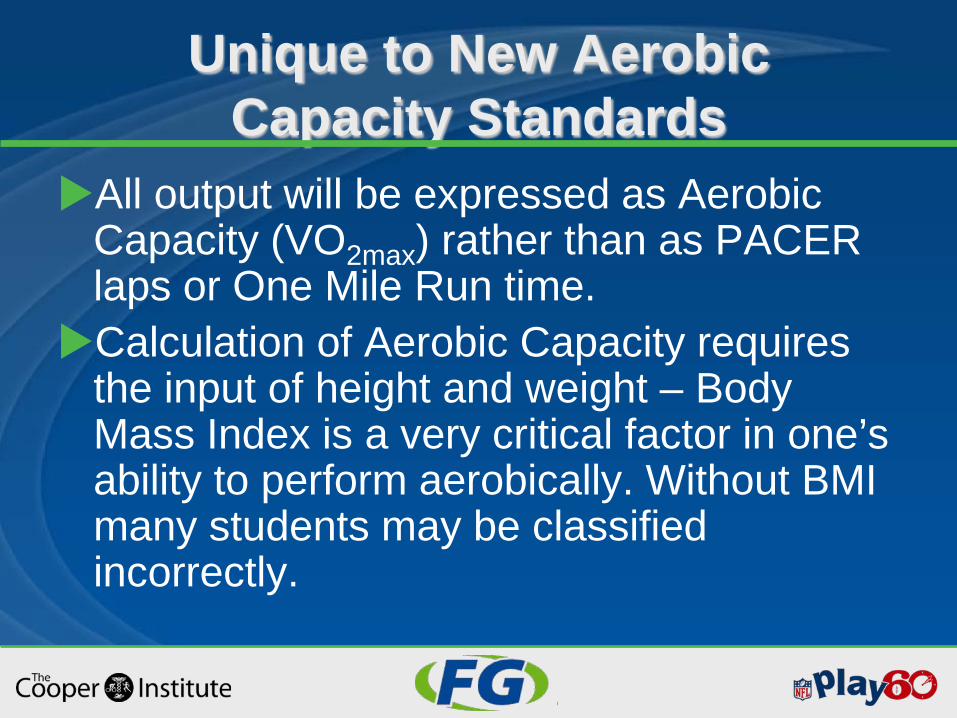
Unique to New Aerobic Capacity Standards
All output will be expressed as Aerobic Capacity (VO2max) rather than as PACER laps or One Mile Run time.
Calculation of Aerobic Capacity requires the input of height and weight – Body Mass Index is a very critical factor in one’s ability to perform aerobically. Without BMI many students may be classified incorrectly.
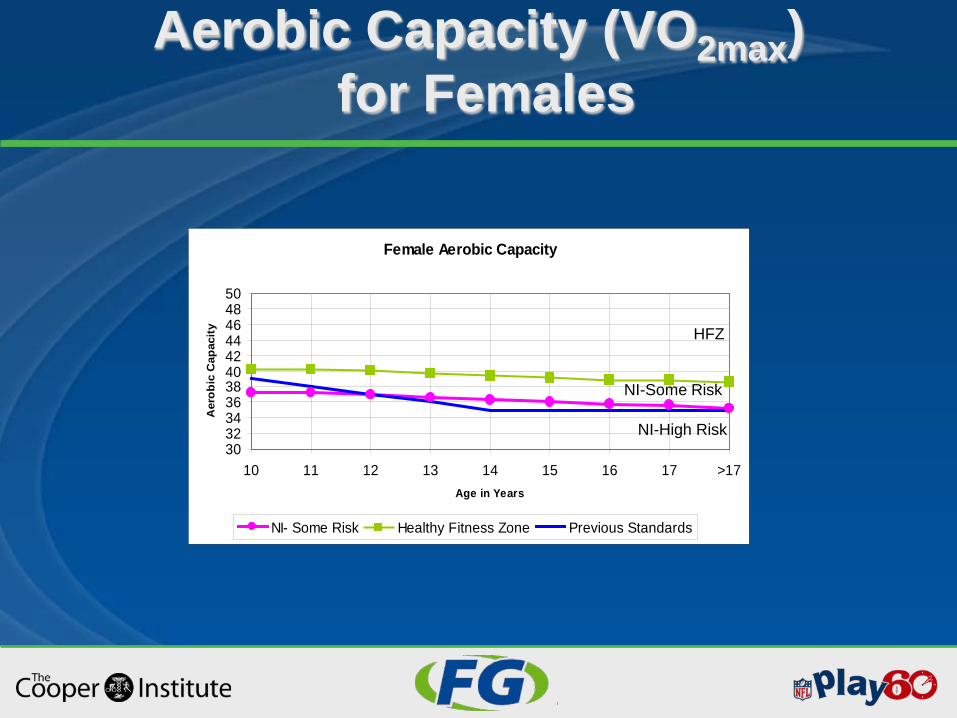
Aerobic Capacity (VO2max)for Females
Female Aerobic Capacity
3032343638404244464850
10 11 12 13 14 15 16 17 >17Age in Years
Aer
obic
Cap
acity
NI- Some Risk Healthy Fitness Zone Previous Standards
HFZ
NI-High Risk
NI-Some Risk
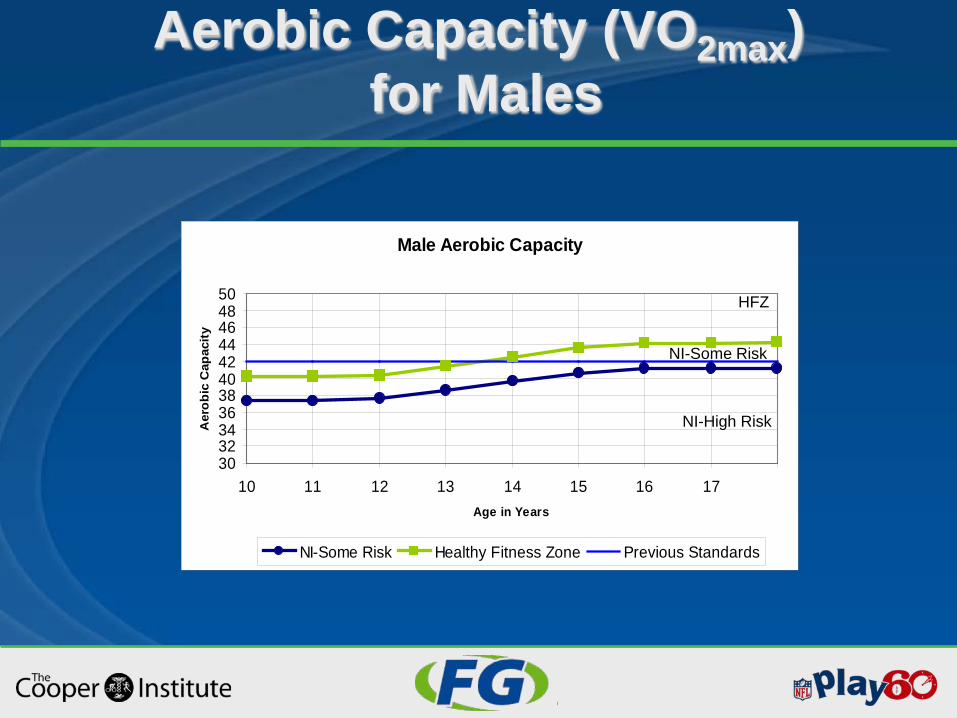
Aerobic Capacity (VO2max) for Males
Male Aerobic Capacity
3032343638404244464850
10 11 12 13 14 15 16 17Age in Years
Aer
obic
Cap
acity
NI-Some Risk Healthy Fitness Zone Previous Standards
HFZ
NI-Some Risk
NI-High Risk
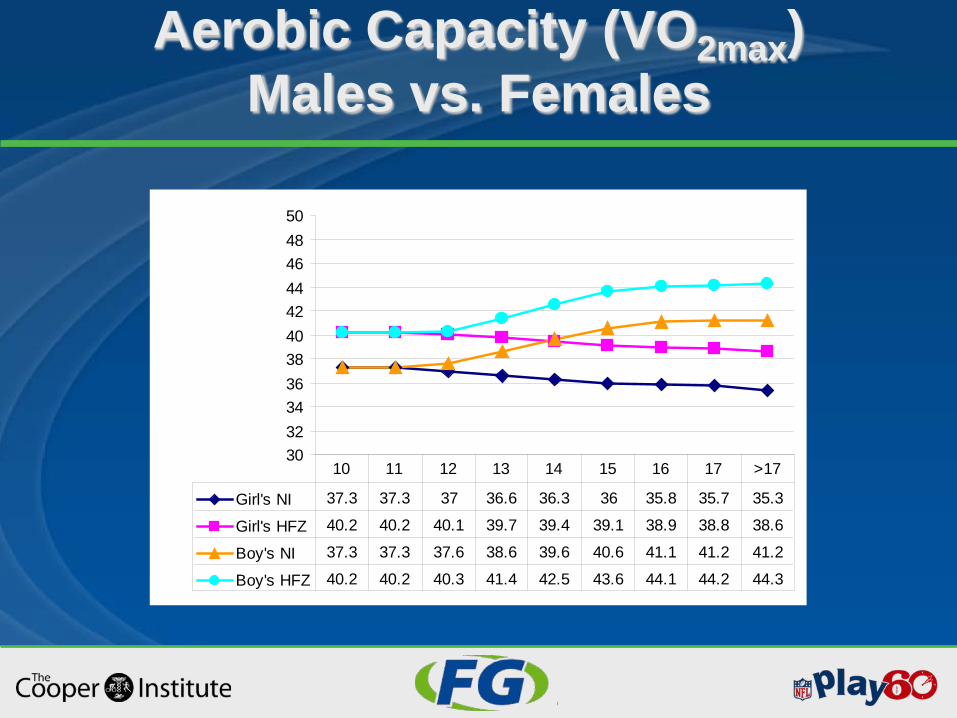
Aerobic Capacity (VO2max) Males vs. Females
3032343638404244464850
Girl's NI 37.3 37.3 37 36.6 36.3 36 35.8 35.7 35.3
Girl's HFZ 40.2 40.2 40.1 39.7 39.4 39.1 38.9 38.8 38.6
Boy's NI 37.3 37.3 37.6 38.6 39.6 40.6 41.1 41.2 41.2
Boy's HFZ 40.2 40.2 40.3 41.4 42.5 43.6 44.1 44.2 44.3
10 11 12 13 14 15 16 17 >17
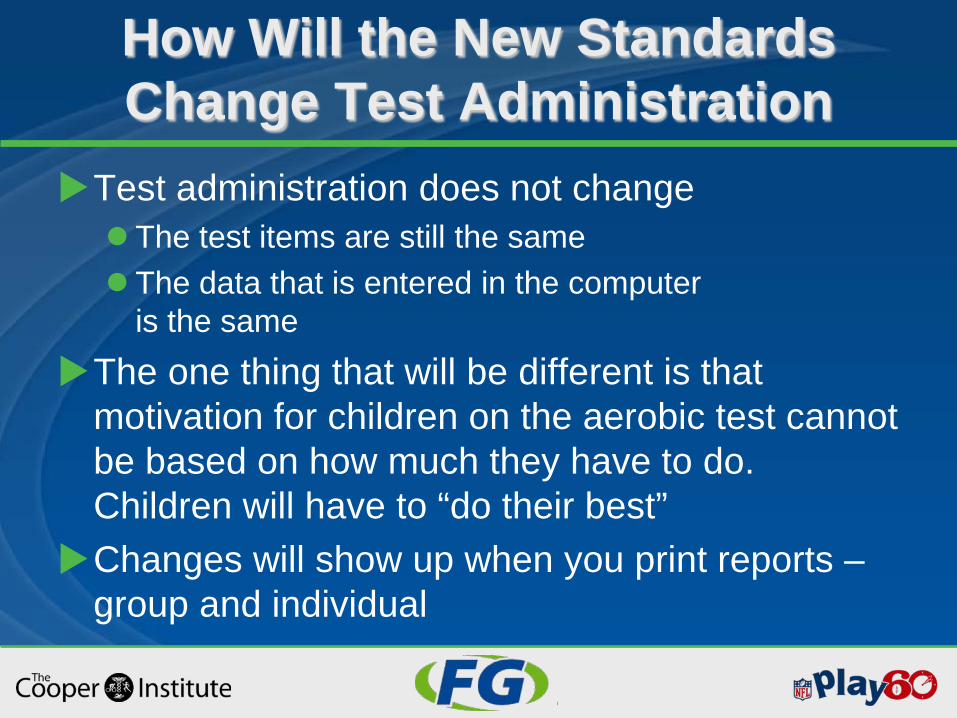
How Will the New Standards Change Test Administration
Test administration does not change The test items are still the same The data that is entered in the computer
is the sameThe one thing that will be different is that
motivation for children on the aerobic test cannot be based on how much they have to do. Children will have to “do their best”
Changes will show up when you print reports –group and individual
How Do I Get the New Standards
Posted at www.fitnessgram.netIn version 8.6 and 9.1 of the
FITNESSGRAM software