Embed Size (px)
Citation preview
Summary of FY 2016 State Employee Compensation & Benefits Report
Joint Legislative CEC Committee
David Fulkerson, Interim Administrator
Division of Human Resources
1
Base Pay & Salary Survey Analysis
Classified Employee Salary Information
Total Compensation
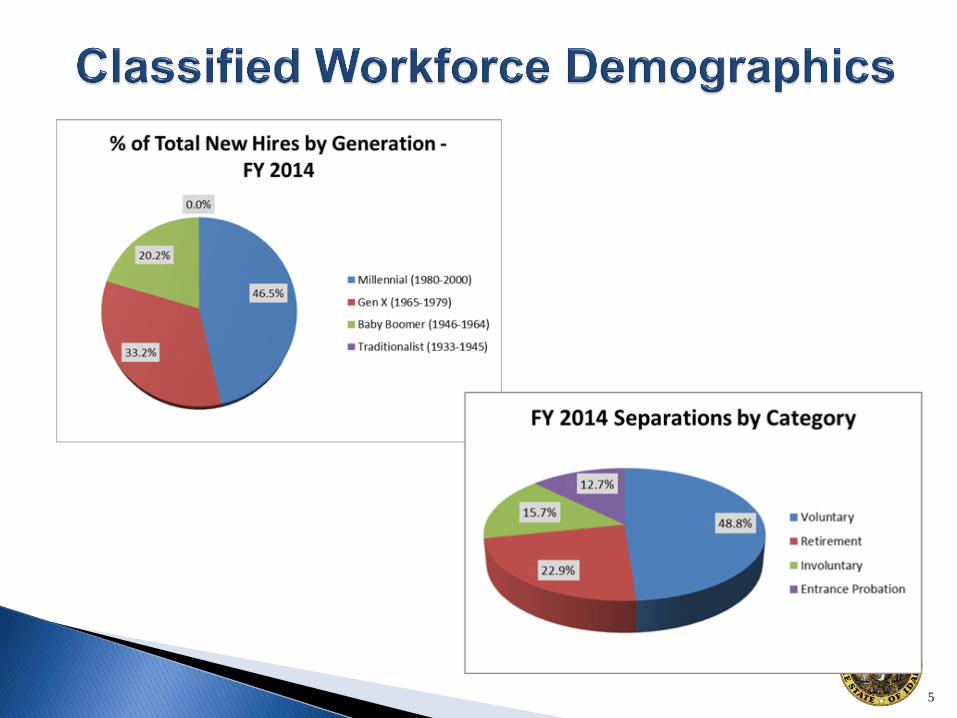
Classified Workforce Demographics
Retirement Forecasts
DHR Recommendation
Appendices
2
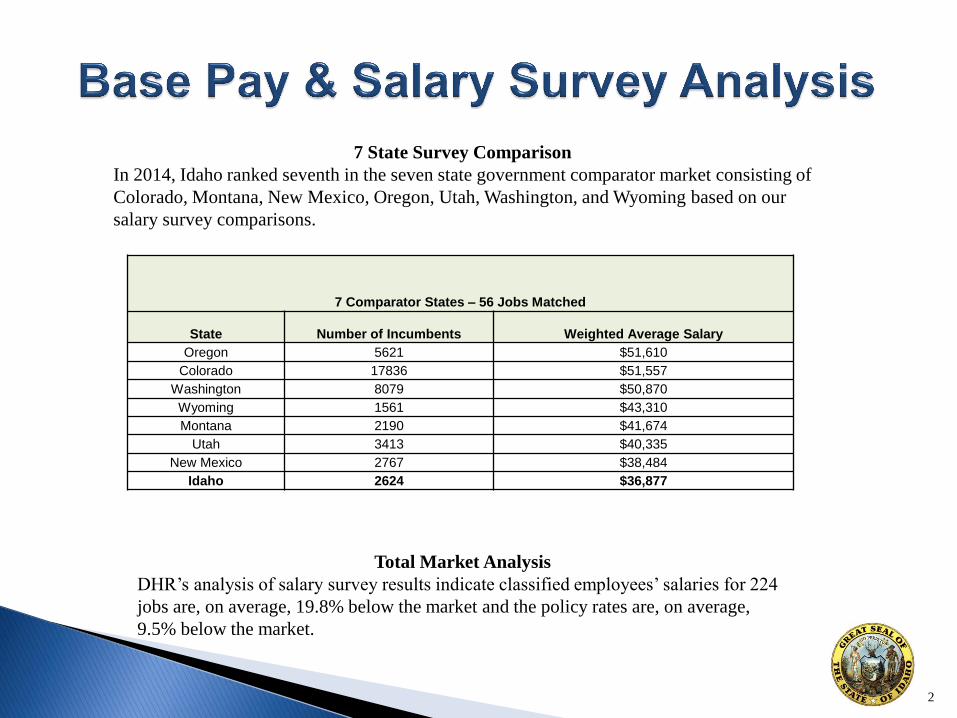
7 Comparator States – 56 Jobs Matched
State Number of Incumbents Weighted Average Salary
Oregon 5621 $51,610
Colorado 17836 $51,557
Washington 8079 $50,870
Wyoming 1561 $43,310
Montana 2190 $41,674
Utah 3413 $40,335
New Mexico 2767 $38,484
Idaho 2624 $36,877
7 State Survey Comparison
In 2014, Idaho ranked seventh in the seven state government comparator market consisting of
Colorado, Montana, New Mexico, Oregon, Utah, Washington, and Wyoming based on our
salary survey comparisons.
Total Market Analysis
DHR’s analysis of salary survey results indicate classified employees’ salaries for 224
jobs are, on average, 19.8% below the market and the policy rates are, on average,
9.5% below the market.
3
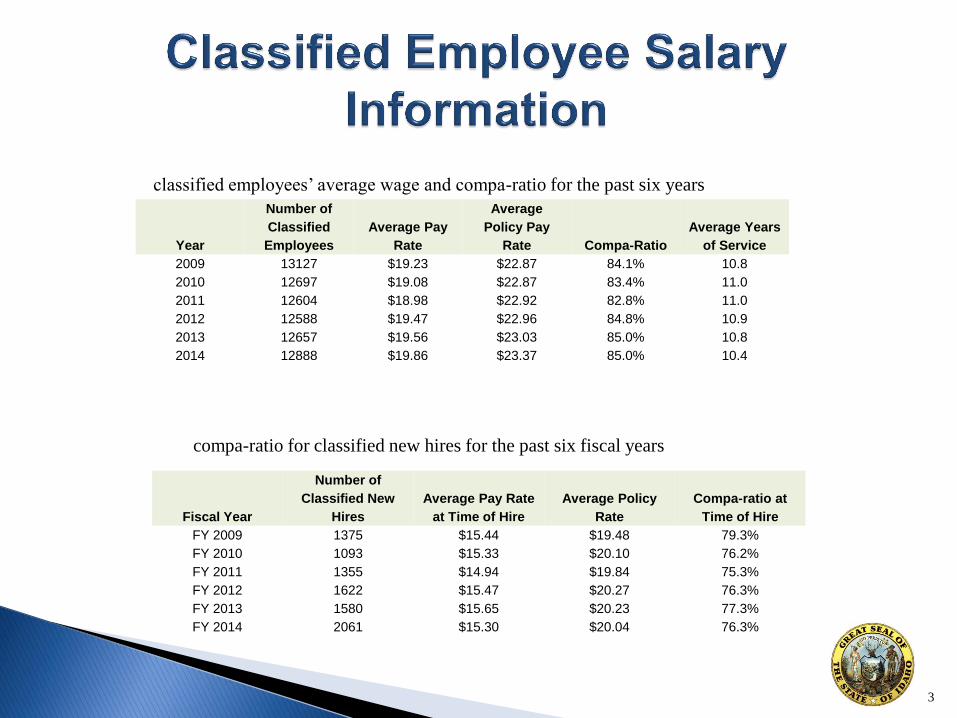
Year
Number of
Classified
Employees
Average Pay
Rate
Average
Policy Pay
Rate Compa-Ratio
Average Years
of Service
2009 13127 $19.23 $22.87 84.1% 10.8
2010 12697 $19.08 $22.87 83.4% 11.0
2011 12604 $18.98 $22.92 82.8% 11.0
2012 12588 $19.47 $22.96 84.8% 10.9
2013 12657 $19.56 $23.03 85.0% 10.8
2014 12888 $19.86 $23.37 85.0% 10.4
Fiscal Year
Number of
Classified New
Hires
Average Pay Rate
at Time of Hire
Average Policy
Rate
Compa-ratio at
Time of Hire
FY 2009 1375 $15.44 $19.48 79.3%
FY 2010 1093 $15.33 $20.10 76.2%
FY 2011 1355 $14.94 $19.84 75.3%
FY 2012 1622 $15.47 $20.27 76.3%
FY 2013 1580 $15.65 $20.23 77.3%
FY 2014 2061 $15.30 $20.04 76.3%
classified employees’ average wage and compa-ratio for the past six years
compa-ratio for classified new hires for the past six fiscal years
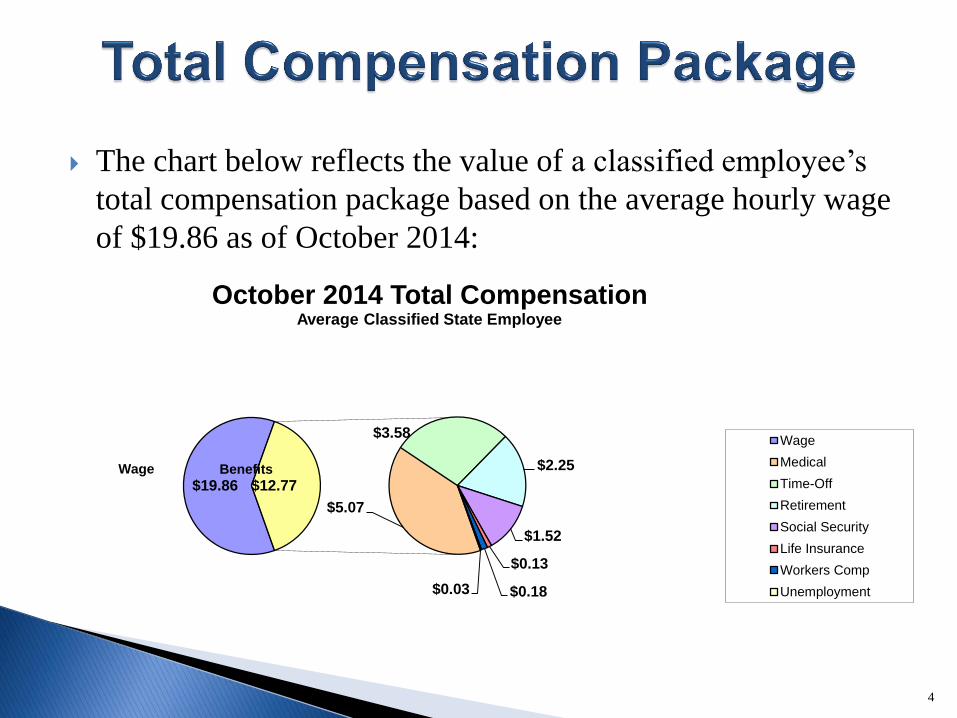
The chart below reflects the value of a classified employee’s
total compensation package based on the average hourly wage
of $19.86 as of October 2014:
4
$19.86
$5.07
$3.58
$2.25
$1.52
$0.13
$0.18 $0.03
$12.77
October 2014 Total Compensation Average Classified State Employee
Wage
Medical
Time-Off
Retirement
Social Security
Life Insurance
Workers Comp
Unemployment
Benefits Wage
5
6
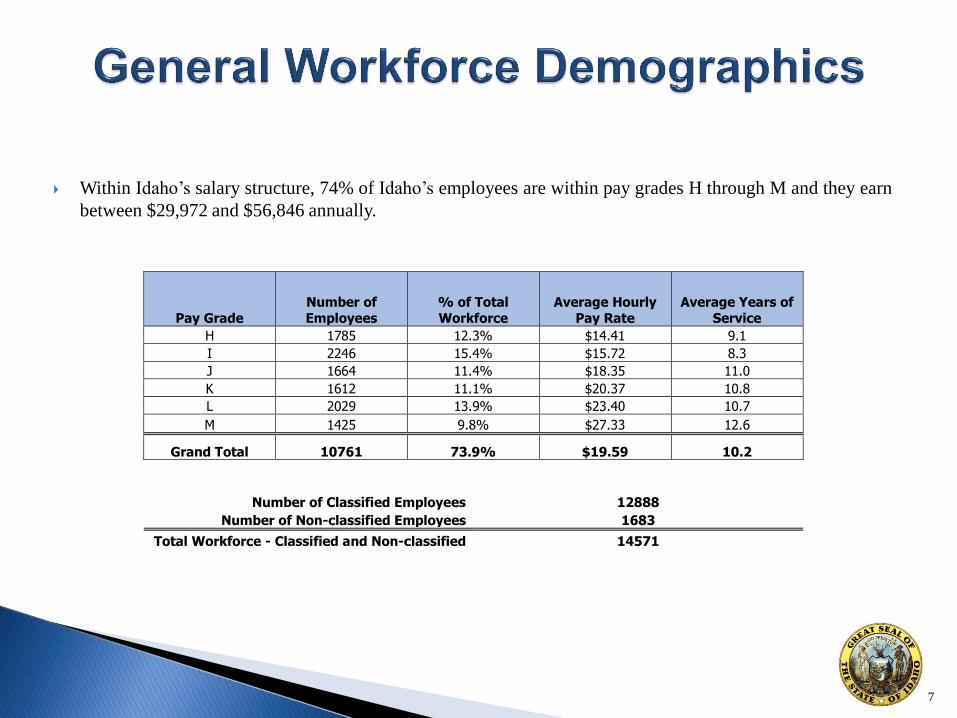
Within Idaho’s salary structure, 74% of Idaho’s employees are within pay grades H through M and they earn
between $29,972 and $56,846 annually.
7
Pay Grade
Number of
Employees
% of Total
Workforce
Average Hourly
Pay Rate
Average Years of
Service
H 1785 12.3% $14.41 9.1
I 2246 15.4% $15.72 8.3
J 1664 11.4% $18.35 11.0
K 1612 11.1% $20.37 10.8
L 2029 13.9% $23.40 10.7
M 1425 9.8% $27.33 12.6
Grand Total 10761 73.9% $19.59 10.2
Number of Classified Employees 12888
Number of Non-classified Employees 1683
Total Workforce - Classified and Non-classified 14571
8
Effective Date
Number of Employees
Eligible to Retire - Cumulative
% of Total Active State
PERSI Members
Number of Employees Eligible to
Retire Each Year
% of Total Active State PERSI
Members
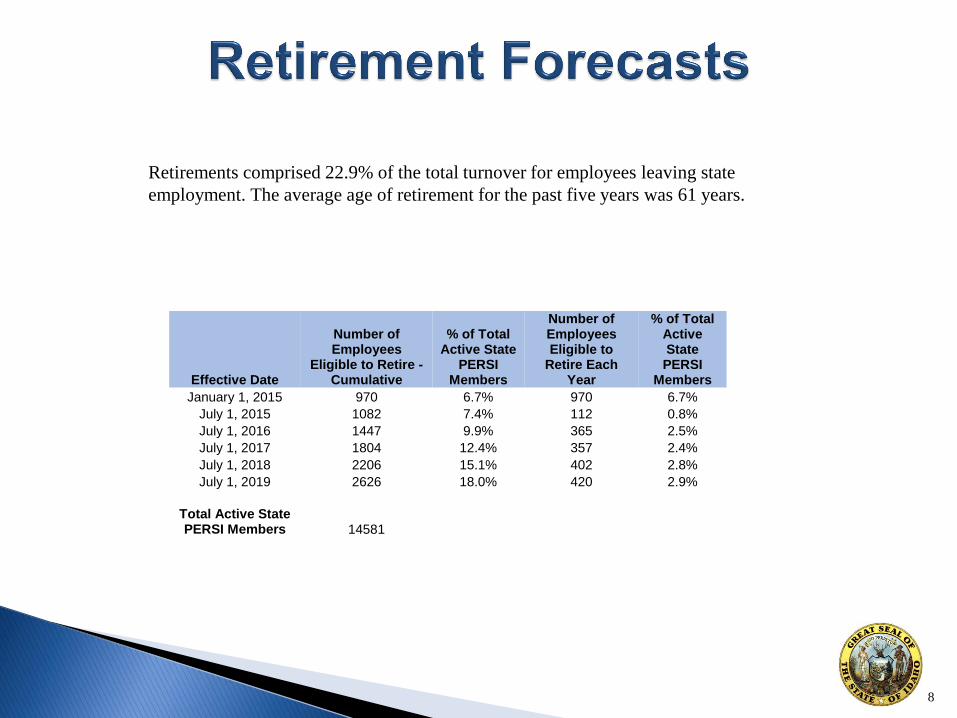
January 1, 2015 970 6.7% 970 6.7%
July 1, 2015 1082 7.4% 112 0.8%
July 1, 2016 1447 9.9% 365 2.5%
July 1, 2017 1804 12.4% 357 2.4%
July 1, 2018 2206 15.1% 402 2.8%
July 1, 2019 2626 18.0% 420 2.9%
Total Active State PERSI Members 14581
Retirements comprised 22.9% of the total turnover for employees leaving state
employment. The average age of retirement for the past five years was 61 years.
9
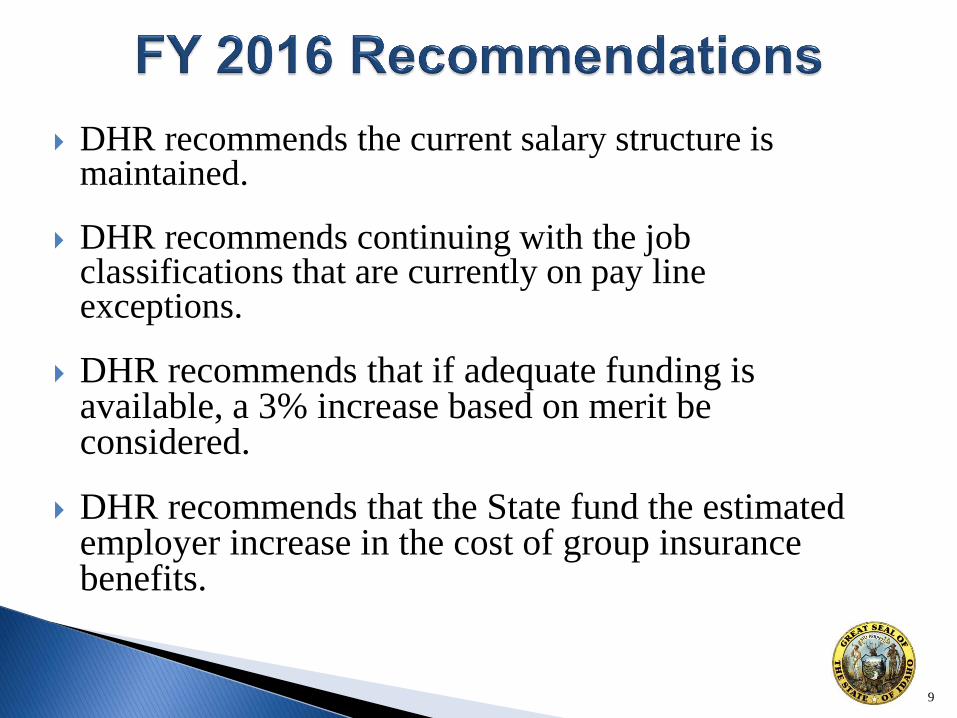
DHR recommends the current salary structure is maintained.
DHR recommends continuing with the job classifications that are currently on pay line exceptions.
DHR recommends that if adequate funding is available, a 3% increase based on merit be considered.
DHR recommends that the State fund the estimated employer increase in the cost of group insurance benefits.
10
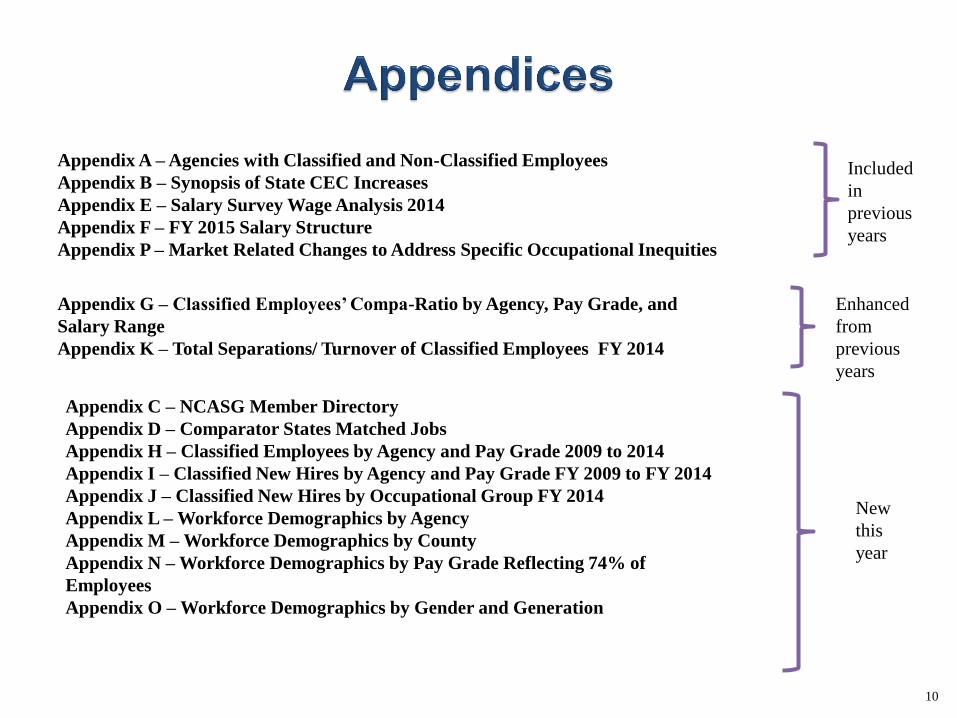
Appendix A – Agencies with Classified and Non-Classified Employees
Appendix B – Synopsis of State CEC Increases
Appendix E – Salary Survey Wage Analysis 2014
Appendix F – FY 2015 Salary Structure
Appendix P – Market Related Changes to Address Specific Occupational Inequities
Included
in
previous
years
Appendix G – Classified Employees’ Compa-Ratio by Agency, Pay Grade, and
Salary Range
Appendix K – Total Separations/ Turnover of Classified Employees FY 2014
Enhanced
from
previous
years
Appendix C – NCASG Member Directory
Appendix D – Comparator States Matched Jobs
Appendix H – Classified Employees by Agency and Pay Grade 2009 to 2014
Appendix I – Classified New Hires by Agency and Pay Grade FY 2009 to FY 2014
Appendix J – Classified New Hires by Occupational Group FY 2014
Appendix L – Workforce Demographics by Agency
Appendix M – Workforce Demographics by County
Appendix N – Workforce Demographics by Pay Grade Reflecting 74% of
Employees
Appendix O – Workforce Demographics by Gender and Generation
New
this
year
11
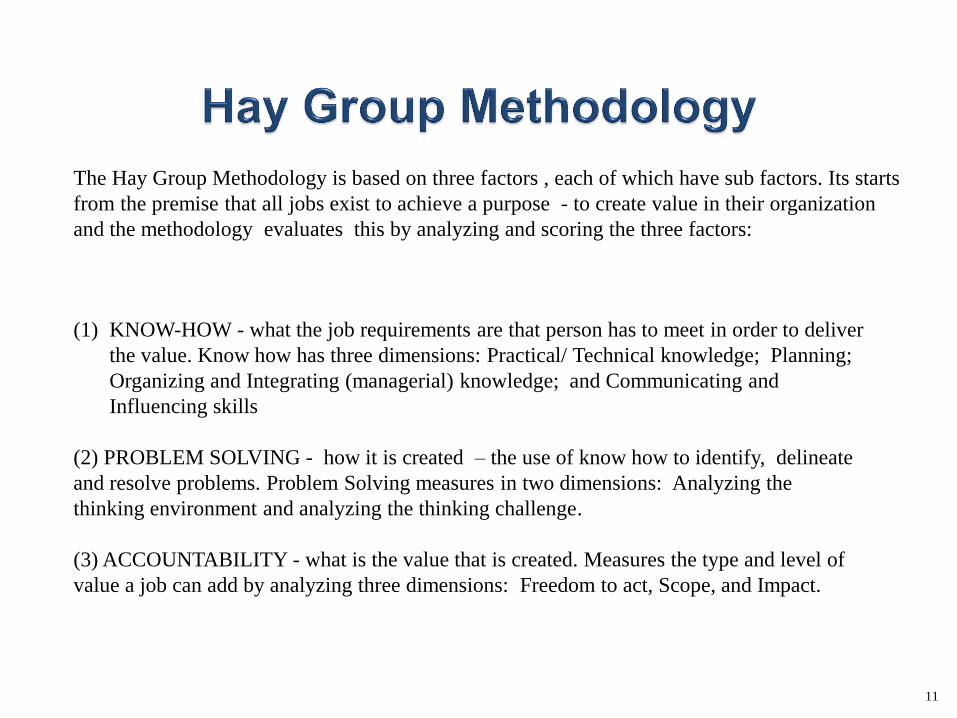
The Hay Group Methodology is based on three factors , each of which have sub factors. Its starts
from the premise that all jobs exist to achieve a purpose - to create value in their organization
and the methodology evaluates this by analyzing and scoring the three factors:
(1) KNOW-HOW - what the job requirements are that person has to meet in order to deliver
the value. Know how has three dimensions: Practical/ Technical knowledge; Planning;
Organizing and Integrating (managerial) knowledge; and Communicating and
Influencing skills
(2) PROBLEM SOLVING - how it is created – the use of know how to identify, delineate
and resolve problems. Problem Solving measures in two dimensions: Analyzing the
thinking environment and analyzing the thinking challenge.
(3) ACCOUNTABILITY - what is the value that is created. Measures the type and level of
value a job can add by analyzing three dimensions: Freedom to act, Scope, and Impact.