Embed Size (px)
Citation preview
Summary of FY 2017 State Employee
Compensation & Benefits Report
Joint Legislative CEC Committee
David Fulkerson, Interim Administrator Division of Human Resources
Pages 4 – 14 Summary Information National Data Salary survey results Salary structure Total compensation Workforce demographics Turnover data Exit survey results Retirement forecast
Page 15 DHR Recommendations
Page 16 Appendices
CPI -UID CEC Increases
National Increase
-2.0%
-1.0%
0.0%
1.0%
2.0%
3.0%
4.0%
5.0%
FY2003 FY2004 FY2005 FY2006 FY2007 FY2008 FY2009 FY2010 FY2011 FY2012 FY2013 FY2014
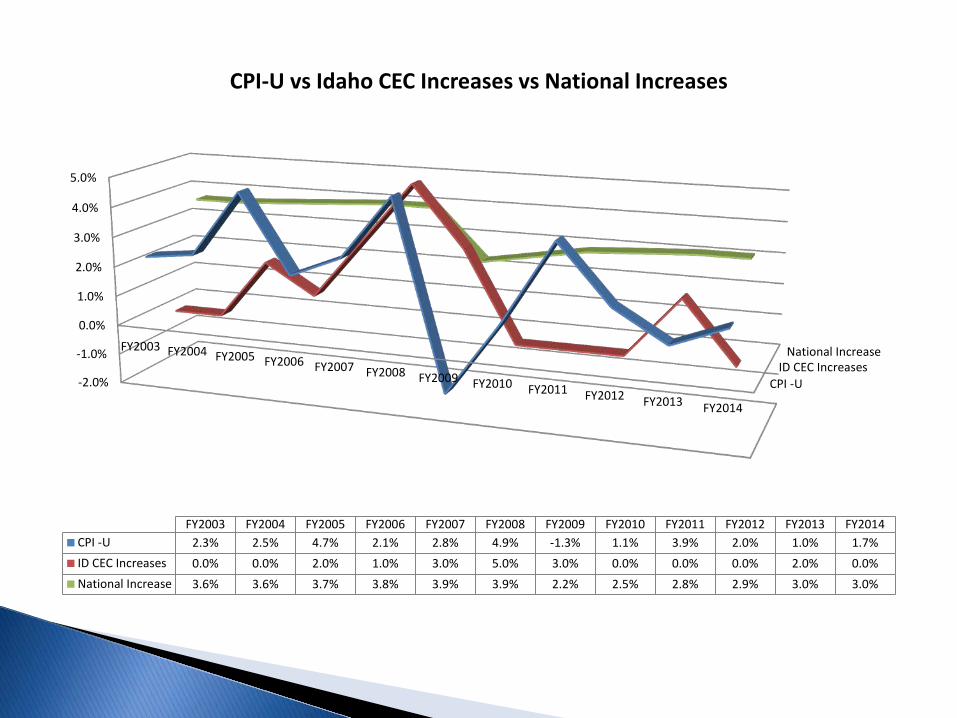
FY2003 FY2004 FY2005 FY2006 FY2007 FY2008 FY2009 FY2010 FY2011 FY2012 FY2013 FY2014CPI -U 2.3% 2.5% 4.7% 2.1% 2.8% 4.9% -1.3% 1.1% 3.9% 2.0% 1.0% 1.7%ID CEC Increases 0.0% 0.0% 2.0% 1.0% 3.0% 5.0% 3.0% 0.0% 0.0% 0.0% 2.0% 0.0%National Increase 3.6% 3.6% 3.7% 3.8% 3.9% 3.9% 2.2% 2.5% 2.8% 2.9% 3.0% 3.0%
CPI-U vs Idaho CEC Increases vs National Increases
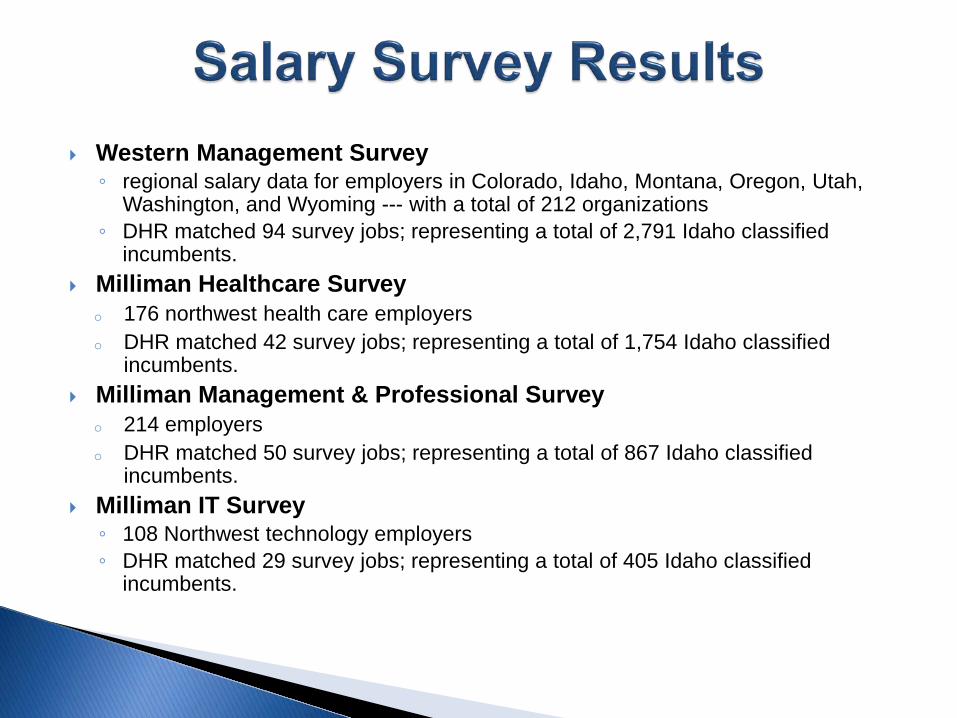
Western Management Survey ◦ regional salary data for employers in Colorado, Idaho, Montana, Oregon, Utah,
Washington, and Wyoming --- with a total of 212 organizations ◦ DHR matched 94 survey jobs; representing a total of 2,791 Idaho classified
incumbents. Milliman Healthcare Survey
o 176 northwest health care employers o DHR matched 42 survey jobs; representing a total of 1,754 Idaho classified
incumbents. Milliman Management & Professional Survey
o 214 employers o DHR matched 50 survey jobs; representing a total of 867 Idaho classified
incumbents. Milliman IT Survey ◦ 108 Northwest technology employers ◦ DHR matched 29 survey jobs; representing a total of 405 Idaho classified
incumbents.
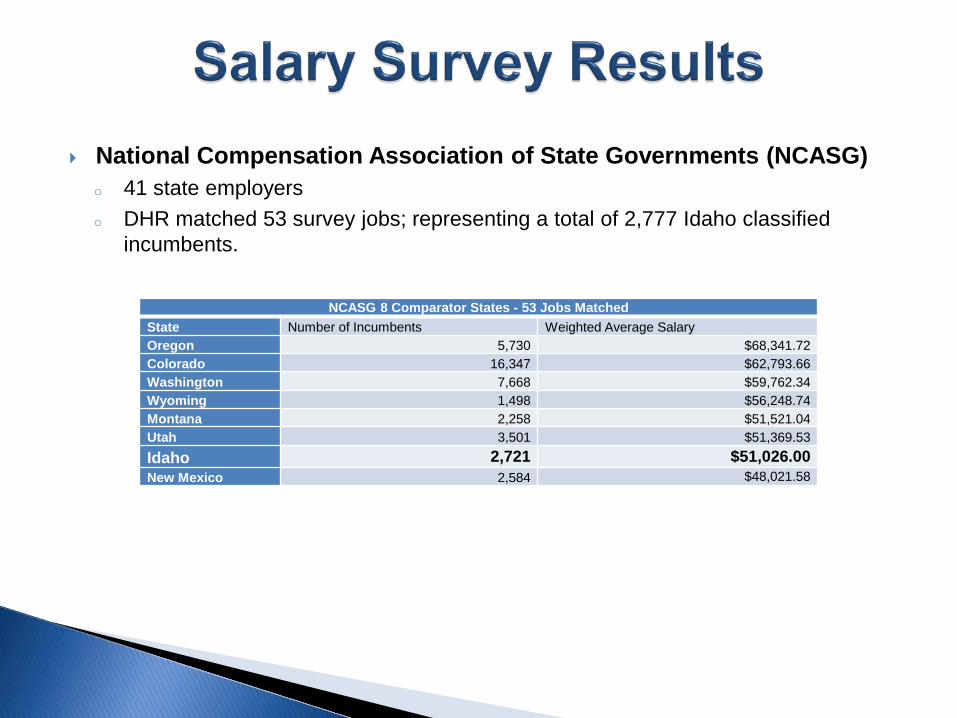
National Compensation Association of State Governments (NCASG) o 41 state employers o DHR matched 53 survey jobs; representing a total of 2,777 Idaho classified
incumbents.
NCASG 8 Comparator States - 53 Jobs Matched State Number of Incumbents Weighted Average Salary Oregon 5,730 $68,341.72 Colorado 16,347 $62,793.66 Washington 7,668 $59,762.34 Wyoming 1,498 $56,248.74 Montana 2,258 $51,521.04 Utah 3,501 $51,369.53 Idaho 2,721 $51,026.00 New Mexico 2,584 $48,021.58
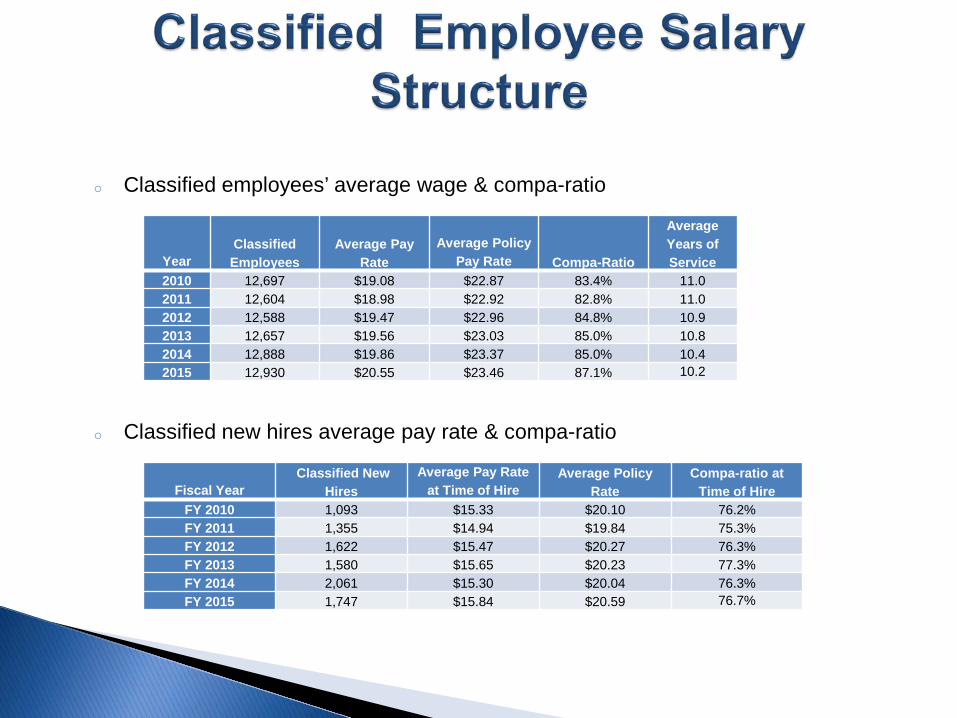
o Classified employees’ average wage & compa-ratio
o Classified new hires average pay rate & compa-ratio
Year Classified Employees
Average Pay Rate
Average Policy Pay Rate Compa-Ratio
Average Years of Service
2010 12,697 $19.08 $22.87 83.4% 11.0 2011 12,604 $18.98 $22.92 82.8% 11.0 2012 12,588 $19.47 $22.96 84.8% 10.9 2013 12,657 $19.56 $23.03 85.0% 10.8 2014 12,888 $19.86 $23.37 85.0% 10.4 2015 12,930 $20.55 $23.46 87.1% 10.2
Fiscal Year Classified New
Hires Average Pay Rate
at Time of Hire Average Policy
Rate Compa-ratio at
Time of Hire FY 2010 1,093 $15.33 $20.10 76.2% FY 2011 1,355 $14.94 $19.84 75.3% FY 2012 1,622 $15.47 $20.27 76.3% FY 2013 1,580 $15.65 $20.23 77.3% FY 2014 2,061 $15.30 $20.04 76.3% FY 2015 1,747 $15.84 $20.59 76.7%
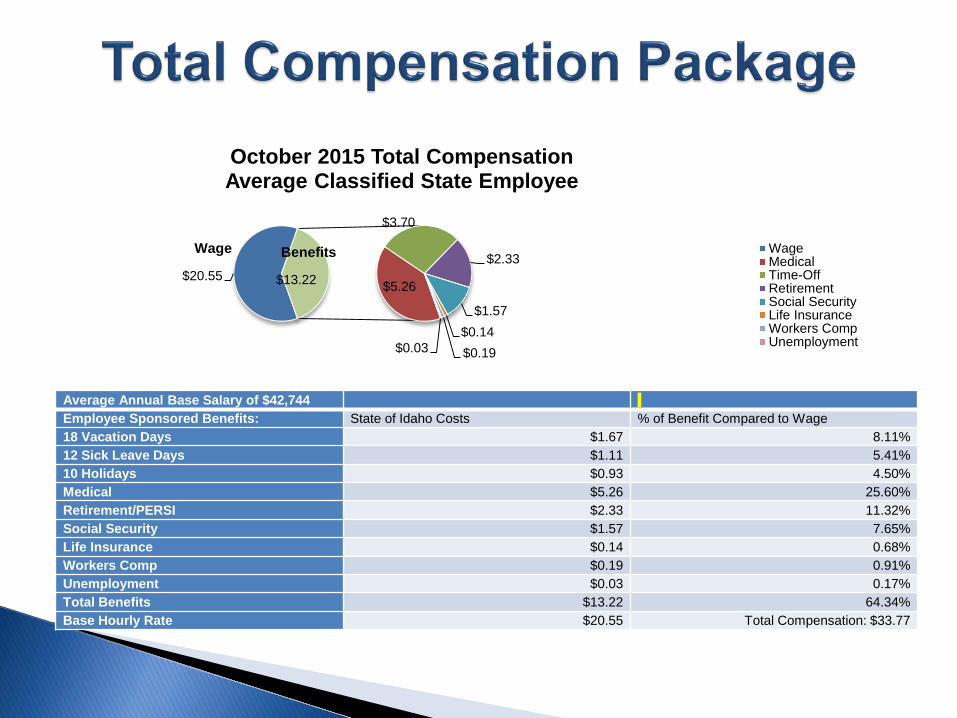
$20.55 $5.26
$3.70
$2.33
$1.57 $0.14 $0.19 $0.03
$13.22
October 2015 Total Compensation Average Classified State Employee
WageMedicalTime-OffRetirementSocial SecurityLife InsuranceWorkers CompUnemployment
Benefits Wage
Average Annual Base Salary of $42,744 Employee Sponsored Benefits: State of Idaho Costs % of Benefit Compared to Wage 18 Vacation Days $1.67 8.11% 12 Sick Leave Days $1.11 5.41% 10 Holidays $0.93 4.50% Medical $5.26 25.60% Retirement/PERSI $2.33 11.32% Social Security $1.57 7.65% Life Insurance $0.14 0.68% Workers Comp $0.19 0.91% Unemployment $0.03 0.17% Total Benefits $13.22 64.34% Base Hourly Rate $20.55 Total Compensation: $33.77
0
500
1000
1500
2000
2500
3000
3500
4000
4500
5000
Number of Employees
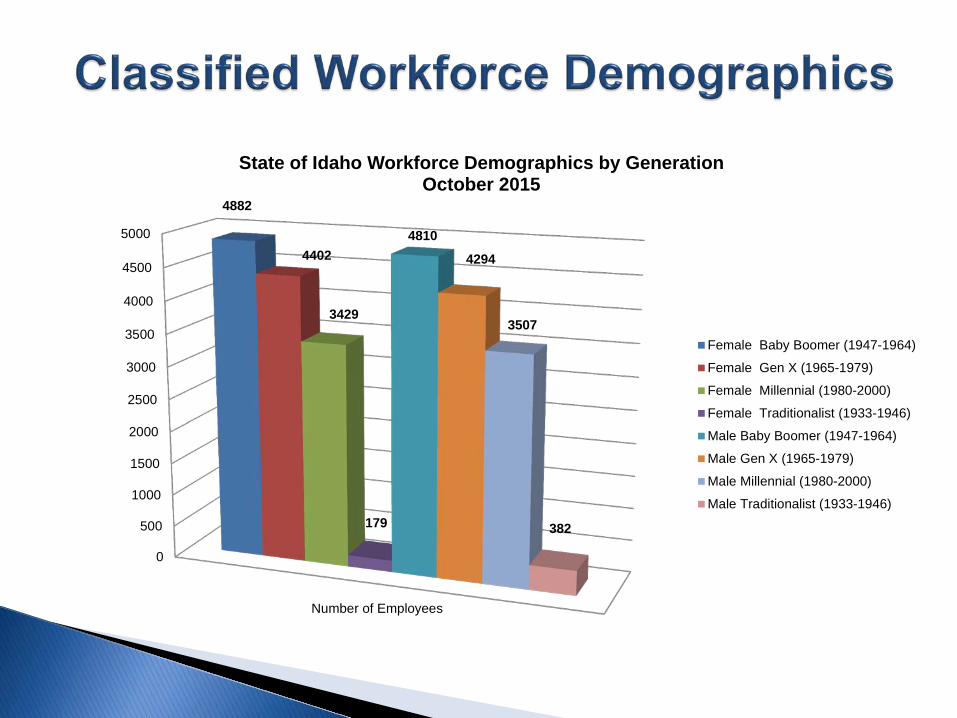
4882
4402
3429
179
4810
4294
3507
382
State of Idaho Workforce Demographics by Generation October 2015
Female Baby Boomer (1947-1964)
Female Gen X (1965-1979)
Female Millennial (1980-2000)
Female Traditionalist (1933-1946)
Male Baby Boomer (1947-1964)
Male Gen X (1965-1979)
Male Millennial (1980-2000)
Male Traditionalist (1933-1946)
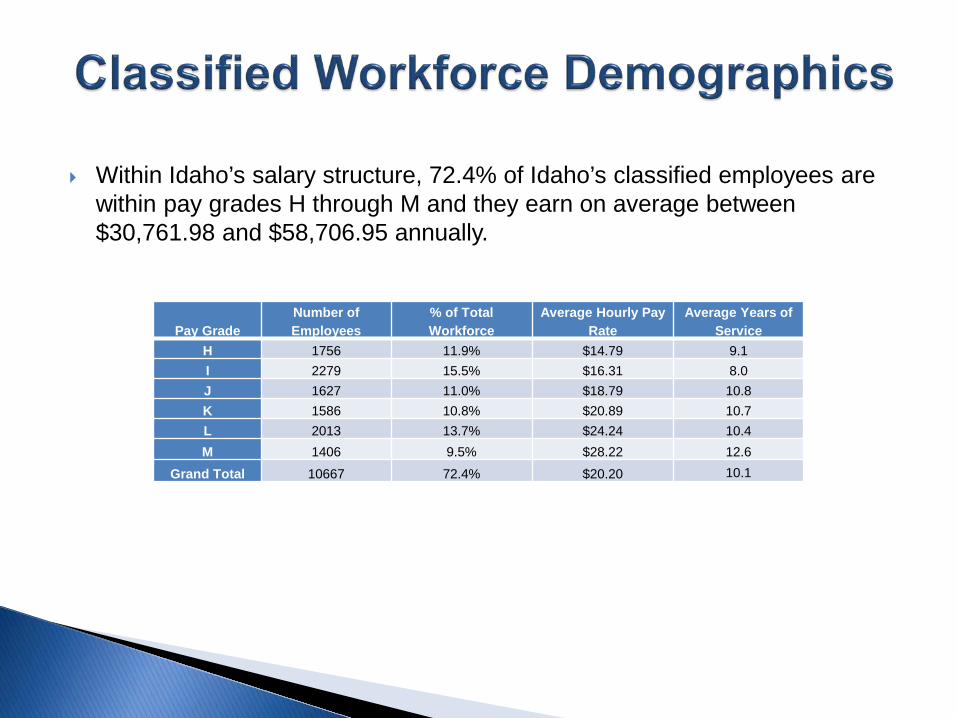
Within Idaho’s salary structure, 72.4% of Idaho’s classified employees are within pay grades H through M and they earn on average between $30,761.98 and $58,706.95 annually.
Pay Grade Number of Employees
% of Total Workforce
Average Hourly Pay Rate
Average Years of Service
H 1756 11.9% $14.79 9.1
I 2279 15.5% $16.31 8.0
J 1627 11.0% $18.79 10.8
K 1586 10.8% $20.89 10.7
L 2013 13.7% $24.24 10.4
M 1406 9.5% $28.22 12.6
Grand Total 10667 72.4% $20.20 10.1
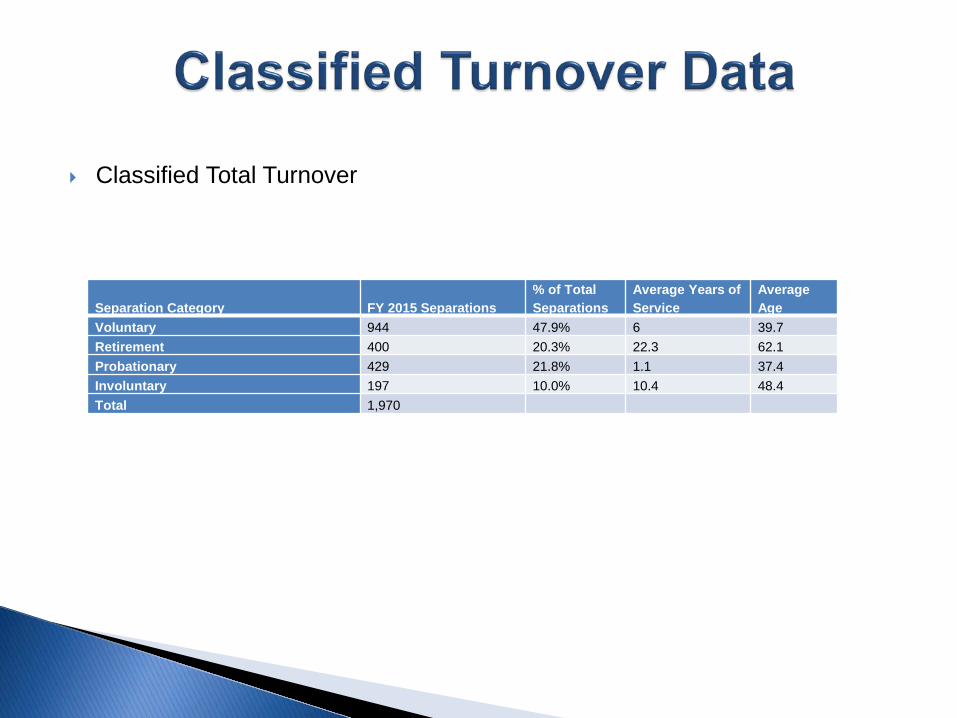
Classified Total Turnover
Separation Category FY 2015 Separations % of Total Separations
Average Years of Service
Average Age
Voluntary 944 47.9% 6 39.7 Retirement 400 20.3% 22.3 62.1 Probationary 429 21.8% 1.1 37.4 Involuntary 197 10.0% 10.4 48.4 Total 1,970
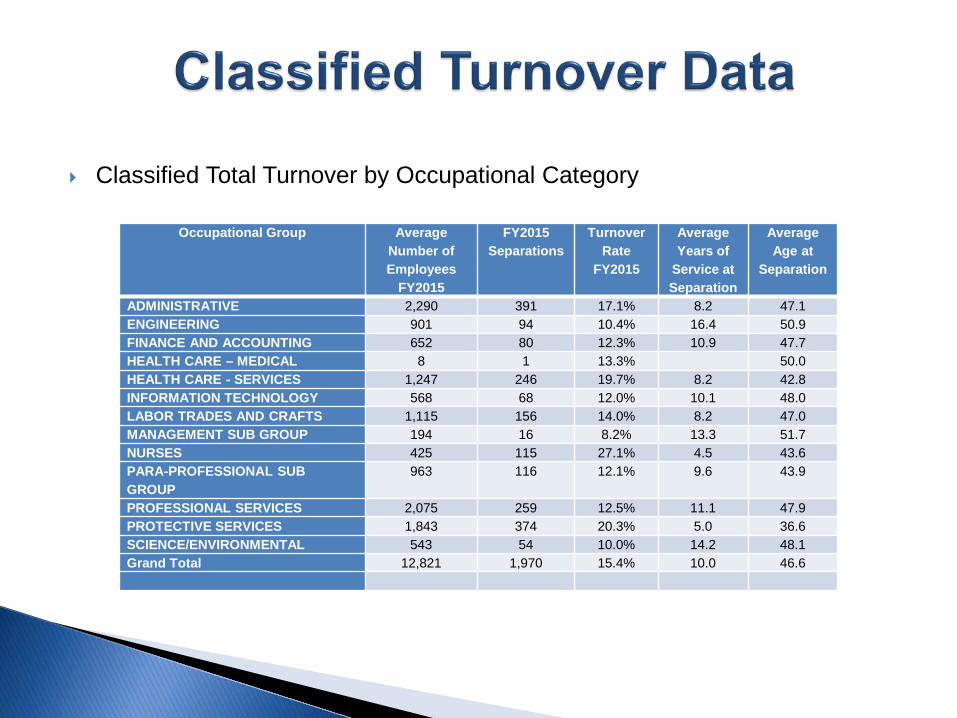
Classified Total Turnover by Occupational Category Occupational Group Average
Number of Employees
FY2015
FY2015 Separations
Turnover Rate
FY2015
Average Years of
Service at Separation
Average Age at
Separation
ADMINISTRATIVE 2,290 391 17.1% 8.2 47.1 ENGINEERING 901 94 10.4% 16.4 50.9 FINANCE AND ACCOUNTING 652 80 12.3% 10.9 47.7 HEALTH CARE – MEDICAL 8 1 13.3% 50.0 HEALTH CARE - SERVICES 1,247 246 19.7% 8.2 42.8 INFORMATION TECHNOLOGY 568 68 12.0% 10.1 48.0 LABOR TRADES AND CRAFTS 1,115 156 14.0% 8.2 47.0 MANAGEMENT SUB GROUP 194 16 8.2% 13.3 51.7 NURSES 425 115 27.1% 4.5 43.6 PARA-PROFESSIONAL SUB GROUP
963 116 12.1% 9.6 43.9
PROFESSIONAL SERVICES 2,075 259 12.5% 11.1 47.9 PROTECTIVE SERVICES 1,843 374 20.3% 5.0 36.6 SCIENCE/ENVIRONMENTAL 543 54 10.0% 14.2 48.1 Grand Total 12,821 1,970 15.4% 10.0 46.6
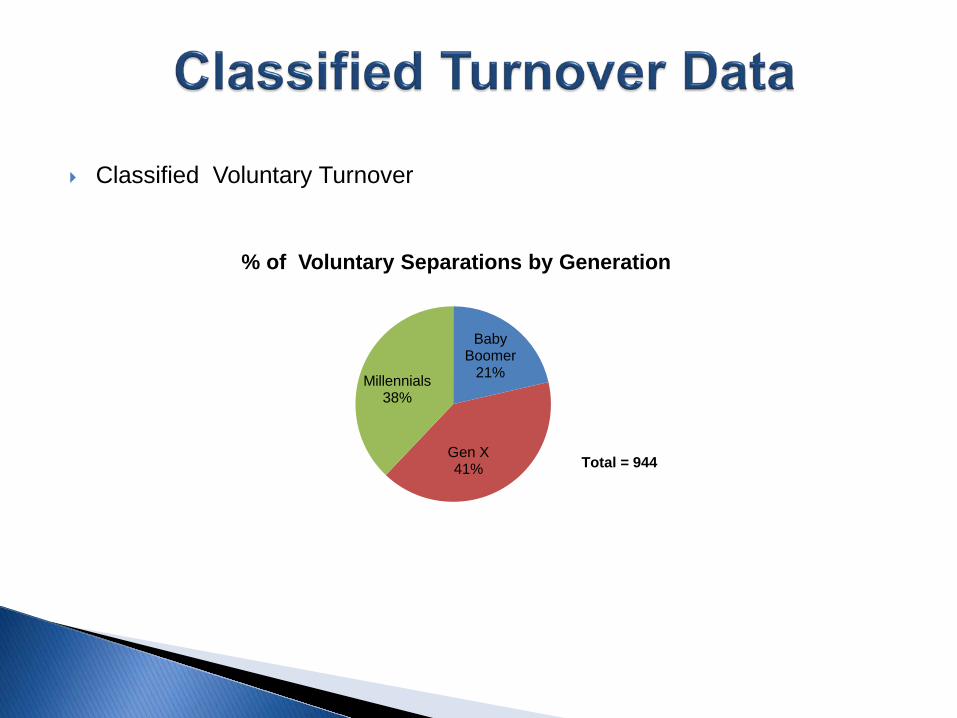
Classified Voluntary Turnover
Baby Boomer
21%
Gen X 41%
Millennials 38%
% of Voluntary Separations by Generation
Total = 944
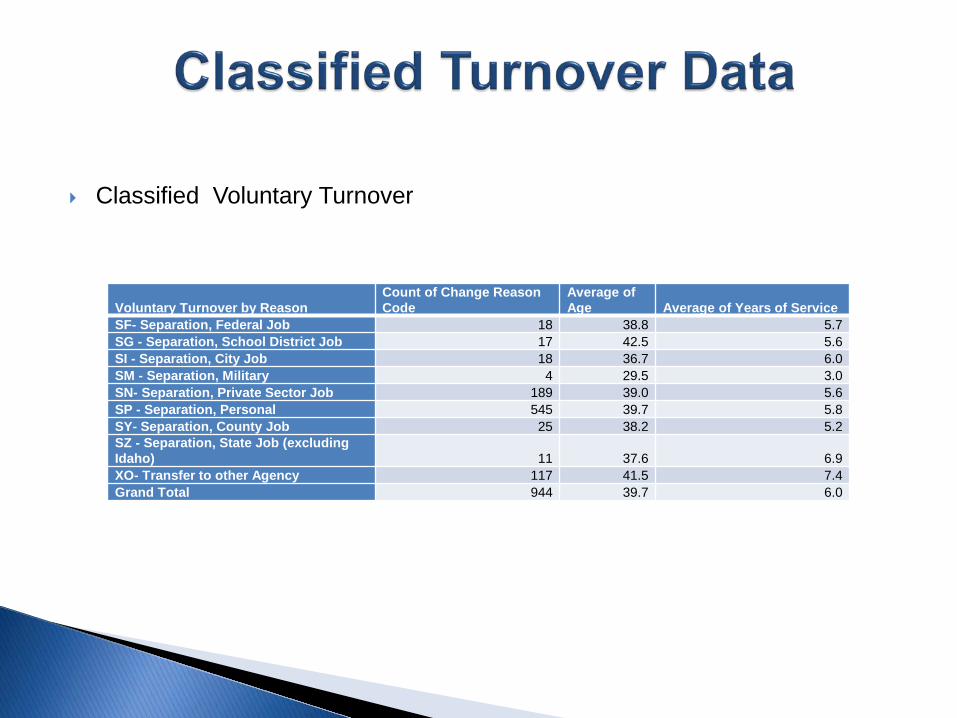
Classified Voluntary Turnover
Voluntary Turnover by Reason Count of Change Reason Code
Average of Age Average of Years of Service
SF- Separation, Federal Job 18 38.8 5.7 SG - Separation, School District Job 17 42.5 5.6 SI - Separation, City Job 18 36.7 6.0 SM - Separation, Military 4 29.5 3.0 SN- Separation, Private Sector Job 189 39.0 5.6 SP - Separation, Personal 545 39.7 5.8 SY- Separation, County Job 25 38.2 5.2 SZ - Separation, State Job (excluding Idaho) 11 37.6 6.9 XO- Transfer to other Agency 117 41.5 7.4 Grand Total 944 39.7 6.0
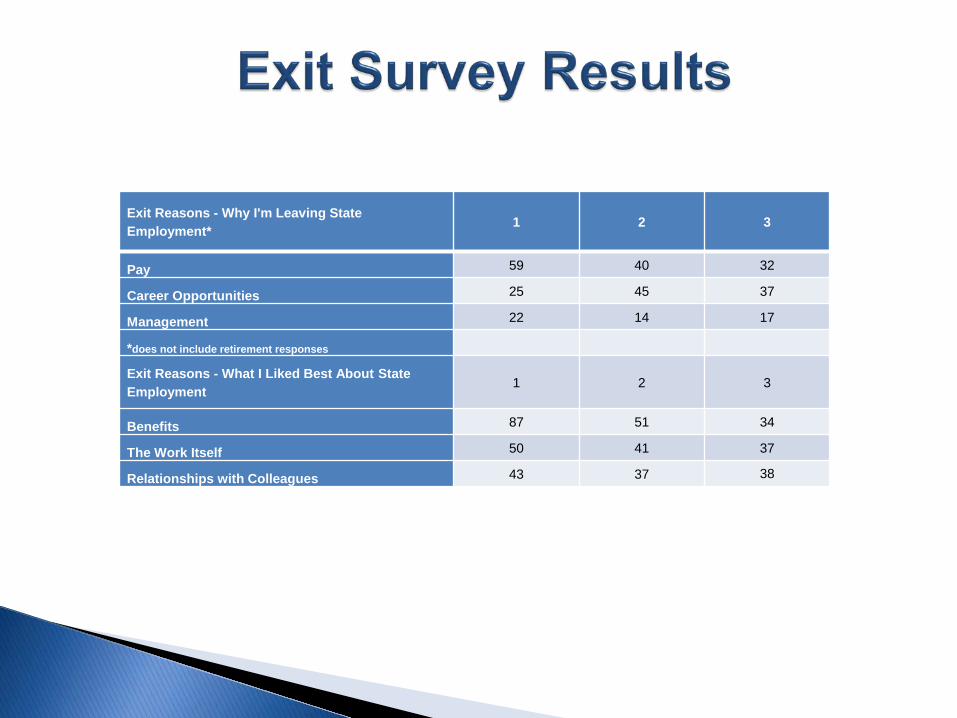
Exit Reasons - Why I'm Leaving State Employment*
1 2 3
Pay 59 40 32
Career Opportunities 25 45 37
Management 22 14 17
*does not include retirement responses
Exit Reasons - What I Liked Best About State Employment
1 2 3
Benefits 87 51 34
The Work Itself 50 41 37
Relationships with Colleagues 43 37 38
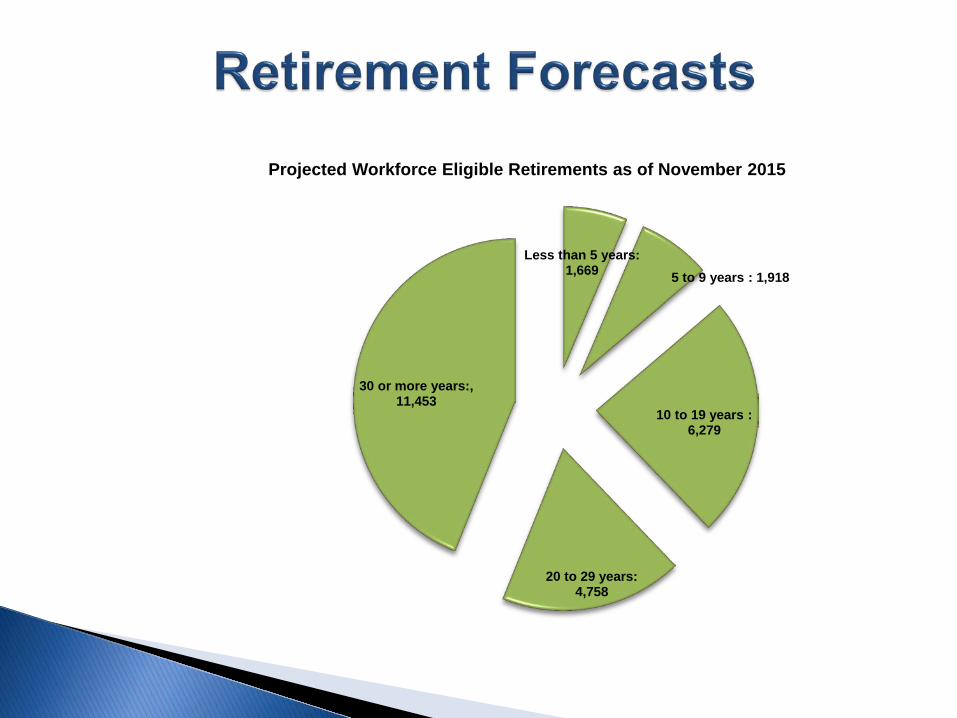
Less than 5 years: 1,669 5 to 9 years : 1,918
10 to 19 years : 6,279
20 to 29 years: 4,758
30 or more years:, 11,453
Projected Workforce Eligible Retirements as of November 2015
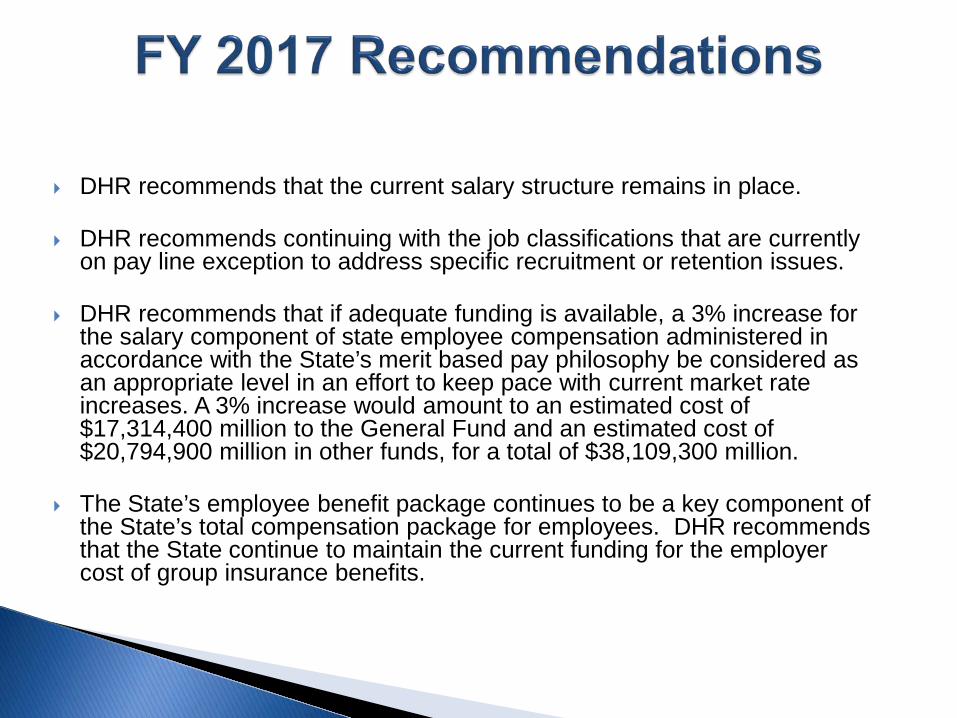
DHR recommends that the current salary structure remains in place.
DHR recommends continuing with the job classifications that are currently on pay line exception to address specific recruitment or retention issues.
DHR recommends that if adequate funding is available, a 3% increase for the salary component of state employee compensation administered in accordance with the State’s merit based pay philosophy be considered as an appropriate level in an effort to keep pace with current market rate increases. A 3% increase would amount to an estimated cost of $17,314,400 million to the General Fund and an estimated cost of $20,794,900 million in other funds, for a total of $38,109,300 million.
The State’s employee benefit package continues to be a key component of the State’s total compensation package for employees. DHR recommends that the State continue to maintain the current funding for the employer cost of group insurance benefits.
Appendix A – Agencies with Classified and Non-Classified Employees Appendix B – Synopsis of State CEC Increases Appendix C – National Compensation Association of State Governments (NCASG) Directory Appendix D – NCASG Comparator States Matched Jobs Appendix E – Salary Survey Wage Analysis Appendix F – FY 2016 Salary Structure Appendix G – Classified Employees’ Compa-Ratio by Agency and Pay Grade Appendix H – Classified Employees by Agency and Pay Grade 2010 to 2015 Appendix I – Classified New Hires by Agency and Pay Grade FY2010 to FY2015 Appendix J – Classified New Hires by Occupational Group and Average Age Appendix K – Classified Employees Total Separations by Agency FY2014 and FY2015 Appendix L – Classified Employees Voluntary Separations by Agency FY2010 to FY2015 Appendix M –Classified Employees Retirement Separations by Agency FY2014 and FY2015 Appendix N – Classified Employees Involuntary Separations FY 2013 to FY 2015 Appendix O – Workforce Demographics by Agency as of October 2015 Appendix P – Workforce Demographics by County as of October 2015 Appendix Q – Workforce Demographics by Pay Grade as of October 2015 Appendix R – Workforce Demographics by Gender and Generation as of October 2015 Appendix S – FY2015 Employee Exit Survey Summary Appendix T – Retirement Forecast Calendar Years 2015 to 2025 Appendix U – Market Related Changes to Address Specific Occupational Inequities Appendix V – Glossary