Embed Size (px)
Citation preview
TECHNICAL NOTE: ANALYSIS OF PRICE INCENTIVES AND DISINCENTIVES FOR MAIZE IN THE REPUBLIC OF MOZAMBIQUE FOR THE TIME PERIOD 2005-2013
October 2014
- DRAFT -
Analysis of price incentives and disincentives for maize in Mozambique 2005-2013
2 Monitoring and Analysing Food and Agricultural Policies (MAFAP)
This technical note is a product of the Monitoring and Analysing Food and Agricultural Policies (MAFAP) programme. It may be updated as new data becomes available.
MAFAP is implemented by the Food and Agriculture Organization of the United Nations (FAO) in collaboration with the Organisation for Economic Co-operation and Development (OECD) and national partners in participating countries. It is financially supported by the Bill and Melinda Gates Foundation, the United States Agency for International Developm ent (USAID) and FAO.
The analysis presented in this document is the result of partnerships established in the context of the MAFAP programme with the National Directorate of Economics from the Ministry of Agriculture and the Research Center for Agricultural Policies and Programs (CEPPAG) from the Eduardo Mondlane University (UEM).
This technical note was prepared by Helder Zavale from CEPPAG-UEM, with support and contributions from Valentina Pernechele of FAO.
For more information: www.fao.org/in-action/mafap
Suggested citation:Zavale, H., 2014. Analysis of price incentives and disincentives for maize in the Republic of Mozambique 2005-2013. Technical notes series, MAFAP, FAO, Rome. © FAO 2013 FAO encourages the use, reproduction and dissemination of material in this information product. Except where otherwise indicated, material may be copied, downloaded and printed for private study, research and teaching purposes, or for use in non-commercial products or services, provided that appropriate acknowledgement of FAO as the source and copyright holder is given and that FAO’s endorsement of users’ views, products or services is not implied in any way. All requests for translation and adaptation rights, and for resale and other commercial use rights should be made via www.fao.org/contact-us/licence-request or addressed to [email protected]. FAO information products are available on the FAO website (www.fao.org/publications) and can be purchased through [email protected].
Analysis of price incentives and disincentives for maize in Mozambique 2005-2013
SUMMARY OF THE NOTE
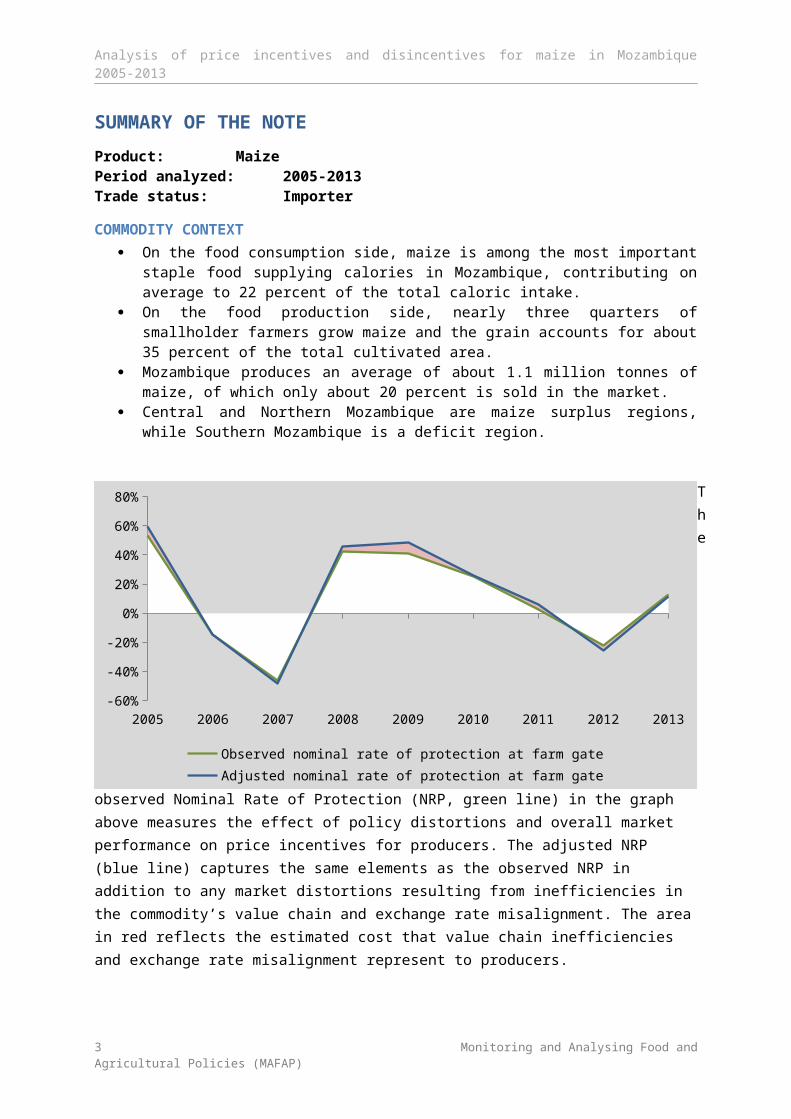
Product: MaizePeriod analyzed: 2005-2013Trade status: Importer
COMMODITY CONTEXT On the food consumption side, maize is among the most important staple food supplying
calories in Mozambique, contributing on average to 22 percent of the total caloric intake. On the food production side, nearly three quarters of smallholder farmers grow maize and
the grain accounts for about 35 percent of the total cultivated area. Mozambique produces an average of about 1.1 million tonnes of maize, of which only about
20 percent is sold in the market. Central and Northern Mozambique are maize surplus regions, while Southern Mozambique is
a deficit region.
The
observed Nominal Rate of Protection (NRP, green line) in the graph above measures the effect of policy distortions and overall market performance on price incentives for producers. The adjusted NRP (blue line) captures the same elements as the observed NRP in addition to any market distortions resulting from inefficiencies in the commodity’s value chain and exchange rate misalignment. The area in red reflects the estimated cost that value chain inefficiencies and exchange rate misalignment represent to producers.
DRIVING FACTORS Cereals including maize, wheat and rice are subject to a 2.5 percent import tariff. In addition, a 17 percent value added tax (VAT) is applied on maize grain imports. Since VAT
is not applied to domestic production, this measure de facto constitutes a trade policy measure in the form of an import tax.
Large-scale millers in Southern Mozambique prefer maize grain imported from South Africa, while medium-to-small millers use predominantly maize sourced from surplus areas in Central and Northern Mozambique.
3 Monitoring and Analysing Food and Agricultural Policies (MAFAP)
2005 2006 2007 2008 2009 2010 2011 2012 2013-60%
-40%
-20%
0%
20%
40%
60%
80%
Observed nominal rate of protection at farm gateAdjusted nominal rate of protection at farm gate
Analysis of price incentives and disincentives for maize in Mozambique 2005-2013
RECOMMENDATIONS Although there is the need to undertake additional research to draw specific policy
recommendations from a more in-depth analysis, we recommend to undertake an assessment of the potential impact of the removal of the 17 percent VAT on maize grain import.
4 Monitoring and Analysing Food and Agricultural Policies (MAFAP)
Analysis of price incentives and disincentives for maize in Mozambique 2005-2013
CONTENTSSUMMARY OF THE NOTE........................................................................................................................3
COMMODITY CONTEXT..................................................................................................................3DRIVING FACTORS..........................................................................................................................3RECOMMENDATIONS.....................................................................................................................4
CONTENTS..............................................................................................................................................51. PURPOSE OF THE NOTE..................................................................................................................62. COMMODITY CONTEXT..................................................................................................................7
PRODUCTION......................................................................................................................................7CONSUMPTION/UTILIZATION.............................................................................................................9MARKETING AND TRADE..................................................................................................................12DESCRIPTION OF THE VALUE CHAIN.................................................................................................14POLICY DECISIONS AND MEASURES.................................................................................................16
3. METHODOLOGY............................................................................................................................204. DATA REQUIREMENTS AND CALCULATION OF INDICATORS........................................................24
TRADE STATUS OF THE PRODUCT.....................................................................................................24MARKET PATHWAY ANALYSED.........................................................................................................25BENCHMARK PRICES.........................................................................................................................27DOMESTIC PRICES............................................................................................................................28EXCHANGE RATES.............................................................................................................................29ACCESS COSTS..................................................................................................................................30BUDGET AND OTHER TRANSFERS.....................................................................................................31QUALITY AND QUANTITY ADJUSTMENTS.........................................................................................32DATA OVERVIEW..............................................................................................................................32SUMMARY OF INDICATORS..............................................................................................................34
5. RESULTS AND INTERPRETATION...................................................................................................356. CONCLUSION................................................................................................................................41
MAIN MESSAGE................................................................................................................................41RECOMMENDATIONS.......................................................................................................................41LIMITATIONS....................................................................................................................................41FURTHER INVESTIGATION AND RESEARCH.......................................................................................42
BIBLIOGRAPHY......................................................................................................................................43
5 Monitoring and Analysing Food and Agricultural Policies (MAFAP)
Analysis of price incentives and disincentives for maize in Mozambique 2005-2013
1. PURPOSE OF THE NOTE
This technical note is an attempt to measure, analyze and interpret price incentives for maize in Mozambique over the period 2005-2013.
For this purpose, yearly averages of domestic farm gate and wholesale prices are compared with reference prices calculated on the basis of the price of the commodity in the international market. The price gaps between reference prices and domestic prices along the commodity’s value chain indicate the extent to which incentives (positive gaps) or disincentives (negative gaps) were present at the farm gate and wholesale level. The price gaps are expressed in relative terms as a percentage of the reference price, referred to as the Nominal Rate of Protection (NRP). These key indicators are used by MAFAP to assess the effects of policy and market performance on prices.
This technical note begins with a review of the commodity’s production, consumption/utilization, marketing and trade, value chain and policy context (Chapter 2). Then, the methodological approach employed in the technical note is outlined (Chapter 3). The technical note also provides a detailed description of how key data elements were obtained and indicators were calculated (Chapter 4). The indicators were then interpreted in light of existing policies and market characteristics (Chapter 5). Finally, the note concludes with a few main messages, key policy recommendations were formulated on the basis of this interpretation, limitations of the analysis and areas identified for further research to improve the analysis (Chapter 6).
The results and recommendations presented in this analysis of price incentives can be used by stakeholders involved in policy-making for the food and agriculture sector. They can also serve as input for evidence-based policy dialogue at the national, regional or international level.
This technical note should not be interpreted as an in-depth value chain analysis or detailed description of the commodity’s production, consumption/utilization, marketing and trade or policy context. All information related to these areas is presented merely to provide background on the commodity under review, help understand major trends and facilitate the interpretation of the indicators.
All information in this technical note is subject to review and validation.
6 Monitoring and Analysing Food and Agricultural Policies (MAFAP)
Analysis of price incentives and disincentives for maize in Mozambique 2005-2013
2. COMMODITY CONTEXT
Cassava and maize are among the most important staple crops in Mozambique, contributing to food security in the country especially in Central and Northern Mozambique. According to data from FAOSTAT, the maize share of the total caloric intake averaged 22 percent over the period 2000 to 2009, while the average contribution of cassava was about 33 percent. Maize ranked second only to cassava in terms of contribution to calories consumed during the same period. Estimates from a national agricultural survey covering the 2007/08 agricultural season indicate that maize was grown by 2.7 out of 3.7 million rural households living in the country, with households producing on average 326 kilograms of maize per year. The majority of these maize-growing households reside in the Central and Northern regions, contributing to a combined share of 82 percent of the total number of rural households who grow maize. About one quarter of rural maize-growing households in the country can be classified as autarkic.1 Only about 20 percent of rural households reported that they sold their maize production at the market in the 2007/08 agricultural season. Maize – accounting on average for about 60 percent of the total value of production (cereals plus peanut) in the same agricultural season – is the most important crop in terms of value of production. Similar patterns emerge for other agricultural seasons, using data from the national agricultural surveys.
In terms of consumption, data from the Mozambique Household Budget Survey 2008/09 show that 2.8 out of 4.6 million households consumed maize with annual consumption of maize (either purchased or own grown) averaging about 353 kilograms per household, compared to average production of 326 kilograms in the 2007/08 production season. Rural households consumed on average 410 kilograms per year, compared to 214 kilograms for urban households. The proportion of households who consume maize is also greater in rural areas than in urban areas (65 percent versus 51 percent). The data from the Household Budget Survey 2008/09 also show that maize is the most important commodity in terms of food expenditure. On average, nearly 70 percent of the total household expenditures are spent on food. The share of total household food expenditure spent on maize averaged about 25 percent. The average shares of maize in the household food expenditures are greater in Northern and Central Mozambique, compared to Southern Mozambique (41 percent in Central and 24 percent in Northern versus 14 percent in Southern).
PRODUCTION
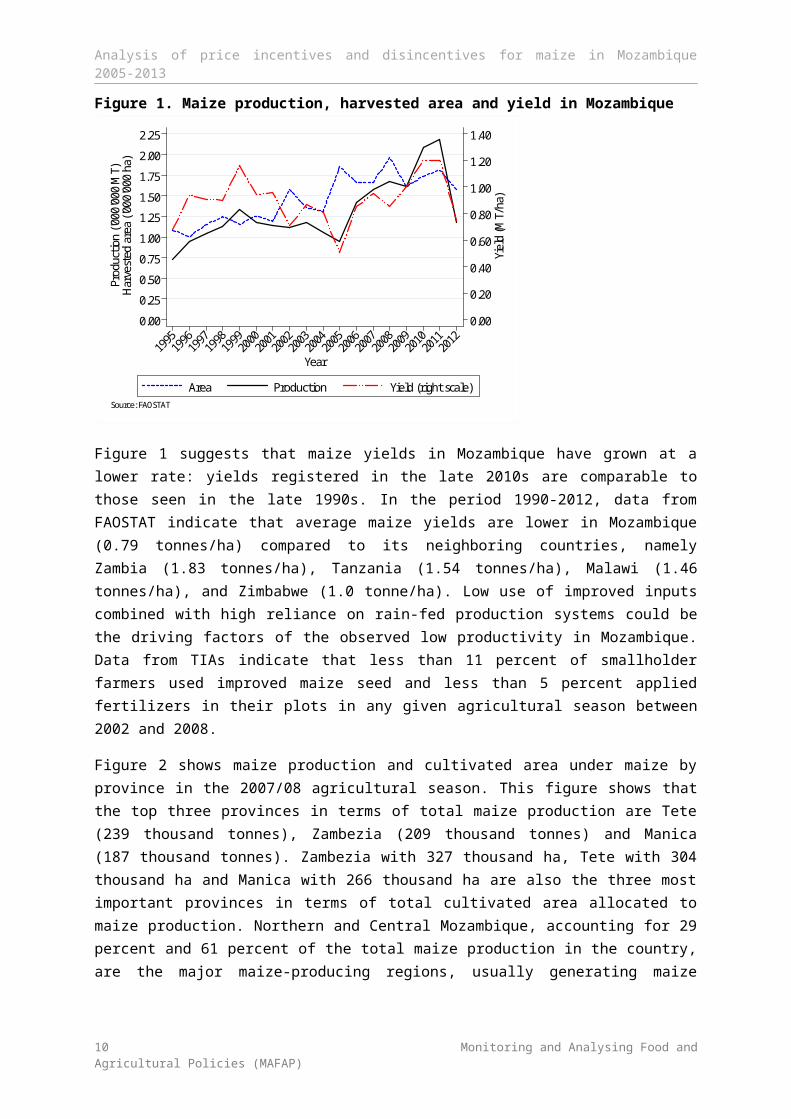
Maize is an important crop grown by smallholder farmers in Mozambique. according to data from a national sample survey – administered by the Mozambique Ministry of Agriculture (MINAG) and commonly known by its Portuguese acronym Trabalho de Inquerito Agricola (TIA) - early three quarters of smallholder farmers grew maize, accounting for about 35 percent of the total cultivated area in the 2007/08 agricultural season. Maize production, harvested area and yield in Mozambique are plotted in Figure 1. This figure shows that maize harvested area oscillated with an upward trend, increasing by about 60 percent from 1.15 million hectare (ha) in 1999 to 1.81 million ha in 2011. From 1995 to 1999, maize production increased from 0.73 million tonnes to 1.34 million tonnes. It then dropped to 0.94 million tonnes in 2005. Since that year, maize production experienced a steady
1 Net maize sellers (buyers) are defined as households whose maize sales (purchases) outweigh their maize purchases (sales). When maize sales are equal to maize purchases then households are classified as autarkic. Here we assume that households sell all their maize production at the market and buy their maize consumption requirements from the market.
7 Monitoring and Analysing Food and Agricultural Policies (MAFAP)
Analysis of price incentives and disincentives for maize in Mozambique 2005-2013
upward trend, jumping to 2.2 million tonnes in 2011. Maize yields followed a similar pattern; dropping from 1.16 tonnes/ha in 1999 to 0.51 tonnes/ha in 2005 and then rising to 1.2 tonne/ha in 2011.
Figure 1. Maize production, harvested area and yield in Mozambique
0.00
0.20
0.40
0.60
0.80
1.00
1.20
1.40
Yiel
d (M
T/ha
)
0.00
0.25
0.50
0.75
1.00
1.25
1.50
1.75
2.00
2.25
Prod
uctio
n ('0
00'0
00 M
T)Ha
rves
ted
area
('00
0'00
0 ha
)
19951996
19971998
19992000
20012002
20032004
20052006
20072008
20092010
20112012
Year
Area Production Yield (right scale)
Source: FAOSTAT
Figure 1 suggests that maize yields in Mozambique have grown at a lower rate: yields registered in the late 2010s are comparable to those seen in the late 1990s. In the period 1990-2012, data from FAOSTAT indicate that average maize yields are lower in Mozambique (0.79 tonnes/ha) compared to its neighboring countries, namely Zambia (1.83 tonnes/ha), Tanzania (1.54 tonnes/ha), Malawi (1.46 tonnes/ha), and Zimbabwe (1.0 tonne/ha). Low use of improved inputs combined with high reliance on rain-fed production systems could be the driving factors of the observed low productivity in Mozambique. Data from TIAs indicate that less than 11 percent of smallholder farmers used improved maize seed and less than 5 percent applied fertilizers in their plots in any given agricultural season between 2002 and 2008.
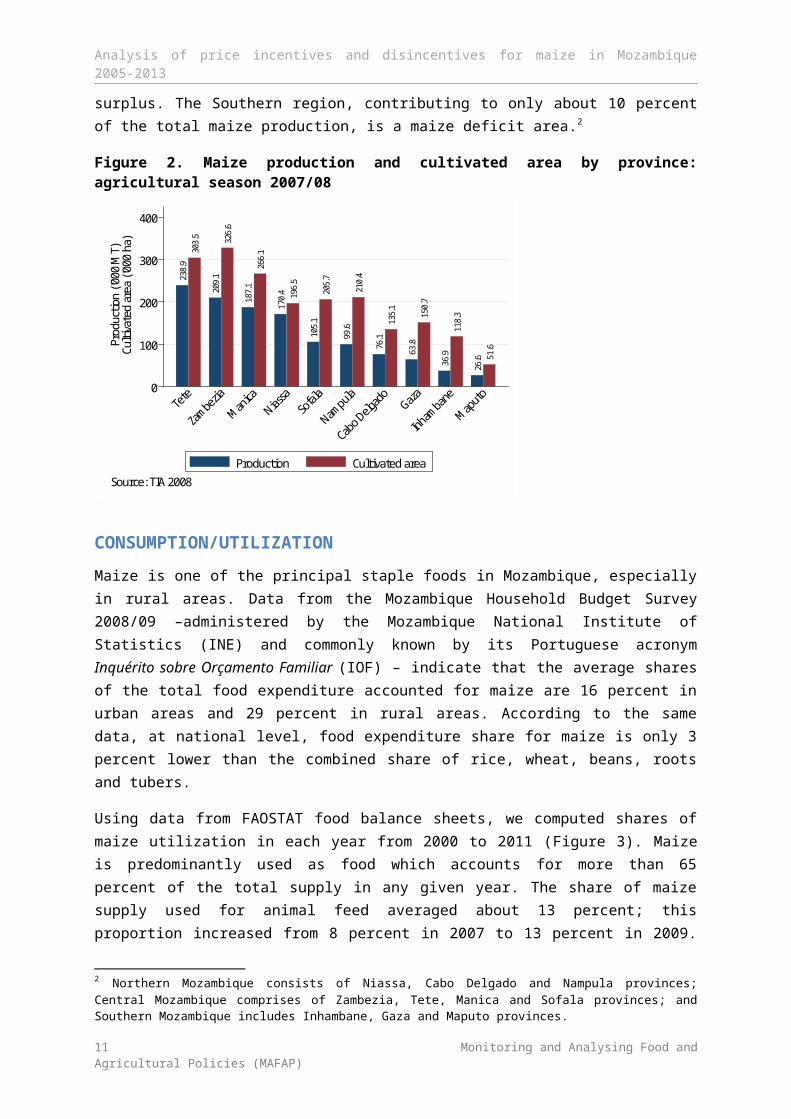
Figure 2 shows maize production and cultivated area under maize by province in the 2007/08 agricultural season. This figure shows that the top three provinces in terms of total maize production are Tete (239 thousand tonnes), Zambezia (209 thousand tonnes) and Manica (187 thousand tonnes). Zambezia with 327 thousand ha, Tete with 304 thousand ha and Manica with 266 thousand ha are also the three most important provinces in terms of total cultivated area allocated to maize production. Northern and Central Mozambique, accounting for 29 percent and 61 percent of the total maize production in the country, are the major maize-producing regions, usually generating maize surplus. The Southern region, contributing to only about 10 percent of the total maize production, is a maize deficit area.2
2 Northern Mozambique consists of Niassa, Cabo Delgado and Nampula provinces; Central Mozambique comprises of Zambezia, Tete, Manica and Sofala provinces; and Southern Mozambique includes Inhambane, Gaza and Maputo provinces.
8 Monitoring and Analysing Food and Agricultural Policies (MAFAP)
Analysis of price incentives and disincentives for maize in Mozambique 2005-2013
Figure 2. Maize production and cultivated area by province: agricultural season 2007/08
238.
930
3.5
209.
132
6.6
187.
126
6.1
170.
4 196.
5
105.
120
5.7
99.6
210.
4
76.1
135.
1
63.8
150.
7
36.9
118.
3
26.6 51
.6
0
100
200
300
400
Prod
uctio
n ('0
00 M
T)Cu
ltiva
ted
area
('00
0 ha
)
Tete
Zambezia
Manica
Niassa
Sofal
a
Nampula
Cabo Delga
doGaza
Inhamban
e
Maputo
Source: TIA 2008
Production Cultivated area
CONSUMPTION/UTILIZATION
Maize is one of the principal staple foods in Mozambique, especially in rural areas. Data from the Mozambique Household Budget Survey 2008/09 –administered by the Mozambique National Institute of Statistics (INE) and commonly known by its Portuguese acronym Inquérito sobre Orçamento Familiar (IOF) – indicate that the average shares of the total food expenditure accounted for maize are 16 percent in urban areas and 29 percent in rural areas. According to the same data, at national level, food expenditure share for maize is only 3 percent lower than the combined share of rice, wheat, beans, roots and tubers.
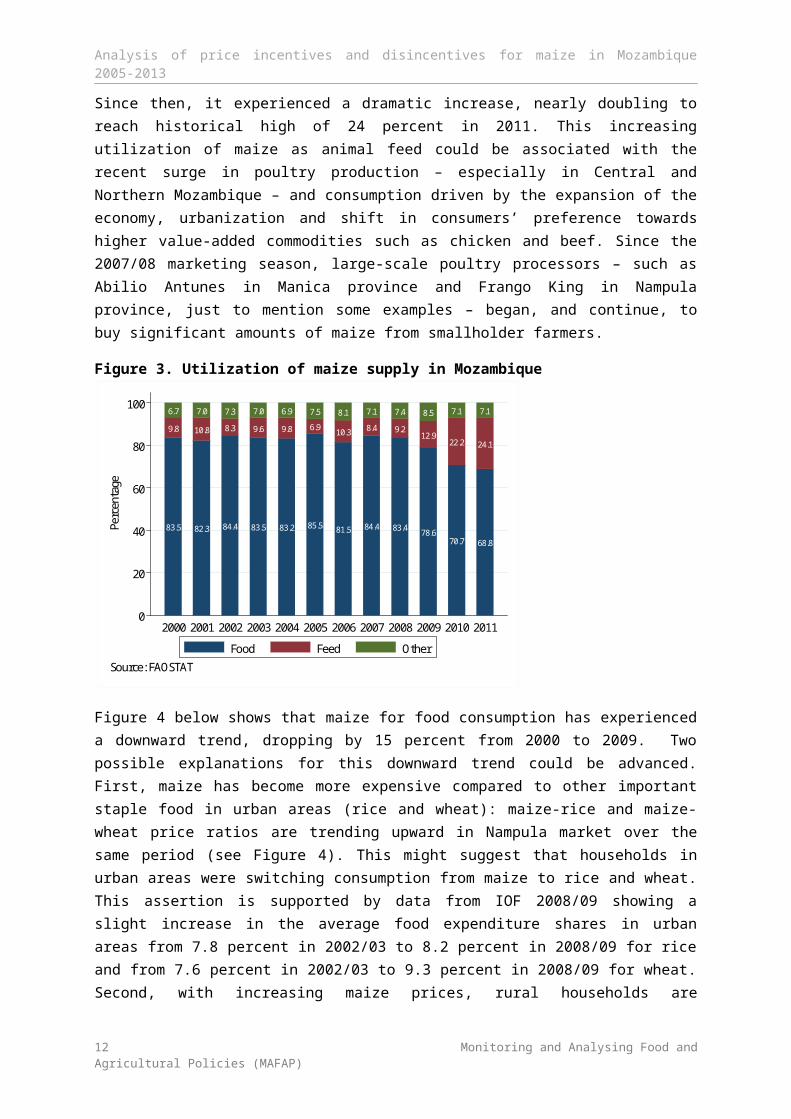
Using data from FAOSTAT food balance sheets, we computed shares of maize utilization in each year from 2000 to 2011 (Figure 3). Maize is predominantly used as food which accounts for more than 65 percent of the total supply in any given year. The share of maize supply used for animal feed averaged about 13 percent; this proportion increased from 8 percent in 2007 to 13 percent in 2009. Since then, it experienced a dramatic increase, nearly doubling to reach historical high of 24 percent in 2011. This increasing utilization of maize as animal feed could be associated with the recent surge in poultry production – especially in Central and Northern Mozambique – and consumption driven by the expansion of the economy, urbanization and shift in consumers’ preference towards higher value-added commodities such as chicken and beef. Since the 2007/08 marketing season, large-scale poultry processors – such as Abilio Antunes in Manica province and Frango King in Nampula province, just to mention some examples – began, and continue, to buy significant amounts of maize from smallholder farmers.
9 Monitoring and Analysing Food and Agricultural Policies (MAFAP)
Analysis of price incentives and disincentives for maize in Mozambique 2005-2013
Figure 3. Utilization of maize supply in Mozambique
83.5
9.8
6.7
82.3
10.8
7.0
84.4
8.3
7.3
83.5
9.6
7.0
83.2
9.8
6.9
85.5
6.9
7.5
81.5
10.3
8.1
84.4
8.4
7.1
83.4
9.2
7.4
78.6
12.9
8.5
70.7
22.2
7.1
68.8
24.1
7.1
0
20
40
60
80
100
Perc
enta
ge
2000 2001 2002 2003 2004 2005 2006 2007 2008 2009 2010 2011
Source: FAOSTAT
Food Feed Other
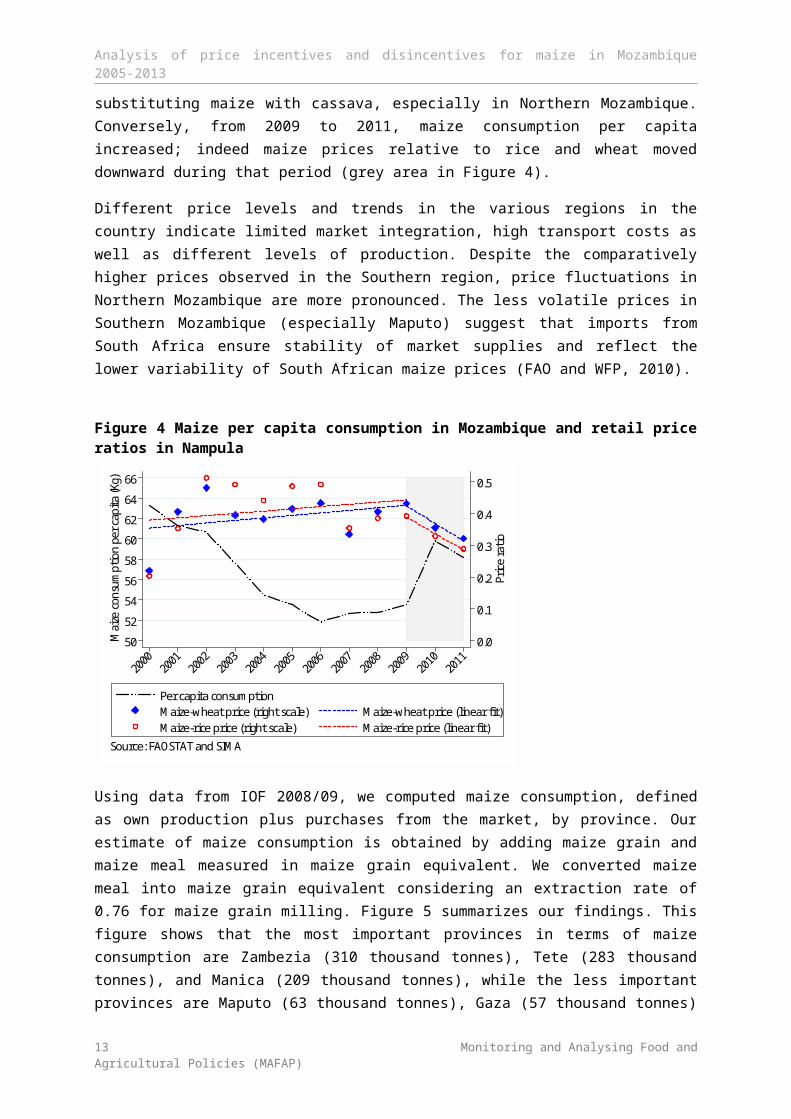
Figure 4 below shows that maize for food consumption has experienced a downward trend, dropping by 15 percent from 2000 to 2009. Two possible explanations for this downward trend could be advanced. First, maize has become more expensive compared to other important staple food in urban areas (rice and wheat): maize-rice and maize-wheat price ratios are trending upward in Nampula market over the same period (see Figure 4). This might suggest that households in urban areas were switching consumption from maize to rice and wheat. This assertion is supported by data from IOF 2008/09 showing a slight increase in the average food expenditure shares in urban areas from 7.8 percent in 2002/03 to 8.2 percent in 2008/09 for rice and from 7.6 percent in 2002/03 to 9.3 percent in 2008/09 for wheat. Second, with increasing maize prices, rural households are substituting maize with cassava, especially in Northern Mozambique. Conversely, from 2009 to 2011, maize consumption per capita increased; indeed maize prices relative to rice and wheat moved downward during that period (grey area in Figure 4).
Different price levels and trends in the various regions in the country indicate limited market integration, high transport costs as well as different levels of production. Despite the comparatively higher prices observed in the Southern region, price fluctuations in Northern Mozambique are more pronounced. The less volatile prices in Southern Mozambique (especially Maputo) suggest that imports from South Africa ensure stability of market supplies and reflect the lower variability of South African maize prices (FAO and WFP, 2010).
10 Monitoring and Analysing Food and Agricultural Policies (MAFAP)
Analysis of price incentives and disincentives for maize in Mozambique 2005-2013
Figure 4 Maize per capita consumption in Mozambique and retail price ratios in Nampula
0.0
0.1
0.2
0.3
0.4
0.5
Pric
e ra
tio
50
52
54
56
58
60
62
64
66M
aize
con
sum
ption
per
cap
ita (K
g)
20002001
20022003
20042005
20062007
20082009
20102011
Per capita consumptionMaize-wheat price (right scale) Maize-wheat price (linear fit)Maize-rice price (right scale) Maize-rice price (linear fit)
Source: FAOSTAT and SIMA
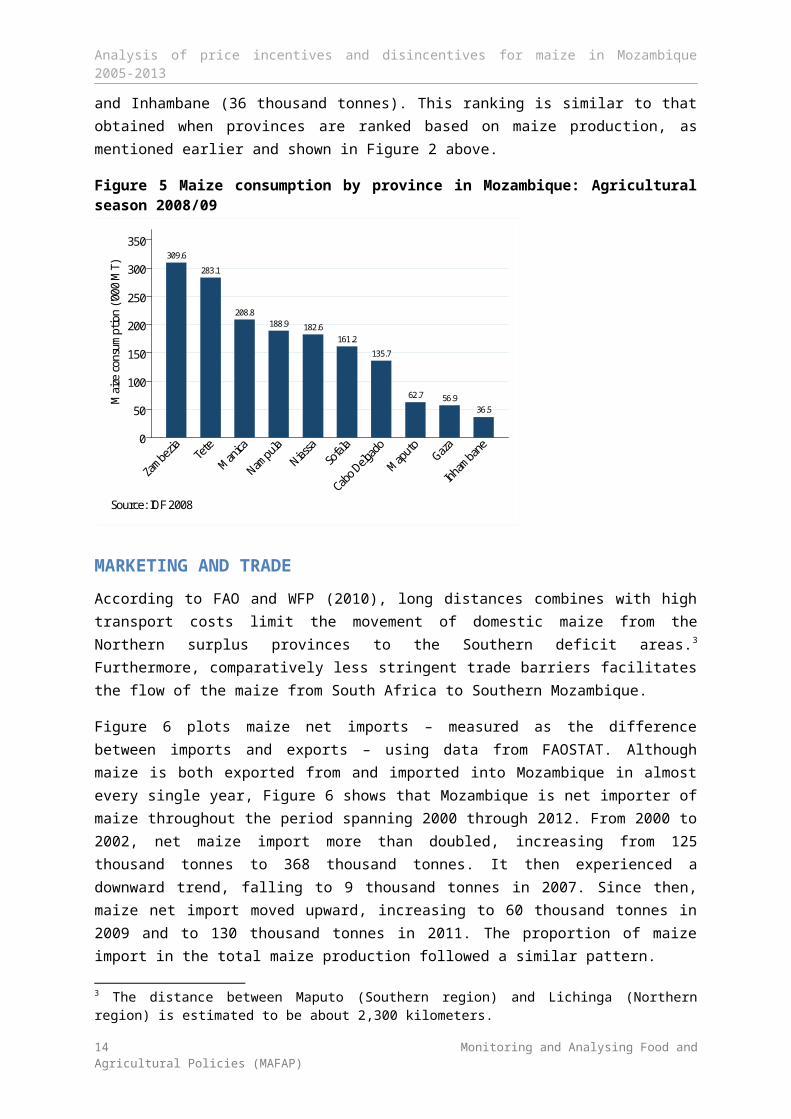
Using data from IOF 2008/09, we computed maize consumption, defined as own production plus purchases from the market, by province. Our estimate of maize consumption is obtained by adding maize grain and maize meal measured in maize grain equivalent. We converted maize meal into maize grain equivalent considering an extraction rate of 0.76 for maize grain milling. Figure 5 summarizes our findings. This figure shows that the most important provinces in terms of maize consumption are Zambezia (310 thousand tonnes), Tete (283 thousand tonnes), and Manica (209 thousand tonnes), while the less important provinces are Maputo (63 thousand tonnes), Gaza (57 thousand tonnes) and Inhambane (36 thousand tonnes). This ranking is similar to that obtained when provinces are ranked based on maize production, as mentioned earlier and shown in Figure 2 above.
Figure 5 Maize consumption by province in Mozambique: Agricultural season 2008/09
309.6
283.1
208.8188.9 182.6
161.2
135.7
62.7 56.936.5
0
50
100
150
200
250
300
350
Mai
ze c
onsu
mpti
on ('
000
MT)
Zambezia Te
te
Manica
Nampula
Niassa
Sofal
a
Cabo Delga
do
Maputo
Gaza
Inhamban
e
Source: IOF 2008
11 Monitoring and Analysing Food and Agricultural Policies (MAFAP)
Analysis of price incentives and disincentives for maize in Mozambique 2005-2013
MARKETING AND TRADE
According to FAO and WFP (2010), long distances combines with high transport costs limit the movement of domestic maize from the Northern surplus provinces to the Southern deficit areas.3 Furthermore, comparatively less stringent trade barriers facilitates the flow of the maize from South Africa to Southern Mozambique.
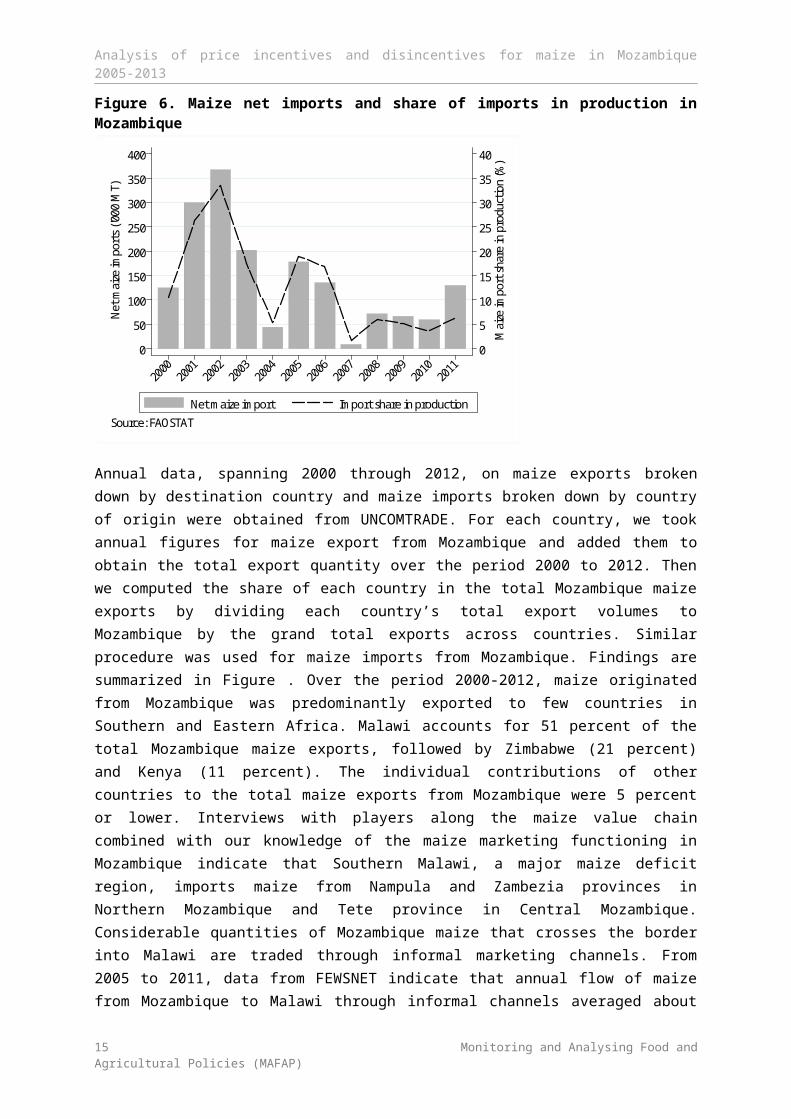
Figure 6 plots maize net imports – measured as the difference between imports and exports – using data from FAOSTAT. Although maize is both exported from and imported into Mozambique in almost every single year, Figure 6 shows that Mozambique is net importer of maize throughout the period spanning 2000 through 2012. From 2000 to 2002, net maize import more than doubled, increasing from 125 thousand tonnes to 368 thousand tonnes. It then experienced a downward trend, falling to 9 thousand tonnes in 2007. Since then, maize net import moved upward, increasing to 60 thousand tonnes in 2009 and to 130 thousand tonnes in 2011. The proportion of maize import in the total maize production followed a similar pattern.
Figure 6. Maize net imports and share of imports in production in Mozambique
0
5
10
15
20
25
30
35
40
Mai
ze im
port
shar
e in
pro
ducti
on (%
)
0
50
100
150
200
250
300
350
400
Net
mai
ze im
port
s ('0
00 M
T)
20002001
20022003
20042005
20062007
20082009
20102011
Net maize import Import share in production
Source: FAOSTAT
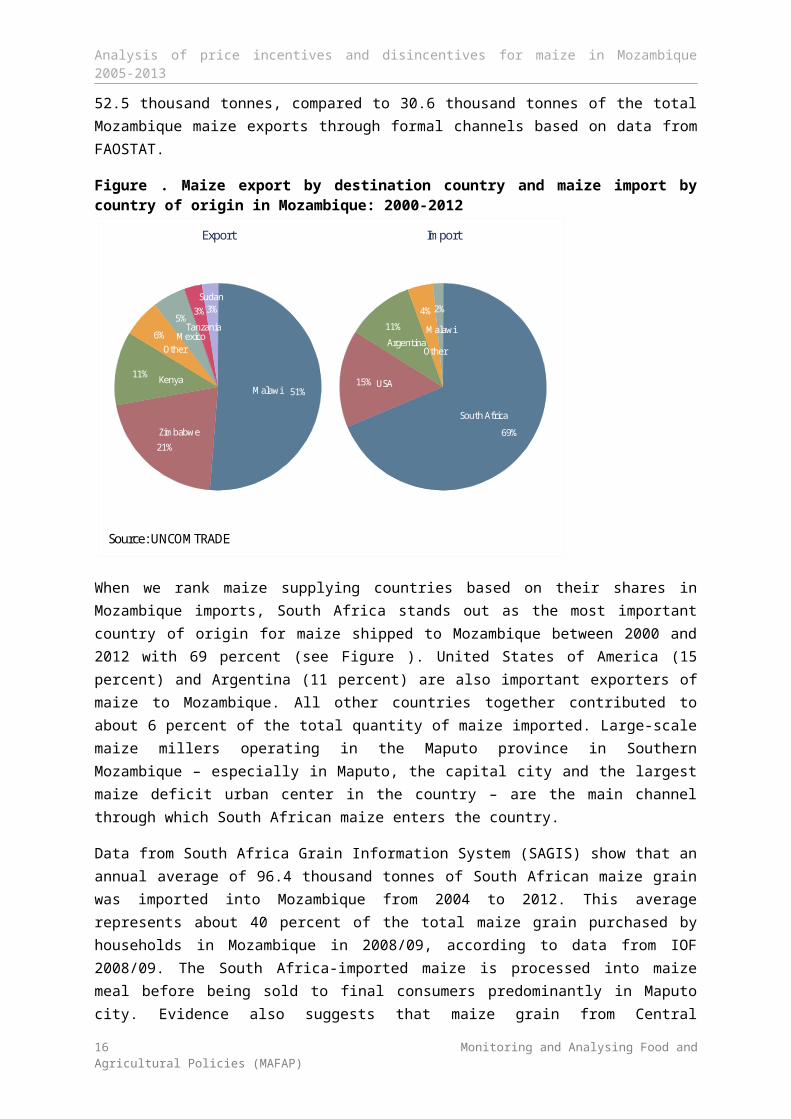
Annual data, spanning 2000 through 2012, on maize exports broken down by destination country and maize imports broken down by country of origin were obtained from UNCOMTRADE. For each country, we took annual figures for maize export from Mozambique and added them to obtain the total export quantity over the period 2000 to 2012. Then we computed the share of each country in the total Mozambique maize exports by dividing each country’s total export volumes to Mozambique by the grand total exports across countries. Similar procedure was used for maize imports from Mozambique. Findings are summarized in Figure . Over the period 2000-2012, maize originated from Mozambique was predominantly exported to few countries in Southern and Eastern Africa. Malawi accounts for 51 percent of the total Mozambique maize exports, followed by Zimbabwe (21 percent) and Kenya (11 percent). The individual contributions of other countries to the total maize exports from Mozambique were 5 percent or lower. Interviews with players along the maize value chain
3 The distance between Maputo (Southern region) and Lichinga (Northern region) is estimated to be about 2,300 kilometers.
12 Monitoring and Analysing Food and Agricultural Policies (MAFAP)
Analysis of price incentives and disincentives for maize in Mozambique 2005-2013
combined with our knowledge of the maize marketing functioning in Mozambique indicate that Southern Malawi, a major maize deficit region, imports maize from Nampula and Zambezia provinces in Northern Mozambique and Tete province in Central Mozambique. Considerable quantities of Mozambique maize that crosses the border into Malawi are traded through informal marketing channels. From 2005 to 2011, data from FEWSNET indicate that annual flow of maize from Mozambique to Malawi through informal channels averaged about 52.5 thousand tonnes, compared to 30.6 thousand tonnes of the total Mozambique maize exports through formal channels based on data from FAOSTAT.
Figure . Maize export by destination country and maize import by country of origin in Mozambique: 2000-2012
51%
21%
11%
6%
5%3% 3%
Malawi
Zimbabwe
Kenya
OtherMexico
Tanzania
Sudan
Export
69%
15%
11%
4% 2%
South Africa
USA
ArgentinaOther
Malawi
Import
Source: UNCOMTRADE
When we rank maize supplying countries based on their shares in Mozambique imports, South Africa stands out as the most important country of origin for maize shipped to Mozambique between 2000 and 2012 with 69 percent (see Figure ). United States of America (15 percent) and Argentina (11 percent) are also important exporters of maize to Mozambique. All other countries together contributed to about 6 percent of the total quantity of maize imported. Large-scale maize millers operating in the Maputo province in Southern Mozambique – especially in Maputo, the capital city and the largest maize deficit urban center in the country – are the main channel through which South African maize enters the country.
Data from South Africa Grain Information System (SAGIS) show that an annual average of 96.4 thousand tonnes of South African maize grain was imported into Mozambique from 2004 to 2012. This average represents about 40 percent of the total maize grain purchased by households in Mozambique in 2008/09, according to data from IOF 2008/09. The South Africa-imported maize is processed into maize meal before being sold to final consumers predominantly in Maputo city. Evidence also suggests that maize grain from Central Mozambique is shipped to Southern Mozambique, especially Maputo city. However, concerns about quality and quantity of the
13 Monitoring and Analysing Food and Agricultural Policies (MAFAP)
Analysis of price incentives and disincentives for maize in Mozambique 2005-2013
domestically produced maize grain are considered as the main factors that make large-scale millers import maize grain from South Africa instead of purchasing from the domestic market.4
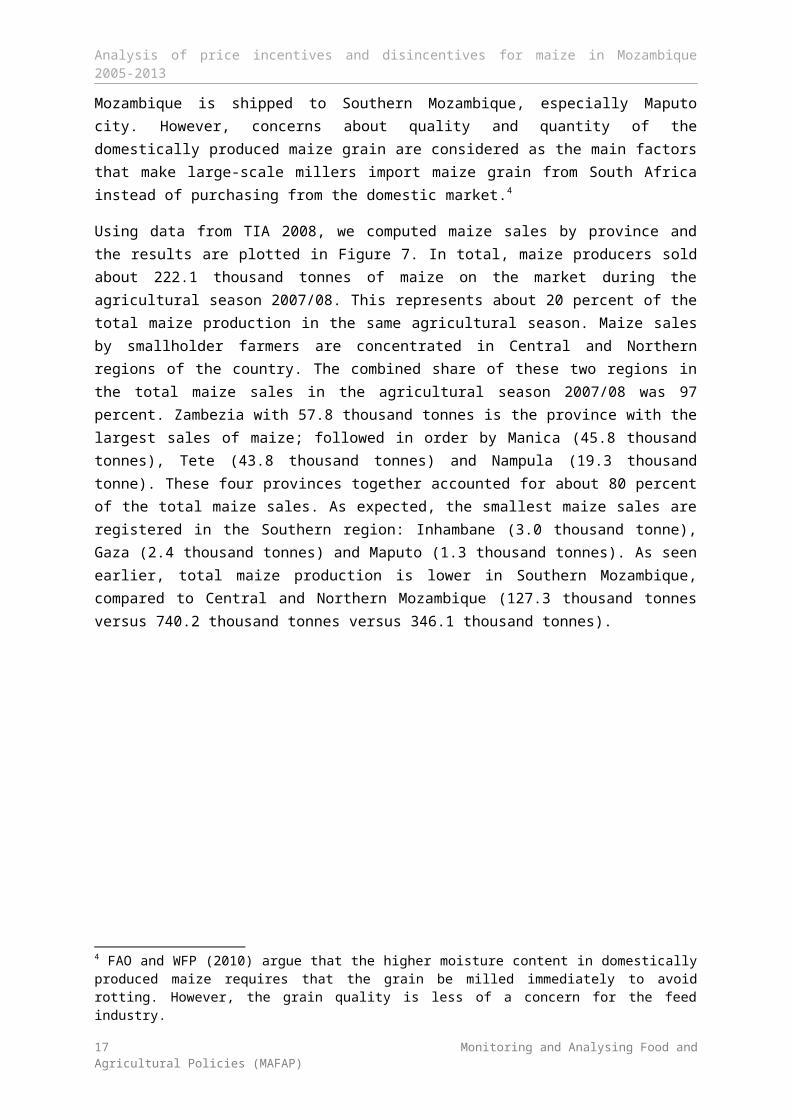
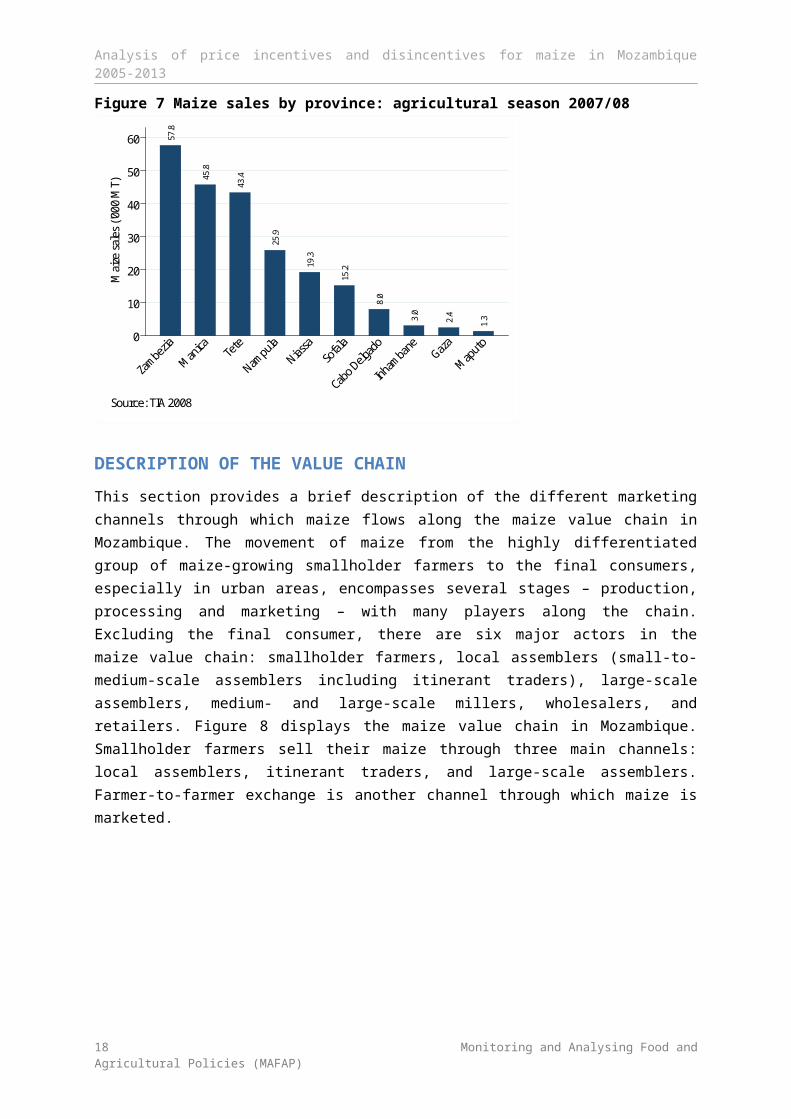
Using data from TIA 2008, we computed maize sales by province and the results are plotted in Figure7. In total, maize producers sold about 222.1 thousand tonnes of maize on the market during the agricultural season 2007/08. This represents about 20 percent of the total maize production in the same agricultural season. Maize sales by smallholder farmers are concentrated in Central and Northern regions of the country. The combined share of these two regions in the total maize sales in the agricultural season 2007/08 was 97 percent. Zambezia with 57.8 thousand tonnes is the province with the largest sales of maize; followed in order by Manica (45.8 thousand tonnes), Tete (43.8 thousand tonnes) and Nampula (19.3 thousand tonne). These four provinces together accounted for about 80 percent of the total maize sales. As expected, the smallest maize sales are registered in the Southern region: Inhambane (3.0 thousand tonne), Gaza (2.4 thousand tonnes) and Maputo (1.3 thousand tonnes). As seen earlier, total maize production is lower in Southern Mozambique, compared to Central and Northern Mozambique (127.3 thousand tonnes versus 740.2 thousand tonnes versus 346.1 thousand tonnes).
Figure 7 Maize sales by province: agricultural season 2007/08
57.8
45.8
43.4
25.9
19.3
15.2
8.0
3.0
2.4
1.3
0
10
20
30
40
50
60
Mai
ze sa
les (
'000
MT)
Zambezia
Manica Te
te
Nampula
Niassa
Sofal
a
Cabo Delg
ado
Inhambane
Gaza
Maputo
Source: TIA 2008
DESCRIPTION OF THE VALUE CHAIN
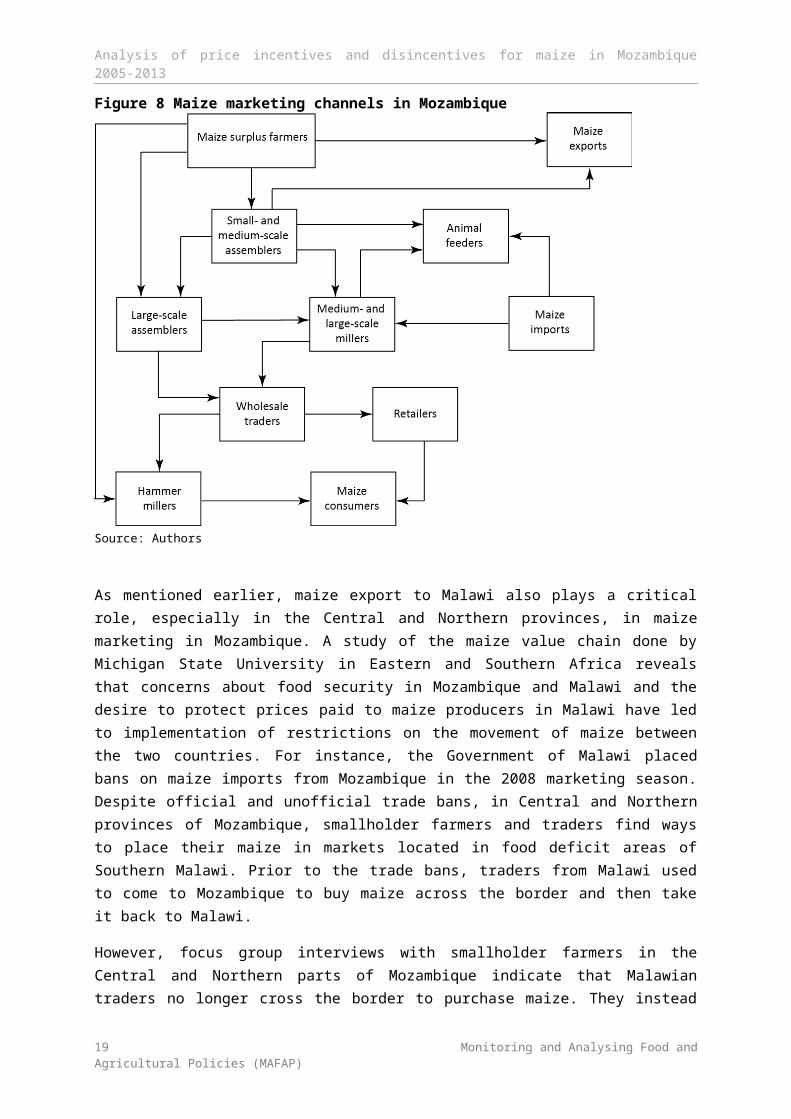
This section provides a brief description of the different marketing channels through which maize flows along the maize value chain in Mozambique. The movement of maize from the highly differentiated group of maize-growing smallholder farmers to the final consumers, especially in urban areas, encompasses several stages – production, processing and marketing – with many players along the chain. Excluding the final consumer, there are six major actors in the maize value chain: smallholder farmers, local assemblers (small-to-medium-scale assemblers including itinerant traders), large-scale assemblers, medium- and large-scale millers, wholesalers, and retailers. Figure 8
4 FAO and WFP (2010) argue that the higher moisture content in domestically produced maize requires that the grain be milled immediately to avoid rotting. However, the grain quality is less of a concern for the feed industry.
14 Monitoring and Analysing Food and Agricultural Policies (MAFAP)
Analysis of price incentives and disincentives for maize in Mozambique 2005-2013
displays the maize value chain in Mozambique. Smallholder farmers sell their maize through three main channels: local assemblers, itinerant traders, and large-scale assemblers. Farmer-to-farmer exchange is another channel through which maize is marketed.
Figure 8 Maize marketing channels in Mozambique
Source: Authors
As mentioned earlier, maize export to Malawi also plays a critical role, especially in the Central and Northern provinces, in maize marketing in Mozambique. A study of the maize value chain done by Michigan State University in Eastern and Southern Africa reveals that concerns about food security in Mozambique and Malawi and the desire to protect prices paid to maize producers in Malawi have led to implementation of restrictions on the movement of maize between the two countries. For instance, the Government of Malawi placed bans on maize imports from Mozambique in the 2008 marketing season. Despite official and unofficial trade bans, in Central and Northern provinces of Mozambique, smallholder farmers and traders find ways to place their maize in markets located in food deficit areas of Southern Malawi. Prior to the trade bans, traders from Malawi used to come to Mozambique to buy maize across the border and then take it back to Malawi.
However, focus group interviews with smallholder farmers in the Central and Northern parts of Mozambique indicate that Malawian traders no longer cross the border to purchase maize. They instead set up buying points in Malawi where the Mozambique smallholder farmers and traders have to take their maize if interested in reaching Malawian markets. Maize grain is also shipped from international markets into Mozambique. For example, South-Africa maize is imported into Mozambique, predominantly in the deficit Southern region, by large-scale millers and animal feeders.
15 Monitoring and Analysing Food and Agricultural Policies (MAFAP)
Analysis of price incentives and disincentives for maize in Mozambique 2005-2013
Assemblers represent the next link in the maize value chain. Local assemblers are residents of the villages, in some cases they live outside the community, who buy maize from smallholder farmers for onward sale to itinerant traders, large-scale traders, and sometimes they export maize to Malawi. Itinerant traders, commonly known as “Mamanas”, are normally comprised of women coming from the Southern region of the country, mainly from Maputo city, to buy and bulk maize in surplus maize villages of Central and Northern Mozambique with the objective of reselling it in the maize deficit markets of Southern Mozambique. Itinerant traders set up buying points in surplus areas. After acquiring large volumes of maize, they rent trucks to transport their maize to Southern markets. Itinerant traders are also involved in the commercialization of other crops such as sesame and beans.
POLICY DECISIONS AND MEASURES
We are not aware of any policy strategy designed by the Government of Mozambique (GoM) specifically for the maize sub-sector to guide production and marketing of the grain in the country. However, a wide range of government policy instruments target the agricultural sector as a whole, touching issues related to maize production and marketing along with other strategic crops. These include the Strategic Plan for Agricultural Development (PEDSA) 2011 to 2020, the National Investment Plan for the Agricultural Sector (PNISA) 2013 to 2017, the Food Production Action Plan (PAPA) 2008 to 2011, and the Green Revolution Strategy (RV) approved in 2007, just to mention a few. In the Southern Africa region, Mozambique is among the few countries where government restrictions are not imposed on maize production and marketing. In this section we describe the relevant policy instruments of intervention used by the government in the recent years.
International and regional trade policy measures
Starting in the late 1980s, Mozambique has experienced several trade-related policy reforms, moving from centrally planned to market-oriented economy. For example, following guidance from the World Bank and the International Monetary Fund (IMF) under the Washington-consensus umbrella, in the later 1980s, the Government of Mozambique (GoM) put in place measures to liberalize markets for almost all sectors of the economy including the agriculture sector. According to Chilonda et al (2012), under this policy reform, prices for all commodities – except sugar and petroleum products – were liberalized.
Mozambique is member of a number of trade organizations and group of countries at both international and regional levels. At international level, the most important organizations are the World Trade Organization (WTO) and the African, Caribbean and Pacific Group of States (ACP). This represents opportunities for Mozambique to enjoy preferential trade agreements, such as Economic Partnership Agreements (EPAs) with the European Union (EU), African Growth and Opportunity Act (AGOA) with the United States. These agreements to some extent facilitate the exchange of commodities between Mozambique and many countries by lessening trade barriers and restrictions.
At regional level, Mozambique belongs to the Southern Africa Development Community (SADC). SADC country members signed their Protocol on Trade in August 1996. The protocol was put into effect in January 2001 and outlined measures to remove trade barriers, ease customs procedures, harmonize trade policies, and prohibit unfair trade practices with the ultimate objective of facilitating economic development in the region. In 2001, the structure of import duties for commodities shipped to Mozambique was as follows: 25 percent for consumer goods, 7.5 percent for intermediate
16 Monitoring and Analysing Food and Agricultural Policies (MAFAP)
Analysis of price incentives and disincentives for maize in Mozambique 2005-2013
goods and 2.5 percent for raw materials. Under the SADC Trade Protocol, Mozambique has been gradually eliminating import duties, but duties on some commodities classified as “sensitive” have experienced smaller reductions. For instance, duties on all cereals – except maize – imported from SADC countries dropped from 2.5 percent in 2008 to zero in 2010. By contrast, with the exception of rice, sorghum, and millet, cereals shipped from the rest of the world to Mozambique are subject to a 2.5 percent import duty. Until 2013, duty on maize imports from South Africa and other SADC countries is set at 2.5 percent. The charge on South Africa maize imports will continue to be in effect until 2015 when it is scheduled to phase down to zero. Maize flour is subject to a duty of 20 percent when imported into Mozambique from SADC or non-SADC countries (Chilonda et al, 2012; Acosta, 2012; MIC, 2004).
According to Tschirley and Abdula (2007) and Chilonda et al (2012), in addition to the 2.5 percent import duty, Mozambique also applies a 17 percent value added tax (VAT) to both maize grain and maize flour. In the case of maize trade between Mozambique and South Africa, this creates an immediate cost disadvantage for the imported product. Since VAT is not applied to domestic production, this measure de facto constitutes a trade policy measure in the form of an import tax. On the other hand, large-scale millers who import maize grain from South Africa and mill it in Maputo are entitled to the full reimbursement of the VAT within three months. However, if imported maize is processed on a small scale or sold in retail markets, the VAT is not reimbursed (Tschirley and Abdula, 2007). Tschirley and Abdula (2007) conclude that due to this imbalance, grain marketed in Southern Mozambique was mostly of domestic origin, while demand from industrial processors is met by imports from South Africa. This explains the preferences of small traders in Maputo to procure maize grain from Central and Northern region of Mozambique, despite the high transport costs, which keeps the prices in Maputo market considerably higher compared to other regions of the country.
Marketing and price policies
After moving from centrally planned to market-oriented economy, commodity prices in Mozambique are generally determined by market forces with minimal government interventions. From time to time, the GoM imposes price controls on a few basic commodities in an attempt to protect vulnerable groups in both rural and urban areas and to contribute to some degree to poverty alleviation, and food and nutrition security (Chilonda et al, 2012; Cunguara, 2012). For example, in response to the sharp spike in food price experienced in 2008, the GoM introduced price subsidies (diesel, wheat, rice, cooking oil, water and electricity) after violent riots erupted in urban areas, especially Maputo city. Rapid increases in commodity prices seen 2010 also led to violent protests in urban areas, and the government again responded by reintroducing fuel and food price subsidies. Acording to Cunguara (2012), during both food riots (February 2008 and September 2010), some people were killed and several entities were paralyzed. Despite the relatively high importance of maize in food consumption, especially in rural areas, maize was not among the subsidized commodities. However, subsidized fuel prices would indirectly have an impact on maize prices because fuel is used as an intermediate input for maize production and milling.
Under the Food Production Action Plan (PAPA) formulated in 2008 and started in 2009 as a strategy in response to the worldwide 2007/08 food price crisis, the GoM began to build strategic silos for storage of cereals, including maize, in all provinces of the country except Maputo and Inhambane
17 Monitoring and Analysing Food and Agricultural Policies (MAFAP)
Analysis of price incentives and disincentives for maize in Mozambique 2005-2013
provinces, with the aim to reach a total capacity of 143 thousand tonnes by 2011. 5 The rationale behind this policy is to stabilize domestic cereals price increases and to minimize trasmission of price spikes from international to domestic markets. More recently, in 2013, the GoM launched the Mozambique Commodity Exchange through which the cereals reservoir kept in the silos could be traded.
High prices of imported inputs, especially fertilizer, are among the factors that prevent smallholder farmers from having access to yield-boosting inputs – required to increase productivity for maize and other crops – when they are available in local markets. Three main factors contribute to these high prices: government policy regarding fertilizer importation and marketing, high transport costs, and farmers’ lack of information concerning efficient use of fertilizer. Benson, Cunguara and Tewodaj (2012) argued that government regulations on fertilizer impose indirect costs on fertilizer importers by increasing transaction costs related but not limited to time and financial means required to register and to pay annual license fees as a fertilizer importer. These increased transaction costs are then passed on to farmers. The GoM has tried to put in place some measures to promote farmers’ use of inputs to boost their productivity. It is worth mentioning that removal of import tariffs under the SADC Trade Protocol should have contributed to some extent to lowering fertilizer prices.
Agricultural input measures and subsidies
The GoM introduced a 10 percent subsidy on electricity (measured as kilowatt-hour) prices in 2010. This measure was seen as an incentive to promote domestic food and non-food industries, especially those that use large volumes of electricity in their production processes. Maize farmers, consumers, and millers direct or indirectly benefited from this government subsidy since maize milling processes consume substantial quantities of energy. On the other hand, according to FAO and WFP (2010), in 2010, the GoM began to gradually phase down fuel subsidies introduced in 2008 to align domestic prices with international market price; this resulted in progressive increases in domestic fuel prices. However, as a complementary strategy, the GoM subsidized public transport to minimize the impact of the rising fuel prices on the poor.
In 2010, the government introduced credit subsidies totaling USD 25 million for providing low interest loans to small farmers to support cereals’ planting season. Maize producers also benefited from this government subsidy.
A two-year Agricultural Input Subsidy Program was introduced in 2009 and targeted 25 thousand producers in five provinces and 17 districts (Chilonda et al, 2012). Through the programme, farmers received either a rice input pack (40 kilograms of seed and 2 bags of fertilizer) or maize input pack (12.5 kilogram of seed and 2 bags of fertilizer). Own contribution of farmers consisted of 30 percent of the cost of inputs. According to the Economic and Social Plan 2012, government projections indicate that the measure has had a short term positive impact on increasing production and productivity of smallholder farmers in rural areas; although no specific data on this impact are available. The unavailability of data on the amount of subsidies targeting maize farmers hampers the identification of the real impact of this policy. Public expenditure analysis, which is
5 We do not know whether this silo capacity has been fully installed, but we are aware that some silos have been built. For instance, Tostao and Tschirley (2010) documented that six silos with aggregate capacity of 50 thousand tonnes were built in Tete province by January 2009.
18 Monitoring and Analysing Food and Agricultural Policies (MAFAP)
Analysis of price incentives and disincentives for maize in Mozambique 2005-2013
being undertaken under the MAFAP project, could provide useful insights on the exact level of budgetary transfers to maize farmers.
19 Monitoring and Analysing Food and Agricultural Policies (MAFAP)
Analysis of price incentives and disincentives for maize in Mozambique 2005-2013
3. METHODOLOGY
MAFAP methodology seeks to measure price incentives for producers and other marketing agents in key agricultural value chains. The analysis is based on the comparison between observed domestic prices and constructed reference prices. Reference prices are calculated from the international price of the product at the country’s border, where the product enters the country (if imported) or exits the country (if exported). This price is considered the benchmark price free of influence from domestic policies and markets. MAFAP estimates two types of reference prices – observed and adjusted. Observed reference prices are those that producers and other marketing agents could receive if the effects of distortions from domestic market and trade policies, as well as overall market performance, were removed. Adjusted reference prices are the same as observed reference prices, but also exclude the effects of any additional distortions from domestic exchange rate policies, structural inefficiencies in the commodity’s value chain, and imperfect functioning and non-competitive pricing in international markets.
MAFAP’s price incentives analysis is based on the law of one price, which is the economic theory that there is only one prevailing price for each product in a perfectly competitive market. This law only applies in the case of homogeneous goods, if information is correct and free, and if transaction costs are zero. Thus, this analysis was conducted for goods that are either perfectly homogeneous or perfect substitutes in the local market in terms of quality, or, failing that, are simply comparable goods. Indicators calculated from reference and domestic prices will, therefore, reveal whether domestic prices represent support (incentives) or a tax (disincentives) to various agents in the value chain.
Domestic prices are compared to reference prices at two specific locations along commodity value chains – the farm gate (usually the main production area for the product) and the point of competition (usually the main wholesale market where the domestic product competes with the internationally traded product). The approach for comparing prices at each location is summarized below, using an imported commodity as an example. In this situation, the country is importing a commodity that arrives in the port at the benchmark price (usually the unit value CIF price at the port of entry). In the domestic market, we observe the price of the same commodity at the point of competition, which is in this case the wholesale market, and at the farm gate. We also have information on observed access costs, which are all the costs associated with bringing the commodity to market, such as costs for processing, storage, handling, transport and the different margins applied by marketing agents in the value chain. These include access costs between the border and wholesale, as well as between the farm gate and wholesale.
The benchmark price is made comparable to the domestic price at wholesale by adding the access costs between the border and wholesale, resulting in the observed reference price at wholesale. This takes into account all the costs incurred by importers and other agents to bring the commodity to market, which in effect, raises the price of the commodity. The reference price at wholesale is further made comparable to the domestic price at the farm gate by deducting the access costs between the farm gate and wholesale, resulting in the observed reference price at farm gate. This takes into account all the costs incurred by farmers and other agents to bring the commodity from the farm to
20 Monitoring and Analysing Food and Agricultural Policies (MAFAP)
Analysis of price incentives and disincentives for maize in Mozambique 2005-2013
the wholesale market. Mathematically, the equations for calculating the observed reference prices at wholesale (RP¿¿owh)¿and farm gate (RPofg )for an imported commodity are as follows:
RPowh=Pb+AC owh
RPofg=RPowh−ACofg
where ACowh are the observed access costs from the border to wholesale, including handling costs at the border, transport costs from the border to the wholesale market, profit margins and all observed taxes and levies, except tariffs, and Pb is the benchmark price. ACofg are the observed access costs from the farm gate to wholesale, including handling costs at the farm, transport costs from farm to wholesale market, processing, profit margins and all observed taxes and levies.
The same steps described above can be taken a second time using benchmark prices and access costs that have been adjusted to eliminate market distortions due to exchange rate misalignments, structural inefficiencies in the commodity’s value chain6 and imperfect functioning and non-competitive pricing in international markets, where possible and relevant. The adjusted benchmark prices and access costs are then used to generate a second set of adjusted reference prices, in addition to the first set of observed reference prices calculated.
For exported commodities, a slightly different approach is used. In this case, the border is generally considered the point of competition (wholesale), and the unit value FOB price for the commodity is normally taken as the benchmark price. Furthermore, observed and adjusted reference prices at wholesale are obtained by subtracting, rather than adding, the access costs between the border and wholesale. Mathematically, the equations for calculating the observed reference prices at wholesale (RP¿¿owh)¿and farm gate (RPofg )for an exported commodity are as follows:
RPowh=Pb−ACowh
RPofg=RPowh−ACofg
After observed and adjusted reference prices are calculated for the commodity, they are subtracted from the domestic prices at each point in the value chain to obtain the observed and adjusted price gaps at wholesale and farm gate. Observed price gaps capture the effect of distortions from trade and market policies directly influencing the price of the commodity in domestic markets (e.g. price ceilings and tariffs), as well as overall market performance. Adjusted price gaps capture the same as the observed, in addition to the effect of any distortions from domestic exchange rate policies, structural inefficiencies in the commodity’s value chain, and imperfect functioning and non-competitive pricing in international markets. Mathematically, the equations for calculating the observed price gaps at wholesale (PG¿¿owh)¿and farm gate (PGofg)are as follows:
PGowh=Pwh−RPowh
PGofg=Pfg−RPofg
6 Structural inefficiencies in commodity value chains may include government taxes and fees (excluding fees for services), high transportation and processing costs, high profit margins captured by various marketing agents, bribes and other non-tariff barriers.
21 Monitoring and Analysing Food and Agricultural Policies (MAFAP)
Analysis of price incentives and disincentives for maize in Mozambique 2005-2013
where Pfg is the domestic price at farm gate, RPofg is the observed reference price at farm gate, Pwh is the domestic price at wholesale, and RPowh is the observed reference price at wholesale.
A positive price gap, resulting when the domestic price exceeds the reference price, means that the policy environment and market functioning as a whole generate incentives (support) to producers or wholesalers. For an imported commodity this could be due to distortions such as the existence of an import tariff. On the other hand, if the reference price exceeds the domestic price, resulting in a negative price gap, this means that the policy environment and market functioning as a whole generate disincentives (taxes) to producers or wholesalers. For an imported commodity this could be due to distortions such as a price ceiling established by the government to keep domestic prices low.
In general, price gaps provide an absolute measure of the market price incentives (or disincentives) that producers and wholesalers face. Therefore, price gaps at wholesale and farm gate are divided by their corresponding reference price and expressed as a ratio, referred to as the Nominal Rate of Protection (NRP), which can be compared between years, commodities, and countries.
The Observed Nominal Rates of Protection at the farm gate (NRPofg¿and wholesale¿) are defined by the following equations:
NRPofg=PGofgRPofg
;NRPowh=PGowh
RPowh
where PGofgis the observed price gap at farm gate, RPofgis the observed reference price at the farm gate,PGowhis the observed price gap at wholesale and RPowh is the observed reference price at wholesale.
Similarly, the Adjusted Nominal Rates of Protection at the farm gate (NRP¿¿afg)¿ and wholesale¿) are defined by the following equations:
NRPafg=PGafgRPafg
;NRPawh=PGawhRPawh
where PGafgis the adjusted price gap at farm gate, RPafgis the adjusted reference price at the farm gate,PGawhis the adjusted price gap at wholesale and RPawh is the adjusted reference price at wholesale.
If public expenditure allocated to the commodity is added to the price gap at farm gate when calculating the ratios, the Nominal Rate of Assistance (NRA) is generated. This indicator summarizes the incentives (or disincentives) due to policies, market performance and public expenditure. 7 Mathematically, the Nominal Rate of Assistance is defined by the following equation:
NRA=PGafg+PEcspRF afg
7 The NRA indicator was not calculated for any of the commodities analyzed because of insufficient data on public expenditure. However, it will be developed in the forthcoming reports, as the public expenditure analysis is improved and better data are made available.
22 Monitoring and Analysing Food and Agricultural Policies (MAFAP)
Analysis of price incentives and disincentives for maize in Mozambique 2005-2013
where PEcsp is commodity-specific public expenditure that has been identified and measured as monetary units per tonne.
Finally, MAFAP methodology estimates the Market Development Gap (MDG), which is the portion of the price gap that can be attributed to “excessive” or inefficient access costs within a given value chain, exchange rate misalignments, and imperfect functioning of international markets. “Excessive” access costs may result from factors such as poor infrastructure, high processing costs due to obsolete technology, government taxes and fees (excluding fees for services), high profit margins captured by various marketing agents, bribes and other non-tariff barriers. Therefore, the total MDG at farm gate is comprised of three components – gaps due to “excessive” access costs, the exchange rate policy gap and the international market gap. When added together, these components are equivalent to the difference between the observed and adjusted price gaps at farm gate.
Similar to the price gaps calculated, the MDG is an absolute measure, which is also expressed as a ratio to allow for comparison between years, commodities, and countries. This relative indicator of the total MDG affecting farmers is derived by calculating the ratio between the total MDG at farm gate and the adjusted reference price at farm gate as follows:
MDG fg=(ACGwh+ACG fg+EXPG+ IMG)
RPafg
where ACGwh is the access cost gap at wholesale defined as the difference between observed and adjusted access costs at wholesale, ACGfg is the access cost gap at farm gate defined as the difference between observed and adjusted access costs at the farm gate, ERPG is the exchange rate policy gap, and IMG is the international market gap.
A more detailed description of the methodology applied in this analysis is available on MAFAP’s website at www.fao.org/in-action/mafap.
23 Monitoring and Analysing Food and Agricultural Policies (MAFAP)
Analysis of price incentives and disincentives for maize in Mozambique 2005-2013
4. DATA REQUIREMENTS AND CALCULATION OF INDICATORS
To calculate MAFAP’s price incentives indicators, several types of data are needed. This section presents the data that was obtained and methodological decisions that were taken in this analysis.
TRADE STATUS OF THE PRODUCT
Volumes of maize net imports are shown in Figure 6 in the Marketing and Trade section. As mentioned earlier, in every single year between 2005 and 2011, maize imports exceeded maize exports. Although volumes of maize imports and exports are not available for 2012 and 2013, we assumed that imports continued to outweigh exports in those two years. This assumption is supported by market observations and interviews with agents in the maize supply chain, especially in Southern Mozambique where large-scale maize millers rely heavily on maize supplies from South Africa. Hence Mozambique is considered as a maize importer throughout the period under analysis (2000 to 2013). As mentioned earlier (see Figure 7 and related discussion), South Africa is the main maize supplier, contributing to nearly 70 percent of the total Mozambique maize imports over the period 2000- 2012.
To assess the share of maize trade (imports plus exports) on apparent domestic consumption, we computed the trade intensity (TI) defined as:
where denotes trade intensity in year , represents volumes of maize imports in year ,
represents volumes of maize exports in year , and denotes domestic maize production in year . To compute our estimates of trade intensity over the period 2005 to 2011, we used data on maize production imports and exports, obtained from FAOSTAT. Our findings are plotted in Figure 9. From 2005 to 2006, trade intensity increased by six percentage points, reaching historical high of 22 percent over the period between 2005 and 2011. In 2007, trade intensity plummeted, reaching historical low of 3 percent. Since then, trade intensity oscillated but it was never higher than 8 percent. From 2005 to 2011, trade intensity averaged 9 percent. This low trade intensity suggests that unit value of maize imports may not be a good proxy for the opportunity costs of domestic production, as argued in the MAFAP methodological implementation guide. In this case, wholesale prices in the country where maize is imported from would be a better proxy.
The period between 2007 and 2011 coincides with the period when food commodity prices in the international market experienced a sharp rise, reaching historical high since 1970. Commodity price data from the World Bank show that international maize prices increased by 34 percent in 2007 and 83 percent in 2008, compared to 2006. Average maize net imports in Mozambique dropped from 193 thousand tonnes for the period 2005-2006 to 67 thousand tonnes for the period 2007-2011, representing a 65 percent reduction. Unusually, in some months of 2007, maize prices in South Africa were up to 10 percent higher than in Maputo. In that year, average annual wholesale maize price in Maputo were similar to those observed in South Africa (USD 245.9 per tonne versus USD 244.5 per
24 Monitoring and Analysing Food and Agricultural Policies (MAFAP)
Analysis of price incentives and disincentives for maize in Mozambique 2005-2013
tonne). In the other years between 2005 and 2013 maize prices were, on average, at least 35 percent higher in Maputo than in South Africa (see Figure 10).
Figure 9 Maize trade intensity in Mozambique: 2005 through 2011
16.1
22.0
3.0
7.45.8
4.3
6.3
0
5
10
15
20
25
Trad
e in
tens
ity (%
)
20052006
20072008
20092010
2011
Source: FAOSTAT
Figure 10 Wholesale maize prices in Maputo and South Africa
0
100
200
300
400
500
600
Pric
e (U
SD/M
T)
2005Jan
2005Jul
2006Jan
2006Jul
2007Jan
2007Jul
2008Jan
2008Jul
2009Jan
2009Jul
2010Jan
2010Jul
2011Jan
2011Jul
2012Jan
2012Jul
2013Jan
2013Jul
2014Jan
Year & month
Maputo South Africa
Source: SIMA and SAFEX
MARKET PATHWAY ANALYSED
The domestic maize pathway we considered in this study is that of production in Central Mozambique (maize surplus region) and consumption in Southern Mozambique (maize deficit region). As discussed earlier, Mozambique also imports considerable volumes of maize and South Africa stands out as the dominant supplier. Nearly all maize imports from South Africa are directed to Maputo where maize is processed into flour by large-scale millers. Maputo is the largest city and the major maize deficit market in the country, generating considerable demand for maize. For this reason, we consider Maputo as the point of competition. Domestic maize grain surplus –
25 Monitoring and Analysing Food and Agricultural Policies (MAFAP)
Analysis of price incentives and disincentives for maize in Mozambique 2005-2013
predominantly from Central Mozambique – flow to Maputo, competing to some extent with maize grain imported from South Africa. For these reasons, our analysis of the price incentives focuses on Southern Mozambique, more specifically on Maputo city, as the point of competition. Ressano Garcia (on Mozambique side) is the main border through which South African maize enters Mozambique. The border is located about 96 kilometers from Maputo (Mozambique capital city) and 474 kilometers from Johannesburg (South Africa capital city). Our analysis focuses on this market pathway on the import side.
From the domestic production viewpoint, Manica province ranks third only to Tete and Zambezia provinces in terms of maize production and cultivated area under maize (see Figure 2 in the section on Production). Among these three provinces, Manica is the closest one to Maputo located about 1,200 kilometers away from Chimoio (the capital city of Manica). Maize surplus from Tete and Zambezia provinces flows predominantly to Southern Malawi. For considerable portion of the period analyzed in this technical note (2005 to 2013), Zambezi River – the fourth largest river in Africa – was a natural trade barrier preventing the ease flow of maize from Northern Mozambique (including Zambezia province) to Central and Southern Mozambique. This is because there was no bridge over the Zambezi River up until August 2009, dividing the country into two separate marketing segments. For these reasons, we considered Manica province as the main domestic maize producing area for our analysis of price incentives. Availability of price data at farm-gate level was the main reason we considered to choose Chimoio as the reference market. Maize prices at farm-gate level are available for Chimoio market throughout our period of analysis. It is worth mentioning that we could also analyze the market pathway in Northern Mozambique where domestic maize is predominantly exported to Southern Malawi. However, lack of data – more specifically prices, access cost, and import and production volumes over time – prevented us from undertaking the price incentives analysis in Northern Mozambique.
26 Monitoring and Analysing Food and Agricultural Policies (MAFAP)
Analysis of price incentives and disincentives for maize in Mozambique 2005-2013
BENCHMARK PRICES
Observed
Analysis of price incentives for Mozambique maize requires that benchmark prices are established in order to compute reference prices against which domestic prices are compared. Benchmark prices for maize represent the price free of domestic policy and market distortions. Since Mozambique is a net importer of maize during the period 2005 to 2013, we considered CIF maize prices as the benchmark prices.8 We obtained historical daily wholesale maize prices in Johannesburg from the South African Futures Exchange (SAFEX), a subsidiary of the Johannesburg Stock Exchange. SAFEX prices cover the period from January 2000 to December 2013. We averaged daily SAFEX prices within each month and year to obtain monthly prices. Then annual SAFEX prices were computed by averaging monthly prices within each year. A study by Meeuws (2004) on trade and transport facilitation in Mozambique estimated that road transport cost from Maputo to Johannesburg averaged 0.06 USD/tonne/Km in 2004. We took this estimate of road transport cost and multiplied it by annual consumer price index (CPI) – obtained from Mozambique National Institute of Statistics (INE) and using 2004 as the base year – to obtain estimates of road transport cost for each year over the period 2005 to 2013. Then, these annual estimates were multiplied by the distance between Johannesburg and Ressano Garcia (border between South Africa and Mozambique) to get estimates of transport cost from Johannesburg to Ressano Garcia, measured in USD/tonne. 9 Finally, our estimates of CIF prices for maize are computed by adding road transport cost (from Johannesburg to Ressano Garcia) to SAFEX maize prices, both measured in USD/tonne. We plotted SAFEX prices and 8 CIF stands for cost, insurance and freight.9 The distance between Johanneburg to Ressano Garcia is estimated to be 474 Km.
27 Monitoring and Analysing Food and Agricultural Policies (MAFAP)
Border
Point of competition
Producing area
Analysis of price incentives and disincentives for maize in Mozambique 2005-2013
CIF prices for maize in Figure 11. This figure shows that CIF maize prices fluctuated with an upward trend, increasing from 137 USD/tonne in 2005 to 346 USD/tonne in 2012 to 297 USD/tonne in 2013 (see also Table 1).
Table 1 SAFEX maize price, transport cost and CIF maize prices2005 2006 2007 2008 2009 2010 2011 2012 2013
SAFEX price (USD/tonne) 108.6 181.9 244.5 225.2 186.8 164.8 260.0 293.7 243.1Transport cost (USD/tonne/Km) 0.06 0.06 0.07 0.08 0.09 0.09 0.10 0.11 0.11Distance (Km) 474 474 474 474 474 474 474 474 474Transport cost (USD/tonne) 28.4 30.5 34.3 37.1 40.9 42.3 47.6 52.5 53.6CIF price (USD/tonne) 137.1 212.4 278.8 262.3 227.7 207.0 307.6 346.2 296.7
Figure 11 CIF maize prices in Mozambique: 2005 – 2013
0
50
100
150
200
250
300
350
Pric
e (U
SD/M
T)
2005 2006 2007 2008 2009 2010 2011 2012 2013
Year
SAFEX price CIF priceLinear trend of CIF price
Adjusted
We have no information to support the argument that CIF prices, used as benchmark prices, reflect market distortions, leading to higher or lower import prices for maize in Mozambique. For this reason, no adjustments were made to our estimates of benchmark prices for maize.
DOMESTIC PRICES
Observed prices at point of competition
From the discussion above, we consider Maputo as the major deficit area in the country and it is seen as the point of competition between domestic maize and maize imports from South Africa. Monthly wholesale maize prices in Maputo were gathered from the Agricultural Market Information System (SIMA) of the Mozambique Ministry of Agriculture (MINAG). We took these monthly prices and averaged them to obtain estimates of annual wholesale maize prices for each year over the period 2005 through 2013. Figure 12 shows average wholesale maize prices in Maputo which experienced an upward trend from 2005 to 2013. Our estimates indicate that wholesale maize prices grew at an
28 Monitoring and Analysing Food and Agricultural Policies (MAFAP)
Analysis of price incentives and disincentives for maize in Mozambique 2005-2013
average annual rate of 10 percent, rising from 5 800 MZN/tonne in 2005 to 13 400 MZN/tonne in 2013. This upward trend in Maputo is not surprising because comparable growth rates of maize prices were registered in South Africa with 7 percent and international market with 10 percent during the same period.
Figure 12 Wholesale and farm gate prices for maize in Mozambique
5.8
3.5
6.2
4.0
6.3
3.4
10.2
6.2
10.1
6.9
11.5
7.4
10.8
7.8
11.3
6.6
13.4
8.5
0.0
2.5
5.0
7.5
10.0
12.5
15.0
Pric
e ('0
00 M
ZN/M
T)
2005 2006 2007 2008 2009 2010 2011 2012 2013
Wholesale level (Maputo) Farm gate level (Chimoio)
Observed prices at farm gate
We obtained monthly farm-level maize prices from January 2005 to December 2013 in Chimoio from SIMA. Using monthly prices, we computed average annual maize prices at farm-gate. Annual maize prices in Chimoio are plotted in Figure 13 above. This Figure indicates that farm-level maize prices in Chimoio are lower than wholesale maize prices in Maputo throughout the period under analysis, as expected. Comparing farm- and wholesale-level prices from 2005 to 2013, maize prices are on average about 40 percent lower in Chimoio than in Maputo. The annual growth rate of Chimoio maize prices averaged about 11 percent over the period 2005 through 2013. This growth rate is comparable to that registered in Maputo for wholesale maize prices.
EXCHANGE RATES
Observed
We gathered monthly exchange rates between the Mozambique Metical (MZN) and the United States Dollar (USD) from the Mozambique Central Bank. We averaged monthly exchange rates to obtain annual exchange rates and the results are summarized in Table 2 below.
Table 2 Nominal exchange rate (MZN/USD)
Year 2005 2006 2007 2008 2009 2010 2011 2012 2013Exchange rate (MZN/USD) 23.1 25.0 25.6 24.2 26.7 33.0 28.9 28.4 29.8
Source: Mozambique Central Bank
29 Monitoring and Analysing Food and Agricultural Policies (MAFAP)
Analysis of price incentives and disincentives for maize in Mozambique 2005-2013
Adjusted
We did not make any adjustments to the exchange rates because we are not aware of any explicit exchange rate policy or foreign currency controls undertaken by the Government of Mozambique over the period under analysis.
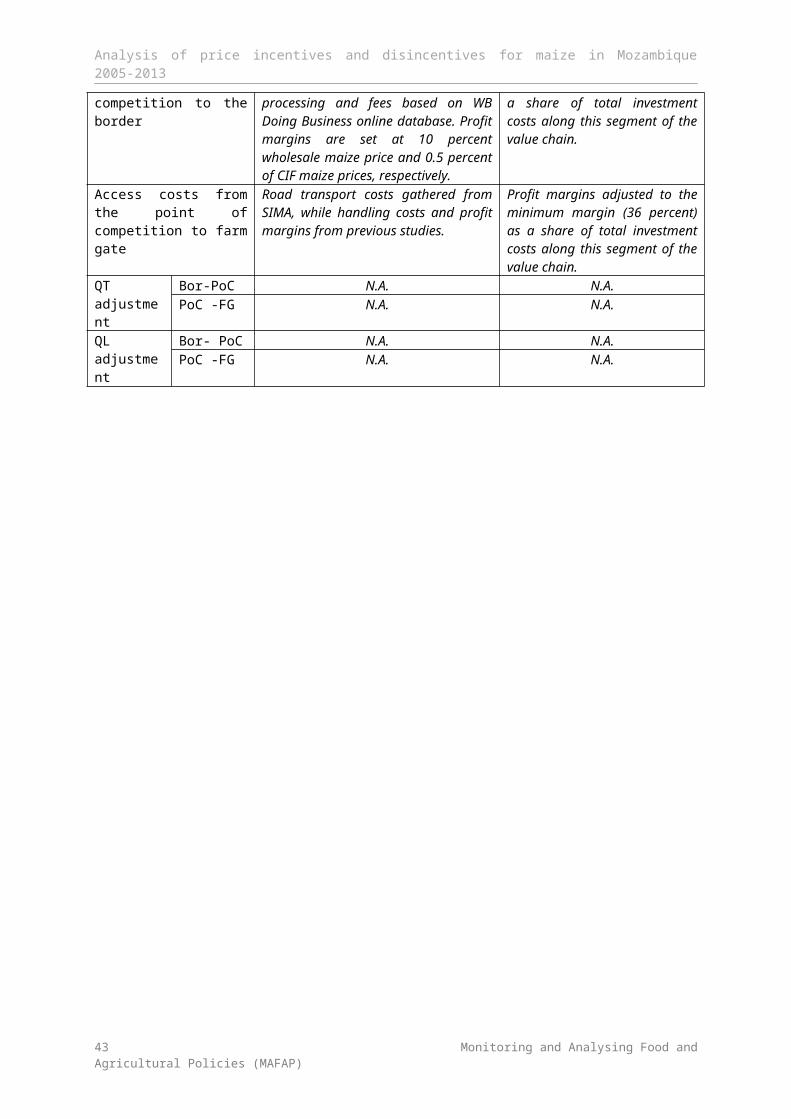
ACCESS COSTS
Observed
Border to point of competition
As mentioned earlier, estimates from a study by the World Bank (2004) pointed out that road transport cost from Maputo to Johannesburg averaged 0.06 USD/tonne/Km in 2004. Our estimates of the transport costs for other years are computed by deflating the 2004 transport cost using CPI for each year between 2005 and 2013, considering 2004 as the base year. We then took the resulting estimates and multiplied them by the distance between Ressano Garcia and Maputo. We finally converted these estimates of transport costs into MZN/tonne by multiplying them by exchange rates between MZN and USD. Our estimates of costs related to customs and processing of paperwork required to import commodities into Mozambique are obtained from the World Bank doing business data.
Based on our interviews with players in the maize value chain and our knowledge of maize marketing in Mozambique, we assumed that profit margins are 10 percent of wholesale maize prices and costs associated with customs brokers represent 0.5 percent of CIF maize prices. Access costs from the border to point of competition are summarized in Table 3 below. Between 2005 and 2013, this table shows that access costs for this segment ranged from 1,891 MZN/tonne in 2005 to 3,993 MZN/tonne in 2013.
Table 3 Observed access costs (MZN/tonne of maize grain)2005 2006 2007 2008 2009 2010 2011 2012 2013
Border to point of competition (96.3 Km)Transport 143 174 193 201 229 320 309 309 339Margins 583 623 627 1,023 1,006 1,150 1,080 1,126 1,335Handling 1,165 1,444 1,589 1,494 1,936 2,394 2,049 2,199 2,320Total 1,891 2,241 2,409 2,718 3,171 3,864 3,438 3,633 3,993
Point of competition to farm gate (1,149 Km)Transport 873 896 1,160 1,413 1,103 1,138 1,252 1,252 1,034Margins 1,798 1,923 1,935 3,156 3,103 3,549 3,334 3,474 4,120Handling 49 55 60 66 68 77 85 86 90Others 38 43 46 51 53 60 66 67 70Total 2,758 2,917 3,202 4,686 4,327 4,822 4,737 4,880 5,314
Farm gate to point of competition
We gathered estimates of transport cost, measured in MZN/tonne/Km, from SIMA for each year between 2005 and 2013. We multiplied these estimates with the distance between Chimoio and Maputo (estimated to be 1,149 Km) to get estimates of transport costs measured in MZN/tonne. We obtained estimates of costs related to marketing of maize in 2013 from a study of the maize and rice
30 Monitoring and Analysing Food and Agricultural Policies (MAFAP)
Analysis of price incentives and disincentives for maize in Mozambique 2005-2013
value chains in Mozambique commissioned by the National Directorate for Promotion of Rural Development (DNPDR) under the Mozambique Ministry of Planning and Development (MPD). The study classified the marketing costs into the following categories: truck loading and unloading, accommodation, and other costs. We took each component of the 2013 estimated costs and deflated them using the CPI – considering 2013 as the base year – to compute estimates for other years between 2005 and 2012. The DNPDR study also provided estimates of wholesalers’ profits in 2013. These profits represented about 31 percent of wholesale maize price in 2013. We took this share and multiplied it by wholesale maize prices for each year to compute wholesalers’ profits for years between 2005 and 2012. Results are summarized in Table 3 above. Over the period 2005 to 2013, access costs from farm gate to point of competition doubled, increasing from 2,758 MZN/tonne in 2005 to 5,314 MZN/tonne in 2013.
Adjusted
Border to point of competition
We computed the proportion of profit margins in total investment costs (operational and financial costs plus price paid to purchase imported maize). From 2005 to 2013, the margins shares of the total investment costs ranged from 7 percent in 2007 to 13 percent in 2005. Given our knowledge about the functioning of maize markets in Mozambique, we believe that these shares represent excessive profit margins. We therefore adjusted profit margins for every year using the minimum margins share of 7 percent during 2005-2013 because we could not obtain a more reliable estimate of profit margins. Findings are reported in Table 4.
Table 4. Adjusted access costs (MZN/tonne of maize grain)2005 2006 2007 2008 2009 2010 2011 2012 2013
Border to point of competition (96.3 Km)Transport 143 174 193 201 229 320 309 309 339Margins 314 487 626 565 579 671 791 866 809Handling 1,165 1,444 1,589 1,494 1,936 2,394 2,049 2,199 2,320Total 1,622 2,105 2,408 2,260 2,745 3,385 3,149 3,374 3,467
Point of competition to farm gate (1,149 Km)Transport 873 896 1,160 1,413 1,103 1,138 1,252 1,252 1,034Margins 1,613 1,783 1,688 2,794 2,935 3,109 3,304 2,896 3,487Handling 49 55 60 66 68 77 85 86 90Others 38 43 46 51 53 60 66 67 70Total 2,574 2,778 2,955 4,324 4,159 4,383 4,707 4,302 4,681
Farm gate to point of competition
Profit margins for this segment were adjusted using the same procedure used to adjust profit margins between the border and point of competition. Before adjustments, profit margins as proportion of the total investment costs oscillated from year to year between 2005 and 2013, with a minimum of 36 percent in 2011 and a maximum of 43 percent in 2012. The minimum share of profit margins in the total investment costs over the period 2005 to 2013 was used as a benchmark to adjust profit margins for each year. Results are summarized in Table 4.
31 Monitoring and Analysing Food and Agricultural Policies (MAFAP)
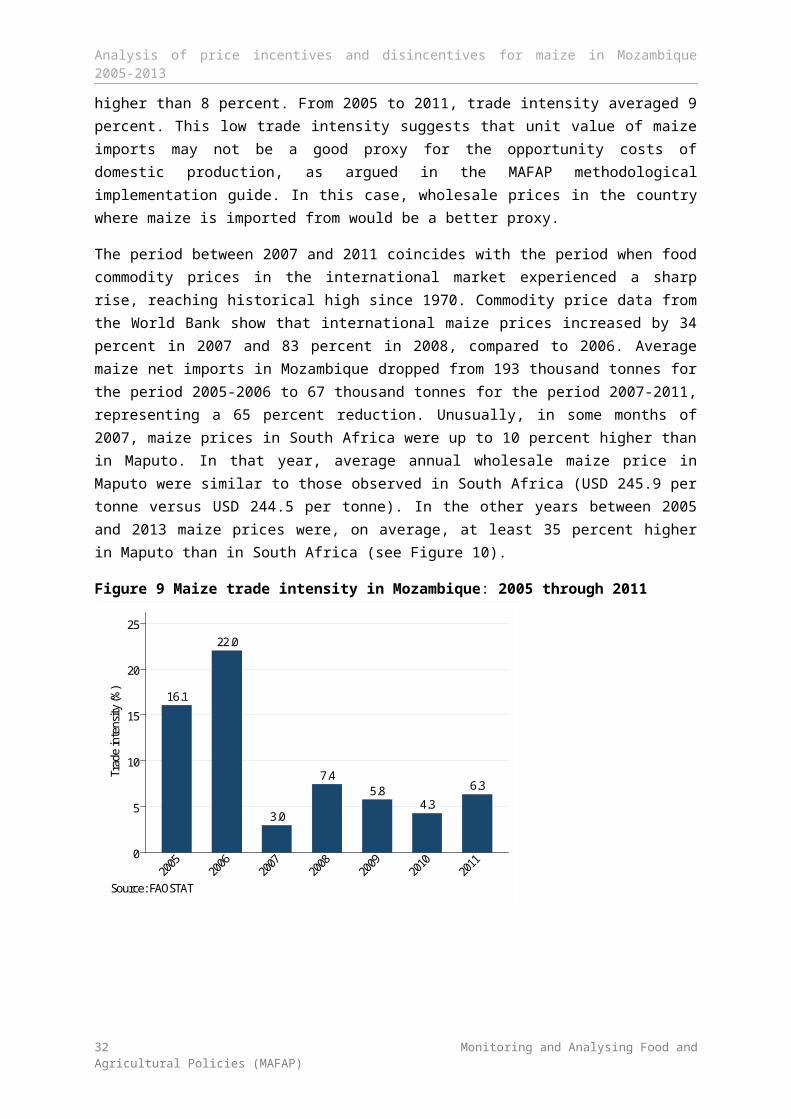
Analysis of price incentives and disincentives for maize in Mozambique 2005-2013
BUDGET AND OTHER TRANSFERS
Since 2009, under the Agricultural Input Subsidy Program, maize farmers started receiving inputs, but unavailability of data hampers the identification of the real impact of this policy. Once the public expenditure analysis using the MAFAP methodological approach is finalized, estimates of government transfers to maize producers, measured in MZN per tonne, could be added to the price incentives and disincentives analysis undertaken in this technical note.
QUALITY AND QUANTITY ADJUSTMENTS
We are aware that there is some quality differential between imported and domestic maize grain, as discussed earlier. However, we are not aware of any conversion factors to guide us in making quality adjustments. On the other hand, there is no need to make quantity adjustments because our analysis of price incentives and disincentives considers maize grain (either produced domestically or imported from South Africa). For these reasons, no quality or quantity adjustments were made.
DATA OVERVIEW
Following the discussions above, the table below summarizes the main data sources used and methodological decisions taken for the analysis.
Table 5: Data sources and methodological decisionsDescription
Concept Observed AdjustedBenchmark price Annual CIF prices calculated by adding
road transport costs to annual wholesale prices gathered from South Africa Future Exchange (SAFEX). Road transport cost data came from secondary source.
N.A.
Domestic price at point of competition
Annual average wholesale maize prices obtained from the Ministry of Agriculture’s Agricultural Market Information System (SIMA)
N.A.
Domestic price at farm gate Annual average producer maize prices obtained from SIMA
N.A.
Exchange rate Official exchange rate gathered from the Central Bank of Mozambique
N.A.
Access cost from the point of competition to the border
Road transport costs from previous studies. Customs paperwork processing and fees based on WB Doing Business online database. Profit margins are set at 10 percent wholesale maize price and 0.5 percent of CIF maize prices, respectively.
Profit margins adjusted to the minimum margin (7 percent) as a share of total investment costs along this segment of the value chain.
Access costs from the point of competition to farm gate
Road transport costs gathered from SIMA, while handling costs and profit margins from previous studies.
Profit margins adjusted to the minimum margin (36 percent) as a share of total investment costs along this segment of the value chain.
QT adjustment
Bor-PoC N.A. N.A.PoC -FG N.A. N.A.
QL adjustment
Bor- PoC N.A. N.A.PoC -FG N.A. N.A.
32 Monitoring and Analysing Food and Agricultural Policies (MAFAP)
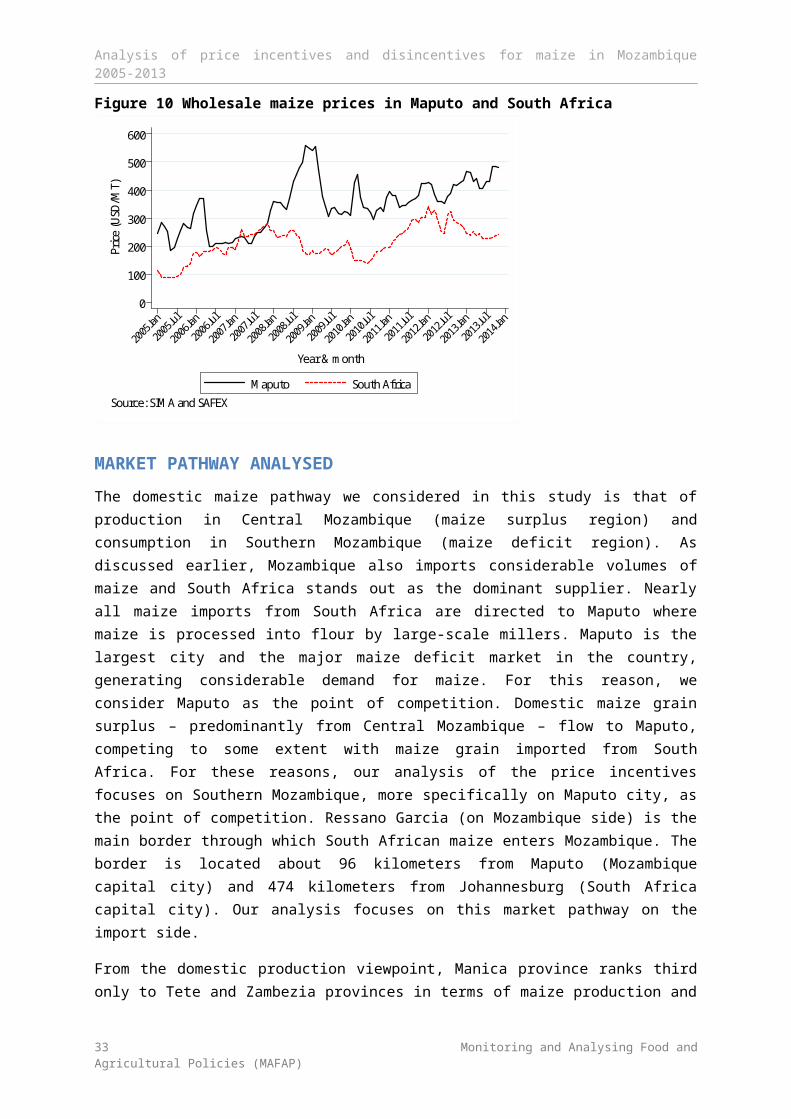
Analysis of price incentives and disincentives for maize in Mozambique 2005-2013
The data used for this analysis is summarized below.
Table 6 Data used for maize analysisYear 2005 2006 2007 2008 2009 2010 2011 2012 2013
trade status
m m m m m m m m m
DATA Unit SymbolBenchmark Price
Observed USD/tonne Pb(int$) 137.06 212.40 278.81 262.28 227.69 207.01 307.63 346.23 296.75Adjusted Pba
Exchange Rate
Observed MZN/USD ERo 23.06 24.99 25.56 24.17 26.71 33.04 28.91 28.35 29.85Adjusted ERa
Access costs border - wholesale
Observed MZN/tonne ACowh 1,890.73 2,241.27 2,408.82 2,718.10 3,170.97 3,863.70 3,438.38 3,633.14 3,993.33Adjusted MZN/tonne ACawh 1,622.09 2,104.81 2,407.76 2,260.10 2,744.75 3,384.88 3,148.62 3,373.60 3,467.42
Domestic price at wholesale MZN/tonne Pdwh 5,825.60 6,231.21 6,271.52 10,227.18 10,056.12 11,499.95 10,804.53 11,256.94 13,351.08Access costs wholesale - farm
gateObserved MZN/tonne ACofg 2,758.14 2,917.20 3,201.92 4,686.27 4,327.10 4,822.43 4,736.90 4,879.61 5,313.86Adjusted MZN/tonne ACafg 2,573.63 2,777.87 2,955.18 4,324.39 4,159.00 4,382.70 4,706.56 4,301.92 4,680.70
Farm gate price MZN/tonne Pdfg 3,520.31 3,959.59 3,423.49 6,230.48 6,928.54 7,361.75 7,773.81 6,638.10 8,490.91Externalities associated with
productionE
Budget and other product related transfers
BOT
Quantity conversion factor (border - point of competition)
Fraction QTwh 1 1 1 1 1 1 1 1 1
Quality conversion factor (border - point of competition)
Fraction QLwh 1 1 1 1 1 1 1 1 1
Quantity conversion factor (point of competition – farm
gate)
Fraction QTfg 1 1 1 1 1 1 1 1 1
Quality conversion factor (point of competition – farm gate)
Fraction QLfg 1 1 1 1 1 1 1 1 1
33 Monitoring and Analysing Food and Agricultural Policies (MAFAP)
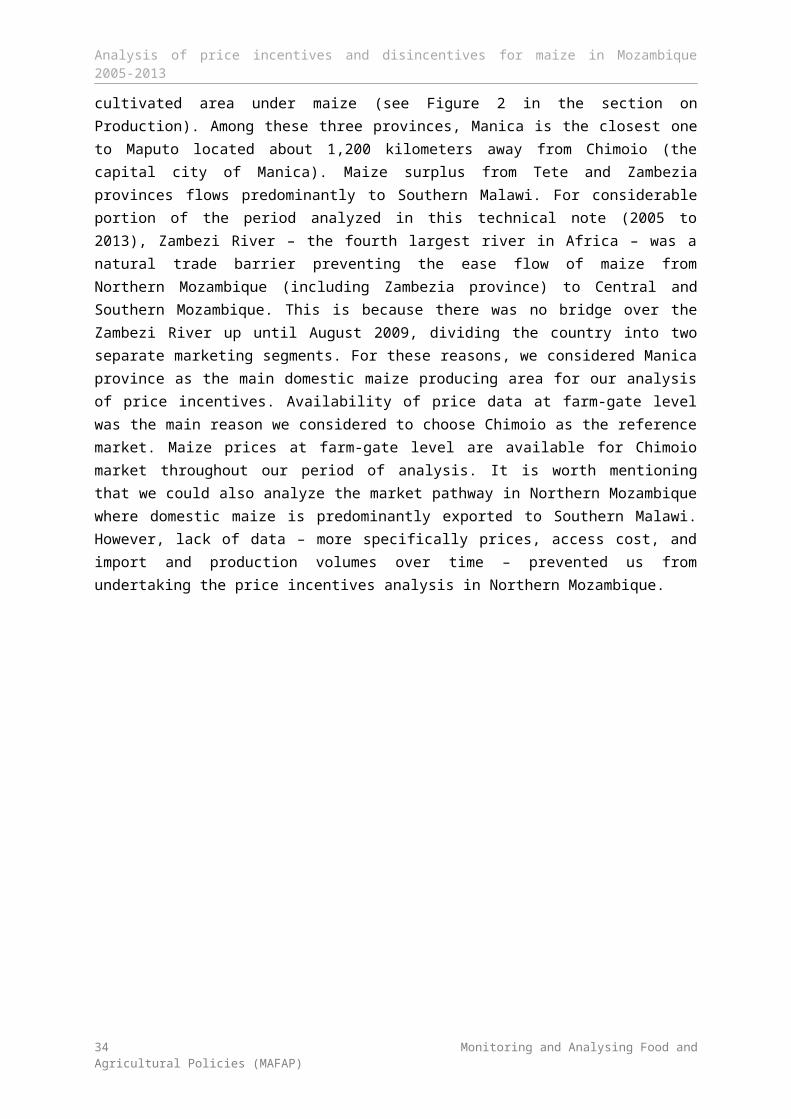
Analysis of price incentives and disincentives for maize in Mozambique 2005-2013
SUMMARY OF INDICATORS
Table 7. MAFAP price gaps for maize in Mozambique, (MZN/tonne), 2005-20132005 2006 2007 2008 2009 2010 2011 2012 2013
Trade status for the year m m m m m m m M m
Observed price gap at point of competition 774 -1,318 -3,264 1,169 804 796 -1,527 -2,193 500
Adjusted price gap at point of competition 1,043 -1,181 -3,263 1,627 1,230 1,275 -1,237 -1,934 1,026
Observed price gap at farm gate 1,227 -672 -2,910 1,858 2,003 1,480 179 -1,933 954
Adjusted price gap at farm gate 1,311 -675 -3,156 1,954 2,262 1,519 438 -2,251 847
Source: Author’s own calculations using data as described above.
Table 8 : MAFAP Nominal Rates of Protection for maize in Mozambique, ( percent), 2005-20132005 2006 2007 2008 2009 2010 2011 2012 2013
Trade status for the year m m m m m m m M M
Observed NRP at point of competition
15.3 percen
t
-17.5 percent
-34.2 percent
12.9 percent
8.7 percent
7.4 percent
-12.4 percen
t
-16.3 percent
3.9 percent
Adjusted NRP at point of competition
21.8 percen
t
-15.9 percent
-34.2 percent
18.9 percent
13.9 percent
12.5 percent
-10.3 percen
t
-14.7 percent
8.3 percent
Observed NRP at farm gate
53.5 percen
t
-14.5 percent
-45.9 percent
42.5 percent
40.7 percent
25.2 percent
2.4 percen
t
-22.5 percent
12.7 percent
Adjusted NRP at farm gate
59.4 percen
t
-14.6 percent
-48.0 percent
45.7 percent
48.5 percent
26.0 percent
6.0 percen
t
-25.3 percent
11.1 percent
Observed NRA at farm gateAdjusted NRA at farm gateSource: Author’s own calculations using data as described above.
Table 9. MAFAP Market Development Gaps for maize in Mozambique, (MZN/tonne), 2005-20132005 2006 2007 2008 2009 2010 2011 2012 2013
Trade status for the year m m m m m m m m m
Access costs gap to competition point (ACGwh)
268.64 136.46 1.06 457.99 426.22 478.82 289.76 259.54 525.91
Access costs gap to farm gate (ACGfg) -184.51 -139.33 -246.74 -361.88 -168.09 -439.73 -30.34 -577.68 -633.16
Exchange rate policy gap (EXRP)International markets gap (IMG)Source: Author’s own calculations using data as described above.
34 Monitoring and Analysing Food and Agricultural Policies (MAFAP)
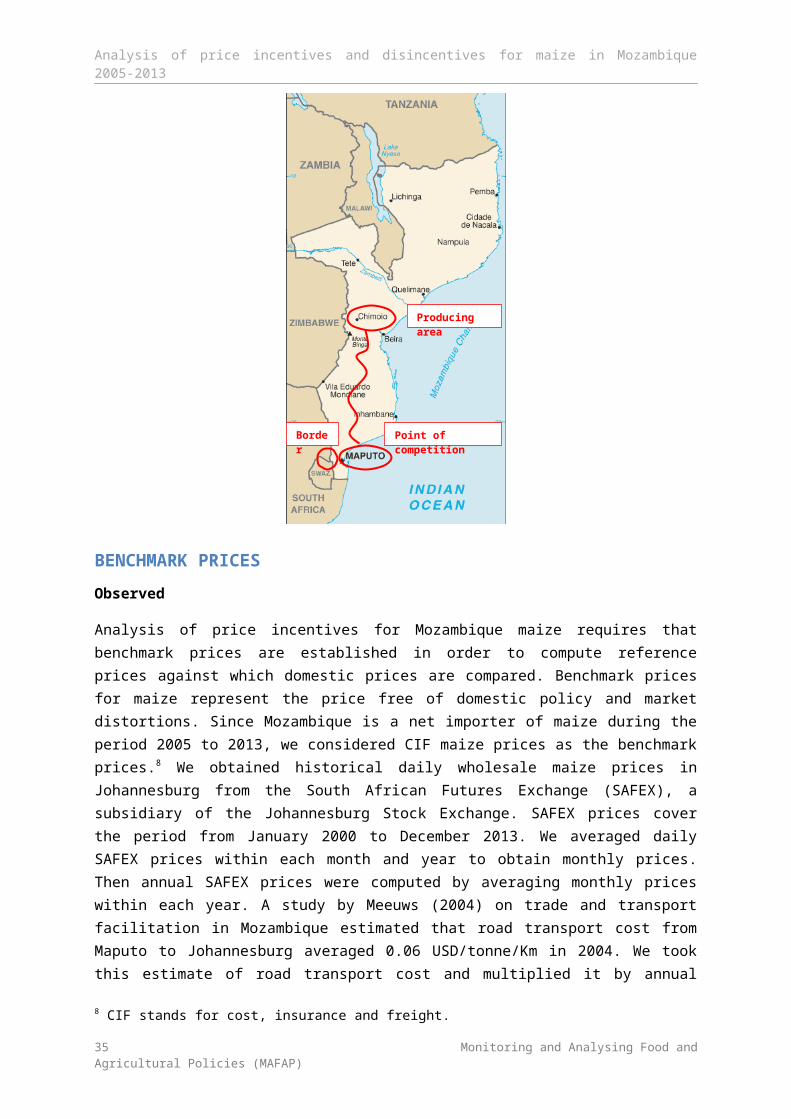
Analysis of price incentives and disincentives for maize in Mozambique 2005-2013
5. RESULTS AND INTERPRETATION
We begin our discussion by pointing out that throughout the period under analysis (2005 through 2013) the key maize policy instrument that was in place was the 17 percent Value-Added Tax (VAT) on maize grain imports. As argued by Tschirley and Adbulai (2007), large scale maize millers who process imported maize grain into maize meal for sales in domestic markets get reimbursed for their VAT payments. This favors large scale millers over smaller traders and hammer millers who rely heavily on domestically produced maize grain.
Figure 13 and Figure Figure 14 show the observed maize market prices and reference maize prices at farm-gate and wholesale levels over the period 2005 through 2013, respectively. Reference prices at wholesale (farm-gate) level represent prices that traders (farmers) would have been paid for their maize in the absence of distortions stemming from domestic market and trade policies, as well as domestic market functioning. Price gaps are given by the difference between observed market prices and reference price at each level in the value chain (e.g. wholesale and farm gate). Positive (negative) price gaps represent incentives (disincentives) – to wholesalers or farmers depending on the marketing level in question – resulting from market and policy distortions. Observed and adjusted price gaps shown in Figures Figure 13 and Figure 14 follow similar patterns. For this reason, our discussions of the results focused on our findings for observed price gaps.
First, the largest observed price gaps are seen in 2007: minus 3,264 MZN/tonne at wholesale level and minus 2,910 MZN/tonne at farm-gate level. This finding could be attributed to the fact during the period spanning 2005 through 2013, 2007 was the only year when wholesale prices in South Africa outstripped wholesale prices in Maputo in some months. Furthermore, 2007 is the year when the smallest difference between wholesale maize prices in South Africa and Maputo was registered (see Figure 10).
Figure 13 Observed and adjusted price gaps for maize at farm gate level (MZN/tonne)
2.3
2.2
3.5
4.6
4.6
4.0
6.3 6.6
3.4
4.4
4.3
6.2
4.9
4.7
6.9
5.9
5.8
7.4 7.6
7.3 7.
8 8.6 8.
96.
6
7.5 7.6
8.5
0
2
4
6
8
10
Pric
e ('0
00 M
ZN/M
T of
mai
ze g
rain
)
2005 2006 2007 2008 2009 2010 2011 2012 2013
Source: Authors' calculations
Farm gate priceReference price at farm gate level (observed)Reference price at farm gate level (adjusted)
35 Monitoring and Analysing Food and Agricultural Policies (MAFAP)
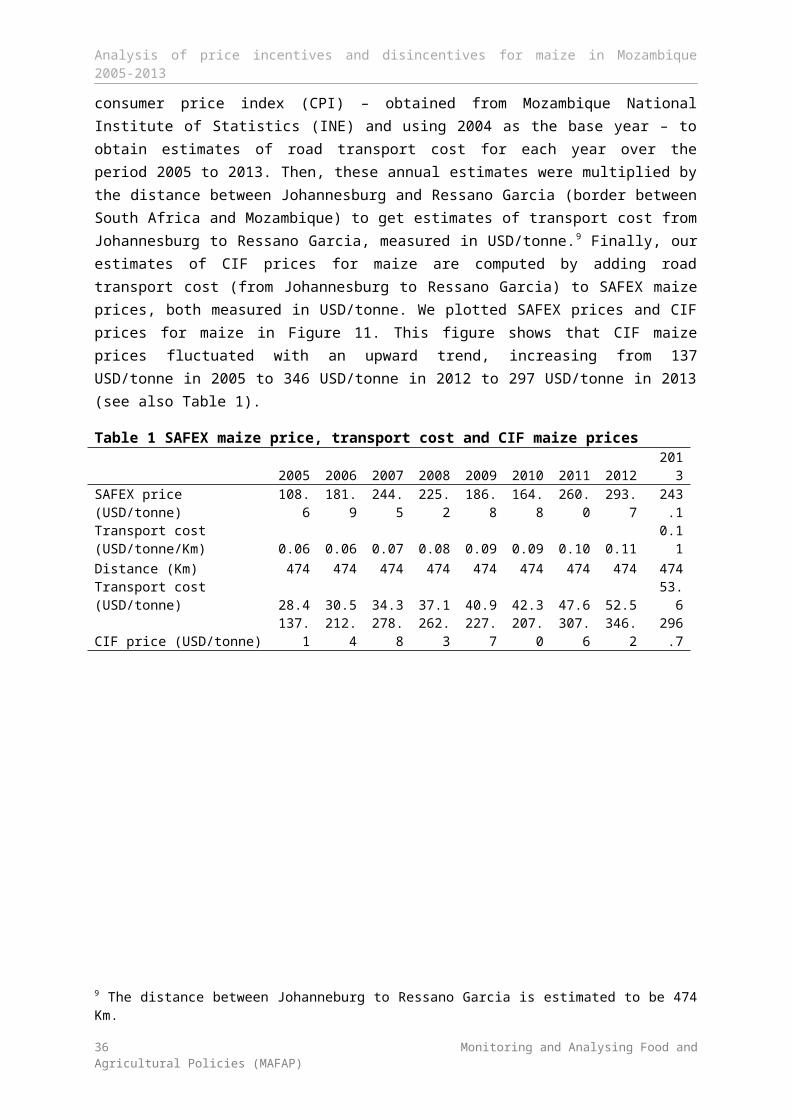
Analysis of price incentives and disincentives for maize in Mozambique 2005-2013
Figure 14 Observed and adjusted price gaps for maize at wholesale level (MZN/tonne)
5.1
4.8 5.
8
7.5
7.4
6.2
9.5
9.5
6.3
9.1
8.6
10.2
9.3
8.8 10
.1 10.7
10.2 11
.5 12.3
12.0
10.8
13.5
13.2
11.3
12.9
12.3 13
.4
0
2
4
6
8
10
12
14
16
Pric
e ('0
00 M
ZN/M
T of
mai
ze g
rain
)
2005 2006 2007 2008 2009 2010 2011 2012 2013
Source: Authors' calculations
Wholesale priceReference price at wholesale level (observed)Reference price at wholesale level (adjusted)
Second, our findings show that from 2008 to 2010, the policy environment and market functioning generated incentives to both wholesalers and farmers selling maize in Mozambique. Over the same period, observed price gaps ranged from 795 MZN/tonne to 1,169 MZN/tonne at wholesale level and from 1,480 MZN/tonne to 1858 MZN/tonne at farm-gate level, with averages of 923 MZN/tonne at wholesale level and 1,780 MZN/tonne at farm-gate level. One possible explanation for this finding is that during this period, wholesale maize prices in Mozambique trended upward, while they moved downward in South Africa. From 2007 to 2010, wholesale maize prices declined by 33 percent in South Africa, compared to 83 percent increase in Maputo (wholesale level) and 115 percent increase in Chimoio (farm-gate level). We note that from 2007 to 2008, wholesale maize price increased by 63 percent in Maputo and by 82 percent in Chimoio. Another possible explanation is that starting from 2008, as mentioned earlier, new large-scale maize buyers (poultry processors and maize millers) operating in the Central and Northern regions began to aggressively buy maize from farmers in these regions. The rise in poultry production – and resulting increased demand for maize as feed – was driven by the rapidly growing share of the urban population that increased the demand for processed commodities such as chicken and beef in urban centers.
Third, price gaps were negative in 2012: minus 2,193 MZN/tonne at wholesale level and minus 1,933 MZN/tonne at farm-gate level. Wholesale maize prices registered a 13 percent increase in South Africa from 2011 to 2012, compared to only 4 percent increase in Maputo and 15 percent decline in Chimoio. In 2013, the situation reversed and price gaps became positive at both wholesale (500 MZN/tonne) and farm-gate (954 MZN/tonne) levels. This change from 2012 to 2013 is associated with price decline in South Africa by 18 percent, while Mozambique experienced price increases in both Maputo (19 percent) and Chimoio (28 percent).
Price gaps are absolute measure of price incentives or disincentives to wholesaler or farmers. Therefore, they cannot be compared across years. To allow comparisons across years, we computed Nominal Rate of Protection (NRP) for each year as the share of price gaps to respective reference prices. Figures Figure 15 and Figure 16 show NRP for wholesale and farm-gate level, respectively.
36 Monitoring and Analysing Food and Agricultural Policies (MAFAP)
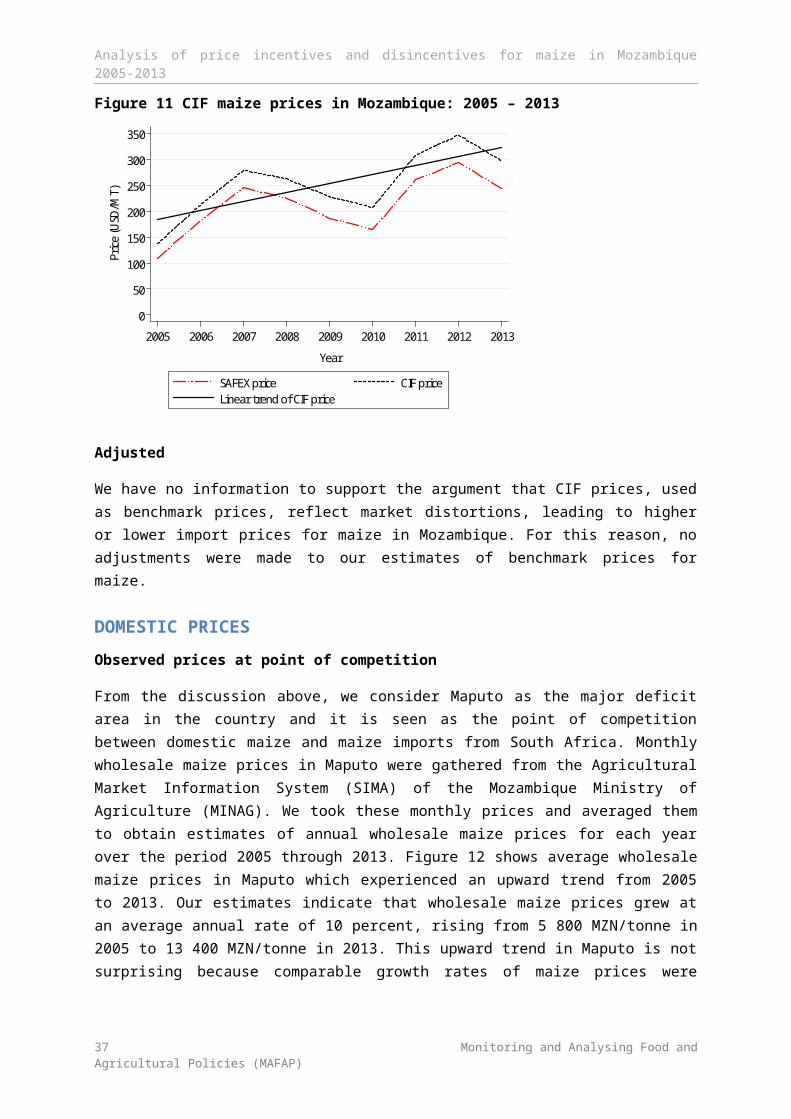
Analysis of price incentives and disincentives for maize in Mozambique 2005-2013
Figure 15 Observed and adjusted NRP for maize at farm gate in Mozambique
5459
-15-15
-46-48
43 4641
48
25 26
2 6
-23-25
13 11
-60
-40
-20
0
20
40
60
Nom
inal
rate
of p
rote
ction
(%)
2005 2006 2007 2008 2009 2010 2011 2012 2013
Year
Source: Authors' calculations
Observed Adjusted
Figure 16 Observed and adjusted NRP for maize at wholesale level in Mozambique
1522
-17 -16
-34
-34
1319
914
712
-12 -10
-16 -15
48
-40
-20
0
20
40
Nom
inal
rate
of p
rote
ction
(%)
2005 2006 2007 2008 2009 2010 2011 2012 2013
Year
Source: Authors' calculations
Observed Adjusted
As was the case with price gaps, observed and adjusted NRPs followed similar patterns over the period 2005 through 2013. We saw earlier that the largest price gaps were observed in 2007 at both wholesale and farm-gate levels. However, Figure 15 shows that the largest NRP at farm-gate level was registered in 2005. In this year, maize prices paid to farmers were 54 percent higher than what farmers should have been paid for their maize if market and policy distortions were removed. Maize production declined by 11 percent from 2004 to 2005 because 2005 was a drought year in Mozambique. With 0.9 thousand tonnes of maize, 2005 was the year with the historical low production level during the period 2005 to 2013 (see Figure 1). This shortage in maize supply may have forced traders to pay higher prices to maize farmers than what they would have paid otherwise. We note that wholesale maize prices were 15 percent higher than they would have been in absence
37 Monitoring and Analysing Food and Agricultural Policies (MAFAP)
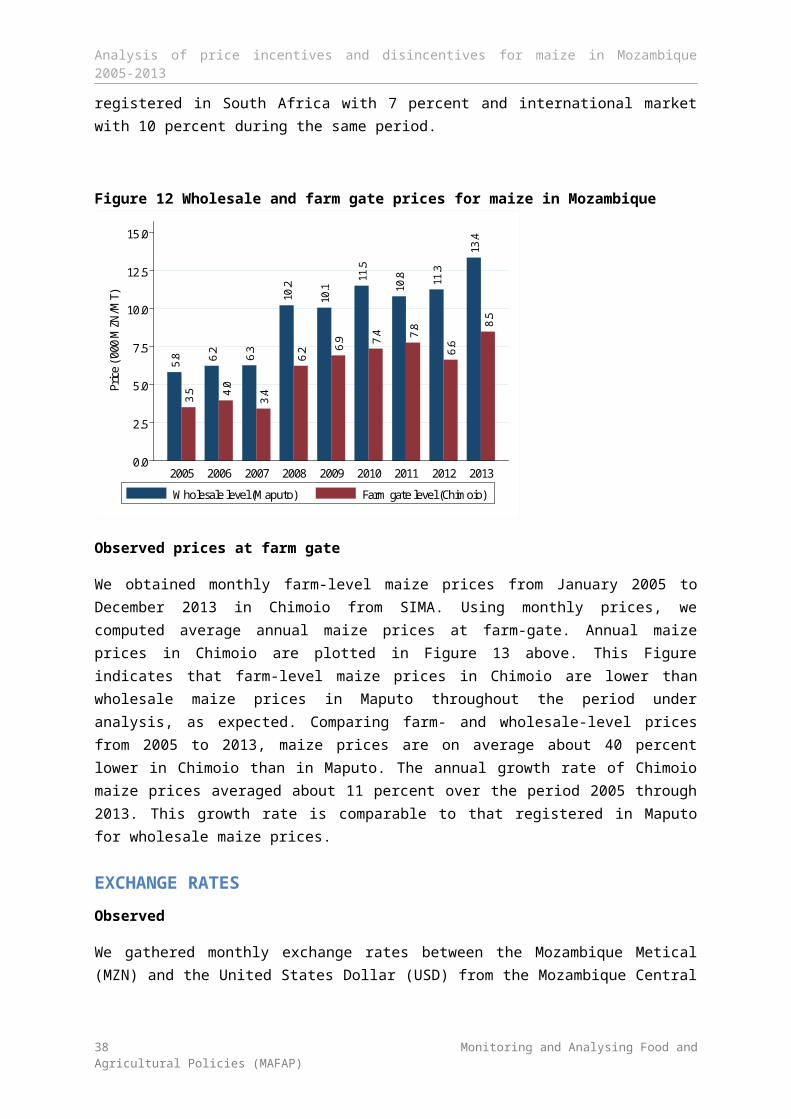
Analysis of price incentives and disincentives for maize in Mozambique 2005-2013
of market and policy distortions. However, this was not the largest NRP over the period 2005 to 2013. Like price gap, the largest NRP at wholesale level was seen in 2007 when traders were paid 34 percent less than what they should have been paid. This is because 2007 was the only year when wholesale maize prices were higher in Maputo than in South Africa (see Figure 10).
When maize prices were increasing in Mozambique while declining in South Africa (from 2008 to 2010), maize prices at wholesale and farm-gate levels were on average 10 percent and 36 percent higher than what they should have been, respectively, in the absence of market and policy distortions. This result suggests that over the same period, policy put in place in Mozambique (import duty and import VAT) as well as market functioning generated higher incentives to farmers than traders on average, in line with the larger price increase at farm-gate level compared to wholesale level (115 percent versus 83 percent).
From 2005 to 2013, adjusted NRP averaged 12 percent at farm-gate level and less than 1 percent at wholesale level. If we exclude 2007 (the year when Maputo wholesale prices were higher compared to South Africa), then average NRP increases to 20 percent at farm-gate level and to 4 percent at wholesale level. This suggested that the policy and market structure gave greater protection to farmers than wholesalers, after accounting for “excessive” profit margins gained by wholesalers.
The difference between observed and adjusted indicators reflects adjustments on profit margins that we made for both segments of the value chain (border to point of competition and point of competition to farm gate). As explained earlier, the minimum share of profit margins in the total investment costs over the period 2005 to 2013 was used as a benchmark to adjust profit margins for each year: 7 percent for the segment from border to the point of competition and 36 percent for the segment from point of competition to farm gate. We computed Market Development Gap (MDG) as the difference between observed and adjusted NRPs. MDG thus captures inefficiencies in access costs – related to profit margins – from the border to farm gate. Our findings are summarized in Figure 17.
The light blue bar in Figure 17 represents MDG between the border and Maputo. This indicator is also known as access cost gap at point of competition and reflects the effects of trading agents’ profit margins on maize prices paid to farmers and wholesalers. Access cost gap at point of competition is always positive through the period under analysis, representing gains to traders who import maize from South Africa because their profit margins from imported maize are higher than “normal” profit margins (set at 7 percent of the total investment costs). However, the gains to import traders from imported maize oscillate from year to year with no clear trend, dropping from 269 MZN/tonne in 2005 to about one MZN/tonne in 2007 and then sharply increasing to 458 MZN/tonne in 2008 and 479 MZN/tonne in 2010. This was followed by a 46 percent reduction from 2010 to 2012 and a 103 percent increase from 2012 to 2013.
38 Monitoring and Analysing Food and Agricultural Policies (MAFAP)
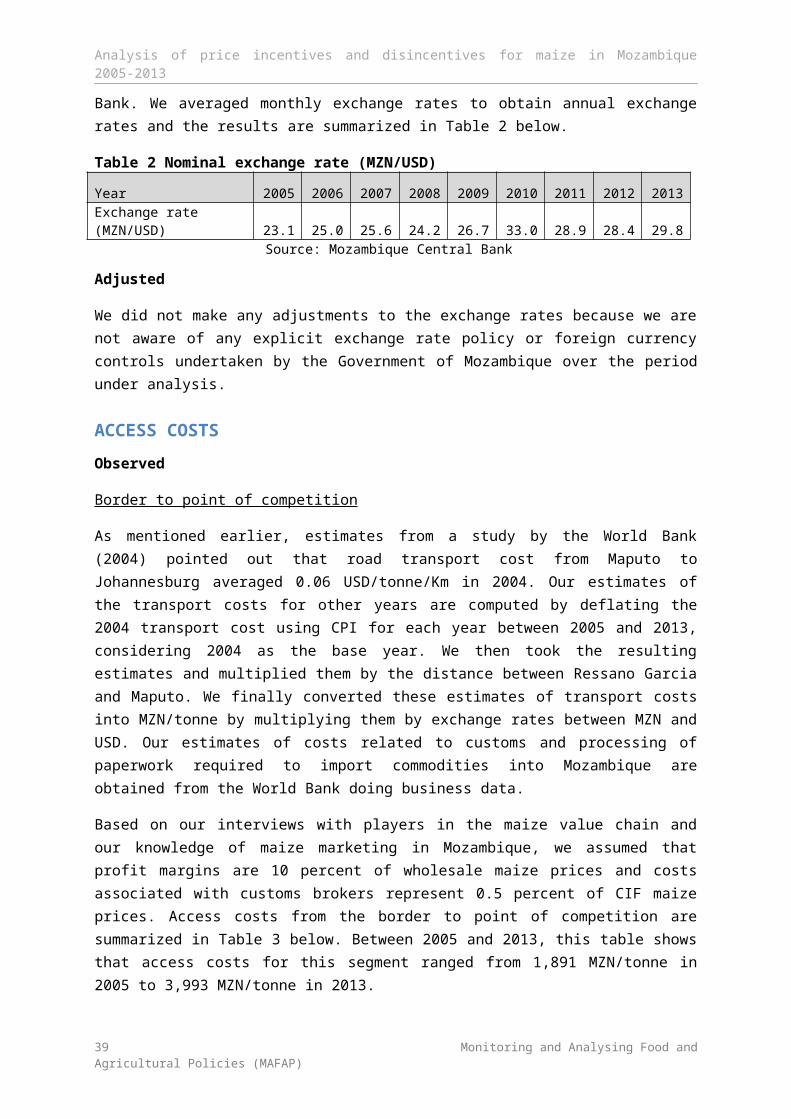
Analysis of price incentives and disincentives for maize in Mozambique 2005-2013
Figure 17 Market development gap for maize in Mozambique
6.0
4.0
2.0
0.0
-2.0
-4.0
-6.0
MDG
as %
of r
efer
ence
pric
e (%
)
-600
-400
-200
0
200
400
600Ac
cess
cos
t gap
(MZN
/MT)
MDG
(MZN
/MT)
2005 2006 2007 2008 2009 2010 2011 2012 2013Year
Access cost gap at point of competitionAccess cost gap at farm gateMarket development gap (MDG)MDG as % of reference price at farm gate (right scale)
Source: Authors' calculations
The dark blue bar in Figure 17 represents MDG between Maputo and Chimoio (also known as access cost gap at farm gate). From 2005 to 2013, access cost gap between point of competition and farm gate is always negative, representing losses to maize farmers stemming from higher than “normal” wholesalers’ profit margins from domestically produced maize. Losses to maize farmers vary from year to year with no clear trend, ranging from minus 30 MZN/tonne in 2011 to minus 633 MZN/tonne in 2013. The red bar denotes MDG obtained by adding access cost gaps for both segments of the value chain (the border to point of completion and point of competition to farm gate). Throughout the period under analysis, MDG varies from year to year, but it was never larger than 6 percent of the reference price at farm gate. MDG as a share of reference price at farm gate (the dark line in Figure 17) averaged 1 percent during the period 2005 through 2013. This suggests that on average, gains to traders exceed (by little bit) losses to farmers deriving from “excessive” profit margins at various stages of the maize value chain.
39 Monitoring and Analysing Food and Agricultural Policies (MAFAP)
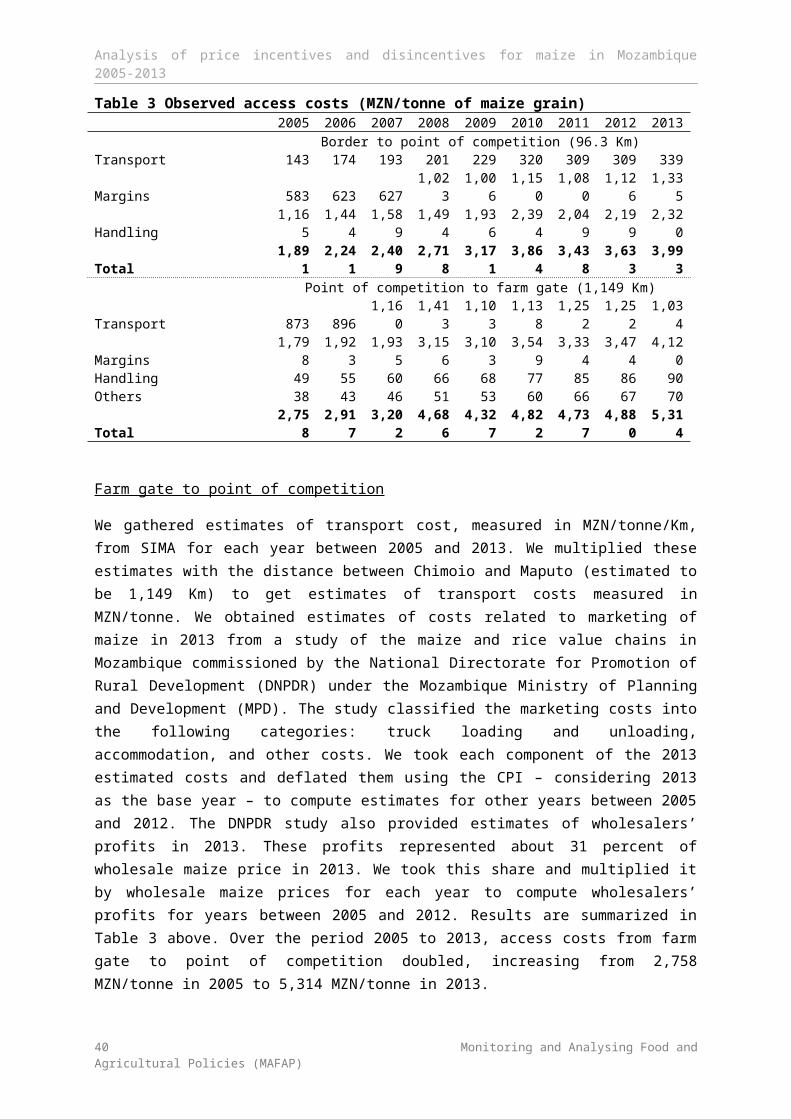
Analysis of price incentives and disincentives for maize in Mozambique 2005-2013
6. CONCLUSION
MAIN MESSAGE
Our findings indicate that the current government policies put in place by the government (e.g. 2.5 percent import duty and 17 percent valued-added tax on maize grain imports) and the market structure have resulted in greater incentives to maize farmers in Central Mozambique than maize wholesalers in Maputo. Both maize farmers and wholesalers were paid higher prices for their maize grain than what they would have been paid if market and policy distortions were eliminated. This advantage for farmers and traders have implications for net maize consumers who paid higher prices for purchasing maize than what they would have paid under more efficient and competitive maize grain markets. This should not cause much of a concern in Southern Mozambique (the region considered as the point of competition in our analysis) because in terms of both total consumption and contribution to the total food expenditures, maize consumption is less important in the Southern region compared to the Central and Northern regions.
With construction of a bridge over the Zambezi River in 2009, it is expected that there will be better connection between Northern and Southern regions of the country. The lower transaction costs to move the grain to Southern Mozambique through Zambezi River bridge could benefit both regions, in particular consumers in Maputo (who access cheaper maize domestically produced) and farmers in Northern Mozambique (who could sell maize at higher prices).
It appears that maize price in South Africa are not that well integrated with maize prices in Maputo because prices signals from wholesale markets in South Africa are not reflected in Maputo retail prices. This is particularly evident in 2007 when maize prices were higher in South Africa than in Maputo (in some months) and between 2012 and 2013 when maize prices in South Africa declined markedly by 18 percent while they increased by 19 percent in Maputo (and by 28 percent in Chimoio). The import restrictions in place could one possible driver of the price transmission mechanism between the two countries.
RECOMMENDATIONS
We recognize that additional research is demanded to get a better understanding of maize markets dynamics to draw specific policy recommendation from a more in-depth analysis. However, it would be important to assess the impacts of the removal of the 17 percent VAT on maize grain imports especially on consumers.
Although the recent construction of the Zambesi River bridge already represents a relevant improvement in connections within the country, further infrastructural upgrading could facilitate maize flow from maize producing regions (North) and deficit regions (South) offering a secure market channel for farmers in Tete, Zambezia and Manica, which generally supply Malawian markets - mainly through informal channels - rather than urban consumers in the south of Mozambique.
On the production side, it is recognized that current maize yields in Mozambique are still similar to those seen in the late 1990s, and much lower than the neighboring countries. Low use of improved inputs combined with high reliance on rain-fed production systems are driving factors of this low
40 Monitoring and Analysing Food and Agricultural Policies (MAFAP)
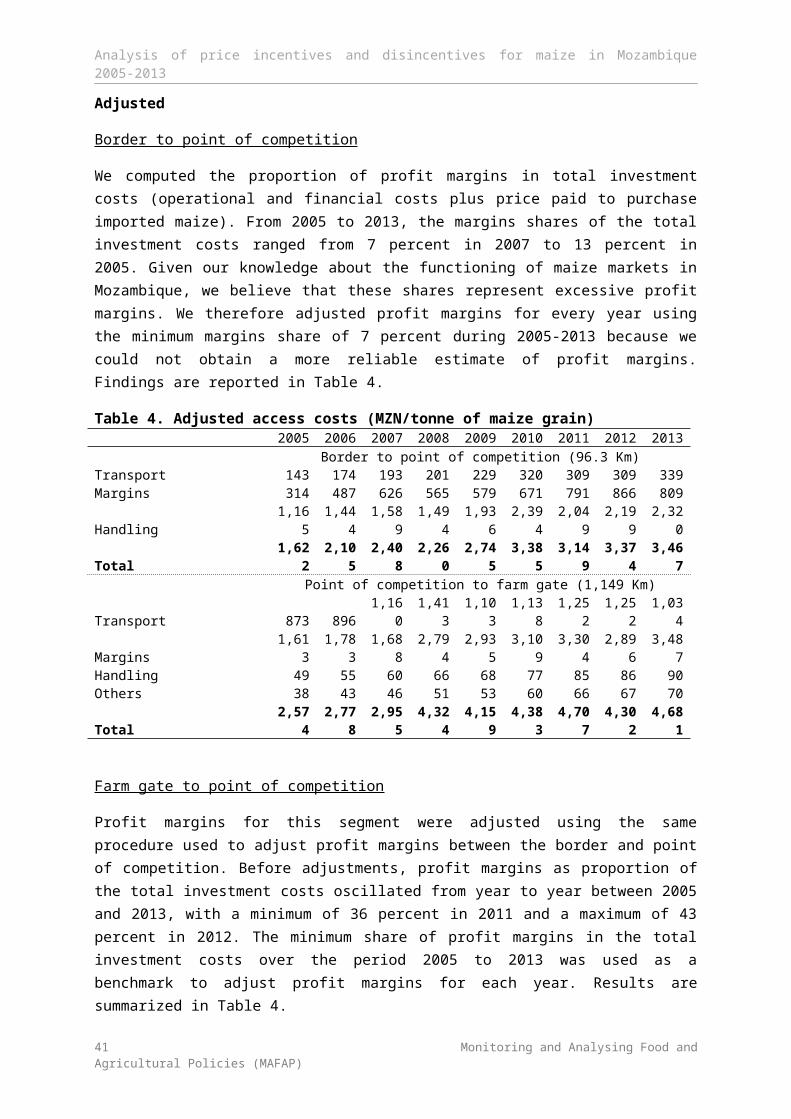
Analysis of price incentives and disincentives for maize in Mozambique 2005-2013
productivity. The government should take into consideration these constrains affecting not only maize, but also other cereals production, in order to frame appropriate policies and interventions to support farmers, in the context of PEDSA and PNISA.
LIMITATIONS
Our analysis did not take into account quality differential between imported maize grain and domestically produced maize grain;
The public monetary transfers to farmers, in form of input subsidies, are not included at this stage of the analysis. Data were in the process of being collected by the MAFAP team in Mozambique and will allow to compute the Nominal Rates of Assistance.
FURTHER INVESTIGATION AND RESEARCH
Both maize grain and maize meal are traded at wholesale level in Maputo although maize is ultimately consumed as maize meal. Our analysis focused on price incentives for maize grain traders and farmers. The analysis could be improved by comparing results from two scenarios: (i) computing the indicators using wholesale maize grain prices as we did in our analysi, and (ii) estimating the same indicators using wholesale maize meal prices. This could help us better understand whether the 17 percent VAT on maize grain import had differential impacts on maize grain and maize meal as it would be predicted because millers who import maize grain and process it into maize meal get rebates for their VAT payments;
The focus of our analysis was on Southern Mozambique (a maize deficit region). However, Northern Mozambique – a maize surplus region – could be considered as a separate marketing segment and therefore analysis of prices incentives to farmers and wholesalers operating in this region could be undertaken. There had been limited integration between maize markets in Northern and Southern Mozambique due mainly to lack of a bridge in the Zambezi River, causing a natural barrier to maize flow from Northern to Southern Mozambique. The market integration between the two regions has been improving since August 2009 when a bridge was built in the Zambezi River. Maize markets in Northern Mozambique are better linked with markets in Southern Malawi (a major maize deficit region).
41 Monitoring and Analysing Food and Agricultural Policies (MAFAP)
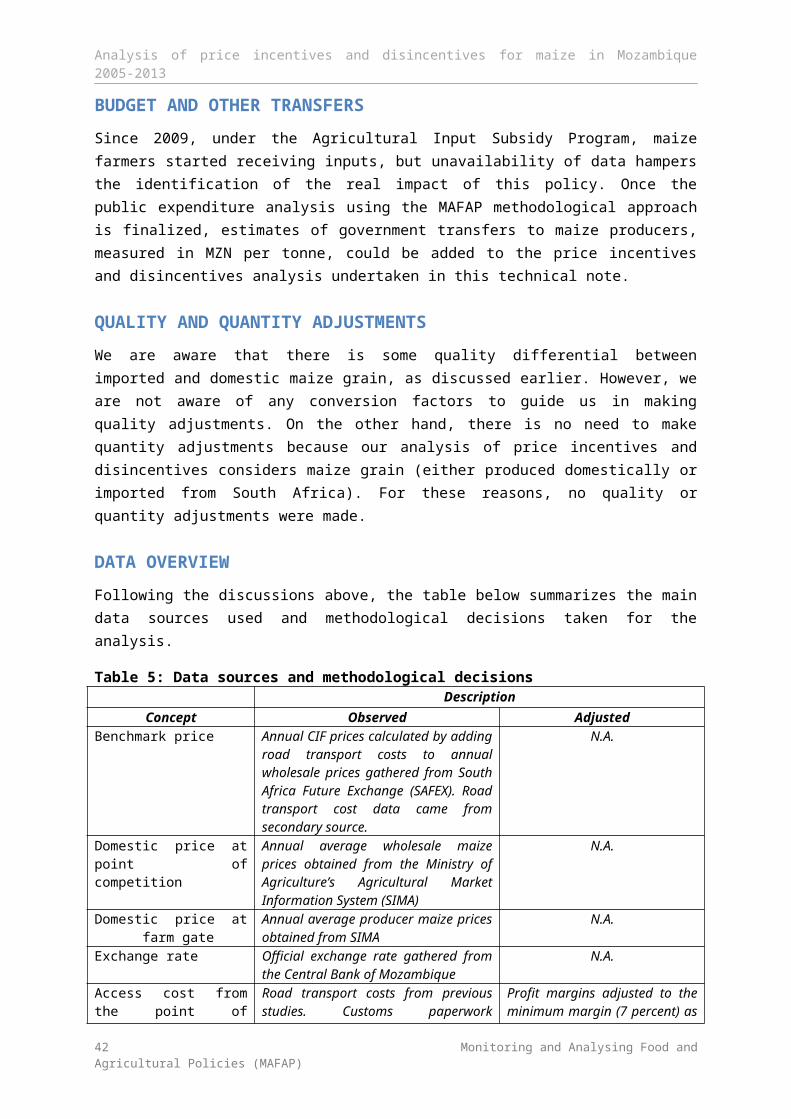
Analysis of price incentives and disincentives for maize in Mozambique 2005-2013
BIBLIOGRAPHY
Acosta, A. 2012. Measuring Spatial Transmission of White Maize Prices between South Africa and Mozambique: An Asymmetric Error Correction Model Approach. African Journal of Agricultural and Resource Economics 7(1), 1-13.
Benson, T.; Cunguara, B.; Mogues, T. 2012. The supply of Inorganic Fertilizers to Smallholder Farmers in Mozambique: Evidence from Fertilizer Policy Development. IFPRI Discussion Paper 01229. Washington, DC: Internation Food Policy Research Institute (IFPRI).
Chilonda, P.; Xavier, V.; Luciano, L.; Gemo, H.; Chamusso, A.; Zikhali, P.; Faria, A.; Govereh, J.; Musaba, E.; Manussa, S.; Acubar, B.; Osvaldo, L.; Alage, N.; Macome, E.; Manganhela, A. 2012. Monitoring and Evaluating Agricultural Growth, Trade and Poverty in Mozambique: 2011 Annual Trends and Outlook Report. Maputo, Mozambique: Mozambique Ministry of Agriculture (MINAG) and Mozambique Strategic Analysis and Knowledge Support System (MozSAKSS).
Cunguara, B. 2012. An Exposition of Development Failures in Mozambique. Review of African Political Economy 39(131), 161-170.
FAO; WFP. 2010. FAO/WFP Crop and Food Security Assessment Mission to Mozambique. Rome, Italy: Food and Agriculture Organization of the United Nations (FAO) and United Nations World Food Program (WFP).
Meeuws, R. 2004. Mozambique trade and transport facilitation audit. Report submitted to the World Bank. Rijswijk, The Netherlands: NEA Transport Research and Training.
MIC. 2004. Removing Obstacles to Economic Growth in Mozambique: A Diagnostic Trade Integration Study. Volume 2: Main Report. Maputo, Mozambique: Ministry of Industry and Trade (MIC).
Tostao, E.; Tschirley, D. 2010. On the Role of Government in Food Staples Markets: Perspectives from Recent Research and Implications for Mozambique. Flash 54E. Maputo, Mozambique: Ministry of Agriculture (MINAG).
Tschirley, D.; Abdula, D. 2007. Toward Improved Maize Marketing Trade Policies to Promote Household Food Security in Central and Southern Mozambique: 2007 update. Research Report 62E. Maputo, Mozambique: Ministry of Agricultural Rural Development, Economics Directorate.
42 Monitoring and Analysing Food and Agricultural Policies (MAFAP)