Embed Size (px)
Citation preview
cr) I
n a c 4 c/) 4 z I
SUMMARY OF THERMOPHYSICAL PROPERTIES OF POTASSIUM ..
by Harold H. Coe Lewis Reseurch Center Cleuekznd, Ohio
N A T I O N A L AERONAUTICS A N D SPACE A D M l N l S T R A T l O N - WASHINGTON,
https://ntrs.nasa.gov/search.jsp?R=19670022590 2018-06-16T19:42:23+00:00Z
ERRATA
NASA Technical Note D-3120
SUMMARY OF THERMOPHYSICAL PROPERTIES OF POTASSIUM
by Harold H. Coe
December 1965
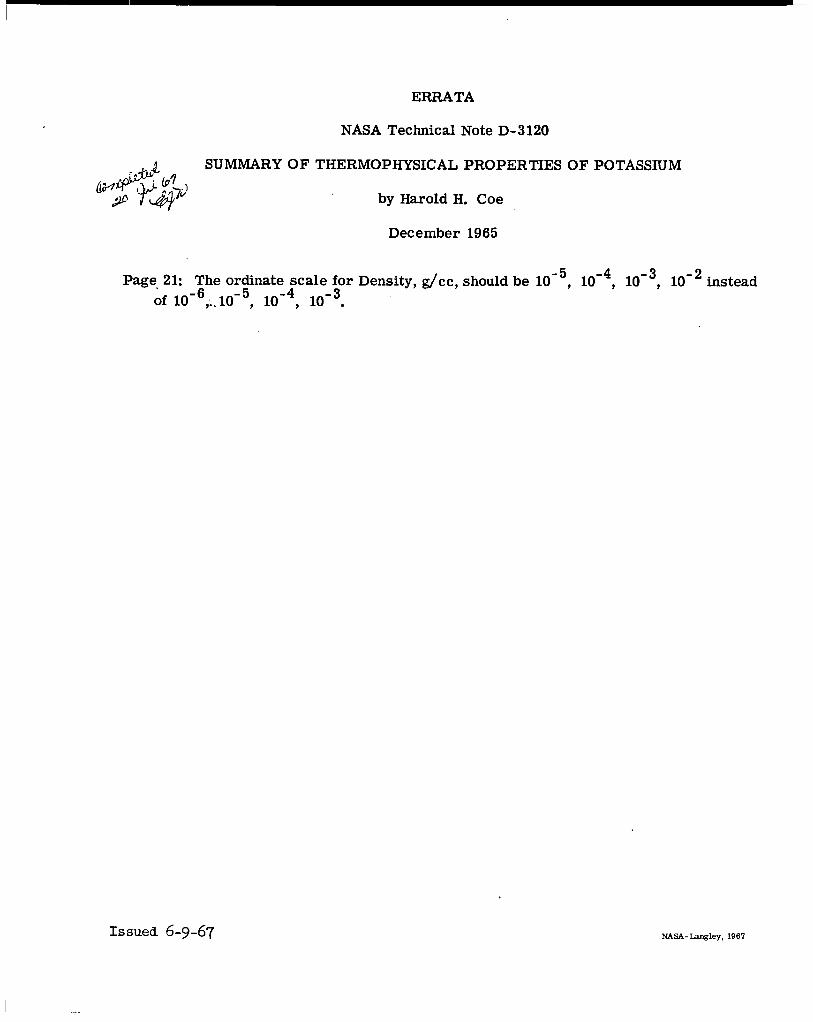
Page- 21: The ordinate scale for Density, g/cc, should be 10- 2 instead 6 3 of IO- IO- .
Issued 6-9-67 NASA-Langley, 1967
TECH LIBRARY KAFB, NM
I llllll I Illll lllll I lllll1 Ill1 Ill
SUMMARY O F THERMOPHYSICAL PROPERTIES OF POTASSIUM
By Harold H. Coe
Lewis Research Center Cleveland, Ohio
N ATlON AL AERONAUT ICs AND SPACE ADMINISTRATION
For sale by the Clearinghouse for Federal Scientific and Technical Information Springfield, Virginia 22151 - Price $2.00
CONTENTS
Page SUMMARY . . . . . . . . . . . . . . . . . . . . . . . . . . . . . . . . . . 1
INTRODTJCTION . . . . . . . . . . . . . . . . . . . . . . . . . . . . . . . 1
PHESENTATION OF RESULTS . . . . . . . . . . . . . . . . . . . . . . . . . . 2
SATURATED LIQUID PROPERTIES . . . . . . . . . . . . . . . . . . . . . . . . 4 Density (F ig . 1) . . . . . . . . . . . . . . . . . . . . . . . . . . . . 4 Viscosi ty (F ig . 2) . . . . . . . . . . . . . . . . . . . . . . . . . . . 6 Surface Tension (F ig . 3) . . . . . . . . . . . . . . . . . . . . . . . . 6 E l e c t r i c a l Res i s t iv i ty (F ig . 4) . . . . . . . . . . . . . . . . . . . . . 8 Thermal Conductivity (Fig . 5) . . . . . . . . . . . . . . . . . . . . . . 10 Enthalpy (F ig . 6 ) . . . . . . . . . . . . . . . . . . . . . . . . . . . . 1 2 Specif ic Heat (F ig . 7 ) . . . . . . . . . . . . . . . . . . . . . . . . . 14 Entropy (F ig . 8 ) . . . . . . . . . . . . . . . . . . . . . . . . . . . . 16
SATURATED VAPOR PROPERTIES . . . . . . . . . . . . . . . . . . . . . . . . 18 Vapor Pressure (F ig . 9 ) . . . . . . . . . . . . . . . . . . . . . . . . . 18 D e n s i t y ( F i g . 1 0 ) . . . . . . . . . . . . . . . . . . . . . . . . . . . . 20 Viscosi ty (Fig . 11) . . . . . . . . . . . . . . . . . . . . . . . . . . . 22 Thermal Conductivity (F ig . 1 2 ) . . . . . . . . . . . . . . . . . . . . . 22 Heat of Vaporization (F ig . 13) . . . . . . . . . . . . . . . . . . . . . 22 Entropy of Vaporization (Fig . 1 4 ) . . . . . . . . . . . . . . . . . . . . 26 Specif ic Heat (Fig . 15) . . . . . . . . . . . . . . . . . . . . . . . . . 28 Enthalpy and Eqtropy (F ig . 1 6 ) . . . . . . . . . . . . . . . . . . . . . 31
CONCLUDING REMARKS . . . . . . . . . . . . . . . . . . . . . . . . . . . . 31
REFERENCES . . . . . . . . . . . . . . . . . . . . . . . . . . . . . . . . 32
SUMMARY O F TKERMOPHYSICAL PROPERTIES OF POTASSIUM
by Harold H. Coe
Lewis Research Center
SUMMARY
Recently reported thermodynamic and physical property data on the a lka l i metal potassium a r e compiled and the r e s u l t s of t he various sources a r e com- pared w i t h previously ex is t ing data. D a t a f o r t h e l i q u i d propert ies of spe- c i f i c heat, thermal conductivity, enthalpy, entropy, viscosi ty , e l e c t r i c a l r e - s i s t i v i t y , density, and surface tension a re presented over the temperature range from 200' t o 2200' F when possible . Data f o r t he saturated vapor prop- e r t i e s of spec i f i c heat, thermal conductivity, vapor pressure, heat of vapor- iza t ion , entropy of vaporization, v i scos i ty , and densi ty a re presented over t he temperature range from 800' t o 2200° F.
The r e s u l t s from the several sources agree very well fo r most of t he prop- e r t i e s i n the lower temperature range up t o about 1400' F. cant differences a r e apparent f o r some of the propert ies a t temperatures above 1400' F.
However, s i g n i f i -
INTRODUCTION
The a l k a l i metals, such as sodium, potassium, rubidium, cesium, and l i t h - ium, have physical, thermodynamic, and t ranspor t propert ies t h a t make t h e m a t - t r a c t i v e f lu ids fo r elevated temperature appl icat ions. For t h i s reason, a l k a l i metals a re being considered fo r use as reac tor coolants and as working f l u i d s i n space power generation systems. Although t h e values of some of these prop- e r t i e s had been establ ished e a r l i e r , it became evident i n recent years t h a t more experimental data were required, not only t o extend the temperature range, but a l s o t o resolve discrepancies t h a t ex is ted a t t h e lower temperatures.
Beginning i n 1960, severa l programs were i n i t i a t e d by NASA and the USAF (WADD) t o determine and compile the propert ies of t h e a lka l i metals. The re- sults of a USAF contract w i t h Southwest Research I n s t i t u t e f o r co l lec t ion of property data on a number of mater ia ls including the a l k a l i metals were pub- l i shed i n 1961 as reference 1. This repor t w a s considered one of t he bes t sources of property da ta p r i o r t o the recent publ icat ion of the r e s u l t s of many of t h e other invest igat ions (refs. 2 t o 2 4 ) .
The majority of t h e published repor t s were concerned w i t h potassium, one
of the more widely used a l k a l i metals. There are many design and experimental s tud ies of Rankine cycle space power generation systems with pr inc ipa l i n t e r e s t a t present on potassium as the working f l u i d . These s tudies include the SPUR- SNAP 50 program ( re f . 25), t he General E lec t r i c bo i l ing and condensing inves- t iga t ions (ref. 26), and severa l inhouse programs a t t h e NASA Lewis Research Center. In a l l of these programs, accurate property data a re required for de- s ign procedures and s tudies and for analysis of experimental and theore t ica l results.
The object of t h i s repor t i s t o compile t h e recent ly reported property data on potassium, t o compare the results of t he various sources with previ- ously ex is t ing data, and t o ident i fy any areas of discrepancy s o t h a t t he de- signer can e s t ab l i sh bes t judgement i n the use of t he avai lable propert ies . Data on the sa tura ted l i q u i d propert ies of density, viscosi ty , surface tension, e l e c t r i c a l r e s i s t i v i t y , thermal conductivity, enthalpy, spec i f i c heat, and en- tropy a re presented over t he temperature range from 200' to 2200' F when pos- s i b l e . Data on the sa tura ted vapor propert ies of vapor pressure, density, v i s - cosity, thermal conductivity, heat of vaporization, entropy of vaporization, and spec i f ic heat are presented over the temperature range from 800' t o 2200' F. The sa tura t ion l i n e s on an enthalpy-entropy diagram a r e a l s o presented. I n fo r - m a t , the values determined i n the recent experimental programs (refs . 2 t o 16) a re compared with t h e values reported i n reference 1 and other previous data sources.
PRESECJTATION OF RESULTS
The data are presented graphically with property values p lo t ted against temperature, and comments are presented concerning the method each source em- ployed i n obtaining i t s data. The curves are numbered t o f a c i l i t a t e reference i n the t e x t .
In order t o make comparisons of the data, a l l property values were con- verted t o the English system of units, with the metric system of uni t s shown on the graphs f o r convenience. sources fo r each property were calculated and are noted i n the comments on the individual propert ies .
The percent differences between the data
The presentat ion of the comparisons has been separated i n t o saturated l i q - uid propert ies ( f i g s . 1 t o 8) and saturated vapor propert ies ( f i g s . 9 t o 1 6 ) .
It should be noted t h a t some work on potassium propert ies i s s t i l l i n prog- ress by Aerojet-General Nucleonics (AGN) and MSA Research Corporation (MSAR) ( r e f s . 16 and 20) and t h a t the data presented from t h e U. S. Naval Research Laboratory (NRL) (refs. 3 and 11) and MSAR ( refs . 4 and 8) a re from inter im progress reports and are not from a f i n a l technical report . A s t he present repor t w a s being published, potassium property data were made avai lable by the rJRL f i n a l technical repor t ( re f . 2 7 ) and were added t o the appropriate graphs. However, t he NRL preliminary values were l e f t i n t he present work for compari- son because the two progress reports (refs. 3 and 11) show the results of two d i f fe ren t methods of determining property data. I n t h e f i n a l repor t ( ref . 2 7 ) ,
2
* 8(
.75
0 7c u (sr * .- 2. VI c W n
.65
.6c
.55
600 800 lo00 1200 1400 1600 1800 2200 Temperature, OF
I I I I 1 1 I I I I 900 lo00 1100 1200 800 700 600 500 300 400
I 200
Temperature, O c
Figure 1. - Density of potassium liquid.
3
I l l1 IIIIIIII I lllll11111l1l1 I I I I 1 II
NRL determined the propert ies by the same method out l ined i n reference 11, and, although an e r ro r w a s found i n t he coef f ic ien t of expansion of niobium-1 z i r - conium, the f i n a l sa tura t ion values were only s l i g h t l y changed from the prelim- inary data, with the exception of t h e spec i f i c heat of t he sa tura ted vapor.
SATlJRATED LIQUID PROPERTIES
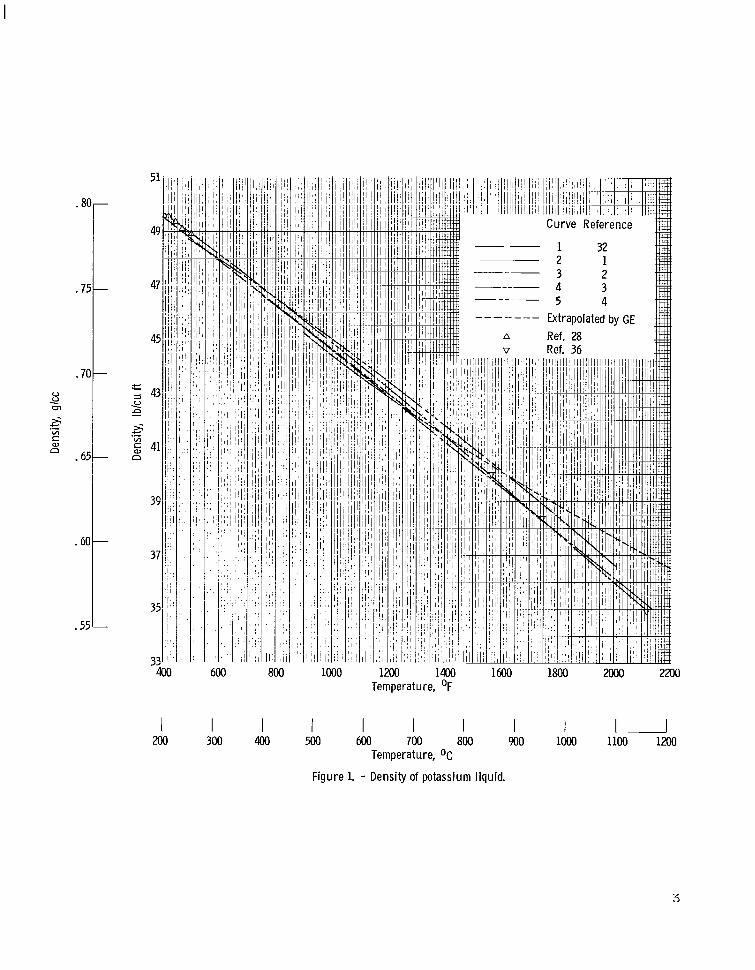
Density (Fig. 1)
In 1948, NRL (ref. 28) presented a bes t l i n e through the experimental den- s i t y data of Ewing,'et al. ( r e f . 2 8 ) , WAR, Rinck ( r e f . 29), and Hagen ( r e f . 30). Values of densi ty from t h i s bes t l i n e were then given i n t ab le 2 .2 of r e fe r - ence 31 and i n t ab le 1-14 of reference 32 and a r e shown as curve 1 i n f igure 1. General E lec t r i c (GE) ( r e f . 33) extrapolated the data from reference 31 t o tem- peratures above 1300O F, and WADD reported the GE values i n reference 1; these values a r e shown as curve 2 .
Ba t t e l l e presented an equation i n reference 5 derived by them t o f i t the data from reference 32 and a p r iva t e communication from Eking of NRL. Values of density calculated from t h i s equation were tabulated i n t ab le C-2 of r e fe r - ence 2 and a r e shown as curve 3.
The values f o r the NRL curve (curve 4) were calculated from an equation presented i n reference 3, derived by I\JRL as the bes t curve f i t t o t he experi- mental density data of Hagen ( r e f . 30) and Ewing, e t al. ( r e f . 28) a t lower temperatures, Movikov, e t a l . (ref. 34), Jackson, e t a l . ( r e f . 35), and Rinck ( r e f . 29) a t moderate temperatures, and Eking, e t a l . ( r e f . 36) a t higher tem- peratures . The data points from a quartz dilatometer i n reference 28 and from a pynchnometer i n reference 36 a re a l so shown f o r comparison. values from appendix A of reference 27 l i e on curve 4.
The NRL f i n a l
MSAR presented an equation i n reference 4 as the bes t representat ion of the MSAR experimental data obtained from a dilatometer over t he temperature range of 470' t o 2000° F. The standard deviation of the 39 data points w a s 0.0014 gram per cubic centimeter. Density values calculated from t h i s equation a re shown as curve 5.
It i s s t a t e d by Cooke i n reference 6 t h a t t h e preliminary r e s u l t s obtained up t o about 1300° F by the maximum bubble pressure method show good agreement with the composite data of reference 31 and average approximately 0.4 percent higher. These data then would be very close t o the NRL curve (curve 4 ) .
It can be seen t h a t t h e recent experimental determination of MSAR agrees
It should be noted tha t curve 2 has the wrong curvature and very well with the previous work, with a maximum difference of l e s s than 2 per- cent a t 2000' F. thus d i f f e r s from the other determinations; t h i s difference a t 2000' F i s a maximum of about 4 percent.
4
. .. 1 .... .. ... .
--.--.-... . ... . - .. ... ....-_..--- I
n u s c v) 0 V v)
.-
.- >
.45 * ' O F
. 1 5 k
.10
Temperature, OF
I - 600 700 800 900 1000 1100
I 500
I I 300 400
I 200
I 100
Temperature, OC
Figure 2. -Viscosity of potassium liquid.
5
I
I ll11111ll I I 1 I
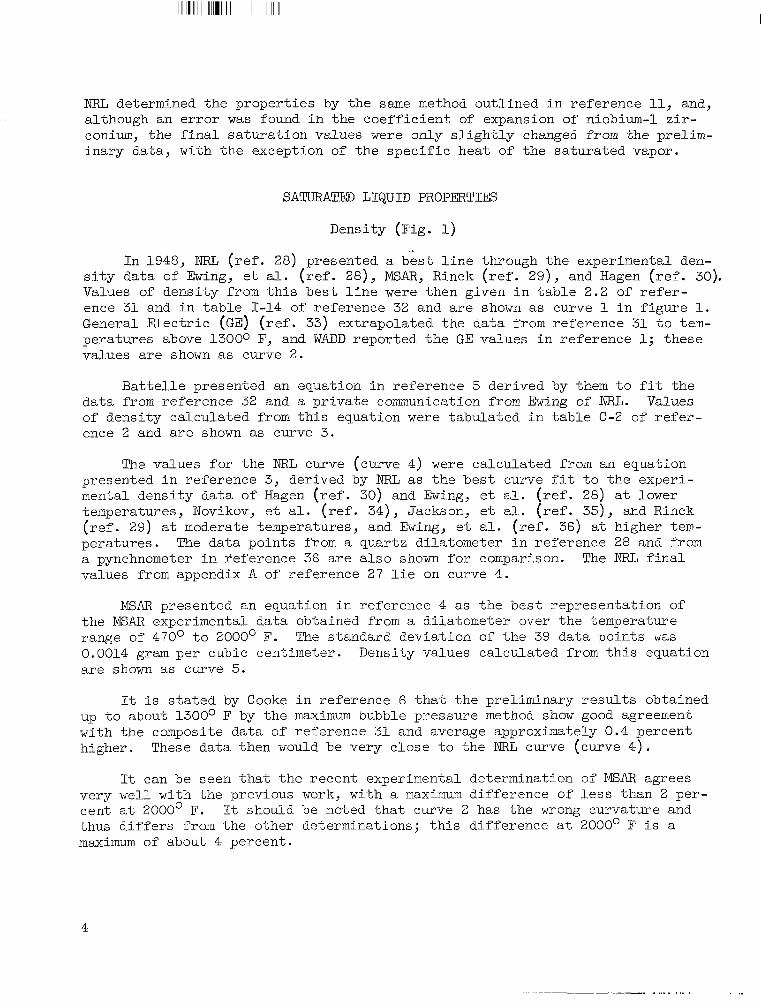
Viscosity (Fig. 2)
The v i scos i ty data obtained by Chiong ( r e f . 37) , using a g lass o s c i l l a t i n g
Chiong determined these values using the densi ty data of Hagen sphere, a r e shown i n f igu re 2. f o r comparison. (ref. 30).
A curve (curve 1) w a s drawn through the points
Eking, e t al. (ref. 38) obtained some v i scos i ty da ta up t o 660° F using a nickel viscometer of t h e Ostwald type. with a curve (curve 2 ) drawn through t h e poin ts fo r comparison.
These da ta poin ts a r e shown i n f igu re 2,
Novikov, e t a l . (ref. 39) obtained v i scos i ty da ta using the tors iona l os- c i l l a t i o n method and the theory of Shvidkovsky (ref. 40). Values of kinematic v i scos i ty were taken from the l i n e through the data presented i n reference 39. The absolute v iscos i ty , calculated with the same densi ty values used for curves 2 and 5 i n order t o make a b e t t e r comparison, i s shown as curve 3. Ex- perimental da ta of Kutateladze, e t a l . ( r e f . 41), obtained by the damped t o r - s iona l o sc i l l a t ions method, were reported by WADD ( ref . 1) and are shown as curve 4.
Ba t t e l l e ( r e f . 5) determined t h i s property using t h e osc i l l a t ing cylinder method and the Shvidkovsky (ref. 40) equation. Values of absolute v i scos i ty calculated from the two Andrade (ref. 42) type equations presented i n r e f e r - ence 5 as a least-squares f i t t i n g of t he experimental data a r e shown as curve 5. The standard deviat ion of t h e points from the low temperature (154' t o 698' F) equation w a s 0.005 and from t h e high temperature (6980 t o 2100' F) equation w a s 0.012. It should be noted t h a t Ba t t e l l e also f i t t e d the data over the e n t i r e temperature range with a s ing le equation of the Andrade type t h a t resu l ted i n a standard deviation of 0.018; it was obvious t h a t t h e data were b e t t e r f i t t e d with the two equations.
It can be seen t h a t t he Ba t t e l l e r e s u l t s (curve 5) l i e generally midway between the other values presented. Chiong's values a re about 4 percent lower than curve 5 a t 211' F and about 5 percent higher a t 666' F. (curve 3) a re about 5 percent higher than B a t t e l l e ' s i n t h e range from 400° t o 1000° F but show good agreement a t the higher and lower temperatures. Eking's data a re about 10 percent lower than B a t t e l l e ' s over the range shown.
Novikov's r e s u l t s
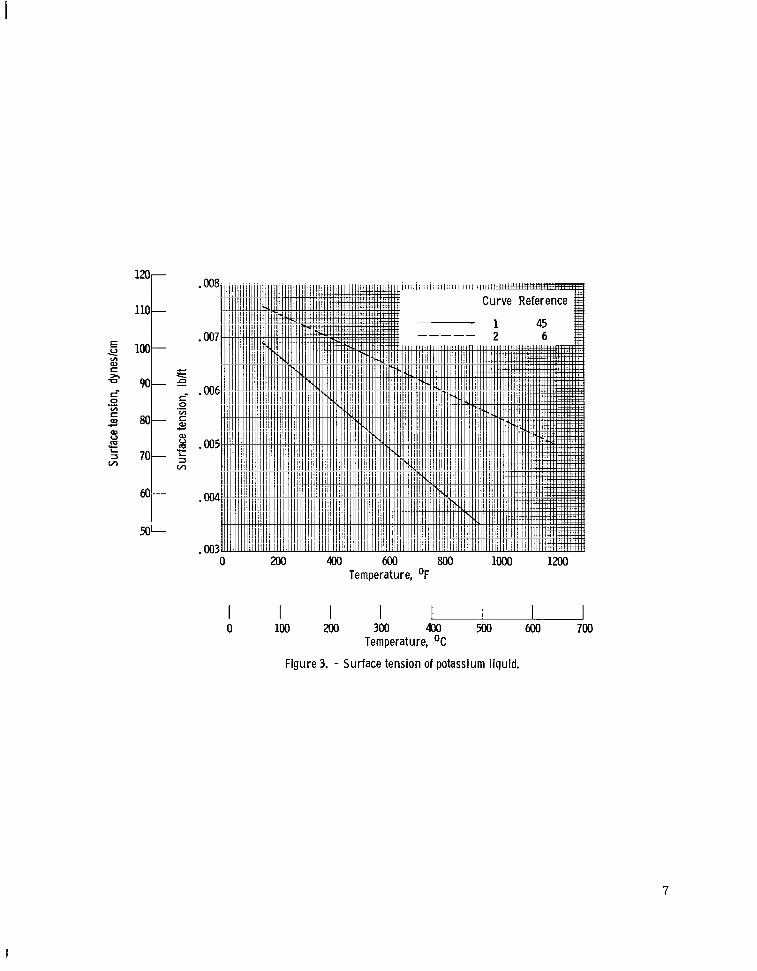
Surface Tension (Fig. 3)
Using the cap i l l a ry r i s e method, Eking, e t a l . ( r e f . 28) determined an av- erage value of about 0.00546 pound per foot (80 dynes/cm) fo r t h e surface ten- s ion of potassium over the temperature range from the melting point t o 379' F (193' C), assuming a contact angle of zero degrees. The pu r i ty of t he potas- sium was 99.6 percent.
Quarterman and Primak ( r e f . 43) a l s o used the cap i l l a ry r i s e method and reported an average value of 0.00587 pound per foot (86 dynes/cm) from the melt- ing point t o 308O F (153.4' C ) , assuming a contact angle of zero degrees. contact angle was measured one year l a t e r and determined t o be 24' t o 26'.
The It
6
E Y v) aa r ZI '0
r- 0 v) r a3
.- c aa u
L. c 2 VI
100
0 400 600 800 1200 Temperature, OF
500 600 700 1
400 I 300
I 200
I 100
I 0
Temperature, OC
Figure 3. - Surface tension of potassium liquid.
7
I
w a s concluded t h a t t he ac tua l contact angle during the surface tension measure- ments w a s less than 26O, which would r e s u l t i n a maximum correct ion of l e s s than 11 percent. The value of surface tension a t t h e melting poin t reported by WADD ( r e f . 1) w a s based on reference 44.
The data for curve 1 were calculated with the value of surface tension a t t he melting poin t and the recommended temperature coef f ic ien t (-0.11 erg/cm2/OC) as determined experimentally by Taylor (ref. 45) using the maximum bubble pres- sure method with argon as a cover gas. The cor rec t radius w a s determined by the method of Porter (ref. 46) and t h e correct ion for t h e d i s to r t ion of t he bubble from a spher ica l shape by the method of Sugden ( r e f . 47). t he potassium used w a s 99.895 percent. The data- s c a t t e r w a s approximately 22 percent.
The pu r i ty of
Preliminary surface tension data has been reported by Cooke (ref. 6 ) . The
The values fo r curve 2 were ca l - data were obtained by the maximum bubble pressure method with helium gas and employing the Schrzdinger equation ( r e f . 48). culated from a least-squares equation presented i n reference 6. The mean- square deviation of t he points w a s 20.64 dyne per centimeter. A t o t a l of 202 determinations were made; however, severa l values around 400° F (200' C ) were not included i n t h e least-squares treatment, s ince they were up t o 5 per- cent low. A l l of these low values were recorded shor t ly a f t e r t he i n s t a l l a t i o n of a new cap i l l a ry tube, and it w a s f e l t t h a t these low values were the r e s u l t of poor wetting of the capi l la ry by the potassium.
It can be seen t h a t t he preliminary data of Cooke (curve 2 ) a r e consider- ably higher than Taylor 's values (curve l), ranging from almost 12 percent a t 200' F to about 59 percent a t 9000 F. Tne data of Ewing, e t a l . ( r e f . 28) and Quarterman and Primak ( r e f . 43) are about 15 t o 2 0 percent lower than those of Taylor, with t h e ac tua l contact angle i n considerable doubt. A l a rge r contact angle would, of course, r a i s e the values given. It should be noted t h a t t he pu r i ty of t he potassium i s important i n the surface tension determination and may contr ibute t o these discrepancies.
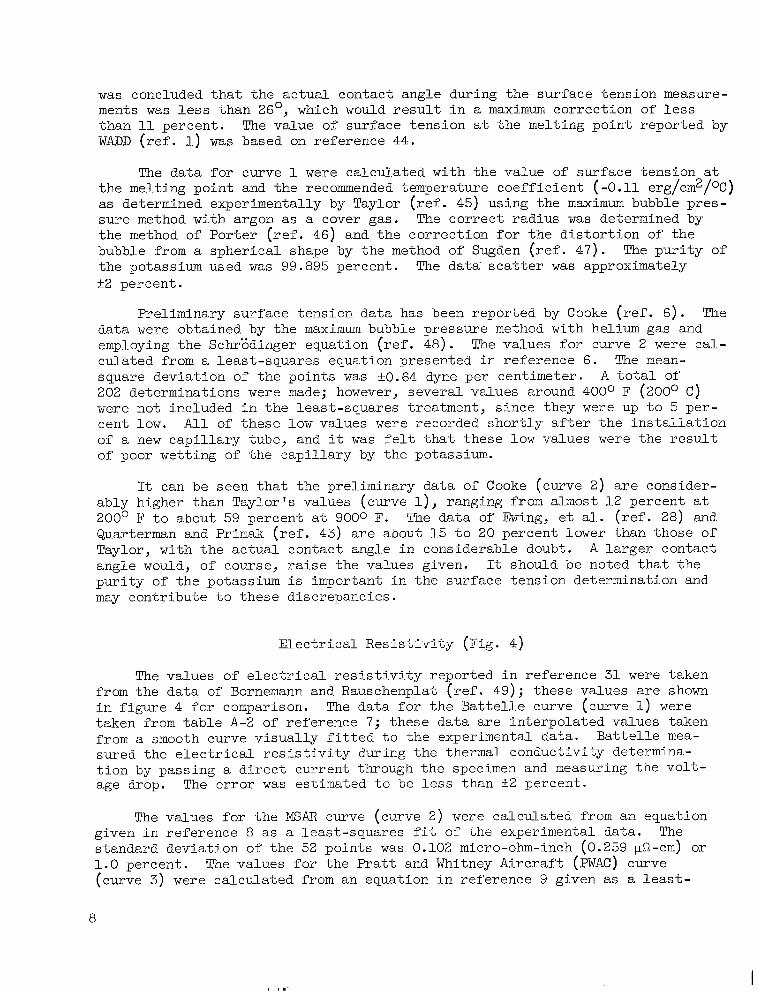
E lec t r i ca l Res i s t iv i ty (Fig. 4)
The values of e l e c t r i c a l r e s i s t i v i t y reported i n reference 31 were taken from the da ta of Bornemann and Rauschenplat ( r e f . 49); these values a r e shown i n f igure 4 fo r comparison. taken from t ab le A-2 of reference 7; these data are interpolated values taken from a smooth curve v isua l ly f i t t e d t o the experimental data. sured the e l e c t r i c a l r e s i s t i v i t y during the thermal conductivity determina- t i o n by passing a d i r e c t current through the specimen and measuring the vo l t - age drop. The e r ror w a s estimated t o be l e s s than f2 percent.
The da ta fo r t h e B a t t e l l e curve (curve 1) were
Ba t t e l l e mea-
The values fo r t he MSAR curve (curve 2 ) were calculated from an equation given i n reference 8 as a least-squares f i t of the experimental data. The standard deviat ion of t he 52 points w a s 0.102 micro-ohm-inch (0.259 @-em) or 1.0 percent. (curve 3) were calculated from an equation i n reference 9 given as a l e a s t -
The values fo r t he Pratt and Whitney Aircraf t (PWAC) curve
8
I I.
60-
10
50 -
-
!f
4
- m U
L c U a w
.- -
E 40- u 4 .- 2; > c v) .- .-
30- E
20-
-- 1600 1800 m 2200 400 800 lo00 Temperature, 1200 OF 1400 0 L "
I 100 m 300 4 0 0 5 0 0 600 700 800 900 lo00 1100 1"
Temperature, OC
Figure 4. - Electrical resistivity of potassium liquid.
squares fit of t he experimental data. The e l e c t r i c a l r e s i s t i v i t y was measured by passing a known current through a ca l ibra ted s t a i n l e s s - s t e e l tube containing the l i q u i d potassium a t a uniform temperature and measuring the po ten t i a l drop across a well-defined length of t he tube. The mean deviat ion of t he 1 5 experi- mental po in ts was k0.71 percent, with a maximum deviat ion of 2 . 3 percent a t 494' F (256.4O C ) .
It can be seen t h a t all the experimental data agree very closely over the e n t i r e temperature range, with a maximum d i f fe rence of only about 3 percent.
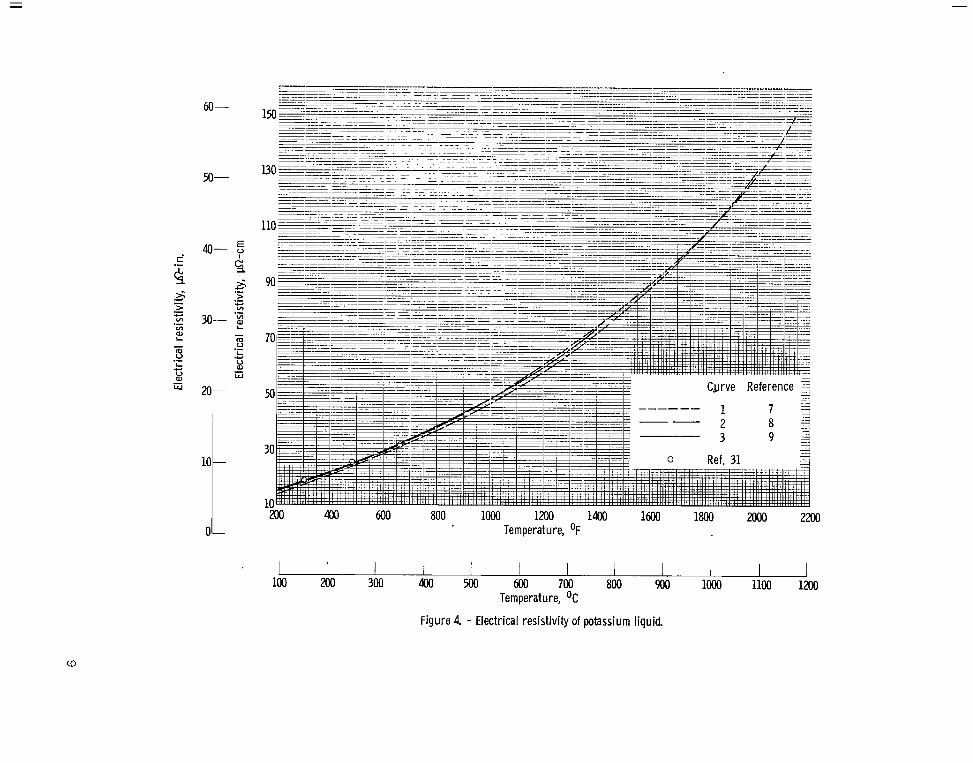
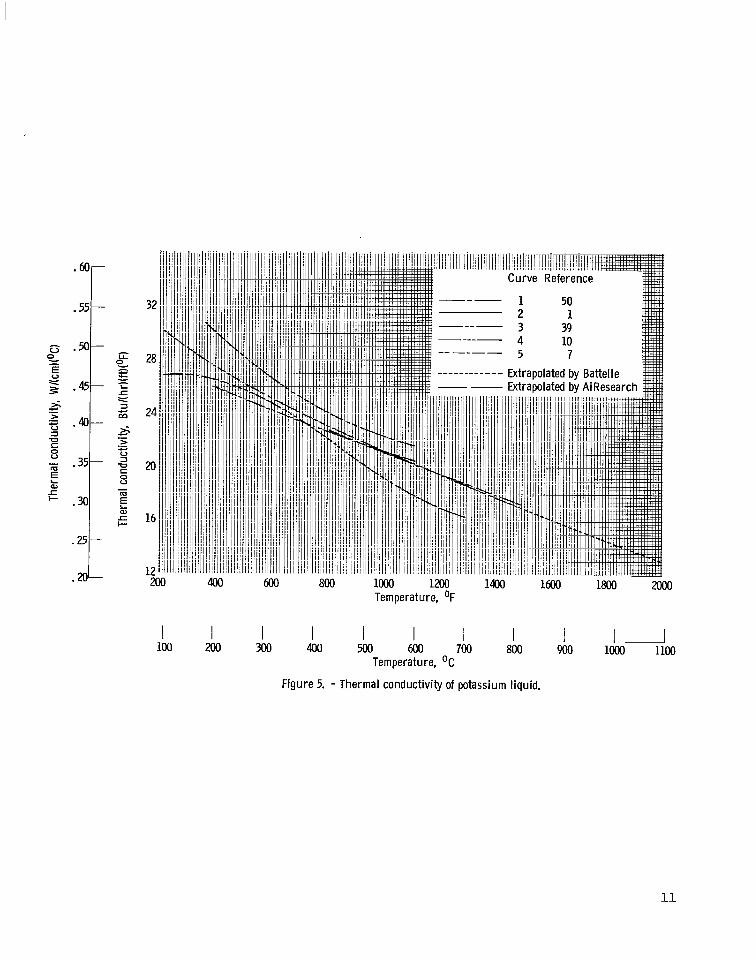
Thermal Conductivity (Fig. 5)
The experimental thermal conductivity data of Ewing, e t a l . ( r e f . 50), ob- ta ined from a longi tudina l heat-flow apparatus, is shown i n f igure 5 as curve 1. These data were a l s o reported i n reference 31. data by AiResearch Company w a s reported i n reference 1 and i s shown as curve 2.
An extrapolat ion of Ewing's
Novikov, e t a l . (ref. 39) concluded that the d i r e c t measurement of the thermal conductivity of the l i q u i d a l k a l i m e t a l s was not su i t ab le and, there- fore , chose t o measure the thermal d i f f u s i v i t y and t o ca lcu la te t he thermal conductivity as t h e product of the thermal d i f fus iv i ty , the spec i f i c heat, and the density. The spec i f i c heat values were taken from Douglas, e t al . ( r e f . 51) and the densi ty from reference 31. The deviat ion of t he readings from the mean was reported not t o exceed 0.5 percent. The values f o r curve 3 were read from a smooth curve i n reference 39.
Nikol 'ski i ( r e f . 10) developed a method of measuring thermal conductivity ca l led the method of successive s t a t iona ry states. The results of experiments using t h i s method a re shown as curve 4. from t ab le 1 2 of reference 10; these values were obtained from the smoothed curve through the experimental data. Although no values were given fo r data s c a t t e r , most of t he data points appeared t o be within about k2 Btu per hour per foot per OF of t h e smoothed curve.
The values f o r t h i s curve were taken
Battelle (ref. 7) measured the thermal conductivity up t o 1472O F (800' C ) , using a longitudinal-heat-flow, s teady-state , comparative method, with an e s t i - mated experimental e r ro r of 8 percent. Two equations were derived for the data by the method of l e a s t squares. The first, a s t r a i g h t l i n e equation ( tha t was v a l i d only from 100' t o 800' C ) had a standard deviat ion of 0.8 Btu per hour per foot per OF (0.014 W/(cm)(OC)) for the 50 data points , while the second, a second-degree equation ( t h a t could be extrapolated) had a standard deviation of 0.6 Btu per hour per foot per OF (0.011 W/(cm)(oC)). t h i s second equation (extrapolated t o 2100' F) were reported i n t ab le A-6 of reference 7 and a r e shown as curve 5.
Values calculated from
The Wiedemann-Franz-Lorenz equation s t a t e s t h a t the product of the thermal conductivity and the e l e c t r i c a l r e s i s t i v i t y divided by the absolute temperature i s equal t o a constant ca l led the Lorenz number. Lorenz number derived from the Ba t t e l l e experimental data w a s 2 .14X10'8 watt- ohm per degree squared.
The average value of t he
It should be noted t h a t t h e average value of the
10
.a-
.55-
.50-
.45-
.40-
.35-
.30-
.25-
.a-
c
Temperature, OF
I I 2 900 loo0 1100
I 800
I 700
I 600
Temperature, OC
Figure 5. - Thermal conductivity of potassium liquid.
I 500
I 400
I 300
I 200
I 100
11
I
Lorenz number obtained using the thermal conductivity data of Ewing, e t a l . (ref. 50) and the e l e c t r i c a l r e s i s t i v i t y data of reference 9 w a s a l s o 2.14X10e8 watt-ohm per degree squared. Values of thermal conductivity calculated by B a t t e l l e up t o 2100° F with t h i s average value of t h e Lorenz number were a l s o reported i n t a b l e A-6 of reference 7 and showed very good agreement with curve 5.
MSAR ( r e f . 8) reported values of thermal conductivity calculated d i r e c t l y from MSAR experimental e l e c t r i c a l r e s i s t i v i t y data, using t h e Wiedemann-Franz- Lorenz equation with the theore t ica l value of the Lorenz number of 2.45X10e8 watt-ohm per degree squared. Since t h i s t h e o r e t i c a l value is about 1 4 percent higher than t h e B a t t e l l e experimental Lorenz number and t h e e l e c t r i c a l r e s i s - t i v i t y values of these two sources d i f f e r only s l i g h t l y , it can be seen t h a t the MSAR thermal conductivity values reported a r e a l s o about 1 4 percent higher than B a t t e l l e ' s over the e n t i r e temperature range.
The data of B a t t e l l e (curve 5) a r e approximately i n t h e middle of the val- ues presented. t o 7 percent a t llOOo F higher than curve 5. (curve 1) a r e about 6 percent lower than B a t t e l l e ' s a t 400° F and cross curve 5 a t about 1000° F. The data of Nikol 'ski i (curve 4) diverge a t both the higher and lower temperatures, d i f fe r ing from t h a t of B a t t e l l e by about 1 4 percent a t ZOOo F and 12 percent a t 1300' F.
Novikov's values (curve 3) a r e from about 9 percent a t 400' F The data of Ewing, e t a l .
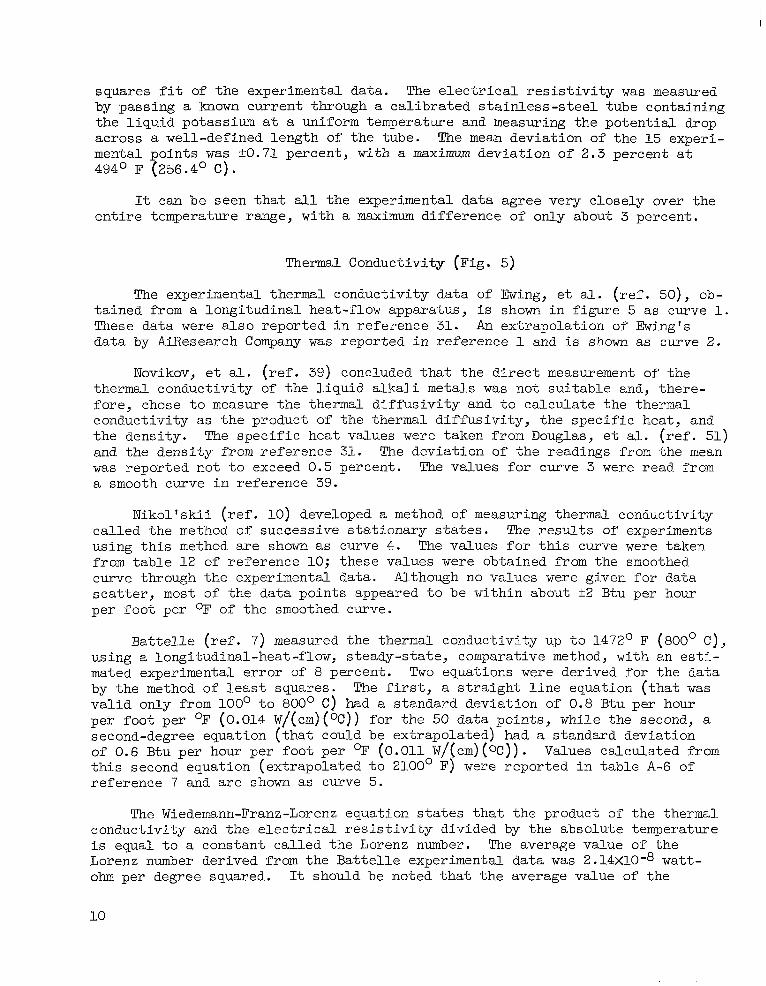
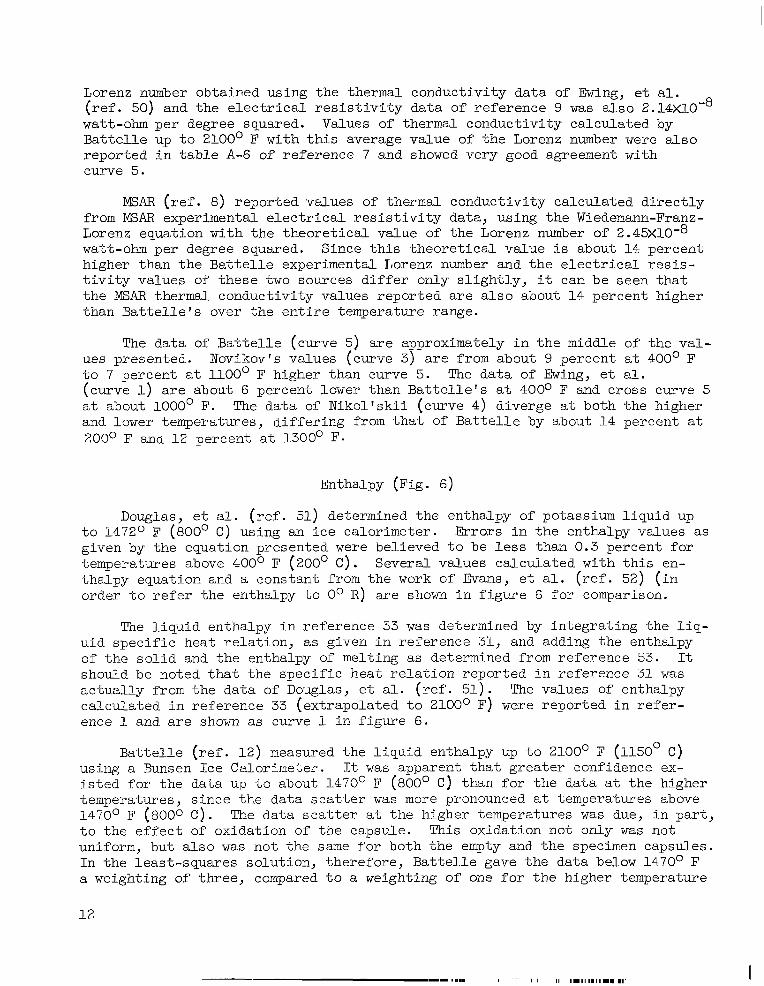
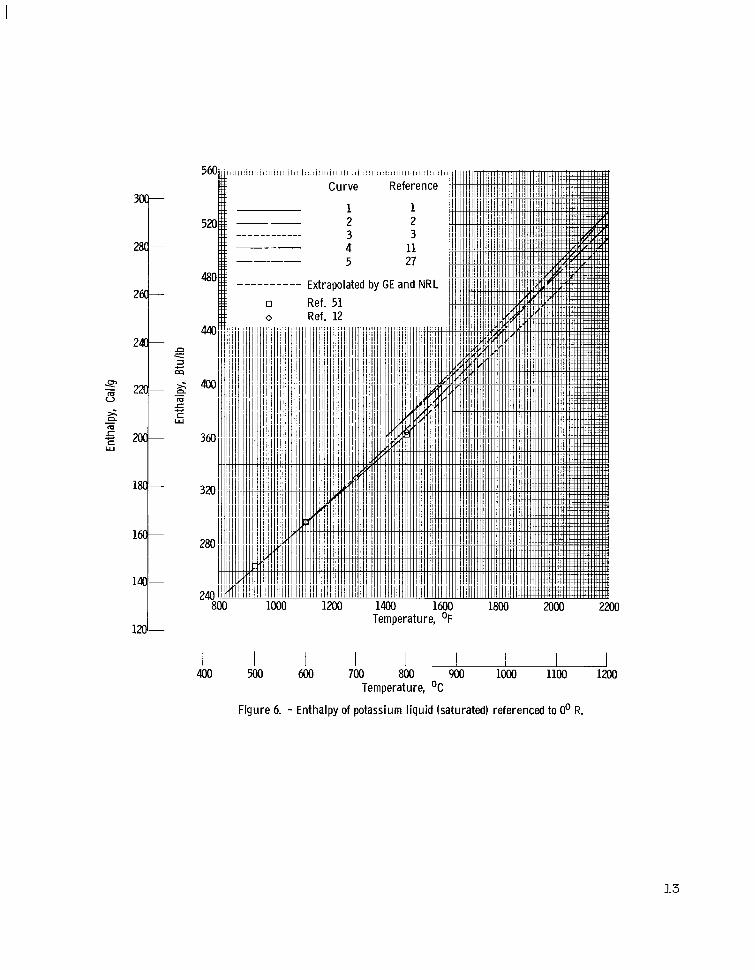
Enthalpy (Fig. 6)
Douglas, e t a l . (ref. 51) determined the enthalpy of potassium l i q u i d up t o 1472O F (800' C ) using an i c e calorimeter. given by the equation presented were believed t o be l e s s than 0.3 percent f o r temperatures above 400° F (200' C ) . Several values calculated with t h i s en- thalpy equation and a constant from the work of Evans, e t a l . ( r e f . 52) ( i n order t o r e f e r the enthalpy t o O o R ) a re shown i n f igure 6 f o r comparison.
Errors i n the enthalpy values as
The l i q u i d enthalpy i n reference 33 w a s determined by integrat ing the l i q - uid spec i f ic heat re la t ion , as given i n reference 31, and adding the enthalpy of the s o l i d and the enthalpy of melting as determined from reference 53. It should be noted t h a t the spec i f ic heat r e l a t i o n reported i n reference 31 w a s ac tua l ly from the data of Douglas, e t a l . ( r e f . 51). The values of enthalpy calculated i n reference 33 (extrapolated t o 2100' F) were reported i n re fer - ence 1 and are shown as curve 1 i n f igure 6.
B a t t e l l e ( r e f . 1 2 ) measured the l i q u i d enthalpy up t o 2100' F (1150' C ) It w a s apparent t h a t g rea te r confidence ex- using a Bunsen Ice Calorimeter.
i s t e d for the data up t o about 1470' F (800' C > than f o r t h e data a t the higher temperatures, s ince the data s c a t t e r w a s more pronounced a t temperatures above 1470° F (8000 C ) . The data s c a t t e r a t the higher temperatures w a s due, i n par t , t o the e f f e c t of oxidation of the capsule. uniform, but a l s o w a s not the same f o r both the empty and the specimen capsules. In the least-squares solution, therefore, B a t t e l l e gave the data below 1470° F a weighting of three, compared t o a weighting of one f o r the higher temperature
This oxidation not on ly w a s not
1 2
800 1000 1200 1400 1600 1800 MOO 2200 Temperature, OF
I 900 lo00 1100 1200
I 800
Temperature, OC
Figure 6. - Enthalpy of potassium l iquid (saturated) referenced to Oo R.
I 700
I 600
I 500
I 400
13
data . The standard deviation from the r e s u l t i n g equation was 3.04 B t u per pound (1.69 Cal/g) f o r t h e 23 values from the melting point t o 2100' F. deviation w a s 1 . 2 0 Btu per pound (0.67 Cal/g) f o r the 13 values below 1470' F and 4.55 Btu per pound (2.53 Cal/g) f o r the 10 values above 1470' F. ing the u n i t s o f t h e previous equation and adding a constant from the work of Evans, e t a l . ( r e f . 52), Battel le obtained an equation (presented i n r e f . 2) for l i q u i d enthalpy referenced t o Oo R (0' K ) . Values calculated from t h i s equa- t i o n were presented i n t a b l e C-2 of reference 2 and are shown as curve 2.
The standard
By chang-
Bat te l le a l s o determined a least-squares f i t of only the data from the melting point t o 1470' F; t h e standard deviation of the 13 points from t h i s equation (presented i n t a b l e 6 of r e f . 12) w a s 0.77 B t u per pound (0.43 Cal/g). Several values calculated by means of t h i s enthalpy equation and a constant from the work of Evans, e t a l . ( r e f . 52) ( i n order t o r e f e r the enthalpy t o 0' R) a r e shown i n f igure 6.
The data f o r one NRL curve (curve 3) were taken from t a b l e 5 of r e f e r - ence 3; these enthalpy values were calculated from an equation derived by NRL d i r e c t l y from the work of Douglas, e t a l . (ref. 51), with a constant from the work of Evans, e t al. ( r e f . 52), and extrapolated by NRL t o 2500' F. nary s p e c i f i c heat r e s u l t s a t NRL ( r e f . 13) i n t h e temperature range from 1300' t o 2100' F show an average deviation of k1.4 percent from values calculated from the equation of reference 51 and tend t o j u s t i f y the enthalpy extrapolation.
Prelimi-
The data f o r t h e other NRL curve (curve 4) were taken from t a b l e 11 of r e f - erence 11; NRL obtailled these enthalpy values by subtract ing the enthalpy of va- porizat ion from t h e enthalpy of the saturated vapor, using the values presented i n t a b l e 11 ( r e f . 11). The enthalpy of t h e saturated vapor presented i n re fer - ence 11 w a s computed with v i r i a l coeff ic ients , by using the propert ies of the monomeric gas a t one atmosphere as given by Evans, e t a l . ( r e f . 52) as a base, or s t a r t i n g point . shown as curve 5.
The NRL f i n a l values from appendix A of reference 27 a r e
It can be seen from f igure 6 t h a t the values calculated from the Bat te l le (ref. 12) equation, which considered only the data a t temperatures l e s s than 1470' F (80O0 C ) , agree very well with the values calculated from Douglas, e t a l . ( r e f . 51). (both based on the data of r e f . 51) agree very well with each other. curve (curve 4) i s from 3 t o 4 percent higher, while the f i n a l NRL curve (curve 5) i s 2 t o 3 percent higher than curve 1 over the range shown. Bat te l le data (curve 2) agree very closely with curve 1 a t the lower tempera- tu res and l i e between the values given by NRL a t t h e higher temperatures, d i f - fer ing from curve 3 by 3 percent a t 20000 F. While t h i s difference i s small, the difference i n the slope of curve 2 a f f e c t s the change i n enthalpy with tem- perature (therefore, the spec i f ic heat) t o a grea te r degree.
The extrapolated curves of NRL (curve 3) and WADD (curve 1) The NRL
The
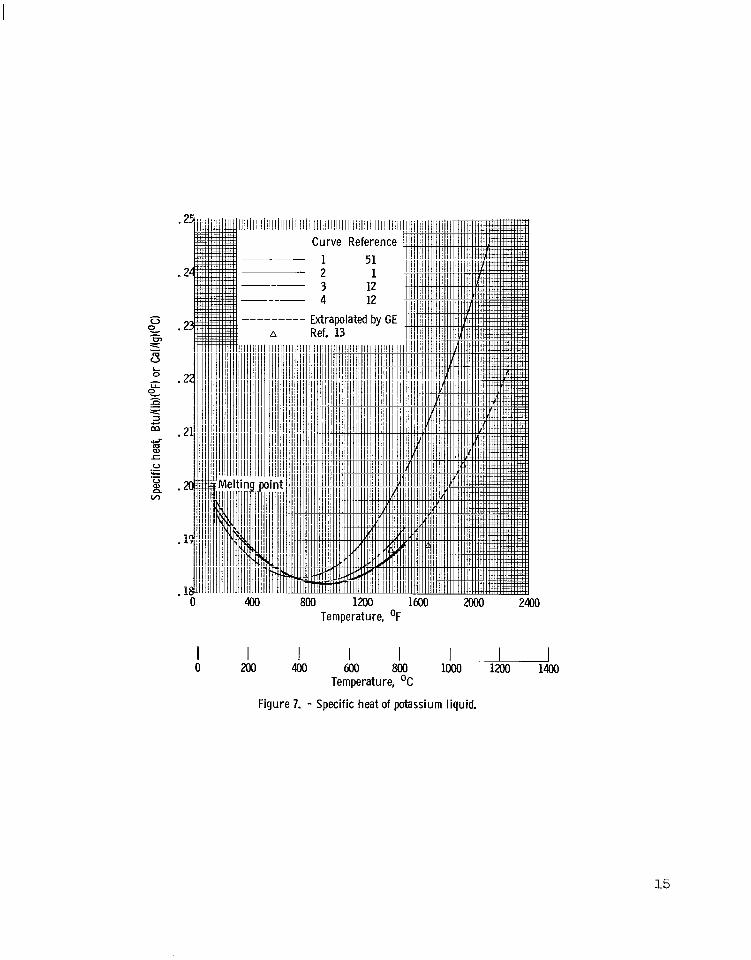
Specif ic Heat (Fig. 7)
Douglas, e t al. (ref. 51) , derived the s p e c i f i c heat r e l a t i o n from a cor- rected first der ivat ive of the equation representing t h e i r experimental l i q u i d
14
L 0
. -- 0 800 1200 1600 2000 2400
Temperature, OF
I ~U lo00 1m 1400
I 800
I 600
I 400
I 200
I 0
Temperature, O C
Figure 7. - Specific heat of potassium liquid.
15
enthalpy data. from the derived equation w a s 0.4 percent for the range from 200' t o 1300° F (100' t o 700' C ) . The values from re?erence 51 were a l s o reported i n re fer - ence 31 and a r e shown as curve 1 i n f igure 7 . The data reported i n reference 31 were extrapolated t o 2200' F i n reference 33; these values were a l s o reported by WADD ( re f . 1) and a r e shown as curve 2 .
The uncertainty assigned t o the heat capacity values calculated
Values of s p e c i f i c heat determined by Nikol 'ski i ( r e f . 10) using t h e d i r e c t heating method a r e i d e n t i c a l t o the values of reference 51 f o r the range of 200' t o 750° F (looo t o 400' C).
B a t t e l l e ( r e f . 1 2 ) determined the s p e c i f i c heat from a corrected f i rs t de- r i v a t i v e of the equation derived by a least-squares f i t of the experimental l i q - uid enthalpy data. A s noted i n the discussion of l i q u i d enthalpy, B a t t e l l e pre- sented two equations t o represent t h e experimental enthalpy data, because of the increased data s c a t t e r a t temperatures above 1470O F (800° C); therefore, two equations were a l s o derived f o r the s p e c i f i c heat. the e n t i r e temperature range (melting point t o 2100' F) were considered i n the least-squares f i t , the spec i f ic heat r e s u l t s ( tabulated i n t a b l e 4 of r e f . 1 2 ) w e r e as shown i n curve 3. However, when o n l y the enthalpy data over the temper- a t u r e range of the melting point t o 1472' F (800' C) were used f o r the l e a s t - squares f i t , the r e s u l t s ( tabulated i n t a b l e 6 of r e f . 1 2 ) were as shown i n curve 4. Preliminary values of spec i f ic heat reported by NRT; i n reference 13 a r e a l s o shown f o r comparison.
When the enthalpy data over
It can be seen t h a t the B a t t e l l e s p e c i f i c heat values (curve 4) t h a t were based on the more r e l i a b l e of t h e i r enthalpy data agree very well with the work of Douglas, e t a l . (curve 1). It can a l s o be seen t h a t t h e preliminary values reported by NRL tend t o j u s t i f y the extrapolated values of curve 2. The other B a t t e l l e curve (curve 3) shows good agreement a t t h e lower temperatures but d i f f e r s s ign i f icant ly a t the higher temperatures; t h i s difference a t 2000° F i s 13 percent.
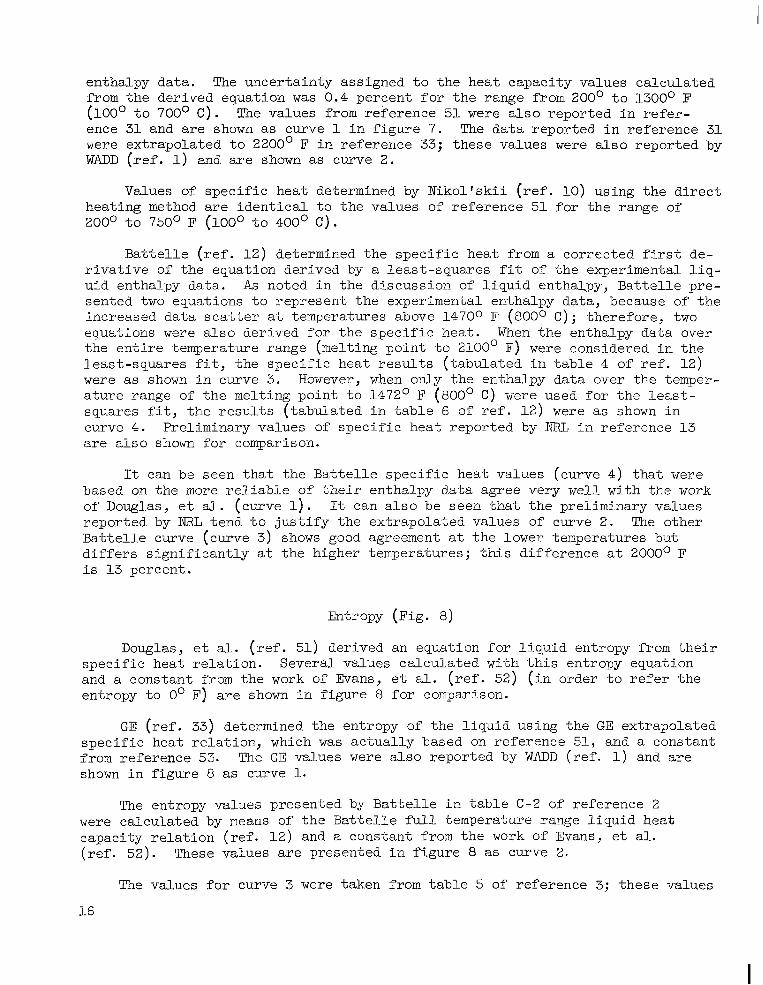
Entropy (Fig. 8 )
Douglas, e t a l . ( r e f . 51) derived an equation f o r l i q u i d entropy from t h e i r spec i f ic heat r e l a t i o n . Several values calculated with t h i s entropy equation and a constant from the work of Evans, e t a l . ( r e f . 52 ) ( i n order t o r e f e r the entropy t o 0' F) a r e shown i n f igure 8 f o r comparison.
GE ( r e f . 33) determined the entropy of the l i q u i d using the GE extrapolated spec i f ic heat re la t ion , which w a s ac tua l ly based on reference 51, and a constant from reference 53. The GE values were a l s o reported by WADD ( re f . 1) and are shown i n f igure 8 as curve 1.
The entropy values presented by B a t t e l l e i n t a b l e C-2 of reference 2 were calculated by means of t h e B a t t e l l e f u l l temperature range l i q u i d heat capacity r e l a t i o n ( r e f . 1 2 ) and a constant from the work of Evans, e t a l . (ref. 52). These values a r e presented i n f igure 8 as curve 2.
The values f o r curve 3 were taken from t a b l e 5 of reference 3; these values
16
I
L 0
25 e c c w
800 lo00 1Mo 1400 1600 1800 Moo 2m Temperature, OF
I I I I IU I I 900 IO00 1100 1200 800
Temperature, OC
Figure 8. - Entropy of potassium l iquid (saturated) referenced to Oo R.
700 400 5 0 0 6 0 0
17
were calculated by means of an equation derived by NRL from the work of Douglas, e t al . ( r e f . 51) using a constant from the work of Evans, e t al. (ref. 52) and extrapolated by NRL t o 2500' F. (ref. 13) i n the temperature range from 1300° t o 2100' F show an average devi- a t i o n of k1.4 percent from the values calculated from t h e equation of r e f e r - ence 51 and tend t o j u s t i f y the entropy extrapolation.
Preliminary s p e c i f i c heat r e s u l t s a t NRL
The values f o r curve 4 were obtained by NRL by subtract ing the entropy of vaporization from the entropy of the sa tura ted vapor as presented i n t a b l e 11 of reference 11. The entropy of saturated vapor as presented i n reference 11 w a s computed with v i r i a l coeff ic ients , using the propert ies of the monomeric gas a t one atmosphere as given by Evans, e t al. (ref. 5 2 ) , as a base, o r s tar t - i.ng point . curve 5.
The NRZ; f i n a l values from appendix A of reference 27 are shown as
It can be seen t h a t the extrapolated curves of WADD (curve 1) and NRL (curve 3) (both based on r e f . 51) agree very well with each other. The NRL curve (curve 4) i s about 1 percent higher than curve 3, and curve 5 is within 0.5 percent of curve 4. values calculated from Douglas, e t a l . (ref. 51) a t the lower temperatures and l i e s between t h e two values given by NRL a t t h e higher temperatures, d i f fe r ing from curve 3 by only 1 percent a t 2000° F.
The B a t t e l l e curve (curve 2 ) agrees very well with the
SATURATED VAPOR PROPERTIES
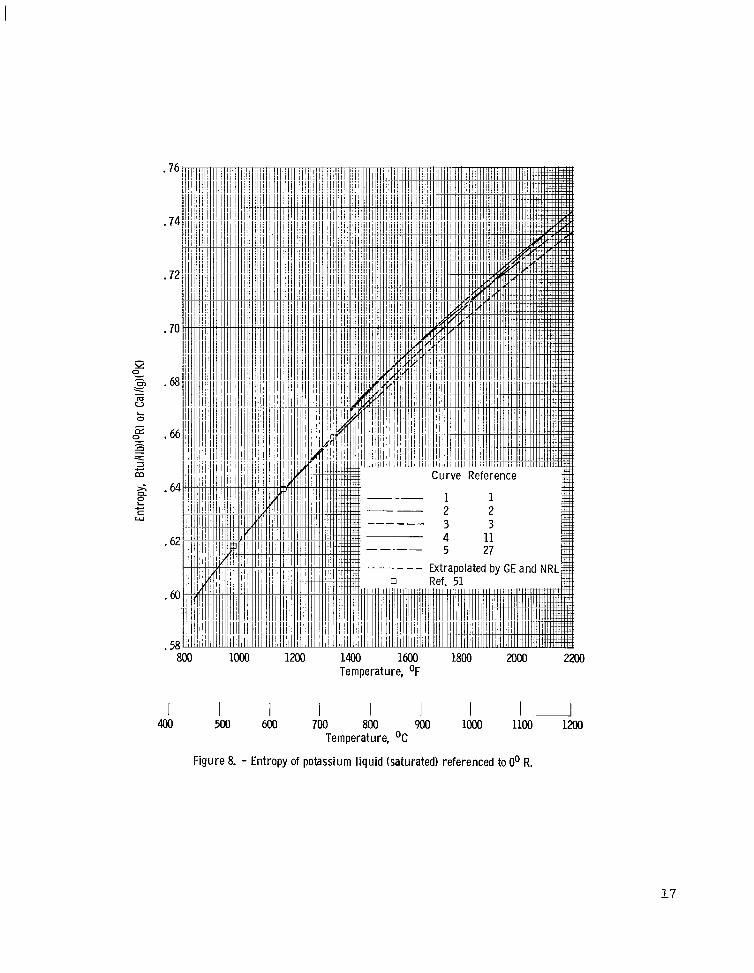
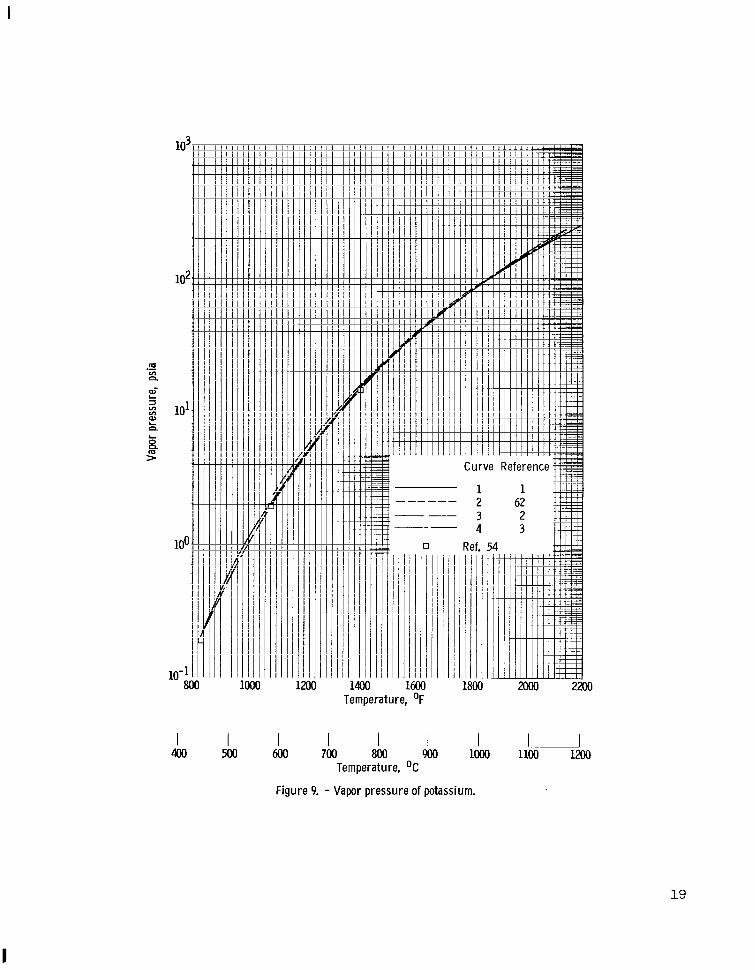
Vapor Pressure (Fig. 9)
I n 1941, Ditchburn and Gilmour ( r e f . 54) correlated the vapor pressure data of several invest igators ( r e f s . 55 t o 61) and derived an equation with an e s t i - mated accuracy of 5 percent for the range from 620' t o 1520' F or 20 percent f o r the range from 170' t o 1700' F. equation were a l s o reported i n reference 31, and several of these values a r e shown i n f igure 9 for comparison.
Values of vapor pressure calculated from t h i s
The values given by the equation of reference 54 (as presented i n r e f . 31) were modified by GE ( r e f . 33) i n order t o y i e l d consis tent r e s u l t s i n the ca l - culat ion of thermodynamic propert ies . The r e s u l t s of t h i s modification were a l s o reported by WADD (ref. 1) and a r e shown i n f igure 9 as curve 1.
Makansi, e t a l . , ( r e f . 62) measured the vapor pressure i n t h e range from 0.162 t o 6.529 atmospheres absolute (2.4 t o 96 p s i a ) . with a least-squares equation with a reported standard e r ror of 1.1 percent of the value of the pressure. Values calculated from t h i s equation a r e shown as curve 2 .
The data were f i t t e d
B a t t e l l e ( r e f . 14) measured the vapor pressure by determining the temper- a ture a t which the pressure of the potassium vapor became equal t o a fixed he- l i u m pressure. This temperature w a s obtained by observing the slope of the time-temperature curve as the specimen capsule w a s heated a t a s e t r a t e . With t h e stainless-steel capsule used a t t h e lower temperatures, the slope of t h i s
18
I
102
101
100
I 400
-
t i 7 I f I I
I I I
I I
io00 1200
I I
Curve Reference
4
1400 1600 Temperature, OF
I I 600 700 800 900
Temperature, OC
#m
Moo 2200
Figure 9. - Vapor pressure of potassium.
19
curve changed abruptly as the boi l ing point w a s reached; however, with the niobium-1 zirconium capsule used a t higher temperatures, no abrupt change w a s noted. Instead, the change of slope w a s very gradual near the boi l ing point . Therefore, the nearly constant slope regions of preboi l ing and postboiling were extrapolated t o t h e i r in te rsec t ion t o determine the boi l ing point . An equation t o represent t h e experimental data w a s derived, based on t h e r e l a t i o n of Thorn and Winslow ( r e f . 63) . k0.0097 i n the logarithm of the pressure i n atmospheres. This standard devia- t i o n corresponds t o an uncertainty i n the vapor pressure of 2.26 percent. V a l - ues calculated from the B a t t e l l e equation were tabulated i n tab le C - 1 of r e f e r - ence 2 and a r e shown i n f igure 9 as curve 3.
The standard deviation f o r the B a t t e l l e equation w a s
The values f o r the NRL curve (curve 4) w e r e taken from t a b l e 5 of r e f e r - ence 3; these values were calculated from an equation obtained by a l e a s t - squares treatment of the NRL experimental vapor pressure data, measured during the pressure-volume-temperature (PVT) experiments. The average deviation of the observed values from t h e corresponding calculated values w a s 20.31 percent. The NRL f i n a l values from appendix A i n reference 27 a r e t h e same as curve 4.
It w a s noted i n reference 14 t h a t the data of Grachev and Kir i l lov ( r e f . 64) deviated widely a t a l l temperatures and must be i n e r ror .
It can be seen i n f igure 9 t h a t the B a t t e l l e curve (curve 3) shows good agreement with the correlated values of Ditchburn and Gilmour ( r e f . 54) i n t h e lower temperature range and with the NRL experimental values (curve 4) a t the higher temperatures. The maximum difference with NRL i s about 5 percent a t 1400' F. higher than B a t t e l l e ' s a t the lower temperatures and up t o 3 percent lower a t the higher temperatures, crossing a t about 1650' F. The values of Makansi, e t a l . (curve 2 ) a r e higher than those of B a t t e l l e and NRL over the range shown and d i f f e r from B a t t e l l e ' s by 10 t o 15 percent a t the lower %emperatures.
The modified values reported by WADD (curve 1) a r e from 6 t o 8 percent
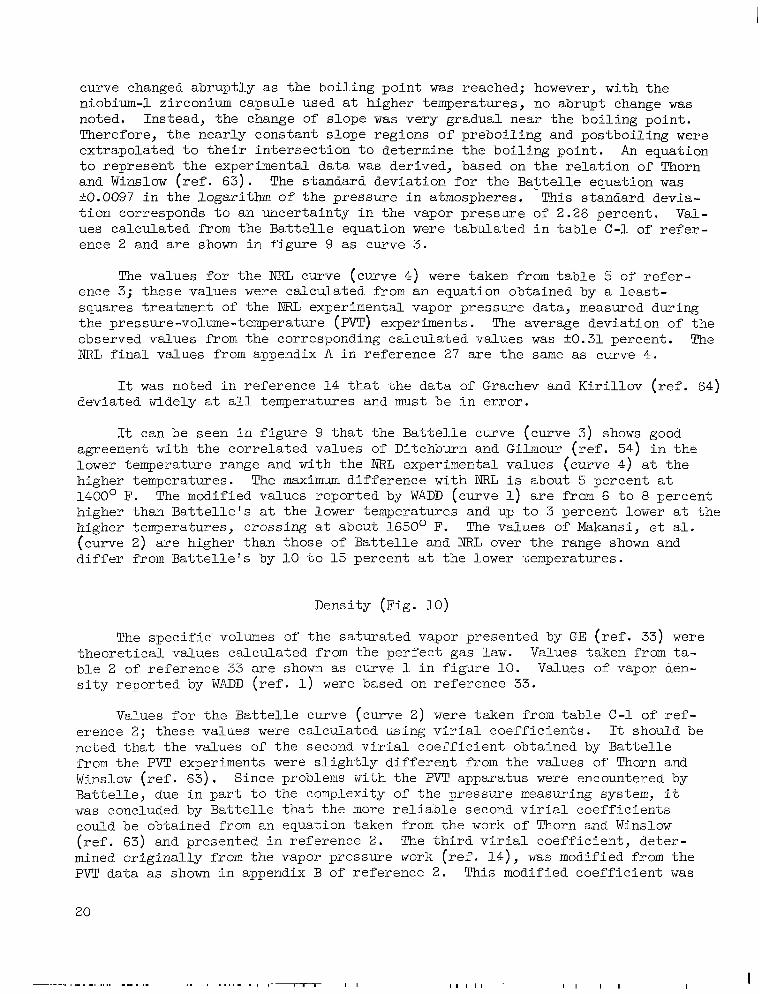
Density (Fig. 10)
The specif ic . volumes of the saturated vapor presented by GE ( r e f . 33) were theore t ica l values calculated from the per fec t gas l a w . Values taken from ta- b l e 2 of reference 33 a r e shown as curve l i n f igure 10. Values of vapor den- s i t y reported by WADD ( r e f . 1) were based on reference 33.
Values f o r t h e B a t t e l l e curve (curve 2 ) were taken from t a b l e C-1 of r e f - erence 2; these values were calculated using v i r i a l coef f ic ien ts . noted t h a t the values of the second v i r i a l coef f ic ien t obtained by B a t t e l l e from the PVT experiments were s l i g h t l y d i f f e r e n t from the values of Thorn and Winslow ( r e f . 63). Since problems with the PVT apparatus were encountered by Bat te l le , due i n p a r t t o the complexity of the pressure measuring system, it w a s concluded by B a t t e l l e t h a t the more r e l i a b l e second v i r i a l coeff ic ients could be obtained from an equation taken from the work of Thorn and Winslow ( r e f . 63) and presented i n reference 2 . The t h i r d v i r i a l coeff ic ient , deter- mined or ig ina l ly from the vapor pressure work ( r e f . 14), w a s modified from the PVT data as shown i n appendix B of reference 2 . This modified coef f ic ien t w a s
It should be
20
I 1 I I 1 I 1 I 1 I I
10-4
3 10-J
-4
lo+
-5 lO"2
I 400
lo00
500 600
1200
700
Curve
1400 1600 1800 Temperature, OF
I I d 900 lo00 1100 1x0
I 800
Temperature, O C
Figure 10. - Density of potassium vapor (saturated).
21
used i n the ca lcu la t ion of t h e vapor s p e c i f i c volwne.
The data for t h e NRL curve (curve 3) were taken from t a b l e 5 of r e f e r - ence 3; these data w e r e computed from the v i r i a l equation of s t a t e . coef f ic ien ts were derived graphically from t h e PVT data of reference 3. c i f i c volumes a t sa tura t ion f o r nine temperatures from 1570' to 2289' F were a l s o d i r e c t l y observed by NRL and were presented i n t a b l e 4 of reference 3. The observed values deviated from computed values by an average of st0.33 per- cent. The NRL f i n a l values from appendix A of reference 27 l i e on curve 3.
The v i r i a l Spe-
"he B a t t e l l e curve (curve 2 ) agrees very w e l l with the theore t ica l values of curve 1 a t the lower temperatures, and both t h e B a t t e l l e and NRL curves de- v i a t e from the t h e o r e t i c a l values a t the higher temperatures. A t 2000' F, the B a t t e l l e value of vapor density i s 1 6 percent higher than the NRL value, and the NRL value is 10 percent higher than the t h e o r e t i c a l value.
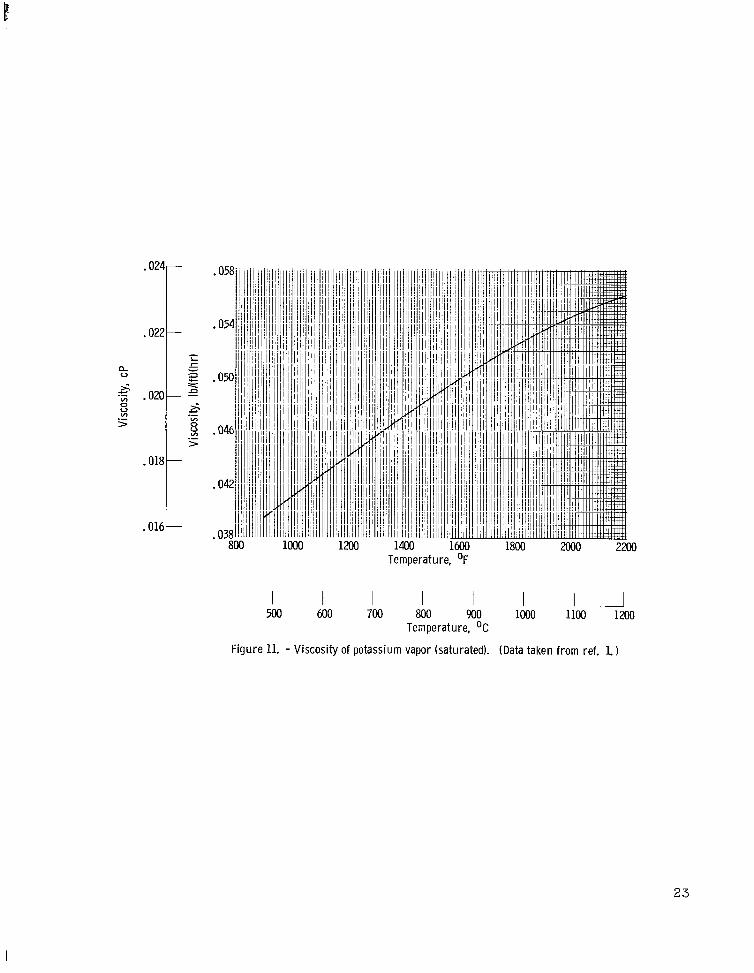
Viscosity (Fig. 11)
The values presented by WADD ( r e f . 1) a r e t h e o r e t i c a l and were computed f o r var iable molecular weight saturated vapor by means of an equation f o r gas v iscos i ty presented i n reference 65.
It should be noted t h a t B a t t e l l e ( r e f . 15) attempted t o determine t h i s prop- e r ty , but experimental d i f f i c u l t i e s prevented completion of the program.
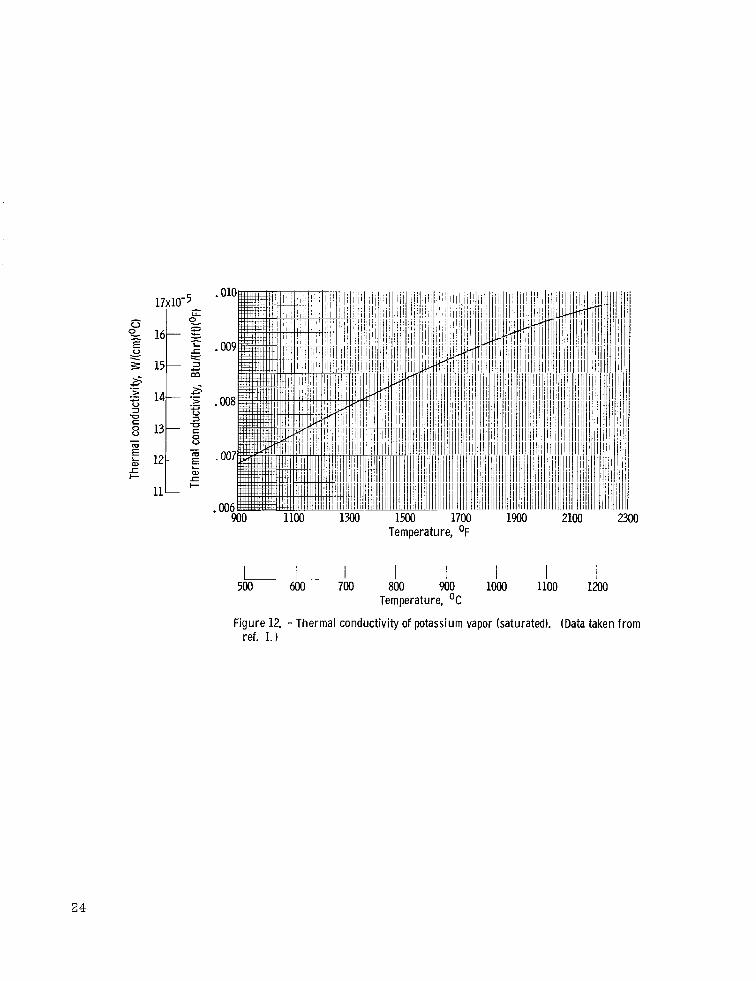
Thermal Conductivity (Fig. 1 2 )
The values presented by WADD ( r e f . 1) were estimated by assuming a con- s t a n t Prandtl number of 0.73. and absolute v iscos i ty ( f i g . 11) were then used t o compute the thermal conduc- t i v i t y of the saturated vapor. These WADD values a r e shown i n f igure 1 2 . B a t t e l l e ( r e f . 15) attempted t o determine t h i s property, but experimental d i f - f i c u l t i e s prevented completion of the program.
Values of frozen s p e c i f i c heat (curve 1, f i g . 15)
It can be seen t h a t the value o f the thermal conductivity calculated i n t h i s manner i s d i r e c t l y affected by the values used f o r spec i f ic heat and v i s - cos i ty as well as the value assumed for the Prandt l number.
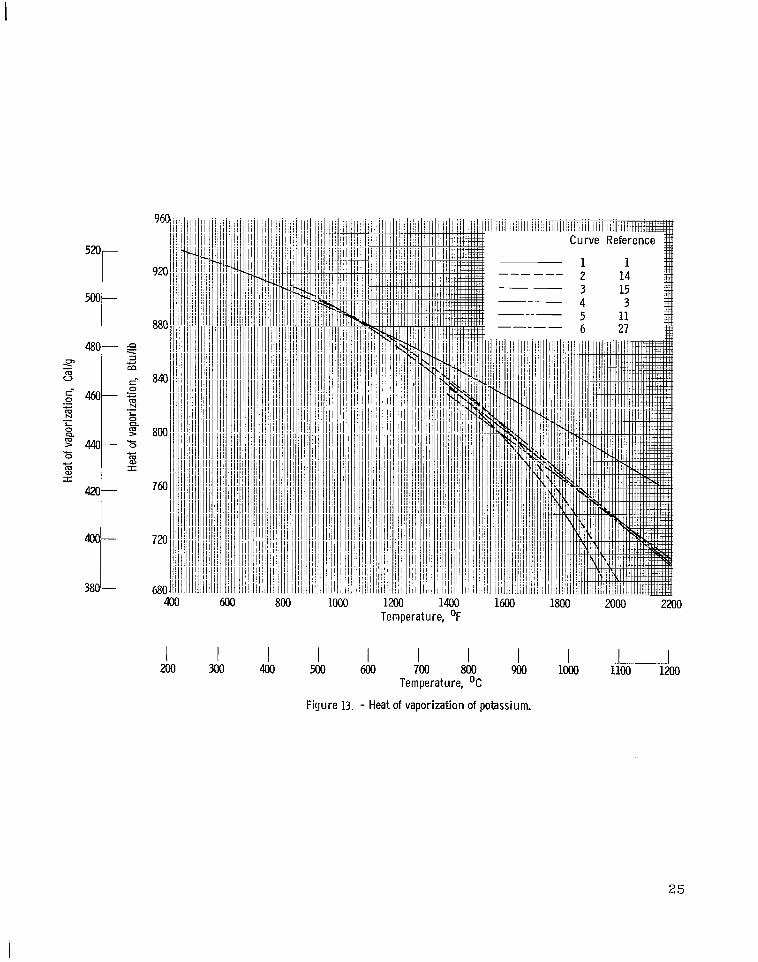
Heat of Vaporization (Fig. 13)
GE calculated t h e theore t ica l values f o r the enthalpy of the saturated va- por using constants from reference 53. Values of the heat of vaporization ob- ta ined by subtract ing the enthalpy of the saturated l i q u i d from the enthalpy of the saturated vapor a t the same temperature as given i n tab le 2 of reference 33 were a l s o reported by WADD ( r e f . 1) and a r e shown as curve 1 i n f igure 13.
Bat te l le calculated the heat of vaporization using the Bat te l le experimen- t a l l y determined vapor pressure equation ( r e f . 14 ) and the Clapeyron equation
22
a V
.- i5 VI 0
2 .- >
.022
. 016L
Temperature, OF
I I I .A I I 1000 1100 1200 900 700 800
I 600
I 500
Temperature, OC
Figure 11. - Viscosity of potassium vapor (saturated). (Data taken from ref. 1.)
23
I
s c .- > V 3 -0 c 0 V
.- c
13 V
Temperature, OF
1 I I I 900 lo00 1100 1200
I 800 500 600 700
Figure 12. - Thermal conductivity of potassium vapor (saturated). (Data taken from
I- I Temperature, OC
ref. 1.)
24
480 c m c- 0
L 0
m > N L 0
n .- n
0 m I
I
c
c m al
Temperature, "F
I 1 I I u 900 io00 iioo 1x1 700 800
Temperature, OC
I 600
I 500
I 400
I 300
I 200
Figure 13. - Heat of vaporization of potassium.
25
with the nonideal gas theory and v i r i a l coe f f i c i en t s . These coef f ic ien ts were discussed i n the vapor densi ty sec t ion of t he present report , and both r e l a t ions derived fo r t he t h i r d v i r i a l coef f ic ien t were used t o ca lcu la te values of t h e hea t of vaporization. Ba t t e l l e used the o r ig ina l r e l a t i o n fo r t he t h i r d v i r i a l coef f ic ien t (as obtained from the vapor pressure work, r e f . 14) t o ca lcu la te t he values presented i n t a b l e 2 of reference 14, shown i n f igure 13 as curve 2 . Ba t t e l l e then used the f i n a l or modified r e l a t i o n fo r t h e coef f ic ien t t o calcu- l a t e the values presented i n t ab le 5 of reference 15, shown i n f igure 13 as curve 3.
The data fo r t h e NRL curve (curve 4) were taken from t a b l e 5 of r e f e r - ence 3; these data were calculated by using the NRL vapor pressure equation ( r e f . 3) with t h e Clapeyron equation. t h a t calculat ion were computed from an equation presented as a representat ion of NRL experimental data .
The values of spec i f i c volume used i n
The values fo r t h e rJRL curve (curve 5) were taken from t ab le 11 of r e f e r - ence 11; these values a l s o w e r e calculated using the NRL vapor pressure equa- t i o n with t h e Clapeyron equation. d i f f e r very s l igh t ly ; apparently the values of sa tura ted vapor spec i f i c volume used i n the ca lcu la t ion i n reference 11 were computed from t he v i r i a l equation of s t a t e . curve 6 .
However, t he two NRL curves (curves 3 and 4)
The NRL f i n a l values from appendix A of reference 27 a r e shown as
The l a t e n t heat of vaporization i s being determined by d i r ec t measurement ( r e f . 16), and very preliminary r e s u l t s ind ica te values approximately 5 percent lower than curve 1 over the range of measurement (up t o 1700' F i n r e f . 1 6 ) .
It can be seen t h a t t h e values given by both NRL and Ba t t e l l e deviate s ig - n i f i can t ly from t h e t h e o r e t i c a l values of WADD (curve 1) a t the higher temper- a tures . lower a t about 11 percent f o r curve 2 and 1 4 percent fo r curve 3. Curve 6 i s within 1 percent of curve 4.
A t 2000° F, NRL is about 6 percent lower than WADD and Ba t t e l l e i s even
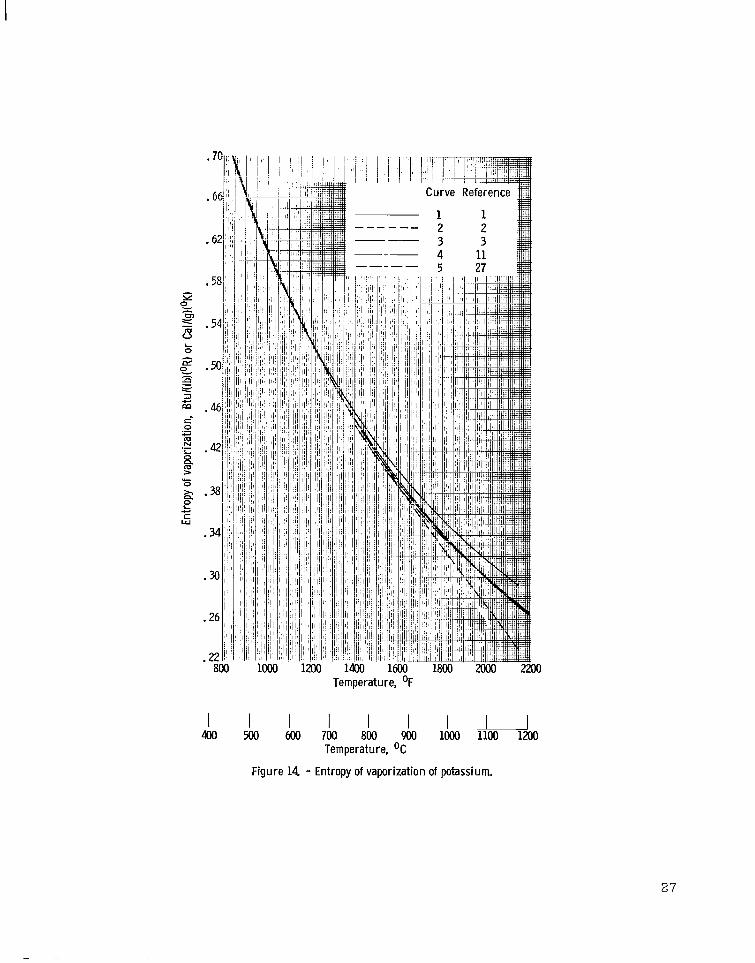
Entropy of Vaporization (Fig. 14 )
Theoretical values of t he entropy of sa tura ted vapor were calculated by GE with constants from reference 53. These entropy values were a l so reported by WADD ( r e f . 1). Data f o r t h e entropy of vaporization, obtained by subt rac t - ing the entropy of t h e s a t u r a t e d l i q u f d from t h e entropy of the saturated vapor a t t h e same temperature using values presented i n t a b l e 2 of reference 33, a r e shown as curve 1 i n f igu re 14 .
B a t t e l l e calculated t h i s property by dividing the enthalpy of vaporization (as given by curve 3, f i g . 13) by the absolute temperature. Ba t t e l l e curve (curve 2 ) were obtained by subtract ing the entropy of the s a t - urated l i q u i d from the entropy of the sa tura ted vapor as presented i n tab les C - 2 and C-1, respect ively, of reference 2 .
Values for t he
NRL a l s o ca lcu la ted t h i s property by dividing t h e enthalpy of vaporization
26
Temperature, OF
L I I I I I I U 400 500 600 700 800 900 loo0 1100 1200
Temperature, OC
Figure 14. - Entropy of vaporization of potassium.
27
by the sa tura t ion temperature. The data f o r the NRL curves (curves 3 and 4) were taken from t a b l e 5 of reference 3 and t a b l e 11 of reference 11, respec- t ive ly , and d i f f e r very l i t t l e from t h e NRL f i n a l values from appendix A of ref- erence 27 shown as curve 5.
It can be seen t h a t both the NRL and B a t t e l l e values deviate s i g n i f i c a n t l y from the t h e o r e t i c a l values of WADD (curve 1) a t t h e higher- temperatures. 2000' F, the NRL values a r e 6 percent lower than those of WADD, and the B a t t e l l e values a r e 14 percent lower than those of WADD.
A t
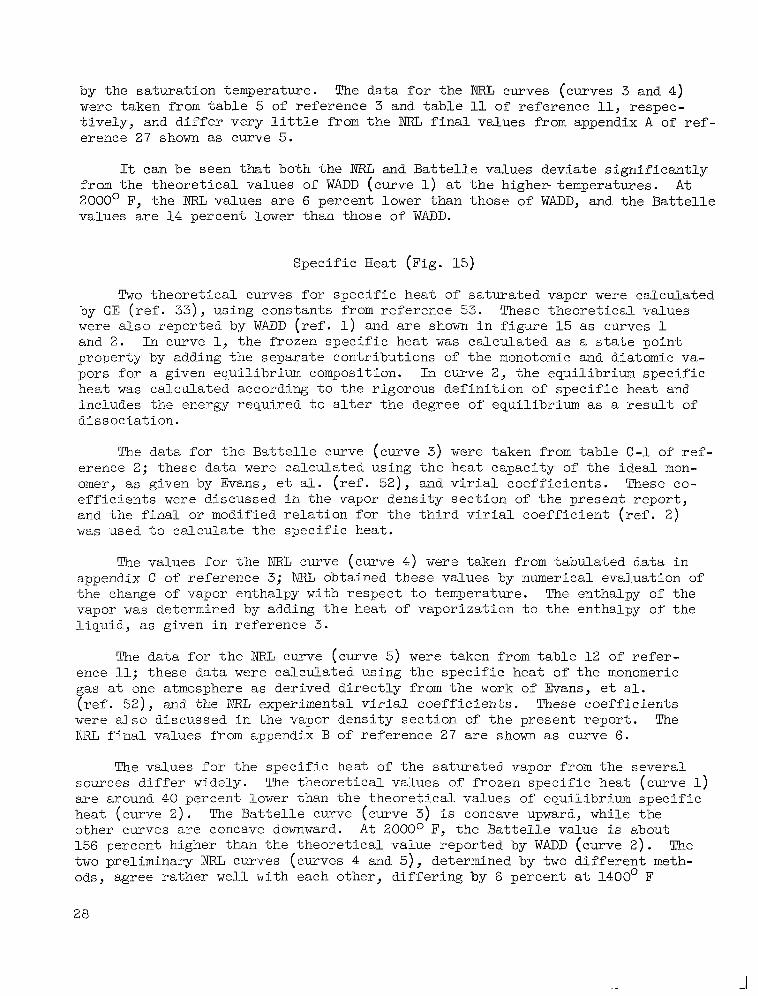
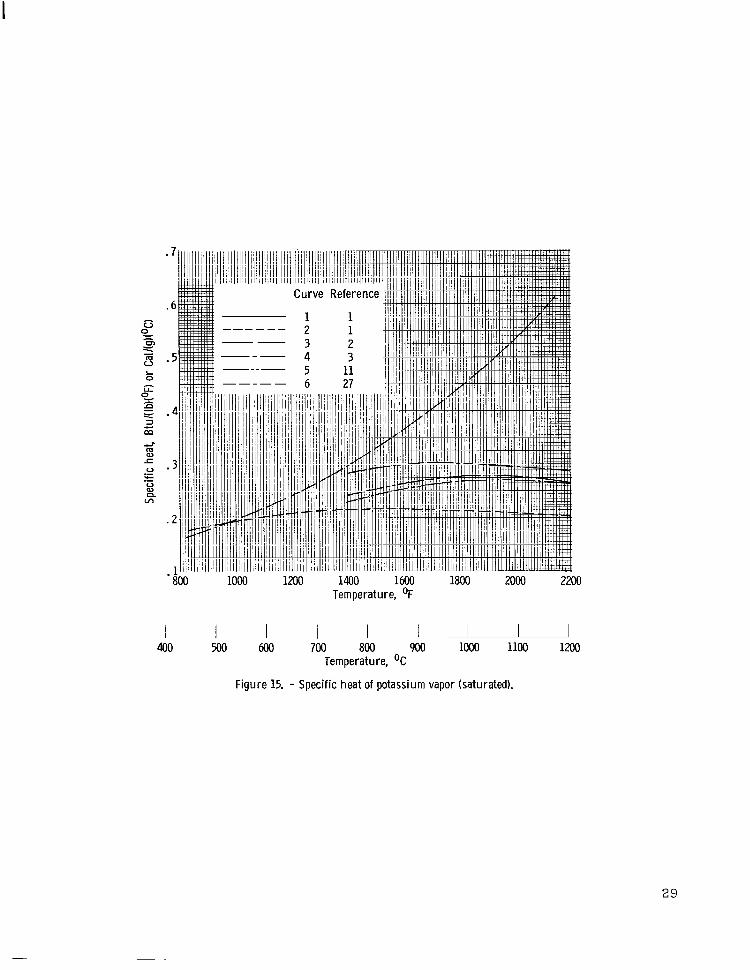
Specif ic Heat (Fig. 15)
Two t h e o r e t i c a l curves f o r s p e c i f i c heat of saturated vapor were calculated by GE ( r e f . 3 3 ) , using constants from reference 53. were a l s o reported by WADD ( r e f . 1) and a r e shown i n f igure 15 as curves 1 and 2 . In curve 1, the frozen spec i f ic heat w a s calculated as a s t a t e point property by adding the separate contributions of the monotomic and diatomic va- pors f o r a given equilibrium composition. In curve 2, the equilibrium spec i f ic heat w a s calculated according t o the rigorous def in i t ion of spec i f ic heat and includes the energy required t o a l t e r the degree of equilibrium as a r e s u l t of dissociat ion.
These theore t ica l values
The data f o r t h e B a t t e l l e c u v e (curve 3 ) were taken from t a b l e C - 1 of r e f - erence 2; these data were calculated using t h e heat capacity of the i d e a l mon- omer, as given by Evans, e t a l . ( r e f . 5 2 ) , and v i r i a l coef f ic ien ts . These co- e f f i c i e n t s were discussed i n the vapor densi ty sect ion of the present report , and the f i n a l or modified r e l a t i o n for t h e t h i r d v i r i a l coef f ic ien t ( r e f . 2 ) w a s used t o ca lcu la te the s p e c i f i c heat.
The values f o r t h e NRL curve (curve 4) were taken from tabulated data i n appendix C of reference 3; T\TRL obtained these values by numerical evaluation of the change of vapor enthalpy with respect t o temperature. The enthalpy of the vapor w a s determined by adding t h e heat of vaporization t o the enthalpy of the l iqu id , as given i n reference 3 .
The data f o r t h e NRL curve (curve 5) were taken from t a b l e 1 2 of r e f e r - ence 11; these data were calculated using t h e s p e c i f i c heat of the monomeric gas a t one atmosphere as derived d i r e c t l y from the work of Evans, e t a l . ( r e f . 52 ) , and the NRL experimental v i r i a l coef f ic ien ts . These coef f ic ien ts were a l s o discussed i n the vapor density sect ion of t h e present report . The rJRL f i n a l values from appendix B of reference 27 a r e shown as curve 6 .
The values f o r the spec i f ic heat of the saturated vapor from the several sources d i f f e r widely. a re around 40 percent lower than the theore t ica l values of equilibrium spec i f ic heat (curve 2 ) . other curves a r e concave downward. A t 2000° F, the B a t t e l l e value is about 156 percent higher than the t h e o r e t i c a l value reported by WADD (curve 2 ) . The two preliminary NRL curves (curves 4 and 5) , determined by two d i f f e r e n t meth- ods, agree rather well with each other, d i f fe r ing by 6 percent a t 1400' F
"he theore t ica l values of frozen spec i f ic heat (curve 1)
The B a t t e l l e curve (curve 3 ) i s concave upward, while the
2%
L 0
c- m aa
1000 1200 1400 1600 1800 2200 Temperature, OF
I I L 800 900 1000 1100 1200
I I I I 400 500 600 700
Temperature, OC
Figure 15. - Specific heat of potassium vapor (saturated).
29
71
70
69
68
I=" 671 B - 2 266( m
W
65(
6 4
63t
62 Entropy, Btu/(lb)(OR) or Cal/(g)(OK)
Figure 16. - Saturation l ines on enthalpy-entropy diagram.
30
and 2.5 percent a t 2000° F. The NRL f i n a l curve (curve 6) i s about 6 t o 16 per- cent higher than curve 5 over the range shown and a t 20000 F i s about 4 1 percent higher than the t h e o r e t i c a l value of curve 2 .
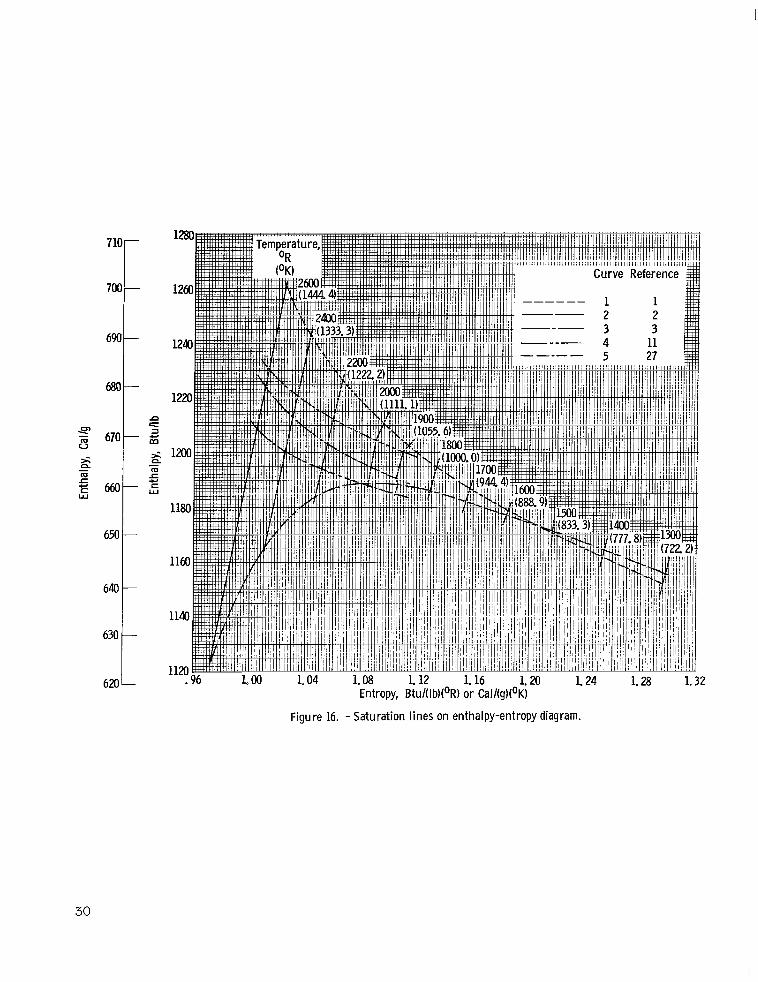
Enthalpy and Entropy (Fig. 16 )
The sa tura t ion l i n e s on an enthalpy-entropy diagram a r e shown f o r several sources i n f igure 16. The s o l i d l i n e s on the f igure merely connect points of equal temperature on the curves. Theoretical values for the enthalpy and en- tropy of the saturated vapor were calculated by GE (ref. 33) with constants from reference 53. These values were a l s o reported by WADD ( r e f . 1) and are shown as curve 1.
The data f o r t h e B a t t e l l e curve (curve 2 ) were taken from t a b l e C - 1 of r e f - erence 2; B a t t e l l e calculated these data by adding t h e absolute values of en- thalpy and entropy of sa tura ted l i q u i d t o the values f o r the enthalpy and en- tropy of vaporization.
The data f o r t h e NRL curve (curve 3) were taken from t a b l e 5 of r e f e r - ence 3; NRL calculated these data by adding the change i n enthalpy and entropy with vaporization t o the values for the saturated l iqu id .
The values f o r the NRL curve (curve 4) were taken from t a b l e 11 of r e f e r - ence 11; NRL calculated these values with v i r i a l coef f ic ien ts using the s t a t e of t h e monomeric gas a t one atmosphere as derived d i r e c t l y from the work of Evans, e t a l . ( r e f . 52 ) as a base, or s t a r t i n g point. These coef f ic ien ts were discussed i n the vapor densi ty sec t ion of t h e present report . The NRL f i n a l values from appendix A of reference 27 a r e shown as curve 5.
It can be seen t h a t the B a t t e l l e values (curve 2 ) agree very closely with t h e theore t ica l values reported by WADD (curve 1) a t the lower temperatures but deviate a t the higher temperatures. A t 2600' R, t h e B a t t e l l e values are 11 per- cent lower for enthalpy and 5 percent lower f o r entropy than the WADD curve. It can a l s o be seen t h a t t h e shape of t h e B a t t e l l e curve deviates s ign i f icant ly from the other curves shown.
The two preliminary NRL curves (curves 3 and 4) agree r a t h e r well with each other, d i f fe r ing by only 2 percent i n enthalpy and 1 percent i n entropy a t 2600° R, and both curves a r e s l i g h t l y lower than the t h e o r e t i c a l values of curve 1. The NRL f i n a l curve (curve 5) i s within 1 percent of curve 4.
CONCLUDING REMARKS
The r e s u l t s of t h e recent invest igat ions have extended the temperature range of t h e previously ex is t ing potassium property data. The values from the several sources f o r most of these propert ies agree very w e l l a t the lower tem- peratures . However, s i g n i f i c a n t differences a r e apparent f o r some of the prop- e r t i e s a t the higher temperatures (above about 1400° F) .
31
I
The l a r g e s t disagreements i n the l i q u i d propert ies were i n the values of surface tension, thermal conductivity, and s p e c i f i c heat. For surface tension, t h e difference between the two sources a t 900' F was about 60 percent. The d i f - ference between t h e highest and lowest values of thermal conductivity a t 1300° F w a s about 20 percent, and the spec i f ic heat values d i f fe red by about 13 percent a t 2000° F. general ly compared wel l with the recent experimental data.
D a t a f o r the l i q u i d propert ies reported by WADD (ref. 1) i n 1961
The l a r g e s t disagreement i n t h e vapor propert ies w a s i n the value of spe- c i f i c heat, where the difference between the several sources w a s over 100 per- cent a t 2000° F. showed good agreement with the values derived i n ' t h e recent determinations a t t h e lower temperatures, but d i f fe red s i g n i f i c a n t l y a t the higher temperatures. In general, t h e differences between the reported sources increased as t h e tem- perature increased. termination of the v iscos i ty or thermal conductivity of t h e saturated vapor.
The theore t ica l vapor property values reported by WADD ( r e f . 1)
A t t h i s time there has been no successf'ul experimental de-
Lewis Research Center, National Aeronautics and Space Administration,
Cleveland, Ohio, August 30, 1965.
REFERENCES
1. Weatherford, W. D. , Jr.; Tyler, John C. ; and Ku, P. M . : Properties of Inor- ganic Energy-Conversion and Heat-Transfer Fluids f o r Space Applications. Rept. No. TR-61-96, WADD, Nov. 1961.
2 . Walling, Joseph F.; and Lemon, Alexis W . , Jr.: The Experimental P-V-T Prop- e r t i e s of Potassium t o 1150' C. NASA CR-52950, 1963.
3. Eking, C . T. ; Stone, J. P.; Spann, J. R. ; S te inkul ler , E. W.; W i l l i a m s , D. D.; and Miller, R . R . : High Temperature Properties of Sodium and Potassium. Rept. No. NRL-6094, Prog. Rept. No. 1 2 , Naval Res. Lab., June 9, 1964.
4 . Tepper, F.; Zelenak, J.; Roehlich, F.; and May, V.: Thermophysical and Trans- p o r t Properties of Liquid Metals. Rept. No. MSAR 64-78, PEA R e s . Corp., July 15, 1964.
5. H a l l , Elton H.; and Blocher, John M . , Jr.: The Viscosity of Saturated Liquid Potassium from 70° to 1150' C by the Oscillating-Cylinder Method. No. BATT-4673-T1, B a t t e l l e Memorial I n s t . , Aug. 31, 1962.
Rept.
6 . Cooke. J. W . : Thermophysical Property Measurements of Alkali Liquid Metals. Rept. No. ORNL-3605, vol. 1, 1964, pp. 66-87.
7 . Deem, H. W . ; and Matolich, J., Jr.: The Thermal Conductivity and Elec t r ica l Res is t iv i ty of Liquid Potassium and the Alloy Niobium-1 Zirconium. NASA CR-52315, 1963.
32
8. Tepper, F.; Murchison, A.; Zelenak, J.; and Roehlich, F.: Thermophysical and Transport Properties of Liquid Metals. Rept. No. MSAR 64-36, MSA R e s . Corp., Apr. 14, 1964.
9. Kapelner, Samuel M.; and Bratton, W i l l i a m D.: The E l e c t r i c a l R e s i s t i v i t y of Sodium, Potassium, Rubidium and Cesium i n the Liquid S ta te . Rept. No. PWAC-376, P r a t t & Whitney Aircraf t , June 30, 1962.
10. Nikol 'ski i , N. A.: Thermophysical Properties of Molten Metals and Alloys. Problems i n Heat Transfer, M. A. Milrheev, ed., AEC-TR-4511, Jan. 1962, pp. 1-36.
11. Stone, J. P.; Ewing, C. T.; Spann, J. R.; S te inkul ler , E. W.; W i l l i a m s , D. D.; and Mil ler , R. R . : High Temperature Properties of Sodium, Potas- s ium, and Cesium. Rept. No. NFZ 6128, Naval Res. Lab., Aug. 3, 1964.
1 2 . Deem, H. W.; Eldridge, E. A.; and Lucks, C. F.: The Specific Heat from Oo t o 11500 C and Heat of Fusion of Potassium. Rept. No. BATT-4673-T2 (NP-12933), B a t t e l l e Memorial I n s t . , Aug. 31, 1962.
13. Ewing, C. T.; Stone, J. P.; Spann, J. R . ; S te inkul ler , E. W.; and Miller, R. R . : High Temperature Properties of Sodium and Potassium. Rept. No, NRL-6004, Naval R e s . Lab., Sept. 13, 1963.
14. Walling, Joseph F.; Nuzum, Harry K.; and Lemon, Alexis W., Jr.: The Vapor Pressure and Heat of Vaporization of Potassium from 480° t o 1150° C. NASA CR-52425, 1963.
15. Lemon, A. W . , Jr.; Deem, H. W.; Eldridge, E. A.; H a l l , E. H.; Matolich, J., Jr.; and Walling, J. F.: Engineering Properties of Potassium. NASA CR-54017, 1963.
1 6 . Fisher, C . R. ; and Achener, P. Y . : Alkali Metals Evaluation Program. Rept. No. AGN-8131, Aerojet-General Nucleonics, Jan. 1965.
1 7 . Walling, Joseph F.; Nuzum, Harry K.; K im, Byung C . ; and Lemon, Alexis W . , Jr.: Design and Evaluation of an Instrument f o r Measuring the Specif ic Heat of Potassium Vapor. NASA CR-52314, 1963.
18. Lemon, A. W., Jr.; Deem, H. W.; Eldridge, E. A.; H a l l , E. H.; Matolich, J., Jr.; and Walling, J. F.: The Specif ic Heat, Thermal Con- duct ivi ty , and Viscosity of Liquid Cesium. NASA CR-54018, 1964.
19. Gottl ieb, M.; and Zollweg, R. J.: Thermal Conductivity of Alkali-Metal Va- pors. J. Chem. Phys., vol. 39, no. 10, Nov. 15, 1963, pp. 2773-2774.
20. Tepper, F.; Zelenak, J.; Roehlich, F.; and May, V.: Thermophysical and Transport Propert ies of Liquid M e t a l s . Rept. NO. MSAR 64-116, MSA Res. Corp., Oct. 19, 1964.
33
21. Achener, P. Y.: The Determination of the Latent Heat of Vaporization, Vapor Pressure, Enthalpy, Specific Heat, and Density of Liquid Rubidium and Ce- sium up to 1800' F. Jan. 1964.
Rept. No. AGN-8090, Aerojet-General Nucleonics,
22. Fisher, C. .R.; and Achener, P. Y. : Rubidium/Cesiwn Evaluation Program. Rept. No. AGN-8107, Aerojet-General Nucleonics, Apr. 28, 1964.
23. Fisher, C. R.; and Achener, P. Y.: Alkali Metals Evaluation Program. Rept. No. AGN-8112, Aero j et -General Nucleonics, Aug . 17, 1964.
24. Fisher, C. R.; and Achener, P. Y.: Alkali Metals Evaluation Program. Rept. No. AGN-8121, Aerojet-General Nucleonics, Oct. 1964.
25. Parker, Kenneth, 0.; and Stone, Robert A.: SPUR High-Temperature Space Ra- diator. Paper No. 2549-62, ARS, 1962.
26. Brooks, R. D.: Alkali Metals Boiling and Condensing Investigations. NASA CR-54050, 1964.
27. Ewing, C. T.; Stone, J. P.; Spann, J. R.; Steinkuller, E. W.; Williams, D. D.; and Miller, R. R.: High Temperature Properties of Potassium. Rept. No. 6233, Naval Res. hb., Sept. 1965.
28. %ing, C. T.; Atkinson, H. B., Jr.; and Rice, T. K.: The Measurements of the Physical and Chemical Properties of the Sodium-Potassium Alloy. Rept. No. NRL C-3287, OPR No. 7, Naval Res. Lab., May 24, 1948.
29. Rinck, M. E.: Densities du potassium et du sodium liquide. Compt. Rend., t. 189, July 1, 1929, pp. 39-41.
30. Hagen, E. B.: ceber die W'kemeausdehnung des Natruims, des Kaliums und deren Legierung im festen und im geschmolzenen Zustande. Ann. Physik, bd. 19, 1883, pp. 436-474.
31. Lyon, R. N., ed.: Liquid-Metals Handbook. Second ed., TID-5277, AFC, June 1952.
32. Jackson, Carey B.: ed: Liquid-Metals Handbook - Sodium-NaK Supplement. Third ed., TID-5277, AEC, July 1, 1955.
33. Meisl, C. J.; and Shapiro, A.: Thermodynamic Properties of Alkali Metal Vapors and Mercury. Second ed., Rept. No. R60FPD358-A, General Elec- tric Co., Nov. 9, 1960.
34. Novikov, I. I.; Soloviev, A. N.; Khabakhpasheva, E. M.; Gruzdev, V. A.; Pridantzev, A. L.; and Vasenina, M. Ya.: Heat Transfer and Thermophysical Properties of Molten Alkali Metals. Soviet J. Atomic Energy, vol. 4, 1956, pp. 545-560.
34
35. Jackson, C. B.; Wieczorek, G. A.; and Van Andel, A.: Density of the System K-Na. Physical and Chemical Properties of the Sodium-Potassium Alloy No. 1 by C. Ewing; and R. R. Miller. Rept. No. P-3010, Naval Res. Lab., Sept. 30, 1946.
Appendix C in Quarterly Progress Report on the Measurement of the
36. Ewing, C. T.; Stone, J. P.; Spann, J. R.; Steinkuller, E. W.; Kovacina, T. A.; and Miller, R. R.: High Temperature Properties of Sodium and Po- tassium. Rept. No. NRL-5844, Naval Res. Lab., Aug. 23, 1962.
37. Chiong, Y. S.: Viscosity of Liquid Sodium and Potassium. Proc. Roy. SOC. (London), ser. A, vol. 157, no. 891, Nov. 2, 1936, pp. 264-277.
38. Ewing, C. T.; Grand, J. A.; and Miller, R. R.: Viscosity of the Sodium- Potassium System. J. Phys. Chem., vol. 58, no. 12, Dec. 1954, pp. 1086- 1088.
39. Novikov, I. I.; Soloviev, A. N.; Khabakhnasheva, E. M.; Gruzdev, V. A.; Pridantzev, A. I. ; and Vasenina, M. Ya: The Heat-Transfer and High Temperature Properties of Liquid Alkali Metals. J. Nucl. Energy, vol. 4, no. 3, 1957, pp. 387-408.
40. Shvidkovsky, Ye. G: Certain Problems Related to the Viscosity of Fused Metals. NASA TT F-88, 1962.
41. Kutateladze, S. S.; Borishanskii, V. M.; Novikov, I. I.; and Fedynskii, 0. S.: Liquid-Metal Heat Transfer Media. Atomnaia Energiia, Suppl. No. 2 (USSR), 1958. (Trans. by Consultants Bureau, Inc., 1959.)
42. da C. Andrade, E. N.: Theory of Viscosity of Liquids. Phil Mag., vol. 17, pt. I, Feb. 1934, pp. 497-511; pt. 11, Mar. 1934, pp. 698-732.
43. Quarterman, Lloyd A.; and Primak, William L.: The Capillary Rise, Contact Angle, and Surface Tension of Potassium. J. Am. Chem. Soc., vol. 72, no. 7, July 20, 1950, pp. 3035-3037.
44. Taylor, J. W.: The Surface Tension of Liquid Metals and Alloys. Rept. No. M/TN-24, British AERE, May 4, 1954.
45. Taylor, J. W.: The Surface Energies of the Alkali Metals. Phil. Mag., V O ~ . 46, Aug. 1955, pp. 867-876.
46. Porter, A. W.: Surface Tension. Phil. Mag., vol. 9, June 1930, pp. 1065- 1073.
47. Sugden, S.: The Determination of Surface Tension from the Maximum Pressure in Bubbles. J. Chem. Soc., vol. 121, pt. I, 1922, pp. 858-866.
48. SchrEdinger, Erwin: Noitz Ceber den Kapillardruck en gasblasen. Ann. Physik, bd. 46, 1915, pp. 413-418.
35
I
49. Bornemann, K.; und Rauschenplat, G.: Die elektrische Leitfzhig keit der Metall Legierungen im fliissigen Zustande. Metallurgie, bd. 9, 1912, pp. 473-486; 505-515.
50. Ewing, C. T.; Grand, J. A.; and Miller, R. R.: Thermal Conductivity of Liq- uid Sodium and Potassium. J. Am. Chem. Soc., vol. 74, no. 1, Jan. 1952, pp. 11-14.
51. Douglas, Thomas B.; Ball, Anne F.; Ginnings, Defoe C.; and Davis, William D.: Heat Capacity of Potassium and Three Potassium-Sodium Alloys Between Oo and 800°, the Triple Point and Heat of Fusion of Potassium. Chem. Soc., vol . 74, no. 10, May 20, 1952, pp. 2472-2478.
J. Am.
52. Evans, W. H.; Jacobson, R.; Munson, T. R.; and Wagman, D. D.: Thermodynamic Properties of the Alkali Metals. J. Res. Natl. Bur. Std., vol. 55, no. 2, Aug. 1955, pp. 83-96.
53. Stull, D. R.; and Sinke, G. C.: Thermodynamic Properties of the Elements. Advances in Chem. Ser. No. 18, Am. Chem. Soc., 1956.
54. Ditchburn, R. W.; and Gilmour, J. C.: The Vapor Pressures of Monatomic Va- pors. Rev. Mod. Phys., vol. 13, no. 4, Oct. 1941, pp. 310-327.
55. Fiock, Ernst F.; and Rodebush, Worth H.: The Vapor Pressures and Thermal Properties of Potassium and Some Alkali Halides. J. Am. Chem. Soc., vol . 48, no. 10, Oct. 1926, pp. 2522-2528.
56. Kr'dner, A.: Uber die Dampfdrucke der Alkalimetalle. Ann. Physik, bd. 40, 1913, pp. 438-452.
57. Lewis, Lester C.: Die Bestimmung des Gleichgewichts Zwischen den Atomen und den Molekulen eines Alkalidampfes mit einer Moledularstrahlmethode. Z. Physik, bd. 69, 1931, pp. 786-809.
58. Heycock, C, T.; and Lamplough, F. E. E.: The Boiling Points of Mercury, Cadmium, Zinc, Potassium and Sodium. Proc. Chem. SOC. (London), vol. 28, '1912, p. 3.
59. Neumann, Kurt; und Volker, enst: Einer Drehwaagemethode zur Messung Kleinster Dampfdrucke. Z. Physik Chem., bd. Al61, 1932, pp. 33-45.
60. Edmondson, W.; and Egerton, A.: The Vapor Pressures and Melting Point of Sodium and Potassium. Proc. Roy. SOC. (London), ser. A. vol. 113, 1927, pp. 520-533.
.. 61. Mayer, H.: mer einer neue Methode zur Messung Kleinster Dampfdrucke von
Quecksilber und Kalium. Z. Physik, bd. 67, 1931, pp. 240-269.
62. Makansi, M. M.; Madsen, M.; Selke, W. A.; and Bonilla, C. F. : Vapor Pres- sure of Potassium. J. Phys. Chem., vol. 60, no. 1, Jan. 20, 1956, p. 128.
36
63. 'Thorn, R. J.; and Winslow, G. H. : Correction of t h e Potassium Vapor Pres- sure Equation by Use of t h e Second V i r i a l Coefficient. J. Phys. Chem., vol. 65, no. 8,-Aug. 24, 1961, pp. 1297-1302.
64. Grachev, N. S.; and Kir i l lov, P. L . : The Experimental Determination of t h e E l a s t i c i t y of Potassium Vapors a t Temperatures from 550' t o 1280° C Inzh. Fiz. Zh. Akad. Nauk SSR, vol . 3, no. 6, 1960, pp. 62-65.
65. Weatherford, W. D., Jr.: Momentum Dynamics of Gas-Phase Physical Processes. B u l l , Am. Phys. Soc., ser. 11, p t . 1, vol . 6, no. 1, Feb. 1, 1961, pp. 41-42.
NASA-Langley, 1965 E-2899
I
3 7
. -
7
“The aeroiiazrtical and space activities of the United. States shall be conducted so as to contribute . . . to the expamion of human h o w l - edge of pheiio?nend i n the atmosphere and space. T h e Administration shall provide for the widest practicable dud appropride dissemination of information coiicerning its actii:ities and the results thereof .”
-NATIONAL AERONAUTICS AND SPACE ACT OF 1958
NASA SCIENTIFIC A N D TECHNICAL PUBLICATIONS
TECHNICAL REPORTS: important, complete, and a lasting contribution to existing knowledge.
TECHNICAL NOTES: of imporrance as a contribution to existing knowledge.
TECHNICAL MEMORANDUMS: Information receiving limited distri- bution because of preliminary data, security classification, or other reasons.
CONTRACTOR REPORTS: Technical information generated in con- nection with a NASA contract or grant and released under NASA auspices.
TECHNICAL TRANSLATIONS: Information published in a foreign language considered to merit NASA distribution in English.
TECHNICAL REPRINTS: Information derived from NASA activities and initially published in the form of journal articles.
SPECIAL PUBLICATIONS: Information derived from or of value to NASA activities but not necessarily reporting the results .of individual NASA-programmed scientific efforts. Publications include conference proceedings, monographs, data compilations, handbooks, sourcebooks, and special bibliographies.
Scientific and technical information considered
Information less broad in scope but nevertheless
Details on the availability of these pubkations may be obtained from:
SCIENTIFIC AND TECHNICAL INFORMATION DIVISION
N AT1 0 N A L A E R 0 N A UTI CS A N D SPACE A DM I N I ST RAT I 0 N
Washington, D.C. PO546