Embed Size (px)
Citation preview
Summary Statistics Victorian Schools, February 2012 1
Summary Statistics Victorian Schools February 2012
Summary Statistics Victorian Schools, February 2012 2
The Publication This publication Summary Statistics Victorian Schools, February 2012 is based on collections from the February 2012 school census of Victorian schools held on Wednesday 29 February 2012. It presents information for all government and non-government schools and students in Victoria. The majority of the statistical data in this publication is drawn from school administration systems. Occasionally there are errors that are detected after the school census process has been completed. Revisions to the historical data are included in the most recent version of the publication. A revised figure is represented in the publication with an “r” next to it (e.g. r123). For subsequent publications these figures will not be deemed to be revised. In some situations where there has been rounding, discrepancies may occur between sums of the component items and totals.
Methodology
Method of Collection
All Victorian schools provide details of enrolments twice each year. The first collection occurs in February and provides data used as a basis for school resource allocation. The second collection occurs in August and provides data used as a basis for school resource allocations and for inclusion in state and national statistical publications. Published by the Data, Outcomes and Evaluation Division Department of Education and Early Childhood Development Victoria. October 2012 For further information about this publication please contact: Statistical and Demographic Information Unit Email: [email protected] Telephone: (03) 9637 3225 ISSN: 1320-1816
©State of Victoria (Department of Education
and Early Childhood Development) 2009
The copyright in this document is owned by the State of Victoria
(Department of Education and Early Childhood Development), or in the case
of some materials, by third parties (third party materials). No part may be
reproduced by any process except in accordance with the provisions of the
Copyright Act 1968, the National Education Access Licence for Schools
(NEALS) (see below) or with permission.
An educational institution situated in Australia which is not
conducted for profit, or a body responsible for administering such
an institution may copy and communicate the materials, other
than third party materials, for the educational purposes of the
institution.
This document is also available on the internet at
http://www.education.vic.gov.au/about/department/Pages/factsandfigures.aspx
Summary Statistics Victorian Schools, February 2012 3
Contents
MAIN FEATURES .................................................................................................. 5
Schools ............................................................................................................... 5
Students ............................................................................................................. 6
Apparent Retention Rates Years 7-12 and 10-12 ............................................... 7
STATISTICAL TABLES ......................................................................................... 8
Schools ............................................................................................................... 8
School Size ....................................................................................................... 10
Students ........................................................................................................... 11
Students by Sector and Enrolment Type .......................................................... 18
Students by Enrolment Type, Sex and Sector .................................................. 19
Students in Post-Compulsory Years by Sex and Sector ................................... 20
Schools and Students by Local Government Area and Sector ......................... 21
Apparent Retention Rates Years 7–12 ............................................................. 23
Apparent Retention Rates Years 10–12 ........................................................... 24
Transition Rates................................................................................................ 25
Class Sizes ....................................................................................................... 27
APPENDIX 1 ........................................................................................................ 31
Alphabetical Listing of Government School Enrolments by School Type and Year Level, February 2012 ........................................................................................ 31
Summary Statistics Victorian Schools, February 2012 4
List of Tables
TABLE 1: NUMBER OF SCHOOLS BY SECTOR, FEBRUARY 2011–2012 ................................................... 5 TABLE 2: NUMBER OF SCHOOLS BY SCHOOL TYPE AND SECTOR, FEBRUARY 2011-2012................. 5 TABLE 3: FULL-TIME EQUIVALENT OF STUDENTS BY YEAR LEVEL CATEGORY AND SECTOR,
FEBRUARY 2011–2012 ................................................................................................................... 6 TABLE 4: FULL-TIME EQUIVALENT OF STUDENTS BY YEAR LEVEL AND SECTOR, FEBRUARY 2011-2012 ......................................................................................................................................... 6 TABLE 5: FULL-TIME EQUIVALENT OF STUDENTS BY SECTOR AND SEX, FEBRUARY 2012 .............. 7 TABLE 6: FULL-TIME EQUIVALENT OF STUDENTS IN YEAR 12 BY SECTOR AND SEX, FEBRUARY
2012 .................................................................................................................................................. 7 TABLE 7: APPARENT RETENTION RATES BY SECTOR, FEBRUARY 2011-2012 (PERCENT) ................. 7 TABLE 8: NUMBER OF SCHOOLS BY SECTOR, FEBRUARY 2003–2012 ................................................... 8 TABLE 9: NUMBER OF SCHOOLS BY SECTOR AND METROPOLITAN/ NON-METROPOLITAN
REGIONS, FEBRUARY 2012 ........................................................................................................... 8 TABLE 10: NUMBER OF SCHOOLS BY SCHOOL TYPE, REGION AND SECTOR, FEBRUARY 2012 ......... 9 TABLE 11: NUMBER OF SCHOOLS BY SIZE, SCHOOL TYPE AND SECTOR, FEBRUARY 2012 .............. 10 TABLE 12: FULL-TIME EQUIVALENT OF STUDENTS BY YEAR LEVEL AND SECTOR, FEBRUARY 201211 TABLE 13: FULL-TIME EQUIVALENT OF STUDENTS BY YEAR LEVEL AND SECTOR, FEBRUARY 2003–
2012 ................................................................................................................................................ 12 TABLE 14: GOVERNMENT SCHOOLS: FULL-TIME EQUIVALENT OF STUDENTS BY YEAR LEVEL AND
REGION, FEBRUARY 2012 ........................................................................................................... 17 TABLE 15: FULL-TIME EQUIVALENT OF STUDENTS BY SECTOR AND METROPOLITAN/ NON-
METROPOLITAN REGIONS, FEBRUARY 2012 ........................................................................... 18 TABLE 16: FULL-TIME EQUIVALENT OF STUDENTS BY ENROLMENT TYPE AND SECTOR, FEBRUARY
2005–2012 ...................................................................................................................................... 18 TABLE 17: FULL-TIME EQUIVALENT OF STUDENTS BY ENROLMENT TYPE, SEX AND SECTOR,
FEBRUARY 2012............................................................................................................................ 19 TABLE 18: FULL-TIME EQUIVALENT OF STUDENTS IN POST-COMPULSORY YEAR LEVELS BY SEX
AND SECTOR, FEBRUARY 2012 .................................................................................................. 20 TABLE 19: FULL-TIME EQUIVALENT OF STUDENTS AND NUMBER OF SCHOOLS BY LOCAL
GOVERNMENT AREA AND SECTOR, FEBRUARY 2012 ............................................................ 21 TABLE 20: YEARS 7–12 APPARENT RETENTION RATES BY SECTOR, FEBRUARY 2003–2012
(PERCENT) ..................................................................................................................................... 23 TABLE 21: YEARS 7–12 APPARENT RETENTION RATES BY SEX AND SECTOR, FEBRUARY 2010–2012
(PERCENT) ..................................................................................................................................... 23 TABLE 22: YEARS 7–12 GOVERNMENT SCHOOLS: APPARENT RETENTION RATES BY REGION,
FEBRUARY 2003–2012 (PERCENT) ............................................................................................. 23 TABLE 23: YEARS 10–12 APPARENT RETENTION RATES BY SECTOR FEBRUARY 2003–2012
(PERCENT) ..................................................................................................................................... 24 TABLE 24: YEARS 10–12 APPARENT RETENTION RATES BY SEX AND SECTOR FEBRUARY 2010–2012
(PERCENT) ..................................................................................................................................... 24 TABLE 25: YEARS 10-12 GOVERNMENT SCHOOLS: APPARENT RETENTION RATES BY REGION,
FEBRUARY 2003–2012 (PERCENT) ............................................................................................. 24 TABLE 26: TRANSITION RATES BY YEAR LEVEL AND SECTOR, FEBRUARY 2007-2008 TO FEBRUARY
2011-2012 (PERCENT) .................................................................................................................. 25 TABLE 27: GOVERNMENT SCHOOLS: CLASS SIZES FEBRUARY 2003 TO FEBRUARY 2012 ................. 27 TABLE 28: GOVERNMENT SCHOOLS: PRIMARY CLASS SIZES FEBRUARY 2012 ................................... 27 TABLE 29: GOVERNMENT SCHOOLS: SECONDARY ENGLISH CLASS SIZES, FEBRUARY 2012 ........... 27
Summary Statistics Victorian Schools, February 2012 5
MAIN FEATURES
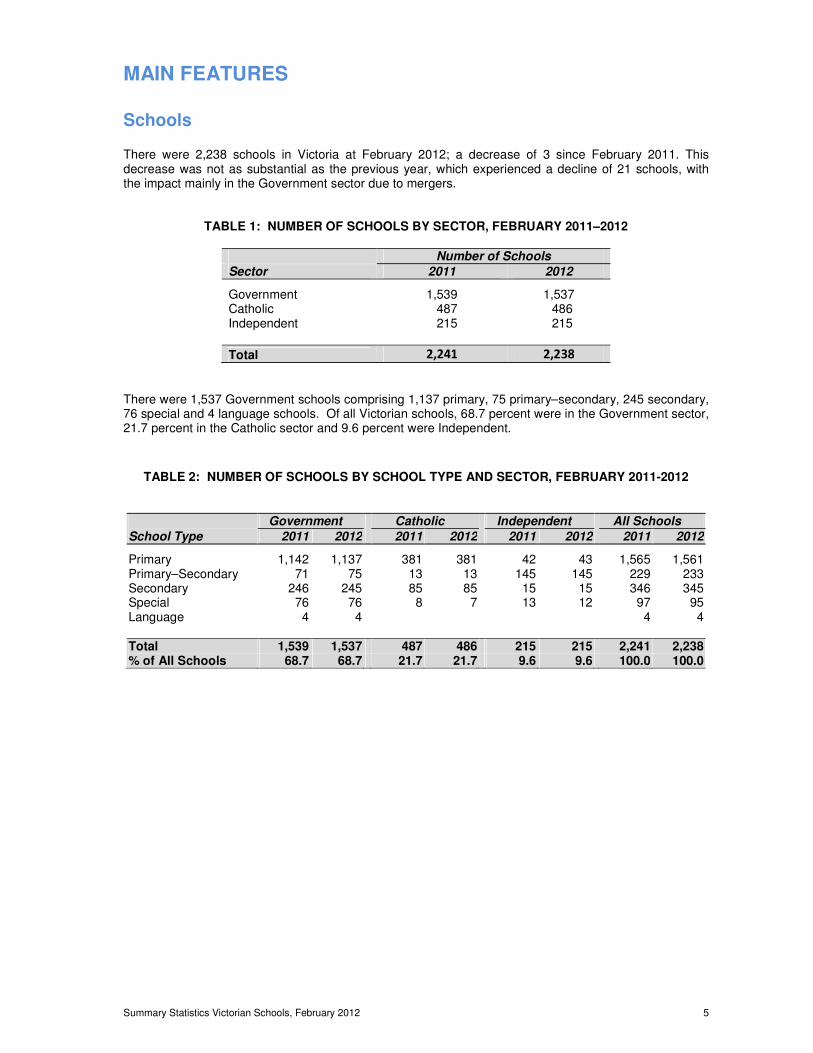
Schools There were 2,238 schools in Victoria at February 2012; a decrease of 3 since February 2011. This decrease was not as substantial as the previous year, which experienced a decline of 21 schools, with the impact mainly in the Government sector due to mergers.
TABLE 1: NUMBER OF SCHOOLS BY SECTOR, FEBRUARY 2011–2012
Number of Schools
Sector 2011 2012
Government 1,539 1,537 Catholic 487 486 Independent 215 215
Total 2,241 2,238
There were 1,537 Government schools comprising 1,137 primary, 75 primary–secondary, 245 secondary, 76 special and 4 language schools. Of all Victorian schools, 68.7 percent were in the Government sector, 21.7 percent in the Catholic sector and 9.6 percent were Independent.
TABLE 2: NUMBER OF SCHOOLS BY SCHOOL TYPE AND SECTOR, FEBRUARY 2011-2012
Government Catholic Independent All Schools
School Type 2011 2012 2011 2012 2011 2012 2011 2012
Primary 1,142 1,137 381 381 42 43 1,565 1,561 Primary–Secondary 71 75 13 13 145 145 229 233 Secondary 246 245 85 85 15 15 346 345 Special 76 76 8 7 13 12 97 95 Language 4 4 4 4 Total 1,539 1,537 487 486 215 215 2,241 2,238 % of All Schools 68.7 68.7 21.7 21.7 9.6 9.6 100.0 100.0
Summary Statistics Victorian Schools, February 2012 6
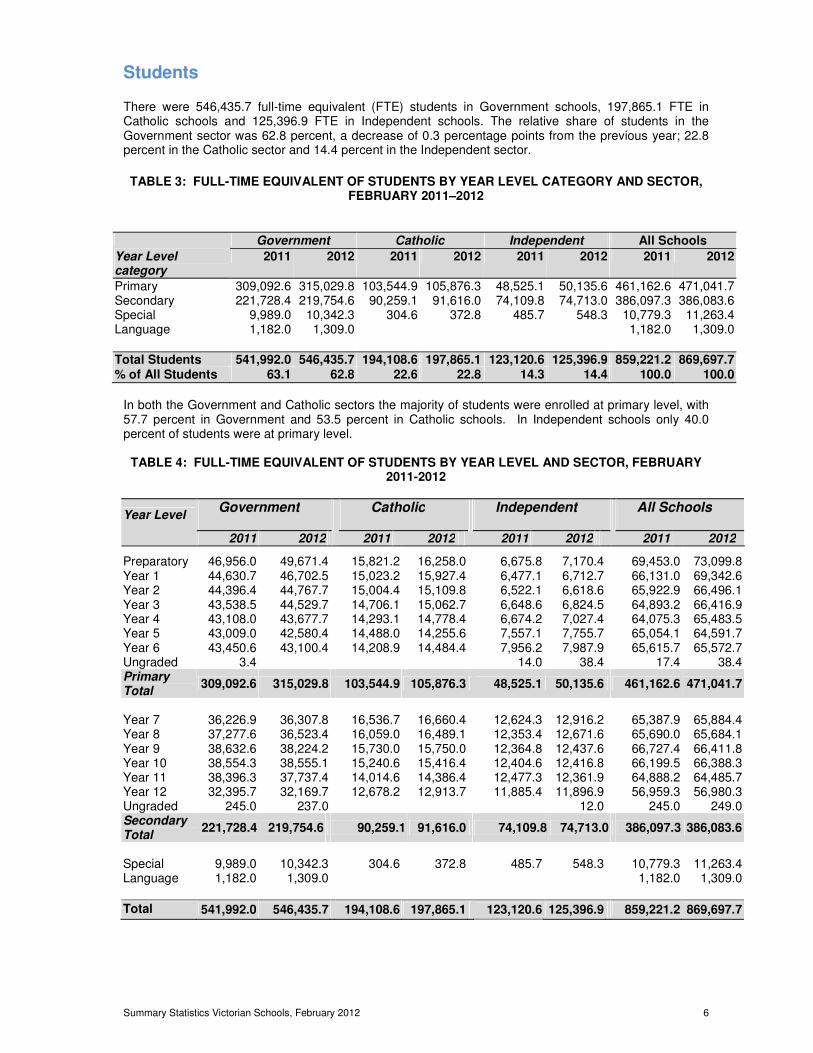
Students
There were 546,435.7 full-time equivalent (FTE) students in Government schools, 197,865.1 FTE in Catholic schools and 125,396.9 FTE in Independent schools. The relative share of students in the Government sector was 62.8 percent, a decrease of 0.3 percentage points from the previous year; 22.8 percent in the Catholic sector and 14.4 percent in the Independent sector.
TABLE 3: FULL-TIME EQUIVALENT OF STUDENTS BY YEAR LEVEL CATEGORY AND SECTOR, FEBRUARY 2011–2012
Government Catholic Independent All Schools
Year Level category
2011 2012 2011 2012 2011 2012 2011 2012
Primary 309,092.6 315,029.8 103,544.9 105,876.3 48,525.1 50,135.6 461,162.6 471,041.7 Secondary 221,728.4 219,754.6 90,259.1 91,616.0 74,109.8 74,713.0 386,097.3 386,083.6 Special 9,989.0 10,342.3 304.6 372.8 485.7 548.3 10,779.3 11,263.4 Language 1,182.0 1,309.0 1,182.0 1,309.0
Total Students 541,992.0 546,435.7 194,108.6 197,865.1 123,120.6 125,396.9 859,221.2 869,697.7 % of All Students 63.1 62.8 22.6 22.8 14.3 14.4 100.0 100.0
In both the Government and Catholic sectors the majority of students were enrolled at primary level, with 57.7 percent in Government and 53.5 percent in Catholic schools. In Independent schools only 40.0 percent of students were at primary level.
TABLE 4: FULL-TIME EQUIVALENT OF STUDENTS BY YEAR LEVEL AND SECTOR, FEBRUARY 2011-2012
Year Level Government Catholic Independent All Schools
2011 2012 2011 2012 2011 2012 2011 2012
Preparatory 46,956.0 49,671.4 15,821.2 16,258.0 6,675.8 7,170.4 69,453.0 73,099.8 Year 1 44,630.7 46,702.5 15,023.2 15,927.4 6,477.1 6,712.7 66,131.0 69,342.6 Year 2 44,396.4 44,767.7 15,004.4 15,109.8 6,522.1 6,618.6 65,922.9 66,496.1 Year 3 43,538.5 44,529.7 14,706.1 15,062.7 6,648.6 6,824.5 64,893.2 66,416.9 Year 4 43,108.0 43,677.7 14,293.1 14,778.4 6,674.2 7,027.4 64,075.3 65,483.5 Year 5 43,009.0 42,580.4 14,488.0 14,255.6 7,557.1 7,755.7 65,054.1 64,591.7 Year 6 43,450.6 43,100.4 14,208.9 14,484.4 7,956.2 7,987.9 65,615.7 65,572.7 Ungraded 3.4 14.0 38.4 17.4 38.4 Primary Total
309,092.6 315,029.8 103,544.9 105,876.3 48,525.1 50,135.6 461,162.6 471,041.7
Year 7 36,226.9 36,307.8 16,536.7 16,660.4 12,624.3 12,916.2 65,387.9 65,884.4 Year 8 37,277.6 36,523.4 16,059.0 16,489.1 12,353.4 12,671.6 65,690.0 65,684.1 Year 9 38,632.6 38,224.2 15,730.0 15,750.0 12,364.8 12,437.6 66,727.4 66,411.8 Year 10 38,554.3 38,555.1 15,240.6 15,416.4 12,404.6 12,416.8 66,199.5 66,388.3 Year 11 38,396.3 37,737.4 14,014.6 14,386.4 12,477.3 12,361.9 64,888.2 64,485.7 Year 12 32,395.7 32,169.7 12,678.2 12,913.7 11,885.4 11,896.9 56,959.3 56,980.3 Ungraded 245.0 237.0 12.0 245.0 249.0 Secondary Total
221,728.4 219,754.6 90,259.1 91,616.0 74,109.8 74,713.0 386,097.3 386,083.6
Special 9,989.0 10,342.3 304.6 372.8 485.7 548.3 10,779.3 11,263.4 Language 1,182.0 1,309.0 1,182.0 1,309.0
Total 541,992.0 546,435.7 194,108.6 197,865.1 123,120.6 125,396.9 859,221.2 869,697.7
Summary Statistics Victorian Schools, February 2012 7
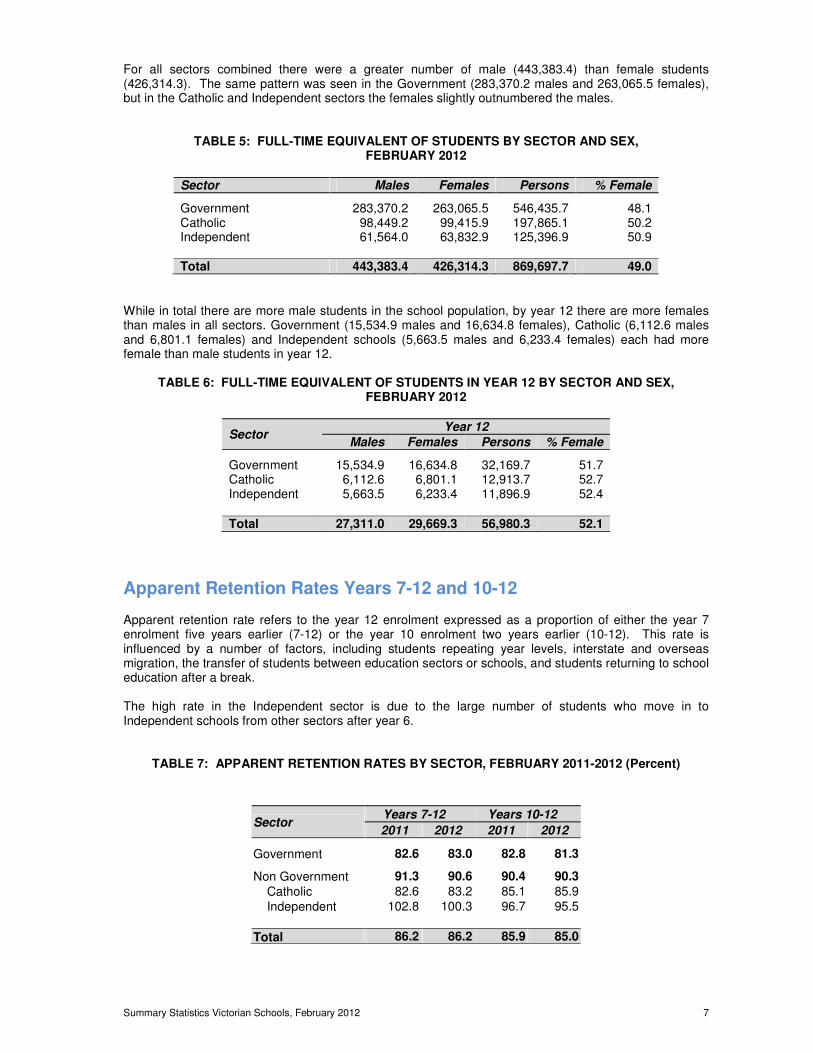
For all sectors combined there were a greater number of male (443,383.4) than female students (426,314.3). The same pattern was seen in the Government (283,370.2 males and 263,065.5 females), but in the Catholic and Independent sectors the females slightly outnumbered the males.
TABLE 5: FULL-TIME EQUIVALENT OF STUDENTS BY SECTOR AND SEX, FEBRUARY 2012
Sector Males Females Persons % Female
Government 283,370.2 263,065.5 546,435.7 48.1 Catholic 98,449.2 99,415.9 197,865.1 50.2 Independent 61,564.0 63,832.9 125,396.9 50.9 Total 443,383.4 426,314.3 869,697.7 49.0
While in total there are more male students in the school population, by year 12 there are more females than males in all sectors. Government (15,534.9 males and 16,634.8 females), Catholic (6,112.6 males and 6,801.1 females) and Independent schools (5,663.5 males and 6,233.4 females) each had more female than male students in year 12.
TABLE 6: FULL-TIME EQUIVALENT OF STUDENTS IN YEAR 12 BY SECTOR AND SEX, FEBRUARY 2012
Sector Year 12
Males Females Persons % Female
Government 15,534.9 16,634.8 32,169.7 51.7 Catholic 6,112.6 6,801.1 12,913.7 52.7 Independent 5,663.5 6,233.4 11,896.9 52.4 Total 27,311.0 29,669.3 56,980.3 52.1
Apparent Retention Rates Years 7-12 and 10-12 Apparent retention rate refers to the year 12 enrolment expressed as a proportion of either the year 7 enrolment five years earlier (7-12) or the year 10 enrolment two years earlier (10-12). This rate is influenced by a number of factors, including students repeating year levels, interstate and overseas migration, the transfer of students between education sectors or schools, and students returning to school education after a break. The high rate in the Independent sector is due to the large number of students who move in to Independent schools from other sectors after year 6.
TABLE 7: APPARENT RETENTION RATES BY SECTOR, FEBRUARY 2011-2012 (Percent)
Sector Years 7-12 Years 10-12
2011 2012 2011 2012
Government 82.6 83.0 82.8 81.3
Non Government 91.3 90.6 90.4 90.3
Catholic 82.6 83.2 85.1 85.9
Independent 102.8 100.3 96.7 95.5
Total 86.2 86.2 85.9 85.0
Summary Statistics Victorian Schools, February 2012 8
STATISTICAL TABLES
Schools
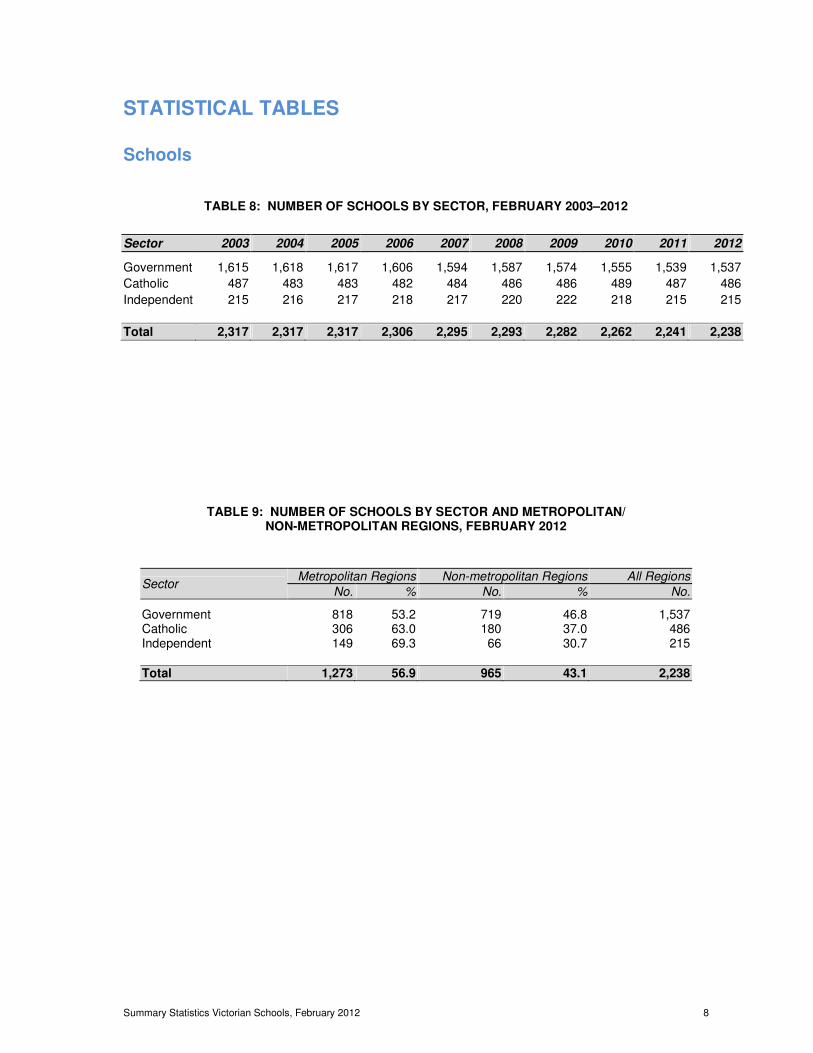
TABLE 8: NUMBER OF SCHOOLS BY SECTOR, FEBRUARY 2003–2012
TABLE 9: NUMBER OF SCHOOLS BY SECTOR AND METROPOLITAN/ NON-METROPOLITAN REGIONS, FEBRUARY 2012
Sector Metropolitan Regions Non-metropolitan Regions All Regions
No. % No. % No.
Government 818 53.2 719 46.8 1,537 Catholic 306 63.0 180 37.0 486 Independent 149 69.3 66 30.7 215 Total 1,273 56.9 965 43.1 2,238
Sector 2003 2004 2005 2006 2007 2008 2009 2010 2011 2012
Government 1,615 1,618 1,617 1,606 1,594 1,587 1,574 1,555 1,539 1,537
Catholic 487 483 483 482 484 486 486 489 487 486
Independent 215 216 217 218 217 220 222 218 215 215
Total 2,317 2,317 2,317 2,306 2,295 2,293 2,282 2,262 2,241 2,238
Summary Statistics Victorian Schools, February 2012 9
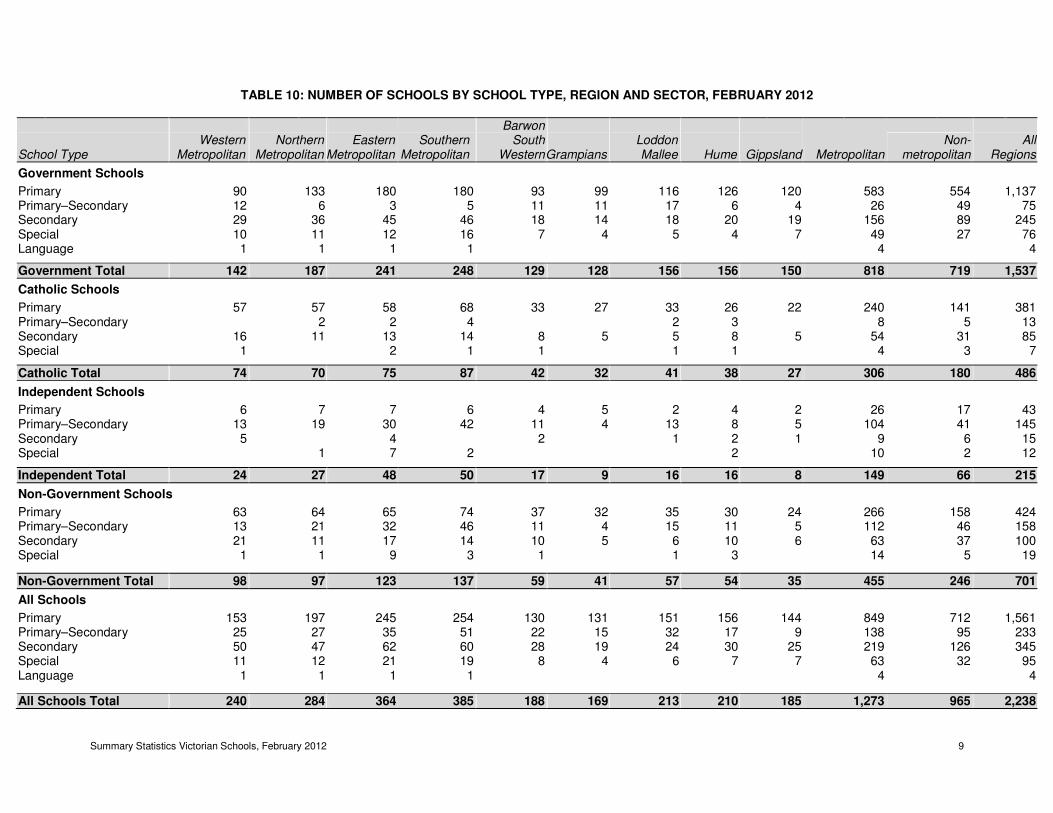
TABLE 10: NUMBER OF SCHOOLS BY SCHOOL TYPE, REGION AND SECTOR, FEBRUARY 2012
CATHOLIC
School Type
Western
Metropolitan
Northern
Metropolitan
Eastern
Metropolitan
Southern
Metropolitan
Barwon South
Western
Grampians
Loddon Mallee
Hume
Gippsland Metropolitan Non-
metropolitan
All
Regions
Government Schools
Primary 90 133 180 180 93 99 116 126 120 583 554 1,137 Primary–Secondary 12 6 3 5 11 11 17 6 4 26 49 75 Secondary 29 36 45 46 18 14 18 20 19 156 89 245 Special 10 11 12 16 7 4 5 4 7 49 27 76 Language 1 1 1 1 4 4 Government Total 142 187 241 248 129 128 156 156 150 818 719 1,537
Catholic Schools
Primary 57 57 58 68 33 27 33 26 22 240 141 381 Primary–Secondary 2 2 4 2 3 8 5 13 Secondary 16 11 13 14 8 5 5 8 5 54 31 85 Special 1 2 1 1 1 1 4 3 7 Catholic Total 74 70 75 87 42 32 41 38 27 306 180 486
Independent Schools
Primary 6 7 7 6 4 5 2 4 2 26 17 43 Primary–Secondary 13 19 30 42 11 4 13 8 5 104 41 145 Secondary 5 4 2 1 2 1 9 6 15 Special 1 7 2 2 10 2 12 Independent Total 24 27 48 50 17 9 16 16 8 149 66 215
Non-Government Schools
Primary 63 64 65 74 37 32 35 30 24 266 158 424 Primary–Secondary 13 21 32 46 11 4 15 11 5 112 46 158 Secondary 21 11 17 14 10 5 6 10 6 63 37 100 Special 1 1 9 3 1 1 3 14 5 19 Non-Government Total 98 97 123 137 59 41 57 54 35 455 246 701
All Schools
Primary 153 197 245 254 130 131 151 156 144 849 712 1,561 Primary–Secondary 25 27 35 51 22 15 32 17 9 138 95 233 Secondary 50 47 62 60 28 19 24 30 25 219 126 345 Special 11 12 21 19 8 4 6 7 7 63 32 95 Language 1 1 1 1 4 4 All Schools Total 240 284 364 385 188 169 213 210 185 1,273 965 2,238
Summary Statistics Victorian Schools, February 2012 10
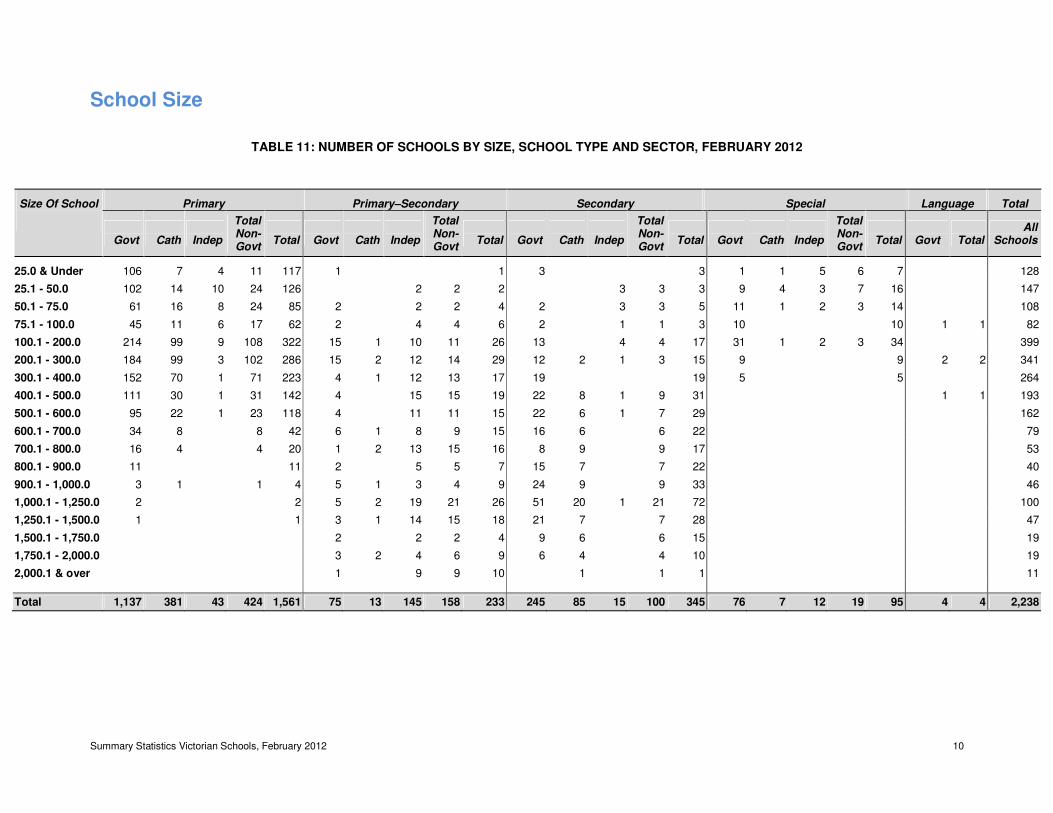
School Size
TABLE 11: NUMBER OF SCHOOLS BY SIZE, SCHOOL TYPE AND SECTOR, FEBRUARY 2012
Size Of School Primary Primary–Secondary Secondary Special Language Total
Govt
Cath
Indep
Total Non-Govt
Total
Govt
Cath
Indep
Total Non-Govt
Total
Govt
Cath
Indep
Total Non-Govt
Total
Govt
Cath
Indep
Total Non-Govt
Total
Govt
Total
All Schools
25.0 & Under 106 7 4 11 117 1 1 3 3 1 1 5 6 7 128
25.1 - 50.0 102 14 10 24 126 2 2 2 3 3 3 9 4 3 7 16 147
50.1 - 75.0 61 16 8 24 85 2 2 2 4 2 3 3 5 11 1 2 3 14 108
75.1 - 100.0 45 11 6 17 62 2 4 4 6 2 1 1 3 10 10 1 1 82
100.1 - 200.0 214 99 9 108 322 15 1 10 11 26 13 4 4 17 31 1 2 3 34 399
200.1 - 300.0 184 99 3 102 286 15 2 12 14 29 12 2 1 3 15 9 9 2 2 341
300.1 - 400.0 152 70 1 71 223 4 1 12 13 17 19 19 5 5 264
400.1 - 500.0 111 30 1 31 142 4 15 15 19 22 8 1 9 31 1 1 193
500.1 - 600.0 95 22 1 23 118 4 11 11 15 22 6 1 7 29 162
600.1 - 700.0 34 8 8 42 6 1 8 9 15 16 6 6 22 79
700.1 - 800.0 16 4 4 20 1 2 13 15 16 8 9 9 17 53
800.1 - 900.0 11 11 2 5 5 7 15 7 7 22 40
900.1 - 1,000.0 3 1 1 4 5 1 3 4 9 24 9 9 33 46
1,000.1 - 1,250.0 2 2 5 2 19 21 26 51 20 1 21 72 100
1,250.1 - 1,500.0 1 1 3 1 14 15 18 21 7 7 28 47
1,500.1 - 1,750.0 2 2 2 4 9 6 6 15 19
1,750.1 - 2,000.0 3 2 4 6 9 6 4 4 10 19
2,000.1 & over 1 9 9 10 1 1 1 11
Total 1,137 381 43 424 1,561 75 13 145 158 233 245 85 15 100 345 76 7 12 19 95 4 4 2,238
Summary Statistics Victorian Schools, February 2012 11
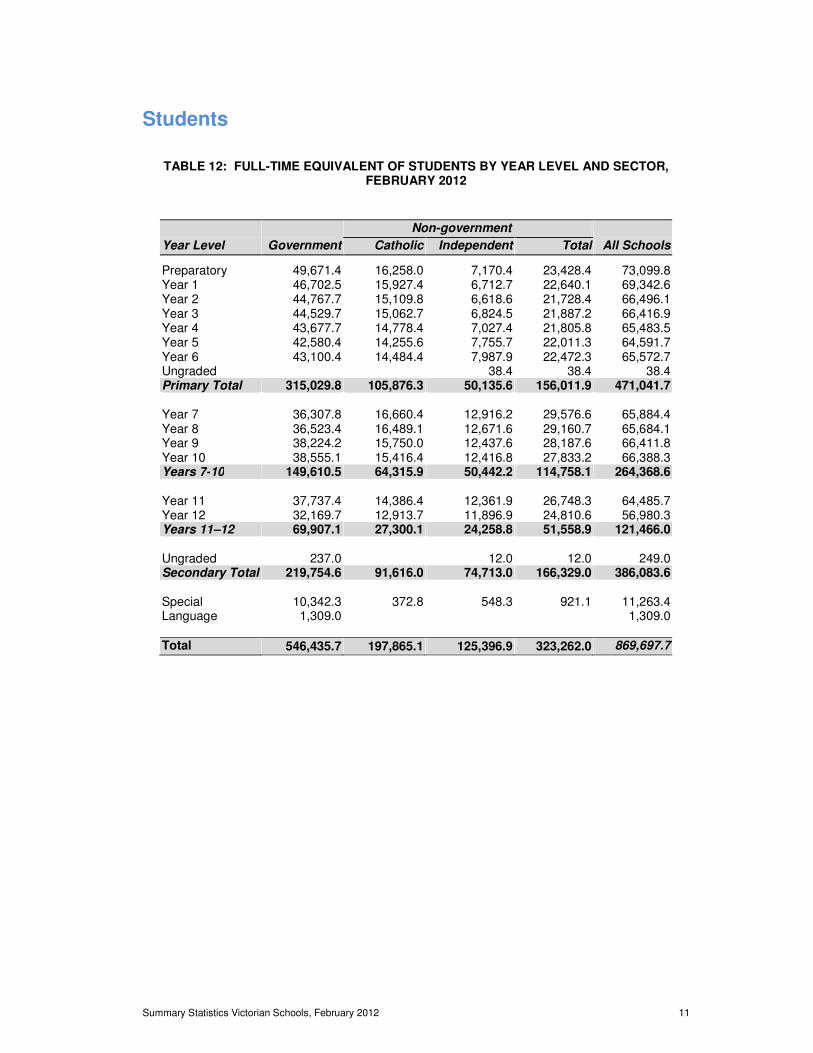
Students
TABLE 12: FULL-TIME EQUIVALENT OF STUDENTS BY YEAR LEVEL AND SECTOR, FEBRUARY 2012
Non-government
Year Level Government Catholic Independent Total All Schools
Preparatory 49,671.4 16,258.0 7,170.4 23,428.4 73,099.8 Year 1 46,702.5 15,927.4 6,712.7 22,640.1 69,342.6 Year 2 44,767.7 15,109.8 6,618.6 21,728.4 66,496.1 Year 3 44,529.7 15,062.7 6,824.5 21,887.2 66,416.9 Year 4 43,677.7 14,778.4 7,027.4 21,805.8 65,483.5 Year 5 42,580.4 14,255.6 7,755.7 22,011.3 64,591.7 Year 6 43,100.4 14,484.4 7,987.9 22,472.3 65,572.7 Ungraded 38.4 38.4 38.4 Primary Total 315,029.8 105,876.3 50,135.6 156,011.9 471,041.7 Year 7 36,307.8 16,660.4 12,916.2 29,576.6 65,884.4 Year 8 36,523.4 16,489.1 12,671.6 29,160.7 65,684.1 Year 9 38,224.2 15,750.0 12,437.6 28,187.6 66,411.8 Year 10 38,555.1 15,416.4 12,416.8 27,833.2 66,388.3 Years 7-10 149,610.5 64,315.9 50,442.2 114,758.1 264,368.6 Year 11 37,737.4 14,386.4 12,361.9 26,748.3 64,485.7 Year 12 32,169.7 12,913.7 11,896.9 24,810.6 56,980.3 Years 11–12 69,907.1 27,300.1 24,258.8 51,558.9 121,466.0 Ungraded 237.0 12.0 12.0 249.0 Secondary Total 219,754.6 91,616.0 74,713.0 166,329.0 386,083.6 Special 10,342.3 372.8 548.3 921.1 11,263.4 Language 1,309.0 1,309.0
Total 546,435.7 197,865.1 125,396.9 323,262.0 869,697.7
Summary Statistics Victorian Schools, February 2012 12
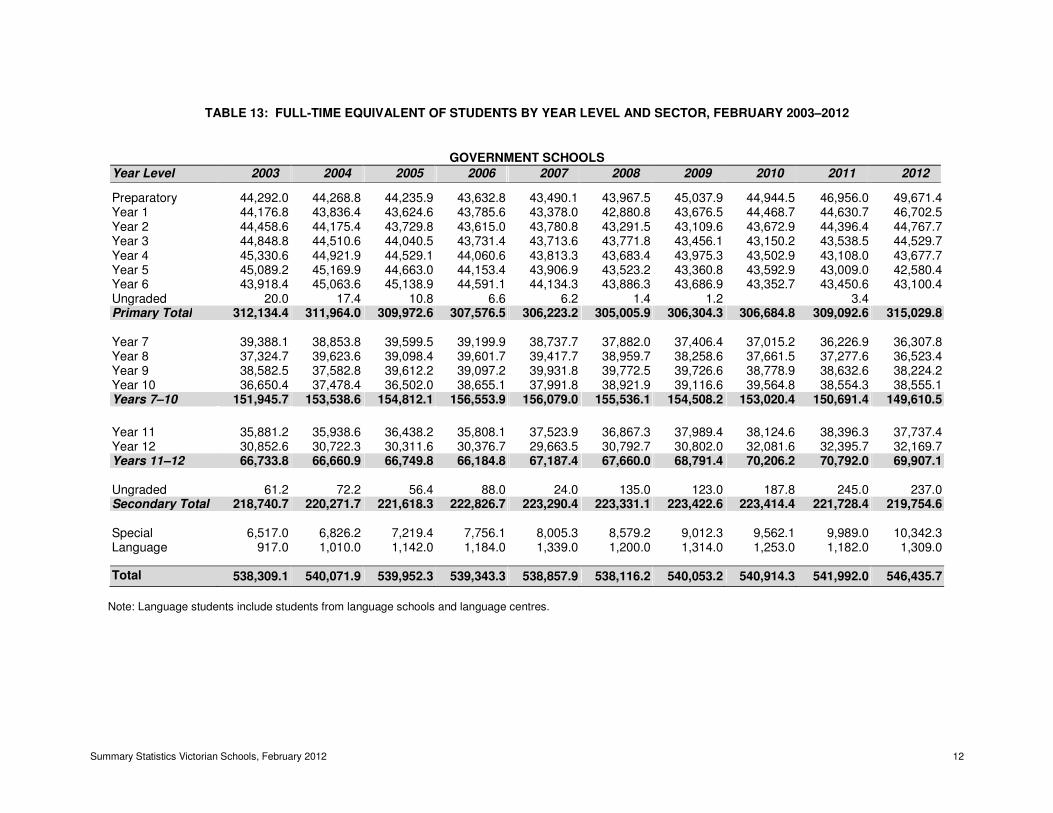
TABLE 13: FULL-TIME EQUIVALENT OF STUDENTS BY YEAR LEVEL AND SECTOR, FEBRUARY 2003–2012
GOVERNMENT SCHOOLS
Year Level 2003 2004 2005 2006 2007 2008 2009 2010 2011 2012
Preparatory 44,292.0 44,268.8 44,235.9 43,632.8 43,490.1 43,967.5 45,037.9 44,944.5 46,956.0 49,671.4 Year 1 44,176.8 43,836.4 43,624.6 43,785.6 43,378.0 42,880.8 43,676.5 44,468.7 44,630.7 46,702.5 Year 2 44,458.6 44,175.4 43,729.8 43,615.0 43,780.8 43,291.5 43,109.6 43,672.9 44,396.4 44,767.7 Year 3 44,848.8 44,510.6 44,040.5 43,731.4 43,713.6 43,771.8 43,456.1 43,150.2 43,538.5 44,529.7 Year 4 45,330.6 44,921.9 44,529.1 44,060.6 43,813.3 43,683.4 43,975.3 43,502.9 43,108.0 43,677.7 Year 5 45,089.2 45,169.9 44,663.0 44,153.4 43,906.9 43,523.2 43,360.8 43,592.9 43,009.0 42,580.4 Year 6 43,918.4 45,063.6 45,138.9 44,591.1 44,134.3 43,886.3 43,686.9 43,352.7 43,450.6 43,100.4 Ungraded 20.0 17.4 10.8 6.6 6.2 1.4 1.2 3.4 Primary Total 312,134.4 311,964.0 309,972.6 307,576.5 306,223.2 305,005.9 306,304.3 306,684.8 309,092.6 315,029.8
Year 7 39,388.1 38,853.8 39,599.5 39,199.9 38,737.7 37,882.0 37,406.4 37,015.2 36,226.9 36,307.8 Year 8 37,324.7 39,623.6 39,098.4 39,601.7 39,417.7 38,959.7 38,258.6 37,661.5 37,277.6 36,523.4 Year 9 38,582.5 37,582.8 39,612.2 39,097.2 39,931.8 39,772.5 39,726.6 38,778.9 38,632.6 38,224.2 Year 10 36,650.4 37,478.4 36,502.0 38,655.1 37,991.8 38,921.9 39,116.6 39,564.8 38,554.3 38,555.1 Years 7–10 151,945.7 153,538.6 154,812.1 156,553.9 156,079.0 155,536.1 154,508.2 153,020.4 150,691.4 149,610.5
Year 11 35,881.2 35,938.6 36,438.2 35,808.1 37,523.9 36,867.3 37,989.4 38,124.6 38,396.3 37,737.4 Year 12 30,852.6 30,722.3 30,311.6 30,376.7 29,663.5 30,792.7 30,802.0 32,081.6 32,395.7 32,169.7 Years 11–12 66,733.8 66,660.9 66,749.8 66,184.8 67,187.4 67,660.0 68,791.4 70,206.2 70,792.0 69,907.1
Ungraded 61.2 72.2 56.4 88.0 24.0 135.0 123.0 187.8 245.0 237.0 Secondary Total 218,740.7 220,271.7 221,618.3 222,826.7 223,290.4 223,331.1 223,422.6 223,414.4 221,728.4 219,754.6
Special 6,517.0 6,826.2 7,219.4 7,756.1 8,005.3 8,579.2 9,012.3 9,562.1 9,989.0 10,342.3 Language 917.0 1,010.0 1,142.0 1,184.0 1,339.0 1,200.0 1,314.0 1,253.0 1,182.0 1,309.0 Total 538,309.1 540,071.9 539,952.3 539,343.3 538,857.9 538,116.2 540,053.2 540,914.3 541,992.0 546,435.7
Note: Language students include students from language schools and language centres.
Summary Statistics Victorian Schools, February 2012 13
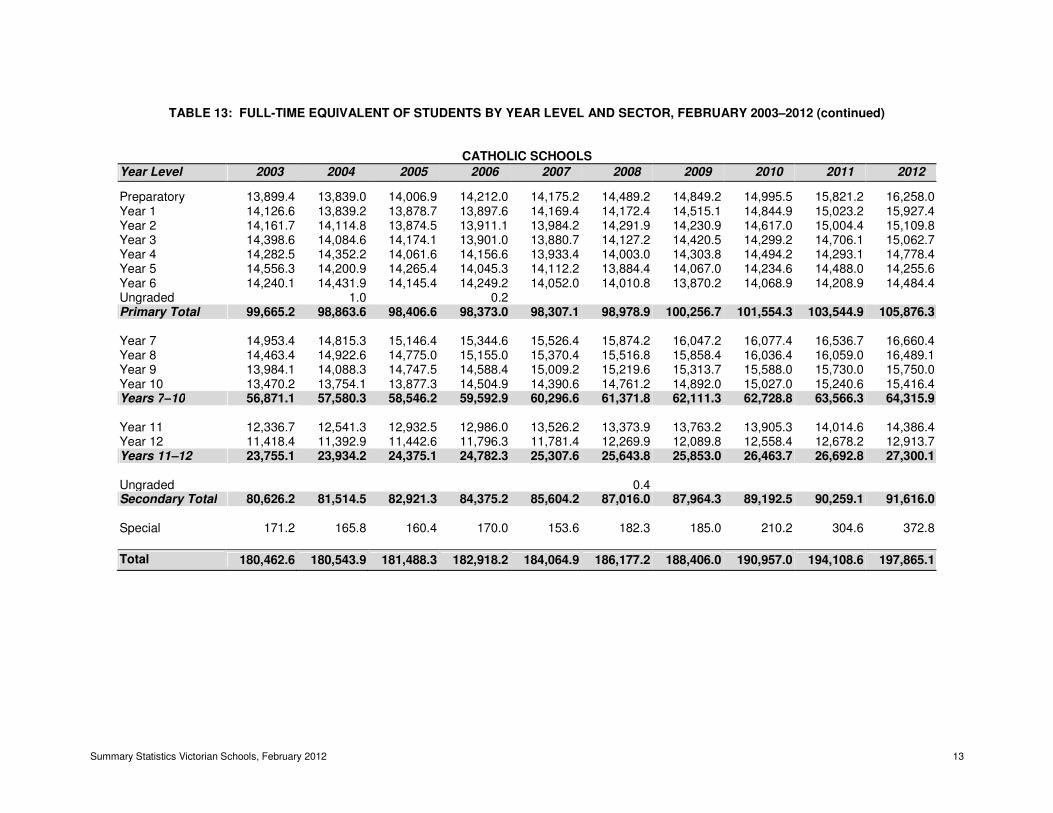
TABLE 13: FULL-TIME EQUIVALENT OF STUDENTS BY YEAR LEVEL AND SECTOR, FEBRUARY 2003–2012 (continued)
CATHOLIC SCHOOLS
Year Level 2003 2004 2005 2006 2007 2008 2009 2010 2011 2012
Preparatory 13,899.4 13,839.0 14,006.9 14,212.0 14,175.2 14,489.2 14,849.2 14,995.5 15,821.2 16,258.0 Year 1 14,126.6 13,839.2 13,878.7 13,897.6 14,169.4 14,172.4 14,515.1 14,844.9 15,023.2 15,927.4 Year 2 14,161.7 14,114.8 13,874.5 13,911.1 13,984.2 14,291.9 14,230.9 14,617.0 15,004.4 15,109.8 Year 3 14,398.6 14,084.6 14,174.1 13,901.0 13,880.7 14,127.2 14,420.5 14,299.2 14,706.1 15,062.7 Year 4 14,282.5 14,352.2 14,061.6 14,156.6 13,933.4 14,003.0 14,303.8 14,494.2 14,293.1 14,778.4 Year 5 14,556.3 14,200.9 14,265.4 14,045.3 14,112.2 13,884.4 14,067.0 14,234.6 14,488.0 14,255.6 Year 6 14,240.1 14,431.9 14,145.4 14,249.2 14,052.0 14,010.8 13,870.2 14,068.9 14,208.9 14,484.4 Ungraded 1.0 0.2 Primary Total 99,665.2 98,863.6 98,406.6 98,373.0 98,307.1 98,978.9 100,256.7 101,554.3 103,544.9 105,876.3
Year 7 14,953.4 14,815.3 15,146.4 15,344.6 15,526.4 15,874.2 16,047.2 16,077.4 16,536.7 16,660.4 Year 8 14,463.4 14,922.6 14,775.0 15,155.0 15,370.4 15,516.8 15,858.4 16,036.4 16,059.0 16,489.1 Year 9 13,984.1 14,088.3 14,747.5 14,588.4 15,009.2 15,219.6 15,313.7 15,588.0 15,730.0 15,750.0 Year 10 13,470.2 13,754.1 13,877.3 14,504.9 14,390.6 14,761.2 14,892.0 15,027.0 15,240.6 15,416.4 Years 7–10 56,871.1 57,580.3 58,546.2 59,592.9 60,296.6 61,371.8 62,111.3 62,728.8 63,566.3 64,315.9
Year 11 12,336.7 12,541.3 12,932.5 12,986.0 13,526.2 13,373.9 13,763.2 13,905.3 14,014.6 14,386.4 Year 12 11,418.4 11,392.9 11,442.6 11,796.3 11,781.4 12,269.9 12,089.8 12,558.4 12,678.2 12,913.7 Years 11–12 23,755.1 23,934.2 24,375.1 24,782.3 25,307.6 25,643.8 25,853.0 26,463.7 26,692.8 27,300.1
Ungraded 0.4 Secondary Total 80,626.2 81,514.5 82,921.3 84,375.2 85,604.2 87,016.0 87,964.3 89,192.5 90,259.1 91,616.0
Special 171.2 165.8 160.4 170.0 153.6 182.3 185.0 210.2 304.6 372.8
Total 180,462.6 180,543.9 181,488.3 182,918.2 184,064.9 186,177.2 188,406.0 190,957.0 194,108.6 197,865.1
Summary Statistics Victorian Schools, February 2012 14
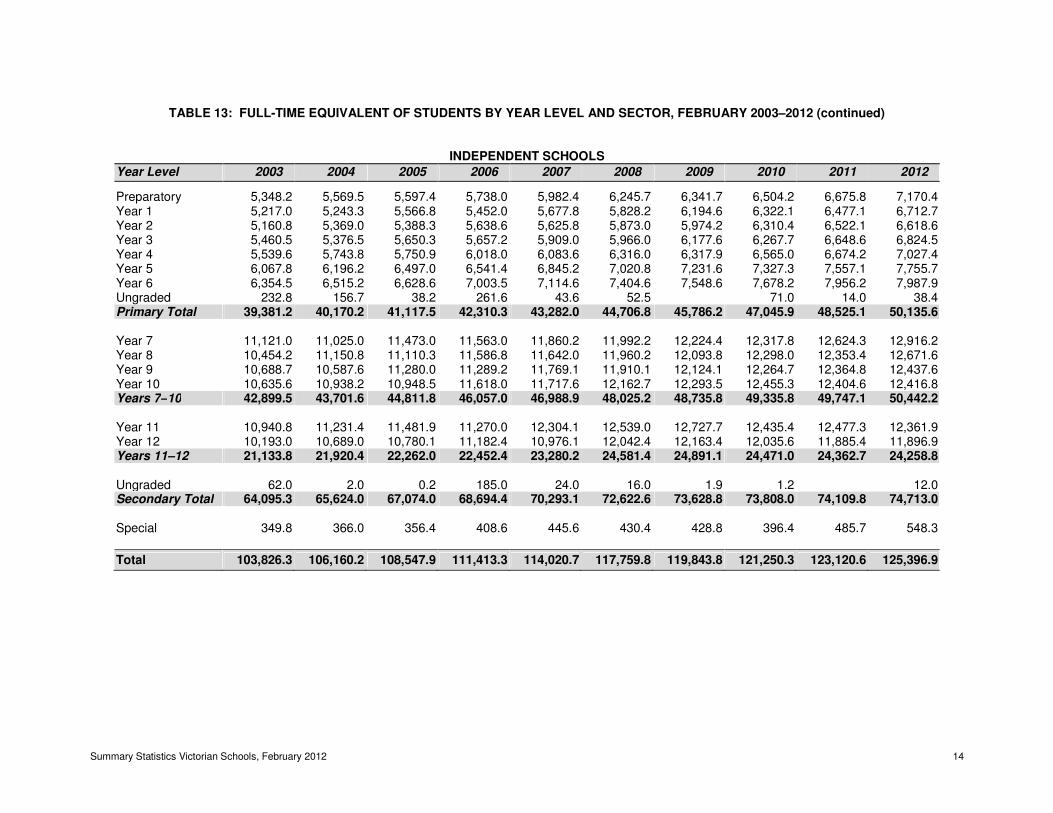
TABLE 13: FULL-TIME EQUIVALENT OF STUDENTS BY YEAR LEVEL AND SECTOR, FEBRUARY 2003–2012 (continued)
INDEPENDENT SCHOOLS
Year Level 2003 2004 2005 2006 2007 2008 2009 2010 2011 2012
Preparatory 5,348.2 5,569.5 5,597.4 5,738.0 5,982.4 6,245.7 6,341.7 6,504.2 6,675.8 7,170.4 Year 1 5,217.0 5,243.3 5,566.8 5,452.0 5,677.8 5,828.2 6,194.6 6,322.1 6,477.1 6,712.7 Year 2 5,160.8 5,369.0 5,388.3 5,638.6 5,625.8 5,873.0 5,974.2 6,310.4 6,522.1 6,618.6 Year 3 5,460.5 5,376.5 5,650.3 5,657.2 5,909.0 5,966.0 6,177.6 6,267.7 6,648.6 6,824.5 Year 4 5,539.6 5,743.8 5,750.9 6,018.0 6,083.6 6,316.0 6,317.9 6,565.0 6,674.2 7,027.4 Year 5 6,067.8 6,196.2 6,497.0 6,541.4 6,845.2 7,020.8 7,231.6 7,327.3 7,557.1 7,755.7 Year 6 6,354.5 6,515.2 6,628.6 7,003.5 7,114.6 7,404.6 7,548.6 7,678.2 7,956.2 7,987.9 Ungraded 232.8 156.7 38.2 261.6 43.6 52.5 71.0 14.0 38.4 Primary Total 39,381.2 40,170.2 41,117.5 42,310.3 43,282.0 44,706.8 45,786.2 47,045.9 48,525.1 50,135.6
Year 7 11,121.0 11,025.0 11,473.0 11,563.0 11,860.2 11,992.2 12,224.4 12,317.8 12,624.3 12,916.2 Year 8 10,454.2 11,150.8 11,110.3 11,586.8 11,642.0 11,960.2 12,093.8 12,298.0 12,353.4 12,671.6 Year 9 10,688.7 10,587.6 11,280.0 11,289.2 11,769.1 11,910.1 12,124.1 12,264.7 12,364.8 12,437.6 Year 10 10,635.6 10,938.2 10,948.5 11,618.0 11,717.6 12,162.7 12,293.5 12,455.3 12,404.6 12,416.8 Years 7–10 42,899.5 43,701.6 44,811.8 46,057.0 46,988.9 48,025.2 48,735.8 49,335.8 49,747.1 50,442.2
Year 11 10,940.8 11,231.4 11,481.9 11,270.0 12,304.1 12,539.0 12,727.7 12,435.4 12,477.3 12,361.9 Year 12 10,193.0 10,689.0 10,780.1 11,182.4 10,976.1 12,042.4 12,163.4 12,035.6 11,885.4 11,896.9 Years 11–12 21,133.8 21,920.4 22,262.0 22,452.4 23,280.2 24,581.4 24,891.1 24,471.0 24,362.7 24,258.8
Ungraded 62.0 2.0 0.2 185.0 24.0 16.0 1.9 1.2 12.0 Secondary Total 64,095.3 65,624.0 67,074.0 68,694.4 70,293.1 72,622.6 73,628.8 73,808.0 74,109.8 74,713.0
Special 349.8 366.0 356.4 408.6 445.6 430.4 428.8 396.4 485.7 548.3
Total 103,826.3 106,160.2 108,547.9 111,413.3 114,020.7 117,759.8 119,843.8 121,250.3 123,120.6 125,396.9
Summary Statistics Victorian Schools, February 2012 15
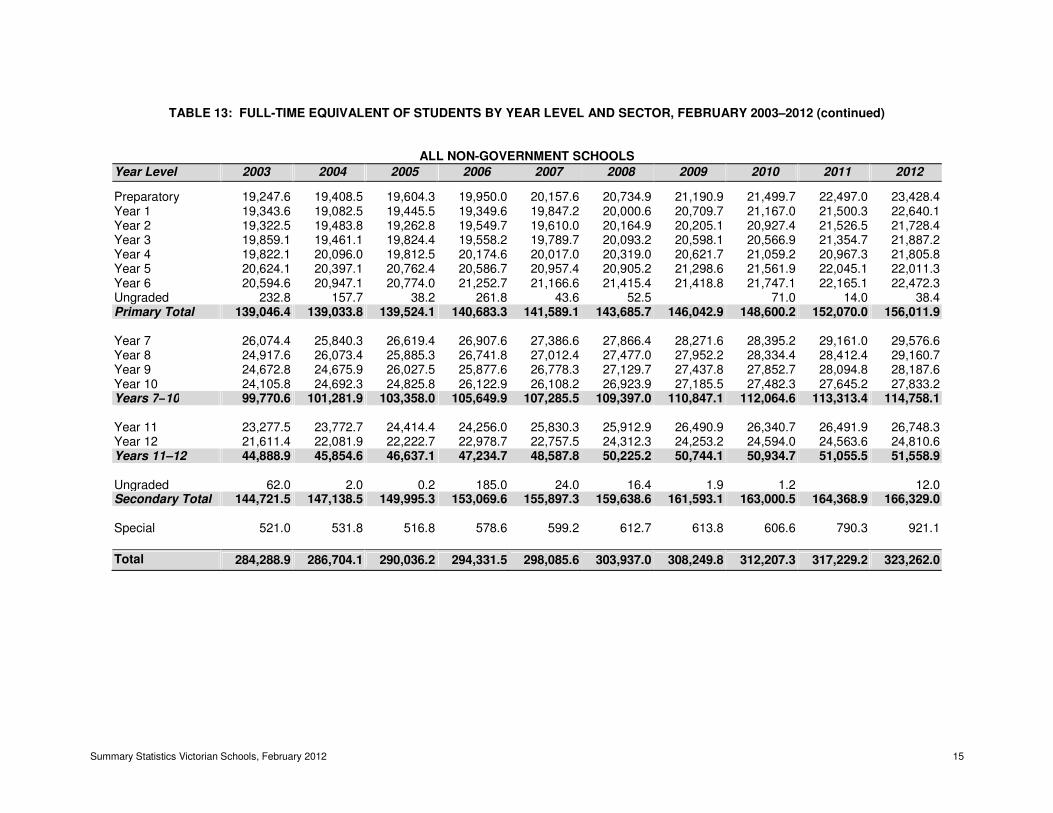
TABLE 13: FULL-TIME EQUIVALENT OF STUDENTS BY YEAR LEVEL AND SECTOR, FEBRUARY 2003–2012 (continued)
ALL NON-GOVERNMENT SCHOOLS
Year Level 2003 2004 2005 2006 2007 2008 2009 2010 2011 2012
Preparatory 19,247.6 19,408.5 19,604.3 19,950.0 20,157.6 20,734.9 21,190.9 21,499.7 22,497.0 23,428.4 Year 1 19,343.6 19,082.5 19,445.5 19,349.6 19,847.2 20,000.6 20,709.7 21,167.0 21,500.3 22,640.1 Year 2 19,322.5 19,483.8 19,262.8 19,549.7 19,610.0 20,164.9 20,205.1 20,927.4 21,526.5 21,728.4 Year 3 19,859.1 19,461.1 19,824.4 19,558.2 19,789.7 20,093.2 20,598.1 20,566.9 21,354.7 21,887.2 Year 4 19,822.1 20,096.0 19,812.5 20,174.6 20,017.0 20,319.0 20,621.7 21,059.2 20,967.3 21,805.8 Year 5 20,624.1 20,397.1 20,762.4 20,586.7 20,957.4 20,905.2 21,298.6 21,561.9 22,045.1 22,011.3 Year 6 20,594.6 20,947.1 20,774.0 21,252.7 21,166.6 21,415.4 21,418.8 21,747.1 22,165.1 22,472.3 Ungraded 232.8 157.7 38.2 261.8 43.6 52.5 71.0 14.0 38.4 Primary Total 139,046.4 139,033.8 139,524.1 140,683.3 141,589.1 143,685.7 146,042.9 148,600.2 152,070.0 156,011.9
Year 7 26,074.4 25,840.3 26,619.4 26,907.6 27,386.6 27,866.4 28,271.6 28,395.2 29,161.0 29,576.6 Year 8 24,917.6 26,073.4 25,885.3 26,741.8 27,012.4 27,477.0 27,952.2 28,334.4 28,412.4 29,160.7 Year 9 24,672.8 24,675.9 26,027.5 25,877.6 26,778.3 27,129.7 27,437.8 27,852.7 28,094.8 28,187.6 Year 10 24,105.8 24,692.3 24,825.8 26,122.9 26,108.2 26,923.9 27,185.5 27,482.3 27,645.2 27,833.2 Years 7–10 99,770.6 101,281.9 103,358.0 105,649.9 107,285.5 109,397.0 110,847.1 112,064.6 113,313.4 114,758.1
Year 11 23,277.5 23,772.7 24,414.4 24,256.0 25,830.3 25,912.9 26,490.9 26,340.7 26,491.9 26,748.3 Year 12 21,611.4 22,081.9 22,222.7 22,978.7 22,757.5 24,312.3 24,253.2 24,594.0 24,563.6 24,810.6 Years 11–12 44,888.9 45,854.6 46,637.1 47,234.7 48,587.8 50,225.2 50,744.1 50,934.7 51,055.5 51,558.9
Ungraded 62.0 2.0 0.2 185.0 24.0 16.4 1.9 1.2 12.0 Secondary Total 144,721.5 147,138.5 149,995.3 153,069.6 155,897.3 159,638.6 161,593.1 163,000.5 164,368.9 166,329.0
Special 521.0 531.8 516.8 578.6 599.2 612.7 613.8 606.6 790.3 921.1
Total 284,288.9 286,704.1 290,036.2 294,331.5 298,085.6 303,937.0 308,249.8 312,207.3 317,229.2 323,262.0
Summary Statistics Victorian Schools, February 2012 16
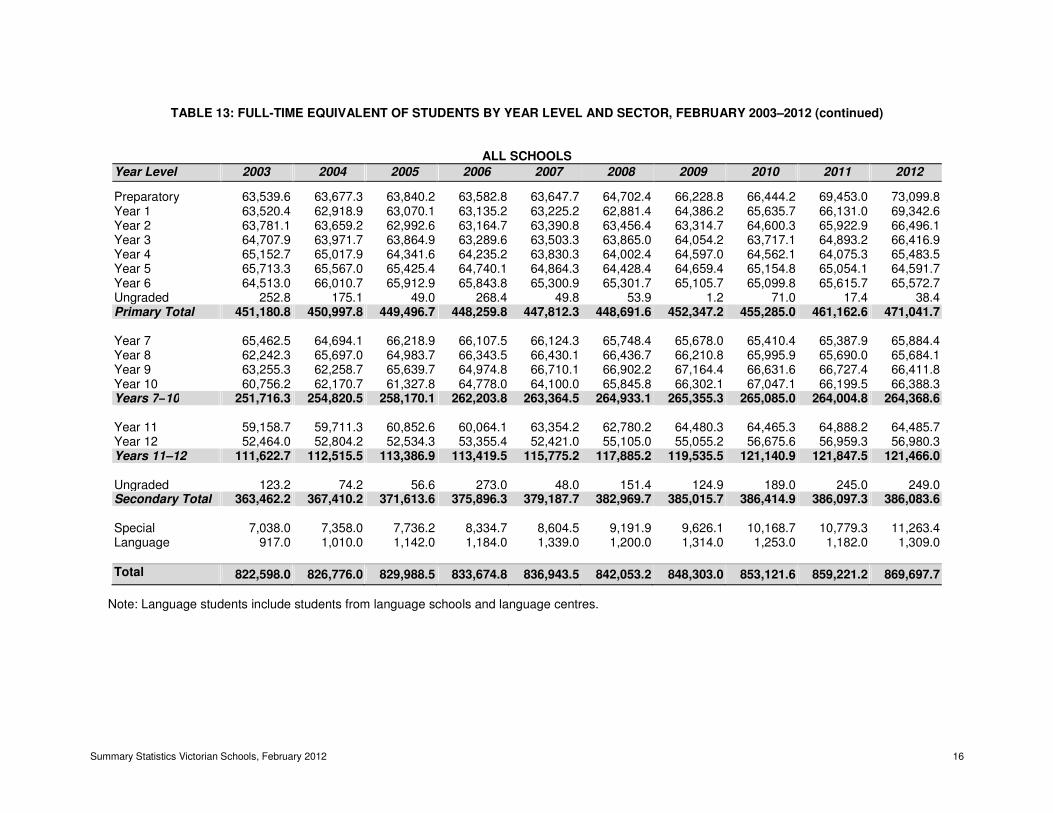
TABLE 13: FULL-TIME EQUIVALENT OF STUDENTS BY YEAR LEVEL AND SECTOR, FEBRUARY 2003–2012 (continued)
ALL SCHOOLS
Year Level 2003 2004 2005 2006 2007 2008 2009 2010 2011 2012
Preparatory 63,539.6 63,677.3 63,840.2 63,582.8 63,647.7 64,702.4 66,228.8 66,444.2 69,453.0 73,099.8 Year 1 63,520.4 62,918.9 63,070.1 63,135.2 63,225.2 62,881.4 64,386.2 65,635.7 66,131.0 69,342.6 Year 2 63,781.1 63,659.2 62,992.6 63,164.7 63,390.8 63,456.4 63,314.7 64,600.3 65,922.9 66,496.1 Year 3 64,707.9 63,971.7 63,864.9 63,289.6 63,503.3 63,865.0 64,054.2 63,717.1 64,893.2 66,416.9 Year 4 65,152.7 65,017.9 64,341.6 64,235.2 63,830.3 64,002.4 64,597.0 64,562.1 64,075.3 65,483.5 Year 5 65,713.3 65,567.0 65,425.4 64,740.1 64,864.3 64,428.4 64,659.4 65,154.8 65,054.1 64,591.7 Year 6 64,513.0 66,010.7 65,912.9 65,843.8 65,300.9 65,301.7 65,105.7 65,099.8 65,615.7 65,572.7 Ungraded 252.8 175.1 49.0 268.4 49.8 53.9 1.2 71.0 17.4 38.4 Primary Total 451,180.8 450,997.8 449,496.7 448,259.8 447,812.3 448,691.6 452,347.2 455,285.0 461,162.6 471,041.7
Year 7 65,462.5 64,694.1 66,218.9 66,107.5 66,124.3 65,748.4 65,678.0 65,410.4 65,387.9 65,884.4 Year 8 62,242.3 65,697.0 64,983.7 66,343.5 66,430.1 66,436.7 66,210.8 65,995.9 65,690.0 65,684.1 Year 9 63,255.3 62,258.7 65,639.7 64,974.8 66,710.1 66,902.2 67,164.4 66,631.6 66,727.4 66,411.8 Year 10 60,756.2 62,170.7 61,327.8 64,778.0 64,100.0 65,845.8 66,302.1 67,047.1 66,199.5 66,388.3 Years 7–10 251,716.3 254,820.5 258,170.1 262,203.8 263,364.5 264,933.1 265,355.3 265,085.0 264,004.8 264,368.6
Year 11 59,158.7 59,711.3 60,852.6 60,064.1 63,354.2 62,780.2 64,480.3 64,465.3 64,888.2 64,485.7 Year 12 52,464.0 52,804.2 52,534.3 53,355.4 52,421.0 55,105.0 55,055.2 56,675.6 56,959.3 56,980.3 Years 11–12 111,622.7 112,515.5 113,386.9 113,419.5 115,775.2 117,885.2 119,535.5 121,140.9 121,847.5 121,466.0
Ungraded 123.2 74.2 56.6 273.0 48.0 151.4 124.9 189.0 245.0 249.0 Secondary Total 363,462.2 367,410.2 371,613.6 375,896.3 379,187.7 382,969.7 385,015.7 386,414.9 386,097.3 386,083.6
Special 7,038.0 7,358.0 7,736.2 8,334.7 8,604.5 9,191.9 9,626.1 10,168.7 10,779.3 11,263.4 Language 917.0 1,010.0 1,142.0 1,184.0 1,339.0 1,200.0 1,314.0 1,253.0 1,182.0 1,309.0
Total 822,598.0 826,776.0 829,988.5 833,674.8 836,943.5 842,053.2 848,303.0 853,121.6 859,221.2 869,697.7
Note: Language students include students from language schools and language centres.
Summary Statistics Victorian Schools, February 2012 17
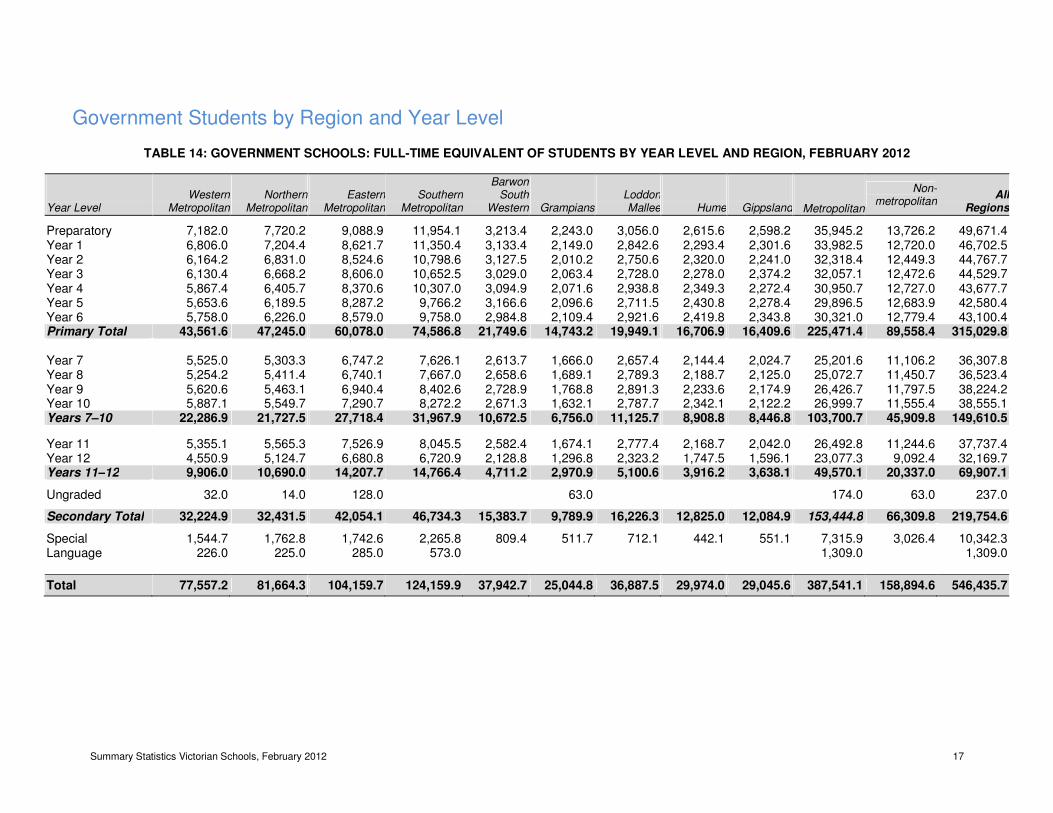
Government Students by Region and Year Level
TABLE 14: GOVERNMENT SCHOOLS: FULL-TIME EQUIVALENT OF STUDENTS BY YEAR LEVEL AND REGION, FEBRUARY 2012
Year Level
WesternMetropolitan
NorthernMetropolitan
EasternMetropolitan
Southern
Metropolitan
BarwonSouth
Western GrampiansLoddonMallee Hume Gippsland Metropolitan
Non-metropolitan
AllRegions
Preparatory 7,182.0 7,720.2 9,088.9 11,954.1 3,213.4 2,243.0 3,056.0 2,615.6 2,598.2 35,945.2 13,726.2 49,671.4 Year 1 6,806.0 7,204.4 8,621.7 11,350.4 3,133.4 2,149.0 2,842.6 2,293.4 2,301.6 33,982.5 12,720.0 46,702.5 Year 2 6,164.2 6,831.0 8,524.6 10,798.6 3,127.5 2,010.2 2,750.6 2,320.0 2,241.0 32,318.4 12,449.3 44,767.7 Year 3 6,130.4 6,668.2 8,606.0 10,652.5 3,029.0 2,063.4 2,728.0 2,278.0 2,374.2 32,057.1 12,472.6 44,529.7 Year 4 5,867.4 6,405.7 8,370.6 10,307.0 3,094.9 2,071.6 2,938.8 2,349.3 2,272.4 30,950.7 12,727.0 43,677.7 Year 5 5,653.6 6,189.5 8,287.2 9,766.2 3,166.6 2,096.6 2,711.5 2,430.8 2,278.4 29,896.5 12,683.9 42,580.4 Year 6 5,758.0 6,226.0 8,579.0 9,758.0 2,984.8 2,109.4 2,921.6 2,419.8 2,343.8 30,321.0 12,779.4 43,100.4 Primary Total 43,561.6 47,245.0 60,078.0 74,586.8 21,749.6 14,743.2 19,949.1 16,706.9 16,409.6 225,471.4 89,558.4 315,029.8
Year 7 5,525.0 5,303.3 6,747.2 7,626.1 2,613.7 1,666.0 2,657.4 2,144.4 2,024.7 25,201.6 11,106.2 36,307.8 Year 8 5,254.2 5,411.4 6,740.1 7,667.0 2,658.6 1,689.1 2,789.3 2,188.7 2,125.0 25,072.7 11,450.7 36,523.4 Year 9 5,620.6 5,463.1 6,940.4 8,402.6 2,728.9 1,768.8 2,891.3 2,233.6 2,174.9 26,426.7 11,797.5 38,224.2 Year 10 5,887.1 5,549.7 7,290.7 8,272.2 2,671.3 1,632.1 2,787.7 2,342.1 2,122.2 26,999.7 11,555.4 38,555.1 Years 7–10 22,286.9 21,727.5 27,718.4 31,967.9 10,672.5 6,756.0 11,125.7 8,908.8 8,446.8 103,700.7 45,909.8 149,610.5
Year 11 5,355.1 5,565.3 7,526.9 8,045.5 2,582.4 1,674.1 2,777.4 2,168.7 2,042.0 26,492.8 11,244.6 37,737.4 Year 12 4,550.9 5,124.7 6,680.8 6,720.9 2,128.8 1,296.8 2,323.2 1,747.5 1,596.1 23,077.3 9,092.4 32,169.7 Years 11–12 9,906.0 10,690.0 14,207.7 14,766.4 4,711.2 2,970.9 5,100.6 3,916.2 3,638.1 49,570.1 20,337.0 69,907.1 Ungraded 32.0 14.0 128.0 63.0 174.0 63.0 237.0 Secondary Total 32,224.9 32,431.5 42,054.1 46,734.3 15,383.7 9,789.9 16,226.3 12,825.0 12,084.9 153,444.8 66,309.8 219,754.6 Special 1,544.7 1,762.8 1,742.6 2,265.8 809.4 511.7 712.1 442.1 551.1 7,315.9 3,026.4 10,342.3 Language 226.0 225.0 285.0 573.0 1,309.0 1,309.0
Total 77,557.2 81,664.3 104,159.7 124,159.9 37,942.7 25,044.8 36,887.5 29,974.0 29,045.6 387,541.1 158,894.6 546,435.7
Summary Statistics Victorian Schools, February 2012 18
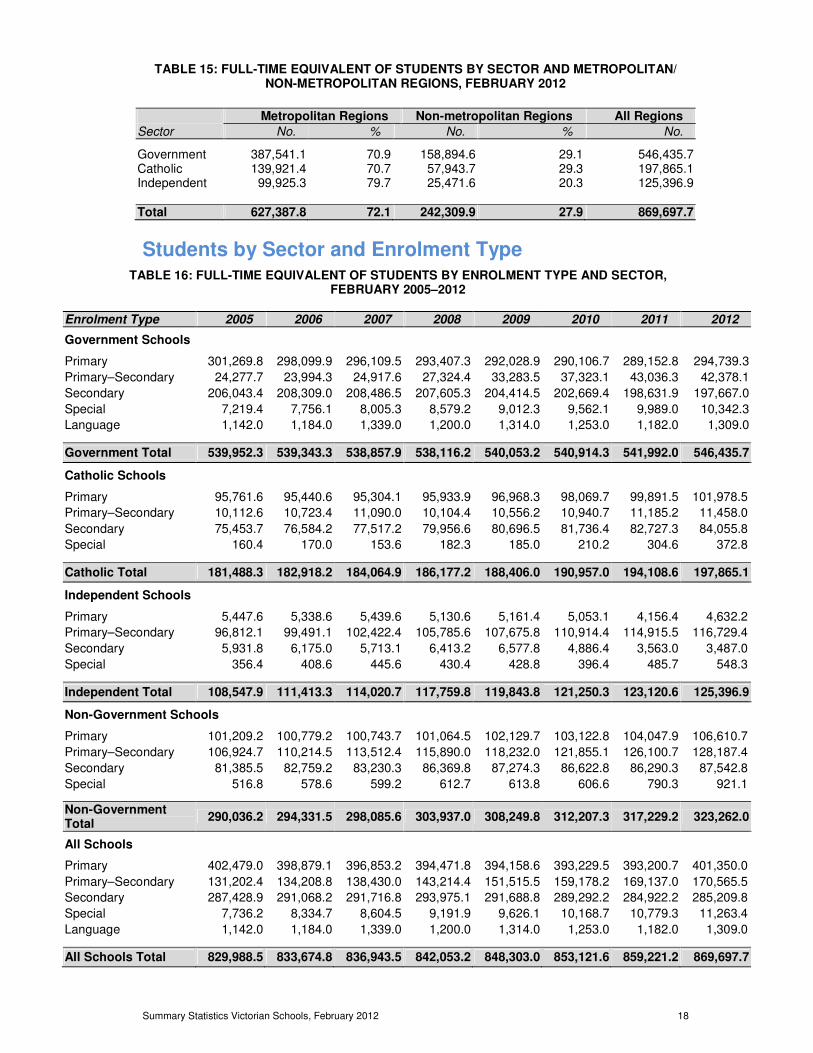
TABLE 15: FULL-TIME EQUIVALENT OF STUDENTS BY SECTOR AND METROPOLITAN/ NON-METROPOLITAN REGIONS, FEBRUARY 2012
Metropolitan Regions Non-metropolitan Regions All Regions
Sector No. % No. % No.
Government 387,541.1 70.9 158,894.6 29.1 546,435.7 Catholic 139,921.4 70.7 57,943.7 29.3 197,865.1 Independent 99,925.3 79.7 25,471.6 20.3 125,396.9 Total 627,387.8 72.1 242,309.9 27.9 869,697.7
Students by Sector and Enrolment Type
TABLE 16: FULL-TIME EQUIVALENT OF STUDENTS BY ENROLMENT TYPE AND SECTOR, FEBRUARY 2005–2012
Enrolment Type 2005 2006 2007 2008 2009 2010 2011 2012
Government Schools
Primary 301,269.8 298,099.9 296,109.5 293,407.3 292,028.9 290,106.7 289,152.8 294,739.3
Primary–Secondary 24,277.7 23,994.3 24,917.6 27,324.4 33,283.5 37,323.1 43,036.3 42,378.1
Secondary 206,043.4 208,309.0 208,486.5 207,605.3 204,414.5 202,669.4 198,631.9 197,667.0
Special 7,219.4 7,756.1 8,005.3 8,579.2 9,012.3 9,562.1 9,989.0 10,342.3
Language 1,142.0 1,184.0 1,339.0 1,200.0 1,314.0 1,253.0 1,182.0 1,309.0 Government Total 539,952.3 539,343.3 538,857.9 538,116.2 540,053.2 540,914.3 541,992.0 546,435.7
Catholic Schools
Primary 95,761.6 95,440.6 95,304.1 95,933.9 96,968.3 98,069.7 99,891.5 101,978.5
Primary–Secondary 10,112.6 10,723.4 11,090.0 10,104.4 10,556.2 10,940.7 11,185.2 11,458.0
Secondary 75,453.7 76,584.2 77,517.2 79,956.6 80,696.5 81,736.4 82,727.3 84,055.8
Special 160.4 170.0 153.6 182.3 185.0 210.2 304.6 372.8 Catholic Total 181,488.3 182,918.2 184,064.9 186,177.2 188,406.0 190,957.0 194,108.6 197,865.1
Independent Schools
Primary 5,447.6 5,338.6 5,439.6 5,130.6 5,161.4 5,053.1 4,156.4 4,632.2
Primary–Secondary 96,812.1 99,491.1 102,422.4 105,785.6 107,675.8 110,914.4 114,915.5 116,729.4
Secondary 5,931.8 6,175.0 5,713.1 6,413.2 6,577.8 4,886.4 3,563.0 3,487.0
Special 356.4 408.6 445.6 430.4 428.8 396.4 485.7 548.3 Independent Total 108,547.9 111,413.3 114,020.7 117,759.8 119,843.8 121,250.3 123,120.6 125,396.9
Non-Government Schools
Primary 101,209.2 100,779.2 100,743.7 101,064.5 102,129.7 103,122.8 104,047.9 106,610.7
Primary–Secondary 106,924.7 110,214.5 113,512.4 115,890.0 118,232.0 121,855.1 126,100.7 128,187.4
Secondary 81,385.5 82,759.2 83,230.3 86,369.8 87,274.3 86,622.8 86,290.3 87,542.8
Special 516.8 578.6 599.2 612.7 613.8 606.6 790.3 921.1 Non-Government Total
290,036.2 294,331.5 298,085.6 303,937.0 308,249.8 312,207.3 317,229.2 323,262.0
All Schools
Primary 402,479.0 398,879.1 396,853.2 394,471.8 394,158.6 393,229.5 393,200.7 401,350.0
Primary–Secondary 131,202.4 134,208.8 138,430.0 143,214.4 151,515.5 159,178.2 169,137.0 170,565.5
Secondary 287,428.9 291,068.2 291,716.8 293,975.1 291,688.8 289,292.2 284,922.2 285,209.8
Special 7,736.2 8,334.7 8,604.5 9,191.9 9,626.1 10,168.7 10,779.3 11,263.4
Language 1,142.0 1,184.0 1,339.0 1,200.0 1,314.0 1,253.0 1,182.0 1,309.0 All Schools Total 829,988.5 833,674.8 836,943.5 842,053.2 848,303.0 853,121.6 859,221.2 869,697.7
Summary Statistics Victorian Schools, February 2012 19
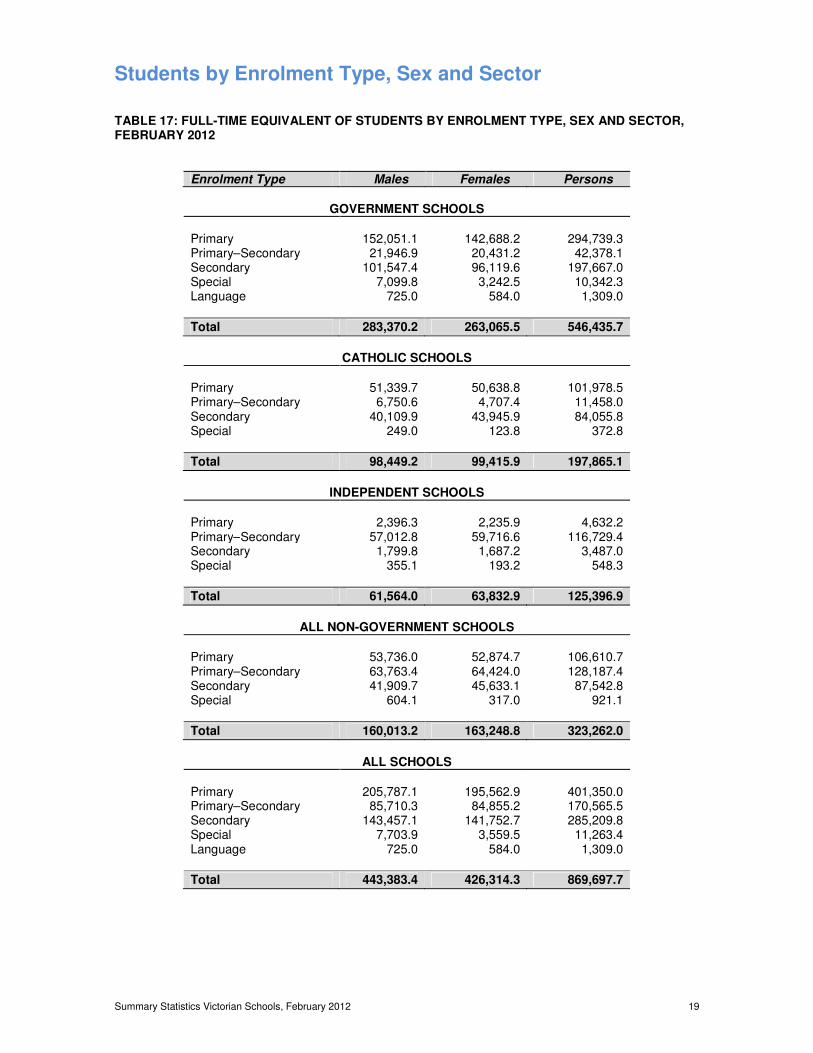
Students by Enrolment Type, Sex and Sector TABLE 17: FULL-TIME EQUIVALENT OF STUDENTS BY ENROLMENT TYPE, SEX AND SECTOR, FEBRUARY 2012
Enrolment Type Males Females Persons
GOVERNMENT SCHOOLS
Primary 152,051.1 142,688.2 294,739.3 Primary–Secondary 21,946.9 20,431.2 42,378.1 Secondary 101,547.4 96,119.6 197,667.0 Special 7,099.8 3,242.5 10,342.3 Language 725.0 584.0 1,309.0
Total 283,370.2 263,065.5 546,435.7
CATHOLIC SCHOOLS
Primary 51,339.7 50,638.8 101,978.5 Primary–Secondary 6,750.6 4,707.4 11,458.0 Secondary 40,109.9 43,945.9 84,055.8 Special 249.0 123.8 372.8
Total 98,449.2 99,415.9 197,865.1
INDEPENDENT SCHOOLS
Primary 2,396.3 2,235.9 4,632.2 Primary–Secondary 57,012.8 59,716.6 116,729.4 Secondary 1,799.8 1,687.2 3,487.0 Special 355.1 193.2 548.3
Total 61,564.0 63,832.9 125,396.9
ALL NON-GOVERNMENT SCHOOLS
Primary 53,736.0 52,874.7 106,610.7 Primary–Secondary 63,763.4 64,424.0 128,187.4 Secondary 41,909.7 45,633.1 87,542.8 Special 604.1 317.0 921.1
Total 160,013.2 163,248.8 323,262.0
ALL SCHOOLS
Primary 205,787.1 195,562.9 401,350.0 Primary–Secondary 85,710.3 84,855.2 170,565.5 Secondary 143,457.1 141,752.7 285,209.8 Special 7,703.9 3,559.5 11,263.4 Language 725.0 584.0 1,309.0
Total 443,383.4 426,314.3 869,697.7
Summary Statistics Victorian Schools, February 2012 20
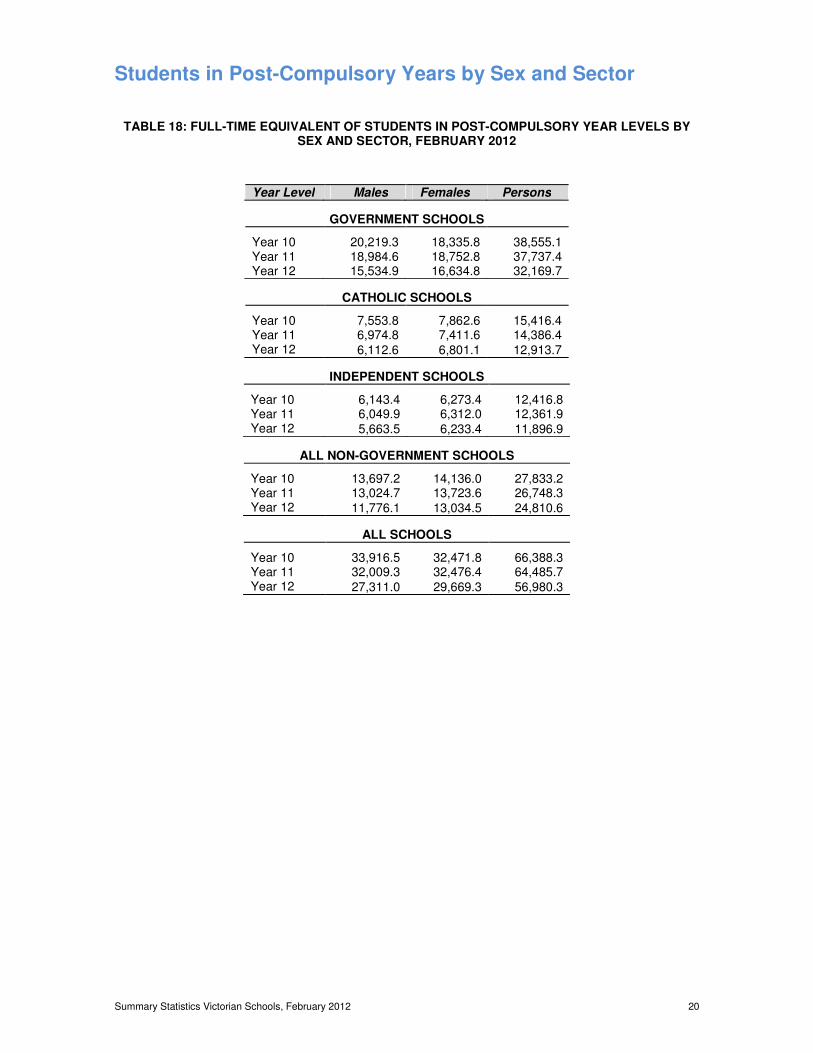
Students in Post-Compulsory Years by Sex and Sector
TABLE 18: FULL-TIME EQUIVALENT OF STUDENTS IN POST-COMPULSORY YEAR LEVELS BY SEX AND SECTOR, FEBRUARY 2012
Year Level Males Females Persons
GOVERNMENT SCHOOLS
Year 10 20,219.3 18,335.8 38,555.1 Year 11 18,984.6 18,752.8 37,737.4 Year 12 15,534.9 16,634.8 32,169.7
CATHOLIC SCHOOLS
Year 10 7,553.8 7,862.6 15,416.4 Year 11 6,974.8 7,411.6 14,386.4 Year 12 6,112.6 6,801.1 12,913.7
INDEPENDENT SCHOOLS
Year 10 6,143.4 6,273.4 12,416.8 Year 11 6,049.9 6,312.0 12,361.9 Year 12 5,663.5 6,233.4 11,896.9
ALL NON-GOVERNMENT SCHOOLS
Year 10 13,697.2 14,136.0 27,833.2 Year 11 13,024.7 13,723.6 26,748.3 Year 12 11,776.1 13,034.5 24,810.6
ALL SCHOOLS
Year 10 33,916.5 32,471.8 66,388.3 Year 11 32,009.3 32,476.4 64,485.7 Year 12 27,311.0 29,669.3 56,980.3
Summary Statistics Victorian Schools, February 2012 21
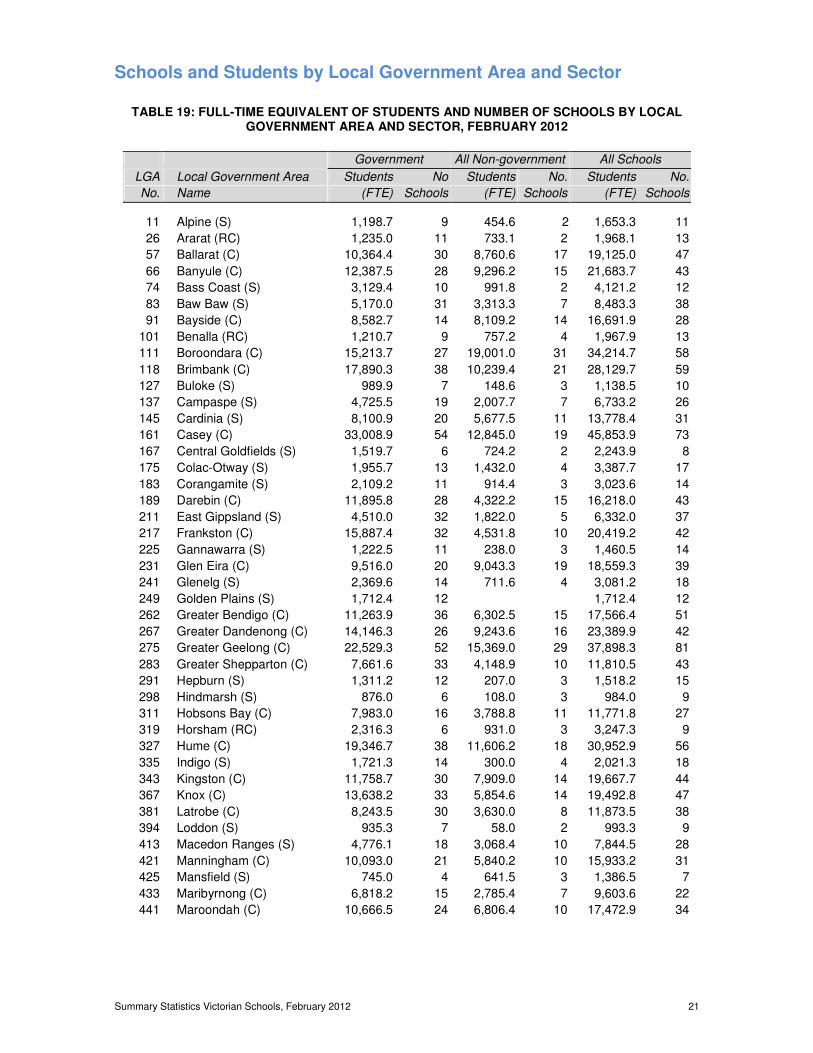
Schools and Students by Local Government Area and Sector
TABLE 19: FULL-TIME EQUIVALENT OF STUDENTS AND NUMBER OF SCHOOLS BY LOCAL
GOVERNMENT AREA AND SECTOR, FEBRUARY 2012
Government All Non-government All Schools
LGA Local Government Area Students No Students No. Students No.
No. Name (FTE) Schools (FTE) Schools (FTE) Schools
11 Alpine (S) 1,198.7 9 454.6 2 1,653.3 11
26 Ararat (RC) 1,235.0 11 733.1 2 1,968.1 13
57 Ballarat (C) 10,364.4 30 8,760.6 17 19,125.0 47
66 Banyule (C) 12,387.5 28 9,296.2 15 21,683.7 43
74 Bass Coast (S) 3,129.4 10 991.8 2 4,121.2 12
83 Baw Baw (S) 5,170.0 31 3,313.3 7 8,483.3 38
91 Bayside (C) 8,582.7 14 8,109.2 14 16,691.9 28
101 Benalla (RC) 1,210.7 9 757.2 4 1,967.9 13
111 Boroondara (C) 15,213.7 27 19,001.0 31 34,214.7 58
118 Brimbank (C) 17,890.3 38 10,239.4 21 28,129.7 59
127 Buloke (S) 989.9 7 148.6 3 1,138.5 10
137 Campaspe (S) 4,725.5 19 2,007.7 7 6,733.2 26
145 Cardinia (S) 8,100.9 20 5,677.5 11 13,778.4 31
161 Casey (C) 33,008.9 54 12,845.0 19 45,853.9 73
167 Central Goldfields (S) 1,519.7 6 724.2 2 2,243.9 8
175 Colac-Otway (S) 1,955.7 13 1,432.0 4 3,387.7 17
183 Corangamite (S) 2,109.2 11 914.4 3 3,023.6 14
189 Darebin (C) 11,895.8 28 4,322.2 15 16,218.0 43
211 East Gippsland (S) 4,510.0 32 1,822.0 5 6,332.0 37
217 Frankston (C) 15,887.4 32 4,531.8 10 20,419.2 42
225 Gannawarra (S) 1,222.5 11 238.0 3 1,460.5 14
231 Glen Eira (C) 9,516.0 20 9,043.3 19 18,559.3 39
241 Glenelg (S) 2,369.6 14 711.6 4 3,081.2 18
249 Golden Plains (S) 1,712.4 12 1,712.4 12
262 Greater Bendigo (C) 11,263.9 36 6,302.5 15 17,566.4 51
267 Greater Dandenong (C) 14,146.3 26 9,243.6 16 23,389.9 42
275 Greater Geelong (C) 22,529.3 52 15,369.0 29 37,898.3 81
283 Greater Shepparton (C) 7,661.6 33 4,148.9 10 11,810.5 43
291 Hepburn (S) 1,311.2 12 207.0 3 1,518.2 15
298 Hindmarsh (S) 876.0 6 108.0 3 984.0 9
311 Hobsons Bay (C) 7,983.0 16 3,788.8 11 11,771.8 27
319 Horsham (RC) 2,316.3 6 931.0 3 3,247.3 9
327 Hume (C) 19,346.7 38 11,606.2 18 30,952.9 56
335 Indigo (S) 1,721.3 14 300.0 4 2,021.3 18
343 Kingston (C) 11,758.7 30 7,909.0 14 19,667.7 44
367 Knox (C) 13,638.2 33 5,854.6 14 19,492.8 47
381 Latrobe (C) 8,243.5 30 3,630.0 8 11,873.5 38
394 Loddon (S) 935.3 7 58.0 2 993.3 9
413 Macedon Ranges (S) 4,776.1 18 3,068.4 10 7,844.5 28
421 Manningham (C) 10,093.0 21 5,840.2 10 15,933.2 31
425 Mansfield (S) 745.0 4 641.5 3 1,386.5 7
433 Maribyrnong (C) 6,818.2 15 2,785.4 7 9,603.6 22
441 Maroondah (C) 10,666.5 24 6,806.4 10 17,472.9 34
Summary Statistics Victorian Schools, February 2012 22
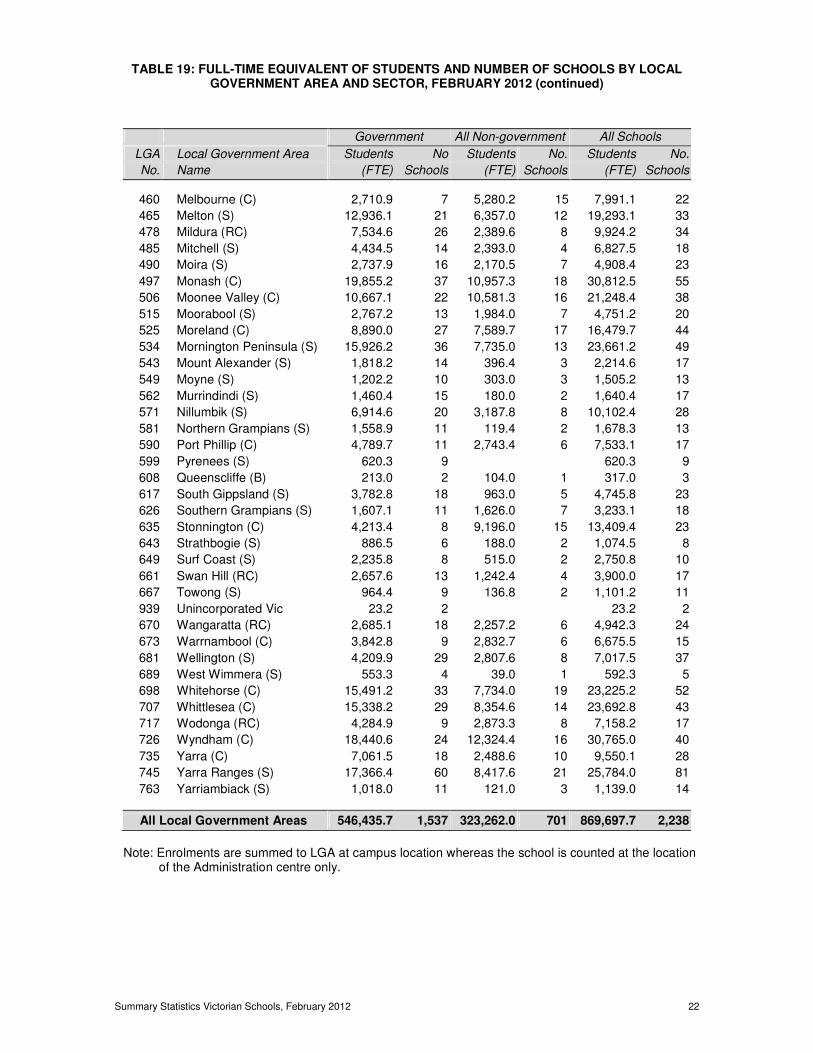
TABLE 19: FULL-TIME EQUIVALENT OF STUDENTS AND NUMBER OF SCHOOLS BY LOCAL GOVERNMENT AREA AND SECTOR, FEBRUARY 2012 (continued)
Government All Non-government All Schools
LGA Local Government Area Students No Students No. Students No.
No. Name (FTE) Schools (FTE) Schools (FTE) Schools
460 Melbourne (C) 2,710.9 7 5,280.2 15 7,991.1 22
465 Melton (S) 12,936.1 21 6,357.0 12 19,293.1 33
478 Mildura (RC) 7,534.6 26 2,389.6 8 9,924.2 34
485 Mitchell (S) 4,434.5 14 2,393.0 4 6,827.5 18
490 Moira (S) 2,737.9 16 2,170.5 7 4,908.4 23
497 Monash (C) 19,855.2 37 10,957.3 18 30,812.5 55
506 Moonee Valley (C) 10,667.1 22 10,581.3 16 21,248.4 38
515 Moorabool (S) 2,767.2 13 1,984.0 7 4,751.2 20
525 Moreland (C) 8,890.0 27 7,589.7 17 16,479.7 44
534 Mornington Peninsula (S) 15,926.2 36 7,735.0 13 23,661.2 49
543 Mount Alexander (S) 1,818.2 14 396.4 3 2,214.6 17
549 Moyne (S) 1,202.2 10 303.0 3 1,505.2 13
562 Murrindindi (S) 1,460.4 15 180.0 2 1,640.4 17
571 Nillumbik (S) 6,914.6 20 3,187.8 8 10,102.4 28
581 Northern Grampians (S) 1,558.9 11 119.4 2 1,678.3 13
590 Port Phillip (C) 4,789.7 11 2,743.4 6 7,533.1 17
599 Pyrenees (S) 620.3 9 620.3 9
608 Queenscliffe (B) 213.0 2 104.0 1 317.0 3
617 South Gippsland (S) 3,782.8 18 963.0 5 4,745.8 23
626 Southern Grampians (S) 1,607.1 11 1,626.0 7 3,233.1 18
635 Stonnington (C) 4,213.4 8 9,196.0 15 13,409.4 23
643 Strathbogie (S) 886.5 6 188.0 2 1,074.5 8
649 Surf Coast (S) 2,235.8 8 515.0 2 2,750.8 10
661 Swan Hill (RC) 2,657.6 13 1,242.4 4 3,900.0 17
667 Towong (S) 964.4 9 136.8 2 1,101.2 11
939 Unincorporated Vic 23.2 2 23.2 2
670 Wangaratta (RC) 2,685.1 18 2,257.2 6 4,942.3 24
673 Warrnambool (C) 3,842.8 9 2,832.7 6 6,675.5 15
681 Wellington (S) 4,209.9 29 2,807.6 8 7,017.5 37
689 West Wimmera (S) 553.3 4 39.0 1 592.3 5
698 Whitehorse (C) 15,491.2 33 7,734.0 19 23,225.2 52
707 Whittlesea (C) 15,338.2 29 8,354.6 14 23,692.8 43
717 Wodonga (RC) 4,284.9 9 2,873.3 8 7,158.2 17
726 Wyndham (C) 18,440.6 24 12,324.4 16 30,765.0 40
735 Yarra (C) 7,061.5 18 2,488.6 10 9,550.1 28
745 Yarra Ranges (S) 17,366.4 60 8,417.6 21 25,784.0 81
763 Yarriambiack (S) 1,018.0 11 121.0 3 1,139.0 14
All Local Government Areas 546,435.7 1,537 323,262.0 701 869,697.7 2,238
Note: Enrolments are summed to LGA at campus location whereas the school is counted at the location
of the Administration centre only.
Summary Statistics Victorian Schools, February 2012 23
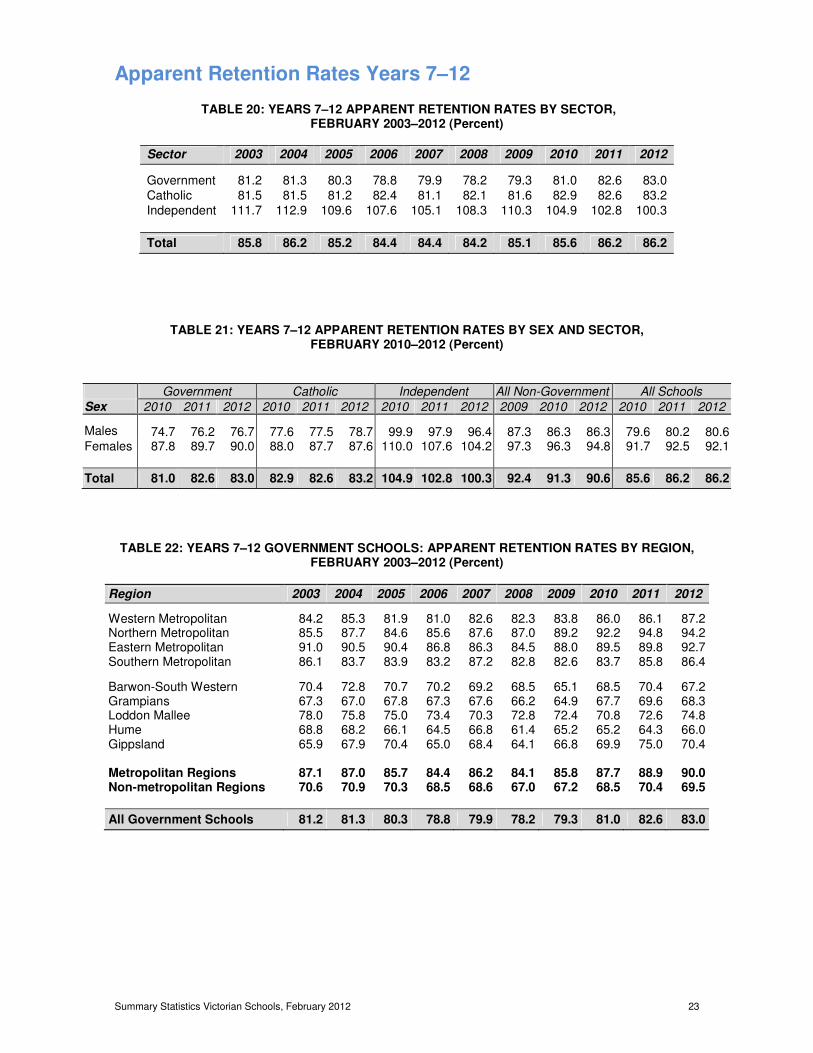
Apparent Retention Rates Years 7–12
TABLE 20: YEARS 7–12 APPARENT RETENTION RATES BY SECTOR, FEBRUARY 2003–2012 (Percent)
Sector 2003 2004 2005 2006 2007 2008 2009 2010 2011 2012
Government 81.2 81.3 80.3 78.8 79.9 78.2 79.3 81.0 82.6 83.0
Catholic 81.5 81.5 81.2 82.4 81.1 82.1 81.6 82.9 82.6 83.2
Independent 111.7 112.9 109.6 107.6 105.1 108.3 110.3 104.9 102.8 100.3
Total 85.8 86.2 85.2 84.4 84.4 84.2 85.1 85.6 86.2 86.2
TABLE 21: YEARS 7–12 APPARENT RETENTION RATES BY SEX AND SECTOR, FEBRUARY 2010–2012 (Percent)
Government Catholic Independent All Non-Government All Schools
Sex 2010 2011 2012 2010 2011 2012 2010 2011 2012 2009 2010 2012 2010 2011 2012
Males 74.7 76.2 76.7 77.6 77.5 78.7 99.9 97.9 96.4 87.3 86.3 86.3 79.6 80.2 80.6 Females 87.8 89.7 90.0 88.0 87.7 87.6 110.0 107.6 104.2 97.3 96.3 94.8 91.7 92.5 92.1
Total 81.0 82.6 83.0 82.9 82.6 83.2 104.9 102.8 100.3 92.4 91.3 90.6 85.6 86.2 86.2
TABLE 22: YEARS 7–12 GOVERNMENT SCHOOLS: APPARENT RETENTION RATES BY REGION, FEBRUARY 2003–2012 (Percent)
Region 2003 2004 2005 2006 2007 2008 2009 2010 2011 2012
Western Metropolitan 84.2 85.3 81.9 81.0 82.6 82.3 83.8 86.0 86.1 87.2 Northern Metropolitan 85.5 87.7 84.6 85.6 87.6 87.0 89.2 92.2 94.8 94.2 Eastern Metropolitan 91.0 90.5 90.4 86.8 86.3 84.5 88.0 89.5 89.8 92.7 Southern Metropolitan 86.1 83.7 83.9 83.2 87.2 82.8 82.6 83.7 85.8 86.4 Barwon-South Western 70.4 72.8 70.7 70.2 69.2 68.5 65.1 68.5 70.4 67.2 Grampians 67.3 67.0 67.8 67.3 67.6 66.2 64.9 67.7 69.6 68.3 Loddon Mallee 78.0 75.8 75.0 73.4 70.3 72.8 72.4 70.8 72.6 74.8 Hume 68.8 68.2 66.1 64.5 66.8 61.4 65.2 65.2 64.3 66.0 Gippsland 65.9 67.9 70.4 65.0 68.4 64.1 66.8 69.9 75.0 70.4 Metropolitan Regions 87.1 87.0 85.7 84.4 86.2 84.1 85.8 87.7 88.9 90.0 Non-metropolitan Regions 70.6 70.9 70.3 68.5 68.6 67.0 67.2 68.5 70.4 69.5
All Government Schools 81.2 81.3 80.3 78.8 79.9 78.2 79.3 81.0 82.6 83.0
Summary Statistics Victorian Schools, February 2012 24
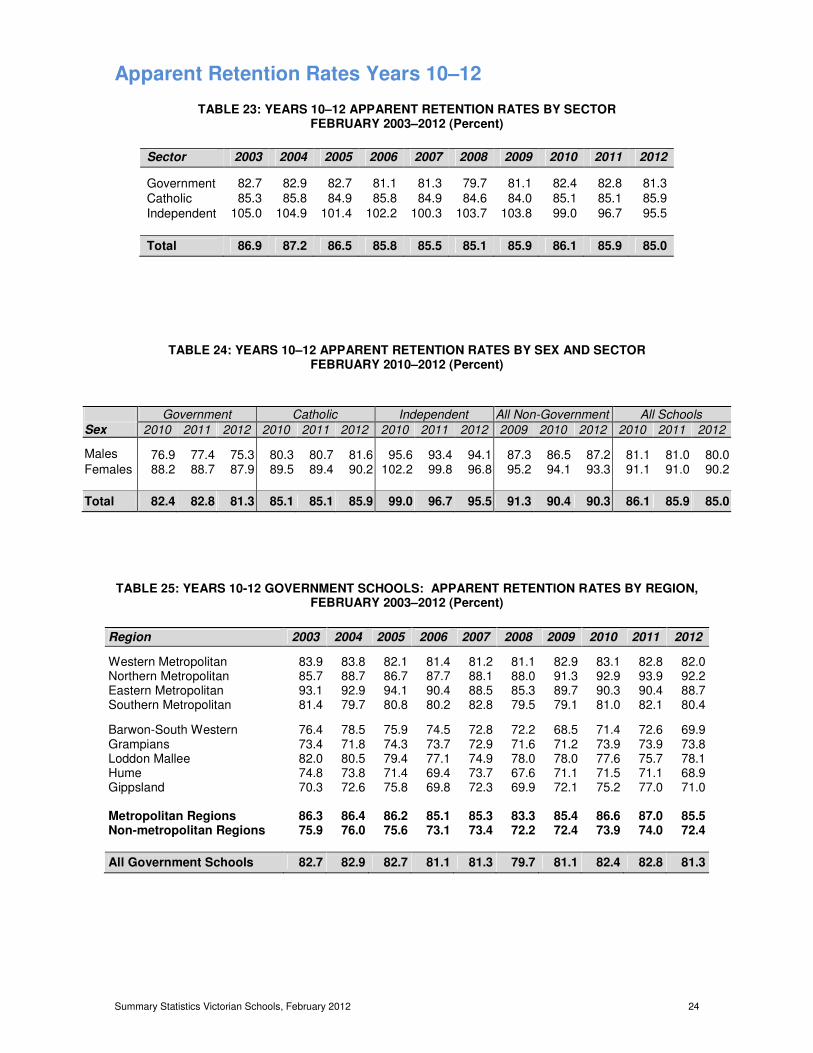
Apparent Retention Rates Years 10–12
TABLE 23: YEARS 10–12 APPARENT RETENTION RATES BY SECTOR FEBRUARY 2003–2012 (Percent)
Sector 2003 2004 2005 2006 2007 2008 2009 2010 2011 2012
Government 82.7 82.9 82.7 81.1 81.3 79.7 81.1 82.4 82.8 81.3
Catholic 85.3 85.8 84.9 85.8 84.9 84.6 84.0 85.1 85.1 85.9
Independent 105.0 104.9 101.4 102.2 100.3 103.7 103.8 99.0 96.7 95.5
Total 86.9 87.2 86.5 85.8 85.5 85.1 85.9 86.1 85.9 85.0
TABLE 24: YEARS 10–12 APPARENT RETENTION RATES BY SEX AND SECTOR FEBRUARY 2010–2012 (Percent)
Government Catholic Independent All Non-Government All Schools
Sex 2010 2011 2012 2010 2011 2012 2010 2011 2012 2009 2010 2012 2010 2011 2012
Males 76.9 77.4 75.3 80.3 80.7 81.6 95.6 93.4 94.1 87.3 86.5 87.2 81.1 81.0 80.0 Females 88.2 88.7 87.9 89.5 89.4 90.2 102.2 99.8 96.8 95.2 94.1 93.3 91.1 91.0 90.2
Total 82.4 82.8 81.3 85.1 85.1 85.9 99.0 96.7 95.5 91.3 90.4 90.3 86.1 85.9 85.0
TABLE 25: YEARS 10-12 GOVERNMENT SCHOOLS: APPARENT RETENTION RATES BY REGION, FEBRUARY 2003–2012 (Percent)
Region 2003 2004 2005 2006 2007 2008 2009 2010 2011 2012
Western Metropolitan 83.9 83.8 82.1 81.4 81.2 81.1 82.9 83.1 82.8 82.0 Northern Metropolitan 85.7 88.7 86.7 87.7 88.1 88.0 91.3 92.9 93.9 92.2 Eastern Metropolitan 93.1 92.9 94.1 90.4 88.5 85.3 89.7 90.3 90.4 88.7 Southern Metropolitan 81.4 79.7 80.8 80.2 82.8 79.5 79.1 81.0 82.1 80.4 Barwon-South Western 76.4 78.5 75.9 74.5 72.8 72.2 68.5 71.4 72.6 69.9 Grampians 73.4 71.8 74.3 73.7 72.9 71.6 71.2 73.9 73.9 73.8 Loddon Mallee 82.0 80.5 79.4 77.1 74.9 78.0 78.0 77.6 75.7 78.1 Hume 74.8 73.8 71.4 69.4 73.7 67.6 71.1 71.5 71.1 68.9 Gippsland 70.3 72.6 75.8 69.8 72.3 69.9 72.1 75.2 77.0 71.0 Metropolitan Regions 86.3 86.4 86.2 85.1 85.3 83.3 85.4 86.6 87.0 85.5 Non-metropolitan Regions 75.9 76.0 75.6 73.1 73.4 72.2 72.4 73.9 74.0 72.4
All Government Schools 82.7 82.9 82.7 81.1 81.3 79.7 81.1 82.4 82.8 81.3
Summary Statistics Victorian Schools, February 2012 25
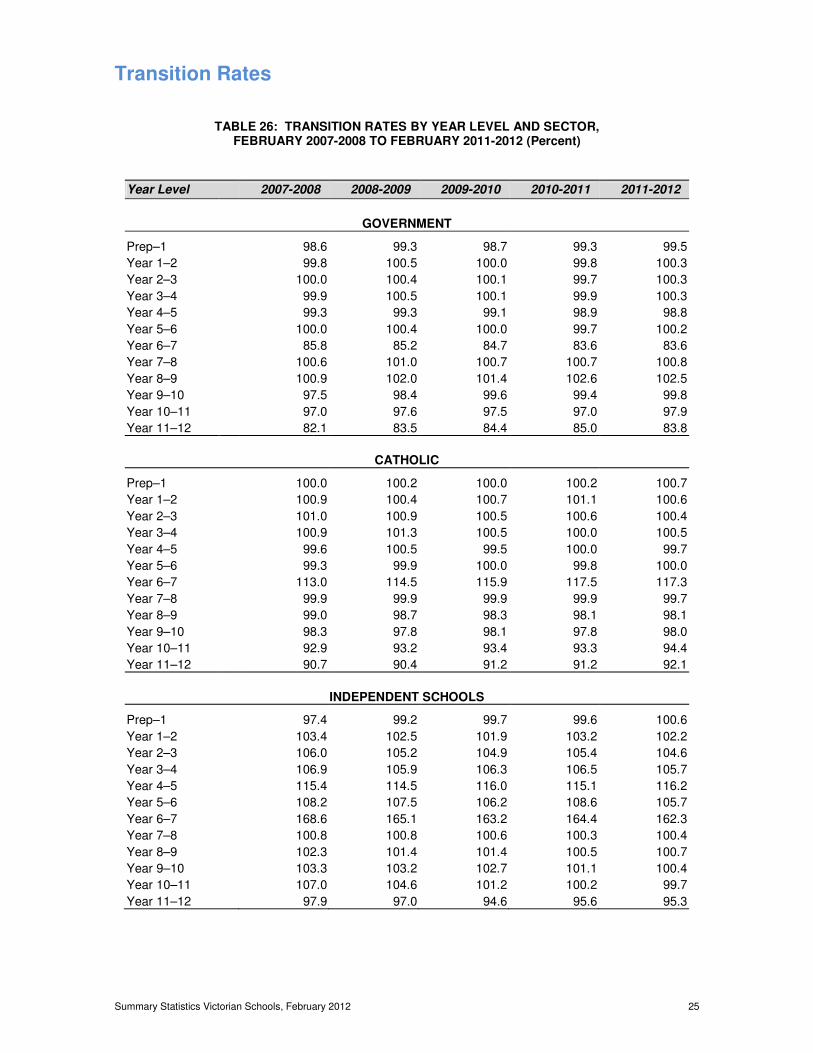
Transition Rates
TABLE 26: TRANSITION RATES BY YEAR LEVEL AND SECTOR, FEBRUARY 2007-2008 TO FEBRUARY 2011-2012 (Percent)
Year Level 2007-2008 2008-2009 2009-2010 2010-2011 2011-2012
GOVERNMENT
Prep–1 98.6 99.3 98.7 99.3 99.5
Year 1–2 99.8 100.5 100.0 99.8 100.3
Year 2–3 100.0 100.4 100.1 99.7 100.3
Year 3–4 99.9 100.5 100.1 99.9 100.3
Year 4–5 99.3 99.3 99.1 98.9 98.8
Year 5–6 100.0 100.4 100.0 99.7 100.2
Year 6–7 85.8 85.2 84.7 83.6 83.6
Year 7–8 100.6 101.0 100.7 100.7 100.8
Year 8–9 100.9 102.0 101.4 102.6 102.5
Year 9–10 97.5 98.4 99.6 99.4 99.8
Year 10–11 97.0 97.6 97.5 97.0 97.9
Year 11–12 82.1 83.5 84.4 85.0 83.8
CATHOLIC
Prep–1 100.0 100.2 100.0 100.2 100.7
Year 1–2 100.9 100.4 100.7 101.1 100.6
Year 2–3 101.0 100.9 100.5 100.6 100.4
Year 3–4 100.9 101.3 100.5 100.0 100.5
Year 4–5 99.6 100.5 99.5 100.0 99.7
Year 5–6 99.3 99.9 100.0 99.8 100.0
Year 6–7 113.0 114.5 115.9 117.5 117.3
Year 7–8 99.9 99.9 99.9 99.9 99.7
Year 8–9 99.0 98.7 98.3 98.1 98.1
Year 9–10 98.3 97.8 98.1 97.8 98.0
Year 10–11 92.9 93.2 93.4 93.3 94.4
Year 11–12 90.7 90.4 91.2 91.2 92.1
INDEPENDENT SCHOOLS
Prep–1 97.4 99.2 99.7 99.6 100.6
Year 1–2 103.4 102.5 101.9 103.2 102.2
Year 2–3 106.0 105.2 104.9 105.4 104.6
Year 3–4 106.9 105.9 106.3 106.5 105.7
Year 4–5 115.4 114.5 116.0 115.1 116.2
Year 5–6 108.2 107.5 106.2 108.6 105.7
Year 6–7 168.6 165.1 163.2 164.4 162.3
Year 7–8 100.8 100.8 100.6 100.3 100.4
Year 8–9 102.3 101.4 101.4 100.5 100.7
Year 9–10 103.3 103.2 102.7 101.1 100.4
Year 10–11 107.0 104.6 101.2 100.2 99.7
Year 11–12 97.9 97.0 94.6 95.6 95.3
Summary Statistics Victorian Schools, February 2012 26
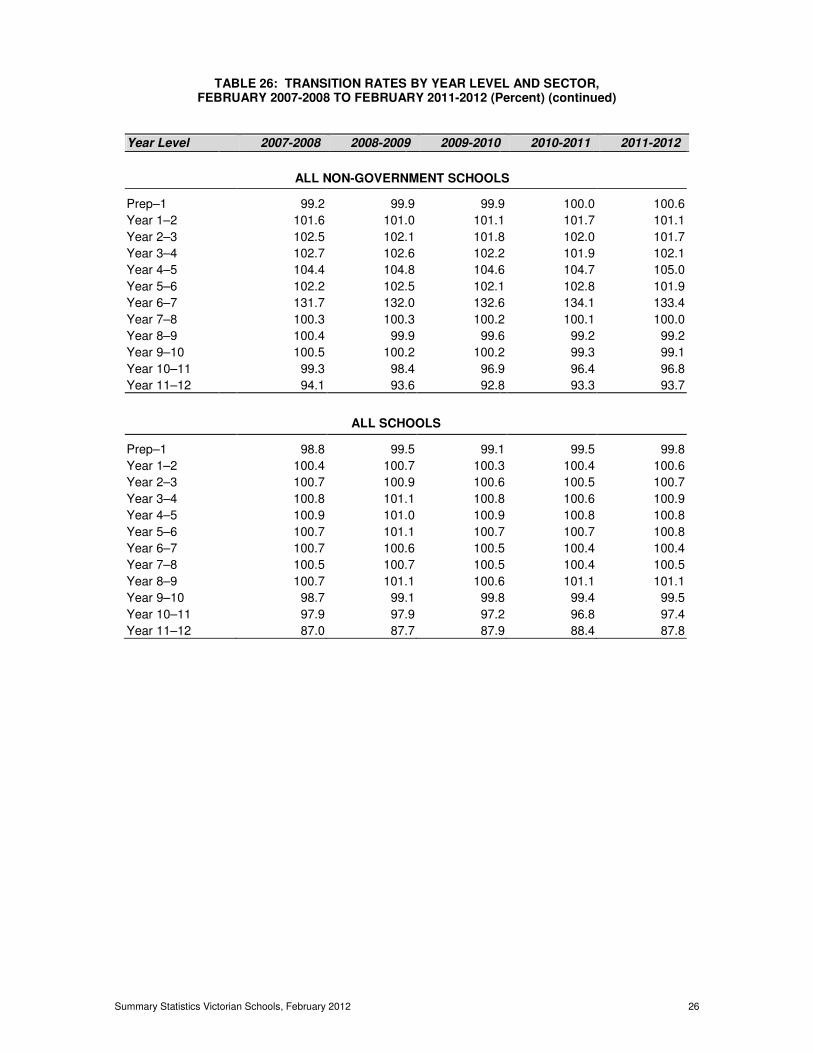
TABLE 26: TRANSITION RATES BY YEAR LEVEL AND SECTOR,
FEBRUARY 2007-2008 TO FEBRUARY 2011-2012 (Percent) (continued)
Year Level 2007-2008 2008-2009 2009-2010 2010-2011 2011-2012
ALL NON-GOVERNMENT SCHOOLS
Prep–1 99.2 99.9 99.9 100.0 100.6
Year 1–2 101.6 101.0 101.1 101.7 101.1
Year 2–3 102.5 102.1 101.8 102.0 101.7
Year 3–4 102.7 102.6 102.2 101.9 102.1
Year 4–5 104.4 104.8 104.6 104.7 105.0
Year 5–6 102.2 102.5 102.1 102.8 101.9
Year 6–7 131.7 132.0 132.6 134.1 133.4
Year 7–8 100.3 100.3 100.2 100.1 100.0
Year 8–9 100.4 99.9 99.6 99.2 99.2
Year 9–10 100.5 100.2 100.2 99.3 99.1
Year 10–11 99.3 98.4 96.9 96.4 96.8
Year 11–12 94.1 93.6 92.8 93.3 93.7
ALL SCHOOLS
Prep–1 98.8 99.5 99.1 99.5 99.8
Year 1–2 100.4 100.7 100.3 100.4 100.6
Year 2–3 100.7 100.9 100.6 100.5 100.7
Year 3–4 100.8 101.1 100.8 100.6 100.9
Year 4–5 100.9 101.0 100.9 100.8 100.8
Year 5–6 100.7 101.1 100.7 100.7 100.8
Year 6–7 100.7 100.6 100.5 100.4 100.4
Year 7–8 100.5 100.7 100.5 100.4 100.5
Year 8–9 100.7 101.1 100.6 101.1 101.1
Year 9–10 98.7 99.1 99.8 99.4 99.5
Year 10–11 97.9 97.9 97.2 96.8 97.4
Year 11–12 87.0 87.7 87.9 88.4 87.8
Summary Statistics Victorian Schools, February 2012 27
Class Sizes
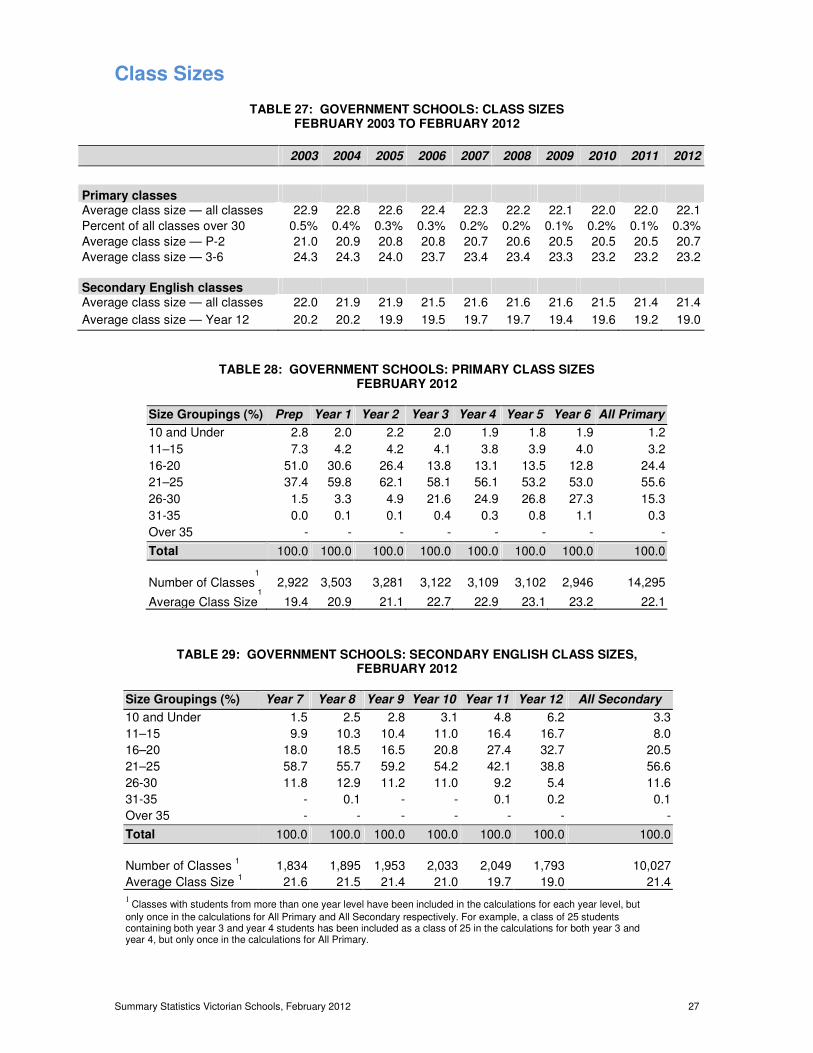
TABLE 27: GOVERNMENT SCHOOLS: CLASS SIZES FEBRUARY 2003 TO FEBRUARY 2012
2003 2004 2005 2006 2007 2008 2009 2010 2011 2012
Primary classes Average class size — all classes 22.9 22.8 22.6 22.4 22.3 22.2 22.1 22.0 22.0 22.1
Percent of all classes over 30 0.5% 0.4% 0.3% 0.3% 0.2% 0.2% 0.1% 0.2% 0.1% 0.3%
Average class size — P-2 21.0 20.9 20.8 20.8 20.7 20.6 20.5 20.5 20.5 20.7
Average class size — 3-6 24.3 24.3 24.0 23.7 23.4 23.4 23.3 23.2 23.2
23.2
Secondary English classes
Average class size — all classes 22.0 21.9 21.9 21.5 21.6 21.6 21.6 21.5 21.4 21.4
Average class size — Year 12 20.2 20.2 19.9 19.5 19.7 19.7 19.4 19.6 19.2 19.0
TABLE 28: GOVERNMENT SCHOOLS: PRIMARY CLASS SIZES FEBRUARY 2012
Size Groupings (%) Prep Year 1 Year 2 Year 3 Year 4 Year 5 Year 6 All Primary
10 and Under 2.8 2.0 2.2 2.0 1.9 1.8 1.9 1.2
11–15 7.3 4.2 4.2 4.1 3.8 3.9 4.0 3.2
16-20 51.0 30.6 26.4 13.8 13.1 13.5 12.8 24.4
21–25 37.4 59.8 62.1 58.1 56.1 53.2 53.0 55.6
26-30 1.5 3.3 4.9 21.6 24.9 26.8 27.3 15.3
31-35 0.0 0.1 0.1 0.4 0.3 0.8 1.1 0.3
Over 35 - - - - - - - -
Total 100.0 100.0 100.0 100.0 100.0 100.0 100.0 100.0
Number of Classes1
2,922
3,503
3,281
3,122
3,109
3,102
2,946
14,295
Average Class Size1
19.4 20.9 21.1 22.7 22.9 23.1 23.2 22.1
TABLE 29: GOVERNMENT SCHOOLS: SECONDARY ENGLISH CLASS SIZES,
FEBRUARY 2012
Size Groupings (%) Year 7 Year 8 Year 9 Year 10 Year 11 Year 12 All Secondary
10 and Under 1.5 2.5 2.8 3.1 4.8 6.2 3.3
11–15 9.9 10.3 10.4 11.0 16.4 16.7 8.0
16–20 18.0 18.5 16.5 20.8 27.4 32.7 20.5
21–25 58.7 55.7 59.2 54.2 42.1 38.8 56.6
26-30 11.8 12.9 11.2 11.0 9.2 5.4 11.6
31-35 - 0.1 - - 0.1 0.2 0.1
Over 35 - - - - - - -
Total 100.0 100.0 100.0 100.0 100.0 100.0 100.0
Number of Classes 1
1,834
1,895
1,953
2,033
2,049
1,793
10,027
Average Class Size 1 21.6 21.5 21.4 21.0 19.7 19.0 21.4
1 Classes with students from more than one year level have been included in the calculations for each year level, but
only once in the calculations for All Primary and All Secondary respectively. For example, a class of 25 students containing both year 3 and year 4 students has been included as a class of 25 in the calculations for both year 3 and year 4, but only once in the calculations for All Primary.
Summary Statistics Victorian Schools, February 2012 28
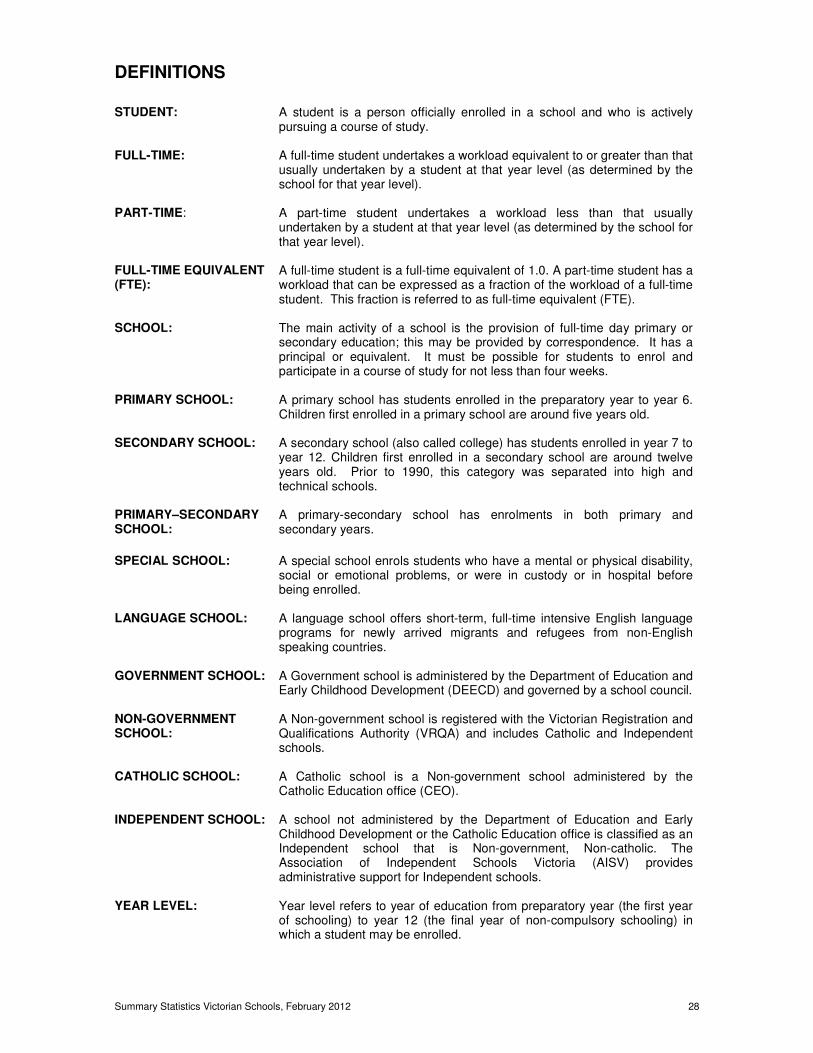
DEFINITIONS
STUDENT: A student is a person officially enrolled in a school and who is actively
pursuing a course of study. FULL-TIME: A full-time student undertakes a workload equivalent to or greater than that
usually undertaken by a student at that year level (as determined by the school for that year level).
PART-TIME: A part-time student undertakes a workload less than that usually
undertaken by a student at that year level (as determined by the school for that year level).
FULL-TIME EQUIVALENT (FTE):
A full-time student is a full-time equivalent of 1.0. A part-time student has a workload that can be expressed as a fraction of the workload of a full-time student. This fraction is referred to as full-time equivalent (FTE).
SCHOOL: The main activity of a school is the provision of full-time day primary or
secondary education; this may be provided by correspondence. It has a principal or equivalent. It must be possible for students to enrol and participate in a course of study for not less than four weeks.
PRIMARY SCHOOL: A primary school has students enrolled in the preparatory year to year 6.
Children first enrolled in a primary school are around five years old. SECONDARY SCHOOL: A secondary school (also called college) has students enrolled in year 7 to
year 12. Children first enrolled in a secondary school are around twelve years old. Prior to 1990, this category was separated into high and technical schools.
PRIMARY–SECONDARY SCHOOL:
A primary-secondary school has enrolments in both primary and secondary years.
SPECIAL SCHOOL: A special school enrols students who have a mental or physical disability,
social or emotional problems, or were in custody or in hospital before being enrolled.
LANGUAGE SCHOOL: A language school offers short-term, full-time intensive English language
programs for newly arrived migrants and refugees from non-English speaking countries.
GOVERNMENT SCHOOL: A Government school is administered by the Department of Education and
Early Childhood Development (DEECD) and governed by a school council. NON-GOVERNMENT SCHOOL:
A Non-government school is registered with the Victorian Registration and Qualifications Authority (VRQA) and includes Catholic and Independent schools.
CATHOLIC SCHOOL: A Catholic school is a Non-government school administered by the
Catholic Education office (CEO). INDEPENDENT SCHOOL: A school not administered by the Department of Education and Early
Childhood Development or the Catholic Education office is classified as an Independent school that is Non-government, Non-catholic. The Association of Independent Schools Victoria (AISV) provides administrative support for Independent schools.
YEAR LEVEL: Year level refers to year of education from preparatory year (the first year
of schooling) to year 12 (the final year of non-compulsory schooling) in which a student may be enrolled.
Summary Statistics Victorian Schools, February 2012 29
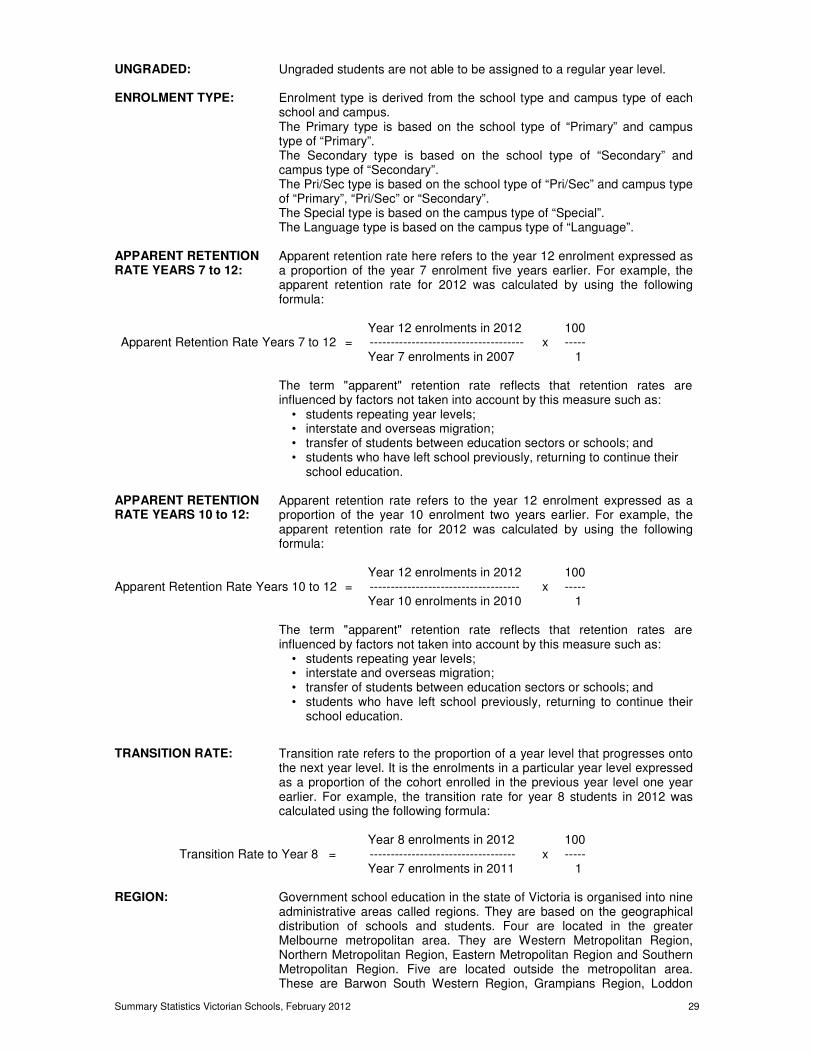
UNGRADED: Ungraded students are not able to be assigned to a regular year level. ENROLMENT TYPE: Enrolment type is derived from the school type and campus type of each
school and campus. The Primary type is based on the school type of “Primary” and campus type of “Primary”. The Secondary type is based on the school type of “Secondary” and campus type of “Secondary”. The Pri/Sec type is based on the school type of “Pri/Sec” and campus type of “Primary”, “Pri/Sec” or “Secondary”. The Special type is based on the campus type of “Special”. The Language type is based on the campus type of “Language”.
APPARENT RETENTION RATE YEARS 7 to 12:
Apparent retention rate here refers to the year 12 enrolment expressed as a proportion of the year 7 enrolment five years earlier. For example, the apparent retention rate for 2012 was calculated by using the following formula:
Year 12 enrolments in 2012 100 Apparent Retention Rate Years 7 to 12 = ------------------------------------- x ----- Year 7 enrolments in 2007 1 The term "apparent" retention rate reflects that retention rates are
influenced by factors not taken into account by this measure such as: • students repeating year levels; • interstate and overseas migration; • transfer of students between education sectors or schools; and • students who have left school previously, returning to continue their
school education. APPARENT RETENTION RATE YEARS 10 to 12:
Apparent retention rate refers to the year 12 enrolment expressed as a proportion of the year 10 enrolment two years earlier. For example, the apparent retention rate for 2012 was calculated by using the following formula:
Year 12 enrolments in 2012 100 Apparent Retention Rate Years 10 to 12 = ------------------------------------ x ----- Year 10 enrolments in 2010 1 The term "apparent" retention rate reflects that retention rates are
influenced by factors not taken into account by this measure such as: • students repeating year levels; • interstate and overseas migration; • transfer of students between education sectors or schools; and • students who have left school previously, returning to continue their
school education.
TRANSITION RATE: Transition rate refers to the proportion of a year level that progresses onto the next year level. It is the enrolments in a particular year level expressed as a proportion of the cohort enrolled in the previous year level one year earlier. For example, the transition rate for year 8 students in 2012 was calculated using the following formula:
Year 8 enrolments in 2012 100 Transition Rate to Year 8 = ----------------------------------- x ----- Year 7 enrolments in 2011 1 REGION: Government school education in the state of Victoria is organised into nine
administrative areas called regions. They are based on the geographical distribution of schools and students. Four are located in the greater Melbourne metropolitan area. They are Western Metropolitan Region, Northern Metropolitan Region, Eastern Metropolitan Region and Southern Metropolitan Region. Five are located outside the metropolitan area. These are Barwon South Western Region, Grampians Region, Loddon
Summary Statistics Victorian Schools, February 2012 30
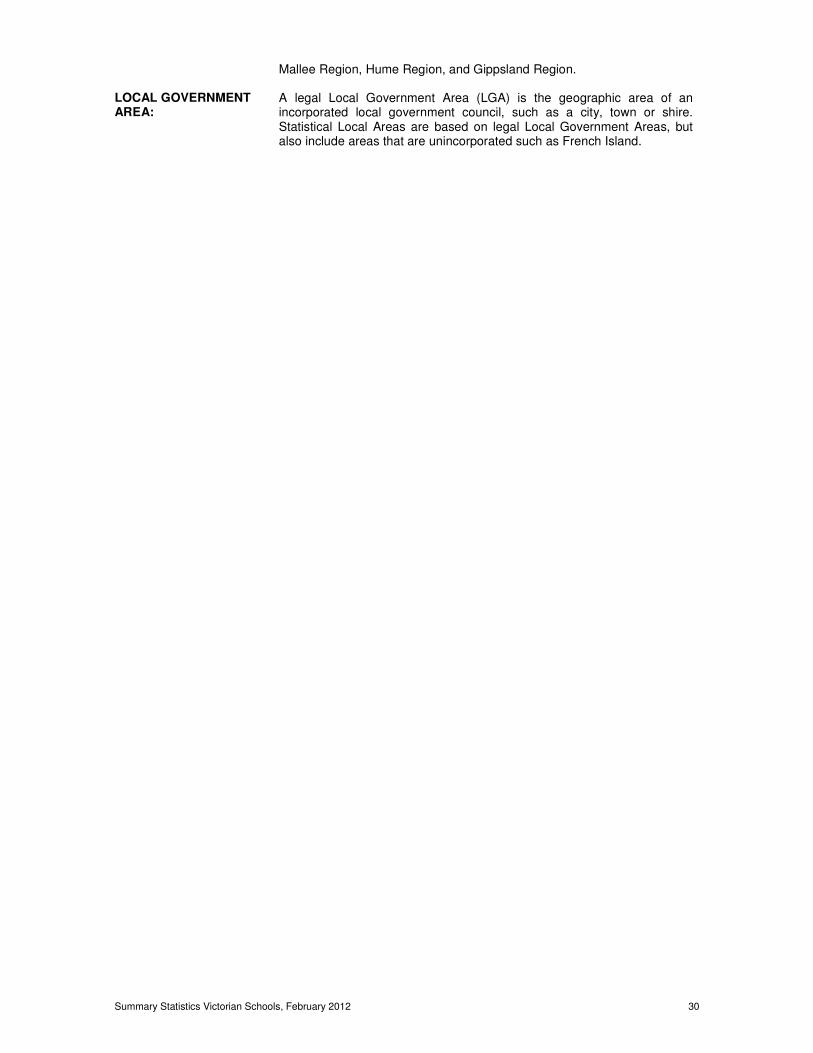
Mallee Region, Hume Region, and Gippsland Region. LOCAL GOVERNMENT AREA:
A legal Local Government Area (LGA) is the geographic area of an incorporated local government council, such as a city, town or shire. Statistical Local Areas are based on legal Local Government Areas, but also include areas that are unincorporated such as French Island.
Summary Statistics Victorian Schools, February 2012 31
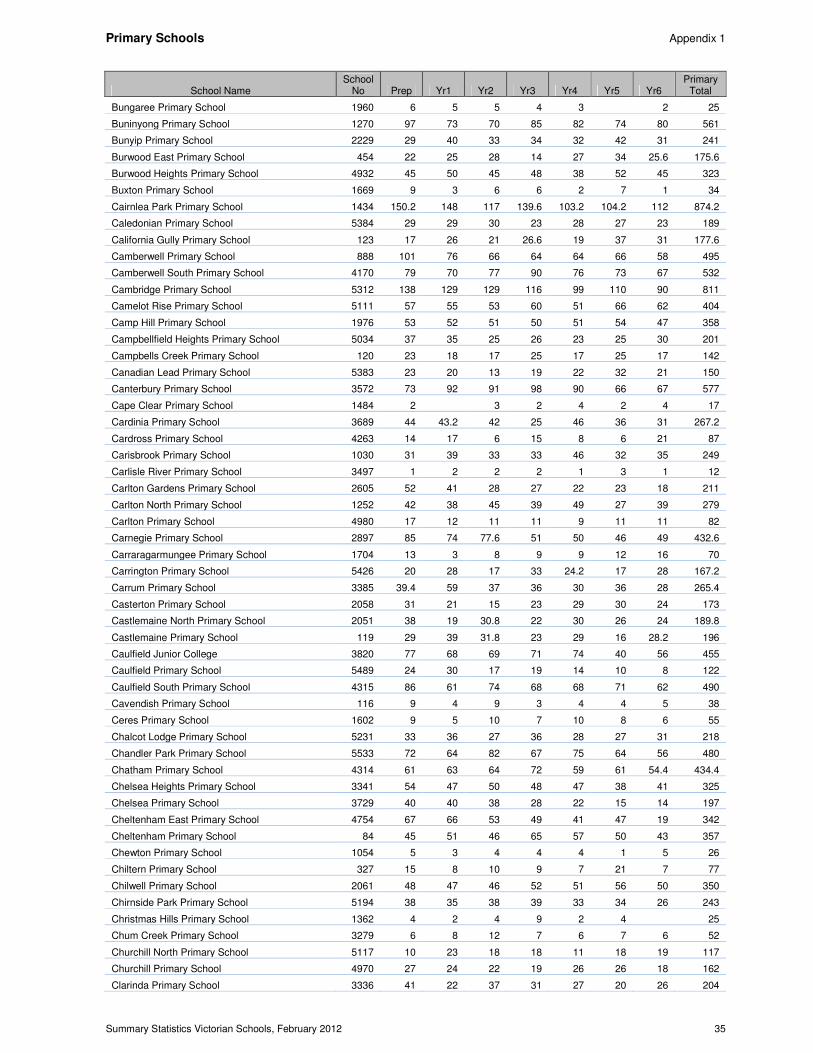
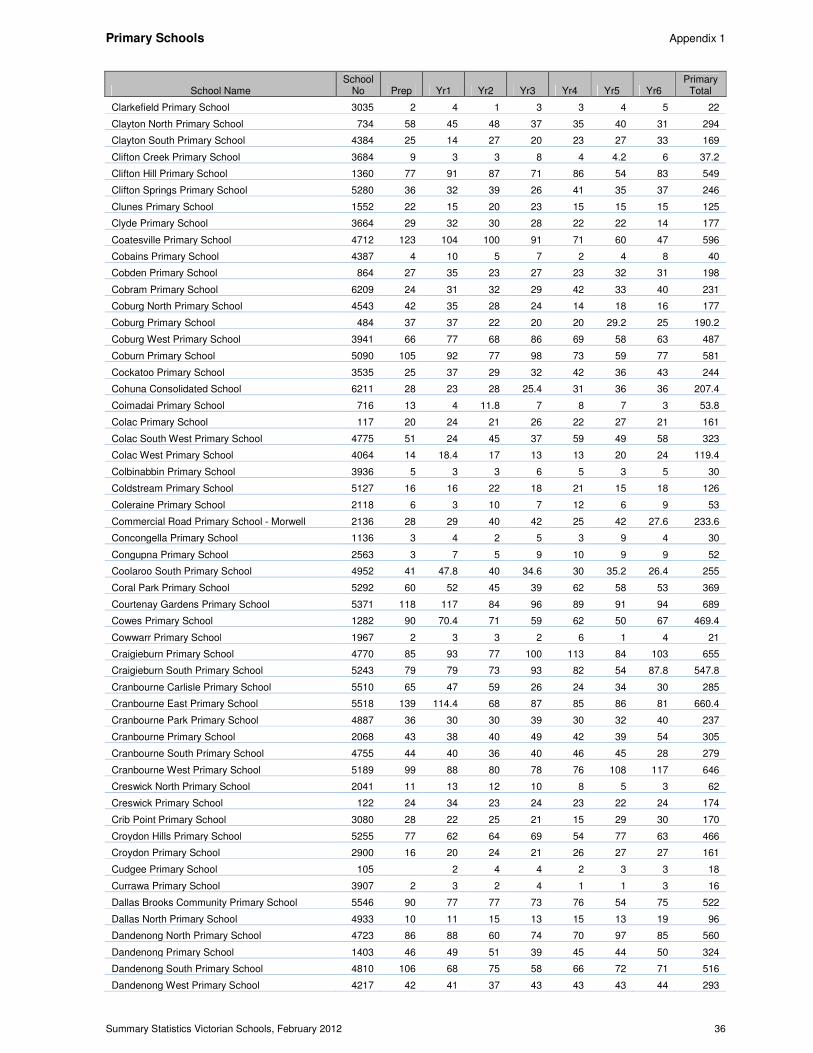
APPENDIX 1
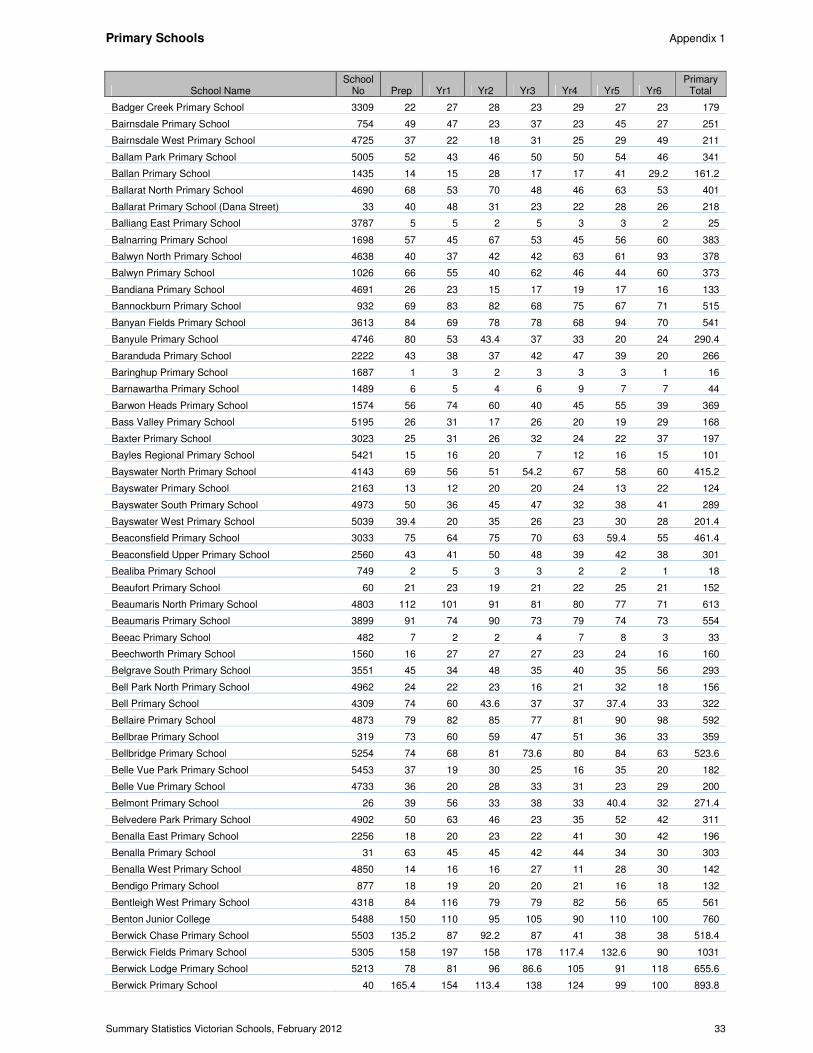
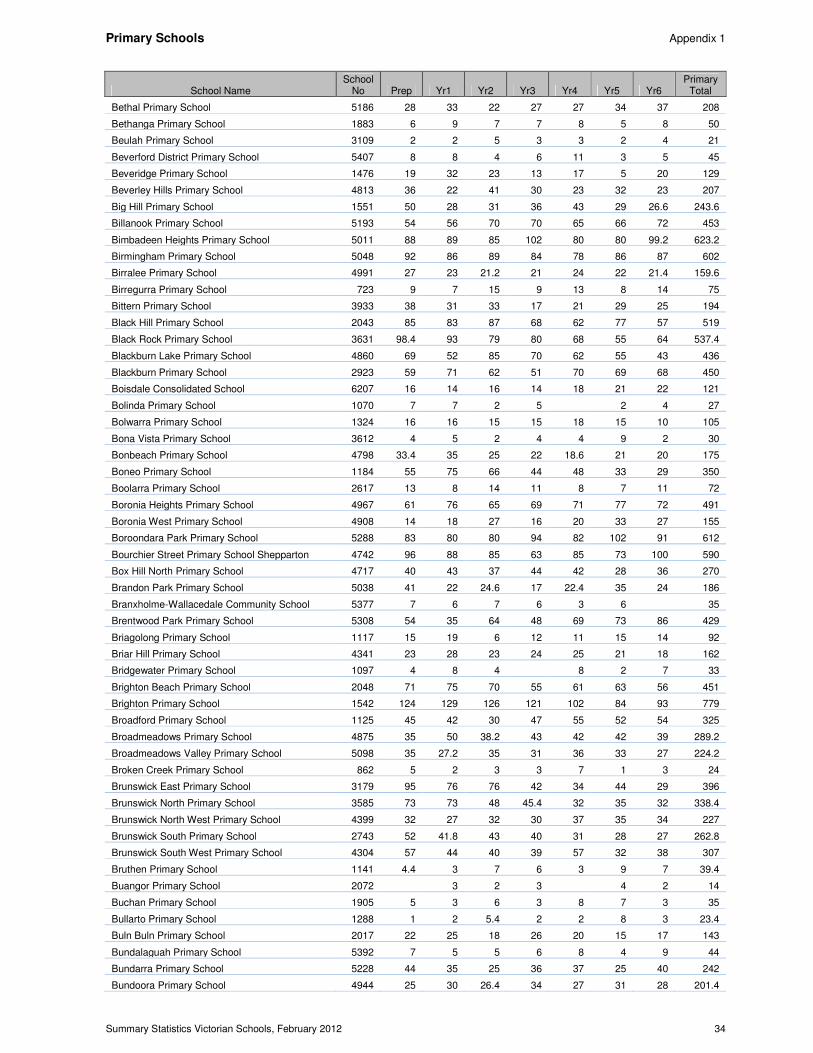
Alphabetical Listing of Government School Enrolments by School Type and Year Level, February 2012
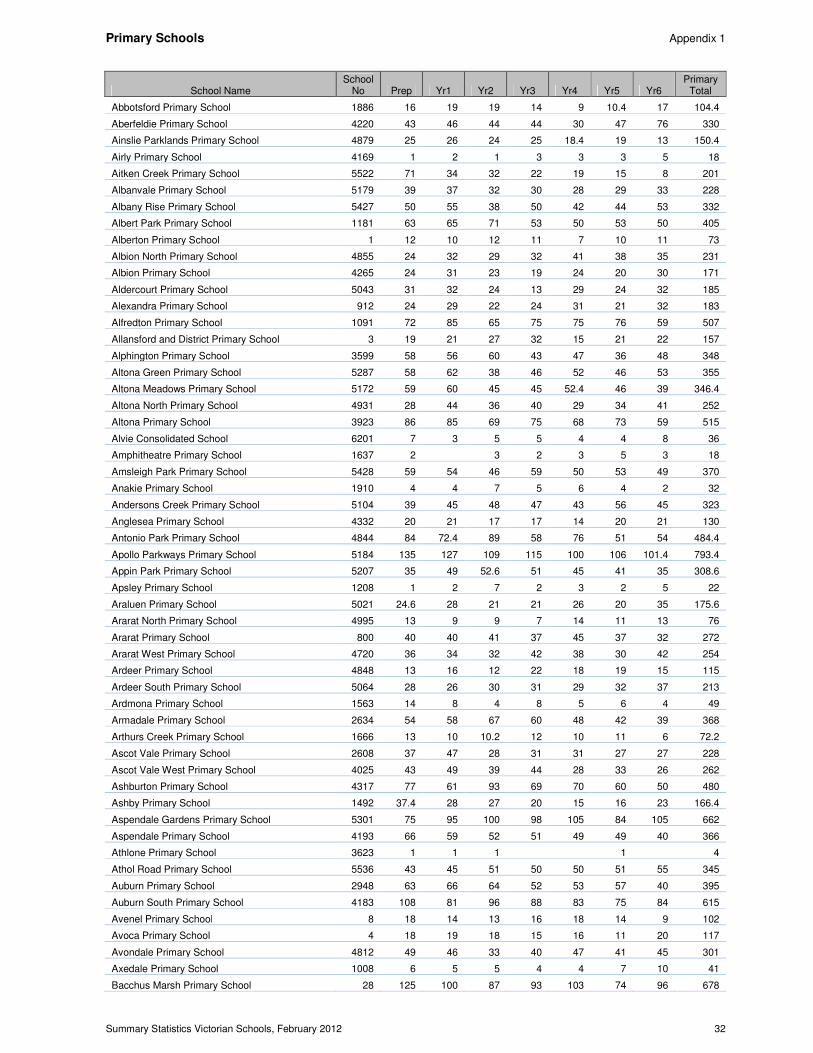
Primary Schools Appendix 1
Summary Statistics Victorian Schools, February 2012 32
School Name School
No Prep Yr1 Yr2 Yr3 Yr4 Yr5 Yr6 Primary
Total
Abbotsford Primary School 1886 16 19 19 14 9 10.4 17 104.4
Aberfeldie Primary School 4220 43 46 44 44 30 47 76 330
Ainslie Parklands Primary School 4879 25 26 24 25 18.4 19 13 150.4
Airly Primary School 4169 1 2 1 3 3 3 5 18
Aitken Creek Primary School 5522 71 34 32 22 19 15 8 201
Albanvale Primary School 5179 39 37 32 30 28 29 33 228
Albany Rise Primary School 5427 50 55 38 50 42 44 53 332
Albert Park Primary School 1181 63 65 71 53 50 53 50 405
Alberton Primary School 1 12 10 12 11 7 10 11 73
Albion North Primary School 4855 24 32 29 32 41 38 35 231
Albion Primary School 4265 24 31 23 19 24 20 30 171
Aldercourt Primary School 5043 31 32 24 13 29 24 32 185
Alexandra Primary School 912 24 29 22 24 31 21 32 183
Alfredton Primary School 1091 72 85 65 75 75 76 59 507
Allansford and District Primary School 3 19 21 27 32 15 21 22 157
Alphington Primary School 3599 58 56 60 43 47 36 48 348
Altona Green Primary School 5287 58 62 38 46 52 46 53 355
Altona Meadows Primary School 5172 59 60 45 45 52.4 46 39 346.4
Altona North Primary School 4931 28 44 36 40 29 34 41 252
Altona Primary School 3923 86 85 69 75 68 73 59 515
Alvie Consolidated School 6201 7 3 5 5 4 4 8 36
Amphitheatre Primary School 1637 2 3 2 3 5 3 18
Amsleigh Park Primary School 5428 59 54 46 59 50 53 49 370
Anakie Primary School 1910 4 4 7 5 6 4 2 32
Andersons Creek Primary School 5104 39 45 48 47 43 56 45 323
Anglesea Primary School 4332 20 21 17 17 14 20 21 130
Antonio Park Primary School 4844 84 72.4 89 58 76 51 54 484.4
Apollo Parkways Primary School 5184 135 127 109 115 100 106 101.4 793.4
Appin Park Primary School 5207 35 49 52.6 51 45 41 35 308.6
Apsley Primary School 1208 1 2 7 2 3 2 5 22
Araluen Primary School 5021 24.6 28 21 21 26 20 35 175.6
Ararat North Primary School 4995 13 9 9 7 14 11 13 76
Ararat Primary School 800 40 40 41 37 45 37 32 272
Ararat West Primary School 4720 36 34 32 42 38 30 42 254
Ardeer Primary School 4848 13 16 12 22 18 19 15 115
Ardeer South Primary School 5064 28 26 30 31 29 32 37 213
Ardmona Primary School 1563 14 8 4 8 5 6 4 49
Armadale Primary School 2634 54 58 67 60 48 42 39 368
Arthurs Creek Primary School 1666 13 10 10.2 12 10 11 6 72.2
Ascot Vale Primary School 2608 37 47 28 31 31 27 27 228
Ascot Vale West Primary School 4025 43 49 39 44 28 33 26 262
Ashburton Primary School 4317 77 61 93 69 70 60 50 480
Ashby Primary School 1492 37.4 28 27 20 15 16 23 166.4
Aspendale Gardens Primary School 5301 75 95 100 98 105 84 105 662
Aspendale Primary School 4193 66 59 52 51 49 49 40 366
Athlone Primary School 3623 1 1 1 1 4
Athol Road Primary School 5536 43 45 51 50 50 51 55 345
Auburn Primary School 2948 63 66 64 52 53 57 40 395
Auburn South Primary School 4183 108 81 96 88 83 75 84 615
Avenel Primary School 8 18 14 13 16 18 14 9 102
Avoca Primary School 4 18 19 18 15 16 11 20 117
Avondale Primary School 4812 49 46 33 40 47 41 45 301
Axedale Primary School 1008 6 5 5 4 4 7 10 41
Bacchus Marsh Primary School 28 125 100 87 93 103 74 96 678
Primary Schools Appendix 1
Summary Statistics Victorian Schools, February 2012 33
School Name School
No Prep Yr1 Yr2 Yr3 Yr4 Yr5 Yr6 Primary
Total
Badger Creek Primary School 3309 22 27 28 23 29 27 23 179
Bairnsdale Primary School 754 49 47 23 37 23 45 27 251
Bairnsdale West Primary School 4725 37 22 18 31 25 29 49 211
Ballam Park Primary School 5005 52 43 46 50 50 54 46 341
Ballan Primary School 1435 14 15 28 17 17 41 29.2 161.2
Ballarat North Primary School 4690 68 53 70 48 46 63 53 401
Ballarat Primary School (Dana Street) 33 40 48 31 23 22 28 26 218
Balliang East Primary School 3787 5 5 2 5 3 3 2 25
Balnarring Primary School 1698 57 45 67 53 45 56 60 383
Balwyn North Primary School 4638 40 37 42 42 63 61 93 378
Balwyn Primary School 1026 66 55 40 62 46 44 60 373
Bandiana Primary School 4691 26 23 15 17 19 17 16 133
Bannockburn Primary School 932 69 83 82 68 75 67 71 515
Banyan Fields Primary School 3613 84 69 78 78 68 94 70 541
Banyule Primary School 4746 80 53 43.4 37 33 20 24 290.4
Baranduda Primary School 2222 43 38 37 42 47 39 20 266
Baringhup Primary School 1687 1 3 2 3 3 3 1 16
Barnawartha Primary School 1489 6 5 4 6 9 7 7 44
Barwon Heads Primary School 1574 56 74 60 40 45 55 39 369
Bass Valley Primary School 5195 26 31 17 26 20 19 29 168
Baxter Primary School 3023 25 31 26 32 24 22 37 197
Bayles Regional Primary School 5421 15 16 20 7 12 16 15 101
Bayswater North Primary School 4143 69 56 51 54.2 67 58 60 415.2
Bayswater Primary School 2163 13 12 20 20 24 13 22 124
Bayswater South Primary School 4973 50 36 45 47 32 38 41 289
Bayswater West Primary School 5039 39.4 20 35 26 23 30 28 201.4
Beaconsfield Primary School 3033 75 64 75 70 63 59.4 55 461.4
Beaconsfield Upper Primary School 2560 43 41 50 48 39 42 38 301
Bealiba Primary School 749 2 5 3 3 2 2 1 18
Beaufort Primary School 60 21 23 19 21 22 25 21 152
Beaumaris North Primary School 4803 112 101 91 81 80 77 71 613
Beaumaris Primary School 3899 91 74 90 73 79 74 73 554
Beeac Primary School 482 7 2 2 4 7 8 3 33
Beechworth Primary School 1560 16 27 27 27 23 24 16 160
Belgrave South Primary School 3551 45 34 48 35 40 35 56 293
Bell Park North Primary School 4962 24 22 23 16 21 32 18 156
Bell Primary School 4309 74 60 43.6 37 37 37.4 33 322
Bellaire Primary School 4873 79 82 85 77 81 90 98 592
Bellbrae Primary School 319 73 60 59 47 51 36 33 359
Bellbridge Primary School 5254 74 68 81 73.6 80 84 63 523.6
Belle Vue Park Primary School 5453 37 19 30 25 16 35 20 182
Belle Vue Primary School 4733 36 20 28 33 31 23 29 200
Belmont Primary School 26 39 56 33 38 33 40.4 32 271.4
Belvedere Park Primary School 4902 50 63 46 23 35 52 42 311
Benalla East Primary School 2256 18 20 23 22 41 30 42 196
Benalla Primary School 31 63 45 45 42 44 34 30 303
Benalla West Primary School 4850 14 16 16 27 11 28 30 142
Bendigo Primary School 877 18 19 20 20 21 16 18 132
Bentleigh West Primary School 4318 84 116 79 79 82 56 65 561
Benton Junior College 5488 150 110 95 105 90 110 100 760
Berwick Chase Primary School 5503 135.2 87 92.2 87 41 38 38 518.4
Berwick Fields Primary School 5305 158 197 158 178 117.4 132.6 90 1031
Berwick Lodge Primary School 5213 78 81 96 86.6 105 91 118 655.6
Berwick Primary School 40 165.4 154 113.4 138 124 99 100 893.8
Primary Schools Appendix 1
Summary Statistics Victorian Schools, February 2012 34
School Name School
No Prep Yr1 Yr2 Yr3 Yr4 Yr5 Yr6 Primary
Total
Bethal Primary School 5186 28 33 22 27 27 34 37 208
Bethanga Primary School 1883 6 9 7 7 8 5 8 50
Beulah Primary School 3109 2 2 5 3 3 2 4 21
Beverford District Primary School 5407 8 8 4 6 11 3 5 45
Beveridge Primary School 1476 19 32 23 13 17 5 20 129
Beverley Hills Primary School 4813 36 22 41 30 23 32 23 207
Big Hill Primary School 1551 50 28 31 36 43 29 26.6 243.6
Billanook Primary School 5193 54 56 70 70 65 66 72 453
Bimbadeen Heights Primary School 5011 88 89 85 102 80 80 99.2 623.2
Birmingham Primary School 5048 92 86 89 84 78 86 87 602
Birralee Primary School 4991 27 23 21.2 21 24 22 21.4 159.6
Birregurra Primary School 723 9 7 15 9 13 8 14 75
Bittern Primary School 3933 38 31 33 17 21 29 25 194
Black Hill Primary School 2043 85 83 87 68 62 77 57 519
Black Rock Primary School 3631 98.4 93 79 80 68 55 64 537.4
Blackburn Lake Primary School 4860 69 52 85 70 62 55 43 436
Blackburn Primary School 2923 59 71 62 51 70 69 68 450
Boisdale Consolidated School 6207 16 14 16 14 18 21 22 121
Bolinda Primary School 1070 7 7 2 5 2 4 27
Bolwarra Primary School 1324 16 16 15 15 18 15 10 105
Bona Vista Primary School 3612 4 5 2 4 4 9 2 30
Bonbeach Primary School 4798 33.4 35 25 22 18.6 21 20 175
Boneo Primary School 1184 55 75 66 44 48 33 29 350
Boolarra Primary School 2617 13 8 14 11 8 7 11 72
Boronia Heights Primary School 4967 61 76 65 69 71 77 72 491
Boronia West Primary School 4908 14 18 27 16 20 33 27 155
Boroondara Park Primary School 5288 83 80 80 94 82 102 91 612
Bourchier Street Primary School Shepparton 4742 96 88 85 63 85 73 100 590
Box Hill North Primary School 4717 40 43 37 44 42 28 36 270
Brandon Park Primary School 5038 41 22 24.6 17 22.4 35 24 186
Branxholme-Wallacedale Community School 5377 7 6 7 6 3 6 35
Brentwood Park Primary School 5308 54 35 64 48 69 73 86 429
Briagolong Primary School 1117 15 19 6 12 11 15 14 92
Briar Hill Primary School 4341 23 28 23 24 25 21 18 162
Bridgewater Primary School 1097 4 8 4 8 2 7 33
Brighton Beach Primary School 2048 71 75 70 55 61 63 56 451
Brighton Primary School 1542 124 129 126 121 102 84 93 779
Broadford Primary School 1125 45 42 30 47 55 52 54 325
Broadmeadows Primary School 4875 35 50 38.2 43 42 42 39 289.2
Broadmeadows Valley Primary School 5098 35 27.2 35 31 36 33 27 224.2
Broken Creek Primary School 862 5 2 3 3 7 1 3 24
Brunswick East Primary School 3179 95 76 76 42 34 44 29 396
Brunswick North Primary School 3585 73 73 48 45.4 32 35 32 338.4
Brunswick North West Primary School 4399 32 27 32 30 37 35 34 227
Brunswick South Primary School 2743 52 41.8 43 40 31 28 27 262.8
Brunswick South West Primary School 4304 57 44 40 39 57 32 38 307
Bruthen Primary School 1141 4.4 3 7 6 3 9 7 39.4
Buangor Primary School 2072 3 2 3 4 2 14
Buchan Primary School 1905 5 3 6 3 8 7 3 35
Bullarto Primary School 1288 1 2 5.4 2 2 8 3 23.4
Buln Buln Primary School 2017 22 25 18 26 20 15 17 143
Bundalaguah Primary School 5392 7 5 5 6 8 4 9 44
Bundarra Primary School 5228 44 35 25 36 37 25 40 242
Bundoora Primary School 4944 25 30 26.4 34 27 31 28 201.4
Primary Schools Appendix 1
Summary Statistics Victorian Schools, February 2012 35
School Name School
No Prep Yr1 Yr2 Yr3 Yr4 Yr5 Yr6 Primary
Total
Bungaree Primary School 1960 6 5 5 4 3 2 25
Buninyong Primary School 1270 97 73 70 85 82 74 80 561
Bunyip Primary School 2229 29 40 33 34 32 42 31 241
Burwood East Primary School 454 22 25 28 14 27 34 25.6 175.6
Burwood Heights Primary School 4932 45 50 45 48 38 52 45 323
Buxton Primary School 1669 9 3 6 6 2 7 1 34
Cairnlea Park Primary School 1434 150.2 148 117 139.6 103.2 104.2 112 874.2
Caledonian Primary School 5384 29 29 30 23 28 27 23 189
California Gully Primary School 123 17 26 21 26.6 19 37 31 177.6
Camberwell Primary School 888 101 76 66 64 64 66 58 495
Camberwell South Primary School 4170 79 70 77 90 76 73 67 532
Cambridge Primary School 5312 138 129 129 116 99 110 90 811
Camelot Rise Primary School 5111 57 55 53 60 51 66 62 404
Camp Hill Primary School 1976 53 52 51 50 51 54 47 358
Campbellfield Heights Primary School 5034 37 35 25 26 23 25 30 201
Campbells Creek Primary School 120 23 18 17 25 17 25 17 142
Canadian Lead Primary School 5383 23 20 13 19 22 32 21 150
Canterbury Primary School 3572 73 92 91 98 90 66 67 577
Cape Clear Primary School 1484 2 3 2 4 2 4 17
Cardinia Primary School 3689 44 43.2 42 25 46 36 31 267.2
Cardross Primary School 4263 14 17 6 15 8 6 21 87
Carisbrook Primary School 1030 31 39 33 33 46 32 35 249
Carlisle River Primary School 3497 1 2 2 2 1 3 1 12
Carlton Gardens Primary School 2605 52 41 28 27 22 23 18 211
Carlton North Primary School 1252 42 38 45 39 49 27 39 279
Carlton Primary School 4980 17 12 11 11 9 11 11 82
Carnegie Primary School 2897 85 74 77.6 51 50 46 49 432.6
Carraragarmungee Primary School 1704 13 3 8 9 9 12 16 70
Carrington Primary School 5426 20 28 17 33 24.2 17 28 167.2
Carrum Primary School 3385 39.4 59 37 36 30 36 28 265.4
Casterton Primary School 2058 31 21 15 23 29 30 24 173
Castlemaine North Primary School 2051 38 19 30.8 22 30 26 24 189.8
Castlemaine Primary School 119 29 39 31.8 23 29 16 28.2 196
Caulfield Junior College 3820 77 68 69 71 74 40 56 455
Caulfield Primary School 5489 24 30 17 19 14 10 8 122
Caulfield South Primary School 4315 86 61 74 68 68 71 62 490
Cavendish Primary School 116 9 4 9 3 4 4 5 38
Ceres Primary School 1602 9 5 10 7 10 8 6 55
Chalcot Lodge Primary School 5231 33 36 27 36 28 27 31 218
Chandler Park Primary School 5533 72 64 82 67 75 64 56 480
Chatham Primary School 4314 61 63 64 72 59 61 54.4 434.4
Chelsea Heights Primary School 3341 54 47 50 48 47 38 41 325
Chelsea Primary School 3729 40 40 38 28 22 15 14 197
Cheltenham East Primary School 4754 67 66 53 49 41 47 19 342
Cheltenham Primary School 84 45 51 46 65 57 50 43 357
Chewton Primary School 1054 5 3 4 4 4 1 5 26
Chiltern Primary School 327 15 8 10 9 7 21 7 77
Chilwell Primary School 2061 48 47 46 52 51 56 50 350
Chirnside Park Primary School 5194 38 35 38 39 33 34 26 243
Christmas Hills Primary School 1362 4 2 4 9 2 4 25
Chum Creek Primary School 3279 6 8 12 7 6 7 6 52
Churchill North Primary School 5117 10 23 18 18 11 18 19 117
Churchill Primary School 4970 27 24 22 19 26 26 18 162
Clarinda Primary School 3336 41 22 37 31 27 20 26 204
Primary Schools Appendix 1
Summary Statistics Victorian Schools, February 2012 36
School Name School
No Prep Yr1 Yr2 Yr3 Yr4 Yr5 Yr6 Primary
Total
Clarkefield Primary School 3035 2 4 1 3 3 4 5 22
Clayton North Primary School 734 58 45 48 37 35 40 31 294
Clayton South Primary School 4384 25 14 27 20 23 27 33 169
Clifton Creek Primary School 3684 9 3 3 8 4 4.2 6 37.2
Clifton Hill Primary School 1360 77 91 87 71 86 54 83 549
Clifton Springs Primary School 5280 36 32 39 26 41 35 37 246
Clunes Primary School 1552 22 15 20 23 15 15 15 125
Clyde Primary School 3664 29 32 30 28 22 22 14 177
Coatesville Primary School 4712 123 104 100 91 71 60 47 596
Cobains Primary School 4387 4 10 5 7 2 4 8 40
Cobden Primary School 864 27 35 23 27 23 32 31 198
Cobram Primary School 6209 24 31 32 29 42 33 40 231
Coburg North Primary School 4543 42 35 28 24 14 18 16 177
Coburg Primary School 484 37 37 22 20 20 29.2 25 190.2
Coburg West Primary School 3941 66 77 68 86 69 58 63 487
Coburn Primary School 5090 105 92 77 98 73 59 77 581
Cockatoo Primary School 3535 25 37 29 32 42 36 43 244
Cohuna Consolidated School 6211 28 23 28 25.4 31 36 36 207.4
Coimadai Primary School 716 13 4 11.8 7 8 7 3 53.8
Colac Primary School 117 20 24 21 26 22 27 21 161
Colac South West Primary School 4775 51 24 45 37 59 49 58 323
Colac West Primary School 4064 14 18.4 17 13 13 20 24 119.4
Colbinabbin Primary School 3936 5 3 3 6 5 3 5 30
Coldstream Primary School 5127 16 16 22 18 21 15 18 126
Coleraine Primary School 2118 6 3 10 7 12 6 9 53
Commercial Road Primary School - Morwell 2136 28 29 40 42 25 42 27.6 233.6
Concongella Primary School 1136 3 4 2 5 3 9 4 30
Congupna Primary School 2563 3 7 5 9 10 9 9 52
Coolaroo South Primary School 4952 41 47.8 40 34.6 30 35.2 26.4 255
Coral Park Primary School 5292 60 52 45 39 62 58 53 369
Courtenay Gardens Primary School 5371 118 117 84 96 89 91 94 689
Cowes Primary School 1282 90 70.4 71 59 62 50 67 469.4
Cowwarr Primary School 1967 2 3 3 2 6 1 4 21
Craigieburn Primary School 4770 85 93 77 100 113 84 103 655
Craigieburn South Primary School 5243 79 79 73 93 82 54 87.8 547.8
Cranbourne Carlisle Primary School 5510 65 47 59 26 24 34 30 285
Cranbourne East Primary School 5518 139 114.4 68 87 85 86 81 660.4
Cranbourne Park Primary School 4887 36 30 30 39 30 32 40 237
Cranbourne Primary School 2068 43 38 40 49 42 39 54 305
Cranbourne South Primary School 4755 44 40 36 40 46 45 28 279
Cranbourne West Primary School 5189 99 88 80 78 76 108 117 646
Creswick North Primary School 2041 11 13 12 10 8 5 3 62
Creswick Primary School 122 24 34 23 24 23 22 24 174
Crib Point Primary School 3080 28 22 25 21 15 29 30 170
Croydon Hills Primary School 5255 77 62 64 69 54 77 63 466
Croydon Primary School 2900 16 20 24 21 26 27 27 161
Cudgee Primary School 105 2 4 4 2 3 3 18
Currawa Primary School 3907 2 3 2 4 1 1 3 16
Dallas Brooks Community Primary School 5546 90 77 77 73 76 54 75 522
Dallas North Primary School 4933 10 11 15 13 15 13 19 96
Dandenong North Primary School 4723 86 88 60 74 70 97 85 560
Dandenong Primary School 1403 46 49 51 39 45 44 50 324
Dandenong South Primary School 4810 106 68 75 58 66 72 71 516
Dandenong West Primary School 4217 42 41 37 43 43 43 44 293
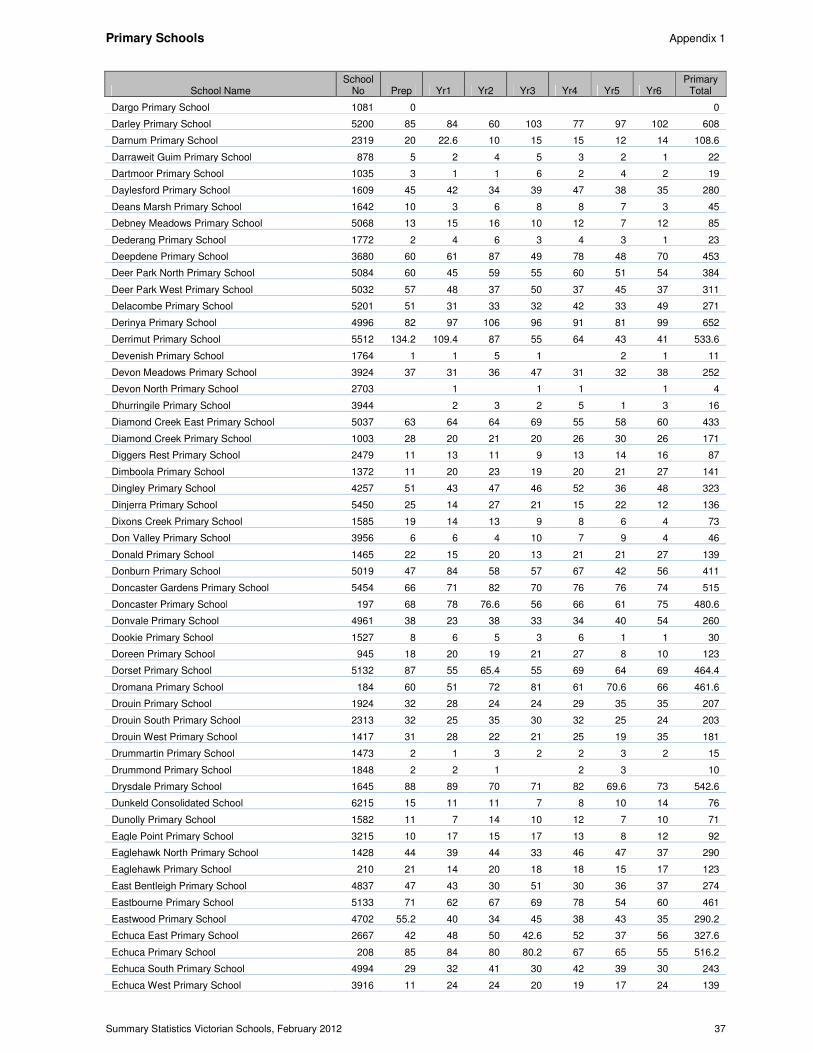
Primary Schools Appendix 1
Summary Statistics Victorian Schools, February 2012 37
School Name School
No Prep Yr1 Yr2 Yr3 Yr4 Yr5 Yr6 Primary
Total
Dargo Primary School 1081 0 0
Darley Primary School 5200 85 84 60 103 77 97 102 608
Darnum Primary School 2319 20 22.6 10 15 15 12 14 108.6
Darraweit Guim Primary School 878 5 2 4 5 3 2 1 22
Dartmoor Primary School 1035 3 1 1 6 2 4 2 19
Daylesford Primary School 1609 45 42 34 39 47 38 35 280
Deans Marsh Primary School 1642 10 3 6 8 8 7 3 45
Debney Meadows Primary School 5068 13 15 16 10 12 7 12 85
Dederang Primary School 1772 2 4 6 3 4 3 1 23
Deepdene Primary School 3680 60 61 87 49 78 48 70 453
Deer Park North Primary School 5084 60 45 59 55 60 51 54 384
Deer Park West Primary School 5032 57 48 37 50 37 45 37 311
Delacombe Primary School 5201 51 31 33 32 42 33 49 271
Derinya Primary School 4996 82 97 106 96 91 81 99 652
Derrimut Primary School 5512 134.2 109.4 87 55 64 43 41 533.6
Devenish Primary School 1764 1 1 5 1 2 1 11
Devon Meadows Primary School 3924 37 31 36 47 31 32 38 252
Devon North Primary School 2703 1 1 1 1 4
Dhurringile Primary School 3944 2 3 2 5 1 3 16
Diamond Creek East Primary School 5037 63 64 64 69 55 58 60 433
Diamond Creek Primary School 1003 28 20 21 20 26 30 26 171
Diggers Rest Primary School 2479 11 13 11 9 13 14 16 87
Dimboola Primary School 1372 11 20 23 19 20 21 27 141
Dingley Primary School 4257 51 43 47 46 52 36 48 323
Dinjerra Primary School 5450 25 14 27 21 15 22 12 136
Dixons Creek Primary School 1585 19 14 13 9 8 6 4 73
Don Valley Primary School 3956 6 6 4 10 7 9 4 46
Donald Primary School 1465 22 15 20 13 21 21 27 139
Donburn Primary School 5019 47 84 58 57 67 42 56 411
Doncaster Gardens Primary School 5454 66 71 82 70 76 76 74 515
Doncaster Primary School 197 68 78 76.6 56 66 61 75 480.6
Donvale Primary School 4961 38 23 38 33 34 40 54 260
Dookie Primary School 1527 8 6 5 3 6 1 1 30
Doreen Primary School 945 18 20 19 21 27 8 10 123
Dorset Primary School 5132 87 55 65.4 55 69 64 69 464.4
Dromana Primary School 184 60 51 72 81 61 70.6 66 461.6
Drouin Primary School 1924 32 28 24 24 29 35 35 207
Drouin South Primary School 2313 32 25 35 30 32 25 24 203
Drouin West Primary School 1417 31 28 22 21 25 19 35 181
Drummartin Primary School 1473 2 1 3 2 2 3 2 15
Drummond Primary School 1848 2 2 1 2 3 10
Drysdale Primary School 1645 88 89 70 71 82 69.6 73 542.6
Dunkeld Consolidated School 6215 15 11 11 7 8 10 14 76
Dunolly Primary School 1582 11 7 14 10 12 7 10 71
Eagle Point Primary School 3215 10 17 15 17 13 8 12 92
Eaglehawk North Primary School 1428 44 39 44 33 46 47 37 290
Eaglehawk Primary School 210 21 14 20 18 18 15 17 123
East Bentleigh Primary School 4837 47 43 30 51 30 36 37 274
Eastbourne Primary School 5133 71 62 67 69 78 54 60 461
Eastwood Primary School 4702 55.2 40 34 45 38 43 35 290.2
Echuca East Primary School 2667 42 48 50 42.6 52 37 56 327.6
Echuca Primary School 208 85 84 80 80.2 67 65 55 516.2
Echuca South Primary School 4994 29 32 41 30 42 39 30 243
Echuca West Primary School 3916 11 24 24 20 19 17 24 139
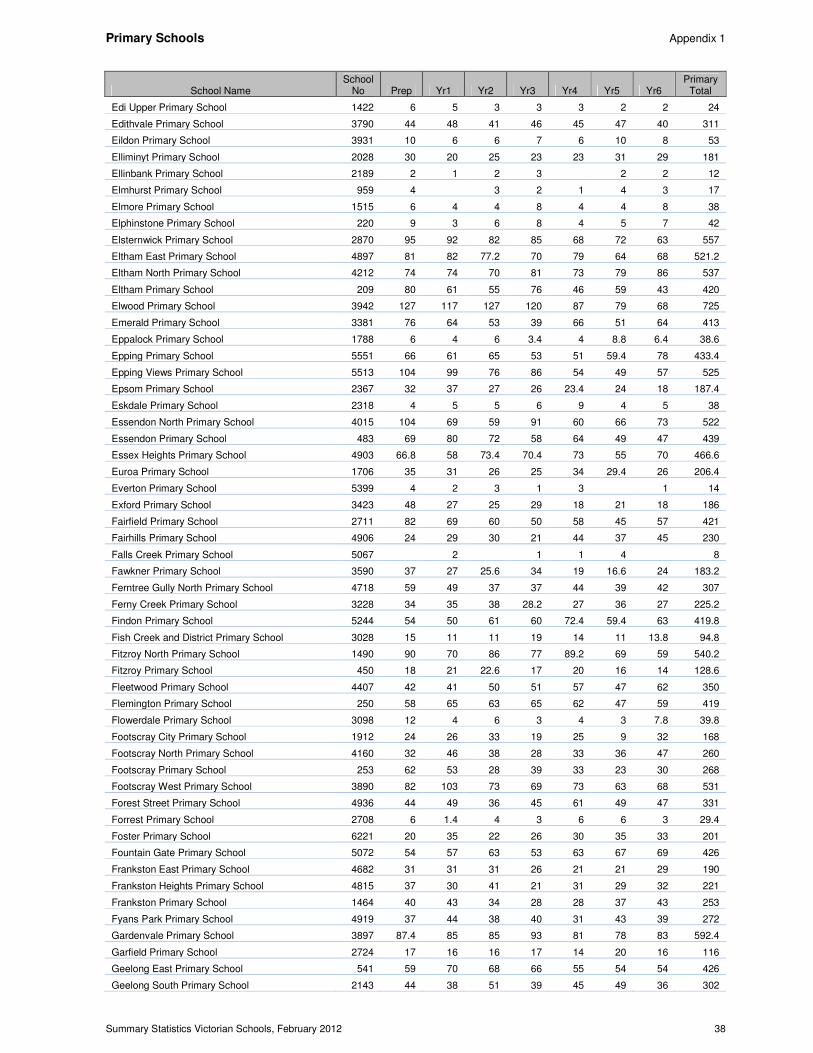
Primary Schools Appendix 1
Summary Statistics Victorian Schools, February 2012 38
School Name School
No Prep Yr1 Yr2 Yr3 Yr4 Yr5 Yr6 Primary
Total
Edi Upper Primary School 1422 6 5 3 3 3 2 2 24
Edithvale Primary School 3790 44 48 41 46 45 47 40 311
Eildon Primary School 3931 10 6 6 7 6 10 8 53
Elliminyt Primary School 2028 30 20 25 23 23 31 29 181
Ellinbank Primary School 2189 2 1 2 3 2 2 12
Elmhurst Primary School 959 4 3 2 1 4 3 17
Elmore Primary School 1515 6 4 4 8 4 4 8 38
Elphinstone Primary School 220 9 3 6 8 4 5 7 42
Elsternwick Primary School 2870 95 92 82 85 68 72 63 557
Eltham East Primary School 4897 81 82 77.2 70 79 64 68 521.2
Eltham North Primary School 4212 74 74 70 81 73 79 86 537
Eltham Primary School 209 80 61 55 76 46 59 43 420
Elwood Primary School 3942 127 117 127 120 87 79 68 725
Emerald Primary School 3381 76 64 53 39 66 51 64 413
Eppalock Primary School 1788 6 4 6 3.4 4 8.8 6.4 38.6
Epping Primary School 5551 66 61 65 53 51 59.4 78 433.4
Epping Views Primary School 5513 104 99 76 86 54 49 57 525
Epsom Primary School 2367 32 37 27 26 23.4 24 18 187.4
Eskdale Primary School 2318 4 5 5 6 9 4 5 38
Essendon North Primary School 4015 104 69 59 91 60 66 73 522
Essendon Primary School 483 69 80 72 58 64 49 47 439
Essex Heights Primary School 4903 66.8 58 73.4 70.4 73 55 70 466.6
Euroa Primary School 1706 35 31 26 25 34 29.4 26 206.4
Everton Primary School 5399 4 2 3 1 3 1 14
Exford Primary School 3423 48 27 25 29 18 21 18 186
Fairfield Primary School 2711 82 69 60 50 58 45 57 421
Fairhills Primary School 4906 24 29 30 21 44 37 45 230
Falls Creek Primary School 5067 2 1 1 4 8
Fawkner Primary School 3590 37 27 25.6 34 19 16.6 24 183.2
Ferntree Gully North Primary School 4718 59 49 37 37 44 39 42 307
Ferny Creek Primary School 3228 34 35 38 28.2 27 36 27 225.2
Findon Primary School 5244 54 50 61 60 72.4 59.4 63 419.8
Fish Creek and District Primary School 3028 15 11 11 19 14 11 13.8 94.8
Fitzroy North Primary School 1490 90 70 86 77 89.2 69 59 540.2
Fitzroy Primary School 450 18 21 22.6 17 20 16 14 128.6
Fleetwood Primary School 4407 42 41 50 51 57 47 62 350
Flemington Primary School 250 58 65 63 65 62 47 59 419
Flowerdale Primary School 3098 12 4 6 3 4 3 7.8 39.8
Footscray City Primary School 1912 24 26 33 19 25 9 32 168
Footscray North Primary School 4160 32 46 38 28 33 36 47 260
Footscray Primary School 253 62 53 28 39 33 23 30 268
Footscray West Primary School 3890 82 103 73 69 73 63 68 531
Forest Street Primary School 4936 44 49 36 45 61 49 47 331
Forrest Primary School 2708 6 1.4 4 3 6 6 3 29.4
Foster Primary School 6221 20 35 22 26 30 35 33 201
Fountain Gate Primary School 5072 54 57 63 53 63 67 69 426
Frankston East Primary School 4682 31 31 31 26 21 21 29 190
Frankston Heights Primary School 4815 37 30 41 21 31 29 32 221
Frankston Primary School 1464 40 43 34 28 28 37 43 253
Fyans Park Primary School 4919 37 44 38 40 31 43 39 272
Gardenvale Primary School 3897 87.4 85 85 93 81 78 83 592.4
Garfield Primary School 2724 17 16 16 17 14 20 16 116
Geelong East Primary School 541 59 70 68 66 55 54 54 426
Geelong South Primary School 2143 44 38 51 39 45 49 36 302
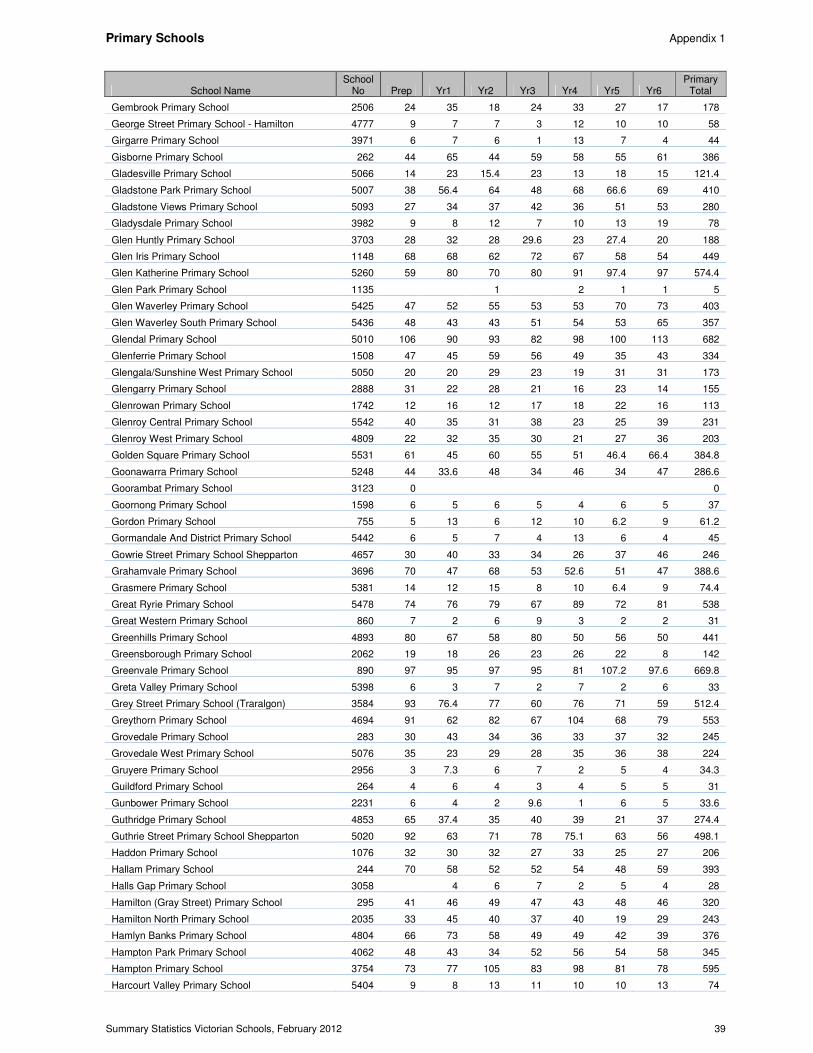
Primary Schools Appendix 1
Summary Statistics Victorian Schools, February 2012 39
School Name School
No Prep Yr1 Yr2 Yr3 Yr4 Yr5 Yr6 Primary
Total
Gembrook Primary School 2506 24 35 18 24 33 27 17 178
George Street Primary School - Hamilton 4777 9 7 7 3 12 10 10 58
Girgarre Primary School 3971 6 7 6 1 13 7 4 44
Gisborne Primary School 262 44 65 44 59 58 55 61 386
Gladesville Primary School 5066 14 23 15.4 23 13 18 15 121.4
Gladstone Park Primary School 5007 38 56.4 64 48 68 66.6 69 410
Gladstone Views Primary School 5093 27 34 37 42 36 51 53 280
Gladysdale Primary School 3982 9 8 12 7 10 13 19 78
Glen Huntly Primary School 3703 28 32 28 29.6 23 27.4 20 188
Glen Iris Primary School 1148 68 68 62 72 67 58 54 449
Glen Katherine Primary School 5260 59 80 70 80 91 97.4 97 574.4
Glen Park Primary School 1135 1 2 1 1 5
Glen Waverley Primary School 5425 47 52 55 53 53 70 73 403
Glen Waverley South Primary School 5436 48 43 43 51 54 53 65 357
Glendal Primary School 5010 106 90 93 82 98 100 113 682
Glenferrie Primary School 1508 47 45 59 56 49 35 43 334
Glengala/Sunshine West Primary School 5050 20 20 29 23 19 31 31 173
Glengarry Primary School 2888 31 22 28 21 16 23 14 155
Glenrowan Primary School 1742 12 16 12 17 18 22 16 113
Glenroy Central Primary School 5542 40 35 31 38 23 25 39 231
Glenroy West Primary School 4809 22 32 35 30 21 27 36 203
Golden Square Primary School 5531 61 45 60 55 51 46.4 66.4 384.8
Goonawarra Primary School 5248 44 33.6 48 34 46 34 47 286.6
Goorambat Primary School 3123 0 0
Goornong Primary School 1598 6 5 6 5 4 6 5 37
Gordon Primary School 755 5 13 6 12 10 6.2 9 61.2
Gormandale And District Primary School 5442 6 5 7 4 13 6 4 45
Gowrie Street Primary School Shepparton 4657 30 40 33 34 26 37 46 246
Grahamvale Primary School 3696 70 47 68 53 52.6 51 47 388.6
Grasmere Primary School 5381 14 12 15 8 10 6.4 9 74.4
Great Ryrie Primary School 5478 74 76 79 67 89 72 81 538
Great Western Primary School 860 7 2 6 9 3 2 2 31
Greenhills Primary School 4893 80 67 58 80 50 56 50 441
Greensborough Primary School 2062 19 18 26 23 26 22 8 142
Greenvale Primary School 890 97 95 97 95 81 107.2 97.6 669.8
Greta Valley Primary School 5398 6 3 7 2 7 2 6 33
Grey Street Primary School (Traralgon) 3584 93 76.4 77 60 76 71 59 512.4
Greythorn Primary School 4694 91 62 82 67 104 68 79 553
Grovedale Primary School 283 30 43 34 36 33 37 32 245
Grovedale West Primary School 5076 35 23 29 28 35 36 38 224
Gruyere Primary School 2956 3 7.3 6 7 2 5 4 34.3
Guildford Primary School 264 4 6 4 3 4 5 5 31
Gunbower Primary School 2231 6 4 2 9.6 1 6 5 33.6
Guthridge Primary School 4853 65 37.4 35 40 39 21 37 274.4
Guthrie Street Primary School Shepparton 5020 92 63 71 78 75.1 63 56 498.1
Haddon Primary School 1076 32 30 32 27 33 25 27 206
Hallam Primary School 244 70 58 52 52 54 48 59 393
Halls Gap Primary School 3058 4 6 7 2 5 4 28
Hamilton (Gray Street) Primary School 295 41 46 49 47 43 48 46 320
Hamilton North Primary School 2035 33 45 40 37 40 19 29 243
Hamlyn Banks Primary School 4804 66 73 58 49 49 42 39 376
Hampton Park Primary School 4062 48 43 34 52 56 54 58 345
Hampton Primary School 3754 73 77 105 83 98 81 78 595
Harcourt Valley Primary School 5404 9 8 13 11 10 10 13 74
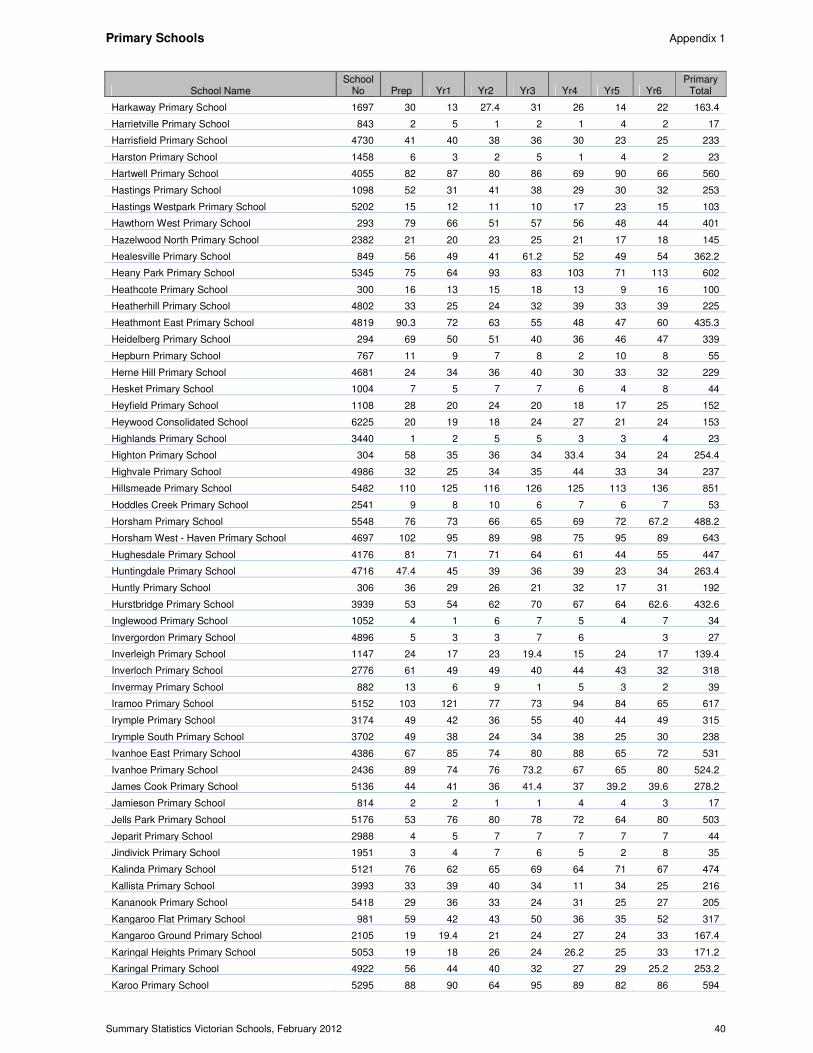
Primary Schools Appendix 1
Summary Statistics Victorian Schools, February 2012 40
School Name School
No Prep Yr1 Yr2 Yr3 Yr4 Yr5 Yr6 Primary
Total
Harkaway Primary School 1697 30 13 27.4 31 26 14 22 163.4
Harrietville Primary School 843 2 5 1 2 1 4 2 17
Harrisfield Primary School 4730 41 40 38 36 30 23 25 233
Harston Primary School 1458 6 3 2 5 1 4 2 23
Hartwell Primary School 4055 82 87 80 86 69 90 66 560
Hastings Primary School 1098 52 31 41 38 29 30 32 253
Hastings Westpark Primary School 5202 15 12 11 10 17 23 15 103
Hawthorn West Primary School 293 79 66 51 57 56 48 44 401
Hazelwood North Primary School 2382 21 20 23 25 21 17 18 145
Healesville Primary School 849 56 49 41 61.2 52 49 54 362.2
Heany Park Primary School 5345 75 64 93 83 103 71 113 602
Heathcote Primary School 300 16 13 15 18 13 9 16 100
Heatherhill Primary School 4802 33 25 24 32 39 33 39 225
Heathmont East Primary School 4819 90.3 72 63 55 48 47 60 435.3
Heidelberg Primary School 294 69 50 51 40 36 46 47 339
Hepburn Primary School 767 11 9 7 8 2 10 8 55
Herne Hill Primary School 4681 24 34 36 40 30 33 32 229
Hesket Primary School 1004 7 5 7 7 6 4 8 44
Heyfield Primary School 1108 28 20 24 20 18 17 25 152
Heywood Consolidated School 6225 20 19 18 24 27 21 24 153
Highlands Primary School 3440 1 2 5 5 3 3 4 23
Highton Primary School 304 58 35 36 34 33.4 34 24 254.4
Highvale Primary School 4986 32 25 34 35 44 33 34 237
Hillsmeade Primary School 5482 110 125 116 126 125 113 136 851
Hoddles Creek Primary School 2541 9 8 10 6 7 6 7 53
Horsham Primary School 5548 76 73 66 65 69 72 67.2 488.2
Horsham West - Haven Primary School 4697 102 95 89 98 75 95 89 643
Hughesdale Primary School 4176 81 71 71 64 61 44 55 447
Huntingdale Primary School 4716 47.4 45 39 36 39 23 34 263.4
Huntly Primary School 306 36 29 26 21 32 17 31 192
Hurstbridge Primary School 3939 53 54 62 70 67 64 62.6 432.6
Inglewood Primary School 1052 4 1 6 7 5 4 7 34
Invergordon Primary School 4896 5 3 3 7 6 3 27
Inverleigh Primary School 1147 24 17 23 19.4 15 24 17 139.4
Inverloch Primary School 2776 61 49 49 40 44 43 32 318
Invermay Primary School 882 13 6 9 1 5 3 2 39
Iramoo Primary School 5152 103 121 77 73 94 84 65 617
Irymple Primary School 3174 49 42 36 55 40 44 49 315
Irymple South Primary School 3702 49 38 24 34 38 25 30 238
Ivanhoe East Primary School 4386 67 85 74 80 88 65 72 531
Ivanhoe Primary School 2436 89 74 76 73.2 67 65 80 524.2
James Cook Primary School 5136 44 41 36 41.4 37 39.2 39.6 278.2
Jamieson Primary School 814 2 2 1 1 4 4 3 17
Jells Park Primary School 5176 53 76 80 78 72 64 80 503
Jeparit Primary School 2988 4 5 7 7 7 7 7 44
Jindivick Primary School 1951 3 4 7 6 5 2 8 35
Kalinda Primary School 5121 76 62 65 69 64 71 67 474
Kallista Primary School 3993 33 39 40 34 11 34 25 216
Kananook Primary School 5418 29 36 33 24 31 25 27 205
Kangaroo Flat Primary School 981 59 42 43 50 36 35 52 317
Kangaroo Ground Primary School 2105 19 19.4 21 24 27 24 33 167.4
Karingal Heights Primary School 5053 19 18 26 24 26.2 25 33 171.2
Karingal Primary School 4922 56 44 40 32 27 29 25.2 253.2
Karoo Primary School 5295 88 90 64 95 89 82 86 594
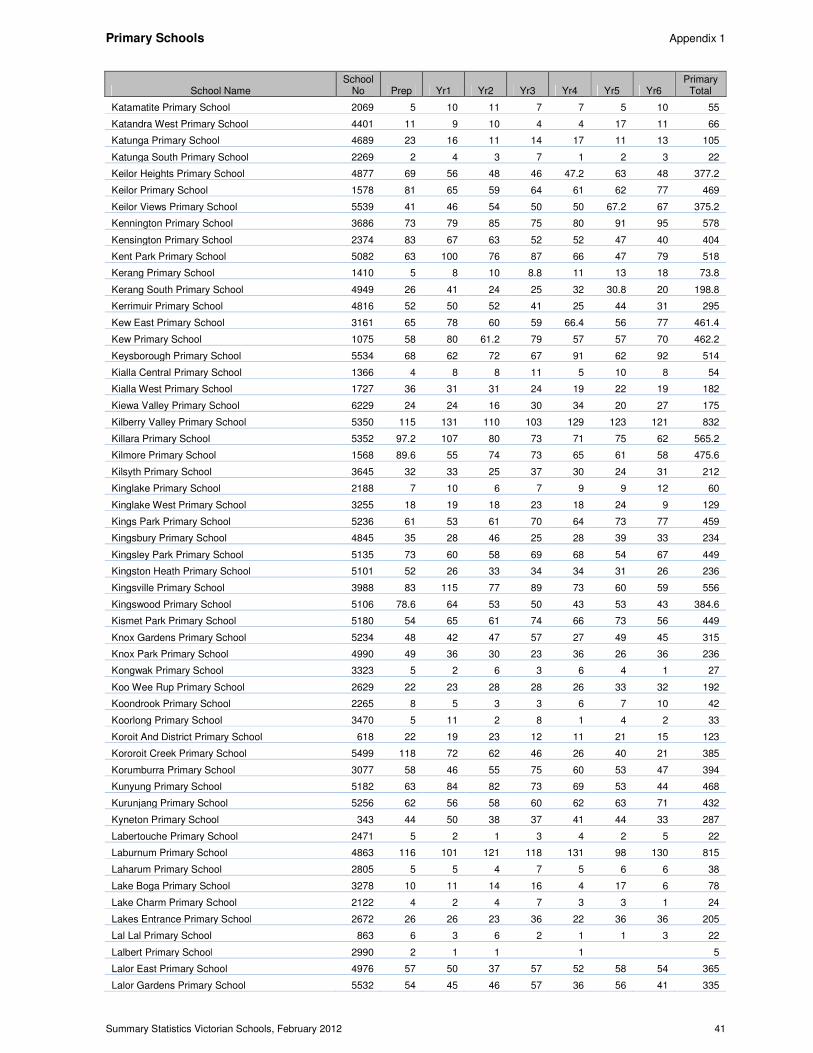
Primary Schools Appendix 1
Summary Statistics Victorian Schools, February 2012 41
School Name School
No Prep Yr1 Yr2 Yr3 Yr4 Yr5 Yr6 Primary
Total
Katamatite Primary School 2069 5 10 11 7 7 5 10 55
Katandra West Primary School 4401 11 9 10 4 4 17 11 66
Katunga Primary School 4689 23 16 11 14 17 11 13 105
Katunga South Primary School 2269 2 4 3 7 1 2 3 22
Keilor Heights Primary School 4877 69 56 48 46 47.2 63 48 377.2
Keilor Primary School 1578 81 65 59 64 61 62 77 469
Keilor Views Primary School 5539 41 46 54 50 50 67.2 67 375.2
Kennington Primary School 3686 73 79 85 75 80 91 95 578
Kensington Primary School 2374 83 67 63 52 52 47 40 404
Kent Park Primary School 5082 63 100 76 87 66 47 79 518
Kerang Primary School 1410 5 8 10 8.8 11 13 18 73.8
Kerang South Primary School 4949 26 41 24 25 32 30.8 20 198.8
Kerrimuir Primary School 4816 52 50 52 41 25 44 31 295
Kew East Primary School 3161 65 78 60 59 66.4 56 77 461.4
Kew Primary School 1075 58 80 61.2 79 57 57 70 462.2
Keysborough Primary School 5534 68 62 72 67 91 62 92 514
Kialla Central Primary School 1366 4 8 8 11 5 10 8 54
Kialla West Primary School 1727 36 31 31 24 19 22 19 182
Kiewa Valley Primary School 6229 24 24 16 30 34 20 27 175
Kilberry Valley Primary School 5350 115 131 110 103 129 123 121 832
Killara Primary School 5352 97.2 107 80 73 71 75 62 565.2
Kilmore Primary School 1568 89.6 55 74 73 65 61 58 475.6
Kilsyth Primary School 3645 32 33 25 37 30 24 31 212
Kinglake Primary School 2188 7 10 6 7 9 9 12 60
Kinglake West Primary School 3255 18 19 18 23 18 24 9 129
Kings Park Primary School 5236 61 53 61 70 64 73 77 459
Kingsbury Primary School 4845 35 28 46 25 28 39 33 234
Kingsley Park Primary School 5135 73 60 58 69 68 54 67 449
Kingston Heath Primary School 5101 52 26 33 34 34 31 26 236
Kingsville Primary School 3988 83 115 77 89 73 60 59 556
Kingswood Primary School 5106 78.6 64 53 50 43 53 43 384.6
Kismet Park Primary School 5180 54 65 61 74 66 73 56 449
Knox Gardens Primary School 5234 48 42 47 57 27 49 45 315
Knox Park Primary School 4990 49 36 30 23 36 26 36 236
Kongwak Primary School 3323 5 2 6 3 6 4 1 27
Koo Wee Rup Primary School 2629 22 23 28 28 26 33 32 192
Koondrook Primary School 2265 8 5 3 3 6 7 10 42
Koorlong Primary School 3470 5 11 2 8 1 4 2 33
Koroit And District Primary School 618 22 19 23 12 11 21 15 123
Kororoit Creek Primary School 5499 118 72 62 46 26 40 21 385
Korumburra Primary School 3077 58 46 55 75 60 53 47 394
Kunyung Primary School 5182 63 84 82 73 69 53 44 468
Kurunjang Primary School 5256 62 56 58 60 62 63 71 432
Kyneton Primary School 343 44 50 38 37 41 44 33 287
Labertouche Primary School 2471 5 2 1 3 4 2 5 22
Laburnum Primary School 4863 116 101 121 118 131 98 130 815
Laharum Primary School 2805 5 5 4 7 5 6 6 38
Lake Boga Primary School 3278 10 11 14 16 4 17 6 78
Lake Charm Primary School 2122 4 2 4 7 3 3 1 24
Lakes Entrance Primary School 2672 26 26 23 36 22 36 36 205
Lal Lal Primary School 863 6 3 6 2 1 1 3 22
Lalbert Primary School 2990 2 1 1 1 5
Lalor East Primary School 4976 57 50 37 57 52 58 54 365
Lalor Gardens Primary School 5532 54 45 46 57 36 56 41 335
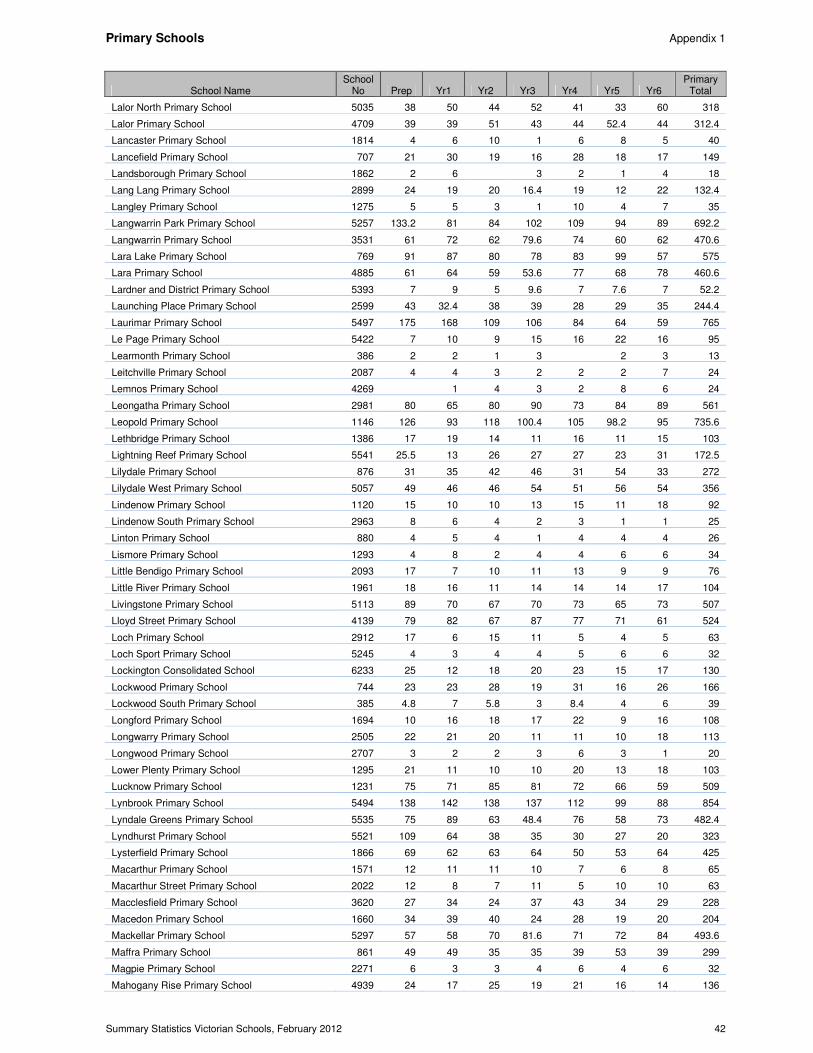
Primary Schools Appendix 1
Summary Statistics Victorian Schools, February 2012 42
School Name School
No Prep Yr1 Yr2 Yr3 Yr4 Yr5 Yr6 Primary
Total
Lalor North Primary School 5035 38 50 44 52 41 33 60 318
Lalor Primary School 4709 39 39 51 43 44 52.4 44 312.4
Lancaster Primary School 1814 4 6 10 1 6 8 5 40
Lancefield Primary School 707 21 30 19 16 28 18 17 149
Landsborough Primary School 1862 2 6 3 2 1 4 18
Lang Lang Primary School 2899 24 19 20 16.4 19 12 22 132.4
Langley Primary School 1275 5 5 3 1 10 4 7 35
Langwarrin Park Primary School 5257 133.2 81 84 102 109 94 89 692.2
Langwarrin Primary School 3531 61 72 62 79.6 74 60 62 470.6
Lara Lake Primary School 769 91 87 80 78 83 99 57 575
Lara Primary School 4885 61 64 59 53.6 77 68 78 460.6
Lardner and District Primary School 5393 7 9 5 9.6 7 7.6 7 52.2
Launching Place Primary School 2599 43 32.4 38 39 28 29 35 244.4
Laurimar Primary School 5497 175 168 109 106 84 64 59 765
Le Page Primary School 5422 7 10 9 15 16 22 16 95
Learmonth Primary School 386 2 2 1 3 2 3 13
Leitchville Primary School 2087 4 4 3 2 2 2 7 24
Lemnos Primary School 4269 1 4 3 2 8 6 24
Leongatha Primary School 2981 80 65 80 90 73 84 89 561
Leopold Primary School 1146 126 93 118 100.4 105 98.2 95 735.6
Lethbridge Primary School 1386 17 19 14 11 16 11 15 103
Lightning Reef Primary School 5541 25.5 13 26 27 27 23 31 172.5
Lilydale Primary School 876 31 35 42 46 31 54 33 272
Lilydale West Primary School 5057 49 46 46 54 51 56 54 356
Lindenow Primary School 1120 15 10 10 13 15 11 18 92
Lindenow South Primary School 2963 8 6 4 2 3 1 1 25
Linton Primary School 880 4 5 4 1 4 4 4 26
Lismore Primary School 1293 4 8 2 4 4 6 6 34
Little Bendigo Primary School 2093 17 7 10 11 13 9 9 76
Little River Primary School 1961 18 16 11 14 14 14 17 104
Livingstone Primary School 5113 89 70 67 70 73 65 73 507
Lloyd Street Primary School 4139 79 82 67 87 77 71 61 524
Loch Primary School 2912 17 6 15 11 5 4 5 63
Loch Sport Primary School 5245 4 3 4 4 5 6 6 32
Lockington Consolidated School 6233 25 12 18 20 23 15 17 130
Lockwood Primary School 744 23 23 28 19 31 16 26 166
Lockwood South Primary School 385 4.8 7 5.8 3 8.4 4 6 39
Longford Primary School 1694 10 16 18 17 22 9 16 108
Longwarry Primary School 2505 22 21 20 11 11 10 18 113
Longwood Primary School 2707 3 2 2 3 6 3 1 20
Lower Plenty Primary School 1295 21 11 10 10 20 13 18 103
Lucknow Primary School 1231 75 71 85 81 72 66 59 509
Lynbrook Primary School 5494 138 142 138 137 112 99 88 854
Lyndale Greens Primary School 5535 75 89 63 48.4 76 58 73 482.4
Lyndhurst Primary School 5521 109 64 38 35 30 27 20 323
Lysterfield Primary School 1866 69 62 63 64 50 53 64 425
Macarthur Primary School 1571 12 11 11 10 7 6 8 65
Macarthur Street Primary School 2022 12 8 7 11 5 10 10 63
Macclesfield Primary School 3620 27 34 24 37 43 34 29 228
Macedon Primary School 1660 34 39 40 24 28 19 20 204
Mackellar Primary School 5297 57 58 70 81.6 71 72 84 493.6
Maffra Primary School 861 49 49 35 35 39 53 39 299
Magpie Primary School 2271 6 3 3 4 6 4 6 32
Mahogany Rise Primary School 4939 24 17 25 19 21 16 14 136
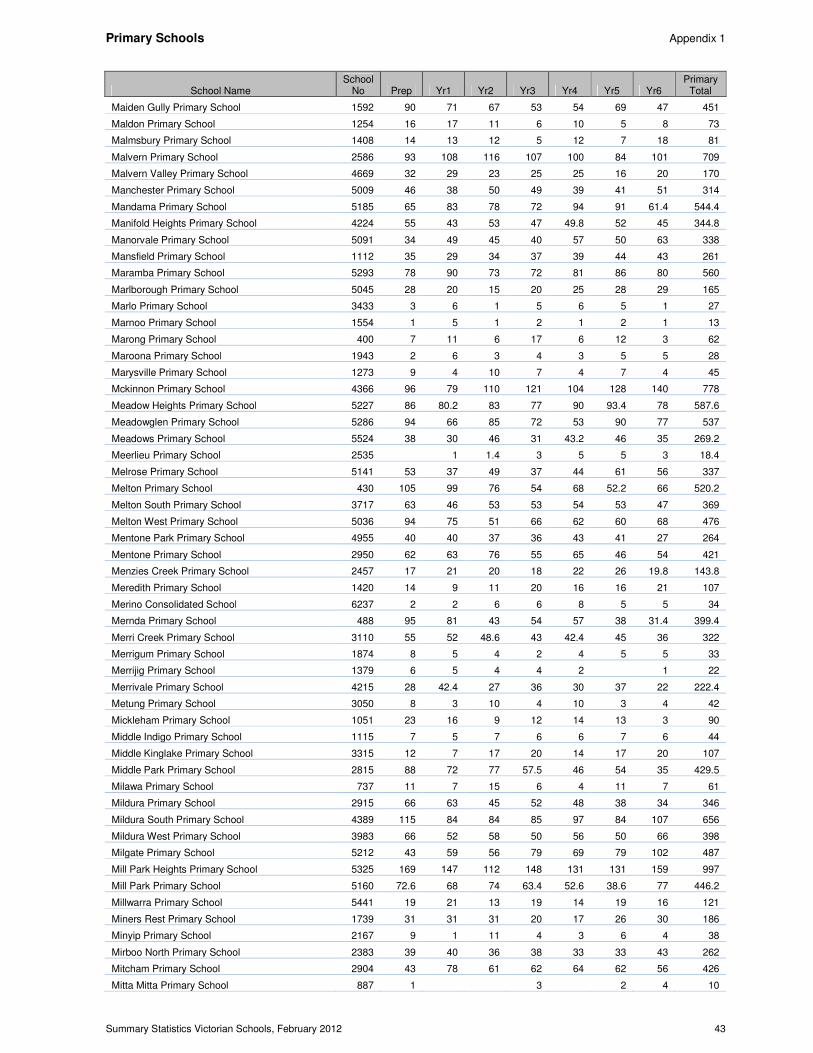
Primary Schools Appendix 1
Summary Statistics Victorian Schools, February 2012 43
School Name School
No Prep Yr1 Yr2 Yr3 Yr4 Yr5 Yr6 Primary
Total
Maiden Gully Primary School 1592 90 71 67 53 54 69 47 451
Maldon Primary School 1254 16 17 11 6 10 5 8 73
Malmsbury Primary School 1408 14 13 12 5 12 7 18 81
Malvern Primary School 2586 93 108 116 107 100 84 101 709
Malvern Valley Primary School 4669 32 29 23 25 25 16 20 170
Manchester Primary School 5009 46 38 50 49 39 41 51 314
Mandama Primary School 5185 65 83 78 72 94 91 61.4 544.4
Manifold Heights Primary School 4224 55 43 53 47 49.8 52 45 344.8
Manorvale Primary School 5091 34 49 45 40 57 50 63 338
Mansfield Primary School 1112 35 29 34 37 39 44 43 261
Maramba Primary School 5293 78 90 73 72 81 86 80 560
Marlborough Primary School 5045 28 20 15 20 25 28 29 165
Marlo Primary School 3433 3 6 1 5 6 5 1 27
Marnoo Primary School 1554 1 5 1 2 1 2 1 13
Marong Primary School 400 7 11 6 17 6 12 3 62
Maroona Primary School 1943 2 6 3 4 3 5 5 28
Marysville Primary School 1273 9 4 10 7 4 7 4 45
Mckinnon Primary School 4366 96 79 110 121 104 128 140 778
Meadow Heights Primary School 5227 86 80.2 83 77 90 93.4 78 587.6
Meadowglen Primary School 5286 94 66 85 72 53 90 77 537
Meadows Primary School 5524 38 30 46 31 43.2 46 35 269.2
Meerlieu Primary School 2535 1 1.4 3 5 5 3 18.4
Melrose Primary School 5141 53 37 49 37 44 61 56 337
Melton Primary School 430 105 99 76 54 68 52.2 66 520.2
Melton South Primary School 3717 63 46 53 53 54 53 47 369
Melton West Primary School 5036 94 75 51 66 62 60 68 476
Mentone Park Primary School 4955 40 40 37 36 43 41 27 264
Mentone Primary School 2950 62 63 76 55 65 46 54 421
Menzies Creek Primary School 2457 17 21 20 18 22 26 19.8 143.8
Meredith Primary School 1420 14 9 11 20 16 16 21 107
Merino Consolidated School 6237 2 2 6 6 8 5 5 34
Mernda Primary School 488 95 81 43 54 57 38 31.4 399.4
Merri Creek Primary School 3110 55 52 48.6 43 42.4 45 36 322
Merrigum Primary School 1874 8 5 4 2 4 5 5 33
Merrijig Primary School 1379 6 5 4 4 2 1 22
Merrivale Primary School 4215 28 42.4 27 36 30 37 22 222.4
Metung Primary School 3050 8 3 10 4 10 3 4 42
Mickleham Primary School 1051 23 16 9 12 14 13 3 90
Middle Indigo Primary School 1115 7 5 7 6 6 7 6 44
Middle Kinglake Primary School 3315 12 7 17 20 14 17 20 107
Middle Park Primary School 2815 88 72 77 57.5 46 54 35 429.5
Milawa Primary School 737 11 7 15 6 4 11 7 61
Mildura Primary School 2915 66 63 45 52 48 38 34 346
Mildura South Primary School 4389 115 84 84 85 97 84 107 656
Mildura West Primary School 3983 66 52 58 50 56 50 66 398
Milgate Primary School 5212 43 59 56 79 69 79 102 487
Mill Park Heights Primary School 5325 169 147 112 148 131 131 159 997
Mill Park Primary School 5160 72.6 68 74 63.4 52.6 38.6 77 446.2
Millwarra Primary School 5441 19 21 13 19 14 19 16 121
Miners Rest Primary School 1739 31 31 31 20 17 26 30 186
Minyip Primary School 2167 9 1 11 4 3 6 4 38
Mirboo North Primary School 2383 39 40 36 38 33 33 43 262
Mitcham Primary School 2904 43 78 61 62 64 62 56 426
Mitta Mitta Primary School 887 1 3 2 4 10
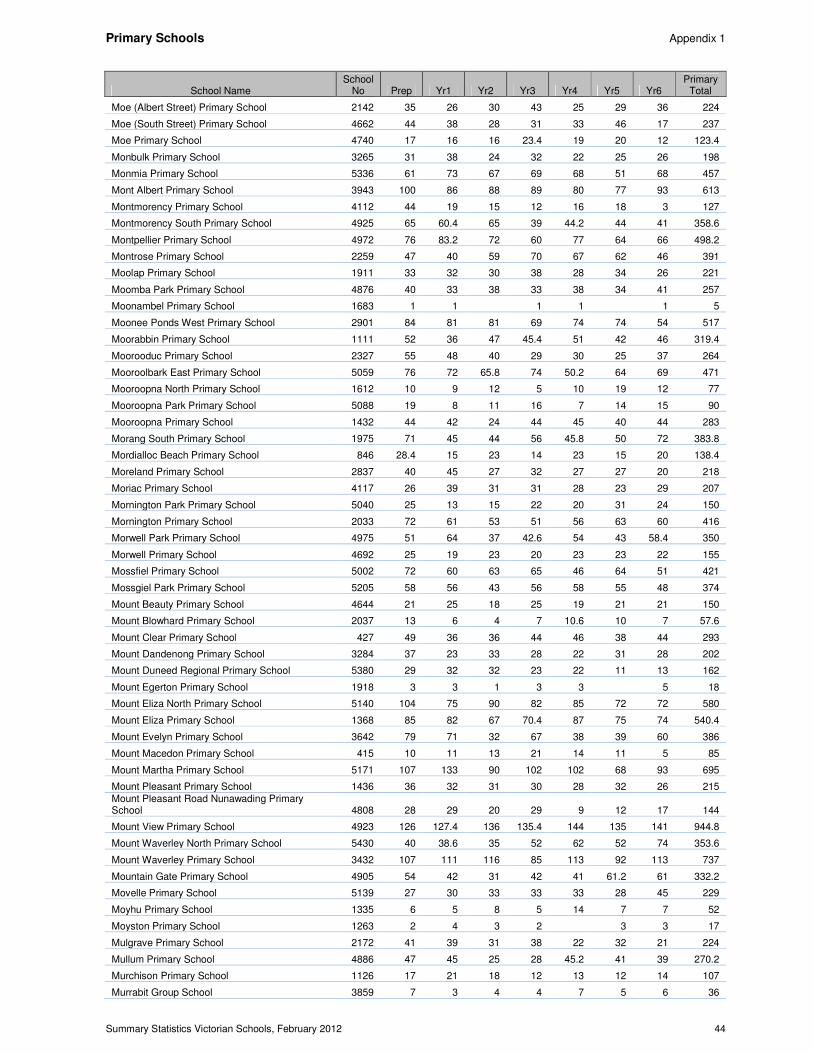
Primary Schools Appendix 1
Summary Statistics Victorian Schools, February 2012 44
School Name School
No Prep Yr1 Yr2 Yr3 Yr4 Yr5 Yr6 Primary
Total
Moe (Albert Street) Primary School 2142 35 26 30 43 25 29 36 224
Moe (South Street) Primary School 4662 44 38 28 31 33 46 17 237
Moe Primary School 4740 17 16 16 23.4 19 20 12 123.4
Monbulk Primary School 3265 31 38 24 32 22 25 26 198
Monmia Primary School 5336 61 73 67 69 68 51 68 457
Mont Albert Primary School 3943 100 86 88 89 80 77 93 613
Montmorency Primary School 4112 44 19 15 12 16 18 3 127
Montmorency South Primary School 4925 65 60.4 65 39 44.2 44 41 358.6
Montpellier Primary School 4972 76 83.2 72 60 77 64 66 498.2
Montrose Primary School 2259 47 40 59 70 67 62 46 391
Moolap Primary School 1911 33 32 30 38 28 34 26 221
Moomba Park Primary School 4876 40 33 38 33 38 34 41 257
Moonambel Primary School 1683 1 1 1 1 1 5
Moonee Ponds West Primary School 2901 84 81 81 69 74 74 54 517
Moorabbin Primary School 1111 52 36 47 45.4 51 42 46 319.4
Moorooduc Primary School 2327 55 48 40 29 30 25 37 264
Mooroolbark East Primary School 5059 76 72 65.8 74 50.2 64 69 471
Mooroopna North Primary School 1612 10 9 12 5 10 19 12 77
Mooroopna Park Primary School 5088 19 8 11 16 7 14 15 90
Mooroopna Primary School 1432 44 42 24 44 45 40 44 283
Morang South Primary School 1975 71 45 44 56 45.8 50 72 383.8
Mordialloc Beach Primary School 846 28.4 15 23 14 23 15 20 138.4
Moreland Primary School 2837 40 45 27 32 27 27 20 218
Moriac Primary School 4117 26 39 31 31 28 23 29 207
Mornington Park Primary School 5040 25 13 15 22 20 31 24 150
Mornington Primary School 2033 72 61 53 51 56 63 60 416
Morwell Park Primary School 4975 51 64 37 42.6 54 43 58.4 350
Morwell Primary School 4692 25 19 23 20 23 23 22 155
Mossfiel Primary School 5002 72 60 63 65 46 64 51 421
Mossgiel Park Primary School 5205 58 56 43 56 58 55 48 374
Mount Beauty Primary School 4644 21 25 18 25 19 21 21 150
Mount Blowhard Primary School 2037 13 6 4 7 10.6 10 7 57.6
Mount Clear Primary School 427 49 36 36 44 46 38 44 293
Mount Dandenong Primary School 3284 37 23 33 28 22 31 28 202
Mount Duneed Regional Primary School 5380 29 32 32 23 22 11 13 162
Mount Egerton Primary School 1918 3 3 1 3 3 5 18
Mount Eliza North Primary School 5140 104 75 90 82 85 72 72 580
Mount Eliza Primary School 1368 85 82 67 70.4 87 75 74 540.4
Mount Evelyn Primary School 3642 79 71 32 67 38 39 60 386
Mount Macedon Primary School 415 10 11 13 21 14 11 5 85
Mount Martha Primary School 5171 107 133 90 102 102 68 93 695
Mount Pleasant Primary School 1436 36 32 31 30 28 32 26 215
Mount Pleasant Road Nunawading Primary School 4808 28 29 20 29 9 12 17 144
Mount View Primary School 4923 126 127.4 136 135.4 144 135 141 944.8
Mount Waverley North Primary School 5430 40 38.6 35 52 62 52 74 353.6
Mount Waverley Primary School 3432 107 111 116 85 113 92 113 737
Mountain Gate Primary School 4905 54 42 31 42 41 61.2 61 332.2
Movelle Primary School 5139 27 30 33 33 33 28 45 229
Moyhu Primary School 1335 6 5 8 5 14 7 7 52
Moyston Primary School 1263 2 4 3 2 3 3 17
Mulgrave Primary School 2172 41 39 31 38 22 32 21 224
Mullum Primary School 4886 47 45 25 28 45.2 41 39 270.2
Murchison Primary School 1126 17 21 18 12 13 12 14 107
Murrabit Group School 3859 7 3 4 4 7 5 6 36
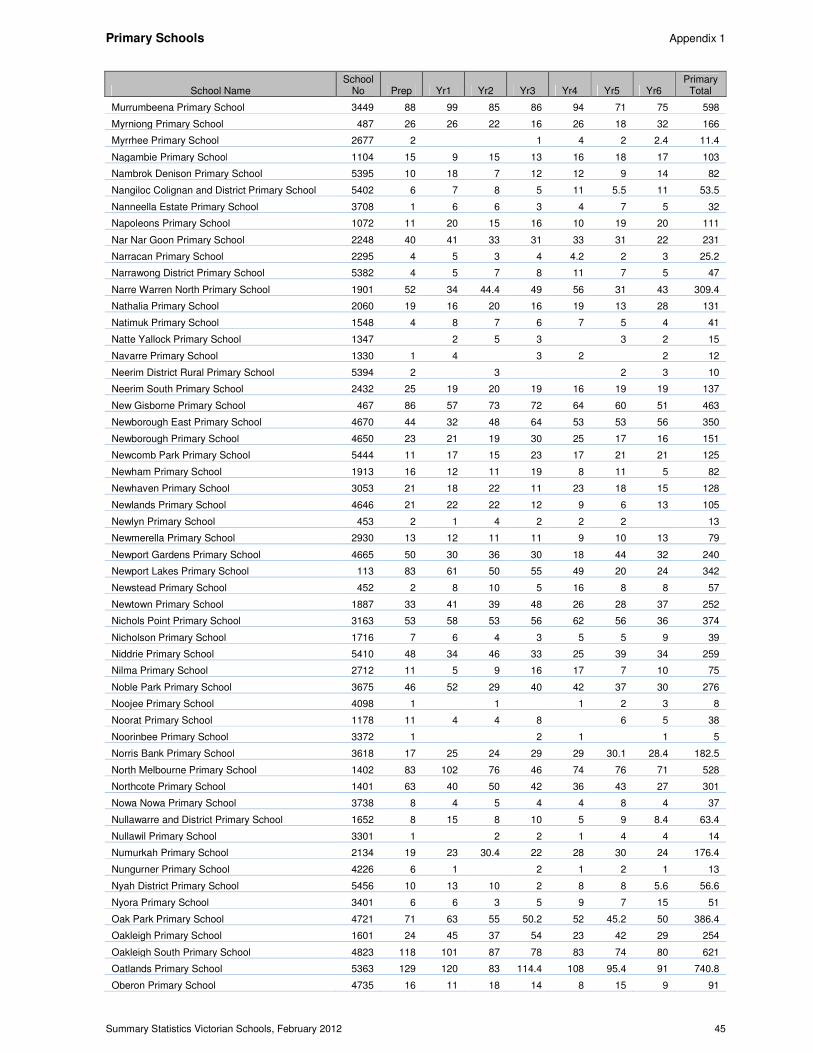
Primary Schools Appendix 1
Summary Statistics Victorian Schools, February 2012 45
School Name School
No Prep Yr1 Yr2 Yr3 Yr4 Yr5 Yr6 Primary
Total
Murrumbeena Primary School 3449 88 99 85 86 94 71 75 598
Myrniong Primary School 487 26 26 22 16 26 18 32 166
Myrrhee Primary School 2677 2 1 4 2 2.4 11.4
Nagambie Primary School 1104 15 9 15 13 16 18 17 103
Nambrok Denison Primary School 5395 10 18 7 12 12 9 14 82
Nangiloc Colignan and District Primary School 5402 6 7 8 5 11 5.5 11 53.5
Nanneella Estate Primary School 3708 1 6 6 3 4 7 5 32
Napoleons Primary School 1072 11 20 15 16 10 19 20 111
Nar Nar Goon Primary School 2248 40 41 33 31 33 31 22 231
Narracan Primary School 2295 4 5 3 4 4.2 2 3 25.2
Narrawong District Primary School 5382 4 5 7 8 11 7 5 47
Narre Warren North Primary School 1901 52 34 44.4 49 56 31 43 309.4
Nathalia Primary School 2060 19 16 20 16 19 13 28 131
Natimuk Primary School 1548 4 8 7 6 7 5 4 41
Natte Yallock Primary School 1347 2 5 3 3 2 15
Navarre Primary School 1330 1 4 3 2 2 12
Neerim District Rural Primary School 5394 2 3 2 3 10
Neerim South Primary School 2432 25 19 20 19 16 19 19 137
New Gisborne Primary School 467 86 57 73 72 64 60 51 463
Newborough East Primary School 4670 44 32 48 64 53 53 56 350
Newborough Primary School 4650 23 21 19 30 25 17 16 151
Newcomb Park Primary School 5444 11 17 15 23 17 21 21 125
Newham Primary School 1913 16 12 11 19 8 11 5 82
Newhaven Primary School 3053 21 18 22 11 23 18 15 128
Newlands Primary School 4646 21 22 22 12 9 6 13 105
Newlyn Primary School 453 2 1 4 2 2 2 13
Newmerella Primary School 2930 13 12 11 11 9 10 13 79
Newport Gardens Primary School 4665 50 30 36 30 18 44 32 240
Newport Lakes Primary School 113 83 61 50 55 49 20 24 342
Newstead Primary School 452 2 8 10 5 16 8 8 57
Newtown Primary School 1887 33 41 39 48 26 28 37 252
Nichols Point Primary School 3163 53 58 53 56 62 56 36 374
Nicholson Primary School 1716 7 6 4 3 5 5 9 39
Niddrie Primary School 5410 48 34 46 33 25 39 34 259
Nilma Primary School 2712 11 5 9 16 17 7 10 75
Noble Park Primary School 3675 46 52 29 40 42 37 30 276
Noojee Primary School 4098 1 1 1 2 3 8
Noorat Primary School 1178 11 4 4 8 6 5 38
Noorinbee Primary School 3372 1 2 1 1 5
Norris Bank Primary School 3618 17 25 24 29 29 30.1 28.4 182.5
North Melbourne Primary School 1402 83 102 76 46 74 76 71 528
Northcote Primary School 1401 63 40 50 42 36 43 27 301
Nowa Nowa Primary School 3738 8 4 5 4 4 8 4 37
Nullawarre and District Primary School 1652 8 15 8 10 5 9 8.4 63.4
Nullawil Primary School 3301 1 2 2 1 4 4 14
Numurkah Primary School 2134 19 23 30.4 22 28 30 24 176.4
Nungurner Primary School 4226 6 1 2 1 2 1 13
Nyah District Primary School 5456 10 13 10 2 8 8 5.6 56.6
Nyora Primary School 3401 6 6 3 5 9 7 15 51
Oak Park Primary School 4721 71 63 55 50.2 52 45.2 50 386.4
Oakleigh Primary School 1601 24 45 37 54 23 42 29 254
Oakleigh South Primary School 4823 118 101 87 78 83 74 80 621
Oatlands Primary School 5363 129 120 83 114.4 108 95.4 91 740.8
Oberon Primary School 4735 16 11 18 14 8 15 9 91
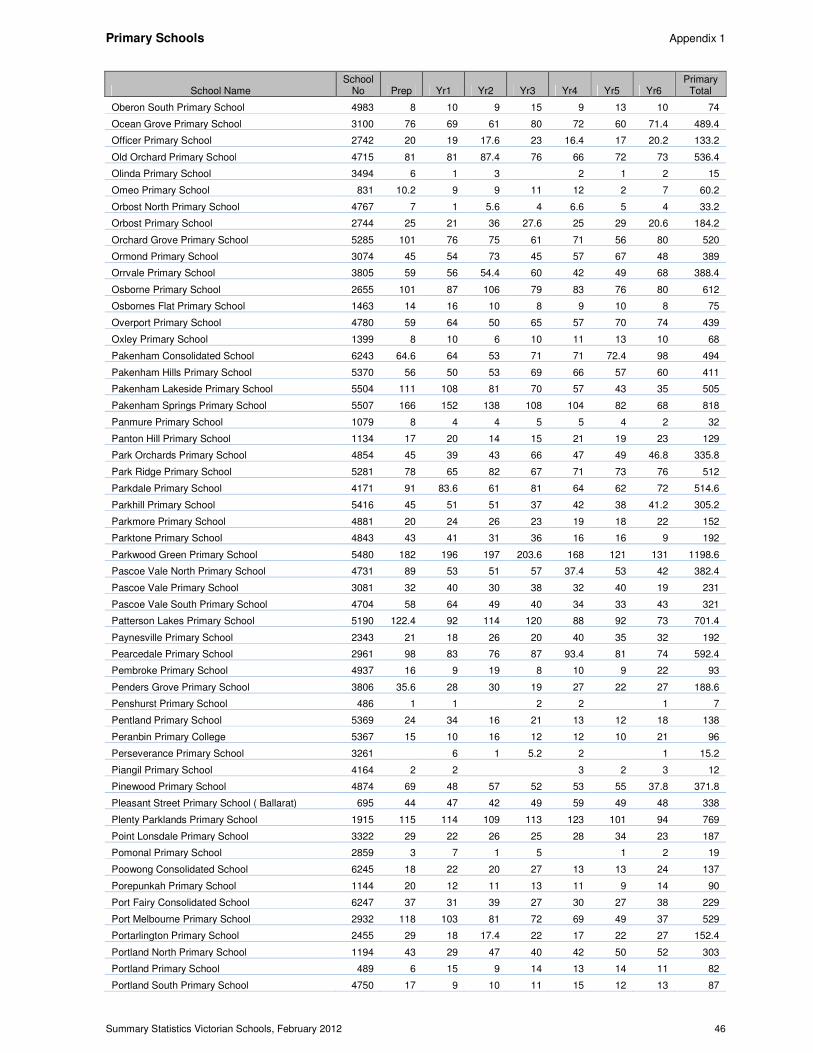
Primary Schools Appendix 1
Summary Statistics Victorian Schools, February 2012 46
School Name School
No Prep Yr1 Yr2 Yr3 Yr4 Yr5 Yr6 Primary
Total
Oberon South Primary School 4983 8 10 9 15 9 13 10 74
Ocean Grove Primary School 3100 76 69 61 80 72 60 71.4 489.4
Officer Primary School 2742 20 19 17.6 23 16.4 17 20.2 133.2
Old Orchard Primary School 4715 81 81 87.4 76 66 72 73 536.4
Olinda Primary School 3494 6 1 3 2 1 2 15
Omeo Primary School 831 10.2 9 9 11 12 2 7 60.2
Orbost North Primary School 4767 7 1 5.6 4 6.6 5 4 33.2
Orbost Primary School 2744 25 21 36 27.6 25 29 20.6 184.2
Orchard Grove Primary School 5285 101 76 75 61 71 56 80 520
Ormond Primary School 3074 45 54 73 45 57 67 48 389
Orrvale Primary School 3805 59 56 54.4 60 42 49 68 388.4
Osborne Primary School 2655 101 87 106 79 83 76 80 612
Osbornes Flat Primary School 1463 14 16 10 8 9 10 8 75
Overport Primary School 4780 59 64 50 65 57 70 74 439
Oxley Primary School 1399 8 10 6 10 11 13 10 68
Pakenham Consolidated School 6243 64.6 64 53 71 71 72.4 98 494
Pakenham Hills Primary School 5370 56 50 53 69 66 57 60 411
Pakenham Lakeside Primary School 5504 111 108 81 70 57 43 35 505
Pakenham Springs Primary School 5507 166 152 138 108 104 82 68 818
Panmure Primary School 1079 8 4 4 5 5 4 2 32
Panton Hill Primary School 1134 17 20 14 15 21 19 23 129
Park Orchards Primary School 4854 45 39 43 66 47 49 46.8 335.8
Park Ridge Primary School 5281 78 65 82 67 71 73 76 512
Parkdale Primary School 4171 91 83.6 61 81 64 62 72 514.6
Parkhill Primary School 5416 45 51 51 37 42 38 41.2 305.2
Parkmore Primary School 4881 20 24 26 23 19 18 22 152
Parktone Primary School 4843 43 41 31 36 16 16 9 192
Parkwood Green Primary School 5480 182 196 197 203.6 168 121 131 1198.6
Pascoe Vale North Primary School 4731 89 53 51 57 37.4 53 42 382.4
Pascoe Vale Primary School 3081 32 40 30 38 32 40 19 231
Pascoe Vale South Primary School 4704 58 64 49 40 34 33 43 321
Patterson Lakes Primary School 5190 122.4 92 114 120 88 92 73 701.4
Paynesville Primary School 2343 21 18 26 20 40 35 32 192
Pearcedale Primary School 2961 98 83 76 87 93.4 81 74 592.4
Pembroke Primary School 4937 16 9 19 8 10 9 22 93
Penders Grove Primary School 3806 35.6 28 30 19 27 22 27 188.6
Penshurst Primary School 486 1 1 2 2 1 7
Pentland Primary School 5369 24 34 16 21 13 12 18 138
Peranbin Primary College 5367 15 10 16 12 12 10 21 96
Perseverance Primary School 3261 6 1 5.2 2 1 15.2
Piangil Primary School 4164 2 2 3 2 3 12
Pinewood Primary School 4874 69 48 57 52 53 55 37.8 371.8
Pleasant Street Primary School ( Ballarat) 695 44 47 42 49 59 49 48 338
Plenty Parklands Primary School 1915 115 114 109 113 123 101 94 769
Point Lonsdale Primary School 3322 29 22 26 25 28 34 23 187
Pomonal Primary School 2859 3 7 1 5 1 2 19
Poowong Consolidated School 6245 18 22 20 27 13 13 24 137
Porepunkah Primary School 1144 20 12 11 13 11 9 14 90
Port Fairy Consolidated School 6247 37 31 39 27 30 27 38 229
Port Melbourne Primary School 2932 118 103 81 72 69 49 37 529
Portarlington Primary School 2455 29 18 17.4 22 17 22 27 152.4
Portland North Primary School 1194 43 29 47 40 42 50 52 303
Portland Primary School 489 6 15 9 14 13 14 11 82
Portland South Primary School 4750 17 9 10 11 15 12 13 87
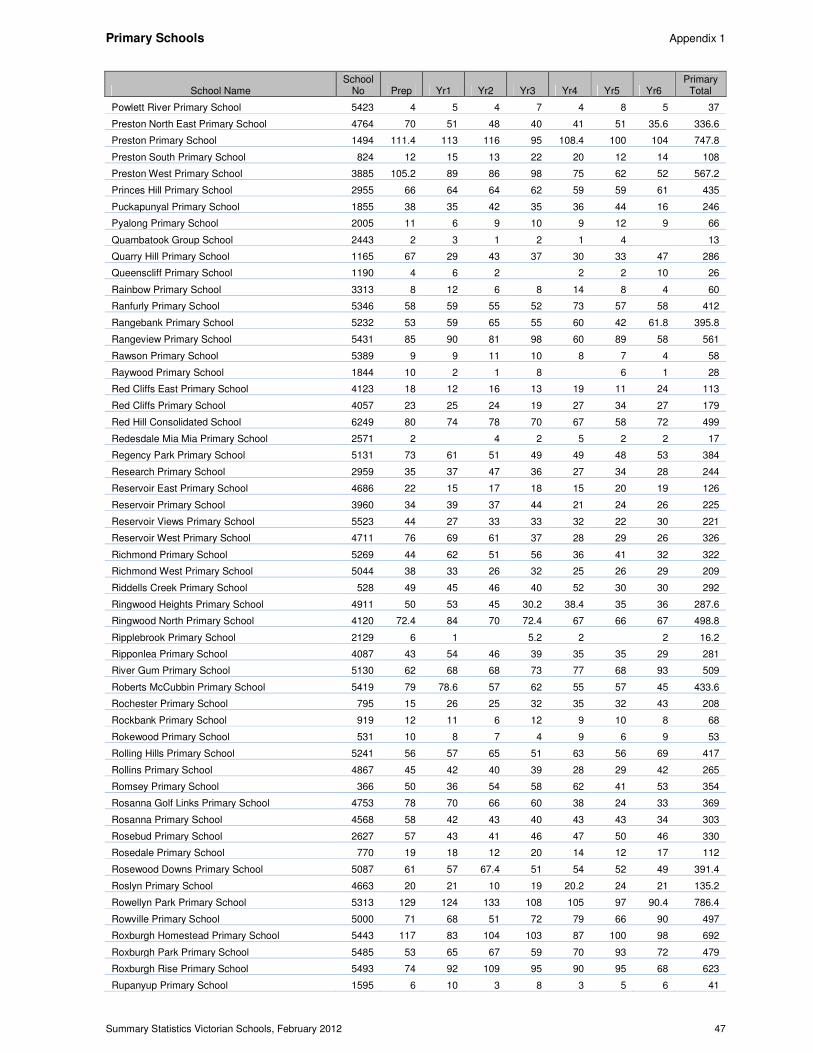
Primary Schools Appendix 1
Summary Statistics Victorian Schools, February 2012 47
School Name School
No Prep Yr1 Yr2 Yr3 Yr4 Yr5 Yr6 Primary
Total
Powlett River Primary School 5423 4 5 4 7 4 8 5 37
Preston North East Primary School 4764 70 51 48 40 41 51 35.6 336.6
Preston Primary School 1494 111.4 113 116 95 108.4 100 104 747.8
Preston South Primary School 824 12 15 13 22 20 12 14 108
Preston West Primary School 3885 105.2 89 86 98 75 62 52 567.2
Princes Hill Primary School 2955 66 64 64 62 59 59 61 435
Puckapunyal Primary School 1855 38 35 42 35 36 44 16 246
Pyalong Primary School 2005 11 6 9 10 9 12 9 66
Quambatook Group School 2443 2 3 1 2 1 4 13
Quarry Hill Primary School 1165 67 29 43 37 30 33 47 286
Queenscliff Primary School 1190 4 6 2 2 2 10 26
Rainbow Primary School 3313 8 12 6 8 14 8 4 60
Ranfurly Primary School 5346 58 59 55 52 73 57 58 412
Rangebank Primary School 5232 53 59 65 55 60 42 61.8 395.8
Rangeview Primary School 5431 85 90 81 98 60 89 58 561
Rawson Primary School 5389 9 9 11 10 8 7 4 58
Raywood Primary School 1844 10 2 1 8 6 1 28
Red Cliffs East Primary School 4123 18 12 16 13 19 11 24 113
Red Cliffs Primary School 4057 23 25 24 19 27 34 27 179
Red Hill Consolidated School 6249 80 74 78 70 67 58 72 499
Redesdale Mia Mia Primary School 2571 2 4 2 5 2 2 17
Regency Park Primary School 5131 73 61 51 49 49 48 53 384
Research Primary School 2959 35 37 47 36 27 34 28 244
Reservoir East Primary School 4686 22 15 17 18 15 20 19 126
Reservoir Primary School 3960 34 39 37 44 21 24 26 225
Reservoir Views Primary School 5523 44 27 33 33 32 22 30 221
Reservoir West Primary School 4711 76 69 61 37 28 29 26 326
Richmond Primary School 5269 44 62 51 56 36 41 32 322
Richmond West Primary School 5044 38 33 26 32 25 26 29 209
Riddells Creek Primary School 528 49 45 46 40 52 30 30 292
Ringwood Heights Primary School 4911 50 53 45 30.2 38.4 35 36 287.6
Ringwood North Primary School 4120 72.4 84 70 72.4 67 66 67 498.8
Ripplebrook Primary School 2129 6 1 5.2 2 2 16.2
Ripponlea Primary School 4087 43 54 46 39 35 35 29 281
River Gum Primary School 5130 62 68 68 73 77 68 93 509
Roberts McCubbin Primary School 5419 79 78.6 57 62 55 57 45 433.6
Rochester Primary School 795 15 26 25 32 35 32 43 208
Rockbank Primary School 919 12 11 6 12 9 10 8 68
Rokewood Primary School 531 10 8 7 4 9 6 9 53
Rolling Hills Primary School 5241 56 57 65 51 63 56 69 417
Rollins Primary School 4867 45 42 40 39 28 29 42 265
Romsey Primary School 366 50 36 54 58 62 41 53 354
Rosanna Golf Links Primary School 4753 78 70 66 60 38 24 33 369
Rosanna Primary School 4568 58 42 43 40 43 43 34 303
Rosebud Primary School 2627 57 43 41 46 47 50 46 330
Rosedale Primary School 770 19 18 12 20 14 12 17 112
Rosewood Downs Primary School 5087 61 57 67.4 51 54 52 49 391.4
Roslyn Primary School 4663 20 21 10 19 20.2 24 21 135.2
Rowellyn Park Primary School 5313 129 124 133 108 105 97 90.4 786.4
Rowville Primary School 5000 71 68 51 72 79 66 90 497
Roxburgh Homestead Primary School 5443 117 83 104 103 87 100 98 692
Roxburgh Park Primary School 5485 53 65 67 59 70 93 72 479
Roxburgh Rise Primary School 5493 74 92 109 95 90 95 68 623
Rupanyup Primary School 1595 6 10 3 8 3 5 6 41
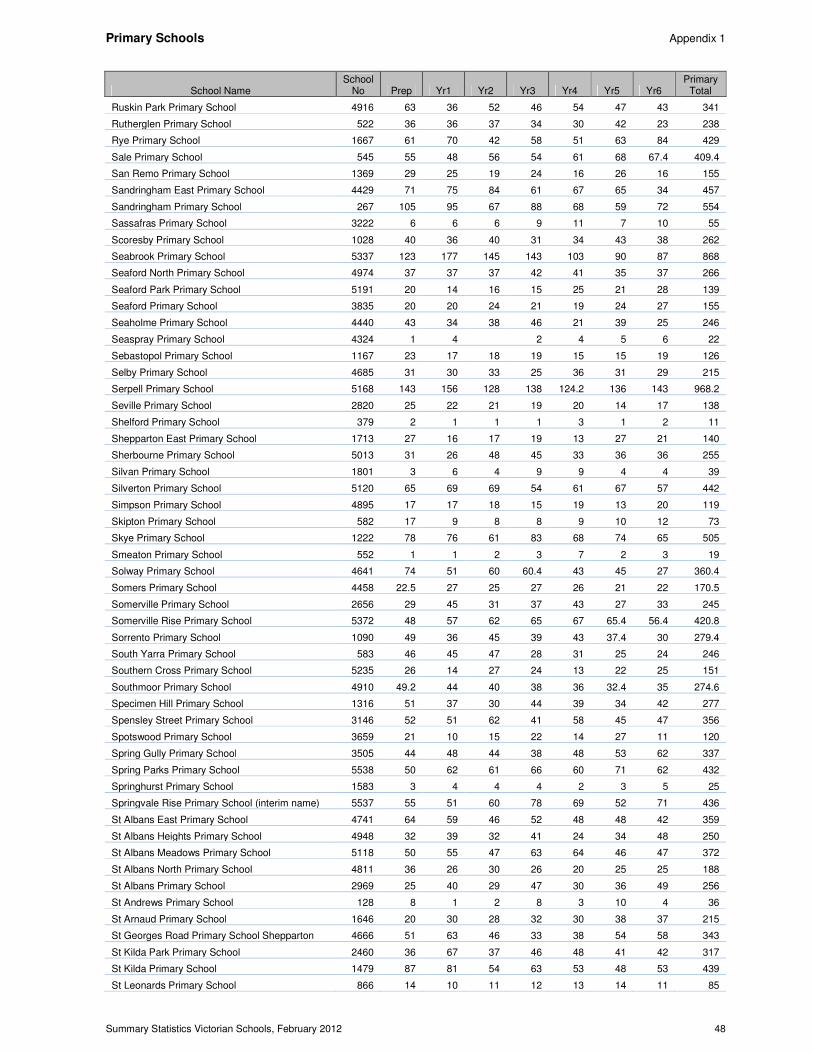
Primary Schools Appendix 1
Summary Statistics Victorian Schools, February 2012 48
School Name School
No Prep Yr1 Yr2 Yr3 Yr4 Yr5 Yr6 Primary
Total
Ruskin Park Primary School 4916 63 36 52 46 54 47 43 341
Rutherglen Primary School 522 36 36 37 34 30 42 23 238
Rye Primary School 1667 61 70 42 58 51 63 84 429
Sale Primary School 545 55 48 56 54 61 68 67.4 409.4
San Remo Primary School 1369 29 25 19 24 16 26 16 155
Sandringham East Primary School 4429 71 75 84 61 67 65 34 457
Sandringham Primary School 267 105 95 67 88 68 59 72 554
Sassafras Primary School 3222 6 6 6 9 11 7 10 55
Scoresby Primary School 1028 40 36 40 31 34 43 38 262
Seabrook Primary School 5337 123 177 145 143 103 90 87 868
Seaford North Primary School 4974 37 37 37 42 41 35 37 266
Seaford Park Primary School 5191 20 14 16 15 25 21 28 139
Seaford Primary School 3835 20 20 24 21 19 24 27 155
Seaholme Primary School 4440 43 34 38 46 21 39 25 246
Seaspray Primary School 4324 1 4 2 4 5 6 22
Sebastopol Primary School 1167 23 17 18 19 15 15 19 126
Selby Primary School 4685 31 30 33 25 36 31 29 215
Serpell Primary School 5168 143 156 128 138 124.2 136 143 968.2
Seville Primary School 2820 25 22 21 19 20 14 17 138
Shelford Primary School 379 2 1 1 1 3 1 2 11
Shepparton East Primary School 1713 27 16 17 19 13 27 21 140
Sherbourne Primary School 5013 31 26 48 45 33 36 36 255
Silvan Primary School 1801 3 6 4 9 9 4 4 39
Silverton Primary School 5120 65 69 69 54 61 67 57 442
Simpson Primary School 4895 17 17 18 15 19 13 20 119
Skipton Primary School 582 17 9 8 8 9 10 12 73
Skye Primary School 1222 78 76 61 83 68 74 65 505
Smeaton Primary School 552 1 1 2 3 7 2 3 19
Solway Primary School 4641 74 51 60 60.4 43 45 27 360.4
Somers Primary School 4458 22.5 27 25 27 26 21 22 170.5
Somerville Primary School 2656 29 45 31 37 43 27 33 245
Somerville Rise Primary School 5372 48 57 62 65 67 65.4 56.4 420.8
Sorrento Primary School 1090 49 36 45 39 43 37.4 30 279.4
South Yarra Primary School 583 46 45 47 28 31 25 24 246
Southern Cross Primary School 5235 26 14 27 24 13 22 25 151
Southmoor Primary School 4910 49.2 44 40 38 36 32.4 35 274.6
Specimen Hill Primary School 1316 51 37 30 44 39 34 42 277
Spensley Street Primary School 3146 52 51 62 41 58 45 47 356
Spotswood Primary School 3659 21 10 15 22 14 27 11 120
Spring Gully Primary School 3505 44 48 44 38 48 53 62 337
Spring Parks Primary School 5538 50 62 61 66 60 71 62 432
Springhurst Primary School 1583 3 4 4 4 2 3 5 25
Springvale Rise Primary School (interim name) 5537 55 51 60 78 69 52 71 436
St Albans East Primary School 4741 64 59 46 52 48 48 42 359
St Albans Heights Primary School 4948 32 39 32 41 24 34 48 250
St Albans Meadows Primary School 5118 50 55 47 63 64 46 47 372
St Albans North Primary School 4811 36 26 30 26 20 25 25 188
St Albans Primary School 2969 25 40 29 47 30 36 49 256
St Andrews Primary School 128 8 1 2 8 3 10 4 36
St Arnaud Primary School 1646 20 30 28 32 30 38 37 215
St Georges Road Primary School Shepparton 4666 51 63 46 33 38 54 58 343
St Kilda Park Primary School 2460 36 67 37 46 48 41 42 317
St Kilda Primary School 1479 87 81 54 63 53 48 53 439
St Leonards Primary School 866 14 10 11 12 13 14 11 85
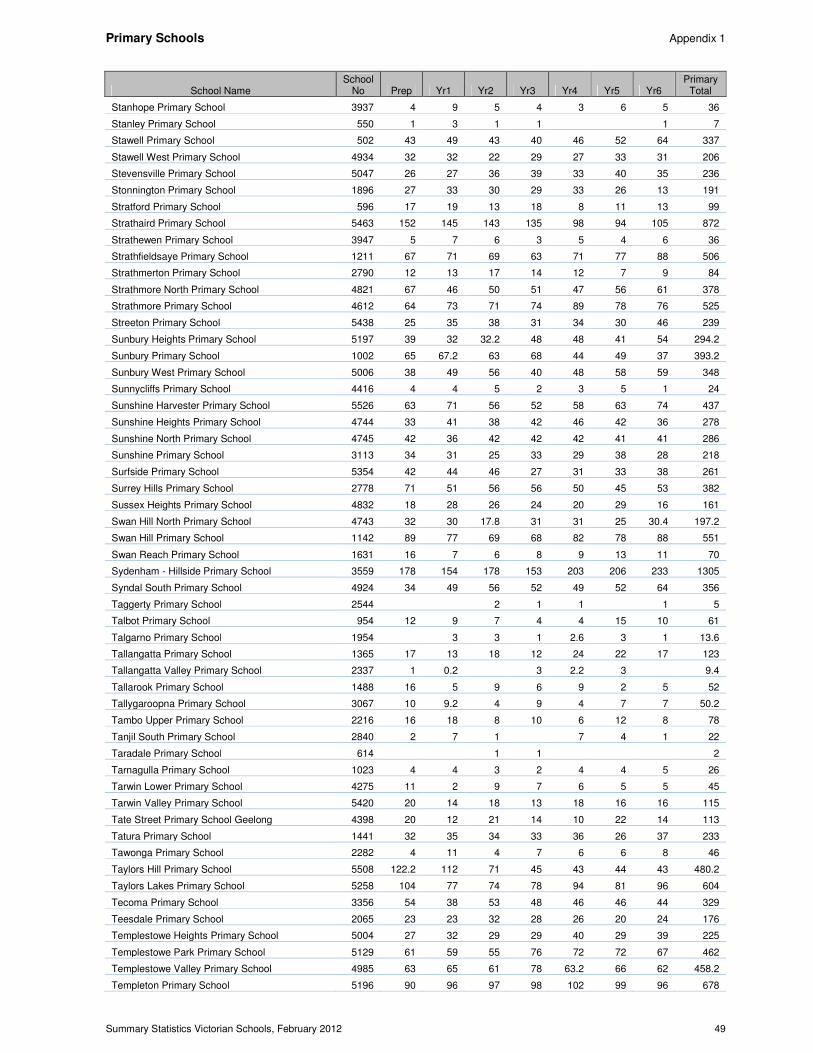
Primary Schools Appendix 1
Summary Statistics Victorian Schools, February 2012 49
School Name School
No Prep Yr1 Yr2 Yr3 Yr4 Yr5 Yr6 Primary
Total
Stanhope Primary School 3937 4 9 5 4 3 6 5 36
Stanley Primary School 550 1 3 1 1 1 7
Stawell Primary School 502 43 49 43 40 46 52 64 337
Stawell West Primary School 4934 32 32 22 29 27 33 31 206
Stevensville Primary School 5047 26 27 36 39 33 40 35 236
Stonnington Primary School 1896 27 33 30 29 33 26 13 191
Stratford Primary School 596 17 19 13 18 8 11 13 99
Strathaird Primary School 5463 152 145 143 135 98 94 105 872
Strathewen Primary School 3947 5 7 6 3 5 4 6 36
Strathfieldsaye Primary School 1211 67 71 69 63 71 77 88 506
Strathmerton Primary School 2790 12 13 17 14 12 7 9 84
Strathmore North Primary School 4821 67 46 50 51 47 56 61 378
Strathmore Primary School 4612 64 73 71 74 89 78 76 525
Streeton Primary School 5438 25 35 38 31 34 30 46 239
Sunbury Heights Primary School 5197 39 32 32.2 48 48 41 54 294.2
Sunbury Primary School 1002 65 67.2 63 68 44 49 37 393.2
Sunbury West Primary School 5006 38 49 56 40 48 58 59 348
Sunnycliffs Primary School 4416 4 4 5 2 3 5 1 24
Sunshine Harvester Primary School 5526 63 71 56 52 58 63 74 437
Sunshine Heights Primary School 4744 33 41 38 42 46 42 36 278
Sunshine North Primary School 4745 42 36 42 42 42 41 41 286
Sunshine Primary School 3113 34 31 25 33 29 38 28 218
Surfside Primary School 5354 42 44 46 27 31 33 38 261
Surrey Hills Primary School 2778 71 51 56 56 50 45 53 382
Sussex Heights Primary School 4832 18 28 26 24 20 29 16 161
Swan Hill North Primary School 4743 32 30 17.8 31 31 25 30.4 197.2
Swan Hill Primary School 1142 89 77 69 68 82 78 88 551
Swan Reach Primary School 1631 16 7 6 8 9 13 11 70
Sydenham - Hillside Primary School 3559 178 154 178 153 203 206 233 1305
Syndal South Primary School 4924 34 49 56 52 49 52 64 356
Taggerty Primary School 2544 2 1 1 1 5
Talbot Primary School 954 12 9 7 4 4 15 10 61
Talgarno Primary School 1954 3 3 1 2.6 3 1 13.6
Tallangatta Primary School 1365 17 13 18 12 24 22 17 123
Tallangatta Valley Primary School 2337 1 0.2 3 2.2 3 9.4
Tallarook Primary School 1488 16 5 9 6 9 2 5 52
Tallygaroopna Primary School 3067 10 9.2 4 9 4 7 7 50.2
Tambo Upper Primary School 2216 16 18 8 10 6 12 8 78
Tanjil South Primary School 2840 2 7 1 7 4 1 22
Taradale Primary School 614 1 1 2
Tarnagulla Primary School 1023 4 4 3 2 4 4 5 26
Tarwin Lower Primary School 4275 11 2 9 7 6 5 5 45
Tarwin Valley Primary School 5420 20 14 18 13 18 16 16 115
Tate Street Primary School Geelong 4398 20 12 21 14 10 22 14 113
Tatura Primary School 1441 32 35 34 33 36 26 37 233
Tawonga Primary School 2282 4 11 4 7 6 6 8 46
Taylors Hill Primary School 5508 122.2 112 71 45 43 44 43 480.2
Taylors Lakes Primary School 5258 104 77 74 78 94 81 96 604
Tecoma Primary School 3356 54 38 53 48 46 46 44 329
Teesdale Primary School 2065 23 23 32 28 26 20 24 176
Templestowe Heights Primary School 5004 27 32 29 29 40 29 39 225
Templestowe Park Primary School 5129 61 59 55 76 72 72 67 462
Templestowe Valley Primary School 4985 63 65 61 78 63.2 66 62 458.2
Templeton Primary School 5196 90 96 97 98 102 99 96 678
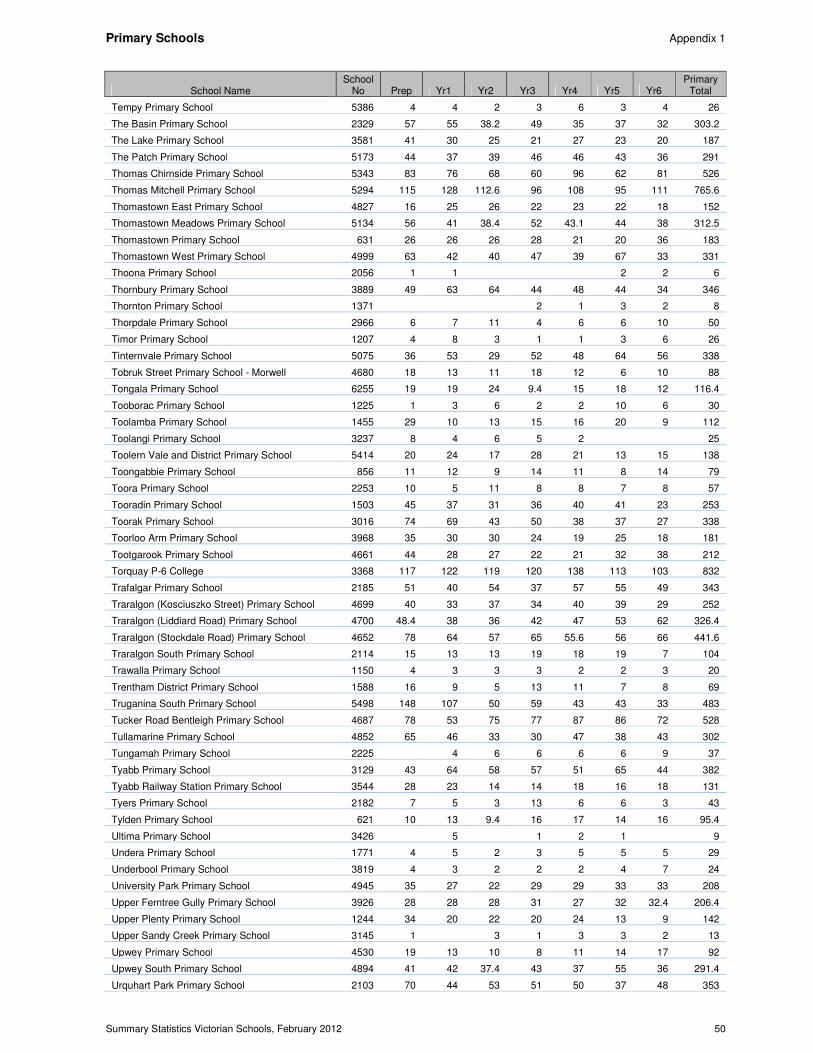
Primary Schools Appendix 1
Summary Statistics Victorian Schools, February 2012 50
School Name School
No Prep Yr1 Yr2 Yr3 Yr4 Yr5 Yr6 Primary
Total
Tempy Primary School 5386 4 4 2 3 6 3 4 26
The Basin Primary School 2329 57 55 38.2 49 35 37 32 303.2
The Lake Primary School 3581 41 30 25 21 27 23 20 187
The Patch Primary School 5173 44 37 39 46 46 43 36 291
Thomas Chirnside Primary School 5343 83 76 68 60 96 62 81 526
Thomas Mitchell Primary School 5294 115 128 112.6 96 108 95 111 765.6
Thomastown East Primary School 4827 16 25 26 22 23 22 18 152
Thomastown Meadows Primary School 5134 56 41 38.4 52 43.1 44 38 312.5
Thomastown Primary School 631 26 26 26 28 21 20 36 183
Thomastown West Primary School 4999 63 42 40 47 39 67 33 331
Thoona Primary School 2056 1 1 2 2 6
Thornbury Primary School 3889 49 63 64 44 48 44 34 346
Thornton Primary School 1371 2 1 3 2 8
Thorpdale Primary School 2966 6 7 11 4 6 6 10 50
Timor Primary School 1207 4 8 3 1 1 3 6 26
Tinternvale Primary School 5075 36 53 29 52 48 64 56 338
Tobruk Street Primary School - Morwell 4680 18 13 11 18 12 6 10 88
Tongala Primary School 6255 19 19 24 9.4 15 18 12 116.4
Tooborac Primary School 1225 1 3 6 2 2 10 6 30
Toolamba Primary School 1455 29 10 13 15 16 20 9 112
Toolangi Primary School 3237 8 4 6 5 2 25
Toolern Vale and District Primary School 5414 20 24 17 28 21 13 15 138
Toongabbie Primary School 856 11 12 9 14 11 8 14 79
Toora Primary School 2253 10 5 11 8 8 7 8 57
Tooradin Primary School 1503 45 37 31 36 40 41 23 253
Toorak Primary School 3016 74 69 43 50 38 37 27 338
Toorloo Arm Primary School 3968 35 30 30 24 19 25 18 181
Tootgarook Primary School 4661 44 28 27 22 21 32 38 212
Torquay P-6 College 3368 117 122 119 120 138 113 103 832
Trafalgar Primary School 2185 51 40 54 37 57 55 49 343
Traralgon (Kosciuszko Street) Primary School 4699 40 33 37 34 40 39 29 252
Traralgon (Liddiard Road) Primary School 4700 48.4 38 36 42 47 53 62 326.4
Traralgon (Stockdale Road) Primary School 4652 78 64 57 65 55.6 56 66 441.6
Traralgon South Primary School 2114 15 13 13 19 18 19 7 104
Trawalla Primary School 1150 4 3 3 3 2 2 3 20
Trentham District Primary School 1588 16 9 5 13 11 7 8 69
Truganina South Primary School 5498 148 107 50 59 43 43 33 483
Tucker Road Bentleigh Primary School 4687 78 53 75 77 87 86 72 528
Tullamarine Primary School 4852 65 46 33 30 47 38 43 302
Tungamah Primary School 2225 4 6 6 6 6 9 37
Tyabb Primary School 3129 43 64 58 57 51 65 44 382
Tyabb Railway Station Primary School 3544 28 23 14 14 18 16 18 131
Tyers Primary School 2182 7 5 3 13 6 6 3 43
Tylden Primary School 621 10 13 9.4 16 17 14 16 95.4
Ultima Primary School 3426 5 1 2 1 9
Undera Primary School 1771 4 5 2 3 5 5 5 29
Underbool Primary School 3819 4 3 2 2 2 4 7 24
University Park Primary School 4945 35 27 22 29 29 33 33 208
Upper Ferntree Gully Primary School 3926 28 28 28 31 27 32 32.4 206.4
Upper Plenty Primary School 1244 34 20 22 20 24 13 9 142
Upper Sandy Creek Primary School 3145 1 3 1 3 3 2 13
Upwey Primary School 4530 19 13 10 8 11 14 17 92
Upwey South Primary School 4894 41 42 37.4 43 37 55 36 291.4
Urquhart Park Primary School 2103 70 44 53 51 50 37 48 353
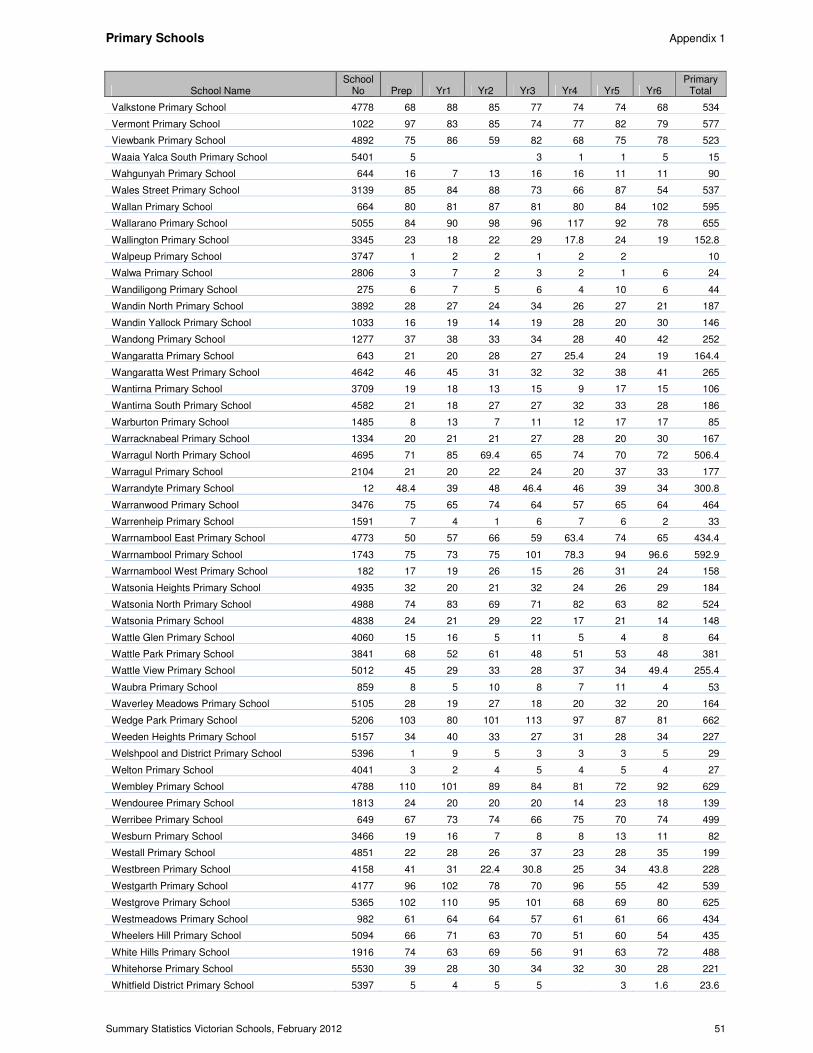
Primary Schools Appendix 1
Summary Statistics Victorian Schools, February 2012 51
School Name School
No Prep Yr1 Yr2 Yr3 Yr4 Yr5 Yr6 Primary
Total
Valkstone Primary School 4778 68 88 85 77 74 74 68 534
Vermont Primary School 1022 97 83 85 74 77 82 79 577
Viewbank Primary School 4892 75 86 59 82 68 75 78 523
Waaia Yalca South Primary School 5401 5 3 1 1 5 15
Wahgunyah Primary School 644 16 7 13 16 16 11 11 90
Wales Street Primary School 3139 85 84 88 73 66 87 54 537
Wallan Primary School 664 80 81 87 81 80 84 102 595
Wallarano Primary School 5055 84 90 98 96 117 92 78 655
Wallington Primary School 3345 23 18 22 29 17.8 24 19 152.8
Walpeup Primary School 3747 1 2 2 1 2 2 10
Walwa Primary School 2806 3 7 2 3 2 1 6 24
Wandiligong Primary School 275 6 7 5 6 4 10 6 44
Wandin North Primary School 3892 28 27 24 34 26 27 21 187
Wandin Yallock Primary School 1033 16 19 14 19 28 20 30 146
Wandong Primary School 1277 37 38 33 34 28 40 42 252
Wangaratta Primary School 643 21 20 28 27 25.4 24 19 164.4
Wangaratta West Primary School 4642 46 45 31 32 32 38 41 265
Wantirna Primary School 3709 19 18 13 15 9 17 15 106
Wantirna South Primary School 4582 21 18 27 27 32 33 28 186
Warburton Primary School 1485 8 13 7 11 12 17 17 85
Warracknabeal Primary School 1334 20 21 21 27 28 20 30 167
Warragul North Primary School 4695 71 85 69.4 65 74 70 72 506.4
Warragul Primary School 2104 21 20 22 24 20 37 33 177
Warrandyte Primary School 12 48.4 39 48 46.4 46 39 34 300.8
Warranwood Primary School 3476 75 65 74 64 57 65 64 464
Warrenheip Primary School 1591 7 4 1 6 7 6 2 33
Warrnambool East Primary School 4773 50 57 66 59 63.4 74 65 434.4
Warrnambool Primary School 1743 75 73 75 101 78.3 94 96.6 592.9
Warrnambool West Primary School 182 17 19 26 15 26 31 24 158
Watsonia Heights Primary School 4935 32 20 21 32 24 26 29 184
Watsonia North Primary School 4988 74 83 69 71 82 63 82 524
Watsonia Primary School 4838 24 21 29 22 17 21 14 148
Wattle Glen Primary School 4060 15 16 5 11 5 4 8 64
Wattle Park Primary School 3841 68 52 61 48 51 53 48 381
Wattle View Primary School 5012 45 29 33 28 37 34 49.4 255.4
Waubra Primary School 859 8 5 10 8 7 11 4 53
Waverley Meadows Primary School 5105 28 19 27 18 20 32 20 164
Wedge Park Primary School 5206 103 80 101 113 97 87 81 662
Weeden Heights Primary School 5157 34 40 33 27 31 28 34 227
Welshpool and District Primary School 5396 1 9 5 3 3 3 5 29
Welton Primary School 4041 3 2 4 5 4 5 4 27
Wembley Primary School 4788 110 101 89 84 81 72 92 629
Wendouree Primary School 1813 24 20 20 20 14 23 18 139
Werribee Primary School 649 67 73 74 66 75 70 74 499
Wesburn Primary School 3466 19 16 7 8 8 13 11 82
Westall Primary School 4851 22 28 26 37 23 28 35 199
Westbreen Primary School 4158 41 31 22.4 30.8 25 34 43.8 228
Westgarth Primary School 4177 96 102 78 70 96 55 42 539
Westgrove Primary School 5365 102 110 95 101 68 69 80 625
Westmeadows Primary School 982 61 64 64 57 61 61 66 434
Wheelers Hill Primary School 5094 66 71 63 70 51 60 54 435
White Hills Primary School 1916 74 63 69 56 91 63 72 488
Whitehorse Primary School 5530 39 28 30 34 32 30 28 221
Whitfield District Primary School 5397 5 4 5 5 3 1.6 23.6
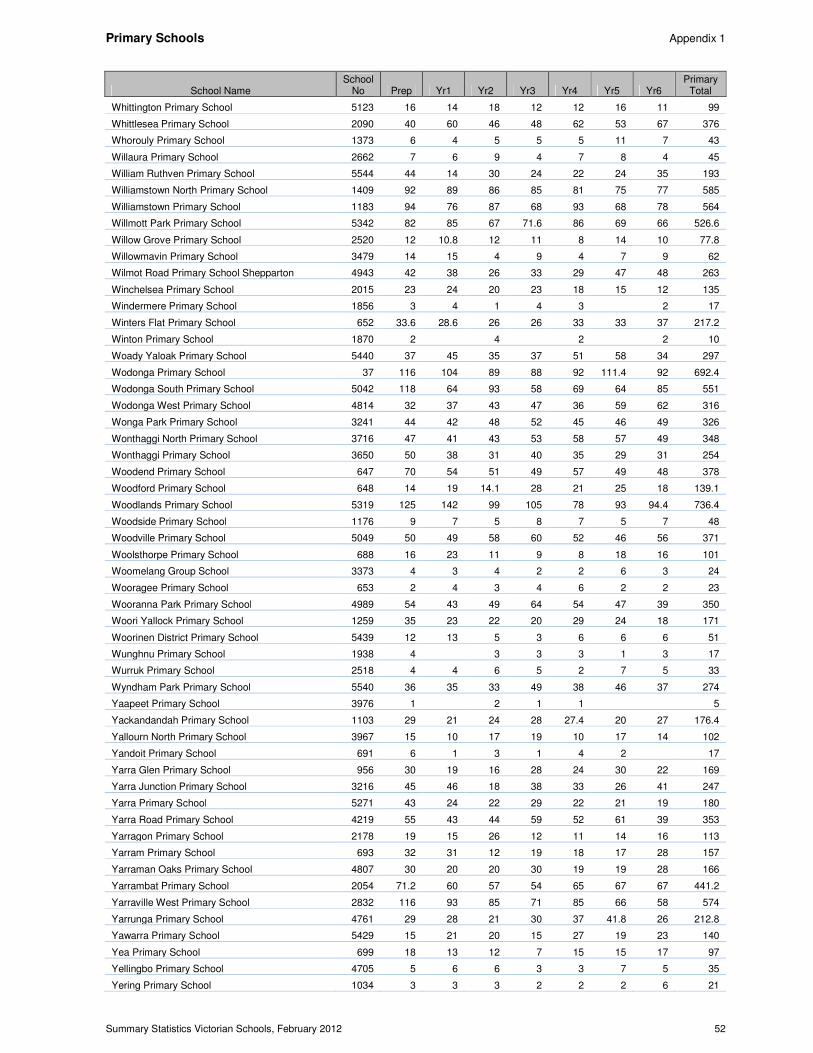
Primary Schools Appendix 1
Summary Statistics Victorian Schools, February 2012 52
School Name School
No Prep Yr1 Yr2 Yr3 Yr4 Yr5 Yr6 Primary
Total
Whittington Primary School 5123 16 14 18 12 12 16 11 99
Whittlesea Primary School 2090 40 60 46 48 62 53 67 376
Whorouly Primary School 1373 6 4 5 5 5 11 7 43
Willaura Primary School 2662 7 6 9 4 7 8 4 45
William Ruthven Primary School 5544 44 14 30 24 22 24 35 193
Williamstown North Primary School 1409 92 89 86 85 81 75 77 585
Williamstown Primary School 1183 94 76 87 68 93 68 78 564
Willmott Park Primary School 5342 82 85 67 71.6 86 69 66 526.6
Willow Grove Primary School 2520 12 10.8 12 11 8 14 10 77.8
Willowmavin Primary School 3479 14 15 4 9 4 7 9 62
Wilmot Road Primary School Shepparton 4943 42 38 26 33 29 47 48 263
Winchelsea Primary School 2015 23 24 20 23 18 15 12 135
Windermere Primary School 1856 3 4 1 4 3 2 17
Winters Flat Primary School 652 33.6 28.6 26 26 33 33 37 217.2
Winton Primary School 1870 2 4 2 2 10
Woady Yaloak Primary School 5440 37 45 35 37 51 58 34 297
Wodonga Primary School 37 116 104 89 88 92 111.4 92 692.4
Wodonga South Primary School 5042 118 64 93 58 69 64 85 551
Wodonga West Primary School 4814 32 37 43 47 36 59 62 316
Wonga Park Primary School 3241 44 42 48 52 45 46 49 326
Wonthaggi North Primary School 3716 47 41 43 53 58 57 49 348
Wonthaggi Primary School 3650 50 38 31 40 35 29 31 254
Woodend Primary School 647 70 54 51 49 57 49 48 378
Woodford Primary School 648 14 19 14.1 28 21 25 18 139.1
Woodlands Primary School 5319 125 142 99 105 78 93 94.4 736.4
Woodside Primary School 1176 9 7 5 8 7 5 7 48
Woodville Primary School 5049 50 49 58 60 52 46 56 371
Woolsthorpe Primary School 688 16 23 11 9 8 18 16 101
Woomelang Group School 3373 4 3 4 2 2 6 3 24
Wooragee Primary School 653 2 4 3 4 6 2 2 23
Wooranna Park Primary School 4989 54 43 49 64 54 47 39 350
Woori Yallock Primary School 1259 35 23 22 20 29 24 18 171
Woorinen District Primary School 5439 12 13 5 3 6 6 6 51
Wunghnu Primary School 1938 4 3 3 3 1 3 17
Wurruk Primary School 2518 4 4 6 5 2 7 5 33
Wyndham Park Primary School 5540 36 35 33 49 38 46 37 274
Yaapeet Primary School 3976 1 2 1 1 5
Yackandandah Primary School 1103 29 21 24 28 27.4 20 27 176.4
Yallourn North Primary School 3967 15 10 17 19 10 17 14 102
Yandoit Primary School 691 6 1 3 1 4 2 17
Yarra Glen Primary School 956 30 19 16 28 24 30 22 169
Yarra Junction Primary School 3216 45 46 18 38 33 26 41 247
Yarra Primary School 5271 43 24 22 29 22 21 19 180
Yarra Road Primary School 4219 55 43 44 59 52 61 39 353
Yarragon Primary School 2178 19 15 26 12 11 14 16 113
Yarram Primary School 693 32 31 12 19 18 17 28 157
Yarraman Oaks Primary School 4807 30 20 20 30 19 19 28 166
Yarrambat Primary School 2054 71.2 60 57 54 65 67 67 441.2
Yarraville West Primary School 2832 116 93 85 71 85 66 58 574
Yarrunga Primary School 4761 29 28 21 30 37 41.8 26 212.8
Yawarra Primary School 5429 15 21 20 15 27 19 23 140
Yea Primary School 699 18 13 12 7 15 15 17 97
Yellingbo Primary School 4705 5 6 6 3 3 7 5 35
Yering Primary School 1034 3 3 3 2 2 2 6 21
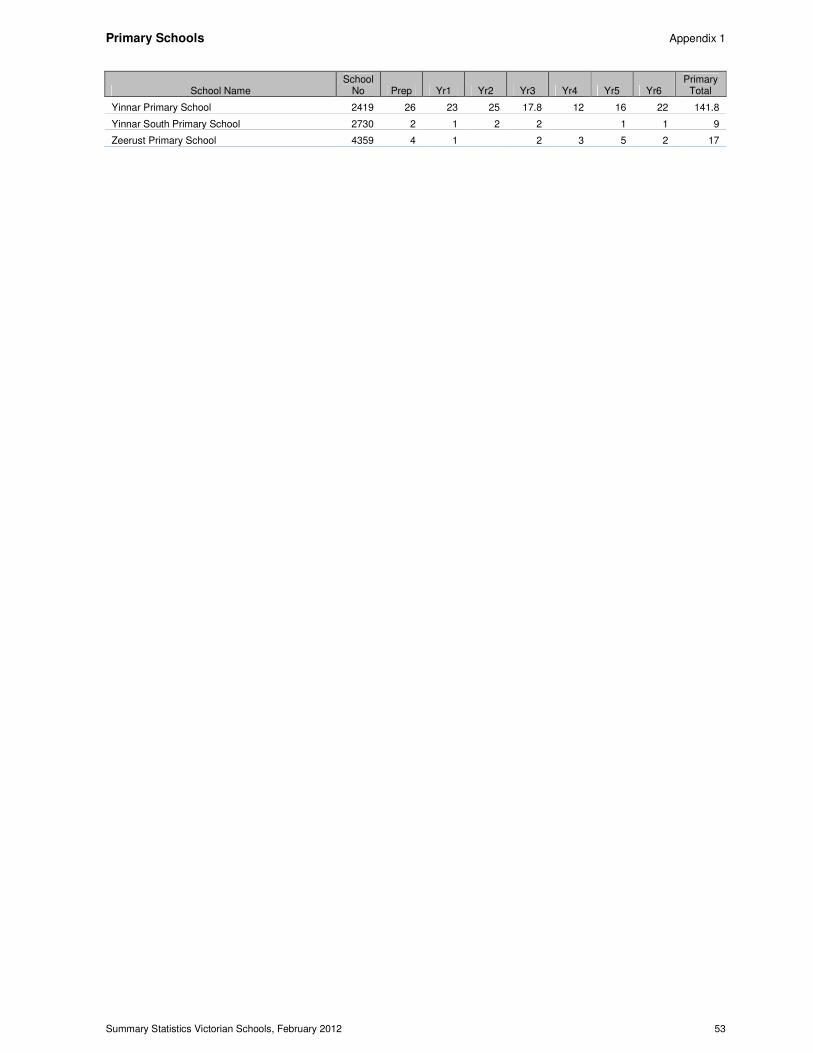
Primary Schools Appendix 1
Summary Statistics Victorian Schools, February 2012 53
School Name School
No Prep Yr1 Yr2 Yr3 Yr4 Yr5 Yr6 Primary
Total
Yinnar Primary School 2419 26 23 25 17.8 12 16 22 141.8
Yinnar South Primary School 2730 2 1 2 2 1 1 9
Zeerust Primary School 4359 4 1 2 3 5 2 17
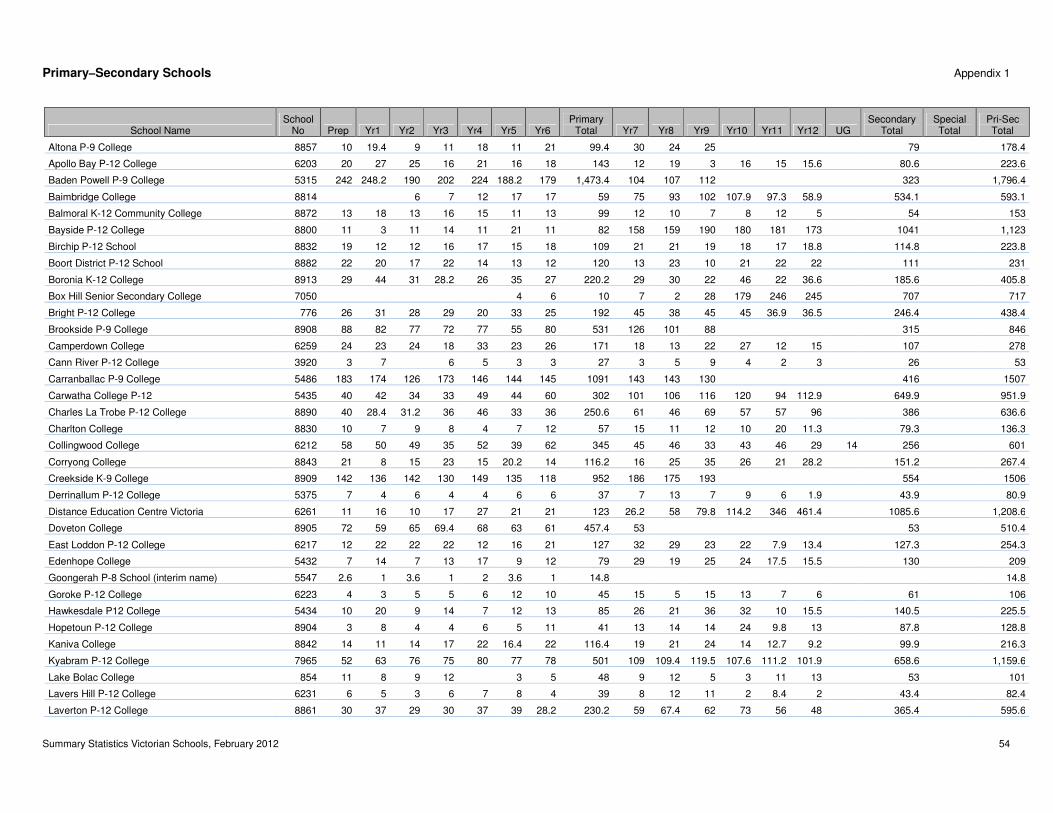
Primary–Secondary Schools Appendix 1
Summary Statistics Victorian Schools, February 2012 54
School Name School
No Prep Yr1 Yr2 Yr3 Yr4 Yr5 Yr6 Primary
Total Yr7 Yr8 Yr9 Yr10 Yr11 Yr12 UG Secondary
Total Special Total
Pri-Sec Total
Altona P-9 College 8857 10 19.4 9 11 18 11 21 99.4 30 24 25 79 178.4
Apollo Bay P-12 College 6203 20 27 25 16 21 16 18 143 12 19 3 16 15 15.6 80.6 223.6
Baden Powell P-9 College 5315 242 248.2 190 202 224 188.2 179 1,473.4 104 107 112 323 1,796.4
Baimbridge College 8814 6 7 12 17 17 59 75 93 102 107.9 97.3 58.9 534.1 593.1
Balmoral K-12 Community College 8872 13 18 13 16 15 11 13 99 12 10 7 8 12 5 54 153
Bayside P-12 College 8800 11 3 11 14 11 21 11 82 158 159 190 180 181 173 1041 1,123
Birchip P-12 School 8832 19 12 12 16 17 15 18 109 21 21 19 18 17 18.8 114.8 223.8
Boort District P-12 School 8882 22 20 17 22 14 13 12 120 13 23 10 21 22 22 111 231
Boronia K-12 College 8913 29 44 31 28.2 26 35 27 220.2 29 30 22 46 22 36.6 185.6 405.8
Box Hill Senior Secondary College 7050 4 6 10 7 2 28 179 246 245 707 717
Bright P-12 College 776 26 31 28 29 20 33 25 192 45 38 45 45 36.9 36.5 246.4 438.4
Brookside P-9 College 8908 88 82 77 72 77 55 80 531 126 101 88 315 846
Camperdown College 6259 24 23 24 18 33 23 26 171 18 13 22 27 12 15 107 278
Cann River P-12 College 3920 3 7 6 5 3 3 27 3 5 9 4 2 3 26 53
Carranballac P-9 College 5486 183 174 126 173 146 144 145 1091 143 143 130 416 1507
Carwatha College P-12 5435 40 42 34 33 49 44 60 302 101 106 116 120 94 112.9 649.9 951.9
Charles La Trobe P-12 College 8890 40 28.4 31.2 36 46 33 36 250.6 61 46 69 57 57 96 386 636.6
Charlton College 8830 10 7 9 8 4 7 12 57 15 11 12 10 20 11.3 79.3 136.3
Collingwood College 6212 58 50 49 35 52 39 62 345 45 46 33 43 46 29 14 256 601
Corryong College 8843 21 8 15 23 15 20.2 14 116.2 16 25 35 26 21 28.2 151.2 267.4
Creekside K-9 College 8909 142 136 142 130 149 135 118 952 186 175 193 554 1506
Derrinallum P-12 College 5375 7 4 6 4 4 6 6 37 7 13 7 9 6 1.9 43.9 80.9
Distance Education Centre Victoria 6261 11 16 10 17 27 21 21 123 26.2 58 79.8 114.2 346 461.4 1085.6 1,208.6
Doveton College 8905 72 59 65 69.4 68 63 61 457.4 53 53 510.4
East Loddon P-12 College 6217 12 22 22 22 12 16 21 127 32 29 23 22 7.9 13.4 127.3 254.3
Edenhope College 5432 7 14 7 13 17 9 12 79 29 19 25 24 17.5 15.5 130 209
Goongerah P-8 School (interim name) 5547 2.6 1 3.6 1 2 3.6 1 14.8 14.8
Goroke P-12 College 6223 4 3 5 5 6 12 10 45 15 5 15 13 7 6 61 106
Hawkesdale P12 College 5434 10 20 9 14 7 12 13 85 26 21 36 32 10 15.5 140.5 225.5
Hopetoun P-12 College 8904 3 8 4 4 6 5 11 41 13 14 14 24 9.8 13 87.8 128.8
Kaniva College 8842 14 11 14 17 22 16.4 22 116.4 19 21 24 14 12.7 9.2 99.9 216.3
Kyabram P-12 College 7965 52 63 76 75 80 77 78 501 109 109.4 119.5 107.6 111.2 101.9 658.6 1,159.6
Lake Bolac College 854 11 8 9 12 3 5 48 9 12 5 3 11 13 53 101
Lavers Hill P-12 College 6231 6 5 3 6 7 8 4 39 8 12 11 2 8.4 2 43.4 82.4
Laverton P-12 College 8861 30 37 29 30 37 39 28.2 230.2 59 67.4 62 73 56 48 365.4 595.6
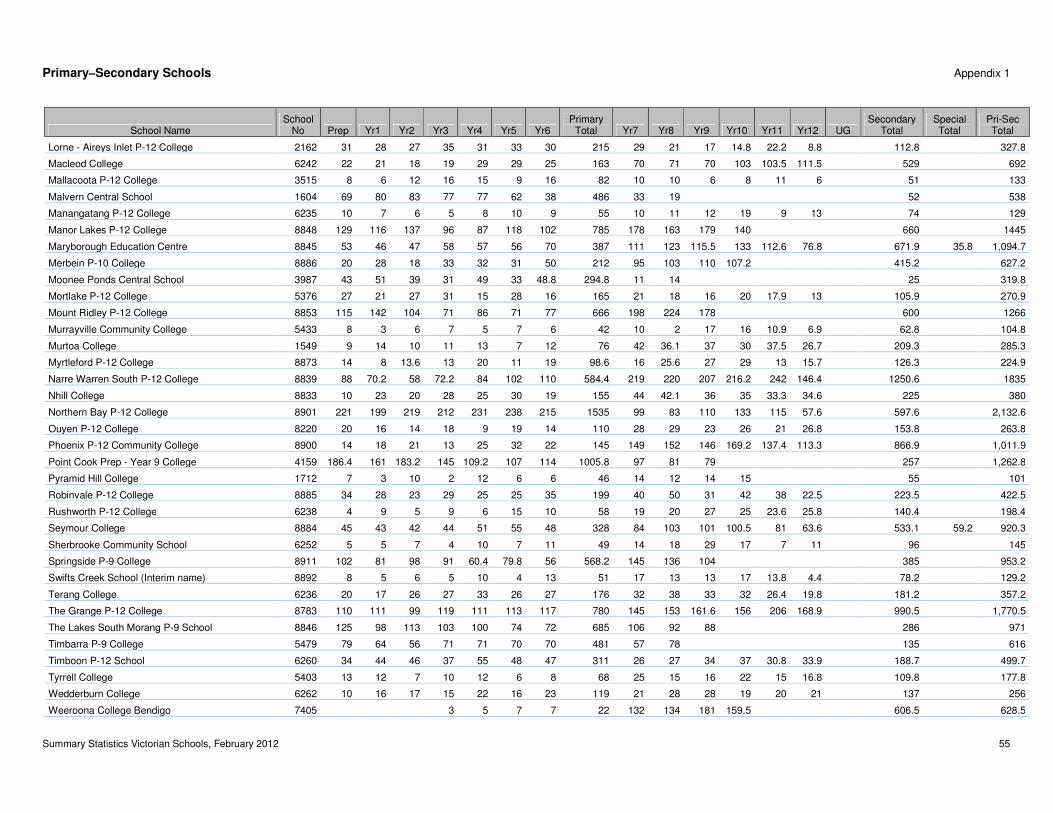
Primary–Secondary Schools Appendix 1
Summary Statistics Victorian Schools, February 2012 55
School Name School
No Prep Yr1 Yr2 Yr3 Yr4 Yr5 Yr6 Primary
Total Yr7 Yr8 Yr9 Yr10 Yr11 Yr12 UG Secondary
Total Special Total
Pri-Sec Total
Lorne - Aireys Inlet P-12 College 2162 31 28 27 35 31 33 30 215 29 21 17 14.8 22.2 8.8 112.8 327.8
Macleod College 6242 22 21 18 19 29 29 25 163 70 71 70 103 103.5 111.5 529 692
Mallacoota P-12 College 3515 8 6 12 16 15 9 16 82 10 10 6 8 11 6 51 133
Malvern Central School 1604 69 80 83 77 77 62 38 486 33 19 52 538
Manangatang P-12 College 6235 10 7 6 5 8 10 9 55 10 11 12 19 9 13 74 129
Manor Lakes P-12 College 8848 129 116 137 96 87 118 102 785 178 163 179 140 660 1445
Maryborough Education Centre 8845 53 46 47 58 57 56 70 387 111 123 115.5 133 112.6 76.8 671.9 35.8 1,094.7
Merbein P-10 College 8886 20 28 18 33 32 31 50 212 95 103 110 107.2 415.2 627.2
Moonee Ponds Central School 3987 43 51 39 31 49 33 48.8 294.8 11 14 25 319.8
Mortlake P-12 College 5376 27 21 27 31 15 28 16 165 21 18 16 20 17.9 13 105.9 270.9
Mount Ridley P-12 College 8853 115 142 104 71 86 71 77 666 198 224 178 600 1266
Murrayville Community College 5433 8 3 6 7 5 7 6 42 10 2 17 16 10.9 6.9 62.8 104.8
Murtoa College 1549 9 14 10 11 13 7 12 76 42 36.1 37 30 37.5 26.7 209.3 285.3
Myrtleford P-12 College 8873 14 8 13.6 13 20 11 19 98.6 16 25.6 27 29 13 15.7 126.3 224.9
Narre Warren South P-12 College 8839 88 70.2 58 72.2 84 102 110 584.4 219 220 207 216.2 242 146.4 1250.6 1835
Nhill College 8833 10 23 20 28 25 30 19 155 44 42.1 36 35 33.3 34.6 225 380
Northern Bay P-12 College 8901 221 199 219 212 231 238 215 1535 99 83 110 133 115 57.6 597.6 2,132.6
Ouyen P-12 College 8220 20 16 14 18 9 19 14 110 28 29 23 26 21 26.8 153.8 263.8
Phoenix P-12 Community College 8900 14 18 21 13 25 32 22 145 149 152 146 169.2 137.4 113.3 866.9 1,011.9
Point Cook Prep - Year 9 College 4159 186.4 161 183.2 145 109.2 107 114 1005.8 97 81 79 257 1,262.8
Pyramid Hill College 1712 7 3 10 2 12 6 6 46 14 12 14 15 55 101
Robinvale P-12 College 8885 34 28 23 29 25 25 35 199 40 50 31 42 38 22.5 223.5 422.5
Rushworth P-12 College 6238 4 9 5 9 6 15 10 58 19 20 27 25 23.6 25.8 140.4 198.4
Seymour College 8884 45 43 42 44 51 55 48 328 84 103 101 100.5 81 63.6 533.1 59.2 920.3
Sherbrooke Community School 6252 5 5 7 4 10 7 11 49 14 18 29 17 7 11 96 145
Springside P-9 College 8911 102 81 98 91 60.4 79.8 56 568.2 145 136 104 385 953.2
Swifts Creek School (Interim name) 8892 8 5 6 5 10 4 13 51 17 13 13 17 13.8 4.4 78.2 129.2
Terang College 6236 20 17 26 27 33 26 27 176 32 38 33 32 26.4 19.8 181.2 357.2
The Grange P-12 College 8783 110 111 99 119 111 113 117 780 145 153 161.6 156 206 168.9 990.5 1,770.5
The Lakes South Morang P-9 School 8846 125 98 113 103 100 74 72 685 106 92 88 286 971
Timbarra P-9 College 5479 79 64 56 71 71 70 70 481 57 78 135 616
Timboon P-12 School 6260 34 44 46 37 55 48 47 311 26 27 34 37 30.8 33.9 188.7 499.7
Tyrrell College 5403 13 12 7 10 12 6 8 68 25 15 16 22 15 16.8 109.8 177.8
Wedderburn College 6262 10 16 17 15 22 16 23 119 21 28 28 19 20 21 137 256
Weeroona College Bendigo 7405 3 5 7 7 22 132 134 181 159.5 606.5 628.5
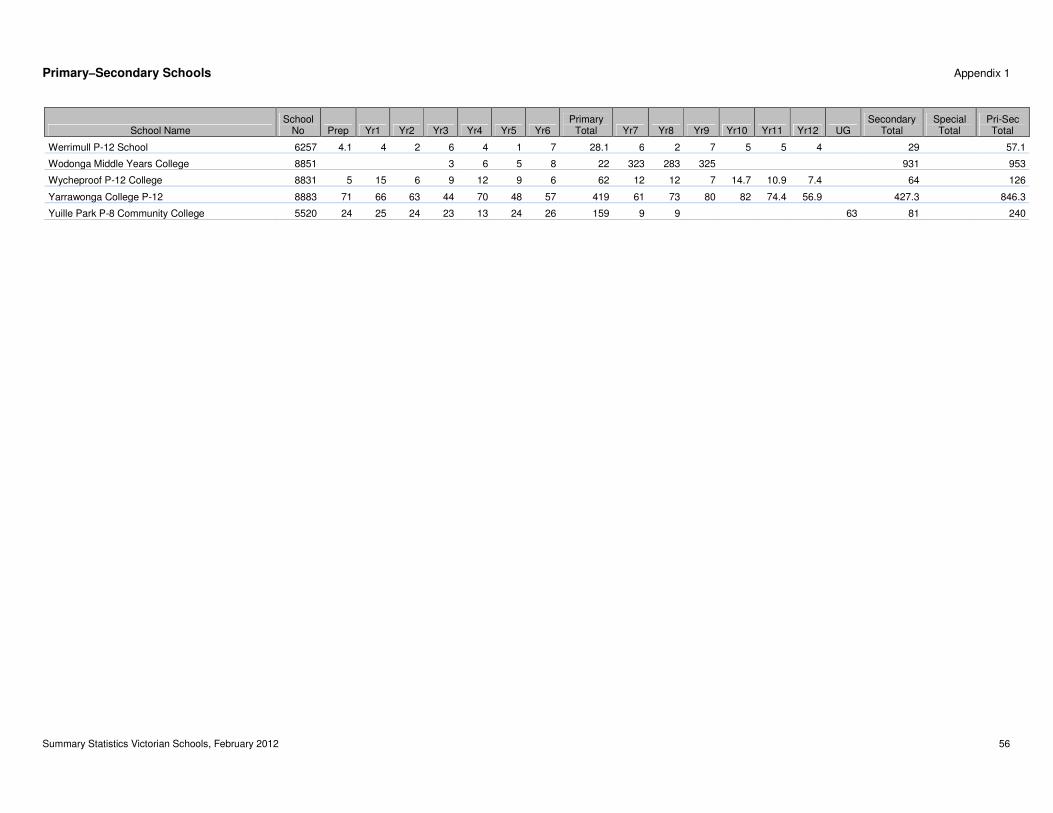
Primary–Secondary Schools Appendix 1
Summary Statistics Victorian Schools, February 2012 56
School Name School
No Prep Yr1 Yr2 Yr3 Yr4 Yr5 Yr6 Primary
Total Yr7 Yr8 Yr9 Yr10 Yr11 Yr12 UG Secondary
Total Special Total
Pri-Sec Total
Werrimull P-12 School 6257 4.1 4 2 6 4 1 7 28.1 6 2 7 5 5 4 29 57.1
Wodonga Middle Years College 8851 3 6 5 8 22 323 283 325 931 953
Wycheproof P-12 College 8831 5 15 6 9 12 9 6 62 12 12 7 14.7 10.9 7.4 64 126
Yarrawonga College P-12 8883 71 66 63 44 70 48 57 419 61 73 80 82 74.4 56.9 427.3 846.3
Yuille Park P-8 Community College 5520 24 25 24 23 13 24 26 159 9 9 63 81 240
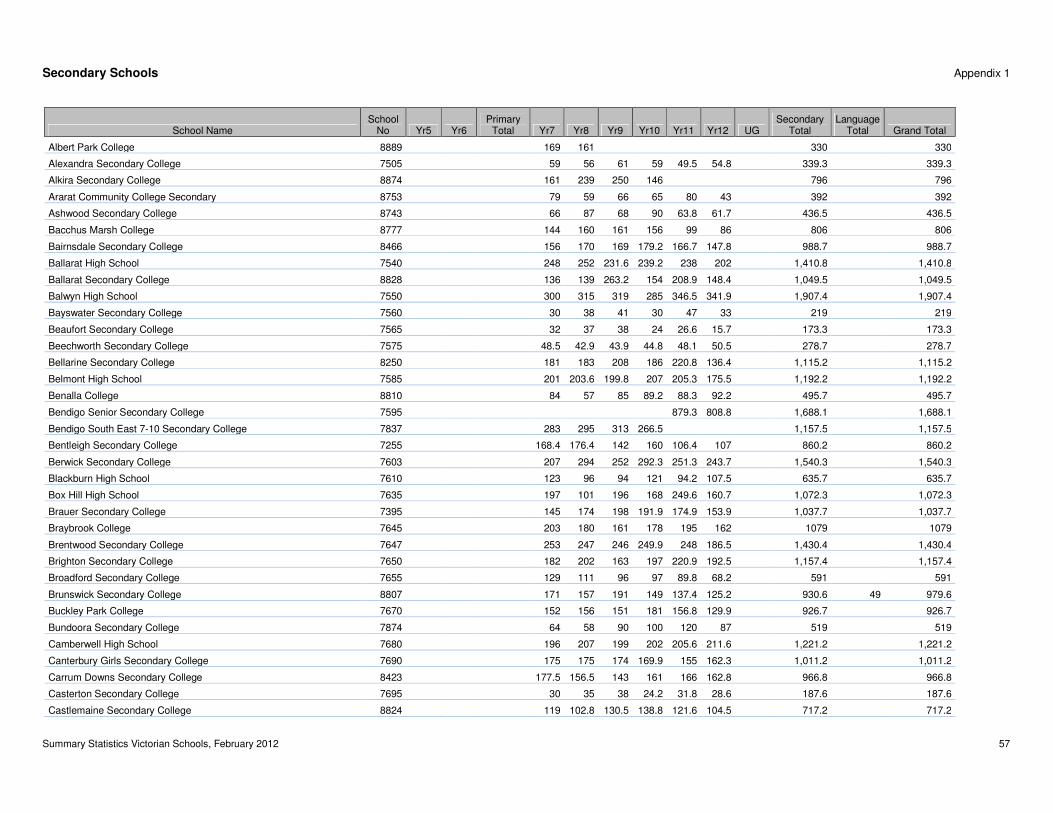
Secondary Schools Appendix 1
Summary Statistics Victorian Schools, February 2012 57
School Name School
No Yr5 Yr6 Primary
Total Yr7 Yr8 Yr9 Yr10 Yr11 Yr12 UG Secondary
Total Language
Total Grand Total
Albert Park College 8889 169 161 330 330
Alexandra Secondary College 7505 59 56 61 59 49.5 54.8 339.3 339.3
Alkira Secondary College 8874 161 239 250 146 796 796
Ararat Community College Secondary 8753 79 59 66 65 80 43 392 392
Ashwood Secondary College 8743 66 87 68 90 63.8 61.7 436.5 436.5
Bacchus Marsh College 8777 144 160 161 156 99 86 806 806
Bairnsdale Secondary College 8466 156 170 169 179.2 166.7 147.8 988.7 988.7
Ballarat High School 7540 248 252 231.6 239.2 238 202 1,410.8 1,410.8
Ballarat Secondary College 8828 136 139 263.2 154 208.9 148.4 1,049.5 1,049.5
Balwyn High School 7550 300 315 319 285 346.5 341.9 1,907.4 1,907.4
Bayswater Secondary College 7560 30 38 41 30 47 33 219 219
Beaufort Secondary College 7565 32 37 38 24 26.6 15.7 173.3 173.3
Beechworth Secondary College 7575 48.5 42.9 43.9 44.8 48.1 50.5 278.7 278.7
Bellarine Secondary College 8250 181 183 208 186 220.8 136.4 1,115.2 1,115.2
Belmont High School 7585 201 203.6 199.8 207 205.3 175.5 1,192.2 1,192.2
Benalla College 8810 84 57 85 89.2 88.3 92.2 495.7 495.7
Bendigo Senior Secondary College 7595 879.3 808.8 1,688.1 1,688.1
Bendigo South East 7-10 Secondary College 7837 283 295 313 266.5 1,157.5 1,157.5
Bentleigh Secondary College 7255 168.4 176.4 142 160 106.4 107 860.2 860.2
Berwick Secondary College 7603 207 294 252 292.3 251.3 243.7 1,540.3 1,540.3
Blackburn High School 7610 123 96 94 121 94.2 107.5 635.7 635.7
Box Hill High School 7635 197 101 196 168 249.6 160.7 1,072.3 1,072.3
Brauer Secondary College 7395 145 174 198 191.9 174.9 153.9 1,037.7 1,037.7
Braybrook College 7645 203 180 161 178 195 162 1079 1079
Brentwood Secondary College 7647 253 247 246 249.9 248 186.5 1,430.4 1,430.4
Brighton Secondary College 7650 182 202 163 197 220.9 192.5 1,157.4 1,157.4
Broadford Secondary College 7655 129 111 96 97 89.8 68.2 591 591
Brunswick Secondary College 8807 171 157 191 149 137.4 125.2 930.6 49 979.6
Buckley Park College 7670 152 156 151 181 156.8 129.9 926.7 926.7
Bundoora Secondary College 7874 64 58 90 100 120 87 519 519
Camberwell High School 7680 196 207 199 202 205.6 211.6 1,221.2 1,221.2
Canterbury Girls Secondary College 7690 175 175 174 169.9 155 162.3 1,011.2 1,011.2
Carrum Downs Secondary College 8423 177.5 156.5 143 161 166 162.8 966.8 966.8
Casterton Secondary College 7695 30 35 38 24.2 31.8 28.6 187.6 187.6
Castlemaine Secondary College 8824 119 102.8 130.5 138.8 121.6 104.5 717.2 717.2
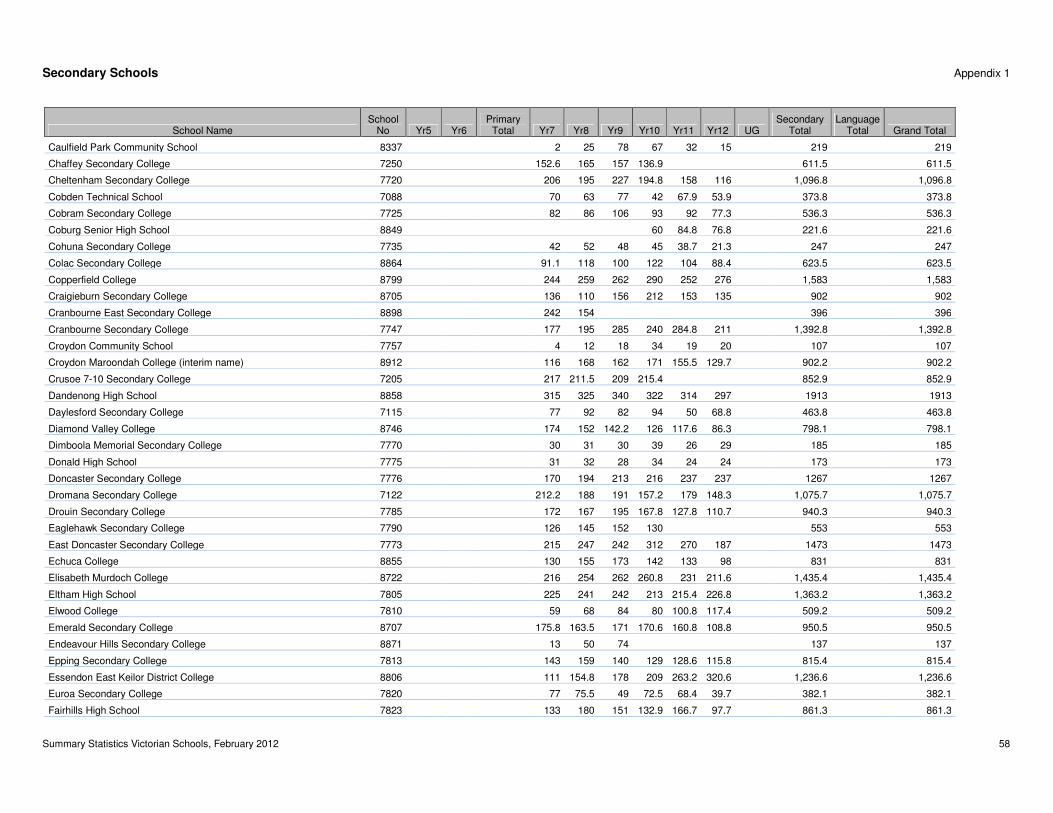
Secondary Schools Appendix 1
Summary Statistics Victorian Schools, February 2012 58
School Name School
No Yr5 Yr6 Primary
Total Yr7 Yr8 Yr9 Yr10 Yr11 Yr12 UG Secondary
Total Language
Total Grand Total
Caulfield Park Community School 8337 2 25 78 67 32 15 219 219
Chaffey Secondary College 7250 152.6 165 157 136.9 611.5 611.5
Cheltenham Secondary College 7720 206 195 227 194.8 158 116 1,096.8 1,096.8
Cobden Technical School 7088 70 63 77 42 67.9 53.9 373.8 373.8
Cobram Secondary College 7725 82 86 106 93 92 77.3 536.3 536.3
Coburg Senior High School 8849 60 84.8 76.8 221.6 221.6
Cohuna Secondary College 7735 42 52 48 45 38.7 21.3 247 247
Colac Secondary College 8864 91.1 118 100 122 104 88.4 623.5 623.5
Copperfield College 8799 244 259 262 290 252 276 1,583 1,583
Craigieburn Secondary College 8705 136 110 156 212 153 135 902 902
Cranbourne East Secondary College 8898 242 154 396 396
Cranbourne Secondary College 7747 177 195 285 240 284.8 211 1,392.8 1,392.8
Croydon Community School 7757 4 12 18 34 19 20 107 107
Croydon Maroondah College (interim name) 8912 116 168 162 171 155.5 129.7 902.2 902.2
Crusoe 7-10 Secondary College 7205 217 211.5 209 215.4 852.9 852.9
Dandenong High School 8858 315 325 340 322 314 297 1913 1913
Daylesford Secondary College 7115 77 92 82 94 50 68.8 463.8 463.8
Diamond Valley College 8746 174 152 142.2 126 117.6 86.3 798.1 798.1
Dimboola Memorial Secondary College 7770 30 31 30 39 26 29 185 185
Donald High School 7775 31 32 28 34 24 24 173 173
Doncaster Secondary College 7776 170 194 213 216 237 237 1267 1267
Dromana Secondary College 7122 212.2 188 191 157.2 179 148.3 1,075.7 1,075.7
Drouin Secondary College 7785 172 167 195 167.8 127.8 110.7 940.3 940.3
Eaglehawk Secondary College 7790 126 145 152 130 553 553
East Doncaster Secondary College 7773 215 247 242 312 270 187 1473 1473
Echuca College 8855 130 155 173 142 133 98 831 831
Elisabeth Murdoch College 8722 216 254 262 260.8 231 211.6 1,435.4 1,435.4
Eltham High School 7805 225 241 242 213 215.4 226.8 1,363.2 1,363.2
Elwood College 7810 59 68 84 80 100.8 117.4 509.2 509.2
Emerald Secondary College 8707 175.8 163.5 171 170.6 160.8 108.8 950.5 950.5
Endeavour Hills Secondary College 8871 13 50 74 137 137
Epping Secondary College 7813 143 159 140 129 128.6 115.8 815.4 815.4
Essendon East Keilor District College 8806 111 154.8 178 209 263.2 320.6 1,236.6 1,236.6
Euroa Secondary College 7820 77 75.5 49 72.5 68.4 39.7 382.1 382.1
Fairhills High School 7823 133 180 151 132.9 166.7 97.7 861.3 861.3
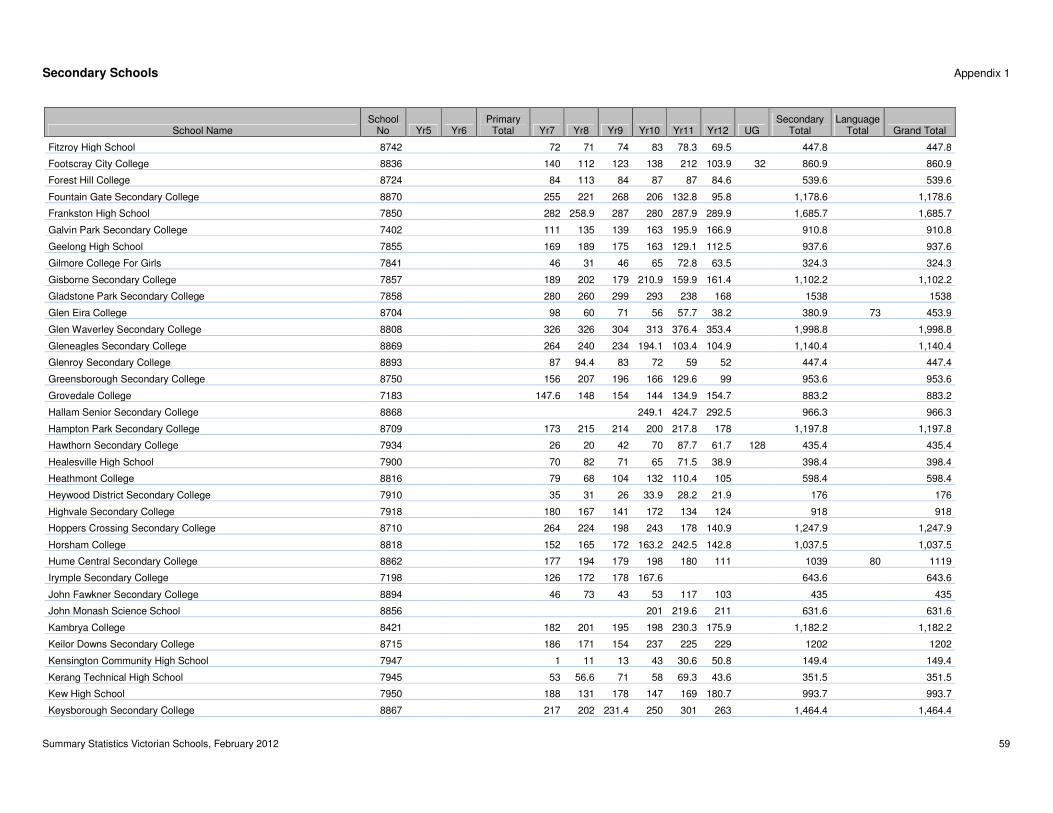
Secondary Schools Appendix 1
Summary Statistics Victorian Schools, February 2012 59
School Name School
No Yr5 Yr6 Primary
Total Yr7 Yr8 Yr9 Yr10 Yr11 Yr12 UG Secondary
Total Language
Total Grand Total
Fitzroy High School 8742 72 71 74 83 78.3 69.5 447.8 447.8
Footscray City College 8836 140 112 123 138 212 103.9 32 860.9 860.9
Forest Hill College 8724 84 113 84 87 87 84.6 539.6 539.6
Fountain Gate Secondary College 8870 255 221 268 206 132.8 95.8 1,178.6 1,178.6
Frankston High School 7850 282 258.9 287 280 287.9 289.9 1,685.7 1,685.7
Galvin Park Secondary College 7402 111 135 139 163 195.9 166.9 910.8 910.8
Geelong High School 7855 169 189 175 163 129.1 112.5 937.6 937.6
Gilmore College For Girls 7841 46 31 46 65 72.8 63.5 324.3 324.3
Gisborne Secondary College 7857 189 202 179 210.9 159.9 161.4 1,102.2 1,102.2
Gladstone Park Secondary College 7858 280 260 299 293 238 168 1538 1538
Glen Eira College 8704 98 60 71 56 57.7 38.2 380.9 73 453.9
Glen Waverley Secondary College 8808 326 326 304 313 376.4 353.4 1,998.8 1,998.8
Gleneagles Secondary College 8869 264 240 234 194.1 103.4 104.9 1,140.4 1,140.4
Glenroy Secondary College 8893 87 94.4 83 72 59 52 447.4 447.4
Greensborough Secondary College 8750 156 207 196 166 129.6 99 953.6 953.6
Grovedale College 7183 147.6 148 154 144 134.9 154.7 883.2 883.2
Hallam Senior Secondary College 8868 249.1 424.7 292.5 966.3 966.3
Hampton Park Secondary College 8709 173 215 214 200 217.8 178 1,197.8 1,197.8
Hawthorn Secondary College 7934 26 20 42 70 87.7 61.7 128 435.4 435.4
Healesville High School 7900 70 82 71 65 71.5 38.9 398.4 398.4
Heathmont College 8816 79 68 104 132 110.4 105 598.4 598.4
Heywood District Secondary College 7910 35 31 26 33.9 28.2 21.9 176 176
Highvale Secondary College 7918 180 167 141 172 134 124 918 918
Hoppers Crossing Secondary College 8710 264 224 198 243 178 140.9 1,247.9 1,247.9
Horsham College 8818 152 165 172 163.2 242.5 142.8 1,037.5 1,037.5
Hume Central Secondary College 8862 177 194 179 198 180 111 1039 80 1119
Irymple Secondary College 7198 126 172 178 167.6 643.6 643.6
John Fawkner Secondary College 8894 46 73 43 53 117 103 435 435
John Monash Science School 8856 201 219.6 211 631.6 631.6
Kambrya College 8421 182 201 195 198 230.3 175.9 1,182.2 1,182.2
Keilor Downs Secondary College 8715 186 171 154 237 225 229 1202 1202
Kensington Community High School 7947 1 11 13 43 30.6 50.8 149.4 149.4
Kerang Technical High School 7945 53 56.6 71 58 69.3 43.6 351.5 351.5
Kew High School 7950 188 131 178 147 169 180.7 993.7 993.7
Keysborough Secondary College 8867 217 202 231.4 250 301 263 1,464.4 1,464.4
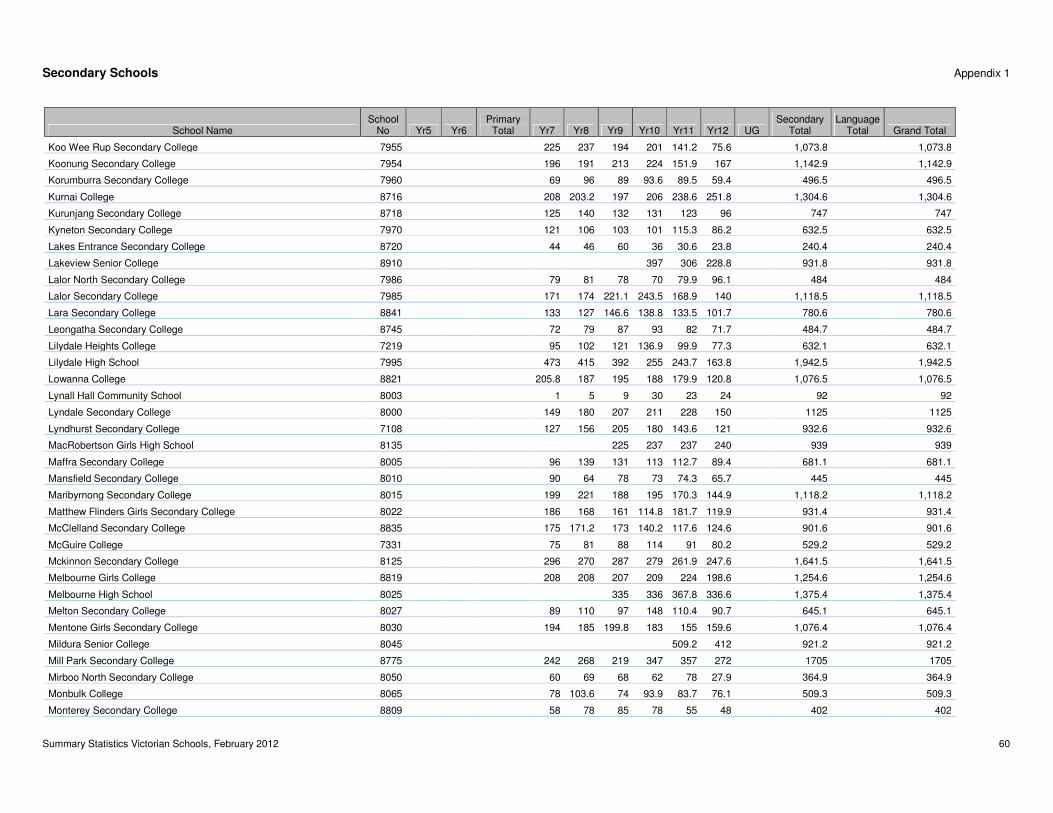
Secondary Schools Appendix 1
Summary Statistics Victorian Schools, February 2012 60
School Name School
No Yr5 Yr6 Primary
Total Yr7 Yr8 Yr9 Yr10 Yr11 Yr12 UG Secondary
Total Language
Total Grand Total
Koo Wee Rup Secondary College 7955 225 237 194 201 141.2 75.6 1,073.8 1,073.8
Koonung Secondary College 7954 196 191 213 224 151.9 167 1,142.9 1,142.9
Korumburra Secondary College 7960 69 96 89 93.6 89.5 59.4 496.5 496.5
Kurnai College 8716 208 203.2 197 206 238.6 251.8 1,304.6 1,304.6
Kurunjang Secondary College 8718 125 140 132 131 123 96 747 747
Kyneton Secondary College 7970 121 106 103 101 115.3 86.2 632.5 632.5
Lakes Entrance Secondary College 8720 44 46 60 36 30.6 23.8 240.4 240.4
Lakeview Senior College 8910 397 306 228.8 931.8 931.8
Lalor North Secondary College 7986 79 81 78 70 79.9 96.1 484 484
Lalor Secondary College 7985 171 174 221.1 243.5 168.9 140 1,118.5 1,118.5
Lara Secondary College 8841 133 127 146.6 138.8 133.5 101.7 780.6 780.6
Leongatha Secondary College 8745 72 79 87 93 82 71.7 484.7 484.7
Lilydale Heights College 7219 95 102 121 136.9 99.9 77.3 632.1 632.1
Lilydale High School 7995 473 415 392 255 243.7 163.8 1,942.5 1,942.5
Lowanna College 8821 205.8 187 195 188 179.9 120.8 1,076.5 1,076.5
Lynall Hall Community School 8003 1 5 9 30 23 24 92 92
Lyndale Secondary College 8000 149 180 207 211 228 150 1125 1125
Lyndhurst Secondary College 7108 127 156 205 180 143.6 121 932.6 932.6
MacRobertson Girls High School 8135 225 237 237 240 939 939
Maffra Secondary College 8005 96 139 131 113 112.7 89.4 681.1 681.1
Mansfield Secondary College 8010 90 64 78 73 74.3 65.7 445 445
Maribyrnong Secondary College 8015 199 221 188 195 170.3 144.9 1,118.2 1,118.2
Matthew Flinders Girls Secondary College 8022 186 168 161 114.8 181.7 119.9 931.4 931.4
McClelland Secondary College 8835 175 171.2 173 140.2 117.6 124.6 901.6 901.6
McGuire College 7331 75 81 88 114 91 80.2 529.2 529.2
Mckinnon Secondary College 8125 296 270 287 279 261.9 247.6 1,641.5 1,641.5
Melbourne Girls College 8819 208 208 207 209 224 198.6 1,254.6 1,254.6
Melbourne High School 8025 335 336 367.8 336.6 1,375.4 1,375.4
Melton Secondary College 8027 89 110 97 148 110.4 90.7 645.1 645.1
Mentone Girls Secondary College 8030 194 185 199.8 183 155 159.6 1,076.4 1,076.4
Mildura Senior College 8045 509.2 412 921.2 921.2
Mill Park Secondary College 8775 242 268 219 347 357 272 1705 1705
Mirboo North Secondary College 8050 60 69 68 62 78 27.9 364.9 364.9
Monbulk College 8065 78 103.6 74 93.9 83.7 76.1 509.3 509.3
Monterey Secondary College 8809 58 78 85 78 55 48 402 402
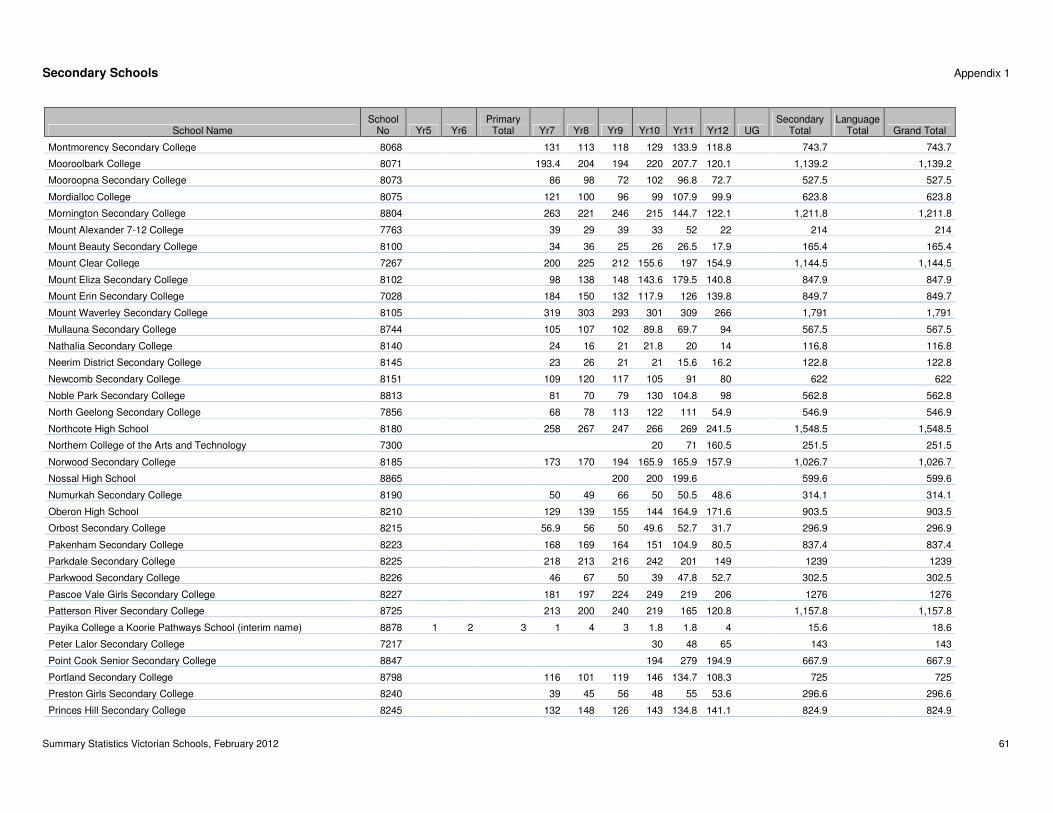
Secondary Schools Appendix 1
Summary Statistics Victorian Schools, February 2012 61
School Name School
No Yr5 Yr6 Primary
Total Yr7 Yr8 Yr9 Yr10 Yr11 Yr12 UG Secondary
Total Language
Total Grand Total
Montmorency Secondary College 8068 131 113 118 129 133.9 118.8 743.7 743.7
Mooroolbark College 8071 193.4 204 194 220 207.7 120.1 1,139.2 1,139.2
Mooroopna Secondary College 8073 86 98 72 102 96.8 72.7 527.5 527.5
Mordialloc College 8075 121 100 96 99 107.9 99.9 623.8 623.8
Mornington Secondary College 8804 263 221 246 215 144.7 122.1 1,211.8 1,211.8
Mount Alexander 7-12 College 7763 39 29 39 33 52 22 214 214
Mount Beauty Secondary College 8100 34 36 25 26 26.5 17.9 165.4 165.4
Mount Clear College 7267 200 225 212 155.6 197 154.9 1,144.5 1,144.5
Mount Eliza Secondary College 8102 98 138 148 143.6 179.5 140.8 847.9 847.9
Mount Erin Secondary College 7028 184 150 132 117.9 126 139.8 849.7 849.7
Mount Waverley Secondary College 8105 319 303 293 301 309 266 1,791 1,791
Mullauna Secondary College 8744 105 107 102 89.8 69.7 94 567.5 567.5
Nathalia Secondary College 8140 24 16 21 21.8 20 14 116.8 116.8
Neerim District Secondary College 8145 23 26 21 21 15.6 16.2 122.8 122.8
Newcomb Secondary College 8151 109 120 117 105 91 80 622 622
Noble Park Secondary College 8813 81 70 79 130 104.8 98 562.8 562.8
North Geelong Secondary College 7856 68 78 113 122 111 54.9 546.9 546.9
Northcote High School 8180 258 267 247 266 269 241.5 1,548.5 1,548.5
Northern College of the Arts and Technology 7300 20 71 160.5 251.5 251.5
Norwood Secondary College 8185 173 170 194 165.9 165.9 157.9 1,026.7 1,026.7
Nossal High School 8865 200 200 199.6 599.6 599.6
Numurkah Secondary College 8190 50 49 66 50 50.5 48.6 314.1 314.1
Oberon High School 8210 129 139 155 144 164.9 171.6 903.5 903.5
Orbost Secondary College 8215 56.9 56 50 49.6 52.7 31.7 296.9 296.9
Pakenham Secondary College 8223 168 169 164 151 104.9 80.5 837.4 837.4
Parkdale Secondary College 8225 218 213 216 242 201 149 1239 1239
Parkwood Secondary College 8226 46 67 50 39 47.8 52.7 302.5 302.5
Pascoe Vale Girls Secondary College 8227 181 197 224 249 219 206 1276 1276
Patterson River Secondary College 8725 213 200 240 219 165 120.8 1,157.8 1,157.8
Payika College a Koorie Pathways School (interim name) 8878 1 2 3 1 4 3 1.8 1.8 4 15.6 18.6
Peter Lalor Secondary College 7217 30 48 65 143 143
Point Cook Senior Secondary College 8847 194 279 194.9 667.9 667.9
Portland Secondary College 8798 116 101 119 146 134.7 108.3 725 725
Preston Girls Secondary College 8240 39 45 56 48 55 53.6 296.6 296.6
Princes Hill Secondary College 8245 132 148 126 143 134.8 141.1 824.9 824.9
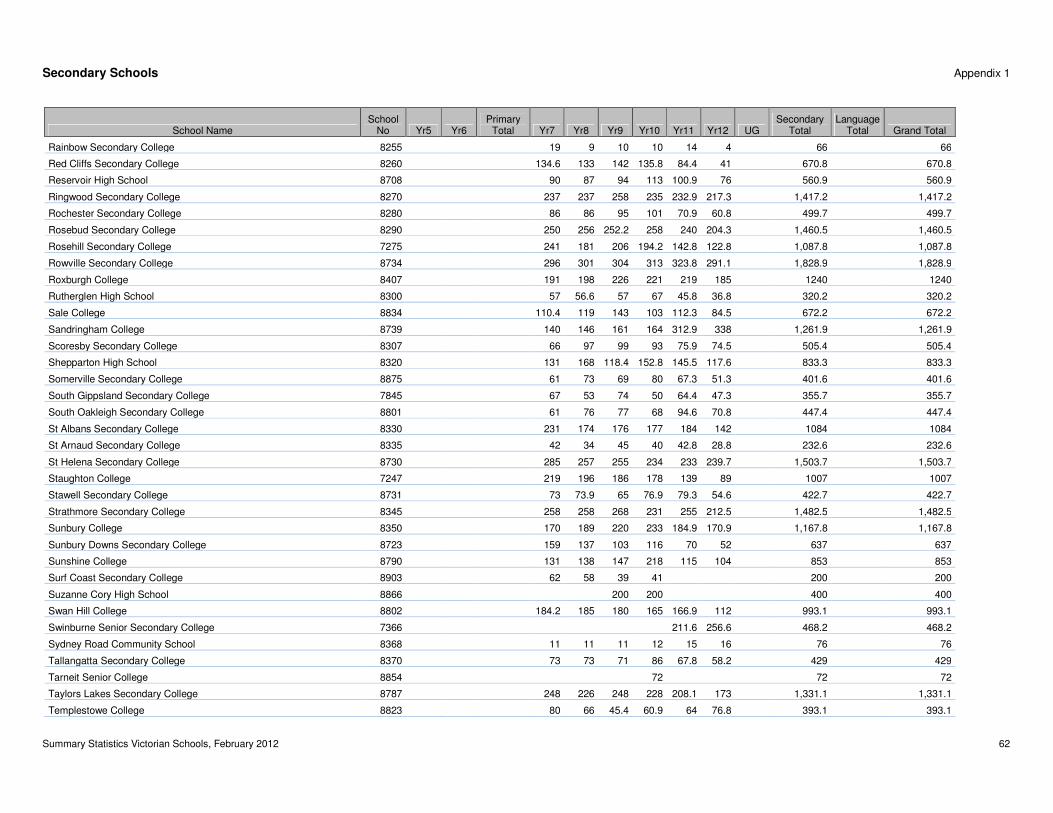
Secondary Schools Appendix 1
Summary Statistics Victorian Schools, February 2012 62
School Name School
No Yr5 Yr6 Primary
Total Yr7 Yr8 Yr9 Yr10 Yr11 Yr12 UG Secondary
Total Language
Total Grand Total
Rainbow Secondary College 8255 19 9 10 10 14 4 66 66
Red Cliffs Secondary College 8260 134.6 133 142 135.8 84.4 41 670.8 670.8
Reservoir High School 8708 90 87 94 113 100.9 76 560.9 560.9
Ringwood Secondary College 8270 237 237 258 235 232.9 217.3 1,417.2 1,417.2
Rochester Secondary College 8280 86 86 95 101 70.9 60.8 499.7 499.7
Rosebud Secondary College 8290 250 256 252.2 258 240 204.3 1,460.5 1,460.5
Rosehill Secondary College 7275 241 181 206 194.2 142.8 122.8 1,087.8 1,087.8
Rowville Secondary College 8734 296 301 304 313 323.8 291.1 1,828.9 1,828.9
Roxburgh College 8407 191 198 226 221 219 185 1240 1240
Rutherglen High School 8300 57 56.6 57 67 45.8 36.8 320.2 320.2
Sale College 8834 110.4 119 143 103 112.3 84.5 672.2 672.2
Sandringham College 8739 140 146 161 164 312.9 338 1,261.9 1,261.9
Scoresby Secondary College 8307 66 97 99 93 75.9 74.5 505.4 505.4
Shepparton High School 8320 131 168 118.4 152.8 145.5 117.6 833.3 833.3
Somerville Secondary College 8875 61 73 69 80 67.3 51.3 401.6 401.6
South Gippsland Secondary College 7845 67 53 74 50 64.4 47.3 355.7 355.7
South Oakleigh Secondary College 8801 61 76 77 68 94.6 70.8 447.4 447.4
St Albans Secondary College 8330 231 174 176 177 184 142 1084 1084
St Arnaud Secondary College 8335 42 34 45 40 42.8 28.8 232.6 232.6
St Helena Secondary College 8730 285 257 255 234 233 239.7 1,503.7 1,503.7
Staughton College 7247 219 196 186 178 139 89 1007 1007
Stawell Secondary College 8731 73 73.9 65 76.9 79.3 54.6 422.7 422.7
Strathmore Secondary College 8345 258 258 268 231 255 212.5 1,482.5 1,482.5
Sunbury College 8350 170 189 220 233 184.9 170.9 1,167.8 1,167.8
Sunbury Downs Secondary College 8723 159 137 103 116 70 52 637 637
Sunshine College 8790 131 138 147 218 115 104 853 853
Surf Coast Secondary College 8903 62 58 39 41 200 200
Suzanne Cory High School 8866 200 200 400 400
Swan Hill College 8802 184.2 185 180 165 166.9 112 993.1 993.1
Swinburne Senior Secondary College 7366 211.6 256.6 468.2 468.2
Sydney Road Community School 8368 11 11 11 12 15 16 76 76
Tallangatta Secondary College 8370 73 73 71 86 67.8 58.2 429 429
Tarneit Senior College 8854 72 72 72
Taylors Lakes Secondary College 8787 248 226 248 228 208.1 173 1,331.1 1,331.1
Templestowe College 8823 80 66 45.4 60.9 64 76.8 393.1 393.1
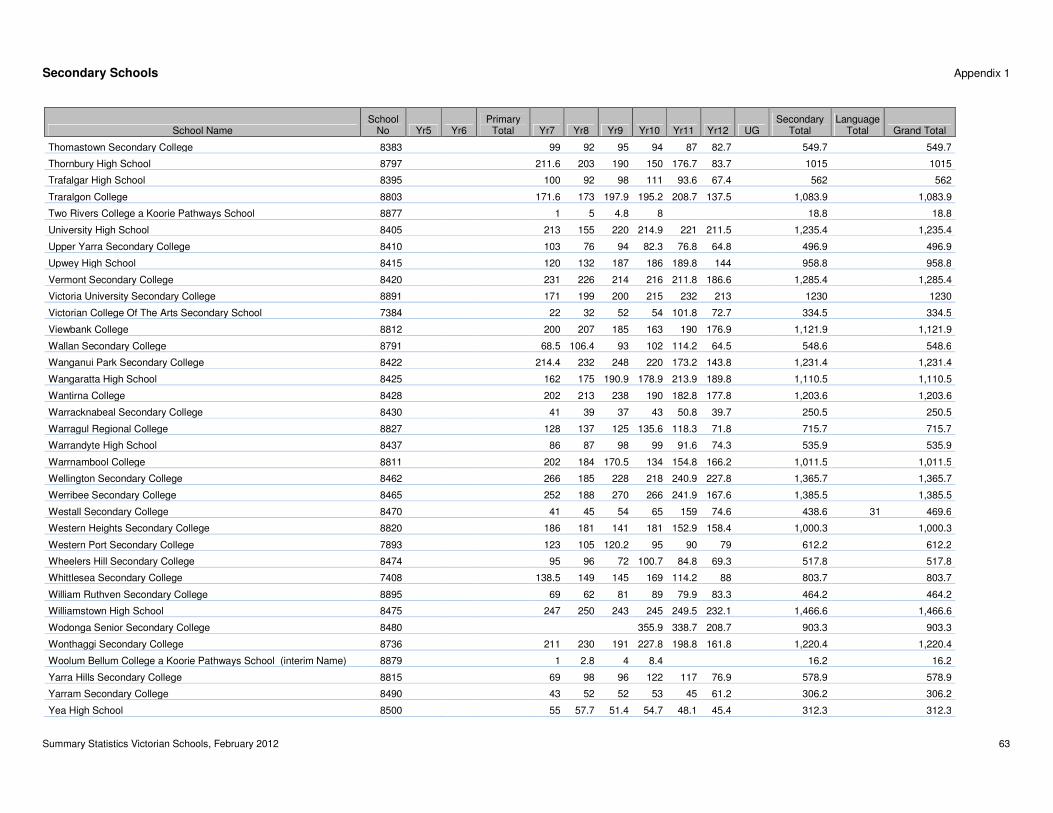
Secondary Schools Appendix 1
Summary Statistics Victorian Schools, February 2012 63
School Name School
No Yr5 Yr6 Primary
Total Yr7 Yr8 Yr9 Yr10 Yr11 Yr12 UG Secondary
Total Language
Total Grand Total
Thomastown Secondary College 8383 99 92 95 94 87 82.7 549.7 549.7
Thornbury High School 8797 211.6 203 190 150 176.7 83.7 1015 1015
Trafalgar High School 8395 100 92 98 111 93.6 67.4 562 562
Traralgon College 8803 171.6 173 197.9 195.2 208.7 137.5 1,083.9 1,083.9
Two Rivers College a Koorie Pathways School 8877 1 5 4.8 8 18.8 18.8
University High School 8405 213 155 220 214.9 221 211.5 1,235.4 1,235.4
Upper Yarra Secondary College 8410 103 76 94 82.3 76.8 64.8 496.9 496.9
Upwey High School 8415 120 132 187 186 189.8 144 958.8 958.8
Vermont Secondary College 8420 231 226 214 216 211.8 186.6 1,285.4 1,285.4
Victoria University Secondary College 8891 171 199 200 215 232 213 1230 1230
Victorian College Of The Arts Secondary School 7384 22 32 52 54 101.8 72.7 334.5 334.5
Viewbank College 8812 200 207 185 163 190 176.9 1,121.9 1,121.9
Wallan Secondary College 8791 68.5 106.4 93 102 114.2 64.5 548.6 548.6
Wanganui Park Secondary College 8422 214.4 232 248 220 173.2 143.8 1,231.4 1,231.4
Wangaratta High School 8425 162 175 190.9 178.9 213.9 189.8 1,110.5 1,110.5
Wantirna College 8428 202 213 238 190 182.8 177.8 1,203.6 1,203.6
Warracknabeal Secondary College 8430 41 39 37 43 50.8 39.7 250.5 250.5
Warragul Regional College 8827 128 137 125 135.6 118.3 71.8 715.7 715.7
Warrandyte High School 8437 86 87 98 99 91.6 74.3 535.9 535.9
Warrnambool College 8811 202 184 170.5 134 154.8 166.2 1,011.5 1,011.5
Wellington Secondary College 8462 266 185 228 218 240.9 227.8 1,365.7 1,365.7
Werribee Secondary College 8465 252 188 270 266 241.9 167.6 1,385.5 1,385.5
Westall Secondary College 8470 41 45 54 65 159 74.6 438.6 31 469.6
Western Heights Secondary College 8820 186 181 141 181 152.9 158.4 1,000.3 1,000.3
Western Port Secondary College 7893 123 105 120.2 95 90 79 612.2 612.2
Wheelers Hill Secondary College 8474 95 96 72 100.7 84.8 69.3 517.8 517.8
Whittlesea Secondary College 7408 138.5 149 145 169 114.2 88 803.7 803.7
William Ruthven Secondary College 8895 69 62 81 89 79.9 83.3 464.2 464.2
Williamstown High School 8475 247 250 243 245 249.5 232.1 1,466.6 1,466.6
Wodonga Senior Secondary College 8480 355.9 338.7 208.7 903.3 903.3
Wonthaggi Secondary College 8736 211 230 191 227.8 198.8 161.8 1,220.4 1,220.4
Woolum Bellum College a Koorie Pathways School (interim Name) 8879 1 2.8 4 8.4 16.2 16.2
Yarra Hills Secondary College 8815 69 98 96 122 117 76.9 578.9 578.9
Yarram Secondary College 8490 43 52 52 53 45 61.2 306.2 306.2
Yea High School 8500 55 57.7 51.4 54.7 48.1 45.4 312.3 312.3
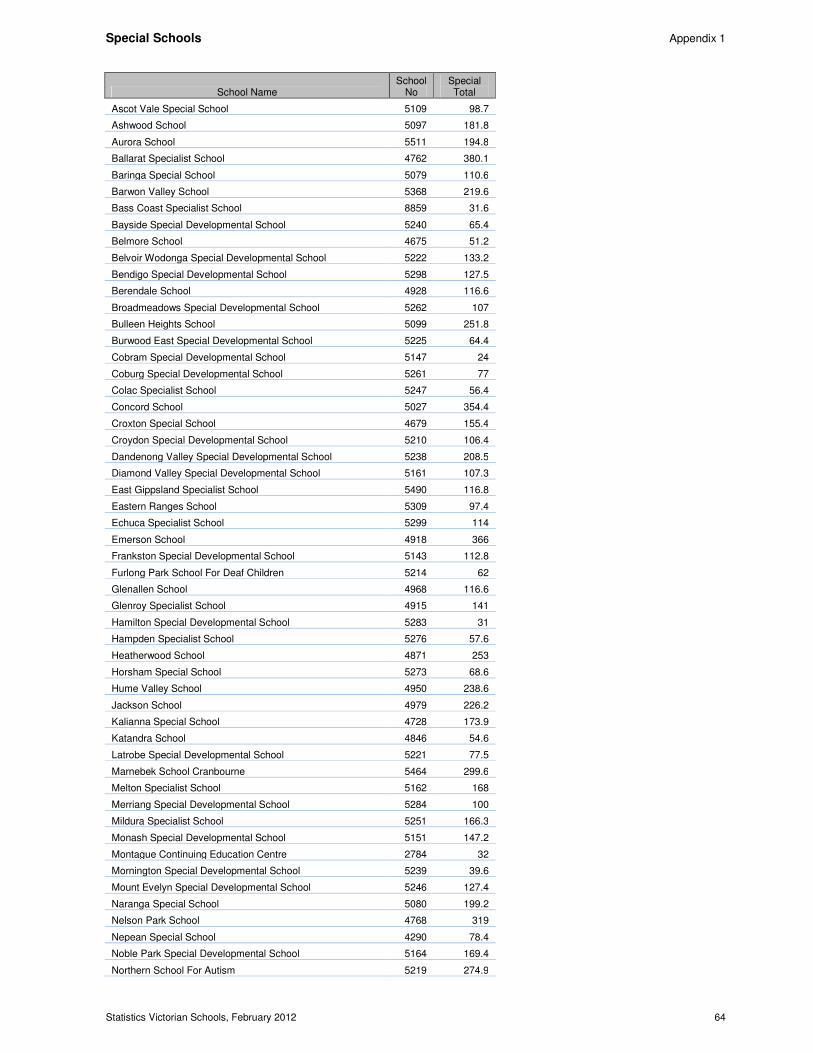
Special Schools Appendix 1
Statistics Victorian Schools, February 2012 64
School Name School
No Special Total
Ascot Vale Special School 5109 98.7
Ashwood School 5097 181.8
Aurora School 5511 194.8
Ballarat Specialist School 4762 380.1
Baringa Special School 5079 110.6
Barwon Valley School 5368 219.6
Bass Coast Specialist School 8859 31.6
Bayside Special Developmental School 5240 65.4
Belmore School 4675 51.2
Belvoir Wodonga Special Developmental School 5222 133.2
Bendigo Special Developmental School 5298 127.5
Berendale School 4928 116.6
Broadmeadows Special Developmental School 5262 107
Bulleen Heights School 5099 251.8
Burwood East Special Developmental School 5225 64.4
Cobram Special Developmental School 5147 24
Coburg Special Developmental School 5261 77
Colac Specialist School 5247 56.4
Concord School 5027 354.4
Croxton Special School 4679 155.4
Croydon Special Developmental School 5210 106.4
Dandenong Valley Special Developmental School 5238 208.5
Diamond Valley Special Developmental School 5161 107.3
East Gippsland Specialist School 5490 116.8
Eastern Ranges School 5309 97.4
Echuca Specialist School 5299 114
Emerson School 4918 366
Frankston Special Developmental School 5143 112.8
Furlong Park School For Deaf Children 5214 62
Glenallen School 4968 116.6
Glenroy Specialist School 4915 141
Hamilton Special Developmental School 5283 31
Hampden Specialist School 5276 57.6
Heatherwood School 4871 253
Horsham Special School 5273 68.6
Hume Valley School 4950 238.6
Jackson School 4979 226.2
Kalianna Special School 4728 173.9
Katandra School 4846 54.6
Latrobe Special Developmental School 5221 77.5
Marnebek School Cranbourne 5464 299.6
Melton Specialist School 5162 168
Merriang Special Developmental School 5284 100
Mildura Specialist School 5251 166.3
Monash Special Developmental School 5151 147.2
Montague Continuing Education Centre 2784 32
Mornington Special Developmental School 5239 39.6
Mount Evelyn Special Developmental School 5246 127.4
Naranga Special School 5080 199.2
Nelson Park School 4768 319
Nepean Special School 4290 78.4
Noble Park Special Developmental School 5164 169.4
Northern School For Autism 5219 274.9
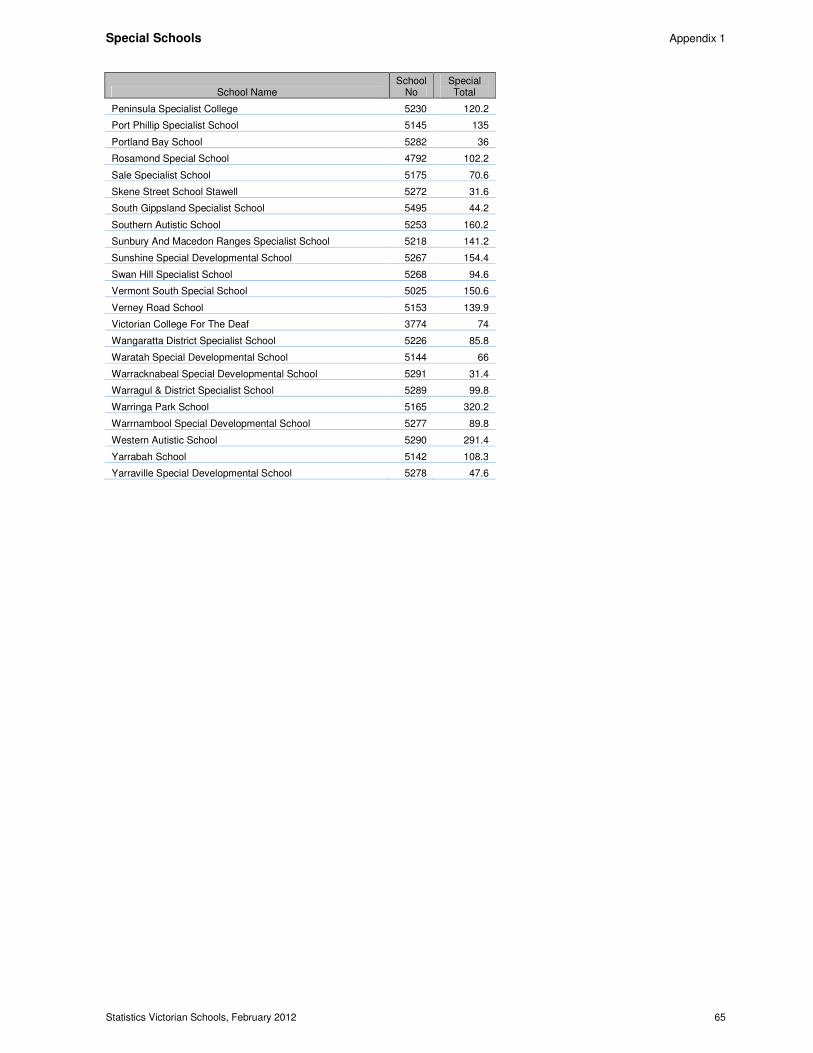
Special Schools Appendix 1
Statistics Victorian Schools, February 2012 65
School Name School
No Special Total
Peninsula Specialist College 5230 120.2
Port Phillip Specialist School 5145 135
Portland Bay School 5282 36
Rosamond Special School 4792 102.2
Sale Specialist School 5175 70.6
Skene Street School Stawell 5272 31.6
South Gippsland Specialist School 5495 44.2
Southern Autistic School 5253 160.2
Sunbury And Macedon Ranges Specialist School 5218 141.2
Sunshine Special Developmental School 5267 154.4
Swan Hill Specialist School 5268 94.6
Vermont South Special School 5025 150.6
Verney Road School 5153 139.9
Victorian College For The Deaf 3774 74
Wangaratta District Specialist School 5226 85.8
Waratah Special Developmental School 5144 66
Warracknabeal Special Developmental School 5291 31.4
Warragul & District Specialist School 5289 99.8
Warringa Park School 5165 320.2
Warrnambool Special Developmental School 5277 89.8
Western Autistic School 5290 291.4
Yarrabah School 5142 108.3
Yarraville Special Developmental School 5278 47.6
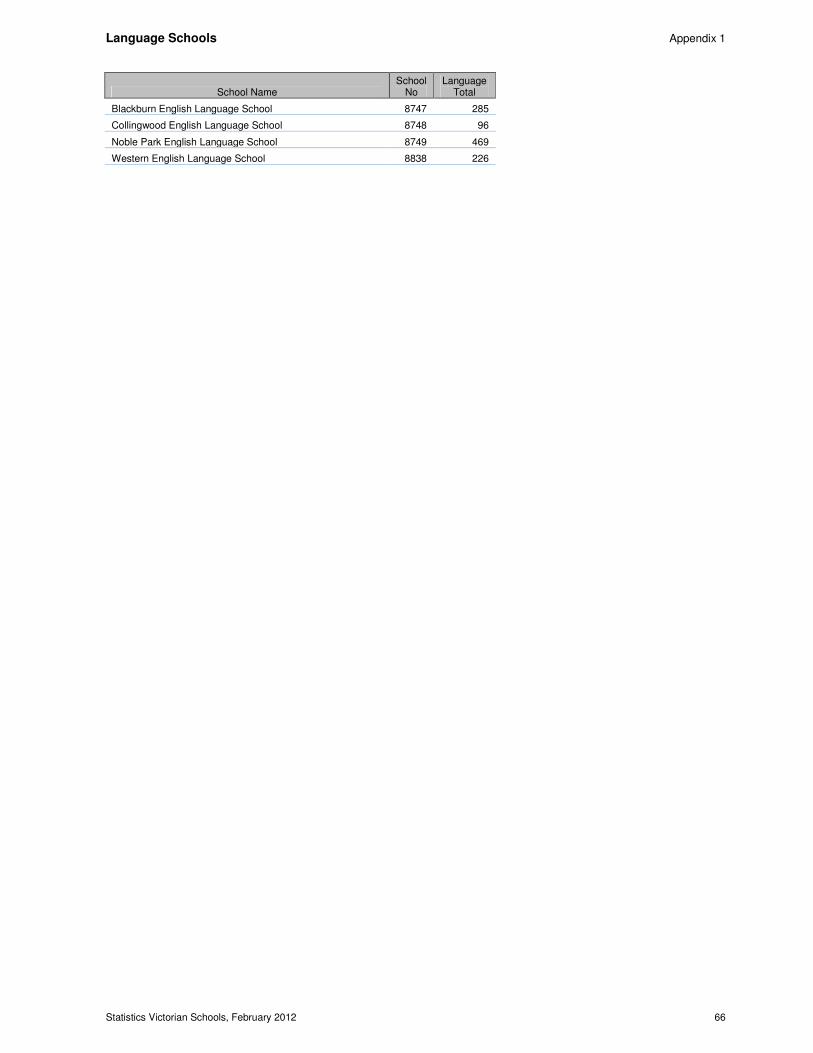
Language Schools Appendix 1
Statistics Victorian Schools, February 2012 66
School Name School
No Language
Total
Blackburn English Language School 8747 285
Collingwood English Language School 8748 96
Noble Park English Language School 8749 469
Western English Language School 8838 226


![[XLS]navy-training-transformation2.wikispaces.com · Web view0. 15 15. 85 85. 100 100. 5. 85. 100. 0.3 1 0.35 0.35 1. 85 85 85 85. 85 85 85 85. 85 85 85 85. 85 85 85 85. 85 85 85](https://img.pdfslide.net/doc/110x75/5b3ecf5e7f8b9a5e2c8b55c9/xlsnavy-training-web-view0-15-15-85-85-100-100-5-85-100-03-1-035.jpg)


![[XLS]navy-training-transformation2.wikispaces.com · Web view0 15 15 85 85 100 100 5 85 100 0.3 1 0.35 0.35 1 85 85 85 85 85 85 85 85 85 85 85 85 85 85 85 85 85 85 85 85 15 15 5 11.5](https://img.pdfslide.net/doc/110x75/5adf226a7f8b9a6e5c8bbbe3/xlsnavy-training-view0-15-15-85-85-100-100-5-85-100-03-1-035-035-1-85-85-85.jpg)