Embed Size (px)
Citation preview
Summative Evaluation Report
Farm to Science Initiative
Prepared for OMSI
Taline A. Kuyumjian Engagement Research and Advancement
March 2016
With generous support from the USDA Specialty Crop Block Grant Program.
Also included is Harvest Fest 2016 Summative Evaluation: Supplement to the Farm to Science Programming and Events Summative Evaluation, prepared by Taline A. Kuyumjian, Oregon Museum of Science and Industry.
Summative Evaluation Report: Farm to Science Initiative 1
OVERVIEW OF SUMMATIVE REPORTS
In 2014, the Oregon Museum of Science and Industry (OMSI) received funding from the Oregon Department of Agriculture (ODA) Specialty Crop Block Grant Program (SCBGP), to enhance the competitiveness of Oregon's specialty crops. OMSI submitted an application for a season of activities which aimed to address the need for increased awareness of the breadth and diversity of crops grown throughout the state. The application advocated that a more aware and educated consumer base will allow the specialty crop industry to continue to grow. With funding, OMSI was able to provide engaging and far-reaching educational experiences for families to learn about the range, diversity, and value of Oregon specialty crops. The hope was that activity participants would become consumers who make informed and healthful food purchasing choices. OMSI worked in close partnership with a group of local specialty crop producers and advocacy organizations to increase public awareness of and interest in Oregon’s vibrant specialty crop industry, with the hope of increasing specialty crop sales. The Farm to Science season of activities took place during the height of the 2015 growing season (June-October, 2015). Activities which contributed to the Farm to Science season included: OMSI After Dark, Food Science Demos, Meet a Farmer Tabling, Food Science Labs, Science Pubs, Better Bites, and Harvest Fest. Activities offered through Farm to Science sought to benefit the Oregon specialty crop industry, with its focus on raising the visibility of eligible specialty crops through a variety of education methods and partnerships. The Farm to Science project was intentionally designed to target and support a range of organizations, including producers, farmers, commissions, and industry advocates. The OMSI Research and Evaluation team conducted a summative evaluation study of the initiative with visitors throughout the summer. A few months later, OMSI sought to amend its award with a no-cost extension into 2016. It was identified that Harvest Fest provided an opportunity for OMSI to strengthen relationships with specialty crop vendors across Oregon, increase awareness of specialty crops and specialty crop seasonality with the public, and test food festivals as a platform for specialty crop engagement on a larger scale. Prolonging the grant period allowed OMSI to repeat Harvest Fest in October 2016, giving the team a full year to prepare. Similar to the first grant year, this event date was selected to utilize as many partners as possible, catching vendors at the end of the season when most of the area’s major farmer’s markets have ended. A summative study is typically conducted in the final year of a project to better understand the effectiveness of a project at achieving its intended impacts. This summative report is divided into two parts: a complete summative evaluation report of Farm to Science activities in 2015, and a supplemental summative evaluation report of the 2016 Harvest Fest. Taline Kuyumjian (OMSI) led both studies. Summative Evaluation Report: Farm to Science Initiative begins on the next page (2). Harvest Fest 2016 Summative Evaluation: Supplement to the Farm to Science Programming and Events Summative Evaluation begins on page 29.
Summative Evaluation Report: Farm to Science Initiative 2
Summative Evaluation Report
Farm to Science Initiative
March 2016
Summative Evaluation Report: Farm to Science Initiative 3
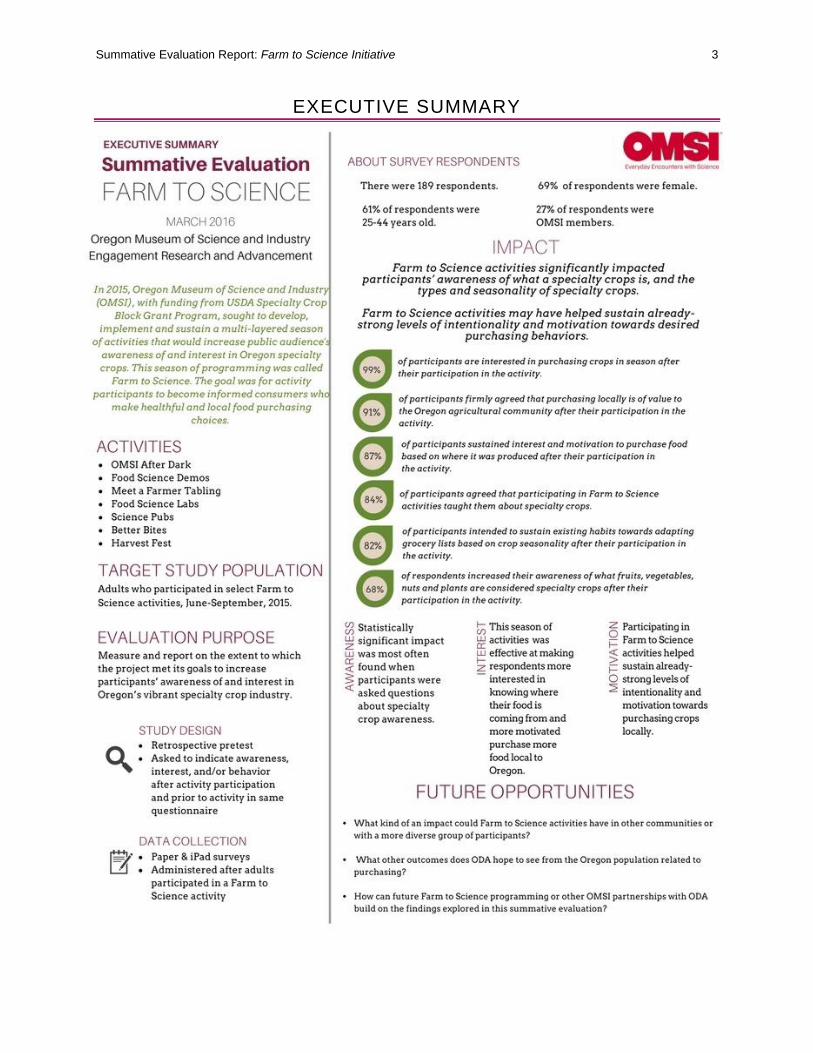
EXECUTIVE SUMMARY
Summative Evaluation Report: Farm to Science Initiative 4
CONTENTS
Overview of Summative Reports ................................................................................................ 1
Executive Summary ................................................................................................................... 3
Contents .................................................................................................................................... 4
List of Figures ............................................................................................................................ 5
Acknowledgements .................................................................................................................... 6
Project Background and Goals ................................................................................................... 7
Evaluation Purpose .................................................................................................................... 7
Evaluation Questions .............................................................................................................. 7
Methodology .............................................................................................................................. 8
Study Design .......................................................................................................................... 8
Data Collection ....................................................................................................................... 8
Informed Consent ................................................................................................................... 8
Sample ................................................................................................................................... 8
Analysis ....................................................................................................................................10
Limitations .............................................................................................................................10
Findings ....................................................................................................................................11
Awareness of Oregon Specialty Crops ..................................................................................11
Paired Questions ...............................................................................................................12
Seasonality of Oregon specialty crops ...................................................................................14
Interest and motivation for purchasing Oregon specialty crops ..............................................16
Summary of Findings .............................................................................................................23
Discussion ................................................................................................................................24
where Farm to Science activities made a significant impact ..................................................24
Farm to Science activities helped sustain interest .................................................................24
Considerations ......................................................................................................................24
Bibliography ..............................................................................................................................26
Appendix A: Description of Events and programs: Farm to Science, Celebrating Oregon Fruits and Vegetables .........................................................................................................................45
Appendix B: Interest and Awareness Survey ............................................................................47
Appendix C: Chart of paired statements, test scores, Means and Significance .........................51
Summative Evaluation Report: Farm to Science Initiative 5
LIST OF FIGURES
Figure 1: Age ranges of respondents ......................................................................................... 9
Figure 2: Awareness of specialty crops after participation .........................................................11
Figure 3: Awareness of the definition of specialty crops prior to participation ............................12
Figure 4: Post/pre comparative for confidence explaining specialty crops .................................12
Figure 5: Pre/post change in confidence explaining what a specialty crop is .............................13
Figure 6: Post/pre comparative for awareness of what are considered Oregon specialty crops 14
Figure 7: Change in awareness of what is considered a specialty crop after activity participation .................................................................................................................................................14
Figure 8: Post/pre comparative for confidence discussing specialty crop seasonality................15
Figure 9: Changes in confidence levels discussing seasonality .................................................15
Figure 10: Pre/post comparative for interest in knowing where food was produced when grocery shopping ...................................................................................................................................16
Figure 11: Changes in interest for knowing where food is produced when grocery shopping ....17
Figure 12: Pre/post comparative for deciding to purchase food based on where it was produced .................................................................................................................................................17
Figure 13: Change in motivation to know where food is purchased prior to purchase................18
Figure 14: Pre/post comparative in interest in purchasing fruit, vegetables, nuts and plants local to oregon ...................................................................................................................................19
Figure 15: Changes in interest in purchasing fruit, vegetables, nuts and plants local to oregon 19
Figure 16: Pre/post comparative of interest in food seasonality when grocery shopping ...........20
Figure 17: Change in interest in if food is in season when purchasing ......................................20
Figure 18: Post/pre comparative for motivation to adapt grocery list based on seasonality .......21
Figure 19: Change in motivation to adapt grocery list based on seasonality ..............................21
Figure 20: Pre/post comparative for belief that purchasing food and plants produced locally is of value .........................................................................................................................................22
Figure 21: Change in belief that purchasing food and plants produced locally is of value ..........22
Summative Evaluation Report: Farm to Science Initiative 6
ACKNOWLEDGEMENTS
The Research and Evaluation staff who led this project would like to thank:
OMSI visitors that contributed to this research
Oregon Department of Agriculture and the USDA Specialty Crop Block Grant Program for their generous support of the project
Evaluation team members that helped with data collection, data entry, analysis, and editing including: Mary Soots, Omar Vargas, Maria Eugenia Perdomo, Jessica Shamek, Melanie Francisco, Allison Prasad, Liz Wright, and Chris Cardiel
Without all of you this report would not be possible.
Summative Evaluation Report: Farm to Science Initiative 7
PROJECT BACKGROUND AND GOALS
In 2014, the Oregon Museum of Science and Industry (OMSI) received funding from the Oregon Department of Agriculture (ODA) Specialty Crop Block Grant Program (SCBGP), to enhance the competitiveness of Oregon's specialty crops. OMSI submitted an application for a season of activities which aimed to address the need for increased awareness of the breadth and diversity of crops grown throughout the state. The application advocated that a more aware and educated consumer base will allow the specialty crop industry to continue to grow. With funding, OMSI was able to provide engaging and far-reaching educational experiences for families to learn about the range, diversity, and value of Oregon specialty crops. The hope was that activity participants would become consumers who make informed and healthful food purchasing choices. OMSI worked in close partnership with a group of local specialty crop producers and advocacy organizations to increase public awareness of and interest in Oregon’s vibrant specialty crop industry, with the hope of increasing specialty crop sales. The Farm to Science season of activities took place during the height of the 2015 growing season (June-October, 2015). Activities which contributed to the Farm to Science season included: OMSI After Dark, Food Science Demos, Meet a Farmer Tabling, Food Science Labs, Science Pubs, Better Bites and a Harvest Fest. Appendix A provides more details on event and program themes. Activities were slowly rolled out throughout the season to accommodate the wide variety of experiences offered. The season kicked-off in June with a cider-themed OMSI After Dark. Food Science Demos, Food Science Labs and Meet a Farmer Tabling began started in July. A Better Bites event was hosted in August. September brought the addition of Science Pubs to regular scheduling, and the season’s capstone event, Harvest Fest. Farm to Science wound down in October with a continuation of Food Science Demos before the season closed at the end of the month. Activities offered through Farm to Science sought to benefit the Oregon specialty crop industry, with its focus on raising the visibility of eligible specialty crops through a variety of education methods and partnerships. The Farm to Science project was intentionally designed to target and support a range of organizations, including producers, farmers, commissions, and industry advocates.
EVALUATION PURPOSE
The goal of the Farm to Science project was to develop, implement and sustain a multi-layered season of community engagement programming that would increase public audience awareness of Oregon specialty crops, with the assumption that it would lead to an increase in the sales of Oregon specialty crops. The purpose of this summative evaluation was to measure and report on the extent to which the project met its goals to increase participants’ awareness of and interest in Oregon’s vibrant specialty crop industry.
EVALUATION QUESTIONS
This summative evaluation was guided by three evaluation questions. To what extent and in what ways did participation in a Farm to Science program or event impact participants’:
Awareness of the types of specialty crops grown in Oregon, where they are grown, and when they are in season?
Understanding of the value of purchasing crops locally and when in season?
Interest and motivation to purchase crops locally and when in season?
Summative Evaluation Report: Farm to Science Initiative 8
METHODOLOGY
STUDY DESIGN
Information provided and analyzed was self-reported by participants through a retrospective pretest design. Respondents were asked to indicate their awareness, interest, and anticipated behavior after activity participation, as well as recall their awareness, interest, and behaviors prior to the program in the same questionnaire.
DATA COLLECTION
Based on piloting and programmatic/event design, the Interest and Awareness Survey (see Appendix B) was administered in two formats pending activity need and data collector preference. For free-flow activities, where visitors could come and go at any time, the Interest and Awareness Survey was administered via an iPad using the Survey Gizmo platform and/or via a paper copy. These activities included Food Science Demos, Meet a Farmer Tabling, OMSI After Dark, and Harvest Fest. For more structured activities, where there was a clear start and end time, paper surveys were distributed to all participants to ensure the highest response rate possible. These activities included Food Science Labs, Science Pubs, and Better Bites. Across all programs and events, surveys were administered after adults engaged in a specific Farm to Science activity. Examples of this include: the conclusion of a Science Pub, after participating in a Food Science Demo in Theory or at an event, or after talking with a farmer at Meet a Farmer Tabling. The overall target sample size was between 200-250 adult participants. An attempt was made to get a proportionate number of sample participants from each of the activities offered. Data collectors aimed to approach every eligible visitor, as they become available throughout their shifts. In a group, only one visitor per group was invited to complete the survey. After an adult finished participating in the activity, the data collector approached (sometimes with the support of educators or volunteer facilitators) and asked the adult if they might be interested in participating in a short survey on their experience with the activity. When multiple activities occurred simultaneously, the evaluator would wait until the individual or group completed all of the activities they wished and then approached.
INFORMED CONSENT
Prior to distributing the survey, the data collector outlined the purpose of the survey to potential participants, how the information would be used, and asked the individual if they agreed to participate. Those who verbally agreed were surveyed. Both versions of the survey, digital (iPad) or written (paper), took approximately five minutes for respondents to complete. Demographic information (age, gender, educational level, area of residence) was documented, but more personal information, such as the name or address of the visitor, was not requested. During analysis visitors were only identified by case number.
SAMPLE
The Interest and Awareness Survey was distributed at 11 activities between June and September 2015. The number of data collection points selected was proportionate to the range of activities offered, and aimed to gather a sample which was representative across the variety of experiences. A total of 189 Farm to Science participants opted to take the survey. Among the 189 responses, 156 surveys were fully completed and 33 were partially completed.
Summative Evaluation Report: Farm to Science Initiative 9
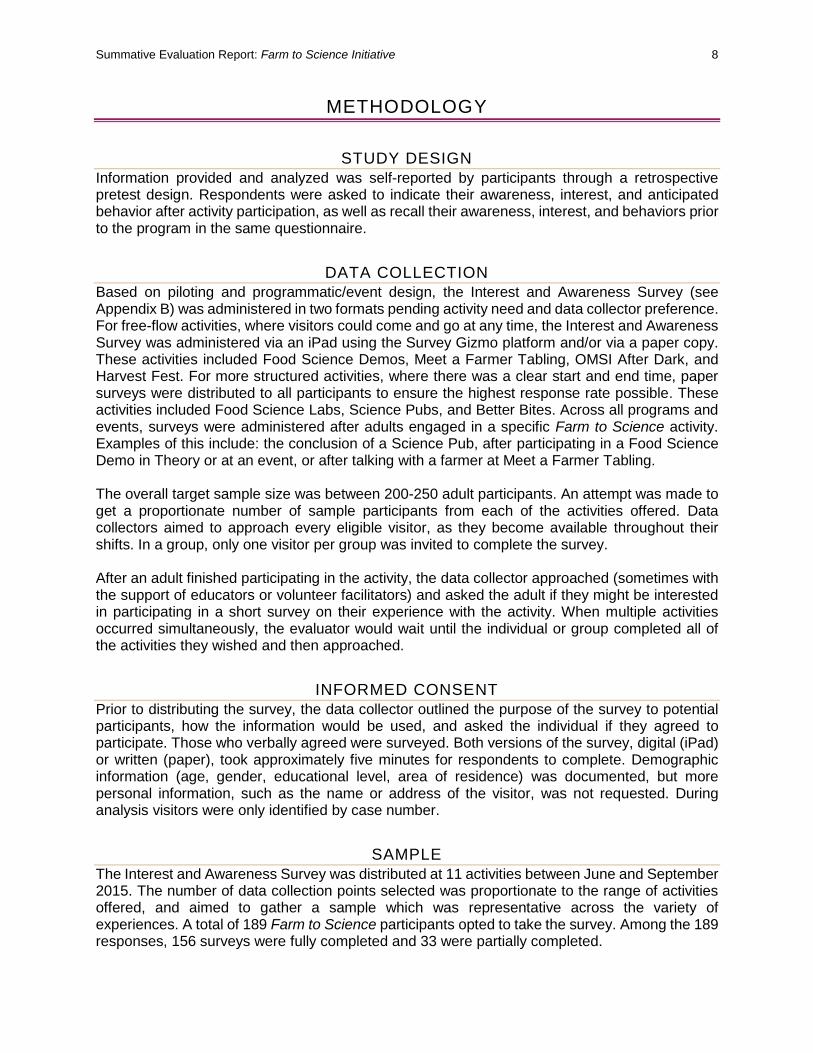
Demographics were optional and collected after participants completed the survey. Most people (94%, n=178) opted to provide demographic information. Among the sample, 69% (n=130) identified as female, 23% (n=44) identified as male, 2 preferred not to answer and 1 identified as “Other.” Participants were asked to indicate their age range. Responses are shown in Figure 1.
FIGURE 1: AGE RANGES OF RESPONDENTS
Respondents were also asked to self-report which ethnic and racial groups they identified with. Regarding self-identified ethnic identity, where four options were given and respondents could choose one, a majority of respondents (83%) self-identified as “Not Hispanic of Latino,” some (9%) preferred not to answer or weren’t sure, and a few (7%) identified as “Hispanic or Latino.” Respondents were given seven options to select for racial identity. Among the options, most (87%) selected “White.” Both “Asian” and “Prefer not to answer” represented 4% of the sample. Some respondents (3%) were not sure of their racial identity. There were 3 respondents who identified as “American Indian or Alaska Native” and one who identified as “Black or African American.” None of the respondents identified as “Native Hawaiian or Other Pacific Islander.” Finally, participants were asked to share if they were OMSI members or not. Among the respondents, 73% were not OMSI members. Accordingly, the remaining 27% of respondents to the question indicated they held OMSI membership.
Summative Evaluation Report: Farm to Science Initiative 10
ANALYSIS
Given the large sample size, data was analyzed in SPSS Statistics Software to assess normalcy, as well as to understand the statistical significances between post and retrospective pre questions. Normalcy tests were run for all paired questions. Results were first analyzed through a visual inspection of the Q-Q plots. Given the larger sample sizes, results for normalcy were verified through a calculation of the Skewness z scores. If pairs were found to be symmetrical and fall within the normal ranges of +/-2.58, then a paired t-test was conducted to compare the means between the two related groups. If pairs fell outside of range of symmetry, then a Sign test was conducted to determine whether there is a median difference between paired observations (Ghasemi and Zahediasl 2012). After data was tested for normalcy and statistical significance, tests to measure distribution of responses were conducted in Excel for individual questions and question pairings. Demographic analytics were similarly conducted.
LIMITATIONS
Data was not analyzed for each individual activity, but instead aggregated to share findings about impact across the whole initiative. Anecdotal comments and observations during data collection across the project seemed to indicate that participants may have felt that the content presented at events (ex: Better Bites, Science Pubs) was more loosely connected to Oregon specialty crops than was presented during programming efforts (ex: Demos, Labs). Often, if a visitor strongly felt there was no connection between the event they just attended and the Interest and Awareness Survey, they opted not to respond or complete their survey. Because this summative evaluation focused on the overall impact aggregated across all programs and events, the extent to which these comments and theorized perceptions may have influenced the findings was not analyzed.
Summative Evaluation Report: Farm to Science Initiative 11
FINDINGS
The aim of this summative evaluation was to measure the extent to which the project met its goals to increase participants’ awareness of Oregon specialty crops and their interest in purchasing Oregon specialty crops. Survey questions were designed to better understand how aware participants were of what products were considered specialty crops, basic comprehension of specialty crop seasonality, and to gauge interest and motivation in purchasing Oregon specialty crops. Across most questions, respondents were given a 6-point Likert-style scale to complete, with 1 being low and 6 being high. Scales measured for self-reported awareness levels, agreement levels, confidence levels, interest levels and degrees of intentionality. Given the retrospective pre/post nature of this survey, respondents were initially asked to provide a rating based on how they felt after activity participation. They were then prompted to think back to how they would have answered the same question or prompt prior to participation. Accordingly, findings will first report the post responses, and then compared to the retrospective pre responses. In the following sections, the findings from across the survey questions are grouped by specialty crop awareness, seasonality awareness, and interest in specialty crops.
AWARENESS OF OREGON SPECIALTY CROPS
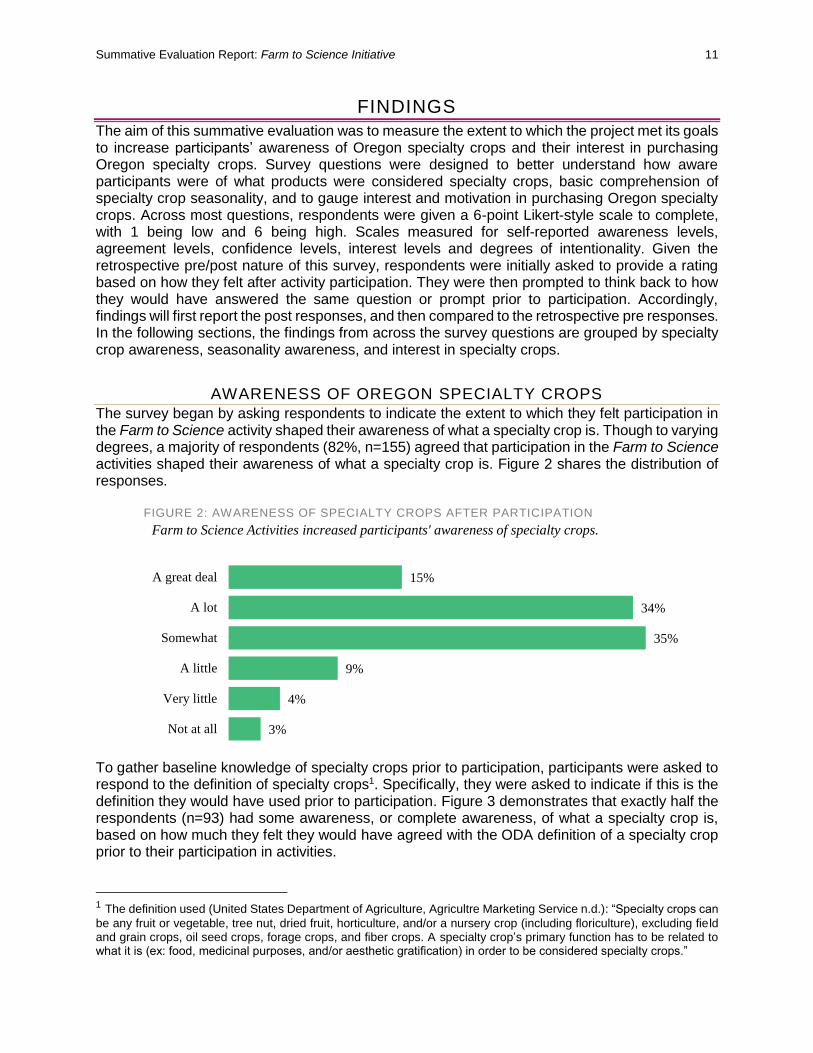
The survey began by asking respondents to indicate the extent to which they felt participation in the Farm to Science activity shaped their awareness of what a specialty crop is. Though to varying degrees, a majority of respondents (82%, n=155) agreed that participation in the Farm to Science activities shaped their awareness of what a specialty crop is. Figure 2 shares the distribution of responses.
FIGURE 2: AWARENESS OF SPECIALTY CROPS AFTER PARTICIPATION
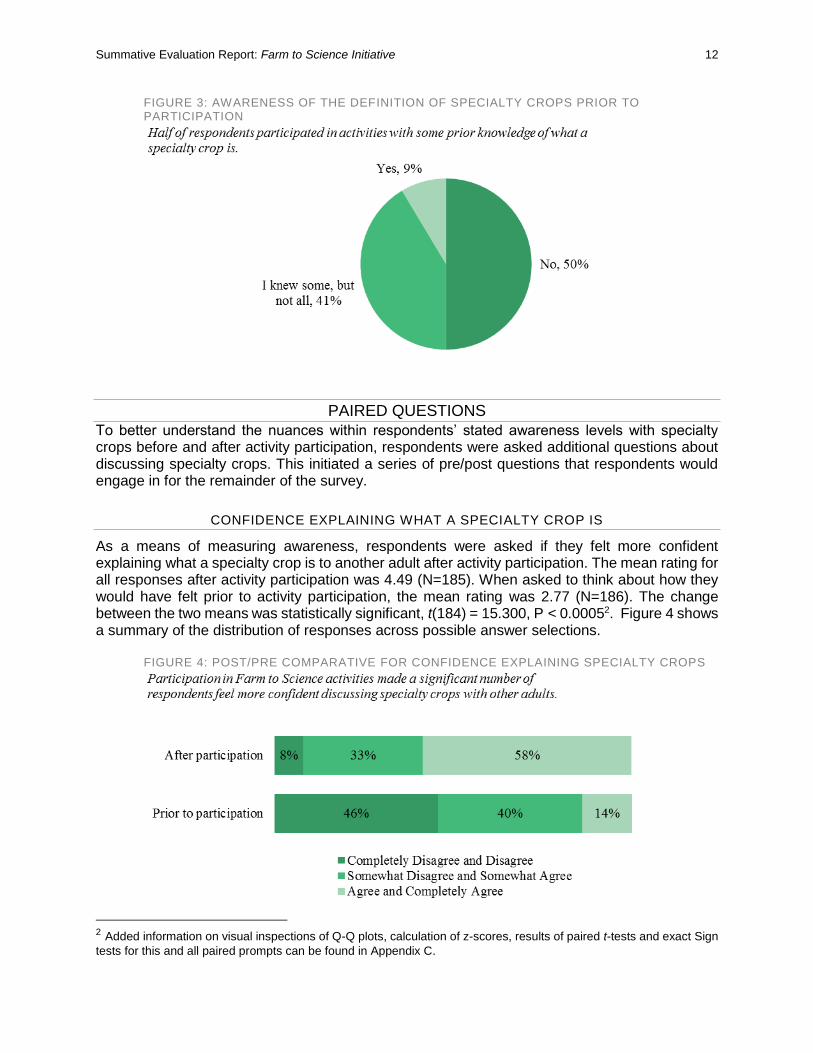
To gather baseline knowledge of specialty crops prior to participation, participants were asked to respond to the definition of specialty crops1. Specifically, they were asked to indicate if this is the definition they would have used prior to participation. Figure 3 demonstrates that exactly half the respondents (n=93) had some awareness, or complete awareness, of what a specialty crop is, based on how much they felt they would have agreed with the ODA definition of a specialty crop prior to their participation in activities.
1 The definition used (United States Department of Agriculture, Agricultre Marketing Service n.d.): “Specialty crops can
be any fruit or vegetable, tree nut, dried fruit, horticulture, and/or a nursery crop (including floriculture), excluding field and grain crops, oil seed crops, forage crops, and fiber crops. A specialty crop’s primary function has to be related to what it is (ex: food, medicinal purposes, and/or aesthetic gratification) in order to be considered specialty crops.”
3%
4%
9%
35%
34%
15%
Not at all
Very little
A little
Somewhat
A lot
A great deal
Farm to Science Activities increased participants' awareness of specialty crops.
Summative Evaluation Report: Farm to Science Initiative 12
FIGURE 3: AWARENESS OF THE DEFINITION OF SPECIALTY CROPS PRIOR TO PARTICIPATION
PAIRED QUESTIONS
To better understand the nuances within respondents’ stated awareness levels with specialty crops before and after activity participation, respondents were asked additional questions about discussing specialty crops. This initiated a series of pre/post questions that respondents would engage in for the remainder of the survey.
CONFIDENCE EXPLAINING WHAT A SPECIALTY CROP IS
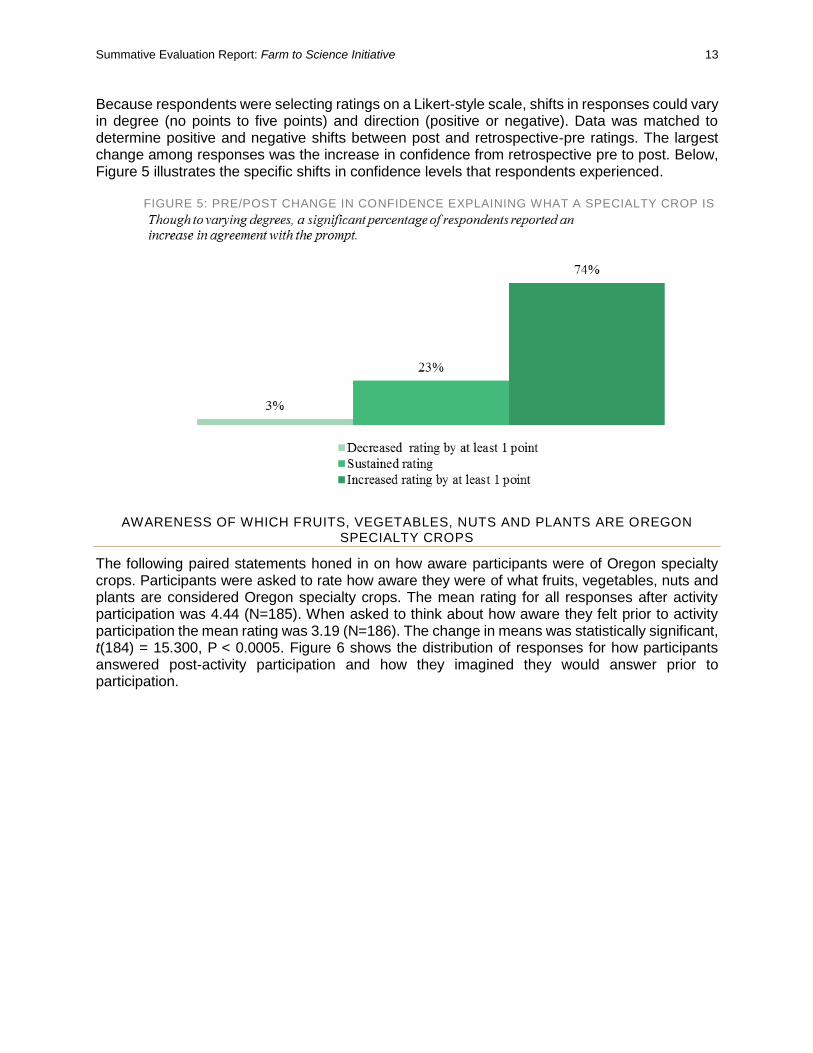
As a means of measuring awareness, respondents were asked if they felt more confident explaining what a specialty crop is to another adult after activity participation. The mean rating for all responses after activity participation was 4.49 (N=185). When asked to think about how they would have felt prior to activity participation, the mean rating was 2.77 (N=186). The change between the two means was statistically significant, t(184) = 15.300, P < 0.00052. Figure 4 shows a summary of the distribution of responses across possible answer selections.
FIGURE 4: POST/PRE COMPARATIVE FOR CONFIDENCE EXPLAINING SPECIALTY CROPS
2 Added information on visual inspections of Q-Q plots, calculation of z-scores, results of paired t-tests and exact Sign
tests for this and all paired prompts can be found in Appendix C.
Summative Evaluation Report: Farm to Science Initiative 13
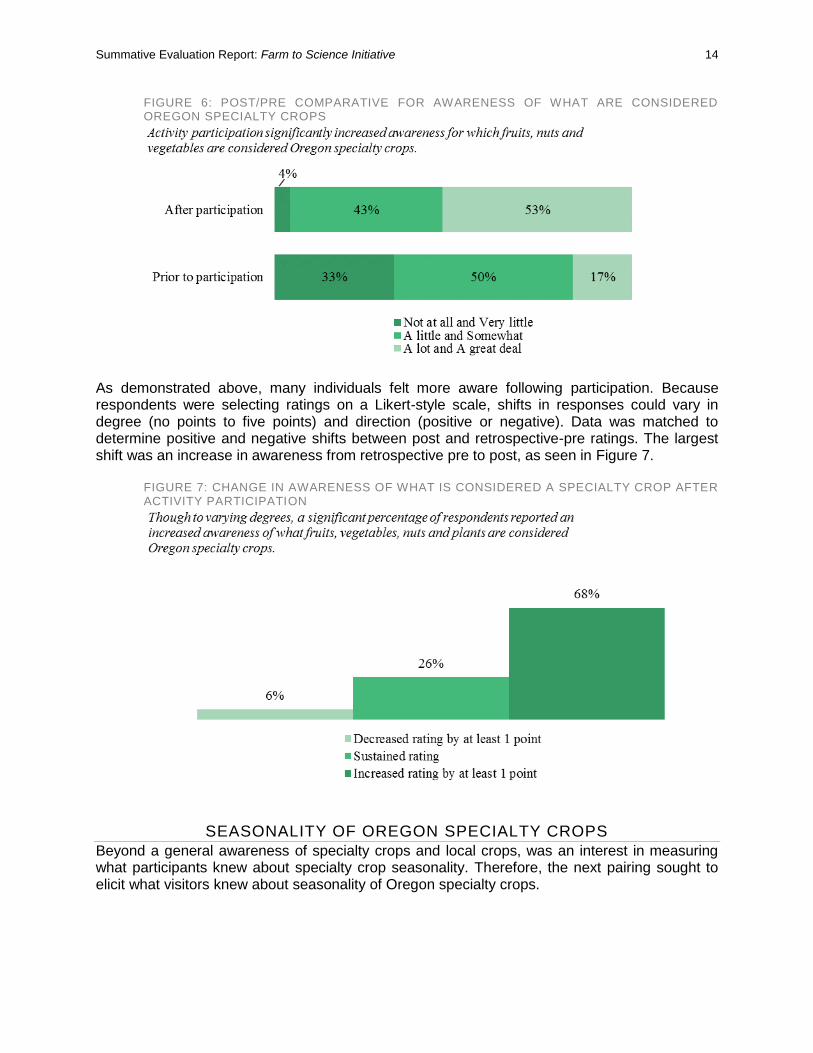
Because respondents were selecting ratings on a Likert-style scale, shifts in responses could vary in degree (no points to five points) and direction (positive or negative). Data was matched to determine positive and negative shifts between post and retrospective-pre ratings. The largest change among responses was the increase in confidence from retrospective pre to post. Below, Figure 5 illustrates the specific shifts in confidence levels that respondents experienced.
FIGURE 5: PRE/POST CHANGE IN CONFIDENCE EXPLAINING WHAT A SPECIALTY CROP IS
AWARENESS OF WHICH FRUITS, VEGETABLES, NUTS AND PLANTS ARE OREGON SPECIALTY CROPS
The following paired statements honed in on how aware participants were of Oregon specialty crops. Participants were asked to rate how aware they were of what fruits, vegetables, nuts and plants are considered Oregon specialty crops. The mean rating for all responses after activity participation was 4.44 (N=185). When asked to think about how aware they felt prior to activity participation the mean rating was 3.19 (N=186). The change in means was statistically significant, t(184) = 15.300, P < 0.0005. Figure 6 shows the distribution of responses for how participants answered post-activity participation and how they imagined they would answer prior to participation.
Summative Evaluation Report: Farm to Science Initiative 14
FIGURE 6: POST/PRE COMPARATIVE FOR AWARENESS OF WHAT ARE CONSIDERED OREGON SPECIALTY CROPS
As demonstrated above, many individuals felt more aware following participation. Because respondents were selecting ratings on a Likert-style scale, shifts in responses could vary in degree (no points to five points) and direction (positive or negative). Data was matched to determine positive and negative shifts between post and retrospective-pre ratings. The largest shift was an increase in awareness from retrospective pre to post, as seen in Figure 7.
FIGURE 7: CHANGE IN AWARENESS OF WHAT IS CONSIDERED A SPECIALTY CROP AFTER ACTIVITY PARTICIPATION
SEASONALITY OF OREGON SPECIALTY CROPS
Beyond a general awareness of specialty crops and local crops, was an interest in measuring what participants knew about specialty crop seasonality. Therefore, the next pairing sought to elicit what visitors knew about seasonality of Oregon specialty crops.
Summative Evaluation Report: Farm to Science Initiative 15
CONFIDENCE TALKING ABOUT SPECIALTY CROP SEASONALITY
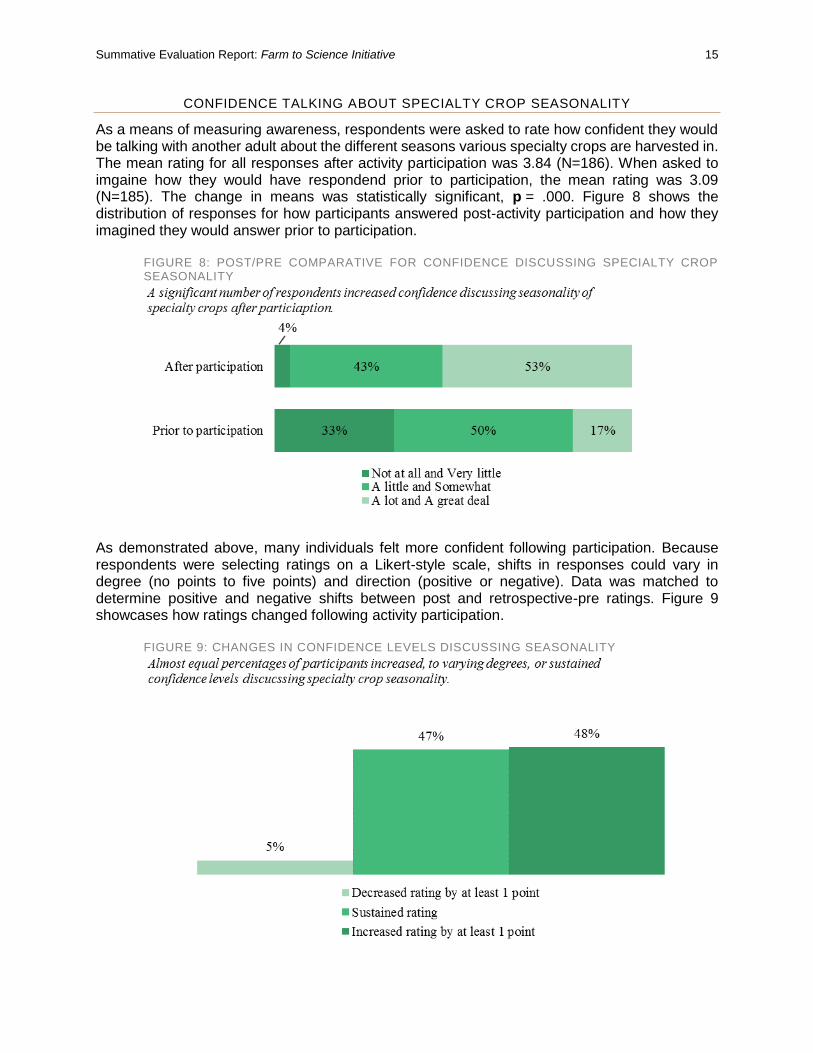
As a means of measuring awareness, respondents were asked to rate how confident they would be talking with another adult about the different seasons various specialty crops are harvested in. The mean rating for all responses after activity participation was 3.84 (N=186). When asked to imgaine how they would have respondend prior to participation, the mean rating was 3.09 (N=185). The change in means was statistically significant, p = .000. Figure 8 shows the distribution of responses for how participants answered post-activity participation and how they imagined they would answer prior to participation.
FIGURE 8: POST/PRE COMPARATIVE FOR CONFIDENCE DISCUSSING SPECIALTY CROP SEASONALITY
As demonstrated above, many individuals felt more confident following participation. Because respondents were selecting ratings on a Likert-style scale, shifts in responses could vary in degree (no points to five points) and direction (positive or negative). Data was matched to determine positive and negative shifts between post and retrospective-pre ratings. Figure 9 showcases how ratings changed following activity participation.
FIGURE 9: CHANGES IN CONFIDENCE LEVELS DISCUSSING SEASONALITY
Summative Evaluation Report: Farm to Science Initiative 16
INTEREST AND MOTIVATION FOR PURCHASING OREGON SPECIALTY CROPS
The survey concluded by asking respondents the extent to which they agreed with six paired statements related to purchasing behaviors, interest and motivations. These questions aimed to explore how interested participants were in purchasing locally, how this interest may impact their purchasing decisions and what may motivate them to purchase locally, before and after participation in the activity.
WHEN I GO TO THE GROCERY STORE, I WANT TO KNOW WHERE MY FOOD WAS PRODUCED
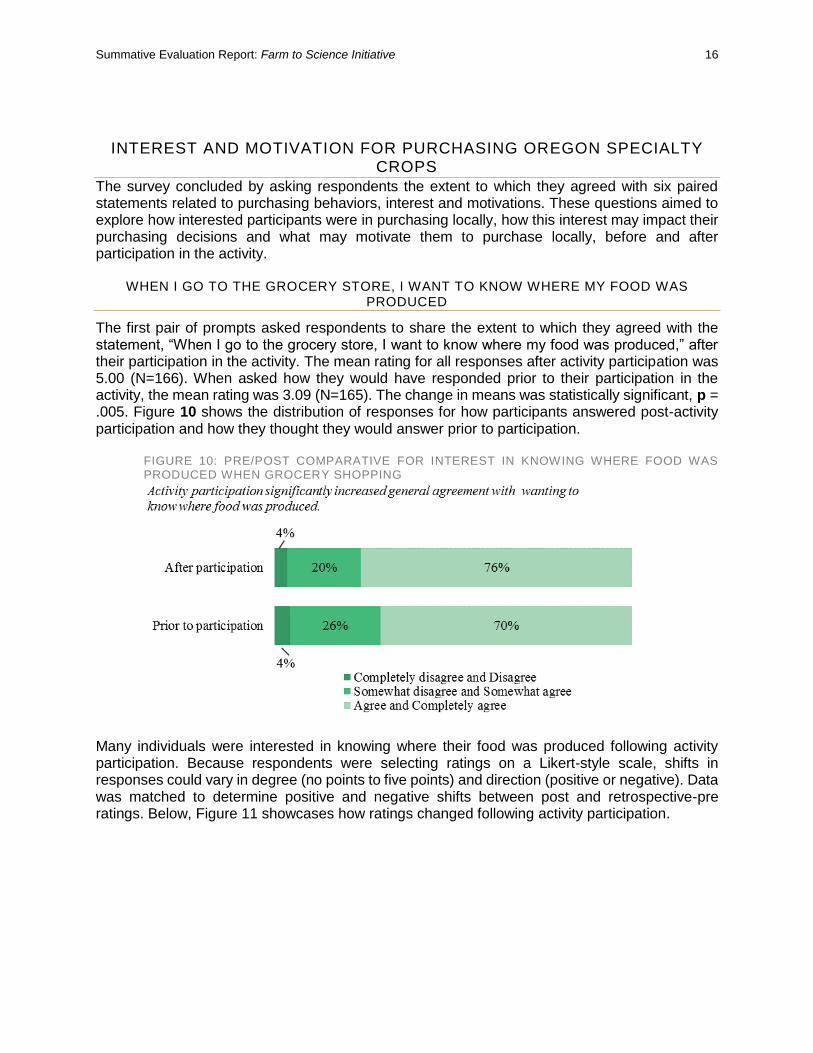
The first pair of prompts asked respondents to share the extent to which they agreed with the statement, “When I go to the grocery store, I want to know where my food was produced,” after their participation in the activity. The mean rating for all responses after activity participation was 5.00 (N=166). When asked how they would have responded prior to their participation in the activity, the mean rating was 3.09 (N=165). The change in means was statistically significant, p = .005. Figure 10 shows the distribution of responses for how participants answered post-activity participation and how they thought they would answer prior to participation.
FIGURE 10: PRE/POST COMPARATIVE FOR INTEREST IN KNOWING WHERE FOOD WAS PRODUCED WHEN GROCERY SHOPPING
Many individuals were interested in knowing where their food was produced following activity participation. Because respondents were selecting ratings on a Likert-style scale, shifts in responses could vary in degree (no points to five points) and direction (positive or negative). Data was matched to determine positive and negative shifts between post and retrospective-pre ratings. Below, Figure 11 showcases how ratings changed following activity participation.
Summative Evaluation Report: Farm to Science Initiative 17
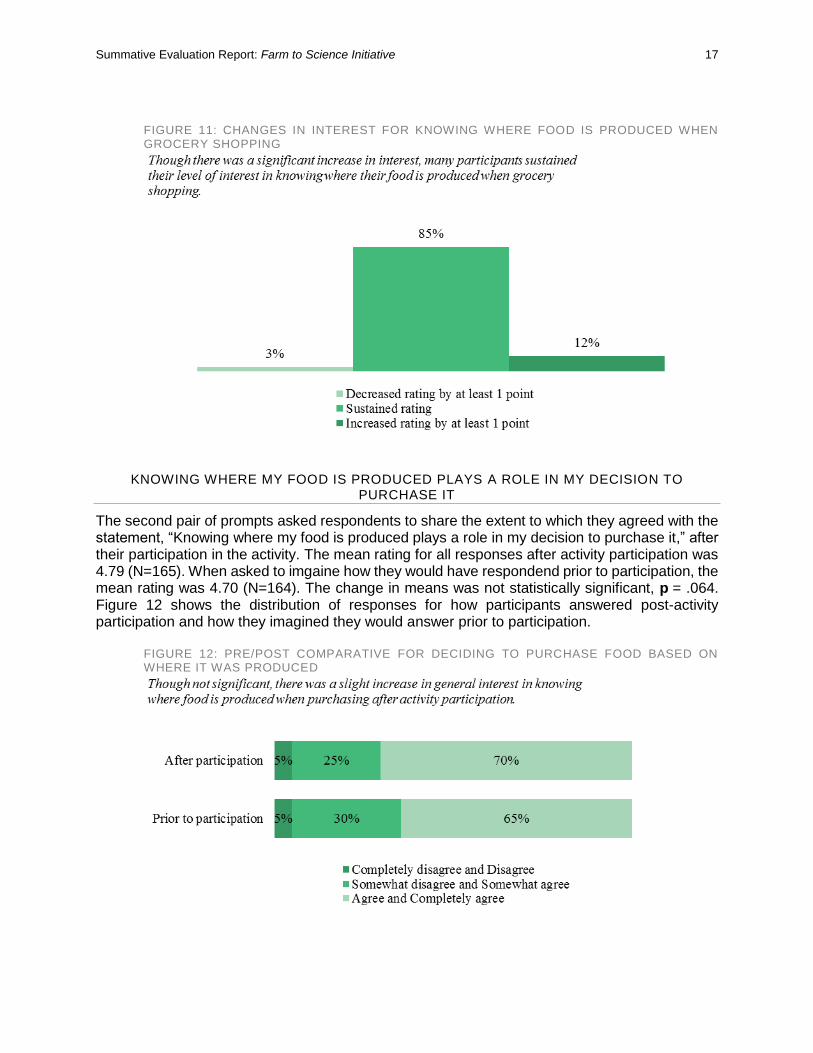
FIGURE 11: CHANGES IN INTEREST FOR KNOWING WHERE FOOD IS PRODUCED WHEN GROCERY SHOPPING
KNOWING WHERE MY FOOD IS PRODUCED PLAYS A ROLE IN MY DECISION TO
PURCHASE IT
The second pair of prompts asked respondents to share the extent to which they agreed with the statement, “Knowing where my food is produced plays a role in my decision to purchase it,” after their participation in the activity. The mean rating for all responses after activity participation was 4.79 (N=165). When asked to imgaine how they would have respondend prior to participation, the mean rating was 4.70 (N=164). The change in means was not statistically significant, p = .064. Figure 12 shows the distribution of responses for how participants answered post-activity participation and how they imagined they would answer prior to participation.
FIGURE 12: PRE/POST COMPARATIVE FOR DECIDING TO PURCHASE FOOD BASED ON WHERE IT WAS PRODUCED
Summative Evaluation Report: Farm to Science Initiative 18
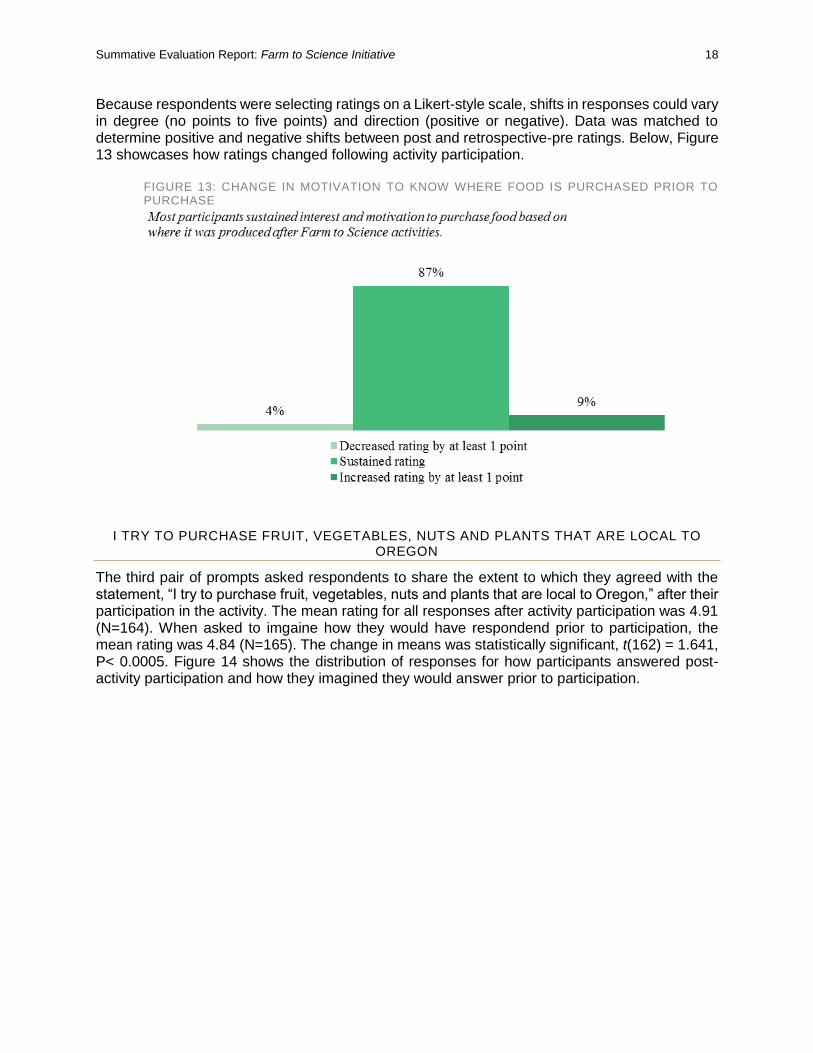
Because respondents were selecting ratings on a Likert-style scale, shifts in responses could vary in degree (no points to five points) and direction (positive or negative). Data was matched to determine positive and negative shifts between post and retrospective-pre ratings. Below, Figure 13 showcases how ratings changed following activity participation.
FIGURE 13: CHANGE IN MOTIVATION TO KNOW WHERE FOOD IS PURCHASED PRIOR TO PURCHASE
I TRY TO PURCHASE FRUIT, VEGETABLES, NUTS AND PLANTS THAT ARE LOCAL TO
OREGON
The third pair of prompts asked respondents to share the extent to which they agreed with the statement, “I try to purchase fruit, vegetables, nuts and plants that are local to Oregon,” after their participation in the activity. The mean rating for all responses after activity participation was 4.91 (N=164). When asked to imgaine how they would have respondend prior to participation, the mean rating was 4.84 (N=165). The change in means was statistically significant, t(162) = 1.641, P< 0.0005. Figure 14 shows the distribution of responses for how participants answered post-activity participation and how they imagined they would answer prior to participation.
Summative Evaluation Report: Farm to Science Initiative 19
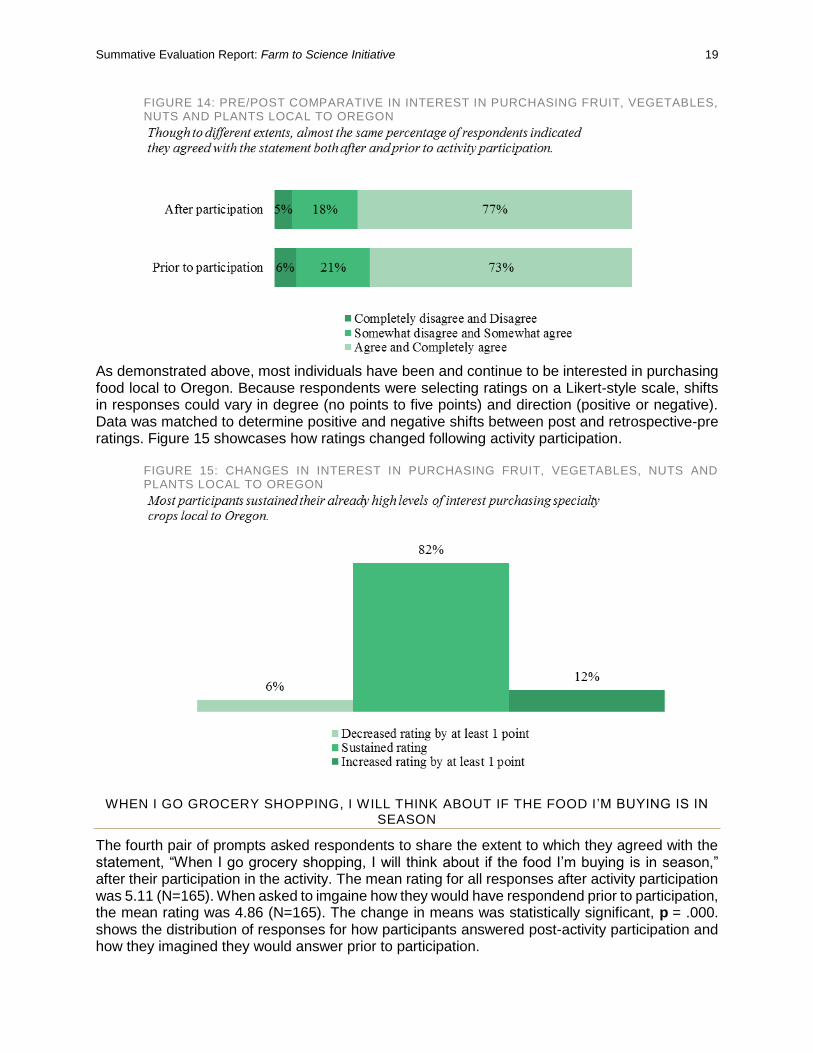
FIGURE 14: PRE/POST COMPARATIVE IN INTEREST IN PURCHASING FRUIT, VEGETABLES, NUTS AND PLANTS LOCAL TO OREGON
As demonstrated above, most individuals have been and continue to be interested in purchasing food local to Oregon. Because respondents were selecting ratings on a Likert-style scale, shifts in responses could vary in degree (no points to five points) and direction (positive or negative). Data was matched to determine positive and negative shifts between post and retrospective-pre ratings. Figure 15 showcases how ratings changed following activity participation.
FIGURE 15: CHANGES IN INTEREST IN PURCHASING FRUIT, VEGETABLES, NUTS AND PLANTS LOCAL TO OREGON
WHEN I GO GROCERY SHOPPING, I WILL THINK ABOUT IF THE FOOD I ’M BUYING IS IN SEASON
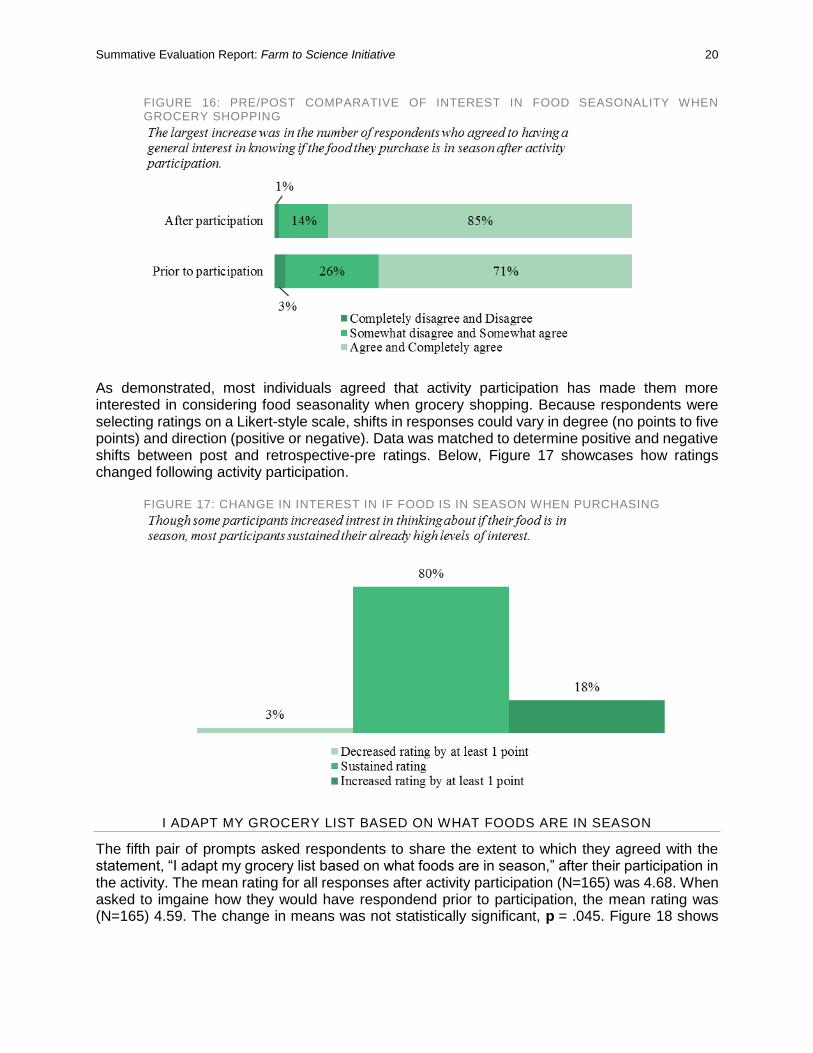
The fourth pair of prompts asked respondents to share the extent to which they agreed with the statement, “When I go grocery shopping, I will think about if the food I’m buying is in season,” after their participation in the activity. The mean rating for all responses after activity participation was 5.11 (N=165). When asked to imgaine how they would have respondend prior to participation, the mean rating was 4.86 (N=165). The change in means was statistically significant, p = .000. shows the distribution of responses for how participants answered post-activity participation and how they imagined they would answer prior to participation.
Summative Evaluation Report: Farm to Science Initiative 20
FIGURE 16: PRE/POST COMPARATIVE OF INTEREST IN FOOD SEASONALITY WHEN GROCERY SHOPPING
As demonstrated, most individuals agreed that activity participation has made them more interested in considering food seasonality when grocery shopping. Because respondents were selecting ratings on a Likert-style scale, shifts in responses could vary in degree (no points to five points) and direction (positive or negative). Data was matched to determine positive and negative shifts between post and retrospective-pre ratings. Below, Figure 17 showcases how ratings changed following activity participation.
FIGURE 17: CHANGE IN INTEREST IN IF FOOD IS IN SEASON WHEN PURCHASING
I ADAPT MY GROCERY LIST BASED ON WHAT FOODS ARE IN SEASON
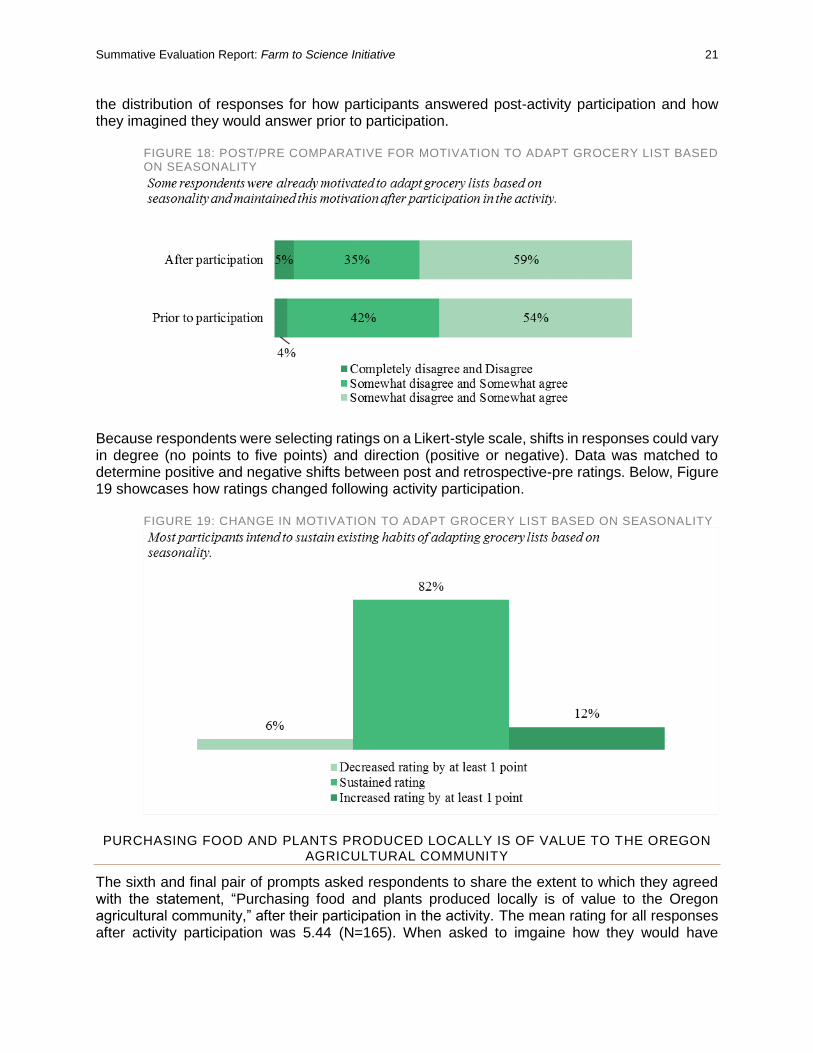
The fifth pair of prompts asked respondents to share the extent to which they agreed with the statement, “I adapt my grocery list based on what foods are in season,” after their participation in the activity. The mean rating for all responses after activity participation (N=165) was 4.68. When asked to imgaine how they would have respondend prior to participation, the mean rating was (N=165) 4.59. The change in means was not statistically significant, p = .045. Figure 18 shows
Summative Evaluation Report: Farm to Science Initiative 21
the distribution of responses for how participants answered post-activity participation and how they imagined they would answer prior to participation.
FIGURE 18: POST/PRE COMPARATIVE FOR MOTIVATION TO ADAPT GROCERY LIST BASED ON SEASONALITY
Because respondents were selecting ratings on a Likert-style scale, shifts in responses could vary in degree (no points to five points) and direction (positive or negative). Data was matched to determine positive and negative shifts between post and retrospective-pre ratings. Below, Figure 19 showcases how ratings changed following activity participation.
FIGURE 19: CHANGE IN MOTIVATION TO ADAPT GROCERY LIST BASED ON SEASONALITY
PURCHASING FOOD AND PLANTS PRODUCED LOCALLY IS OF VALUE TO THE OREGON AGRICULTURAL COMMUNITY
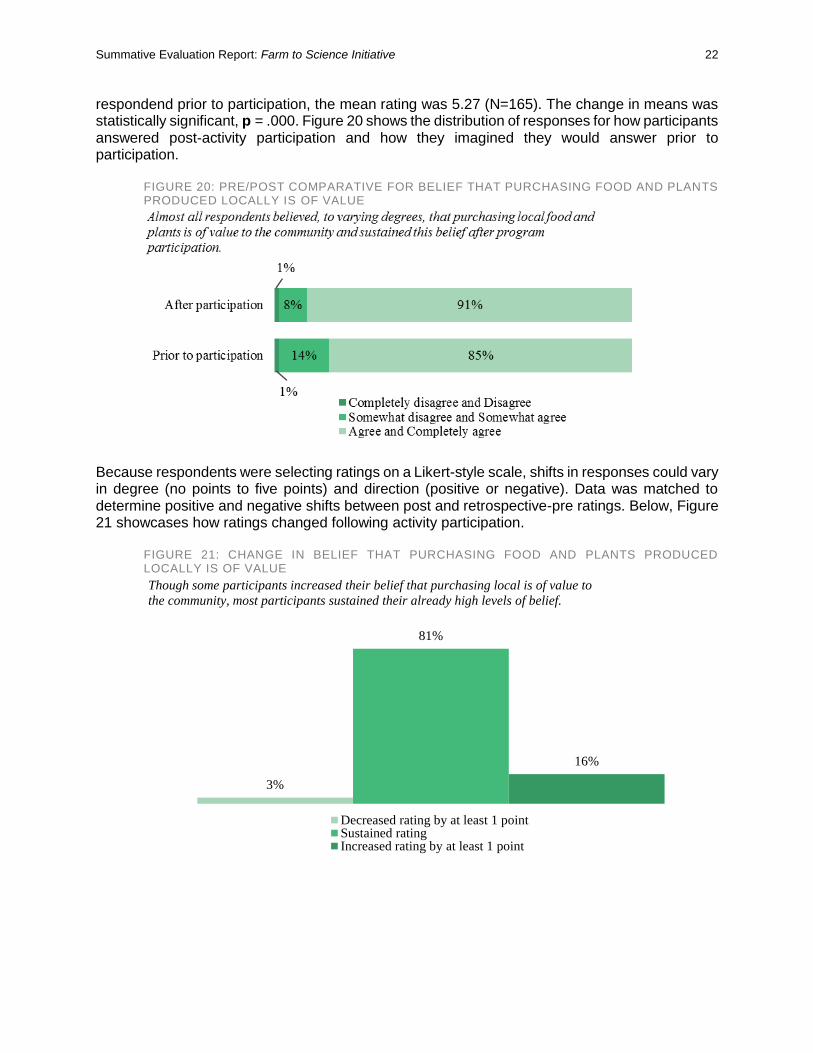
The sixth and final pair of prompts asked respondents to share the extent to which they agreed with the statement, “Purchasing food and plants produced locally is of value to the Oregon agricultural community,” after their participation in the activity. The mean rating for all responses after activity participation was 5.44 (N=165). When asked to imgaine how they would have
Summative Evaluation Report: Farm to Science Initiative 22
respondend prior to participation, the mean rating was 5.27 (N=165). The change in means was statistically significant, p = .000. Figure 20 shows the distribution of responses for how participants answered post-activity participation and how they imagined they would answer prior to participation.
FIGURE 20: PRE/POST COMPARATIVE FOR BELIEF THAT PURCHASING FOOD AND PLANTS PRODUCED LOCALLY IS OF VALUE
Because respondents were selecting ratings on a Likert-style scale, shifts in responses could vary in degree (no points to five points) and direction (positive or negative). Data was matched to determine positive and negative shifts between post and retrospective-pre ratings. Below, Figure 21 showcases how ratings changed following activity participation.
FIGURE 21: CHANGE IN BELIEF THAT PURCHASING FOOD AND PLANTS PRODUCED LOCALLY IS OF VALUE
3%
81%
16%
Though some participants increased their belief that purchasing local is of value to
the community, most participants sustained their already high levels of belief.
Decreased rating by at least 1 pointSustained ratingIncreased rating by at least 1 point
Summative Evaluation Report: Farm to Science Initiative 23
SUMMARY OF FINDINGS
The findings from this summative evaluation show that participants had varying degrees of interest and awareness around specialty crops, both generally and specific to Oregon, as well motivations for purchasing such products locally or in season prior to program participation. Farm to Science programing was able to build on these varying entry points and make significant impact by raising participants’ awareness of what a specialty crops is, the types of crops and the seasonality of specialty crops in Oregon. When measuring awareness before and after activity participation, the study revealed that participants typically felt they had a higher level of awareness of specialty crops after the experience. When describing their baseline awareness prior to participation, 50% claimed not to have any and 41% only claimed to have some. Awareness specifically increased around understanding what a specialty crops is and what crops are native to Oregon. For example, 84% of respondents reported that participating in Farm to Science activities shaped their awareness in some capacity. At 69%, there was a significant increase in awareness among respondents of what crops are local to the state. Activities also impacted participants’ confidence in talking about specialty crops. A significant number or respondents (74%) reported an increase in comfort explaining to other adults what a specialty crop is. For more nuanced topics, such as crop seasonality, there was a 48% increase in comfort talking about it. Prior to experiences with Farm to Science activities, participants already had relatively high levels of agreement with statements around their motivation, behaviors and understanding of the value related to purchasing crops locally and when in season. Across the various prompts, mean ratings fell between “Somewhat agree” (4) and “Completely agree” (6). Rather than significantly impacting these already-high levels of agreement, activities were successful at sustaining them. Sustainment levels across all prompts fell between 80-87%.
Summative Evaluation Report: Farm to Science Initiative 24
DISCUSSION
The overarching focus of Farm to Science activities was to increase awareness of Oregon specialty crops, and interest in purchasing Oregon specialty crops. Summative evaluation revealed that participants who interacted with Farm to Science were able to increase awareness and interest of specialty crops after activity participation. This held true for respondents who claimed to have some awareness of the specialty crops industry, as well as for those who admittedly had little to none. A deeper look at some of the pre/post paired questions and prompts revealed a significant shift or increase in interest and awareness, while others provided evidence of sustained levels of interest and awareness following activity participation. Additionally, summative evaluation confirmed that many participants exhibit desirable purchasing behaviors that are beneficial to the Oregon agricultural community. These include the intent to purchase locally, an interest in purchasing seasonally and agreement that purchasing locally is of value to sustaining this community.
WHERE FARM TO SCIENCE ACTIVITIES MADE A SIGNIFICANT IMPACT
Questions related to specialty crop awareness were more likely to provide evidence of a statistically significant impact on participants than other questions were. Across these paired questions probing at awareness is a running theme of increasing confidence discussing various aspects of the specialty crop industry. Baseline concepts, such as what a specialty crop is, and more focused questions on the specific products which are included in the industry and the seasonality of the crops were explored in these questions. Significant increases in response to these questions validate claims made at the beginning of the survey about activity participation increasing their awareness of specialty crops. Furthermore, significant increases for more basic awareness questions may indicate that this is the largest gap visitors have when approaching Farm to Science activities. That additional significant shifts occurred for more focused, nuanced aspects of the specialty crop industry may confirm that activities were well-structured to support visitors as they learned more about specialty crops. These added shifts may also mean that this is a good starting point for visitors who have a stronger understanding of specialty crops.
FARM TO SCIENCE ACTIVITIES HELPED SUSTAIN INTEREST
Though some of the paired prompts did not return a statistically significant change between post and retrospective pre responses, findings do provide valuable information for consideration. The prompts in reference had a common theme of behavior and motivation related to purchasing locally and purchasing seasonally. Rather than encouraging visitors towards desired purchasing behaviors or changing shopping motivation, Farm to Science activities may have helped sustain what the data has shown to be already-strong levels of intentionality and motivation. One conclusion from this might be that these desired behaviors pre-date participation in Farm to Science activities for many participants. It is worth noting that this sustained belief may also be a reflection of the type of person who chooses to attend a food science-related activity and may already be of the inclination to be interested and motivated towards desired purchasing behaviors.
CONSIDERATIONS
Aside from successful Farm to Science activity design, there may have been some external contributing factors to the impacts made. For example, all individuals self-selected to participate in the Farm to Science activity prior to learning about the evaluation. Following participation, individuals were asked to complete a survey; the respondents who accepted are reflected in this summative evaluation. Individuals who initially choose to participate in Farm to Science activities and subsequently participate in a related study may be more inherently interested in the topic
Summative Evaluation Report: Farm to Science Initiative 25
than other general visitors to OMSI. Further, and as mentioned in the project application, residents in Portland, Oregon have a reputation for mindful purchasing habits (local, organic produce and meats); it may be that general visitors have strong tendencies towards an interest or awareness in the specialty crop industry. With these considerations, it becomes interesting to think about the potential for similar programs and events related to specialty crops:
What kind of an impact could Farm to Science activities have in other communities or with a more diverse group of participants?
Given that participants generally come to activities with some understanding of what specialty crops are and a tendency to purchase locally, what other opportunities between the Farm to Science initiative and ODA might deepen the interest, behaviors and intentions of this existing group through more in-depth programs?
What other purchasing outcomes does ODA hope to see from the Oregon population related to purchasing? In what ways can future Farm to Science programming or other OMSI partnerships with ODA build on the outcomes explored in this summative evaluation?
Summative Evaluation Report: Farm to Science Initiative 26
BIBLIOGRAPHY
Ajzen, Icek. 2002. "Perceived Behavioral Control, Self-Efficacy, Locus of Control, and the Theory of Planned Behavior." Journal of Applied Social Psychology 665-683.
Ajzen, Icek. 1991. "The Theory of Planned Behavior." Organizational Behavior and Human Decision Processes 179-211.
Consoli, Domenico. 2009. "Emotions that influence purchase decisions and their electronic processing." Annales Universitatis Apulensis Series Oeconomica 996-1008.
Dewar, Patricia E, Shea A Keene, Terah N Kalk, David G Clark, Thomas A Colquhoun, and Howard R Moskowitz. 2016. "Identifying the Drivers of a Foliage Plant Purchasing Decision via Contemporary Psychophysics." Journal of Horticulture.
Down, Kylie, and Karena J. Burke. 2013. "The influence of ethical values and food choice motivations on intentions to purchase sustainably sourced foods." Appetite 137-144.
Ekman, Paul. 2007. Emotions Revealed: Recognizing Faces and Feelings to Improve Communication and Emotional Life. New York: St. Martin's Press.
Ghasemi, Asghar, and Saleh Zahediasl. 2012. "Normality Tests for Statistical Analysis: A Guide for Non-Statisticians." Int J Endocrinol Metab. 486-9.
Lee, Hyun-Joo, and Zee-Sun Yun. 2015. "Consumers' perceptions of organic food attributes and cognitive and affective attitudes as determinants of their purchase intentions toward organic food." Food Quality and Preference 250-267.
Liao, Lewis Xinwei, Armando Maria Corsi, Polymeros Chrysochou, and Larry Lockshin. 2015. "Emotional repsonses towards food packaging: A joint application of self-report and physiological measures of emotion." Food Quality and Preference 48-55.
Organ, Kate, Nicole Koenig-Lewis, and Jane Probert. 2015. "Festivals as agents for behaviour change: A study of food festival engagement and subsequent food choices." Tourism Management 84-99.
United States Department of Agriculture, Agricultre Marketing Service. n.d. What is a Specialty Crop? Accessed November 21, 2014. http://www.ams.usda.gov/services/grants/scbgp/specialty-crop.
Summative Evaluation Report: Farm to Science Initiative 27
Summative Evaluation Report
Supplement to the Farm to Science Programming and Events Summative Evaluation
November 2016
Summative Evaluation Report: Farm to Science Initiative 28
CONTENTS
Figures ......................................................................................................................................28
Project Background and Goals ..................................................................................................29
Evaluation Purpose ...................................................................................................................29
Evaluation Questions ................................................................................................................30
Methodology .............................................................................................................................31
Study Design .........................................................................................................................31
Data Collection ......................................................................................................................31
Sample ..................................................................................................................................31
Findings ....................................................................................................................................33
Respondent Activity at Harvest Fest ......................................................................................33
Emotional Engagement with Harvest Fest .............................................................................35
Specialty Crop Awareness .....................................................................................................37
Respondent’s Current & Intended Purchasing Behaviors ......................................................40
Discussion ................................................................................................................................42
Awareness of Specialty Crops and Local Vendors Increased ................................................42
Visitors had Positive Experiences at Harvest Fest .................................................................43
Future Considerations ...........................................................................................................43
Bibliography ..............................................................................................................................44
Appendix D: Harvest Fest Event Map .......................................................................................52
Appendix E: Exit Survey Instrument ..........................................................................................53
FIGURES
Figure 1: Age ranges of respondents, N=109 ............................................................................32 Figure 2: Activities respondents indicated they most interacted with, N=115 .............................33 Figure 3: Activities respondents indicated they least interacted with, N=115 .............................34 Figure 4: Respondents' satisfaction with various Harvest Fest features, N=108 ........................34 Figure 5: Extent to which respondents felt positive emotions at Harvest Fest ...........................36 Figure 6: Extent to which respondents felt negative emotions at Harvest Fest ..........................36 Figure 7: Familiarity with specialty crop definition prior to Harvest Fest .....................................38 Figure 8: Awareness of specialty crops after attending Harvest Fest ........................................38 Figure 9: Confidence discussing specialty crops after 2016 Harvest Fest, N = 110 ...................39 Figure 10: Confidence discussing specialty crops after 2015 Harvest Fest, N=41 .....................40 Figure 11: Respondents' current purchasing behaviors, N=110 ................................................40 Figure 12: Respondent's intended purchasing behaviors, N=110 ..............................................41
Summative Evaluation Report: Farm to Science Initiative 29
PROJECT BACKGROUND AND GOALS
In 2014, the Oregon Museum of Science and Industry (OMSI) received funding from the Oregon Department of Agriculture (ODA) Specialty Crop Block Grant Program (SCBGP), to enhance the competitiveness of Oregon's specialty crops. OMSI submitted an application for a season of activities which aimed to address the need for increased awareness of the breadth and diversity of crops grown throughout the state. The application advocated that a more aware and educated consumer base will allow the specialty crop industry to continue to grow. With funding, OMSI was able to provide engaging and far-reaching educational experiences for families to learn about the range, diversity, and value of Oregon specialty crops. The hope was that activity participants would become consumers who make informed and healthful food purchasing choices. OMSI worked in close partnership with a group of local specialty crop producers and advocacy organizations to increase public awareness of and interest in Oregon’s vibrant specialty crop industry, with the hope of increasing specialty crop sales. The Farm to Science season of activities took place during the height of the 2015 growing season (June-October, 2015). Activities which contributed to the Farm to Science season included: OMSI After Dark, Food Science Demos, Meet a Farmer Tabling, Food Science Labs, Science Pubs, Better Bites, and Harvest Fest. Activities offered through Farm to Science sought to benefit the Oregon specialty crop industry, with its focus on raising the visibility of eligible specialty crops through a variety of education methods and partnerships. The Farm to Science project was intentionally designed to target and support a range of organizations, including producers, farmers, commissions, and industry advocates. The OMSI Research and Evaluation team conducted a summative evaluation study of the initiative with visitors throughout the summer in 2015. A few months later, OMSI sought to amend its award with a no-cost extension into 2016. It was identified that Harvest Fest provided an opportunity for OMSI to strengthen relationships with specialty crop vendors across Oregon, increase awareness of specialty crops and specialty crop seasonality with the public, and test food festivals as a platform for specialty crop engagement on a larger scale. Prolonging the grant period allowed OMSI to repeat Harvest Fest in October 2016, which is the focus of this report, giving the team a full year to prepare. Similar to the first grant year, this event date was selected to utilize as many partners as possible, catching vendors at the end of the season when most of the area’s major farmer’s markets have ended.
EVALUATION PURPOSE
The purpose of this supplemental evaluation report is to build on findings from 2015’s summative evaluation of the ODA Farm to Science Initiative, and look deeper at where activities were sustaining high levels of desired behaviors. Research has proven that there is a link between involvement at food festivals and participant purchase of organic foods (Organ, Koenig-Lewis and Probert 2015). This year’s Harvest Fest provided a unique opportunity to conduct an exploratory study which responds to this research by using program evaluation to put a focus on the relationship between food festivals and the purchase of specialty crops. Research also shows that this relationship can be measured via emotional response to participation and shifts in attitude (Lee and Yun 2015). As such, this evaluation sought to learn from Harvest Fest visitors their emotional motivations for purchasing specialty crops, and how participation at the event contributes to these motivations. Specific study aims also sought to look at the emotional connection to locality of specialty crops (which is where most respondents indicated sustained behavior in the 2015 summative report).
Summative Evaluation Report: Farm to Science Initiative 30
EVALUATION QUESTIONS
What does engagement with specialty crops look like at Harvest Fest? o Measure of Success: Many visitors will report discussing food preparation,
knowledge sharing, and taking part in practical demonstrations.
What does involvement with specialty crops look like at Harvest Fest? o Measure of Success: Many visitors will report personal concern about where their
food is sourced from.
What kind of emotional responses are Harvest Fest participants having towards the purchase of specialty crops?
o Measure of Success: Most visitors will report experiencing positive emotions (happy, excited, pleased, content, pleasantly surprised) while at Harvest Fest.
o Measure of Success: Very few visitors will report that they had a negative emotional experience (annoyed, disappointed, unfulfilled, frustrated) while at Harvest Fest.
Summative Evaluation Report: Farm to Science Initiative 31
METHODOLOGY
STUDY DESIGN
All information was self-reported by participants through an exit survey after attending Harvest Fest. Respondents were asked to recall their engagement and involvement with Harvest Fest activities, their emotional response to Harvest Fest, their awareness of and interest in specialty crops, and their intended purchasing behavior regarding specialty crops following attendance.
DATA COLLECTION
Harvest Fest occurred on Sunday, October 2, 2016, from 10 AM to 4 PM. Though the event was free, this date was selected to coincide with OMSI’s $2 Sunday. On this day, admission to OMSI is reduced in an effort to make the museum more accessible. Harvest Fest was held in a vacant lot on OMSI’s property. This lot is situated on the southern end of OMSI’s campus, along the waterfront and near public transportation hubs. Appendix A provides a map of the lot, including the entrances/exits where data collectors were stationed. Data collection occurred between 1-4 PM, when event participation was anticipated to be the highest. A total of four data collectors were present, with two data collectors per entrance/exit. Data was collected via a paper exit survey. As an adult (those who appeared to be 18 or older) walked towards the Harvest Fest exits, a data collector approached and asked if they might be interested in participating in a short survey. Data collectors outlined the purpose of the survey, including how the information will be used (to gather feedback on their experience to help us make future Harvest Fests better, both for the visitor and for communicating about Food Science initiatives), and asked the individual if they agreed to participate. Those who verbally agreed were given the paper survey to complete. In addition to this study’s data collection efforts, additional data collection was occurring in OMSI’s lobby for an unrelated study. To minimize impact on the visitor experience, study leads coordinated efforts and distributed stickers to survey participants and their visitor groups. By asking participants to wear these stickers, data collectors across both projects were able to identify groups that had already provided data and to consider this when approaching them. As such, for Harvest Fest data collection, once a visitor finished completing a survey, the data collector thanked the participant, and asked them if they were heading into the museum. If the respondent stated that they were, they were offered a sticker to indicate their study participation. If they stated that they were not, a sticker was not offered. Data collectors for the Harvest Fest study shared that they did not see anyone wearing a data sticker prior to their participation in this study. Visitors were only identified by survey number—demographic information (age, gender, racial and ethnic identity) was documented, but identifiable information, including the name or address of the visitor, was not requested.
SAMPLE
The overall target sample size was 30–45 adult participants; however, the actual sample size exceeded this goal with 115 responses. Among the 115 responses, 110 surveys were fully completed and 5 were partially completed.
Summative Evaluation Report: Farm to Science Initiative 32
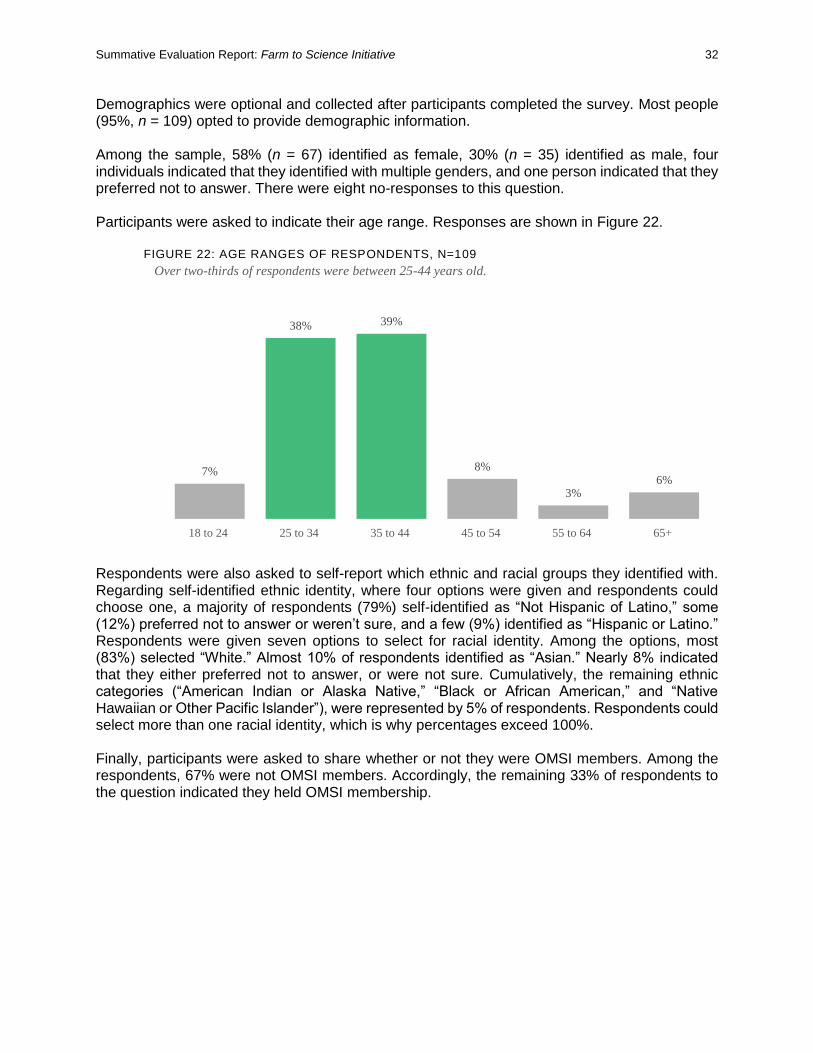
Demographics were optional and collected after participants completed the survey. Most people (95%, n = 109) opted to provide demographic information. Among the sample, 58% (n = 67) identified as female, 30% (n = 35) identified as male, four individuals indicated that they identified with multiple genders, and one person indicated that they preferred not to answer. There were eight no-responses to this question. Participants were asked to indicate their age range. Responses are shown in Figure 22.
FIGURE 22: AGE RANGES OF RESPONDENTS, N=109
Respondents were also asked to self-report which ethnic and racial groups they identified with. Regarding self-identified ethnic identity, where four options were given and respondents could choose one, a majority of respondents (79%) self-identified as “Not Hispanic of Latino,” some (12%) preferred not to answer or weren’t sure, and a few (9%) identified as “Hispanic or Latino.” Respondents were given seven options to select for racial identity. Among the options, most (83%) selected “White.” Almost 10% of respondents identified as “Asian.” Nearly 8% indicated that they either preferred not to answer, or were not sure. Cumulatively, the remaining ethnic categories (“American Indian or Alaska Native,” “Black or African American,” and “Native Hawaiian or Other Pacific Islander”), were represented by 5% of respondents. Respondents could select more than one racial identity, which is why percentages exceed 100%. Finally, participants were asked to share whether or not they were OMSI members. Among the respondents, 67% were not OMSI members. Accordingly, the remaining 33% of respondents to the question indicated they held OMSI membership.
7%
38% 39%
8%
3%6%
18 to 24 25 to 34 35 to 44 45 to 54 55 to 64 65+
Over two-thirds of respondents were between 25-44 years old.
Summative Evaluation Report: Farm to Science Initiative 33
FINDINGS
The aim of this supplemental summative evaluation was to measure how positive emotional engagement with Harvest Fest supported the extent to which Farm to Science met its goals to increase participants’ awareness of Oregon specialty crops and their interest in purchasing Oregon specialty crops. Survey questions were designed to better understand what attendees were doing at Harvest Fest, how aware respondents were of what products were considered specialty crops, and to gauge interest and motivation in purchasing Oregon specialty crops. Across most questions, respondents were given a 6-point Likert-style scale to complete, with 1 being low and 6 being high. Scales measured for self-reported awareness levels, agreement levels, confidence levels, interest levels and degrees of intentionality. In the following sections, the findings from across the survey questions are grouped by Harvest Fest engagement, emotional engagement, specialty crop awareness, and intended purchasing behaviors.
RESPONDENT ACTIVITY AT HARVEST FEST
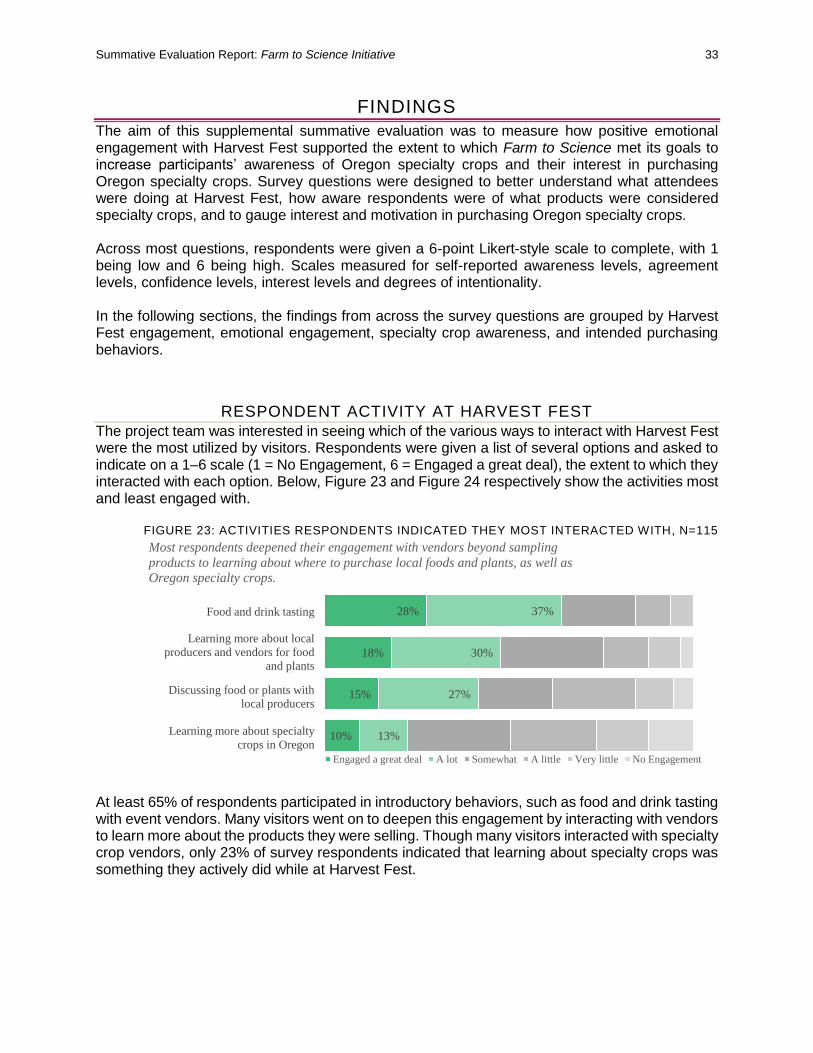
The project team was interested in seeing which of the various ways to interact with Harvest Fest were the most utilized by visitors. Respondents were given a list of several options and asked to indicate on a 1–6 scale (1 = No Engagement, 6 = Engaged a great deal), the extent to which they interacted with each option. Below, Figure 23 and Figure 24 respectively show the activities most and least engaged with.
FIGURE 23: ACTIVITIES RESPONDENTS INDICATED THEY MOST INTERACTED WITH, N=115
At least 65% of respondents participated in introductory behaviors, such as food and drink tasting with event vendors. Many visitors went on to deepen this engagement by interacting with vendors to learn more about the products they were selling. Though many visitors interacted with specialty crop vendors, only 23% of survey respondents indicated that learning about specialty crops was something they actively did while at Harvest Fest.
28%
18%
15%
10%
37%
30%
27%
13%
Most respondents deepened their engagement with vendors beyond sampling
products to learning about where to purchase local foods and plants, as well as
Oregon specialty crops.
Engaged a great deal A lot Somewhat A little Very little No Engagement
Learning more about specialty
crops in Oregon
Learning more about local
producers and vendors for food
and plants
Discussing food or plants with
local producers
Food and drink tasting
Summative Evaluation Report: Farm to Science Initiative 34
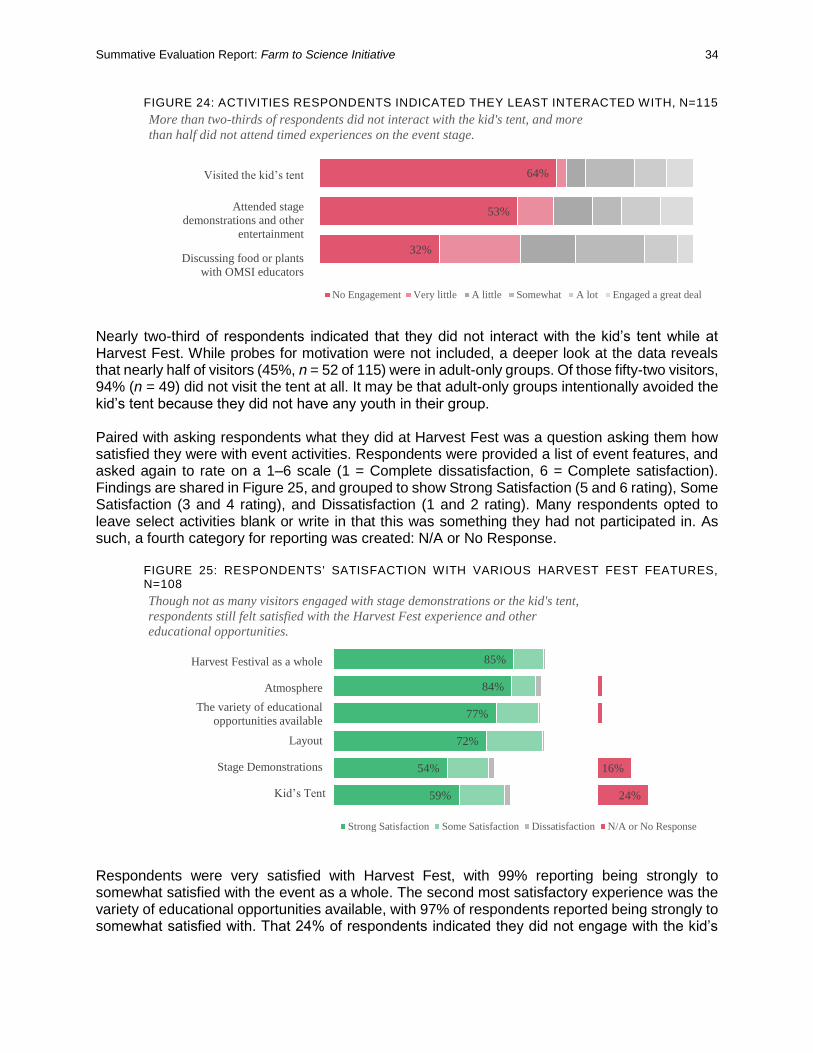
FIGURE 24: ACTIVITIES RESPONDENTS INDICATED THEY LEAST INTERACTED WITH, N=115
Nearly two-third of respondents indicated that they did not interact with the kid’s tent while at Harvest Fest. While probes for motivation were not included, a deeper look at the data reveals that nearly half of visitors (45%, n = 52 of 115) were in adult-only groups. Of those fifty-two visitors, 94% (n = 49) did not visit the tent at all. It may be that adult-only groups intentionally avoided the kid’s tent because they did not have any youth in their group. Paired with asking respondents what they did at Harvest Fest was a question asking them how satisfied they were with event activities. Respondents were provided a list of event features, and asked again to rate on a 1–6 scale (1 = Complete dissatisfaction, 6 = Complete satisfaction). Findings are shared in Figure 25, and grouped to show Strong Satisfaction (5 and 6 rating), Some Satisfaction (3 and 4 rating), and Dissatisfaction (1 and 2 rating). Many respondents opted to leave select activities blank or write in that this was something they had not participated in. As such, a fourth category for reporting was created: N/A or No Response.
FIGURE 25: RESPONDENTS' SATISFACTION WITH VARIOUS HARVEST FEST FEATURES, N=108
Respondents were very satisfied with Harvest Fest, with 99% reporting being strongly to somewhat satisfied with the event as a whole. The second most satisfactory experience was the variety of educational opportunities available, with 97% of respondents reported being strongly to somewhat satisfied with. That 24% of respondents indicated they did not engage with the kid’s
64%
53%
32%
More than two-thirds of respondents did not interact with the kid's tent, and more
than half did not attend timed experiences on the event stage.
No Engagement Very little A little Somewhat A lot Engaged a great deal
Attended stage
demonstrations and other
entertainment
Discussing food or plants
with OMSI educators
Visited the kid’s tent
59%
54%
72%
77%
84%
85%
24%
16%
Though not as many visitors engaged with stage demonstrations or the kid's tent,
respondents still felt satisfied with the Harvest Fest experience and other
educational opportunities.
Strong Satisfaction Some Satisfaction Dissatisfaction N/A or No Response
Harvest Festival as a whole
Atmosphere
The variety of educational
opportunities available
Layout
Stage Demonstrations
Kid’s Tent
Summative Evaluation Report: Farm to Science Initiative 35
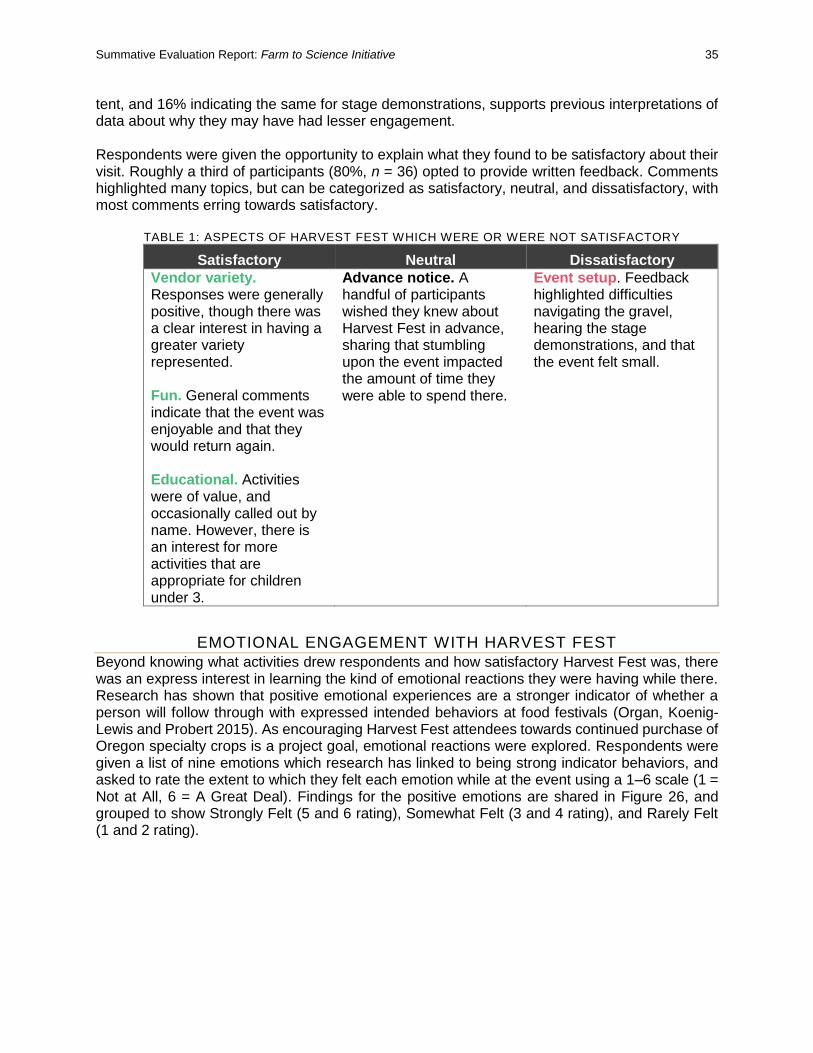
tent, and 16% indicating the same for stage demonstrations, supports previous interpretations of data about why they may have had lesser engagement. Respondents were given the opportunity to explain what they found to be satisfactory about their visit. Roughly a third of participants (80%, n = 36) opted to provide written feedback. Comments highlighted many topics, but can be categorized as satisfactory, neutral, and dissatisfactory, with most comments erring towards satisfactory.
TABLE 1: ASPECTS OF HARVEST FEST WHICH WERE OR WERE NOT SATISFACTORY
Satisfactory Neutral Dissatisfactory
Vendor variety. Responses were generally positive, though there was a clear interest in having a greater variety represented. Fun. General comments indicate that the event was enjoyable and that they would return again. Educational. Activities were of value, and occasionally called out by name. However, there is an interest for more activities that are appropriate for children under 3.
Advance notice. A handful of participants wished they knew about Harvest Fest in advance, sharing that stumbling upon the event impacted the amount of time they were able to spend there.
Event setup. Feedback highlighted difficulties navigating the gravel, hearing the stage demonstrations, and that the event felt small.
EMOTIONAL ENGAGEMENT WITH HARVEST FEST
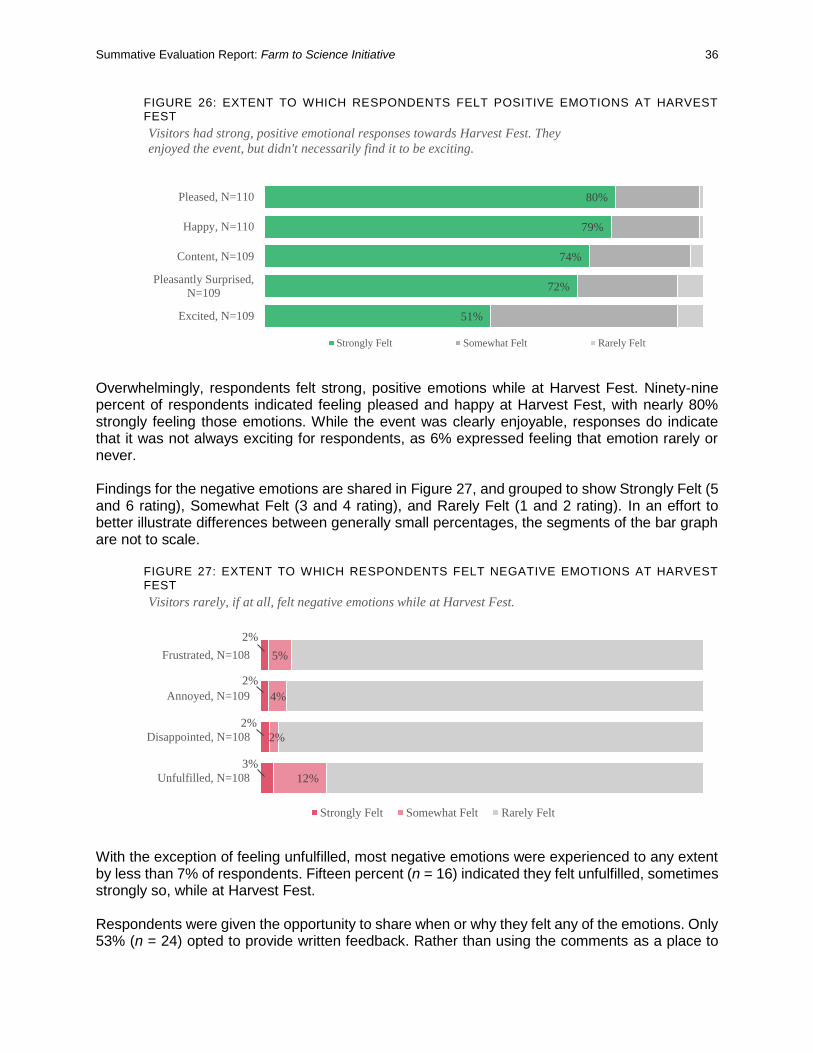
Beyond knowing what activities drew respondents and how satisfactory Harvest Fest was, there was an express interest in learning the kind of emotional reactions they were having while there. Research has shown that positive emotional experiences are a stronger indicator of whether a person will follow through with expressed intended behaviors at food festivals (Organ, Koenig-Lewis and Probert 2015). As encouraging Harvest Fest attendees towards continued purchase of Oregon specialty crops is a project goal, emotional reactions were explored. Respondents were given a list of nine emotions which research has linked to being strong indicator behaviors, and asked to rate the extent to which they felt each emotion while at the event using a 1–6 scale (1 = Not at All, 6 = A Great Deal). Findings for the positive emotions are shared in Figure 26, and grouped to show Strongly Felt (5 and 6 rating), Somewhat Felt (3 and 4 rating), and Rarely Felt (1 and 2 rating).
Summative Evaluation Report: Farm to Science Initiative 36
FIGURE 26: EXTENT TO WHICH RESPONDENTS FELT POSITIVE EMOTIONS AT HARVEST FEST
Overwhelmingly, respondents felt strong, positive emotions while at Harvest Fest. Ninety-nine percent of respondents indicated feeling pleased and happy at Harvest Fest, with nearly 80% strongly feeling those emotions. While the event was clearly enjoyable, responses do indicate that it was not always exciting for respondents, as 6% expressed feeling that emotion rarely or never. Findings for the negative emotions are shared in Figure 27, and grouped to show Strongly Felt (5 and 6 rating), Somewhat Felt (3 and 4 rating), and Rarely Felt (1 and 2 rating). In an effort to better illustrate differences between generally small percentages, the segments of the bar graph are not to scale.
FIGURE 27: EXTENT TO WHICH RESPONDENTS FELT NEGATIVE EMOTIONS AT HARVEST FEST
With the exception of feeling unfulfilled, most negative emotions were experienced to any extent by less than 7% of respondents. Fifteen percent (n = 16) indicated they felt unfulfilled, sometimes strongly so, while at Harvest Fest. Respondents were given the opportunity to share when or why they felt any of the emotions. Only 53% (n = 24) opted to provide written feedback. Rather than using the comments as a place to
51%
72%
74%
79%
80%
Excited, N=109
Pleasantly Surprised,
N=109
Content, N=109
Happy, N=110
Pleased, N=110
Visitors had strong, positive emotional responses towards Harvest Fest. They
enjoyed the event, but didn't necessarily find it to be exciting.
Strongly Felt Somewhat Felt Rarely Felt
3%
2%
2%
2%
12%
2%
4%
5%
Unfulfilled, N=108
Disappointed, N=108
Annoyed, N=109
Frustrated, N=108
Visitors rarely, if at all, felt negative emotions while at Harvest Fest.
Strongly Felt Somewhat Felt Rarely Felt
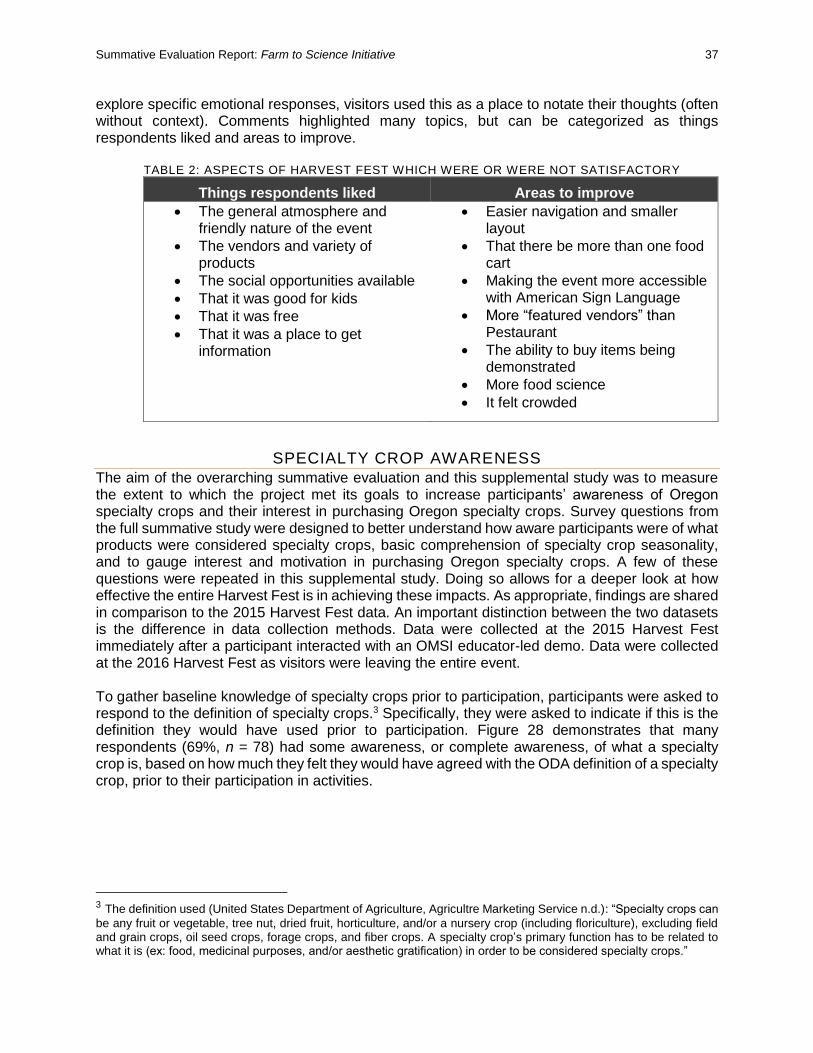
Summative Evaluation Report: Farm to Science Initiative 37
explore specific emotional responses, visitors used this as a place to notate their thoughts (often without context). Comments highlighted many topics, but can be categorized as things respondents liked and areas to improve.
TABLE 2: ASPECTS OF HARVEST FEST WHICH WERE OR WERE NOT SATISFACTORY
Things respondents liked Areas to improve
The general atmosphere and friendly nature of the event
The vendors and variety of products
The social opportunities available
That it was good for kids
That it was free
That it was a place to get information
Easier navigation and smaller layout
That there be more than one food cart
Making the event more accessible with American Sign Language
More “featured vendors” than Pestaurant
The ability to buy items being demonstrated
More food science
It felt crowded
SPECIALTY CROP AWARENESS
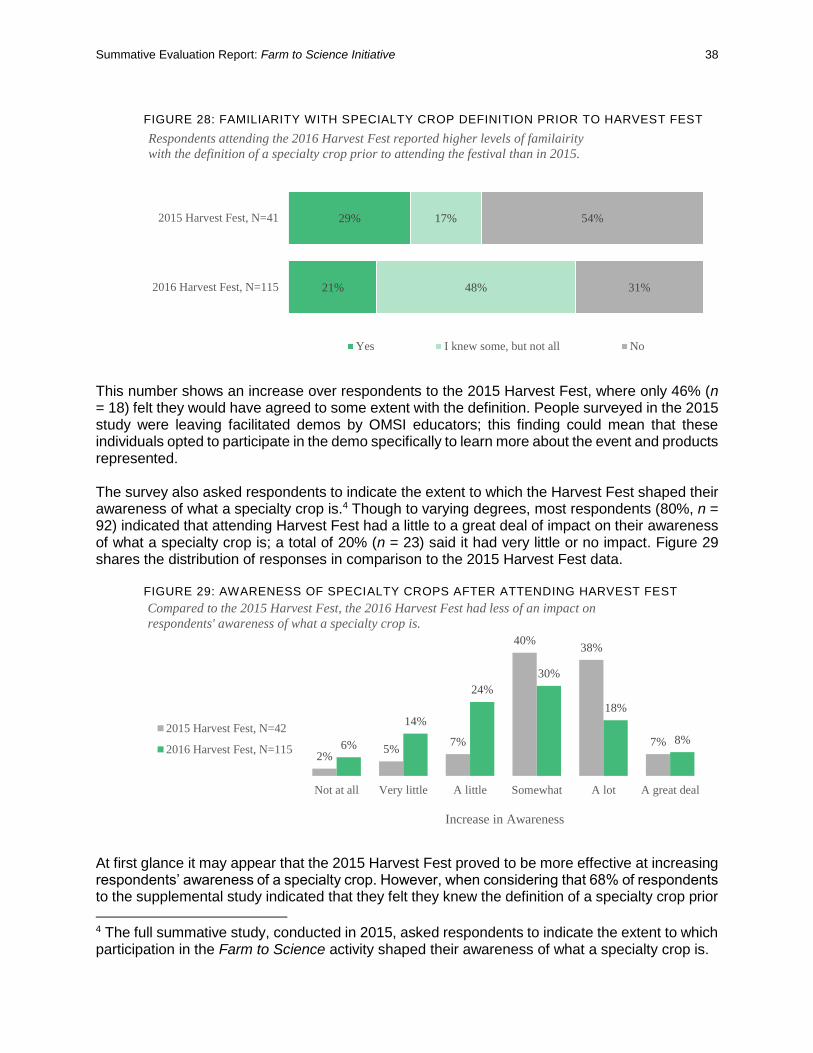
The aim of the overarching summative evaluation and this supplemental study was to measure the extent to which the project met its goals to increase participants’ awareness of Oregon specialty crops and their interest in purchasing Oregon specialty crops. Survey questions from the full summative study were designed to better understand how aware participants were of what products were considered specialty crops, basic comprehension of specialty crop seasonality, and to gauge interest and motivation in purchasing Oregon specialty crops. A few of these questions were repeated in this supplemental study. Doing so allows for a deeper look at how effective the entire Harvest Fest is in achieving these impacts. As appropriate, findings are shared in comparison to the 2015 Harvest Fest data. An important distinction between the two datasets is the difference in data collection methods. Data were collected at the 2015 Harvest Fest immediately after a participant interacted with an OMSI educator-led demo. Data were collected at the 2016 Harvest Fest as visitors were leaving the entire event. To gather baseline knowledge of specialty crops prior to participation, participants were asked to respond to the definition of specialty crops.3 Specifically, they were asked to indicate if this is the definition they would have used prior to participation. Figure 28 demonstrates that many respondents (69%, n = 78) had some awareness, or complete awareness, of what a specialty crop is, based on how much they felt they would have agreed with the ODA definition of a specialty crop, prior to their participation in activities.
3 The definition used (United States Department of Agriculture, Agricultre Marketing Service n.d.): “Specialty crops can
be any fruit or vegetable, tree nut, dried fruit, horticulture, and/or a nursery crop (including floriculture), excluding field and grain crops, oil seed crops, forage crops, and fiber crops. A specialty crop’s primary function has to be related to what it is (ex: food, medicinal purposes, and/or aesthetic gratification) in order to be considered specialty crops.”
Summative Evaluation Report: Farm to Science Initiative 38
FIGURE 28: FAMILIARITY WITH SPECIALTY CROP DEFINITION PRIOR TO HARVEST FEST
This number shows an increase over respondents to the 2015 Harvest Fest, where only 46% (n = 18) felt they would have agreed to some extent with the definition. People surveyed in the 2015 study were leaving facilitated demos by OMSI educators; this finding could mean that these individuals opted to participate in the demo specifically to learn more about the event and products represented. The survey also asked respondents to indicate the extent to which the Harvest Fest shaped their awareness of what a specialty crop is.4 Though to varying degrees, most respondents (80%, n = 92) indicated that attending Harvest Fest had a little to a great deal of impact on their awareness of what a specialty crop is; a total of 20% (n = 23) said it had very little or no impact. Figure 29 shares the distribution of responses in comparison to the 2015 Harvest Fest data.
FIGURE 29: AWARENESS OF SPECIALTY CROPS AFTER ATTENDING HARVEST FEST
At first glance it may appear that the 2015 Harvest Fest proved to be more effective at increasing respondents’ awareness of a specialty crop. However, when considering that 68% of respondents to the supplemental study indicated that they felt they knew the definition of a specialty crop prior
4 The full summative study, conducted in 2015, asked respondents to indicate the extent to which participation in the Farm to Science activity shaped their awareness of what a specialty crop is.
21%
29%
48%
17%
31%
54%
2016 Harvest Fest, N=115
2015 Harvest Fest, N=41
Respondents attending the 2016 Harvest Fest reported higher levels of familairity
with the definition of a specialty crop prior to attending the festival than in 2015.
Yes I knew some, but not all No
2%5%
7%
40%38%
7%6%
14%
24%
30%
18%
8%
Not at all Very little A little Somewhat A lot A great deal
Increase in Awareness
Compared to the 2015 Harvest Fest, the 2016 Harvest Fest had less of an impact on
respondents' awareness of what a specialty crop is.
2015 Harvest Fest, N=42
2016 Harvest Fest, N=115
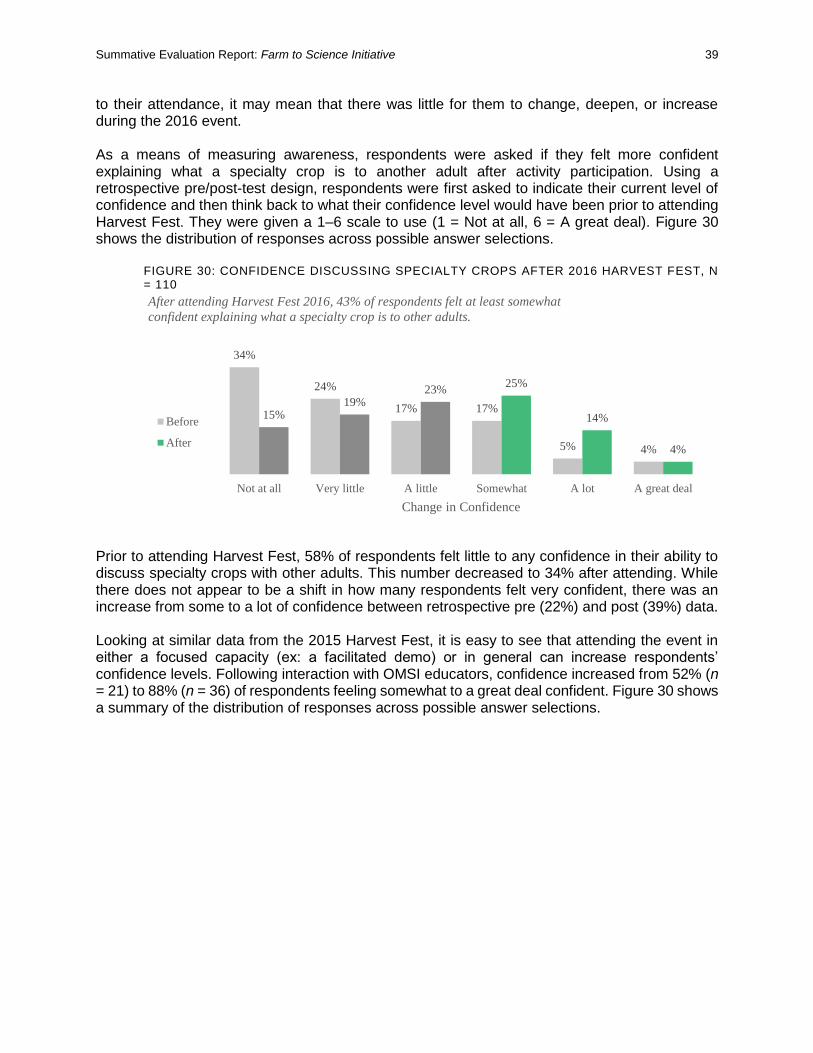
Summative Evaluation Report: Farm to Science Initiative 39
to their attendance, it may mean that there was little for them to change, deepen, or increase during the 2016 event. As a means of measuring awareness, respondents were asked if they felt more confident explaining what a specialty crop is to another adult after activity participation. Using a retrospective pre/post-test design, respondents were first asked to indicate their current level of confidence and then think back to what their confidence level would have been prior to attending Harvest Fest. They were given a 1–6 scale to use (1 = Not at all, 6 = A great deal). Figure 30 shows the distribution of responses across possible answer selections.
FIGURE 30: CONFIDENCE DISCUSSING SPECIALTY CROPS AFTER 2016 HARVEST FEST, N = 110
Prior to attending Harvest Fest, 58% of respondents felt little to any confidence in their ability to discuss specialty crops with other adults. This number decreased to 34% after attending. While there does not appear to be a shift in how many respondents felt very confident, there was an increase from some to a lot of confidence between retrospective pre (22%) and post (39%) data. Looking at similar data from the 2015 Harvest Fest, it is easy to see that attending the event in either a focused capacity (ex: a facilitated demo) or in general can increase respondents’ confidence levels. Following interaction with OMSI educators, confidence increased from 52% (n = 21) to 88% (n = 36) of respondents feeling somewhat to a great deal confident. Figure 30 shows a summary of the distribution of responses across possible answer selections.
34%
24%
17% 17%
5% 4%
15%19%
23%25%
14%
4%
Not at all Very little A little Somewhat A lot A great deal
Change in Confidence
After attending Harvest Fest 2016, 43% of respondents felt at least somewhat
confident explaining what a specialty crop is to other adults.
Before
After
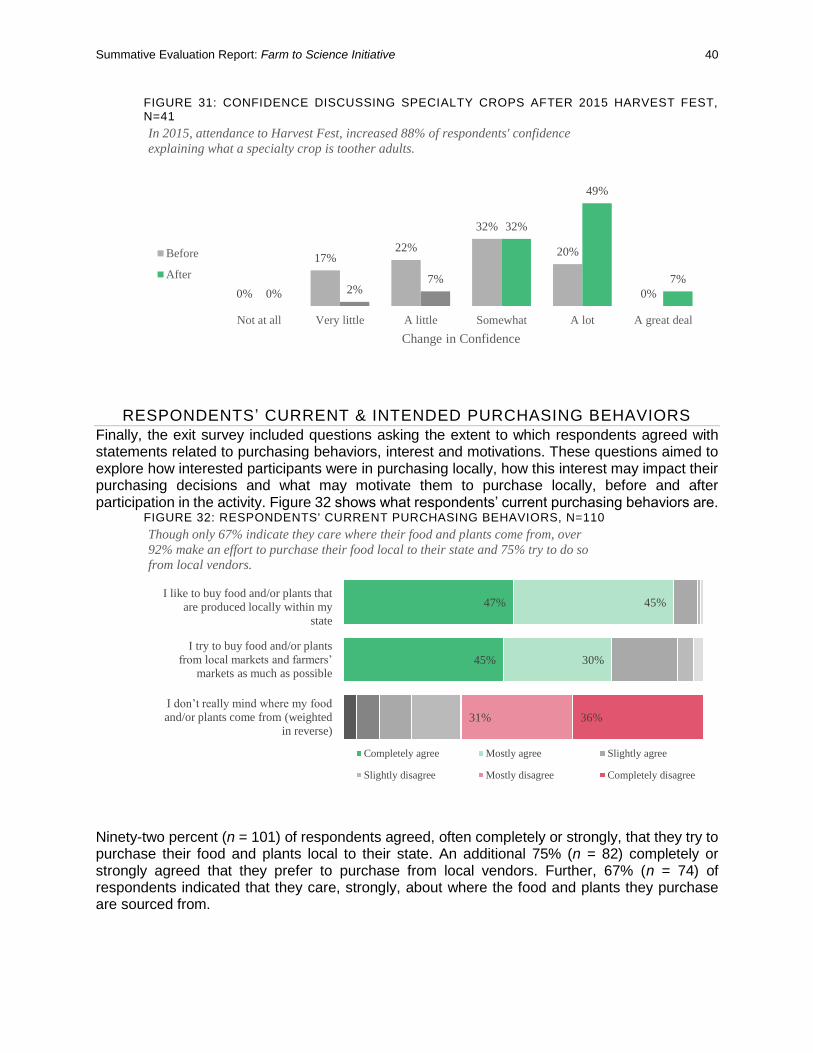
Summative Evaluation Report: Farm to Science Initiative 40
FIGURE 31: CONFIDENCE DISCUSSING SPECIALTY CROPS AFTER 2015 HARVEST FEST, N=41
RESPONDENTS ’ CURRENT & INTENDED PURCHASING BEHAVIORS
Finally, the exit survey included questions asking the extent to which respondents agreed with statements related to purchasing behaviors, interest and motivations. These questions aimed to explore how interested participants were in purchasing locally, how this interest may impact their purchasing decisions and what may motivate them to purchase locally, before and after participation in the activity. Figure 32 shows what respondents’ current purchasing behaviors are.
FIGURE 32: RESPONDENTS' CURRENT PURCHASING BEHAVIORS, N=110
Ninety-two percent (n = 101) of respondents agreed, often completely or strongly, that they try to purchase their food and plants local to their state. An additional 75% (n = 82) completely or strongly agreed that they prefer to purchase from local vendors. Further, 67% (n = 74) of respondents indicated that they care, strongly, about where the food and plants they purchase are sourced from.
0%
17%22%
32%
20%
0%0% 2%7%
32%
49%
7%
Not at all Very little A little Somewhat A lot A great deal
Change in Confidence
In 2015, attendance to Harvest Fest, increased 88% of respondents' confidence
explaining what a specialty crop is toother adults.
Before
After
47%
45%
45%
30%
31% 36%
Though only 67% indicate they care where their food and plants come from, over
92% make an effort to purchase their food local to their state and 75% try to do so
from local vendors.
Completely agree Mostly agree Slightly agree
Slightly disagree Mostly disagree Completely disagree
I like to buy food and/or plants that
are produced locally within my
state
I try to buy food and/or plants
from local markets and farmers’
markets as much as possible
I don’t really mind where my food
and/or plants come from (weighted
in reverse)
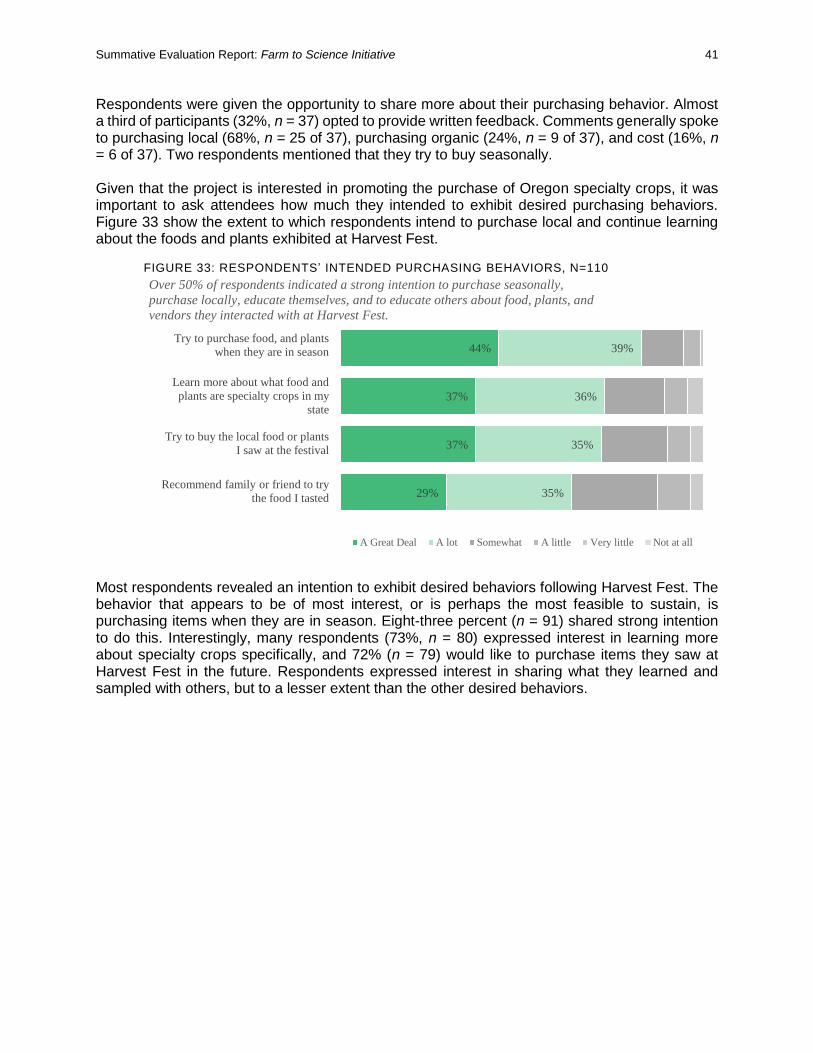
Summative Evaluation Report: Farm to Science Initiative 41
Respondents were given the opportunity to share more about their purchasing behavior. Almost a third of participants (32%, n = 37) opted to provide written feedback. Comments generally spoke to purchasing local (68%, n = 25 of 37), purchasing organic (24%, n = 9 of 37), and cost (16%, n = 6 of 37). Two respondents mentioned that they try to buy seasonally. Given that the project is interested in promoting the purchase of Oregon specialty crops, it was important to ask attendees how much they intended to exhibit desired purchasing behaviors. Figure 33 show the extent to which respondents intend to purchase local and continue learning about the foods and plants exhibited at Harvest Fest.
FIGURE 33: RESPONDENTS’ INTENDED PURCHASING BEHAVIORS, N=110
Most respondents revealed an intention to exhibit desired behaviors following Harvest Fest. The behavior that appears to be of most interest, or is perhaps the most feasible to sustain, is purchasing items when they are in season. Eight-three percent (n = 91) shared strong intention to do this. Interestingly, many respondents (73%, n = 80) expressed interest in learning more about specialty crops specifically, and 72% (n = 79) would like to purchase items they saw at Harvest Fest in the future. Respondents expressed interest in sharing what they learned and sampled with others, but to a lesser extent than the other desired behaviors.
29%
37%
37%
44%
35%
35%
36%
39%
Over 50% of respondents indicated a strong intention to purchase seasonally,
purchase locally, educate themselves, and to educate others about food, plants, and
vendors they interacted with at Harvest Fest.
A Great Deal A lot Somewhat A little Very little Not at all
Try to purchase food, and plants
when they are in season
Learn more about what food and
plants are specialty crops in my
state
Try to buy the local food or plants
I saw at the festival
Recommend family or friend to try
the food I tasted
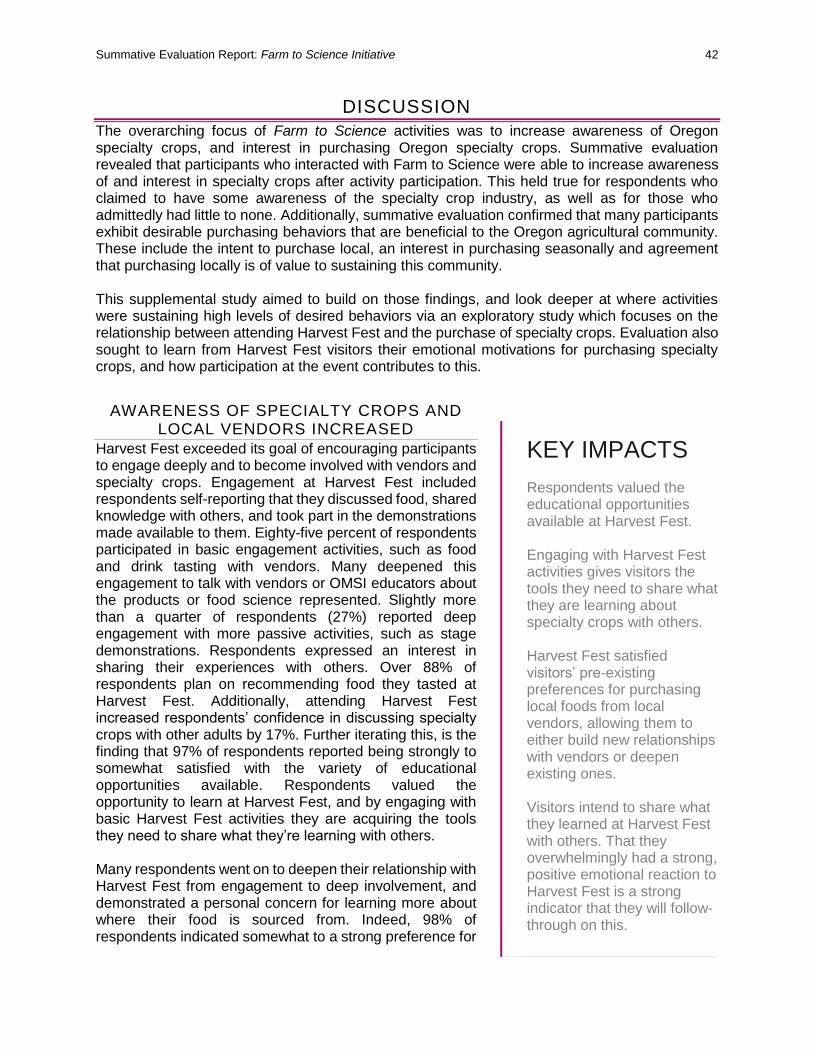
Summative Evaluation Report: Farm to Science Initiative 42
DISCUSSION
The overarching focus of Farm to Science activities was to increase awareness of Oregon specialty crops, and interest in purchasing Oregon specialty crops. Summative evaluation revealed that participants who interacted with Farm to Science were able to increase awareness of and interest in specialty crops after activity participation. This held true for respondents who claimed to have some awareness of the specialty crop industry, as well as for those who admittedly had little to none. Additionally, summative evaluation confirmed that many participants exhibit desirable purchasing behaviors that are beneficial to the Oregon agricultural community. These include the intent to purchase local, an interest in purchasing seasonally and agreement that purchasing locally is of value to sustaining this community. This supplemental study aimed to build on those findings, and look deeper at where activities were sustaining high levels of desired behaviors via an exploratory study which focuses on the relationship between attending Harvest Fest and the purchase of specialty crops. Evaluation also sought to learn from Harvest Fest visitors their emotional motivations for purchasing specialty crops, and how participation at the event contributes to this.
AWARENESS OF SPECIALTY CROPS AND LOCAL VENDORS INCREASED
Harvest Fest exceeded its goal of encouraging participants to engage deeply and to become involved with vendors and specialty crops. Engagement at Harvest Fest included respondents self-reporting that they discussed food, shared knowledge with others, and took part in the demonstrations made available to them. Eighty-five percent of respondents participated in basic engagement activities, such as food and drink tasting with vendors. Many deepened this engagement to talk with vendors or OMSI educators about the products or food science represented. Slightly more than a quarter of respondents (27%) reported deep engagement with more passive activities, such as stage demonstrations. Respondents expressed an interest in sharing their experiences with others. Over 88% of respondents plan on recommending food they tasted at Harvest Fest. Additionally, attending Harvest Fest increased respondents’ confidence in discussing specialty crops with other adults by 17%. Further iterating this, is the finding that 97% of respondents reported being strongly to somewhat satisfied with the variety of educational opportunities available. Respondents valued the opportunity to learn at Harvest Fest, and by engaging with basic Harvest Fest activities they are acquiring the tools they need to share what they’re learning with others. Many respondents went on to deepen their relationship with Harvest Fest from engagement to deep involvement, and demonstrated a personal concern for learning more about where their food is sourced from. Indeed, 98% of respondents indicated somewhat to a strong preference for
KEY IMPACTS
Respondents valued the educational opportunities available at Harvest Fest. Engaging with Harvest Fest activities gives visitors the tools they need to share what they are learning about specialty crops with others. Harvest Fest satisfied visitors’ pre-existing preferences for purchasing local foods from local vendors, allowing them to either build new relationships with vendors or deepen existing ones. Visitors intend to share what they learned at Harvest Fest with others. That they overwhelmingly had a strong, positive emotional reaction to Harvest Fest is a strong indicator that they will follow-through on this.
Summative Evaluation Report: Farm to Science Initiative 43
purchasing products local to them, with 81% agreeing to varying extents that they actively care where their food comes from. Many respondents, 93%, further specified that not only do they want their food to be local, they have a preference for purchasing products from local vendors (farmer’s markets, co-ops, locally-owned grocery stores). Harvest Fest allows both preferences to be met by bringing together local products and local vendors for attendees. Not only did respondents express a deep interest in knowing where and from whom their food products are being purchased, 90% also indicated that they were somewhat to a great deal likely to try to purchase the products they saw at Harvest Fest, specialty crops local to Oregon, in the future. By attending Harvest Fest, many attendees were able to build relationships with vendors who are able to provide for them food products that are desirable to them: known to be sourced locally, and from local vendors.
VISITORS HAD POSITIVE EXPERIENCES AT HARVEST FEST
An additional aim of this study was to understand what kind of emotional reactions visitors were having at Harvest Fest, with the understanding that this may impact the success of the grant’s larger goal of encouraging the purchase of Oregon specialty crops in the future. Overwhelmingly, respondents displayed positive emotional responses to their time at Harvest Fest. In fact, 99% of respondents indicated feeling pleased and happy at Harvest Fest, with nearly 80% strongly feeling those emotions. Conversely, 93% of respondents rarely or never felt negative emotions during the event. At most, 15% of respondents felt somewhat or strongly unfulfilled. This strong, positive emotional reaction to Harvest Fest is a strong indicator that visitors will likely follow-through on their expressed intention to purchase products they interacted with at Harvest Fest, purchase products local to them and from local vendors, to learn more about specialty crops, and to recommend items to others.
FUTURE CONSIDERATIONS
Though Harvest Fest was successful, there are always opportunities to grow. Respondents indicated an interest in seeing greater variety in vendors represented. Future versions of the event could aim to find a balance between representing vendors local to the region and statewide vendors. In doing so, a greater variety of Oregon specialty crop vendors to purchase from and learn from are made accessible to participants. This, in turn, may increase excitement over the variety or products available, and further encourage them towards continued purchase of these products. Additionally, some comments were made about event accessibility. Efforts should be made to provide walking pathways that are easier to navigate for individuals with limited mobility or with strollers. At times the event felt “small,” or “tight.” Should future Harvest Fests be hosted in the same lot, spacing vendor tents and activities throughout the lot may help relieve some of these feelings. Finally, there was notably lower engagement with stage demonstrations and the kid’s tent than with other activities. Reasons for lower engagement were not fully captured, but are likely related to the perception that these activities are exclusively for families. An additional challenge may be the limited opportunities to interact with stage demonstrations (i.e., they are timed and not always available to visitors, especially when they arrive late or are with vendors). Increasing perceived or actual opportunities to interact with stage demonstrations and the kid’s tent could increase overall usage and satisfaction with these activities. Overall, the event is enjoyed by attendees for its educational opportunities and connection to local specialty crop providers, and has much potential to continue building on this success.

Summative Evaluation Report: Farm to Science Initiative 44
BIBLIOGRAPHY
Ajzen, Icek. 2002. "Perceived Behavioral Control, Self-Efficacy, Locus of Control, and the Theory of Planned Behavior." Journal of Applied Social Psychology 665-683.
Ajzen, Icek. 1991. "The Theory of Planned Behavior." Organizational Behavior and Human Decision Processes 179-211.
Consoli, Domenico. 2009. "Emotions that influence purchase decisions and their electronic processing." Annales Universitatis Apulensis Series Oeconomica 996-1008.
Dewar, Patricia E, Shea A Keene, Terah N Kalk, David G Clark, Thomas A Colquhoun, and Howard R Moskowitz. 2016. "Identifying the Drivers of a Foliage Plant Purchasing Decision via Contemporary Psychophysics." Journal of Horticulture.
Down, Kylie, and Karena J. Burke. 2013. "The influence of ethical values and food choice motivations on intentions to purchase sustainably sourced foods." Appetite 137-144.
Ekman, Paul. 2007. Emotions Revealed: Recognizing Faces and Feelings to Improve Communication and Emotional Life. New York: St. Martin's Press.
Ghasemi, Asghar, and Saleh Zahediasl. 2012. "Normality Tests for Statistical Analysis: A Guide for Non-Statisticians." Int J Endocrinol Metab. 486-9.
Lee, Hyun-Joo, and Zee-Sun Yun. 2015. "Consumers' perceptions of organic food attributes and cognitive and affective attitudes as determinants of their purchase intentions toward organic food." Food Quality and Preference 250-267.
Liao, Lewis Xinwei, Armando Maria Corsi, Polymeros Chrysochou, and Larry Lockshin. 2015. "Emotional repsonses towards food packaging: A joint application of self-report and physiological measures of emotion." Food Quality and Preference 48-55.
Organ, Kate, Nicole Koenig-Lewis, and Jane Probert. 2015. "Festivals as agents for behaviour change: A study of food festival engagement and subsequent food choices." Tourism Management 84-99.
United States Department of Agriculture, Agricultre Marketing Service. n.d. What is a Specialty Crop? Accessed November 21, 2014. http://www.ams.usda.gov/services/grants/scbgp/specialty-crop.
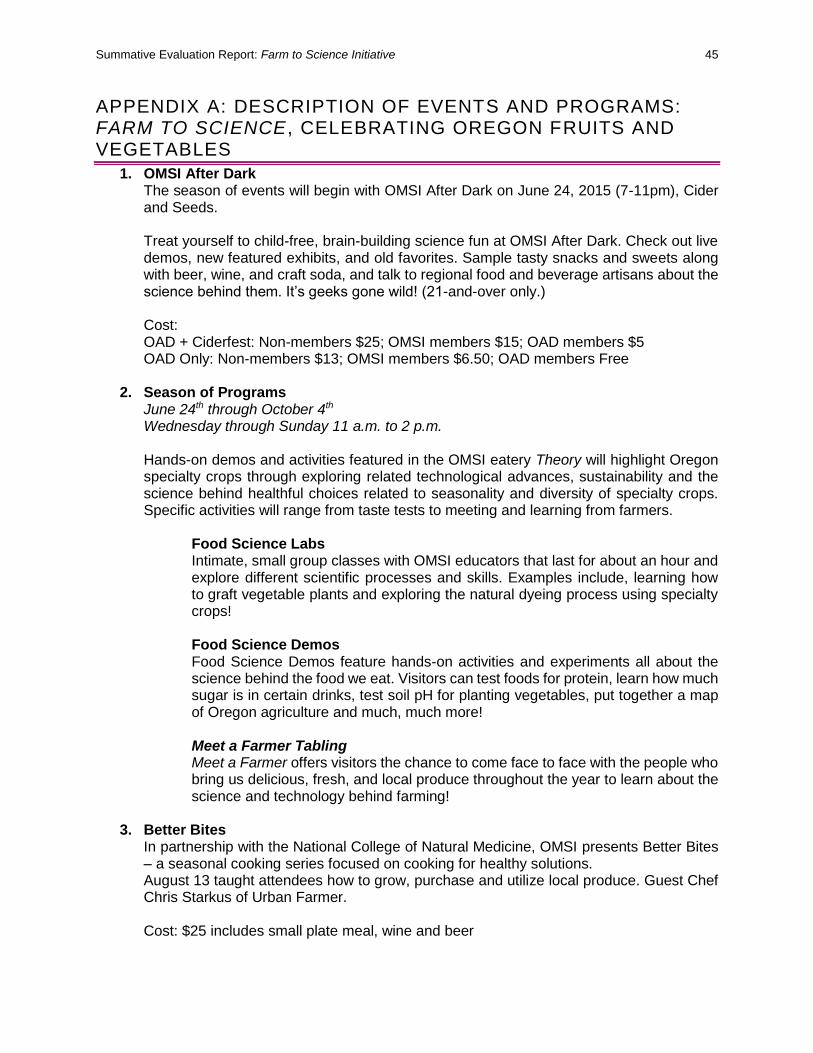
Summative Evaluation Report: Farm to Science Initiative 45
APPENDIX A: DESCRIPTION OF EVENTS AND PROGRAMS: FARM TO SCIENCE , CELEBRATING OREGON FRUITS AND VEGETABLES
1. OMSI After Dark The season of events will begin with OMSI After Dark on June 24, 2015 (7-11pm), Cider and Seeds. Treat yourself to child-free, brain-building science fun at OMSI After Dark. Check out live demos, new featured exhibits, and old favorites. Sample tasty snacks and sweets along with beer, wine, and craft soda, and talk to regional food and beverage artisans about the science behind them. It’s geeks gone wild! (21-and-over only.) Cost: OAD + Ciderfest: Non-members $25; OMSI members $15; OAD members $5 OAD Only: Non-members $13; OMSI members $6.50; OAD members Free
2. Season of Programs June 24th through October 4th Wednesday through Sunday 11 a.m. to 2 p.m. Hands-on demos and activities featured in the OMSI eatery Theory will highlight Oregon specialty crops through exploring related technological advances, sustainability and the science behind healthful choices related to seasonality and diversity of specialty crops. Specific activities will range from taste tests to meeting and learning from farmers.
Food Science Labs Intimate, small group classes with OMSI educators that last for about an hour and explore different scientific processes and skills. Examples include, learning how to graft vegetable plants and exploring the natural dyeing process using specialty crops! Food Science Demos Food Science Demos feature hands-on activities and experiments all about the science behind the food we eat. Visitors can test foods for protein, learn how much sugar is in certain drinks, test soil pH for planting vegetables, put together a map of Oregon agriculture and much, much more! Meet a Farmer Tabling Meet a Farmer offers visitors the chance to come face to face with the people who bring us delicious, fresh, and local produce throughout the year to learn about the science and technology behind farming!
3. Better Bites In partnership with the National College of Natural Medicine, OMSI presents Better Bites – a seasonal cooking series focused on cooking for healthy solutions. August 13 taught attendees how to grow, purchase and utilize local produce. Guest Chef Chris Starkus of Urban Farmer. Cost: $25 includes small plate meal, wine and beer
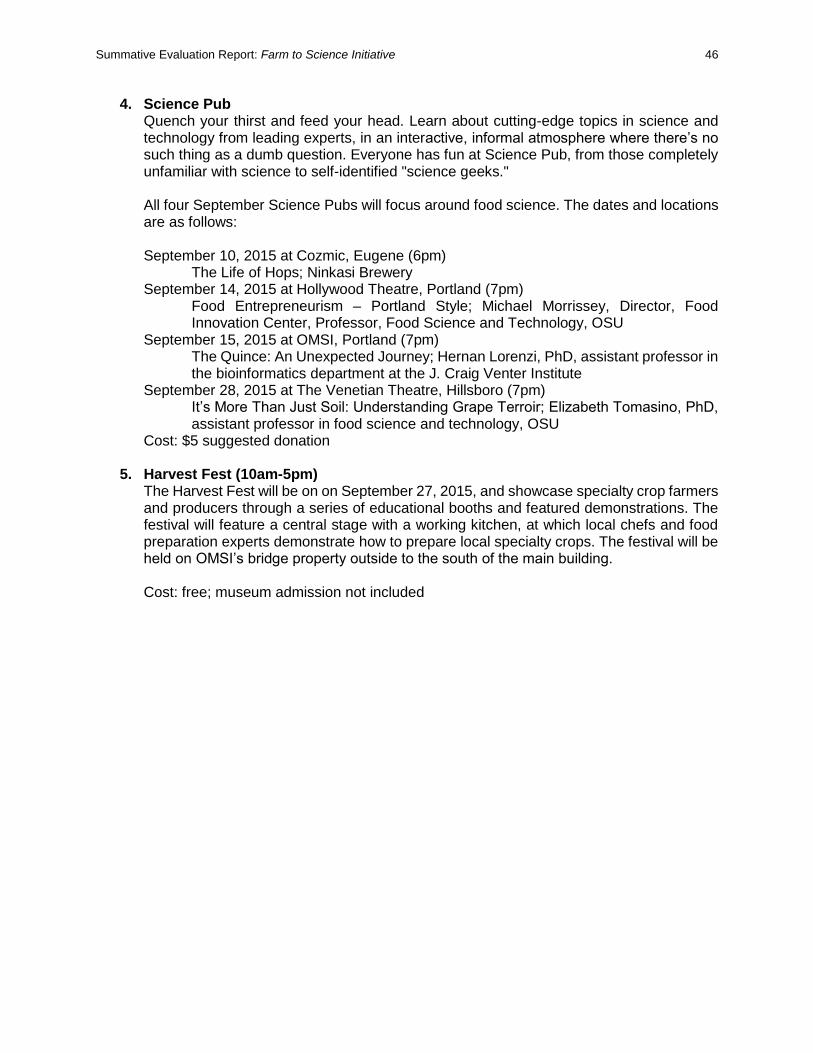
Summative Evaluation Report: Farm to Science Initiative 46
4. Science Pub Quench your thirst and feed your head. Learn about cutting-edge topics in science and technology from leading experts, in an interactive, informal atmosphere where there’s no such thing as a dumb question. Everyone has fun at Science Pub, from those completely unfamiliar with science to self-identified "science geeks." All four September Science Pubs will focus around food science. The dates and locations are as follows: September 10, 2015 at Cozmic, Eugene (6pm) The Life of Hops; Ninkasi Brewery September 14, 2015 at Hollywood Theatre, Portland (7pm)
Food Entrepreneurism – Portland Style; Michael Morrissey, Director, Food Innovation Center, Professor, Food Science and Technology, OSU
September 15, 2015 at OMSI, Portland (7pm) The Quince: An Unexpected Journey; Hernan Lorenzi, PhD, assistant professor in the bioinformatics department at the J. Craig Venter Institute
September 28, 2015 at The Venetian Theatre, Hillsboro (7pm) It’s More Than Just Soil: Understanding Grape Terroir; Elizabeth Tomasino, PhD, assistant professor in food science and technology, OSU
Cost: $5 suggested donation
5. Harvest Fest (10am-5pm) The Harvest Fest will be on on September 27, 2015, and showcase specialty crop farmers and producers through a series of educational booths and featured demonstrations. The festival will feature a central stage with a working kitchen, at which local chefs and food preparation experts demonstrate how to prepare local specialty crops. The festival will be held on OMSI’s bridge property outside to the south of the main building. Cost: free; museum admission not included
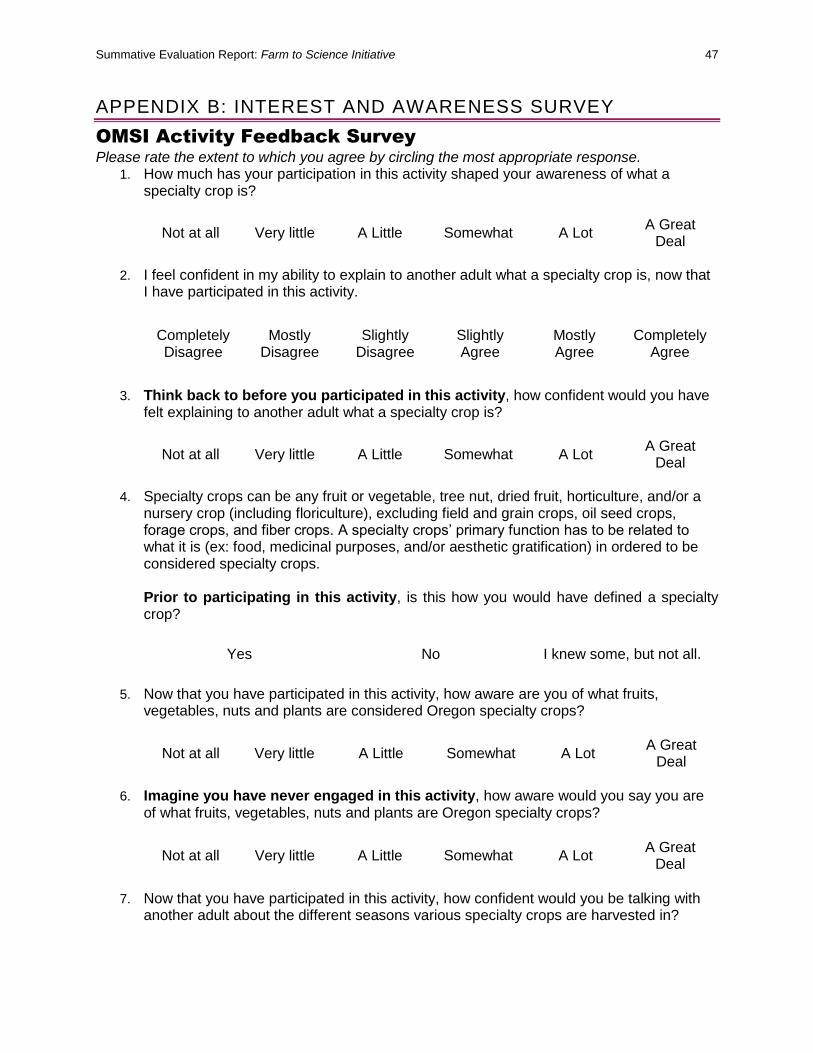
Summative Evaluation Report: Farm to Science Initiative 47
APPENDIX B: INTEREST AND AWARENESS SURVEY
OMSI Activity Feedback Survey
Please rate the extent to which you agree by circling the most appropriate response. 1. How much has your participation in this activity shaped your awareness of what a
specialty crop is?
Not at all Very little A Little Somewhat A Lot A Great
Deal
2. I feel confident in my ability to explain to another adult what a specialty crop is, now that I have participated in this activity.
Completely Disagree
Mostly Disagree
Slightly Disagree
Slightly Agree
Mostly Agree
Completely Agree
3. Think back to before you participated in this activity, how confident would you have
felt explaining to another adult what a specialty crop is?
Not at all Very little A Little Somewhat A Lot A Great
Deal
4. Specialty crops can be any fruit or vegetable, tree nut, dried fruit, horticulture, and/or a nursery crop (including floriculture), excluding field and grain crops, oil seed crops, forage crops, and fiber crops. A specialty crops’ primary function has to be related to what it is (ex: food, medicinal purposes, and/or aesthetic gratification) in ordered to be considered specialty crops. Prior to participating in this activity, is this how you would have defined a specialty crop?
Yes No I knew some, but not all.
5. Now that you have participated in this activity, how aware are you of what fruits,
vegetables, nuts and plants are considered Oregon specialty crops?
Not at all Very little A Little Somewhat A Lot A Great
Deal
6. Imagine you have never engaged in this activity, how aware would you say you are
of what fruits, vegetables, nuts and plants are Oregon specialty crops?
Not at all Very little A Little Somewhat A Lot A Great
Deal
7. Now that you have participated in this activity, how confident would you be talking with
another adult about the different seasons various specialty crops are harvested in?
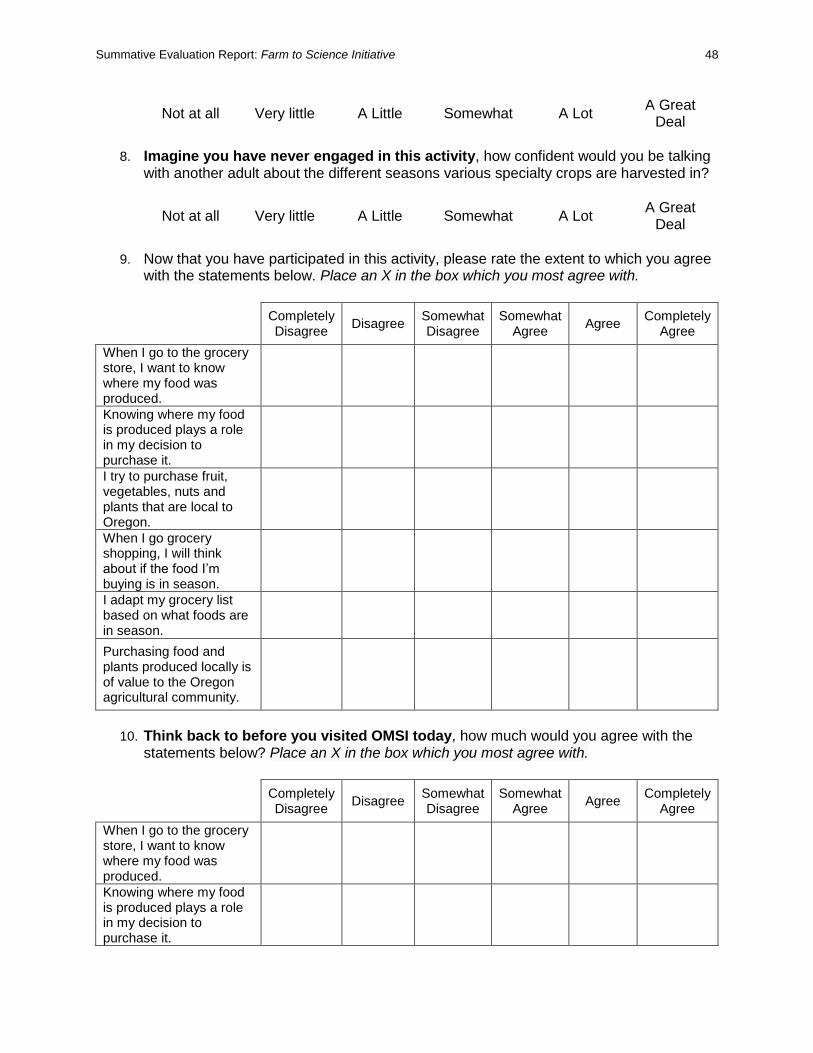
Summative Evaluation Report: Farm to Science Initiative 48
Not at all Very little A Little Somewhat A Lot A Great
Deal
8. Imagine you have never engaged in this activity, how confident would you be talking
with another adult about the different seasons various specialty crops are harvested in?
Not at all Very little A Little Somewhat A Lot A Great
Deal
9. Now that you have participated in this activity, please rate the extent to which you agree
with the statements below. Place an X in the box which you most agree with.
Completely
Disagree Disagree
Somewhat Disagree
Somewhat Agree
Agree Completely
Agree
When I go to the grocery store, I want to know where my food was produced.
Knowing where my food is produced plays a role in my decision to purchase it.
I try to purchase fruit, vegetables, nuts and plants that are local to Oregon.
When I go grocery shopping, I will think about if the food I’m buying is in season.
I adapt my grocery list based on what foods are in season.
Purchasing food and plants produced locally is of value to the Oregon agricultural community.
10. Think back to before you visited OMSI today, how much would you agree with the
statements below? Place an X in the box which you most agree with.
Completely
Disagree Disagree
Somewhat Disagree
Somewhat Agree
Agree Completely
Agree
When I go to the grocery store, I want to know where my food was produced.
Knowing where my food is produced plays a role in my decision to purchase it.
Summative Evaluation Report: Farm to Science Initiative 49
I try to purchase fruit, vegetables, nuts and plants that are local to Oregon.
When I go grocery shopping, I think about if the food I’m buying is in season.
I adapt my grocery list based on what foods are in season.
Purchasing food and plants produced locally is of value to the Oregon agricultural community.
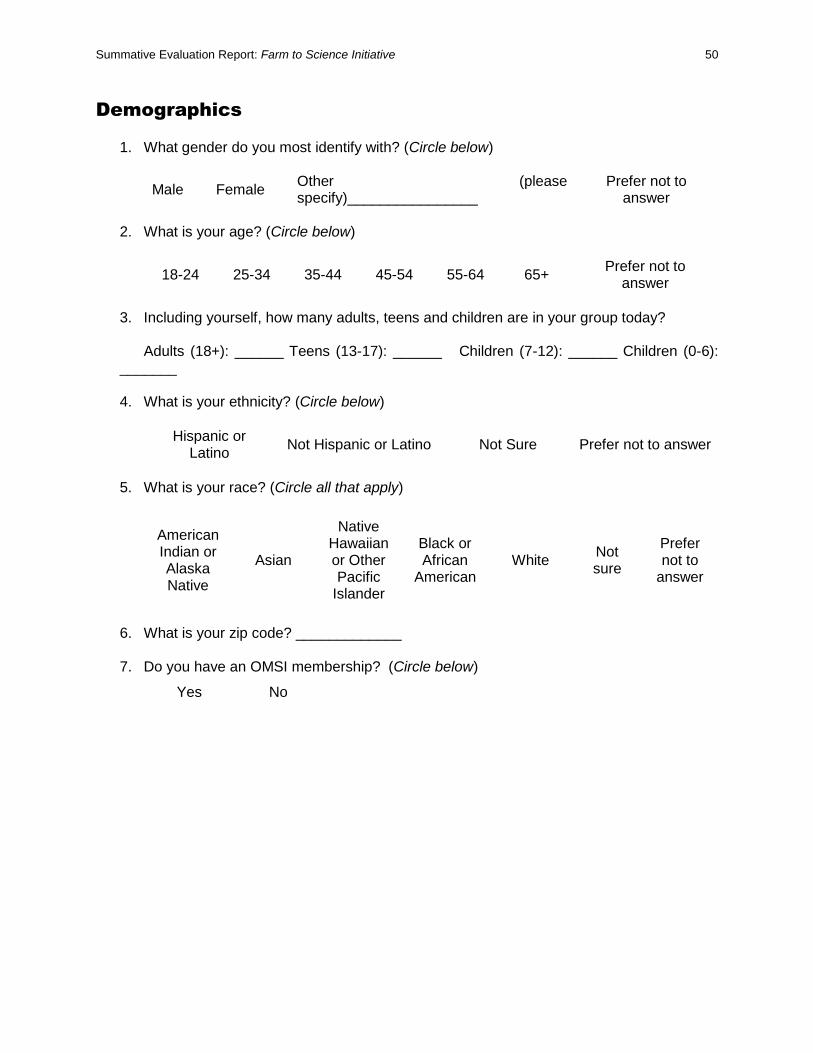
Summative Evaluation Report: Farm to Science Initiative 50
Demographics
1. What gender do you most identify with? (Circle below)
Male Female Other (please specify)________________
Prefer not to answer
2. What is your age? (Circle below)
18-24 25-34 35-44 45-54 55-64 65+ Prefer not to
answer
3. Including yourself, how many adults, teens and children are in your group today?
Adults (18+): ______ Teens (13-17): ______ Children (7-12): ______ Children (0-6):
_______
4. What is your ethnicity? (Circle below)
Hispanic or Latino
Not Hispanic or Latino Not Sure Prefer not to answer
5. What is your race? (Circle all that apply)
American Indian or Alaska Native
Asian
Native Hawaiian or Other Pacific
Islander
Black or African
American White
Not sure
Prefer not to
answer
6. What is your zip code? _____________
7. Do you have an OMSI membership? (Circle below)
Yes No
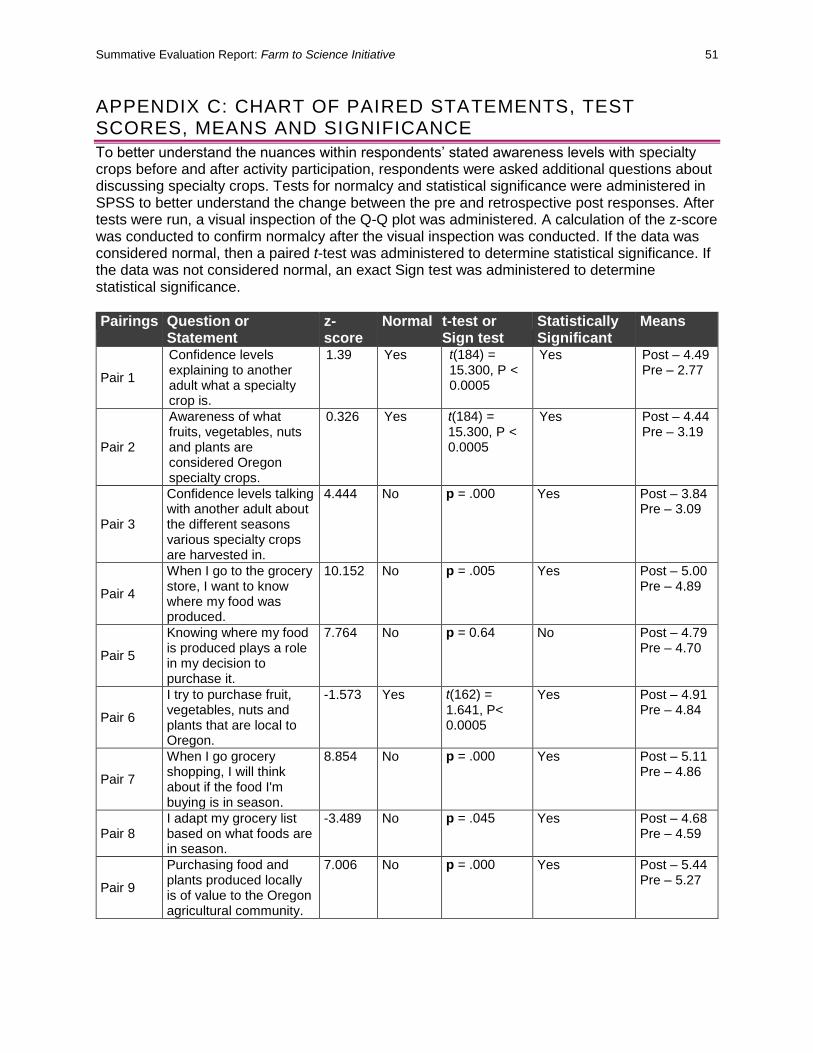
Summative Evaluation Report: Farm to Science Initiative 51
APPENDIX C: CHART OF PAIRED STATEMENTS, TEST SCORES, MEANS AND SIGNIFICANCE
To better understand the nuances within respondents’ stated awareness levels with specialty crops before and after activity participation, respondents were asked additional questions about discussing specialty crops. Tests for normalcy and statistical significance were administered in SPSS to better understand the change between the pre and retrospective post responses. After tests were run, a visual inspection of the Q-Q plot was administered. A calculation of the z-score was conducted to confirm normalcy after the visual inspection was conducted. If the data was considered normal, then a paired t-test was administered to determine statistical significance. If the data was not considered normal, an exact Sign test was administered to determine statistical significance.
Pairings Question or Statement
z-score
Normal t-test or Sign test
Statistically Significant
Means
Pair 1
Confidence levels explaining to another adult what a specialty crop is.
1.39 Yes t(184) = 15.300, P < 0.0005
Yes Post – 4.49 Pre – 2.77
Pair 2
Awareness of what fruits, vegetables, nuts and plants are considered Oregon specialty crops.
0.326 Yes t(184) = 15.300, P < 0.0005
Yes Post – 4.44 Pre – 3.19
Pair 3
Confidence levels talking with another adult about the different seasons various specialty crops are harvested in.
4.444 No p = .000 Yes Post – 3.84 Pre – 3.09
Pair 4
When I go to the grocery store, I want to know where my food was produced.
10.152 No p = .005 Yes Post – 5.00 Pre – 4.89
Pair 5
Knowing where my food is produced plays a role in my decision to purchase it.
7.764 No p = 0.64 No Post – 4.79 Pre – 4.70
Pair 6
I try to purchase fruit, vegetables, nuts and plants that are local to Oregon.
-1.573 Yes t(162) = 1.641, P< 0.0005
Yes Post – 4.91 Pre – 4.84
Pair 7
When I go grocery shopping, I will think about if the food I'm buying is in season.
8.854 No p = .000 Yes Post – 5.11 Pre – 4.86
Pair 8 I adapt my grocery list based on what foods are in season.
-3.489 No p = .045 Yes Post – 4.68 Pre – 4.59
Pair 9
Purchasing food and plants produced locally is of value to the Oregon agricultural community.
7.006 No p = .000 Yes Post – 5.44 Pre – 5.27
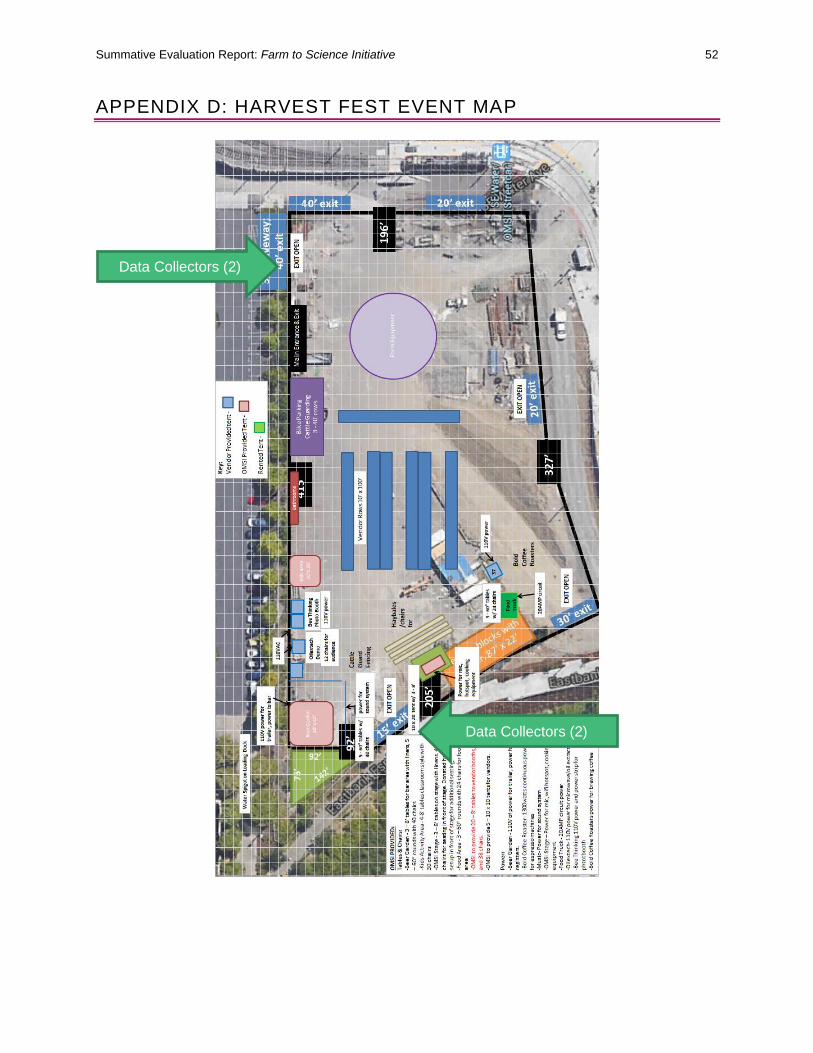
Summative Evaluation Report: Farm to Science Initiative 52
APPENDIX D: HARVEST FEST EVENT MAP
Data Collectors (2)
Data Collectors (2)
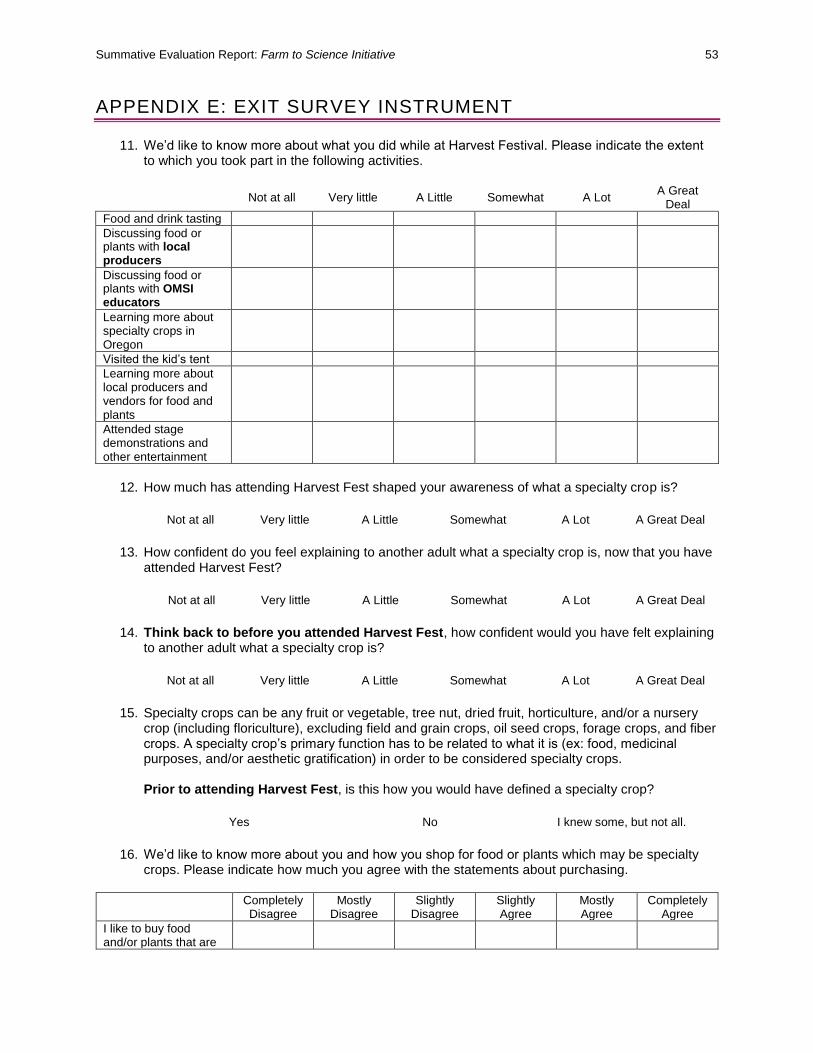
Summative Evaluation Report: Farm to Science Initiative 53
APPENDIX E: EXIT SURVEY INSTRUMENT
11. We’d like to know more about what you did while at Harvest Festival. Please indicate the extent to which you took part in the following activities.
Not at all Very little A Little Somewhat A Lot
A Great Deal
Food and drink tasting
Discussing food or plants with local producers
Discussing food or plants with OMSI educators
Learning more about specialty crops in Oregon
Visited the kid’s tent
Learning more about local producers and vendors for food and plants
Attended stage demonstrations and other entertainment
12. How much has attending Harvest Fest shaped your awareness of what a specialty crop is?
Not at all Very little A Little Somewhat A Lot A Great Deal
13. How confident do you feel explaining to another adult what a specialty crop is, now that you have
attended Harvest Fest?
Not at all Very little A Little Somewhat A Lot A Great Deal
14. Think back to before you attended Harvest Fest, how confident would you have felt explaining
to another adult what a specialty crop is?
Not at all Very little A Little Somewhat A Lot A Great Deal
15. Specialty crops can be any fruit or vegetable, tree nut, dried fruit, horticulture, and/or a nursery
crop (including floriculture), excluding field and grain crops, oil seed crops, forage crops, and fiber crops. A specialty crop’s primary function has to be related to what it is (ex: food, medicinal purposes, and/or aesthetic gratification) in order to be considered specialty crops. Prior to attending Harvest Fest, is this how you would have defined a specialty crop?
Yes No I knew some, but not all.
16. We’d like to know more about you and how you shop for food or plants which may be specialty
crops. Please indicate how much you agree with the statements about purchasing.
Completely Disagree
Mostly Disagree
Slightly Disagree
Slightly Agree
Mostly Agree
Completely Agree
I like to buy food and/or plants that are
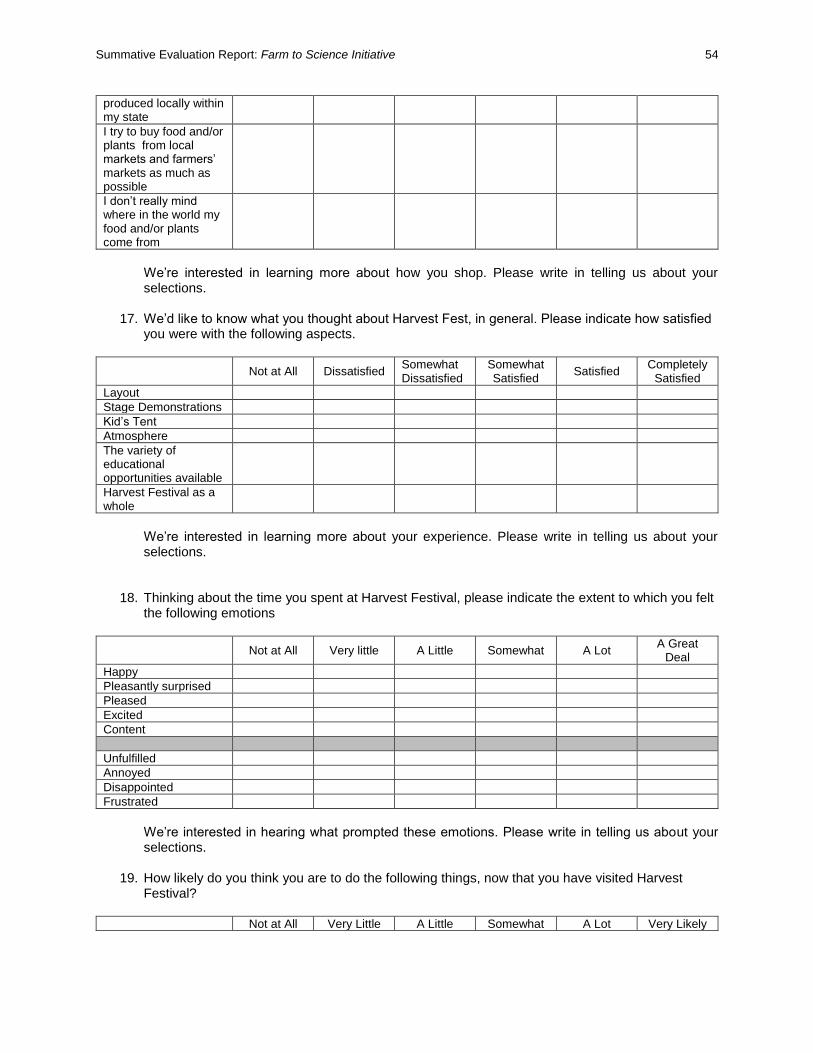
Summative Evaluation Report: Farm to Science Initiative 54
produced locally within my state
I try to buy food and/or plants from local markets and farmers’ markets as much as possible
I don’t really mind where in the world my food and/or plants come from
We’re interested in learning more about how you shop. Please write in telling us about your selections.
17. We’d like to know what you thought about Harvest Fest, in general. Please indicate how satisfied you were with the following aspects.
Not at All Dissatisfied Somewhat Dissatisfied
Somewhat Satisfied
Satisfied Completely
Satisfied
Layout
Stage Demonstrations
Kid’s Tent
Atmosphere
The variety of educational opportunities available
Harvest Festival as a whole
We’re interested in learning more about your experience. Please write in telling us about your selections.
18. Thinking about the time you spent at Harvest Festival, please indicate the extent to which you felt the following emotions
Not at All Very little A Little Somewhat A Lot
A Great Deal
Happy
Pleasantly surprised
Pleased
Excited
Content
Unfulfilled
Annoyed
Disappointed
Frustrated
We’re interested in hearing what prompted these emotions. Please write in telling us about your selections.
19. How likely do you think you are to do the following things, now that you have visited Harvest Festival?
Not at All Very Little A Little Somewhat A Lot Very Likely
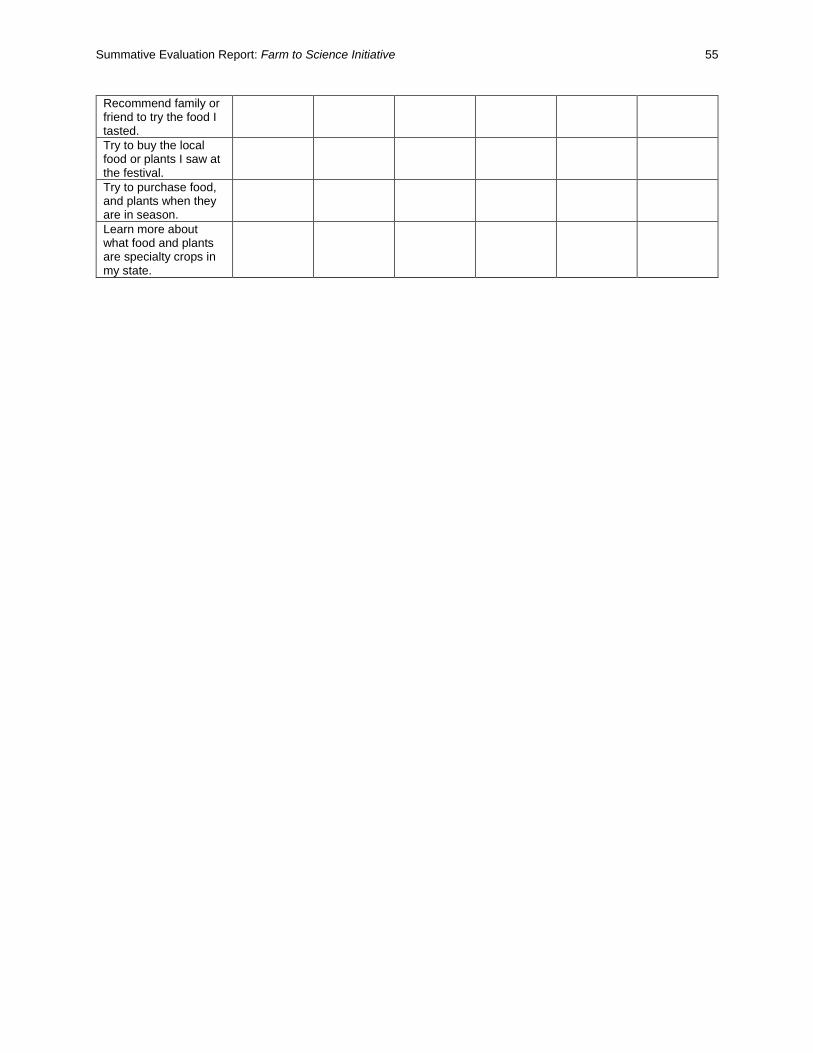
Summative Evaluation Report: Farm to Science Initiative 55
Recommend family or friend to try the food I tasted.
Try to buy the local food or plants I saw at the festival.
Try to purchase food, and plants when they are in season.
Learn more about what food and plants are specialty crops in my state.
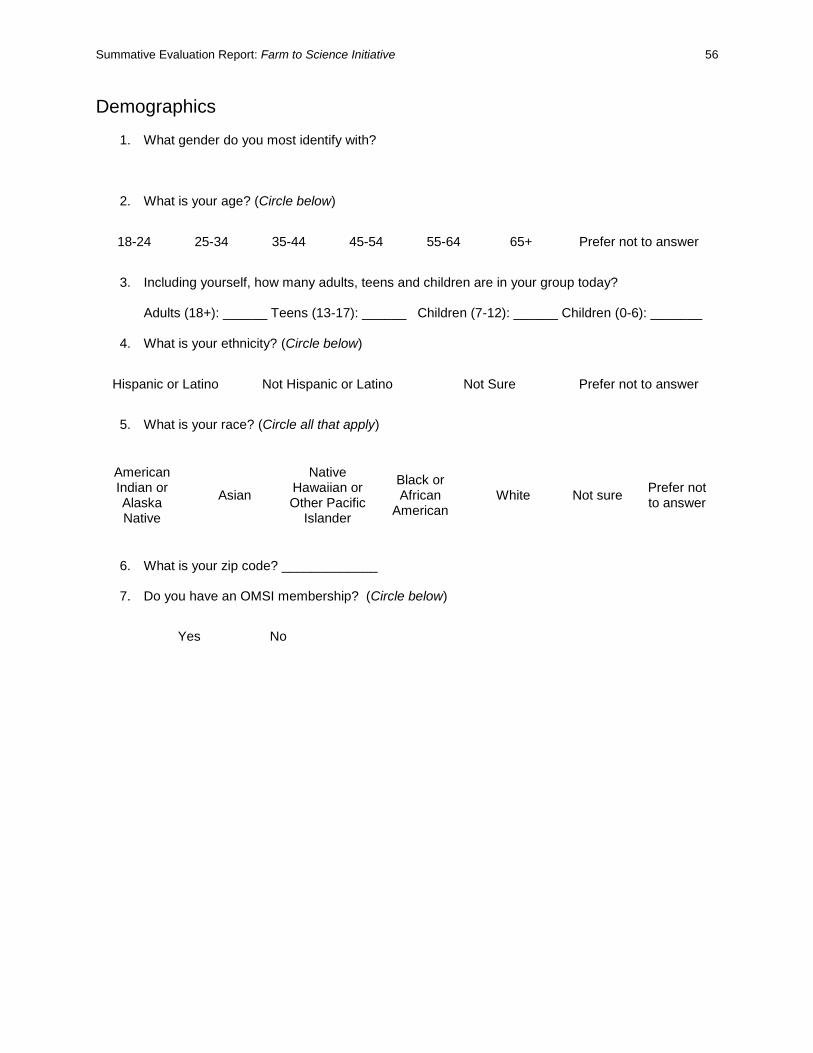
Summative Evaluation Report: Farm to Science Initiative 56
Demographics
1. What gender do you most identify with?
2. What is your age? (Circle below)
18-24 25-34 35-44 45-54 55-64 65+ Prefer not to answer
3. Including yourself, how many adults, teens and children are in your group today?
Adults (18+): ______ Teens (13-17): ______ Children (7-12): ______ Children (0-6): _______
4. What is your ethnicity? (Circle below)
Hispanic or Latino Not Hispanic or Latino Not Sure Prefer not to answer
5. What is your race? (Circle all that apply)
American Indian or Alaska Native
Asian
Native Hawaiian or Other Pacific
Islander
Black or African
American White Not sure
Prefer not to answer
6. What is your zip code? _____________
7. Do you have an OMSI membership? (Circle below)
Yes No