Embed Size (px)
Citation preview
www.everydaymathonline.com
Lesson 5�12 379
Advance PreparationMake copies of Math Masters, pages 159 and 160 and position them next to the Sunrise-Sunset wall chart
and the class Sunrise and Sunset Record.
Teacher’s Reference Manual, Grades 1–3 pp. 121–124
Key Concepts and Skills• Find the maximum, minimum, and
range using data from the Sunrise and
Sunset Record.
[Data and Chance Goal 2]
• Draw conclusions from a line graph.
[Data and Chance Goal 2]
• Draw line segments on a line graph.
[Geometry Goal 1]
Key ActivitiesChildren make a line graph of the Length-of-
Day data they have collected so far. Adding
to the graph will be part of the yearlong
weekly sunrise-sunset routine.
Key Vocabularyline graph
MaterialsMath Journal 1, pp. 27 and 125
Home Link 5�11
Math Masters, pp. 159 and 160
transparency of Math Masters, p. 159 �
Place-Value Book � straightedge � slate
Playing Beat the Calculator (Multiplication)Math Journal 1, p. 156
Student Reference Book, p. 279
calculator
Children practice multiplication facts.
Ongoing Assessment: Recognizing Student Achievement Use an Exit Slip
Math Masters, p. 398
[Operations and Computation Goal 3]
Math Boxes 5�12Math Journal 1, p. 126
Children practice and maintain skills
through Math Box problems.
Home Link 5�12Math Masters, p. 161
Children practice and maintain skills
through Home Link activities.
ENRICHMENT
World Population GrowthMath Masters, p. 162
Student Reference Book, p. 234
Children calculate changes in world
population as they read and interpret data
from a chart and line graph.
EXTRA PRACTICE
Heights of 8-Year-Old ChildrenStudent Reference Book, pp. 79–81 and 235
half-sheet of paper
Children find landmarks for a set of data.
Teaching the Lesson Ongoing Learning & Practice
132
4
Differentiation Options
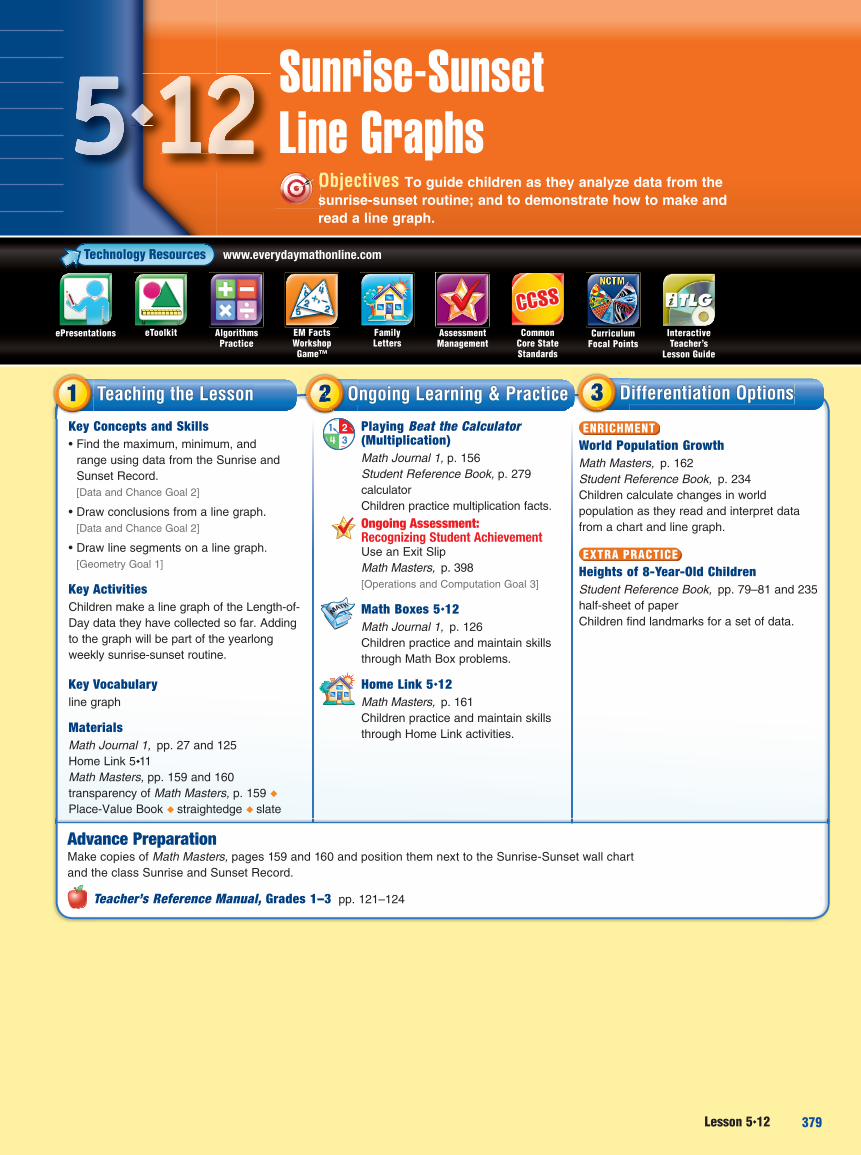
Sunrise-SunsetLine Graphs
Objectives To guide children as they analyze data from the
sunrise-sunset routine; and to demonstrate how to make and
read a line graph.
Os
�����������
eToolkitePresentations Interactive Teacher’s
Lesson Guide
Algorithms Practice
EM FactsWorkshop Game™
AssessmentManagement
Family Letters
CurriculumFocal Points
Common Core State Standards
379_EMCS_T_TLG1_G3_U05_L12_576809.indd 379379_EMCS_T_TLG1_G3_U05_L12_576809.indd 379 2/11/11 2:09 PM2/11/11 2:09 PM
380 Unit 5 Place Value in Whole Numbers and Decimals
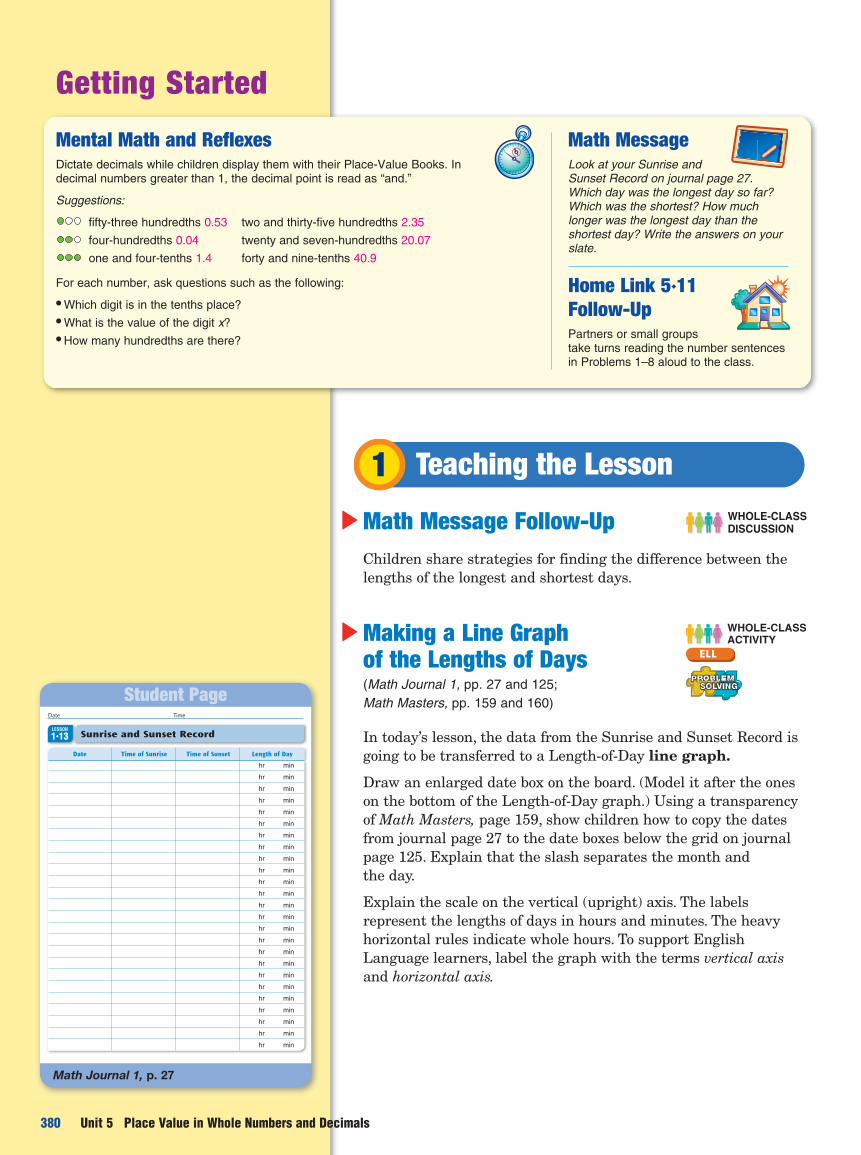
Sunrise and Sunset RecordLESSON
1�13
Date Time
Date Time of Sunrise Time of Sunset Length of Day
hr minhr minhr minhr minhr minhr minhr minhr minhr minhr minhr minhr minhr minhr minhr minhr minhr minhr minhr minhr minhr minhr minhr minhr minhr min
Math Journal 1, p. 27
Student Page
1 Teaching the Lesson
� Math Message Follow-Up WHOLE-CLASSDISCUSSION
Children share strategies for finding the difference between the lengths of the longest and shortest days.
� Making a Line Graph WHOLE-CLASS ACTIVITY
of the Lengths of Days(Math Journal 1, pp. 27 and 125;
Math Masters, pp. 159 and 160)
In today’s lesson, the data from the Sunrise and Sunset Record is going to be transferred to a Length-of-Day line graph.
Draw an enlarged date box on the board. (Model it after the ones on the bottom of the Length-of-Day graph.) Using a transparency of Math Masters, page 159, show children how to copy the dates from journal page 27 to the date boxes below the grid on journal page 125. Explain that the slash separates the month and the day.
Explain the scale on the vertical (upright) axis. The labelsrepresent the lengths of days in hours and minutes. The heavy horizontal rules indicate whole hours. To support English Language learners, label the graph with the terms vertical axis and horizontal axis.
PROBLEMBBBBBBBBBBOOOOOOOOOOBBBBBBBBBBBBBBBBBBBBBBBBBBBB MMMMEMMBLBLELBLEBLELLLBLEBLEBLEBLEBLEBLEBLEBLEEEMMMMMMMMMMMMMMOOOOOOOOOOOOBBBBBBBBLBLBBLBLLLBLLLLPROPROPROPROPROPROPROPROPROPROPROPPRPRPPPPPPPPPPPPPPPPPPPPPPPPPPPPPPPPPPPPPPPPROROOROROROROROOPPPPPPP MMMMMMMMMMMMMMMMMMMMMEEEEEEEEEEELELELEEEEEEEEEELLLLLLLLLLLLLLLLLLLLLRRRRRRRRRRRRRRRRRPROBLEMSOLVING
BBBBBBBBBBBBBBBBBBBB EEELEMMMMMMMMOOOOOOOOOBBBLBLBLBBLBLBBROROOROROROROROROROROROROO LELELELEEEEEELEEMMMMMMMMMMMMLEMLLLLLLLLLLLLLLLLLLLLLRRRRRRRRRRGGGGLLLLLLLLLLLLLVVINVINVINVINVINNNVINVINVINVINVINVINVINGGGGGGGGGGOLOOOOOLOOLOLOO VINVINVLLLLLLLLLLVINVINVINVINVINVINVINVINVINVINVINVINVINVINNGGGGGGGGGGGOLOLOLOLOLOLOLOOOLVVVVVVLLLLLLLLLLVVVVVVVVVOSSOOSOSOSOSOSOSOSOSOSOOOOOOSOSOSOSOSOSOSOSOSOSOSOSOOSOSOSOSOSOSSSSSSSSSSSSSSSSSSSSSSSSSSSSSSSSSSSSS VVVVVVVVVVVVVVVVVVVVVLLLLLLVVVVVVVVVLLLVVVVVVVVLLLLLLLLVVVVVLLLLLLLLLLLLLLLLLLLLLLLLLLLLLLLLLLLLLLLLSSSSSSSSSSSSSSSSSSSSSSSOOOOOOOOOOOOOOOOOOOO GGGGGGGGGGGGGGGGGGGGGGGGGGGGGGGGGGGGGGGGGGGGGGGGGGGGGGGGGGNNNNNNNNNNNNNNNNNNNNNNNNNNNIIIIIIIIIIIIIIIIIIIISOLVING
ELL
Getting Started
Math Message Look at your Sunrise and Sunset Record on journal page 27. Which day was the longest day so far? Which was the shortest? How much longer was the longest day than the shortest day? Write the answers on your slate.
Home Link 5�11 Follow-Up Partners or small groups take turns reading the number sentences in Problems 1–8 aloud to the class.
Mental Math and Reflexes Dictate decimals while children display them with their Place-Value Books. In decimal numbers greater than 1, the decimal point is read as “and.”
Suggestions:
fifty-three hundredths 0.53 two and thirty-five hundredths 2.35
four-hundredths 0.04 twenty and seven-hundredths 20.07
one and four-tenths 1.4 forty and nine-tenths 40.9
For each number, ask questions such as the following:
• Which digit is in the tenths place?
• What is the value of the digit x?
• How many hundredths are there?
EM3cuG3TLG1_380-383_U05L12.indd 380EM3cuG3TLG1_380-383_U05L12.indd 380 12/22/10 8:53 AM12/22/10 8:53 AM
Adjusting the Activity
Links to the Future
Lesson 5�12 381
LESSON
5�12
Name Date Time
Length-of-Day Line Graph
16 hr 0 min
30 min
15 hr 0 min
30 min
14 hr 0 min
30 min
13 hr 0 min
30 min
12 hr 0 min
30 min
11 hr 0 min
30 min
10 hr 0 min
30 min
9 hr 0 min
30 min
8 hr 0 min
Date
Math Masters, p. 159
Teaching Master
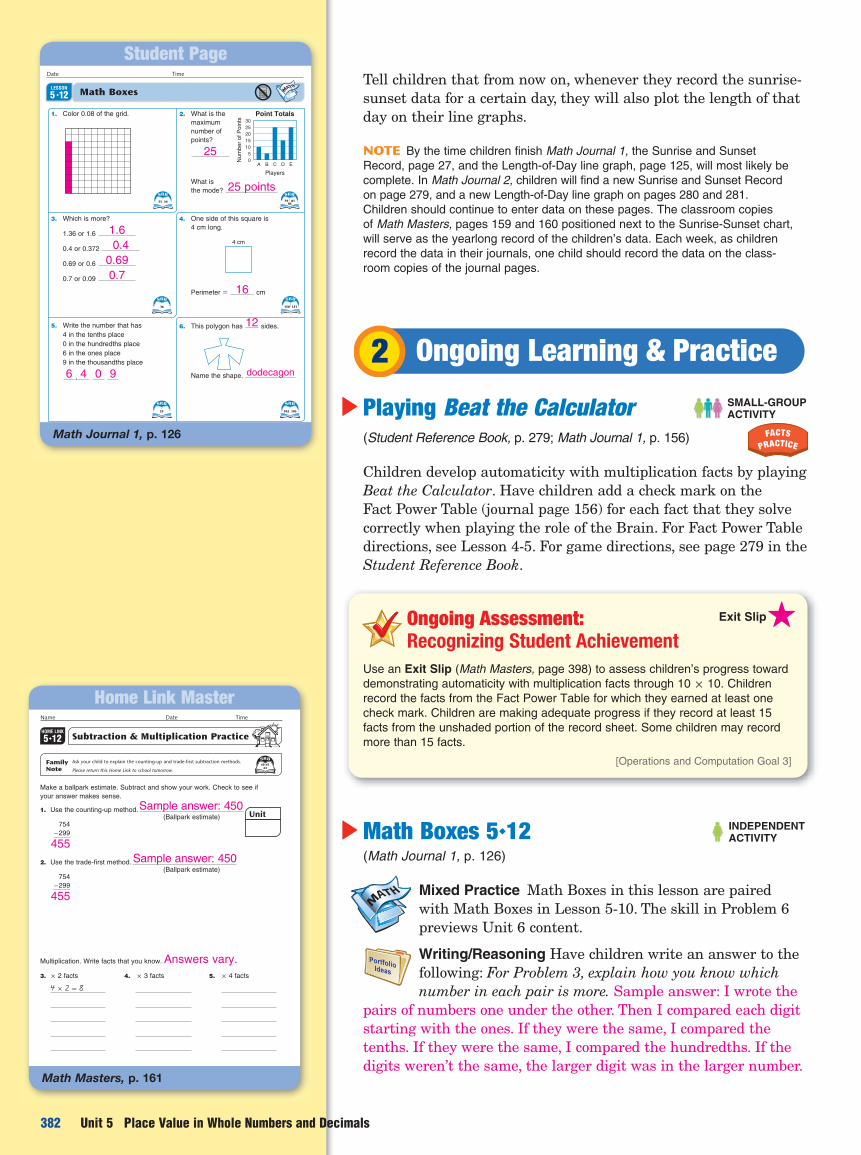
NOTE Math Masters, page 159 is similar to
journal page 125.
LESSON
5�12
Name Date Time
Length-of-Day Line Graph continued
16 hr 0 min
30 min
15 hr 0 min
30 min
14 hr 0 min
30 min
13 hr 0 min
30 min
12 hr 0 min
30 min
11 hr 0 min
30 min
10 hr 0 min
30 min
9 hr 0 min
30 min
8 hr 0 min
Date
Math Masters, p. 160
Teaching Master
Write the word whole on the board and explain its meaning. Whole
hours means entire or complete hours. This will prevent children from hearing
and thinking the word hole.
A U D I T O R Y � K I N E S T H E T I C � T A C T I L E � V I S U A L
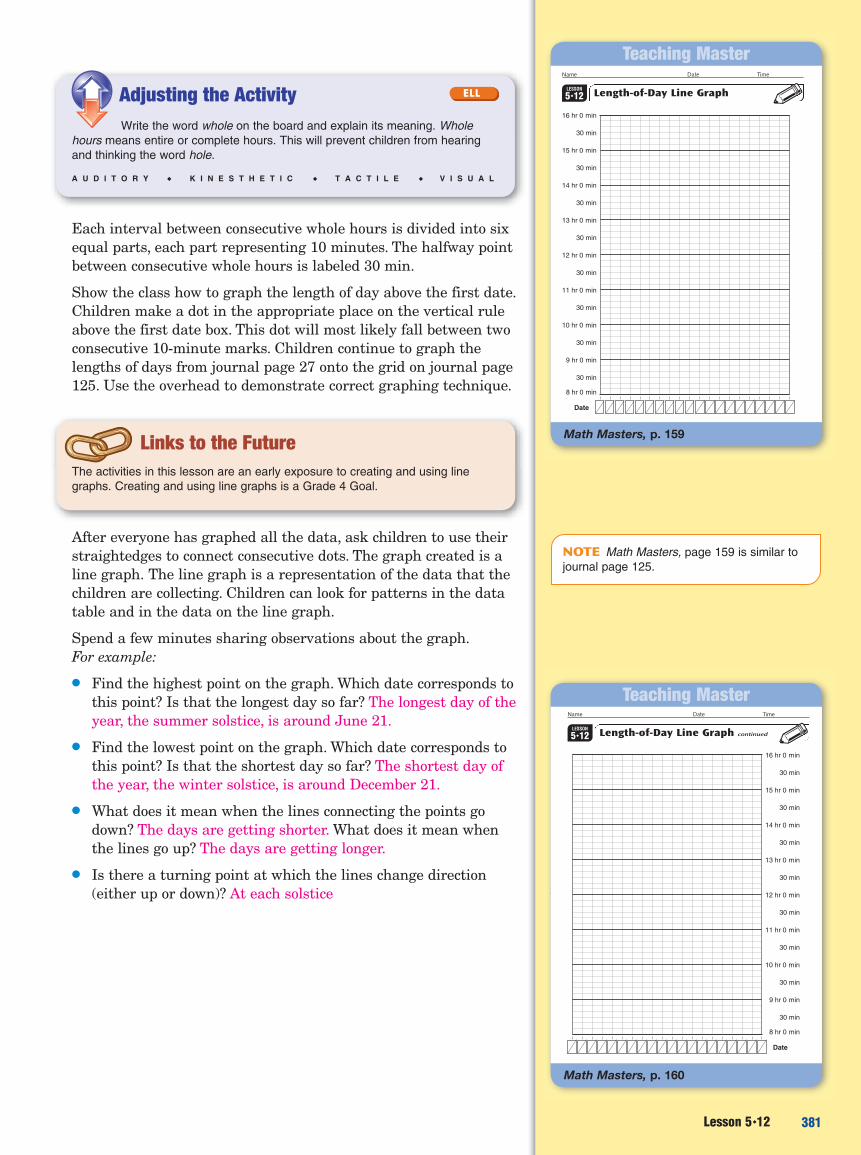
Each interval between consecutive whole hours is divided into six equal parts, each part representing 10 minutes. The halfway point between consecutive whole hours is labeled 30 min.
Show the class how to graph the length of day above the first date. Children make a dot in the appropriate place on the vertical rule above the first date box. This dot will most likely fall between twoconsecutive 10-minute marks. Children continue to graph the lengths of days from journal page 27 onto the grid on journal page 125. Use the overhead to demonstrate correct graphing technique.
The activities in this lesson are an early exposure to creating and using line
graphs. Creating and using line graphs is a Grade 4 Goal.
After everyone has graphed all the data, ask children to use their straightedges to connect consecutive dots. The graph created is a line graph. The line graph is a representation of the data that the children are collecting. Children can look for patterns in the data table and in the data on the line graph.
Spend a few minutes sharing observations about the graph. For example:
● Find the highest point on the graph. Which date corresponds to this point? Is that the longest day so far? The longest day of the year, the summer solstice, is around June 21.
● Find the lowest point on the graph. Which date corresponds to this point? Is that the shortest day so far? The shortest day of the year, the winter solstice, is around December 21.
● What does it mean when the lines connecting the points go down? The days are getting shorter. What does it mean when the lines go up? The days are getting longer.
● Is there a turning point at which the lines change direction (either up or down)? At each solstice
ELL
EM3cuG3TLG1_380-383_U05L12.indd 381EM3cuG3TLG1_380-383_U05L12.indd 381 12/21/10 4:35 PM12/21/10 4:35 PM
382 Unit 5 Place Value in Whole Numbers and Decimals
5. Write the number that has
4 in the tenths place
0 in the hundredths place
6 in the ones place
9 in the thousandths place
6 . 4 0 9
3. Which is more?
1.36 or 1.6 1.6
0.4 or 0.372 0.4
0.69 or 0.6 0.69
0.7 or 0.09 0.7
Date Time
2. What is the
maximum
number of
points?
25
What is
the mode? 25 points
4. One side of this square is
4 cm long.
4 cm
Perimeter = 16 cm
6. This polygon has 12 sides.
Name the shape. dodecagon
1. Color 0.08 of the grid.
33 34
36
79 8186
150 151
35 102 103
Math BoxesLESSON
5 �12
A B C D E05
1015202530
Num
ber o
f Poi
nts
Players
Point Totals
102-127_EMCS_S_SMJ_G3_U05_576353.indd 126 1/26/11 9:17 AM
Math Journal 1, p. 126
Student Page
Name Date Time
HOME LINK
5�12
Make a ballpark estimate. Subtract and show your work. Check to see if
your answer makes sense.
1. Use the counting-up method.
754
-299
2. Use the trade-first method.
754
-299
Multiplication. Write facts that you know.
3. × 2 facts 4. × 3 facts 5. × 4 facts
Answers vary.
455
4 × 2 = 8
455
Sample answer: 450
Sample answer: 450
Subtraction & Multiplication Practice
Unit
Ask your child to explain the counting-up and trade-first subtraction methods.
Please return this Home Link to school tomorrow.
Family Note
60 61 63
(Ballpark estimate)
(Ballpark estimate)
EM3MM_G3_U05_119-166.indd 161 1/7/11 3:29 PM
Math Masters, p. 161
Home Link Master
Tell children that from now on, whenever they record the sunrise-sunset data for a certain day, they will also plot the length of that day on their line graphs.
NOTE By the time children finish Math Journal 1, the Sunrise and Sunset
Record, page 27, and the Length-of-Day line graph, page 125, will most likely be
complete. In Math Journal 2, children will find a new Sunrise and Sunset Record
on page 279, and a new Length-of-Day line graph on pages 280 and 281.
Children should continue to enter data on these pages. The classroom copies
of Math Masters, pages 159 and 160 positioned next to the Sunrise-Sunset chart,
will serve as the yearlong record of the children’s data. Each week, as children
record the data in their journals, one child should record the data on the class-
room copies of the journal pages.
2 Ongoing Learning & Practice
� Playing Beat the Calculator SMALL-GROUP ACTIVITY
(Student Reference Book, p. 279; Math Journal 1, p. 156)
Children develop automaticity with multiplication facts by playing Beat the Calculator. Have children add a check mark on the Fact Power Table (journal page 156) for each fact that they solve correctly when playing the role of the Brain. For Fact Power Table directions, see Lesson 4-5. For game directions, see page 279 in the Student Reference Book.
Ongoing Assessment: Exit Slip�Recognizing Student Achievement
Use an Exit Slip (Math Masters, page 398) to assess children’s progress toward
demonstrating automaticity with multiplication facts through 10 × 10. Children
record the facts from the Fact Power Table for which they earned at least one
check mark. Children are making adequate progress if they record at least 15
facts from the unshaded portion of the record sheet. Some children may record
more than 15 facts.
[Operations and Computation Goal 3]
� Math Boxes 5�12 INDEPENDENTACTIVITY
(Math Journal 1, p. 126)
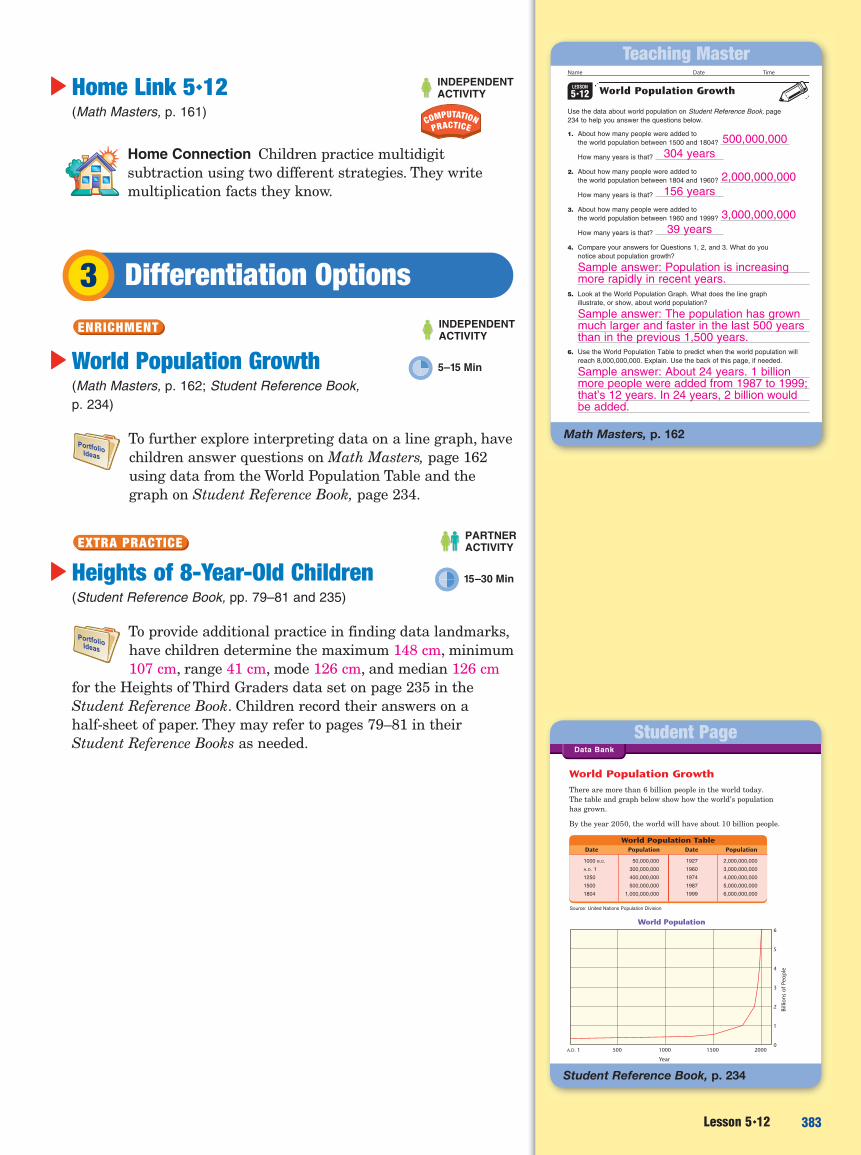
Mixed Practice Math Boxes in this lesson are paired with Math Boxes in Lesson 5-10. The skill in Problem 6 previews Unit 6 content.
Writing/Reasoning Have children write an answer to the following: For Problem 3, explain how you know which number in each pair is more. Sample answer: I wrote the
pairs of numbers one under the other. Then I compared each digit starting with the ones. If they were the same, I compared the tenths. If they were the same, I compared the hundredths. If the digits weren’t the same, the larger digit was in the larger number.
380-383_EMCS_T_TLG1_G3_U05_L12_576809.indd 382380-383_EMCS_T_TLG1_G3_U05_L12_576809.indd 382 1/26/11 4:09 PM1/26/11 4:09 PM
LESSON
5�12
Name Date Time
World Population Growth
Use the data about world population on Student Reference Book, page
234 to help you answer the questions below.
1. About how many people were added to
the world population between 1500 and 1804?
How many years is that?
2. About how many people were added to
the world population between 1804 and 1960?
How many years is that?
3. About how many people were added to
the world population between 1960 and 1999?
How many years is that?
4. Compare your answers for Questions 1, 2, and 3. What do you
notice about population growth?
Sample answer: Population is increasing more rapidly in recent years.
5. Look at the World Population Graph. What does the line graph
illustrate, or show, about world population?
Sample answer: The population has grownmuch larger and faster in the last 500 yearsthan in the previous 1,500 years.
6. Use the World Population Table to predict when the world population will
reach 8,000,000,000. Explain. Use the back of this page, if needed.
Sample answer: About 24 years. 1 billion more people were added from 1987 to 1999;that’s 12 years. In 24 years, 2 billion wouldbe added.
39 years
3,000,000,000
156 years
2,000,000,000
304 years
500,000,000
Math Masters, p. 162
Teaching Master
Lesson 5�12 383
World Population GrowthThere are more than 6 billion people in the world today.The table and graph below show how the world’s populationhas grown.
By the year 2050, the world will have about 10 billion people.
Data Bank
World Population
World Population TableDate Population Date Population
1000 B.C. 50,000,000 1927 2,000,000,000A.D. 1 300,000,000 1960 3,000,000,0001250 400,000,000 1974 4,000,000,0001500 500,000,000 1987 5,000,000,0001804 1,000,000,000 1999 6,000,000,000
Source: United Nations Population Division
Student Reference Book, p. 234
Student Page
� Home Link 5�12 INDEPENDENTACTIVITY
(Math Masters, p. 161)
Home Connection Children practice multidigit subtraction using two different strategies. They write multiplication facts they know.
3 Differentiation Options
ENRICHMENT INDEPENDENTACTIVITY
� World Population Growth 5–15 Min
(Math Masters, p. 162; Student Reference Book,
p. 234)
To further explore interpreting data on a line graph, have children answer questions on Math Masters, page 162 using data from the World Population Table and the graph on Student Reference Book, page 234.
EXTRA PRACTICE PARTNER ACTIVITY
� Heights of 8-Year-Old Children 15–30 Min
(Student Reference Book, pp. 79–81 and 235)
To provide additional practice in finding data landmarks, have children determine the maximum 148 cm, minimum 107 cm, range 41 cm, mode 126 cm, and median 126 cm
for the Heights of Third Graders data set on page 235 in the Student Reference Book. Children record their answers on a half-sheet of paper. They may refer to pages 79–81 in their Student Reference Books as needed.
380-383_EMCS_T_TLG1_G3_U05_L12_576809.indd 383380-383_EMCS_T_TLG1_G3_U05_L12_576809.indd 383 1/26/11 4:09 PM1/26/11 4:09 PM


![LESSON 15: Deriving the Equation of a Line OBJECTIVEntnmath.kemsmath.com/Level H Lesson Notes/Grade 8...LESSON 15: Deriving the Equation of a Line [OBJECTIVE] The student will derive](https://img.pdfslide.net/doc/110x75/5ebd06dfef40d069e20f6d34/lesson-15-deriving-the-equation-of-a-line-h-lesson-notesgrade-8-lesson-15.jpg)