Embed Size (px)
Citation preview
Developmental Cell, Volume 27
Supplemental Information
A Molecular Blueprint
at the Apical Surface Establishes
Planar Asymmetry in Cochlear Hair Cells
Basile Tarchini, Christine Jolicoeur, and Michel Cayouette
Inventory of Supplemental Information 1) Supplementary Figures Figure S1, related to Figure 1 Figure S2, related to Figures 1 and 3 Figure S3, related to Figure 2 Figure S4, related to Figure 3 Figure S5, related to Figure 5 Figure S6, related to Figure 5 Figure S7, related to Figure 6 Figure S8, related to Figure 8 2) Supplementary Experimental Procedures 3) Supplementary References
SUPPLEMENTARY FIGURE LEGENDS
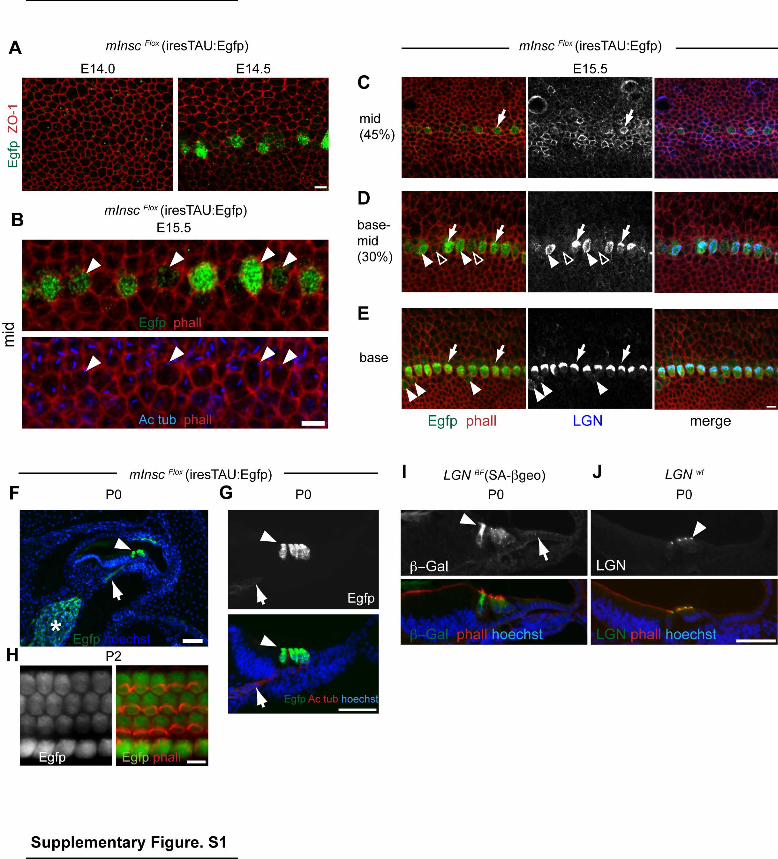
Supplementary Figure 1 (related to Figure 1). mInsc and LGN share expression pattern and dynamics in the organ of Corti. (A-B) Immunostaining for TAU:Egfp expressed in mInscFlox mice (see Fig. S2A). mInsc is first transcribed at E14.5 (A) in the sensory epithelium, and is specific to prospective IHCs that undergo a lateral shift of the kinocilium at E15.5 (B, arrowheads). (C) At mid-distance along the E15.5 cochlea, LGN protein is at the apical junctions of a large subset of undifferentiated cells, but does not exhibit obvious planar enrichment. Some LGN-positive cells also transcribe mInsc and are thus prospective IHCs (arrow). (D-E) In more differentiated regions, LGN is strongly enriched and polarized at the AS specifically in mInsc-positive IHCs (arrows). LGN appears very transiently unpolarized at the AS (D, solid arrowheads). Less differentiated IHCs that are aligned (D, open arrowheads) or still unaligned (E, arrowheads) with the other IHCs share lower levels of mInsc and LGN expression. (F-H) Postnatal mInsc expression is limited to HCs in the sensory epithelium (arrowheads) in sections (F, G) or AS view (H). mInsc is expressed at lower levels in the spiral ganglion (F, asterisk) and along axonal projections to the HCs (F-G, arrows). (I) Postnatal LGN transcription is highest in HCs as seen in LGNBF cochlea sections immunostained for the beta-galactosidase reporter (ß-Gal, arrowhead), but is also detected in neighboring cells (arrow). LGN protein is only detected in HCs, and is enriched at the apical surface as a lateral crescent (J, arrowhead). Scale bars are 5µm (A-E, H), 50µm (F-G, I-J).
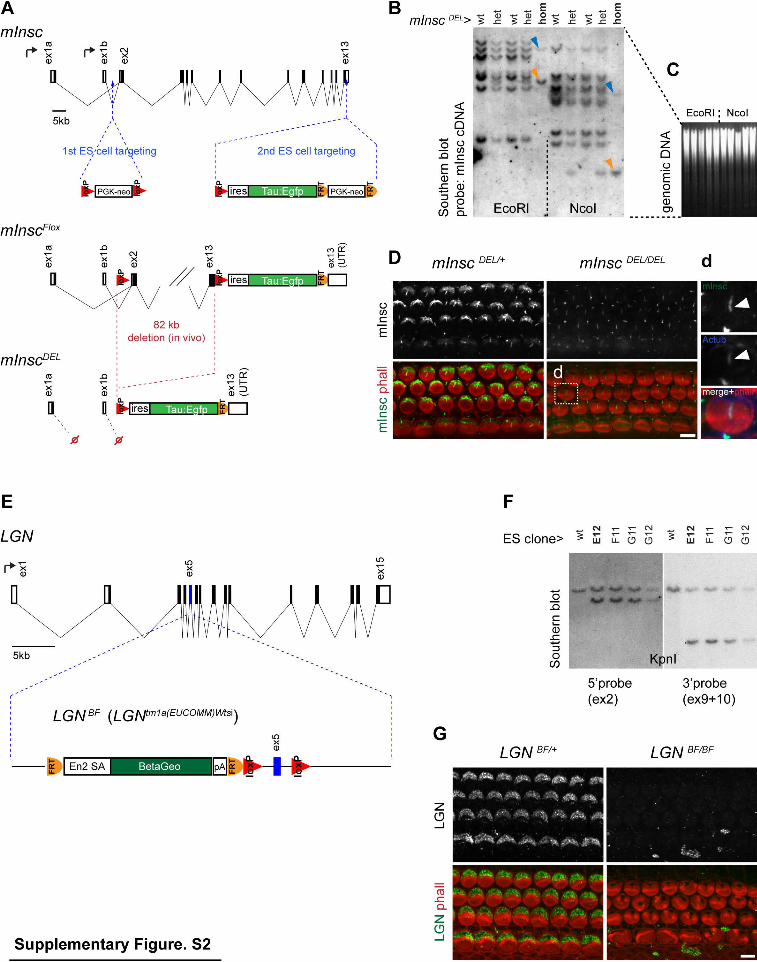
Supplementary Figure 2 (related to Figures 1 and 3). Generation of mInsc and LGN mouse mutants and control of antibody specificity. (A) Strategy to create the mInscDEL allele. Two successive ES cell electroporations introduced the indicated cassettes to generate the InscFlox mouse. The deletion (mInscDEL) was produced in a cross with the CMV-Cre mouse line. Note how retained first exons for the long (ex1a, coding) or short (ex1b, non-coding) isoforms cannot be spliced on missing ex2. (B) Southern blot using the full mInsc cDNA (short isoform) as a probe template to verify the deletion in mInscDEL genomic DNA. Remaining bands in homozygotes (hom) lanes match the expected sizes for probes corresponding to the retained ex1b and 3ʼUTR (blue and orange arrowheads, respectively). Equal loading of genomic DNA is shown in (C). (D) mInsc detected with a long isoform-specific antibody is absent in mInscDEL HCs. Staining in the acetylated tubulin-labeled kinocilium (arrowhead) is unchanged in mInscDEL and corresponds to non-specific antibody binding (d). (E) Strategy to flox LGN (Gpsm2) exon 5 and introduce an upstream reporter in the Gpsm2tm1a(EUCOMM)Wtsi ES cell line obtained from the European Conditional Mouse Mutagenesis consortium. This allele (LGNBF) inactivates LGN since the reporter placed after a splice acceptor creates a N-terminal truncation of the protein. (F) Southern blot verifying correct homologous recombination on both sides of LGN exon 5 in 4 ES cell clones. Clone E12 was used to produce LGNBF. (G) LGN immunostaining is lost in LGNBF HCs. wt, wild-type; het, heterozygotes. Scale bars 5µm.
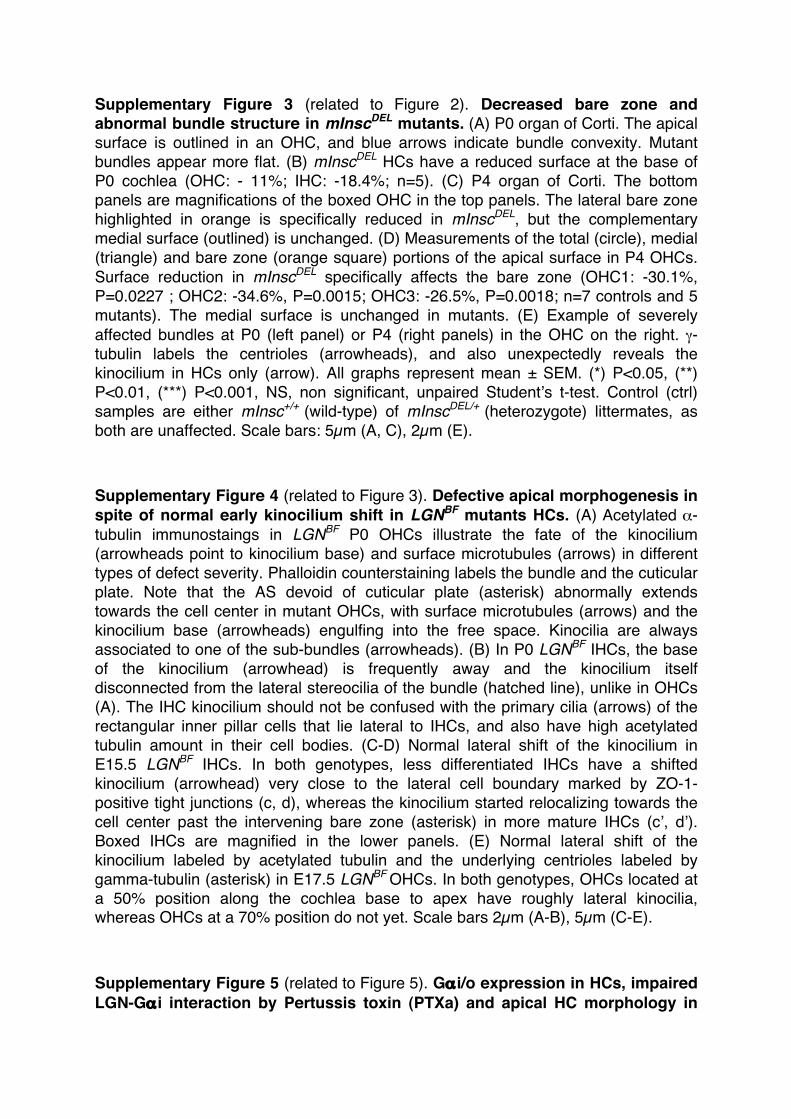
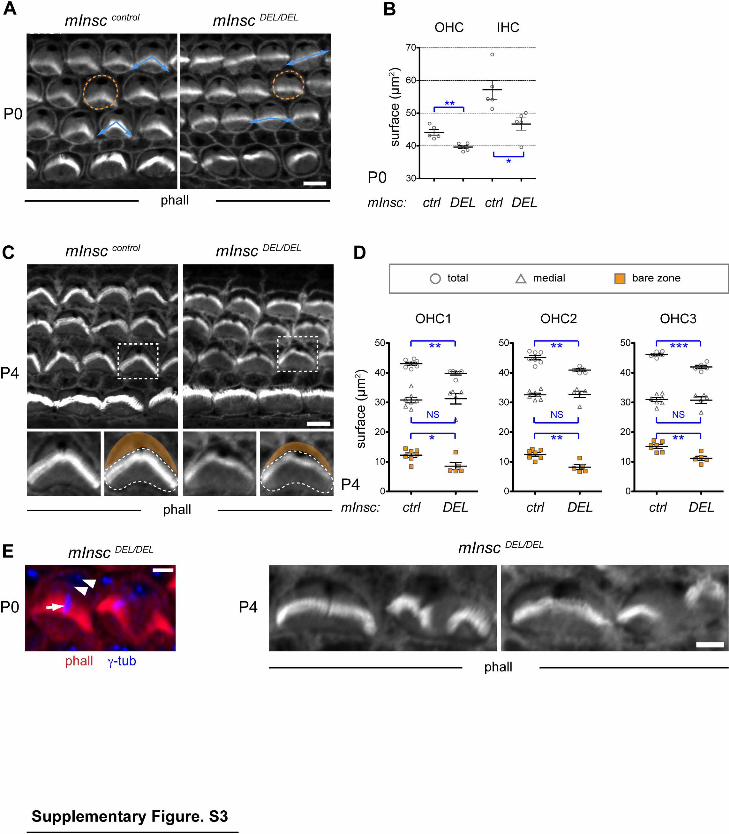
Supplementary Figure 3 (related to Figure 2). Decreased bare zone and abnormal bundle structure in mInscDEL mutants. (A) P0 organ of Corti. The apical surface is outlined in an OHC, and blue arrows indicate bundle convexity. Mutant bundles appear more flat. (B) mInscDEL HCs have a reduced surface at the base of P0 cochlea (OHC: - 11%; IHC: -18.4%; n=5). (C) P4 organ of Corti. The bottom panels are magnifications of the boxed OHC in the top panels. The lateral bare zone highlighted in orange is specifically reduced in mInscDEL, but the complementary medial surface (outlined) is unchanged. (D) Measurements of the total (circle), medial (triangle) and bare zone (orange square) portions of the apical surface in P4 OHCs. Surface reduction in mInscDEL specifically affects the bare zone (OHC1: -30.1%, P=0.0227 ; OHC2: -34.6%, P=0.0015; OHC3: -26.5%, P=0.0018; n=7 controls and 5 mutants). The medial surface is unchanged in mutants. (E) Example of severely affected bundles at P0 (left panel) or P4 (right panels) in the OHC on the right. γ-tubulin labels the centrioles (arrowheads), and also unexpectedly reveals the kinocilium in HCs only (arrow). All graphs represent mean ± SEM. (*) P<0.05, (**) P<0.01, (***) P<0.001, NS, non significant, unpaired Studentʼs t-test. Control (ctrl) samples are either mInsc+/+ (wild-type) of mInscDEL/+ (heterozygote) littermates, as both are unaffected. Scale bars: 5µm (A, C), 2µm (E).
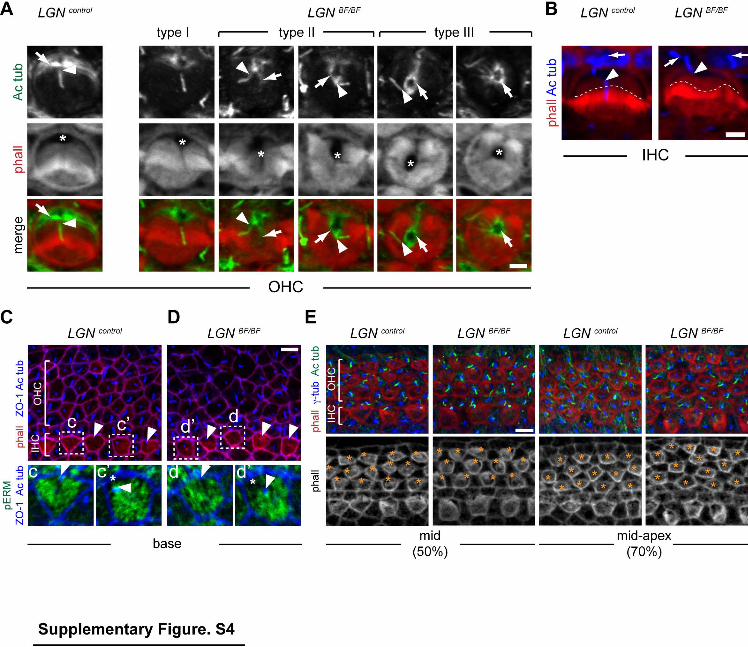
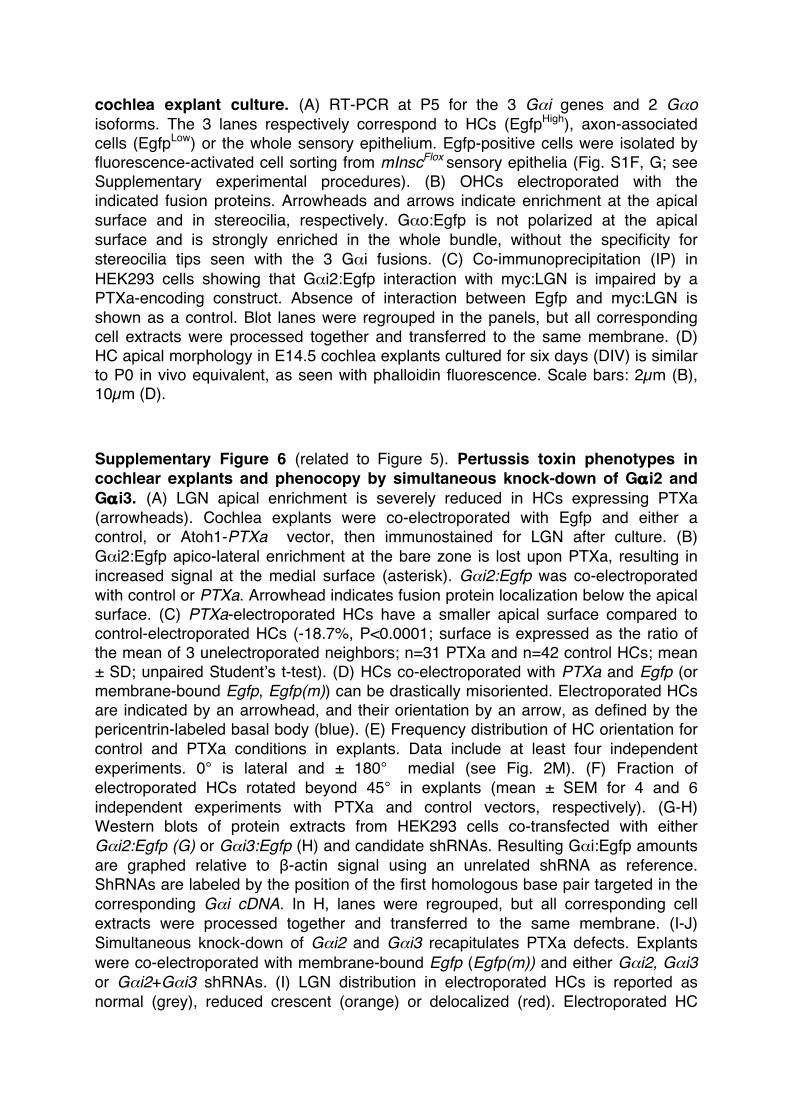
Supplementary Figure 4 (related to Figure 3). Defective apical morphogenesis in spite of normal early kinocilium shift in LGNBF mutants HCs. (A) Acetylated α-tubulin immunostaings in LGNBF P0 OHCs illustrate the fate of the kinocilium (arrowheads point to kinocilium base) and surface microtubules (arrows) in different types of defect severity. Phalloidin counterstaining labels the bundle and the cuticular plate. Note that the AS devoid of cuticular plate (asterisk) abnormally extends towards the cell center in mutant OHCs, with surface microtubules (arrows) and the kinocilium base (arrowheads) engulfing into the free space. Kinocilia are always associated to one of the sub-bundles (arrowheads). (B) In P0 LGNBF IHCs, the base of the kinocilium (arrowhead) is frequently away and the kinocilium itself disconnected from the lateral stereocilia of the bundle (hatched line), unlike in OHCs (A). The IHC kinocilium should not be confused with the primary cilia (arrows) of the rectangular inner pillar cells that lie lateral to IHCs, and also have high acetylated tubulin amount in their cell bodies. (C-D) Normal lateral shift of the kinocilium in E15.5 LGNBF IHCs. In both genotypes, less differentiated IHCs have a shifted kinocilium (arrowhead) very close to the lateral cell boundary marked by ZO-1-positive tight junctions (c, d), whereas the kinocilium started relocalizing towards the cell center past the intervening bare zone (asterisk) in more mature IHCs (cʼ, dʼ). Boxed IHCs are magnified in the lower panels. (E) Normal lateral shift of the kinocilium labeled by acetylated tubulin and the underlying centrioles labeled by gamma-tubulin (asterisk) in E17.5 LGNBF OHCs. In both genotypes, OHCs located at a 50% position along the cochlea base to apex have roughly lateral kinocilia, whereas OHCs at a 70% position do not yet. Scale bars 2µm (A-B), 5µm (C-E).
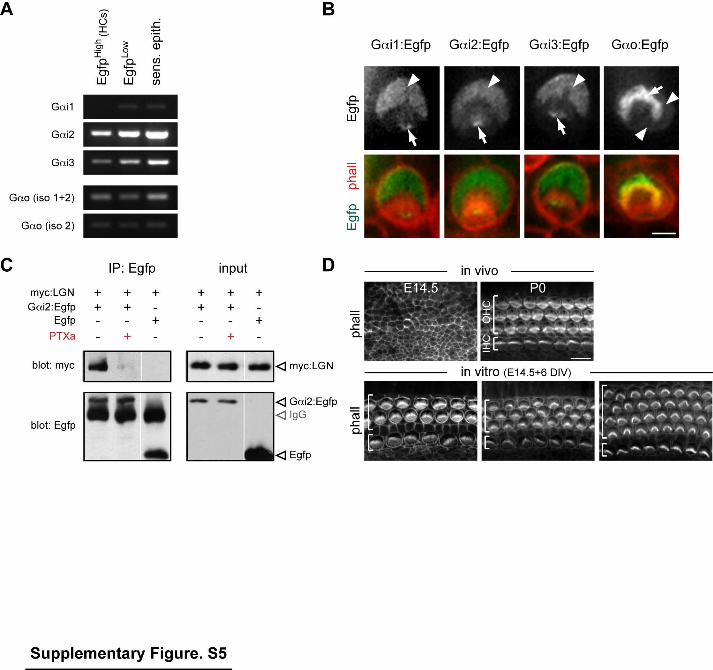
Supplementary Figure 5 (related to Figure 5). Gαi/o expression in HCs, impaired LGN-Gαi interaction by Pertussis toxin (PTXa) and apical HC morphology in
cochlea explant culture. (A) RT-PCR at P5 for the 3 Gαi genes and 2 Gαo isoforms. The 3 lanes respectively correspond to HCs (EgfpHigh), axon-associated cells (EgfpLow) or the whole sensory epithelium. Egfp-positive cells were isolated by fluorescence-activated cell sorting from mInscFlox sensory epithelia (Fig. S1F, G; see Supplementary experimental procedures). (B) OHCs electroporated with the indicated fusion proteins. Arrowheads and arrows indicate enrichment at the apical surface and in stereocilia, respectively. Gαo:Egfp is not polarized at the apical surface and is strongly enriched in the whole bundle, without the specificity for stereocilia tips seen with the 3 Gαi fusions. (C) Co-immunoprecipitation (IP) in HEK293 cells showing that Gαi2:Egfp interaction with myc:LGN is impaired by a PTXa-encoding construct. Absence of interaction between Egfp and myc:LGN is shown as a control. Blot lanes were regrouped in the panels, but all corresponding cell extracts were processed together and transferred to the same membrane. (D) HC apical morphology in E14.5 cochlea explants cultured for six days (DIV) is similar to P0 in vivo equivalent, as seen with phalloidin fluorescence. Scale bars: 2µm (B), 10µm (D).
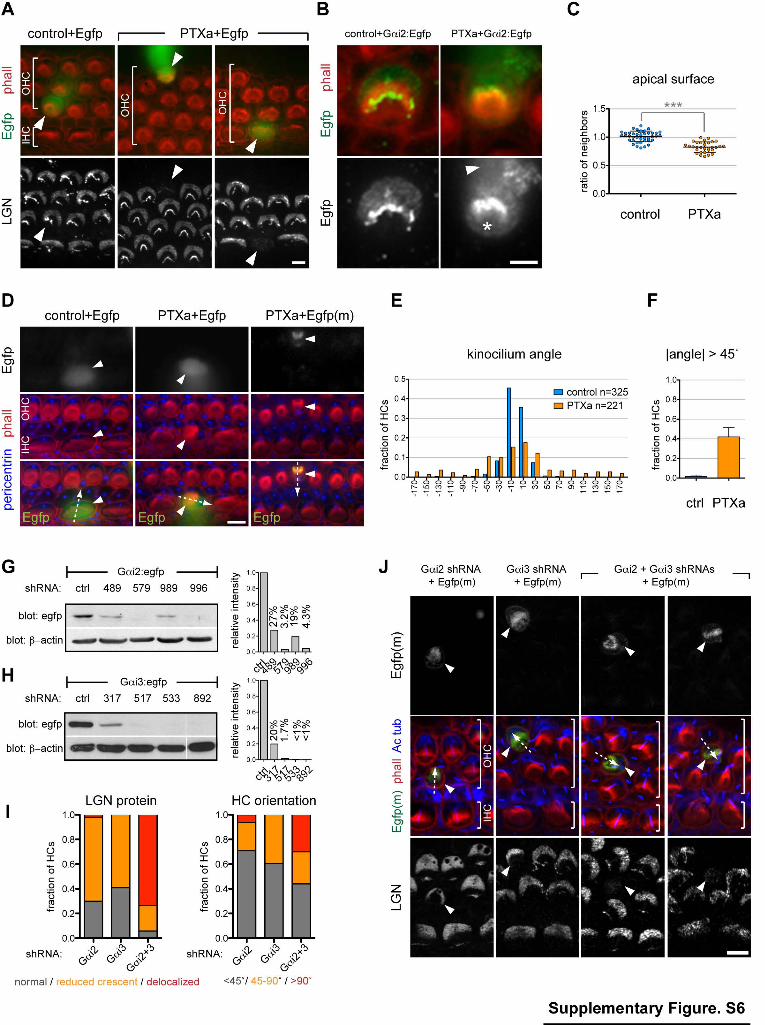
Supplementary Figure 6 (related to Figure 5). Pertussis toxin phenotypes in cochlear explants and phenocopy by simultaneous knock-down of Gαi2 and Gαi3. (A) LGN apical enrichment is severely reduced in HCs expressing PTXa (arrowheads). Cochlea explants were co-electroporated with Egfp and either a control, or Atoh1-PTXa vector, then immunostained for LGN after culture. (B) Gαi2:Egfp apico-lateral enrichment at the bare zone is lost upon PTXa, resulting in increased signal at the medial surface (asterisk). Gαi2:Egfp was co-electroporated with control or PTXa. Arrowhead indicates fusion protein localization below the apical surface. (C) PTXa-electroporated HCs have a smaller apical surface compared to control-electroporated HCs (-18.7%, P<0.0001; surface is expressed as the ratio of the mean of 3 unelectroporated neighbors; n=31 PTXa and n=42 control HCs; mean ± SD; unpaired Studentʼs t-test). (D) HCs co-electroporated with PTXa and Egfp (or membrane-bound Egfp, Egfp(m)) can be drastically misoriented. Electroporated HCs are indicated by an arrowhead, and their orientation by an arrow, as defined by the pericentrin-labeled basal body (blue). (E) Frequency distribution of HC orientation for control and PTXa conditions in explants. Data include at least four independent experiments. 0° is lateral and ± 180° medial (see Fig. 2M). (F) Fraction of electroporated HCs rotated beyond 45° in explants (mean ± SEM for 4 and 6 independent experiments with PTXa and control vectors, respectively). (G-H) Western blots of protein extracts from HEK293 cells co-transfected with either Gαi2:Egfp (G) or Gαi3:Egfp (H) and candidate shRNAs. Resulting Gαi:Egfp amounts are graphed relative to β-actin signal using an unrelated shRNA as reference. ShRNAs are labeled by the position of the first homologous base pair targeted in the corresponding Gαi cDNA. In H, lanes were regrouped, but all corresponding cell extracts were processed together and transferred to the same membrane. (I-J) Simultaneous knock-down of Gαi2 and Gαi3 recapitulates PTXa defects. Explants were co-electroporated with membrane-bound Egfp (Egfp(m)) and either Gαi2, Gαi3 or Gαi2+Gαi3 shRNAs. (I) LGN distribution in electroporated HCs is reported as normal (grey), reduced crescent (orange) or delocalized (red). Electroporated HC
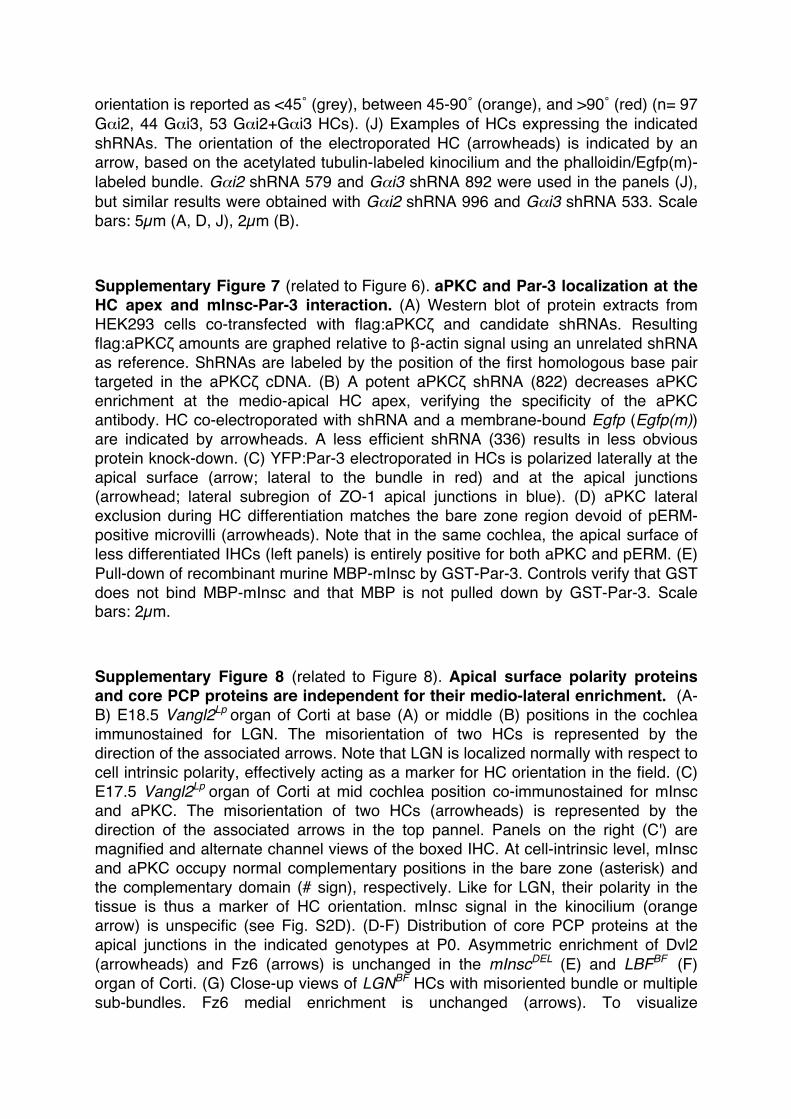
orientation is reported as <45˚ (grey), between 45-90˚ (orange), and >90˚ (red) (n= 97 Gαi2, 44 Gαi3, 53 Gαi2+Gαi3 HCs). (J) Examples of HCs expressing the indicated shRNAs. The orientation of the electroporated HC (arrowheads) is indicated by an arrow, based on the acetylated tubulin-labeled kinocilium and the phalloidin/Egfp(m)-labeled bundle. Gαi2 shRNA 579 and Gαi3 shRNA 892 were used in the panels (J), but similar results were obtained with Gαi2 shRNA 996 and Gαi3 shRNA 533. Scale bars: 5µm (A, D, J), 2µm (B).
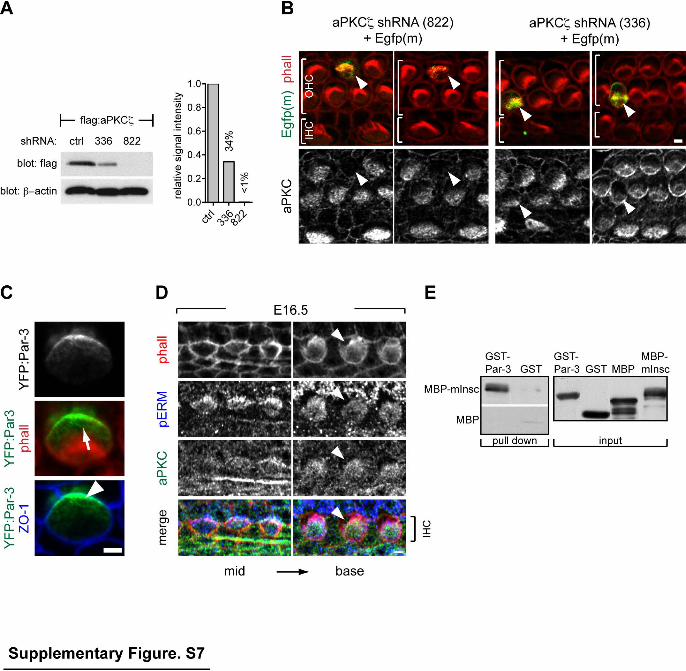
Supplementary Figure 7 (related to Figure 6). aPKC and Par-3 localization at the HC apex and mInsc-Par-3 interaction. (A) Western blot of protein extracts from HEK293 cells co-transfected with flag:aPKCζ and candidate shRNAs. Resulting flag:aPKCζ amounts are graphed relative to β-actin signal using an unrelated shRNA as reference. ShRNAs are labeled by the position of the first homologous base pair targeted in the aPKCζ cDNA. (B) A potent aPKCζ shRNA (822) decreases aPKC enrichment at the medio-apical HC apex, verifying the specificity of the aPKC antibody. HC co-electroporated with shRNA and a membrane-bound Egfp (Egfp(m)) are indicated by arrowheads. A less efficient shRNA (336) results in less obvious protein knock-down. (C) YFP:Par-3 electroporated in HCs is polarized laterally at the apical surface (arrow; lateral to the bundle in red) and at the apical junctions (arrowhead; lateral subregion of ZO-1 apical junctions in blue). (D) aPKC lateral exclusion during HC differentiation matches the bare zone region devoid of pERM-positive microvilli (arrowheads). Note that in the same cochlea, the apical surface of less differentiated IHCs (left panels) is entirely positive for both aPKC and pERM. (E) Pull-down of recombinant murine MBP-mInsc by GST-Par-3. Controls verify that GST does not bind MBP-mInsc and that MBP is not pulled down by GST-Par-3. Scale bars: 2µm.
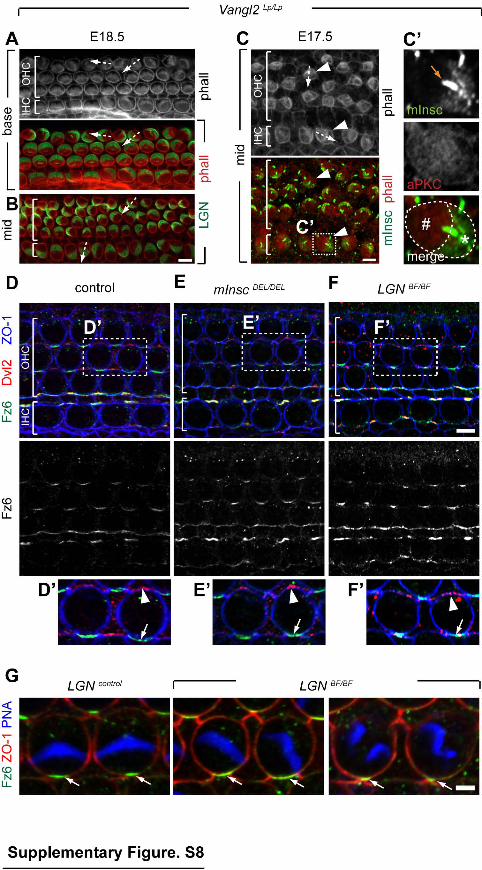
Supplementary Figure 8 (related to Figure 8). Apical surface polarity proteins and core PCP proteins are independent for their medio-lateral enrichment. (A-B) E18.5 Vangl2Lp organ of Corti at base (A) or middle (B) positions in the cochlea immunostained for LGN. The misorientation of two HCs is represented by the direction of the associated arrows. Note that LGN is localized normally with respect to cell intrinsic polarity, effectively acting as a marker for HC orientation in the field. (C) E17.5 Vangl2Lp organ of Corti at mid cochlea position co-immunostained for mInsc and aPKC. The misorientation of two HCs (arrowheads) is represented by the direction of the associated arrows in the top pannel. Panels on the right (C') are magnified and alternate channel views of the boxed IHC. At cell-intrinsic level, mInsc and aPKC occupy normal complementary positions in the bare zone (asterisk) and the complementary domain (# sign), respectively. Like for LGN, their polarity in the tissue is thus a marker of HC orientation. mInsc signal in the kinocilium (orange arrow) is unspecific (see Fig. S2D). (D-F) Distribution of core PCP proteins at the apical junctions in the indicated genotypes at P0. Asymmetric enrichment of Dvl2 (arrowheads) and Fz6 (arrows) is unchanged in the mInscDEL (E) and LBFBF (F)
organ of Corti. (G) Close-up views of LGNBF HCs with misoriented bundle or multiple sub-bundles. Fz6 medial enrichment is unchanged (arrows). To visualize

simultaneously Fz6/ZO-1 at apical junctions and the PNA-stained bundle above the apical surface, two images at different Z positions were merged. Scale bars: 5µm (A- F), 2µm (G).
SUPPLEMENTARY EXPERIMENTAL PROCEDURES
Generation of knockout and transgenic mice
To generate mInscFlox ES cells, three successive electroporations were used. First, a PGK-Neo selection cassette flanked by loxP sites was inserted in the small intron between exon 1b and exon 2 (exon labeling as in (Izaki et al., 2006) in humans; see Fig. S2A). Second, a plasmid expressing Cre was introduced to delete the PGK-Neo selection, leaving only a single loxP site behind. Third, a loxP-ires-TAU:Egfp; FRT-PGK-Neo-FRT cassette was inserted immediately after the mInsc stop codon in the 3'UTR region of exon 13 (TAU: microtubule-associated protein TAU). For each step, Southern blots were made to verify proper homologous recombination using external probes on each side of the targeting construct, or verify proper PGK-Neo deletion. Further details about the strategy are available on request. Following blastocyst injection, chimera generation and germline transmission, mInscFlox mice were obtained. The 3' PGK-Neo selection was deleted in vivo in a cross with the R26-FLP line, and the 82kb genomic deletion removing all coding sequences for the mInsc short isoform (mInscDEL) was obtained in a cross with the CMV-Cre line. A Southern blot using mInsc cDNA as a probe template allowed to directly confirm the deletion in mInscDEL mouse tail DNA (Fig. S2B-C). mInscDEL mice were produced in a mixed 129/sv:C57/B6 background, and subsequently backcrossed for 6 generations onto C57/B6 before analysis.
To generate LGNBF mice, ES cell clones (Gpsm2tm1a(EUCOMM)Wtsi) were obtained from the European Conditional Mouse Mutagenesis consortium (Eucomm). In this cell line, a splice acceptor (SA); beta-geo reporter is inserted before a floxed LGN exon 5 (Fig. S2E). The reporter creates a N-terminal LGN truncation after the second tetratricopeptide repeat. Proper homologous recombination in ES cells was verified by Southern blot using a 5' external probe corresponding to LGN exon 2 and a 3' external probe corresponding to LGN exons 9-10 (Fig. S2F). Clone E12 underwent germline transmission to produce the LGNBF line. LGNBF mice were directly produced in the C57/B6 background. Mice carrying a deletion of exon 5 were subsequently produced with or without the beta-geo reporter, and exhibited the same HC defects as LGNBF.
To generate Atoh1-PTXa transgenic fetuses, the catalytic subunit of the Pertussis toxin (PTXa) was cloned in a Atoh1 3' enhancer (Helms et al., 2000)/beta-globin expression vector, followed by an ires-mCherry reporter. The linearized plasmid was used for pronuclear injection of fertilized oocytes, and litters sacrified at E18.5. mCherry fluorescence could only be detected in a subset of HCs in transgenic fetuses, denoting partial transgene expression in about half the HCs only. Since mCherry signal was weak, down-regulation of endogenous LGN, as consistently observed in cochlear explants (Fig. S6A), was used to identify PTXa-expressing HCs in the transgenic organ of Corti. HCs with normal LGN expression in the same field were used as internal controls.
Cochlea electroporation and organotypic culture
Cochleas were collected at E14.5 and cultured for 6 days following electroporation. Established protocols (Driver and Kelley, 2010; Montcouquiol et al., 2008) were adapted, introducing two modifications. 1) DNA was flushed into the cochlea duct of isolated, intact temporal bones using a capillary/plunger system, and pulses were applied to the whole temporal bone with titanium wire electrodes (27V, 30ms, 6 pulses at 500ms intervals). 2) After removing the surrounding condensed mesenchyme, the whole cochlea was cultured in a drop of gel matrix (Matrigel, BD Biosciences) in standard cell-culture dishes. The Atoh1/beta-globin vector described above was used to limit protein expression to HCs and facilitate analysis. For PTXa analysis, cochleas were co-electroporated with Atoh1/beta-globin-Egfp and either Atoh1/beta-globin-PTXa-ires-mCherry or Atoh1/beta-globin-ires-mCherry as a control. ShRNAs against Gαi2, Gαi3 and aPKCζ were cloned into the pSiren expression vector (Clontech), and co-electroporated with Atoh1/beta-globin-Egfp. ShRNAs target a 19pb region and are labeled by the position of the first homologous base pair in the corresponding cDNA. In Fig.1, the mInsc:Egfp fusion corresponds to the long isoform (see Fig. S2A), but similar enrichment pattern was observed with a fusion involving the short isoform.
Immunostainings
Cochleas were isolated from the temporal bone and the sensory epithelium exposed. After 4% PFA fixation at 4°C for 1 hour to overnight, samples were equilibrated in 20% sucrose and embedded in 1:1 20% sucrose:OCT (Tissue-Tek) for sectioning, or permeabilized with 0.5% Triton X-100 and blocked with 10% goat serum or 1% BSA for whole-mount immunostainings. Whole-mount primary and secondary antibody incubations were done overnight at 4°C in PBS, and samples were flat-mounted in Mowiol. To visualize apical surface expression of Par-3 and Gαi in HCs, samples were fixed, permeabilized, then incubated in urea 0.8M for 1 hour at 50°C and 30 minutes at 65°C before blocking and antibody incubations. For Fz6 and Dvl2 antibodies, inner ears were fixed 1 hour in TCA on ice before sensory epithelium isolation and staining. Alternate mInsc antibodies raised against the CKQRVDTPYTRDQIV peptide or described in (Zigman et al., 2005) detect both the short and long mInsc isoforms, and gave an identical localization pattern at the bare zone as the long isoform-specific antibody used for the figures. These alternate mInsc antibodies did not however label the kinocilium, providing additional evidence that mInsc is not enriched there (see Fig. S2D). Another evidence is the absence of the mInsc:Egfp fusion in the kinocilium (Fig.1G). F-actin was visualized using rhodamin phalloidin (Invitrogen) or CF405M phalloidin (Biotium). Alternatively, peanut agglutinin (PNA) coupled to Alexa Fluor 647 was used to detect the stereocilia bundle (Invitrogen). Images were acquired using Leica DM6000 epifluorescent or Zeiss LSM710 confocal micoscopes.
Scanning electron microscopy
P0 temporal bones were fixed overnight in 4% paraformaldehyde: 2.5% glutaraldehyde in 0.1M Na-cacodylate buffer at 4°C. The sensory epithelium was then isolated and dehydrated through a series of ethanol solutions. After critical point drying, samples were mounted and coated with gold/palladium, and examined on a Hitachi S-4700 microscope at 5 kV.
Co-immunoprecipitation and GST pull-down
For co-immunoprecipitations, Gαi2:Egfp and myc:LGN were co-transfected with or without PTXa in HEK293 cells using Lipofectamine (Invitrogen). After 24 hours, protein extracts were prepared and incubated with the Egfp antibody bound to Dynabeads (Invitrogen). Following precipitation and washings, co-immunoprecipitated myc:LGN was detected on Western blots with anti-myc antibody (9E10, SCBT). For cell-free pull-down assays, mouse mInsc (short isoform) and mouse Par-3 (100kDa isoform) were cloned in pMAL-C2X and pGex-4T vectors, respectively. Proteins were produced in the E. coli BL21 strain, purified and incubated with glutathione agarose beads. Following precipitation and washings, proteins were detected on Western blots using anti-MBP and anti-GST antibodies (SCBT).
HC sorting for RT-PCR
mInscFlox/+ sensory epithelia were dissected out of the cochlea, pooled and dissociated with papain (Worthington). mInsc-positive cells expressing the TAU:Egfp-reporter (Fig. S2A) were isolated using a Beckman Coulter MoFlo cell sorter. As expected from Egfp immunostainings (Fig. S1F-G), HCs formed a strongly fluorescent population (EgfpHigh), easily isolated from a more weakly fluorescent population (EgfpLow) associated to ganglion cell axons. Using this method, about 99% of the sorted cells were HCs, as indicated by asymmetric F-actin-positive cuticular plate/stereocilia bundle in plated cells. Total RNA was extracted using RNeasy micro kit (Qiagen), and cDNA prepared using M-MLV reverse transcriptase (Invitrogen).
Quantification of apical surface, kinocilium/basal body position and HC planar orientation
Images of the organ of Corti were analyzed with the Image J software (NIH). Using phalloidin or ZO-1 to visualize HC junctions, the AS was measured either directly (in vivo), or expressed as a ratio of the mean AS of 3 neighboring, un-electroporated HCs (in vitro). For Atoh1-PTXa HCs in vivo, the AS was expressed as the ratio between the mean of affected versus unaffected cells in the same field. To measure kinocilium/basal body position at the AS, an ellipse was fitted to HC junctions, and a vector was drawn from the ellipse center to the base of the acetylated tubulin-labeled kinocilium, or the pericentrin- or gamma tubulin-labeled basal body. When they could be resolved and had different positions, the most medial of the two centrioles was considered the basal body (Jones et al., 2008). Vector angles were then measured in
a reference system where 0° is lateral and ±180° medial (Fig. 2M), using the row of inner pillar cells as the reference axis in the tissue. Protein crescent orientation was measured the same way, using the crescent center as the vector target (Fig. 2N-O). Kinocilium/basal body eccentricity was expressed as a ratio of the HC diameter at the angle considered, with 0.5 being central and 1 the position of the HC boundary along the vector line (Fig. 2G and Fig. 5I). Kinocilium positions were graphed using cumulative polar plots assuming a perfectly round HC apex, with 0 being the HC center and 1 the radius to the HC boundary (Fig. 3G-H. Fig. 5D). To represent HC orientation, angles of vectors to the kinocilium were shown in a frequency distribution with angle bins of 20° from -170° to +170° (Fig. 5B-C and Fig. S6E).
SUPPLEMENTARY REFERENCES
Driver, E.C., and Kelley, M.W. (2010). Transfection of mouse cochlear explants by electroporation. Curr Protoc Neurosci Chapter 4, Unit 4 34 31-10. Helms, A.W., Abney, A.L., Ben-Arie, N., Zoghbi, H.Y., and Johnson, J.E. (2000). Autoregulation and multiple enhancers control Math1 expression in the developing nervous system. Development 127, 1185-1196. Izaki, T., Kamakura, S., Kohjima, M., and Sumimoto, H. (2006). Two forms of human Inscuteable-related protein that links Par3 to the Pins homologues LGN and AGS3. Biochem Biophys Res Commun 341, 1001-1006. Jones, C., Roper, V.C., Foucher, I., Qian, D., Banizs, B., Petit, C., Yoder, B.K., and Chen, P. (2008). Ciliary proteins link basal body polarization to planar cell polarity regulation. Nat Genet 40, 69-77. Montcouquiol, M., Jones, J.M., and Sans, N. (2008). Detection of planar polarity proteins in mammalian cochlea. Methods Mol Biol 468, 207-219. Zigman, M., Cayouette, M., Charalambous, C., Schleiffer, A., Hoeller, O., Dunican, D., McCudden, C.R., Firnberg, N., Barres, B.A., Siderovski, D.P., et al. (2005). Mammalian inscuteable regulates spindle orientation and cell fate in the developing retina. Neuron 48, 539-545.