Embed Size (px)
Citation preview
1
Neuron, volume 74
Supplemental Information
Motorneurons Require Cysteine String Protein-
to Maintain the Readily Releasable Vesicular Pool
and Synaptic Vesicle Recycling
José Luis Rozas, Leonardo Gómez-Sánchez, Josif Mircheski, Pedro Linares-Clemente, José Luis Nieto-González, M. Eugenio Vázquez, Rafael Luján, and Rafael Fernández-Chacón
INVENTORY OF SUPPLEMENTAL MATERIALS Figure S1 (Related to Fig. 1). Similar MEPP amplitude and facilitation in CSP WT and KO synapses. Figure S2 (Related to Fig. 2) SNAP-25 reduction at early postnatal ages at the NMJ of CSP-α KO mice. Table S1 (Related to Fig. 4). Characteristics of spH fluorescence responses at the terminals of WT and CSP-α KO mice at different postnatal ages and at different stimulation frequencies. Figure S3 (Related to Fig. 4). Slower kinetics of endocytosis in CSP-α KO NMJs with similar exocytic load to WT. Figure S4 (Related to Fig.6). Impairment of dynamin-dependent endocytosis at CSP-α KO synapses during the stimulation at different frequencies. Figure S5 (Related to Fig.7). NMJ ultrastructure and expression of dynamin 1 at the NMJ of WT and CSP-α KO mice. Table S2 (Related to Fig. 2 and Fig. 7). Antibodies used for immunohistochemisty and for Western blots.
Supplemental Methods
2
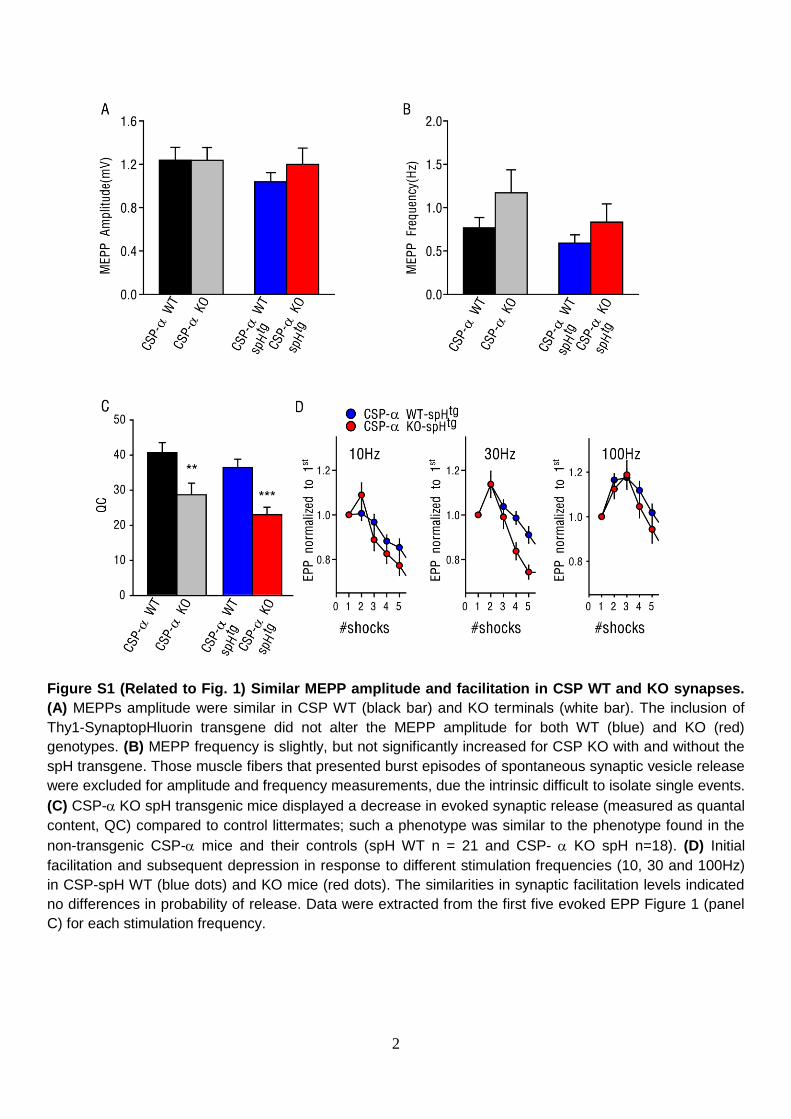
Figure S1 (Related to Fig. 1) Similar MEPP amplitude and facilitation in CSP WT and KO synapses.
(A) MEPPs amplitude were similar in CSP WT (black bar) and KO terminals (white bar). The inclusion of
Thy1-SynaptopHluorin transgene did not alter the MEPP amplitude for both WT (blue) and KO (red)
genotypes. (B) MEPP frequency is slightly, but not significantly increased for CSP KO with and without the
spH transgene. Those muscle fibers that presented burst episodes of spontaneous synaptic vesicle release
were excluded for amplitude and frequency measurements, due the intrinsic difficult to isolate single events.
(C) CSP-KO spH transgenic mice displayed a decrease in evoked synaptic release (measured as quantal
content, QC) compared to control littermates; such a phenotype was similar to the phenotype found in the
non-transgenic CSP- mice and their controls (spH WT n = 21 and CSP- KO spH n=18). (D) Initial
facilitation and subsequent depression in response to different stimulation frequencies (10, 30 and 100Hz)
in CSP-spH WT (blue dots) and KO mice (red dots). The similarities in synaptic facilitation levels indicated
no differences in probability of release. Data were extracted from the first five evoked EPP Figure 1 (panel
C) for each stimulation frequency.
3
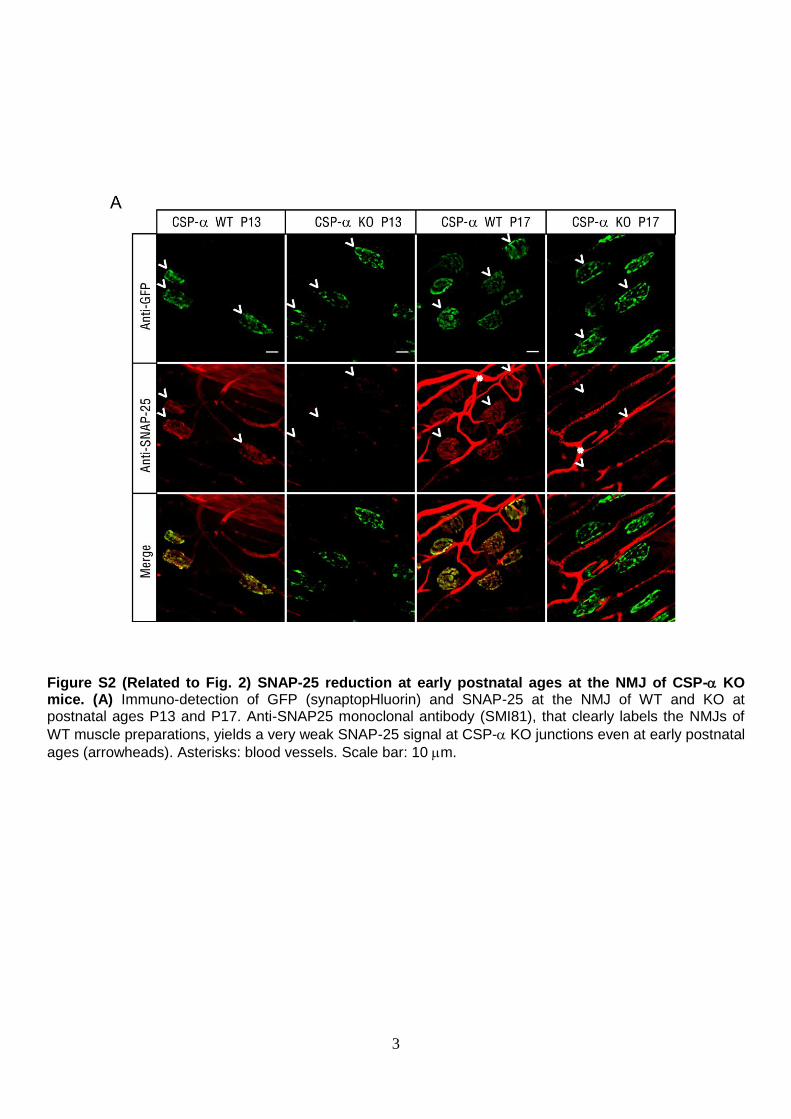
Figure S2 (Related to Fig. 2) SNAP-25 reduction at early postnatal ages at the NMJ of CSP- KO mice. (A) Immuno-detection of GFP (synaptopHluorin) and SNAP-25 at the NMJ of WT and KO at postnatal ages P13 and P17. Anti-SNAP25 monoclonal antibody (SMI81), that clearly labels the NMJs of
WT muscle preparations, yields a very weak SNAP-25 signal at CSP- KO junctions even at early postnatal
ages (arrowheads). Asterisks: blood vessels. Scale bar: 10 m.
4
F Tau (s)
Stim. Freq. Age WT KO p WT KO p
10Hz
P1
0-1
5
5.2 ± 0.5 6.7 ± 0.5 12.1 ± 2.8 9.9 ± 1.8
30Hz 16.2 ± 1.3 14.9 ± 1.4 14.5 ± 1.6 10.6 ± 1.6
50Hz 23.9 ± 1.9 19.3 ± 1.6 15.5 ± 1.9 15.0 ± 1.7
100Hz 38.8 ± 2.5 30.9 ± 2.8 0.043 26.8 ± 2.3 20.3 ± 2.1 0.044
10Hz
P1
6-2
0
7.1 ± 1.0 4.5 ± 0.7 13.5 ± 1.8 12.2 ± 1.9
30Hz 26.7 ± 3.5 17.7 ± 1.9 0.05 16.4 ± 1.4 12.2 ± 1.8
50Hz 34.4 ± 3.9 23.7 ± 2.3 0.035 21.8 ± 2.6 15.0 ± 1.5 0.042
100Hz 47.8 ± 0.5 34.9 ± 3.1 0.048 29.2 ± 3.6 19.1 ± 2.9 0.043
10Hz
P2
1-2
5
7.0 ± 3.5 2.8 ± 0.8 0.003 15.4 ± 1.1 11.0 ± 2.3
30Hz 25.7 ± 3.5 10.2 ± 1.2 <0.001 15.4 ± 1.4 9.8 ± 1.9 0.023
50Hz 36.5 ± 4.0 15.2 ± 1.9 <0.001 19.9 ± 2.1 14.2 ± 1.7 0.027
100Hz 56.6 ± 7.6 21.5 ± 2.5 <0.001 31.1 ± 4.4 20.0 ± 2.6 0.017
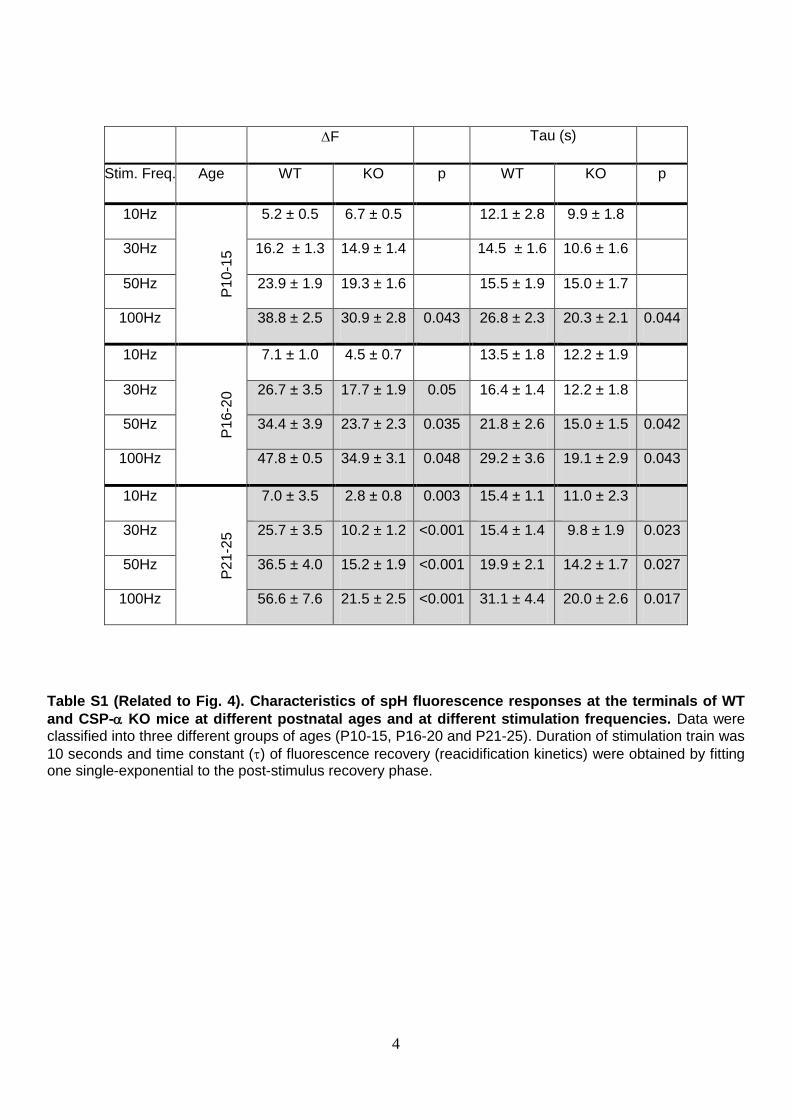
Table S1 (Related to Fig. 4). Characteristics of spH fluorescence responses at the terminals of WT
and CSP- KO mice at different postnatal ages and at different stimulation frequencies. Data were classified into three different groups of ages (P10-15, P16-20 and P21-25). Duration of stimulation train was
10 seconds and time constant () of fluorescence recovery (reacidification kinetics) were obtained by fitting one single-exponential to the post-stimulus recovery phase.
5
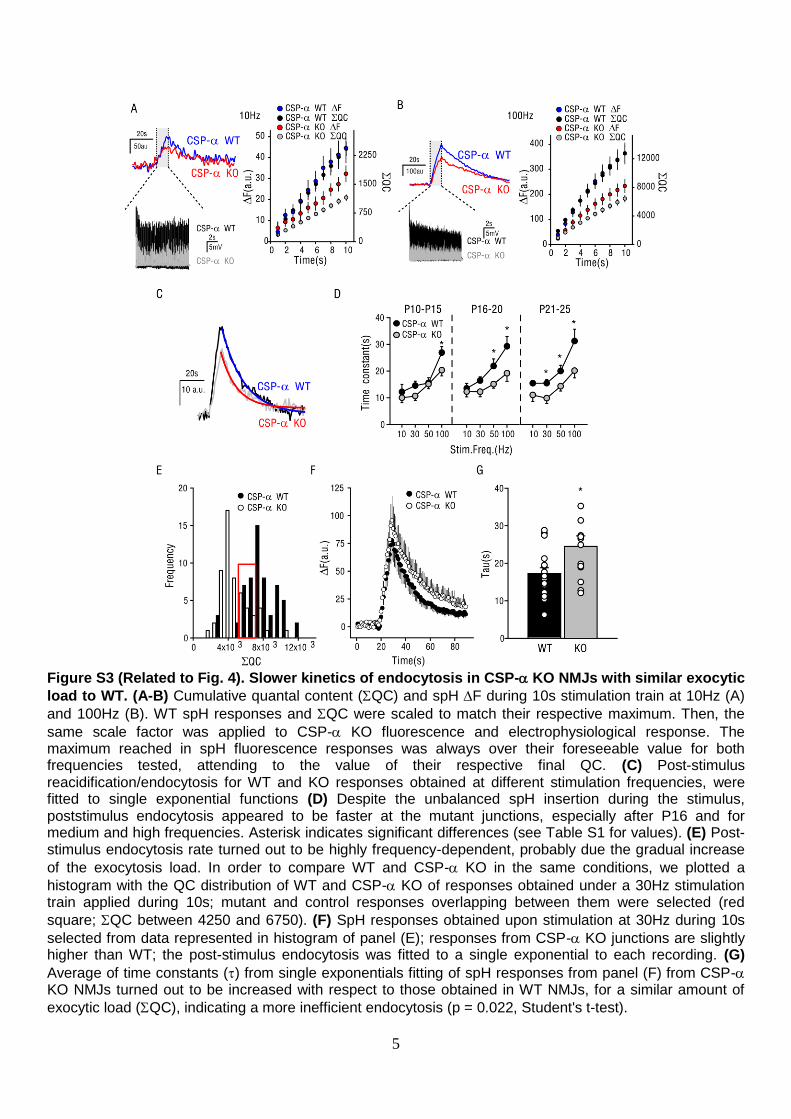
Figure S3 (Related to Fig. 4). Slower kinetics of endocytosis in CSP- KO NMJs with similar exocytic
load to WT. (A-B) Cumulative quantal content (QC) and spH F during 10s stimulation train at 10Hz (A)
and 100Hz (B). WT spH responses and QC were scaled to match their respective maximum. Then, the
same scale factor was applied to CSP- KO fluorescence and electrophysiological response. The maximum reached in spH fluorescence responses was always over their foreseeable value for both frequencies tested, attending to the value of their respective final QC. (C) Post-stimulus reacidification/endocytosis for WT and KO responses obtained at different stimulation frequencies, were fitted to single exponential functions (D) Despite the unbalanced spH insertion during the stimulus, poststimulus endocytosis appeared to be faster at the mutant junctions, especially after P16 and for medium and high frequencies. Asterisk indicates significant differences (see Table S1 for values). (E) Post-stimulus endocytosis rate turned out to be highly frequency-dependent, probably due the gradual increase
of the exocytosis load. In order to compare WT and CSP- KO in the same conditions, we plotted a
histogram with the QC distribution of WT and CSP- KO of responses obtained under a 30Hz stimulation train applied during 10s; mutant and control responses overlapping between them were selected (red
square; QC between 4250 and 6750). (F) SpH responses obtained upon stimulation at 30Hz during 10s
selected from data represented in histogram of panel (E); responses from CSP- KO junctions are slightly higher than WT; the post-stimulus endocytosis was fitted to a single exponential to each recording. (G)
Average of time constants () from single exponentials fitting of spH responses from panel (F) from CSP- KO NMJs turned out to be increased with respect to those obtained in WT NMJs, for a similar amount of
exocytic load (QC), indicating a more inefficient endocytosis (p = 0.022, Student's t-test).
6
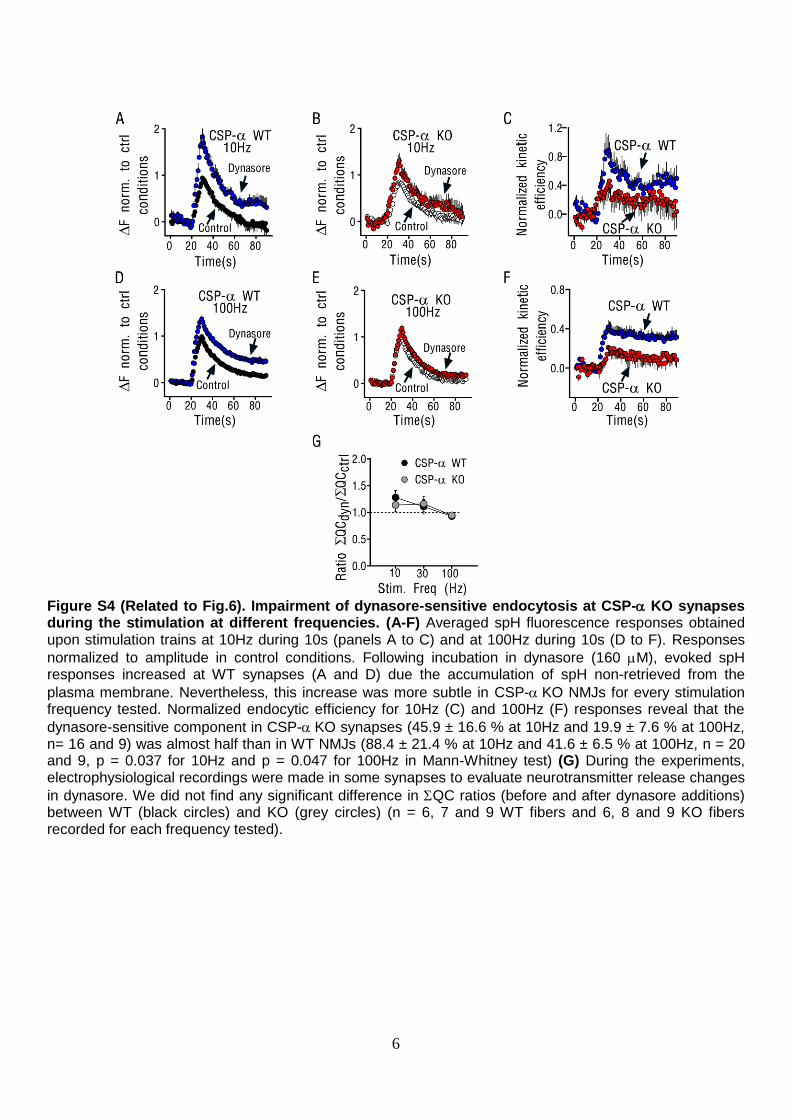
Figure S4 (Related to Fig.6). Impairment of dynasore-sensitive endocytosis at CSP- KO synapses during the stimulation at different frequencies. (A-F) Averaged spH fluorescence responses obtained upon stimulation trains at 10Hz during 10s (panels A to C) and at 100Hz during 10s (D to F). Responses
normalized to amplitude in control conditions. Following incubation in dynasore (160 M), evoked spH responses increased at WT synapses (A and D) due the accumulation of spH non-retrieved from the
plasma membrane. Nevertheless, this increase was more subtle in CSP-KO NMJs for every stimulation frequency tested. Normalized endocytic efficiency for 10Hz (C) and 100Hz (F) responses reveal that the
dynasore-sensitive component in CSP-KO synapses (45.9 ± 16.6 % at 10Hz and 19.9 ± 7.6 % at 100Hz, n= 16 and 9) was almost half than in WT NMJs (88.4 ± 21.4 % at 10Hz and 41.6 ± 6.5 % at 100Hz, n = 20 and 9, p = 0.037 for 10Hz and p = 0.047 for 100Hz in Mann-Whitney test) (G) During the experiments, electrophysiological recordings were made in some synapses to evaluate neurotransmitter release changes
in dynasore. We did not find any significant difference in QC ratios (before and after dynasore additions) between WT (black circles) and KO (grey circles) (n = 6, 7 and 9 WT fibers and 6, 8 and 9 KO fibers recorded for each frequency tested).
7
8
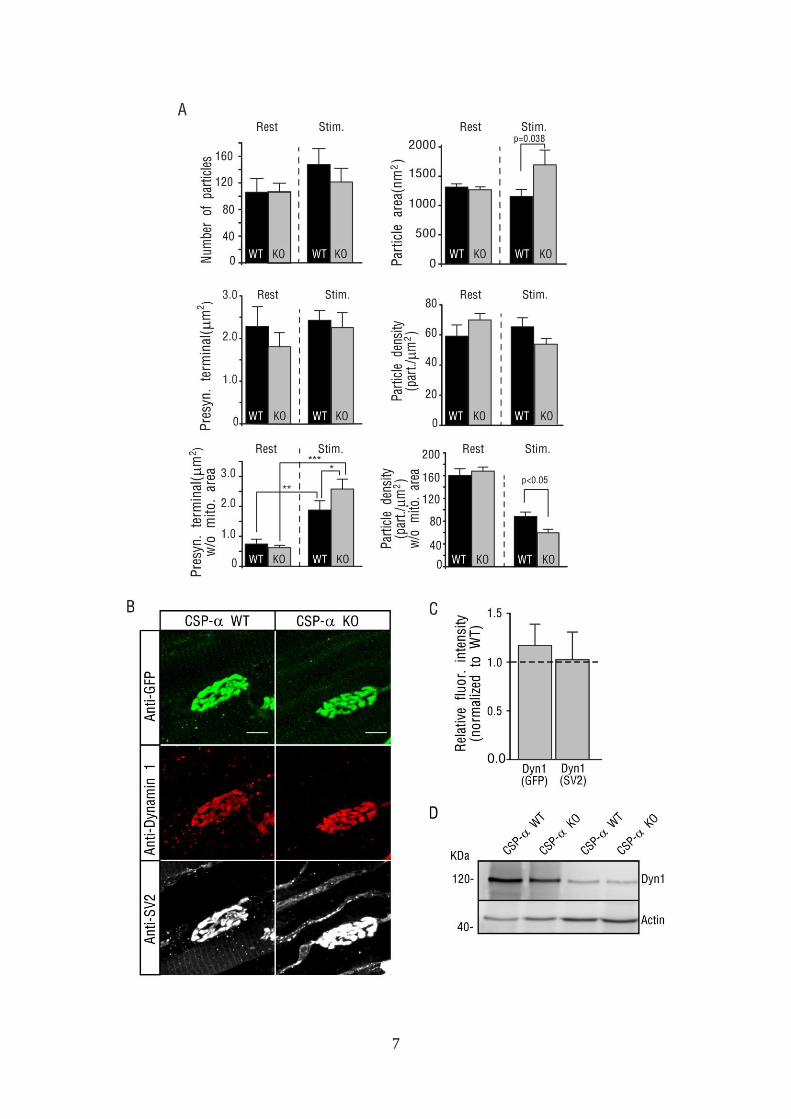
Figure S5 (Related to Fig.7). Ultrastructure and expression of dynamin 1 at the NMJ of WT and CSP-alpha KO mice. (A) Quantification of presynaptic terminals and particles parameters in resting (Rest.) and stimulated (Stim.) conditions. Particles are putative vesicles. Number of particles in a presynaptic terminal region of interest ROI (upper left graph), particle area (upper right graph), area of the presynaptic terminal ROI (middle left graph), density of particles within the presynaptic terminal ROI (middle right graph), area of the presynaptic terminal ROI after removal of area occupied by mitochondria and axon filaments (lower left graph, w/o mito. area,) and density of particles within the presynaptic terminal ROI after the removal of area occupied by mitochondria and axon filaments (lower right graph, w/o mito. area,). The area of presynaptic terminal (after removing the mitochondrial and filament area) turned out to be bigger upon stimulation in WT and CSP-alpha KO compared to resting conditions and the density of particles was significantly reduced in the mutants after stimulation, suggesting a delayed restoration of vesicles after stimulation in the mutants. * p<0.05; **p< 0.03; *** p<0.005 (B) Maximum projection of confocal images from WT and CSP-alpha KO NMJs labeled with anti-GFP (green), dynamin 1 (red) and SV2 (white) antibodies. Scale bar 10 μm. (C) Fluorescence intensity of immuno-detected dynamin 1 normalized to fluorescently labeled GFP or SV2 and normalized to WT. No significant difference was found for both ratios. To improve the penetration of the antibody against dynamin 1, samples, prior to being fixed, were treated during 1-2 minutes at 37ºC with 1mg/ml of collagenase A (Roche Diagnostic, GmbH). (D) Western blot analysis of dynamin 1 protein levels from two different pools of LAL muscle extracts does not detect changes between CSP-alpha KO compared to WT controls.
9
Protein Antibodies Method [Ab] References of antibodies
Synaptotagmin 2 znp-1 (mAb) IF 1/500
Zebrafish International Resource Center, which is supported
by NIH–National Center for Research Resources Grant P40
RR012546
SV2 anti-SV2 (mAb) IF 1/500
Developed by Dr. Buckley and obtained from the
Developmental Studies Hybridoma Bank developed under the
auspices of the NICHD and maintained by The University of
Iowa
Synaptobrevin 1 Syb 1 (pAb) IF 1/500 Synaptic systems Cat. No. 104 002
CSP-alpha CSP (pAb) WB 1/1000
Synaptic systems Cat. No. 154 003 IF 1/500
SNAP-25 I733 (pAb)
WB 1/50 Generous gift from Dr. Thomas Südhof (McMahon and
Sudhof, 1995) IF
1/500
SMI81 1/500 COVANCE Cat. No. SMI-81R
Hsc70 3C5 (mAb) WB 1/1500
Synaptic systems Cat. No. 149 011 IF 1/500
GFP GFP-1020
(pAb)
WB 1/1000 Aves Lab Cat. No. GFP-1020
IF 1/500
Synaptobrevin 2 69.1 (mAb) WB 1/1000 Synaptic systems Cat. No. 104 211
Dynamin 1,2,3 Dyn 1/2/3
(pAb) WB 1/500 Synaptic systems Cat. No. 115 002
Dynamin 1,2 Clone 41
(mAb) WB 1/500 BD Bioscience Cat. No. 610245
Dynamin 1 Clone EP801Y IF 1/200
Epitomics Cat. No. 1851-1 WB 1/1000
Intersectin-L, S P229 (pAb) WB 1/1000 Generous gift from Dr. Thomas Südhof(Okamoto et al., 1999)
RME-8 antiRME-8 WB 1/1000 Generous gift from Dr. Peter McPherson (Girard et al., 2005)
Alpha-actin Anti-actin WB 1/1000 Sigma. Product number A2066
Munc-13 Anti-Munc-13 IF 1/500 Synaptic systems Cat. No. 126 102
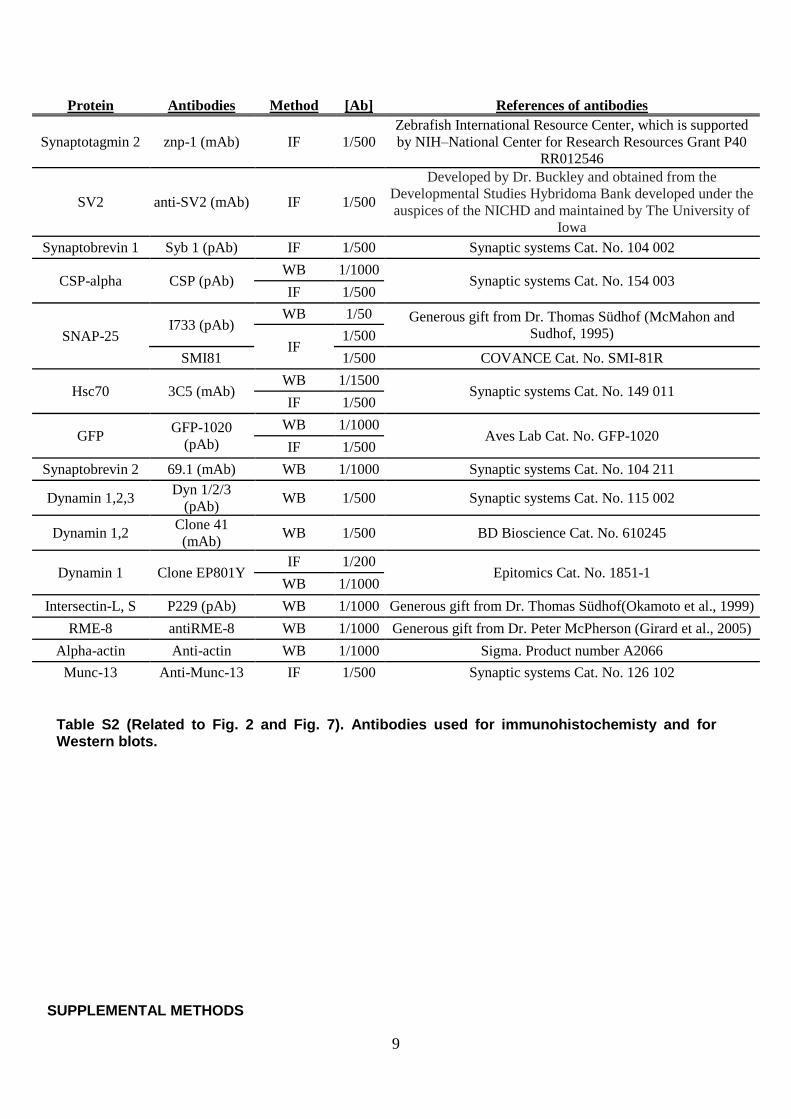
Table S2 (Related to Fig. 2 and Fig. 7). Antibodies used for immunohistochemisty and for Western blots.
SUPPLEMENTAL METHODS
10
Animals. Mouse genotyping was carried by PCR as previously described for the CSP- gene (Schmitz et al., 2006) and the spH transgene (Tabares et al., 2007). Male and female mice were used for experiments. Determination of mouse zygosity for spH transgene by real-time quantitative PCR. Genomic DNA was analyzed by real-time quantitative PCR using the SensiMix (dT)- For Sybr Green kit (Quantace, ref. QT6T3) and the MX3000P® Q-PCR System (Stratagene). Two pairs of oligonucleotides were designed to detect (1) the synaptopHluorin coding sequence (PLC-36: 5’- CCCGAAGGTTATGTACAGGAAA-3’ and PLC-37: 5’- TGTGTCCAAGAATGTTTCCATC-3’, amplicon size 154 bp) and to detect (2) the apoB sequence (apoB-fw: 5’- GGCTCCAGCATTCTAACAGC-3’ and apoB-rev: 5’-GCATTGTGCTCACCAGTCAT-3’, amplicon size 77 bp). The apoB gene was used as a normalizer of DNA
concentration. We used a modification of Ct method (Shitara et al., 2004) to determine the zygosity of
each DNA sample. For each sample, we obtained Ct value, calculated as the difference between CtapoB –
CtpHluorin. For each experiment, we selected the lowest value of Ct as a reference to calculate the Ct
value for the other DNA samples. Two sets of Ct values were obtained: one set grouped around 0 and
other set grouped around 1. Genomic DNA samples giving Ct values close to 0 defined hemizygous mice and samples with values those close to 1 defined homozygous mice. Imaging and electrophysiology. For NMJs identification, postsynaptic Ach-receptors were labelled with
bungarotoxin-tetramethyl-rodamine (Sigma) at 1 M (for imaging experiments) and at 30 nM (for imaging combined with electrophysiology) (Santafe et al., 2000). The perfusion extracellular solution contained (in mM): NaCl 130, KCl 5, MgSO4 1, Na2HPO4 0.5, NaHCO3 20, CaCl2 2, Glucose 15; pH 7.4, continuous bubbled with 95% O2/ 5% CO2. The junctions with high level of basal fluorescence were discarded. Exposure times were either 300 ms or 100 ms (only results displayed in Fig. 4). Emission fluorescence was collected through a 500-545nm band-pass filter. Images were acquired at 1Hz 2x2 binning by an Andor Ixon 885 (Andor Technologies) CCD camera. Image acquisition and analysis was performed with Till Vision Software. Postsynaptic potentials were recorded with a EPC10 patch-clamp amplifier (HEKA, Darmstadt, Germany) in current clamp mode, filtered (Bessel, 2.9 KHz) and acquired at sampling rate of 10 KHz using Pulse software (HEKA, Darmstadt, Germany). Off-line analysis was carried out with Axograph X for Windows. Normalization and correction for non-linear summation of EPPs and MEPPs, and quantal content calculation were performed as previously described (Rozas et al., 2011). Image analysis. Images were background substracted (from ROIs close to recorded terminals) and then corrected for photobleaching. In order to reduce noise and potential artifacts due to uncontrolled movements of the preparation, we generated, for every NMJ, a single image by averaging several (3-7) partial ROIs (Granseth et al., 2006). This approach was valuable to measure a fluorescence response close to the whole synaptic response of the terminal. Then, such a recording should be suitable to compare it with the simultaneous evoked postsynaptic potentials at the same junction. The amplitude of fluorescence
responses was computed as the absolute F values. F/F differences between WT and KO calculated for exemplary recordings (for example recordings in Fig. 4 and data not shown) did not differ significantly from
absolute F measurements. In addition, absolute F measurements were advantageous for experimental conditions with typically high increases of basal fluorescence (for example dynasore and folimycin treatments). Reacidification phase was fitted to single-exponential. After strong stimulation, or after prolonged trains, some responses were well-fitted to double exponentials, but in order to preserve the data homogeneity and to compare time constants, we preferred to maintain the single exponential fitting in spite of some precision loss. Immunohistochemistry. Preparations were visualized using a 60x 1.42 NA oil immersion objective mounted on an Olympus Fluoview confocal microscope. For quantification of fluorescence intensity, images
from WT and CSP- KO junctions were collected using the same conditions of excitation, resolution, zoom and step size (1 micron between each image). Using ImageJ, each slice from the z-stack was summed to
11
each other to obtain a unique image, and the reference marker (GFP detected from synaptopHluorin) was used to create a mask around the NMJs. The average pixel intensity obtained from each synapse for the desired marker was divided by the GFP average intensity to yield a normalized value. Other image treatments or filtering was avoided. Protein biochemistry. To increase protein amount, muscles from 3-4 mice were pooled. Primary
antibodies used are described in Table S2. For immunoprecipitation, muscles from WT and CSP- KO animals were homogenated in lysis solution(Rozas et al., 2011). After centrifuging for 5 min at 10,000×g, supernatants were subjected to SNAP-25 immunoprecipitation (3 μg of SNAP-25, I733 polyclonal antibody, per tube) using Dynabeads Protein G (Invitrogen). Immunoprecipitated proteins were analyzed by SDS-PAGE and immunoblotting using SNAP-25 monoclonal antibody (Cl71.1, Synaptic System; 1/2000). Electron microscopy. Muscles in resting conditions or after stimulation (180s at 30Hz) were immediately immersion-fixed with 2.5% glutaraldehyde/1% PFA in PBS (pH 7.4) for 2.5-3h at 4ºC. The time necessary to remove the stimulated muscle from the stimulation chamber and put it in fixative was maximum one minute. The samples were then postfixed in osmium tetraoxide OsO4 (1% in H2O), blockstained in uranyl acetate (2% in H2O), dehydrated in graded series of acetone, embedded in Epon 12 (Ted Pella Inc.) resin and finally polymerized at 60ºC. Toluidine Blue stained semi-thin sections (500 nm) were used to identify the region of interest. Ultrathin sections (30-50 nm) were cut with a diamond knife (DiATOME) on a Leica EM UC7 ultramicrotome (Leica), collected on Formvar coated single slot grids, stained on drops of 2% uranyl acetate and Reynold’s lead citrate and seen under CM-10 (Philips) electron microscope. Digital images were taken with Veleta (Olympus) camera controlled by iTEM platform (Olympus SIS). Particles quantification in electron microscopy images. The image quantification was performed with iTEM software (Olympus SIS) in the following manner: if there were sufficient NMJs in the sections, random images (all at 34000x) containing sections of a terminal were selected. The ROI was hand-drawn around the terminal but at the same time excluding the area occupied by mitochondria and axon filaments. After that, a series of filters was applied to the image (Shading correction, DCE, Erosion (two times), Threshold and Separator). The threshold was set in a way that included pixels with value above certain level. At the same time, the threshold level excluded the pixels with low value (dark pixels) i.e. membranes. After the automatic detection of all particles, they were then filtered in regards to different parameters (shape, elongation, sphericity, etc.) in order to obtain a population of particles that are as close possibly to a vesicle (synaptic vesicle, lysosome, endosome or vacuole). Thin elongated membranous structures resembling cisterns of endoplasmic reticulum were not included into the particles population. In addition, every image was visually checked after the automated detection and filtering and the detected particles that were not vesicles were manually deleted; in the same time, the vesicles that were not automatically detected by the software were manually appended to the population. Some terminals extended over two or more images and the results of these images were summed up to represent only one section. The most convenient parameter for analysis was particles area. In this case, the area represents the internal area – lumen – of the vesicle, because the membranes were filtered out (set as borders) with the image threshold setting. Particle density was calculated as number of particles in ROI per ROI area. Dynasore synthesis. Dynasore was synthesized following reported procedures (Kucukguzel et al., 2003). In short, methyl-3-hydroxy-2-naphthanoate (2.02 g, 10 mmol) was dissolved in MeOH (30 mL) and hydrazine hydrate (99%, 4 mL, 77 mmol) was added. The resulting mixture was stirred under reflux for 2 h. The crude was added over cold water 100 mL, the precipitate was filtered, washed with ice-cold water, and recrystallized from MeOH to give the desired hydrazyde in 72% yield. The product was subjected to the next step without further purification. 3-hydroxy-2-naphthanoic acid hydrazide (1.66 g, 8.25 mmol) was dissolved in EtOH (50 mL), and 3,4-dihydroxybenzaldehyde (1.14 g, 8.2 mmol) was added. The reaction mixture was stirred under reflux for 2 h. The resulting precipitate was filtered, washed with cold water (10 mL) and hot EtOH (2 x 10 mL) to give the final product in high purity. Nuclear magnetic resonance and
12
electrospray ionization mass spectrometry analysis were consistent with published data for these compounds (Kucukguzel et al., 2003).
SUPPLEMENTAL REFERENCES Granseth, B., Odermatt, B., Royle, S.J., and Lagnado, L. (2006). Clathrin-mediated endocytosis is the dominant mechanism of vesicle retrieval at hippocampal synapses. Neuron 51, 773-786. Kucukguzel, S.G., Mazi, A., Sahin, F., Ozturk, S., and Stables, J. (2003). Synthesis and biological activities of diflunisal hydrazide-hydrazones. Eur J Med Chem 38, 1005-1013. Rozas, J.L., Gomez-Sanchez, L., Tomas-Zapico, C., Lucas, J.J., and Fernandez-Chacon, R. (2011). Increased neurotransmitter release at the neuromuscular junction in a mouse model of polyglutamine disease. J Neurosci 31, 1106-1113. Santafe, M.M., Urbano, F.J., Lanuza, M.A., and Uchitel, O.D. (2000). Multiple types of calcium channels mediate transmitter release during functional recovery of botulinum toxin type A-poisoned mouse motor nerve terminals. Neuroscience 95, 227-234. Schmitz, F., Tabares, L., Khimich, D., Strenzke, N., de la Villa-Polo, P., Castellano-Munoz, M., Bulankina, A., Moser, T., Fernandez-Chacon, R., and Sudhof, T.C. (2006). CSPalpha-deficiency causes massive and rapid photoreceptor degeneration. Proc Natl Acad Sci U S A 103, 2926-2931. Shitara, H., Sato, A., Hayashi, J., Mizushima, N., Yonekawa, H., and Taya, C. (2004). Simple method of zygosity identification in transgenic mice by real-time quantitative PCR. Transgenic Res 13, 191-194. Tabares, L., Ruiz, R., Linares-Clemente, P., Gaffield, M.A., Alvarez de Toledo, G., Fernandez-Chacon, R., and Betz, W.J. (2007). Monitoring synaptic function at the neuromuscular junction of a mouse expressing synaptopHluorin. J Neurosci 27, 5422-5430.


![A Cysteine-Rich Protein Kinase Associates with a ...A Cysteine-Rich Protein Kinase Associates with a Membrane Immune Complex and the Cysteine Residues Are Required for Cell Death1[OPEN]](https://img.pdfslide.net/doc/110x75/6010dcfa8c823031a411c4f6/a-cysteine-rich-protein-kinase-associates-with-a-a-cysteine-rich-protein-kinase.jpg)