Embed Size (px)
Citation preview
1
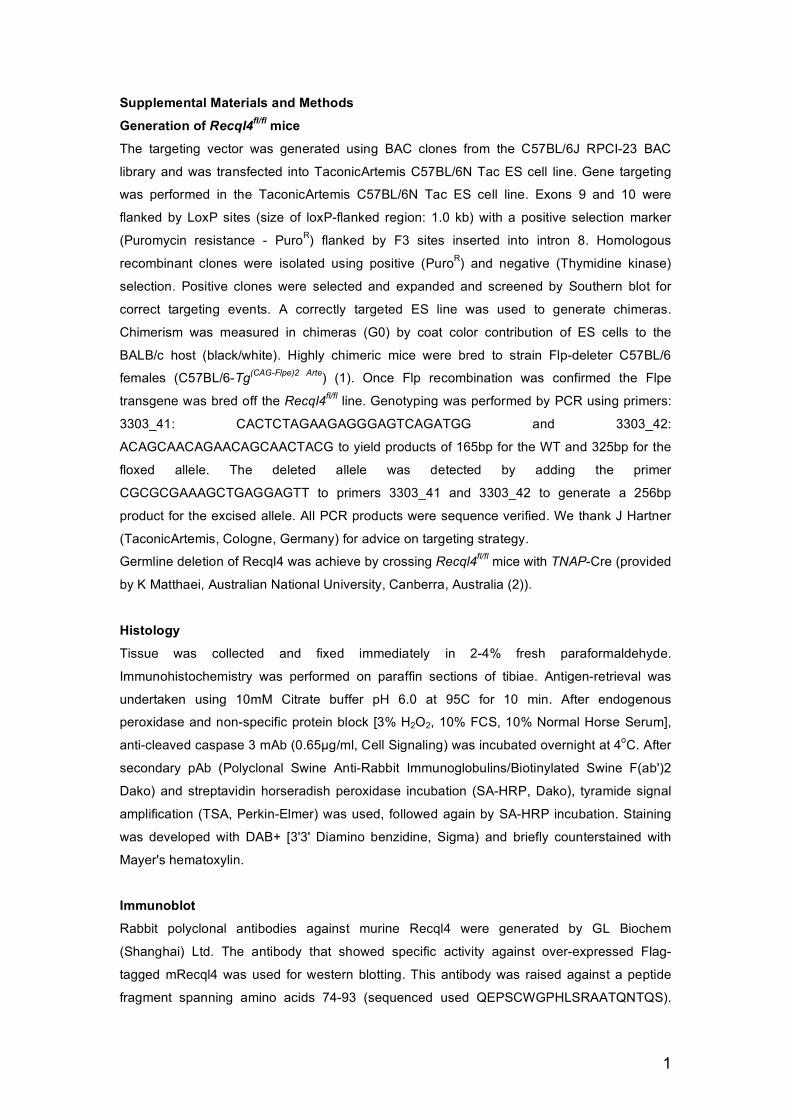
Supplemental Materials and Methods
Generation of Recql4fl/fl mice
The targeting vector was generated using BAC clones from the C57BL/6J RPCI-23 BAC
library and was transfected into TaconicArtemis C57BL/6N Tac ES cell line. Gene targeting
was performed in the TaconicArtemis C57BL/6N Tac ES cell line. Exons 9 and 10 were
flanked by LoxP sites (size of loxP-flanked region: 1.0 kb) with a positive selection marker
(Puromycin resistance - PuroR) flanked by F3 sites inserted into intron 8. Homologous
recombinant clones were isolated using positive (PuroR) and negative (Thymidine kinase)
selection. Positive clones were selected and expanded and screened by Southern blot for
correct targeting events. A correctly targeted ES line was used to generate chimeras.
Chimerism was measured in chimeras (G0) by coat color contribution of ES cells to the
BALB/c host (black/white). Highly chimeric mice were bred to strain Flp-deleter C57BL/6
females (C57BL/6-Tg(CAG-Flpe)2 Arte) (1). Once Flp recombination was confirmed the Flpe
transgene was bred off the Recql4fl/fl line. Genotyping was performed by PCR using primers:
3303_41: CACTCTAGAAGAGGGAGTCAGATGG and 3303_42:
ACAGCAACAGAACAGCAACTACG to yield products of 165bp for the WT and 325bp for the
floxed allele. The deleted allele was detected by adding the primer
CGCGCGAAAGCTGAGGAGTT to primers 3303_41 and 3303_42 to generate a 256bp
product for the excised allele. All PCR products were sequence verified. We thank J Hartner
(TaconicArtemis, Cologne, Germany) for advice on targeting strategy.
Germline deletion of Recql4 was achieve by crossing Recql4fl/fl mice with TNAP-Cre (provided
by K Matthaei, Australian National University, Canberra, Australia (2)).
Histology
Tissue was collected and fixed immediately in 2-4% fresh paraformaldehyde.
Immunohistochemistry was performed on paraffin sections of tibiae. Antigen-retrieval was
undertaken using 10mM Citrate buffer pH 6.0 at 95C for 10 min. After endogenous
peroxidase and non-specific protein block [3% H2O2, 10% FCS, 10% Normal Horse Serum],
anti-cleaved caspase 3 mAb (0.65µg/ml, Cell Signaling) was incubated overnight at 4oC. After
secondary pAb (Polyclonal Swine Anti-Rabbit Immunoglobulins/Biotinylated Swine F(ab')2
Dako) and streptavidin horseradish peroxidase incubation (SA-HRP, Dako), tyramide signal
amplification (TSA, Perkin-Elmer) was used, followed again by SA-HRP incubation. Staining
was developed with DAB+ [3'3' Diamino benzidine, Sigma) and briefly counterstained with
Mayer's hematoxylin.
Immunoblot
Rabbit polyclonal antibodies against murine Recql4 were generated by GL Biochem
(Shanghai) Ltd. The antibody that showed specific activity against over-expressed Flag-
tagged mRecql4 was used for western blotting. This antibody was raised against a peptide
fragment spanning amino acids 74-93 (sequenced used QEPSCWGPHLSRAATQNTQS).
2
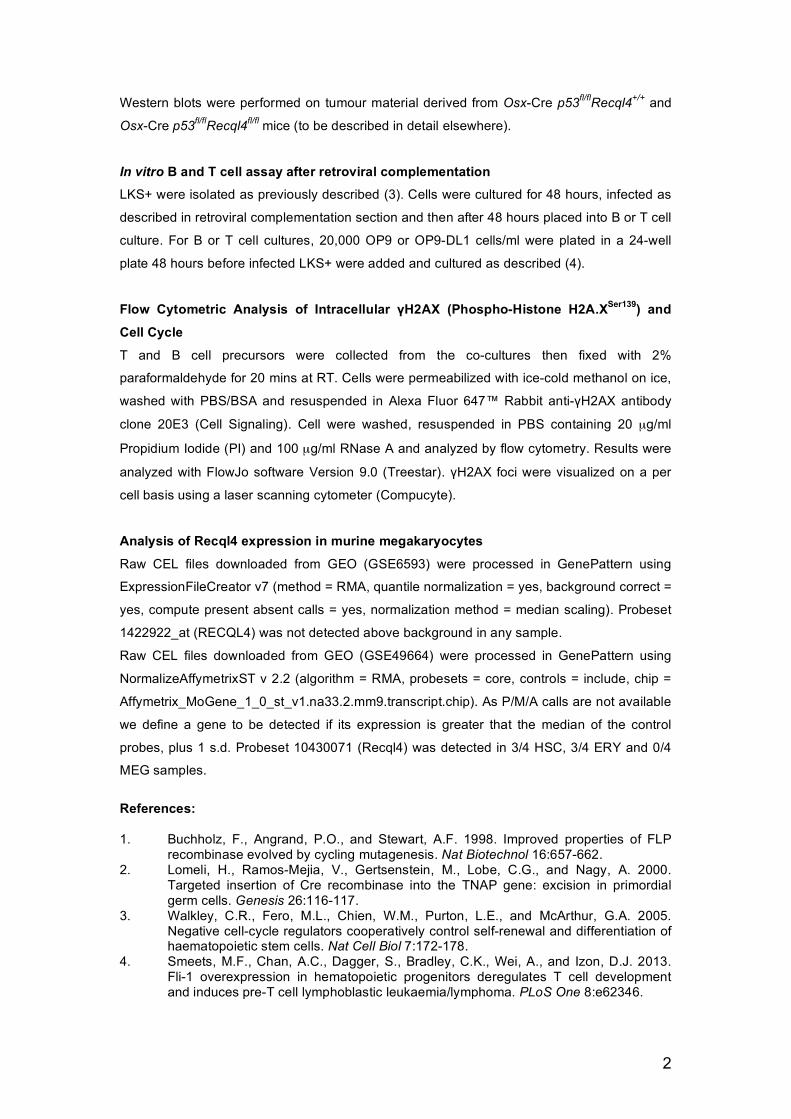
Western blots were performed on tumour material derived from Osx-Cre p53fl/flRecql4+/+ and
Osx-Cre p53fl/flRecql4fl/fl mice (to be described in detail elsewhere).
In vitro B and T cell assay after retroviral complementation LKS+ were isolated as previously described (3). Cells were cultured for 48 hours, infected as
described in retroviral complementation section and then after 48 hours placed into B or T cell
culture. For B or T cell cultures, 20,000 OP9 or OP9-DL1 cells/ml were plated in a 24-well
plate 48 hours before infected LKS+ were added and cultured as described (4).
Flow Cytometric Analysis of Intracellular γH2AX (Phospho-Histone H2A.XSer139) and
Cell Cycle
T and B cell precursors were collected from the co-cultures then fixed with 2%
paraformaldehyde for 20 mins at RT. Cells were permeabilized with ice-cold methanol on ice,
washed with PBS/BSA and resuspended in Alexa Fluor 647™ Rabbit anti-γH2AX antibody
clone 20E3 (Cell Signaling). Cell were washed, resuspended in PBS containing 20 µg/ml
Propidium Iodide (PI) and 100 µg/ml RNase A and analyzed by flow cytometry. Results were
analyzed with FlowJo software Version 9.0 (Treestar). γH2AX foci were visualized on a per
cell basis using a laser scanning cytometer (Compucyte).
Analysis of Recql4 expression in murine megakaryocytes
Raw CEL files downloaded from GEO (GSE6593) were processed in GenePattern using
ExpressionFileCreator v7 (method = RMA, quantile normalization = yes, background correct =
yes, compute present absent calls = yes, normalization method = median scaling). Probeset
1422922_at (RECQL4) was not detected above background in any sample.
Raw CEL files downloaded from GEO (GSE49664) were processed in GenePattern using
NormalizeAffymetrixST v 2.2 (algorithm = RMA, probesets = core, controls = include, chip =
Affymetrix_MoGene_1_0_st_v1.na33.2.mm9.transcript.chip). As P/M/A calls are not available
we define a gene to be detected if its expression is greater that the median of the control
probes, plus 1 s.d. Probeset 10430071 (Recql4) was detected in 3/4 HSC, 3/4 ERY and 0/4
MEG samples.
References: 1. Buchholz, F., Angrand, P.O., and Stewart, A.F. 1998. Improved properties of FLP
recombinase evolved by cycling mutagenesis. Nat Biotechnol 16:657-662. 2. Lomeli, H., Ramos-Mejia, V., Gertsenstein, M., Lobe, C.G., and Nagy, A. 2000.
Targeted insertion of Cre recombinase into the TNAP gene: excision in primordial germ cells. Genesis 26:116-117.
3. Walkley, C.R., Fero, M.L., Chien, W.M., Purton, L.E., and McArthur, G.A. 2005. Negative cell-cycle regulators cooperatively control self-renewal and differentiation of haematopoietic stem cells. Nat Cell Biol 7:172-178.
4. Smeets, M.F., Chan, A.C., Dagger, S., Bradley, C.K., Wei, A., and Izon, D.J. 2013. Fli-1 overexpression in hematopoietic progenitors deregulates T cell development and induces pre-T cell lymphoblastic leukaemia/lymphoma. PLoS One 8:e62346.
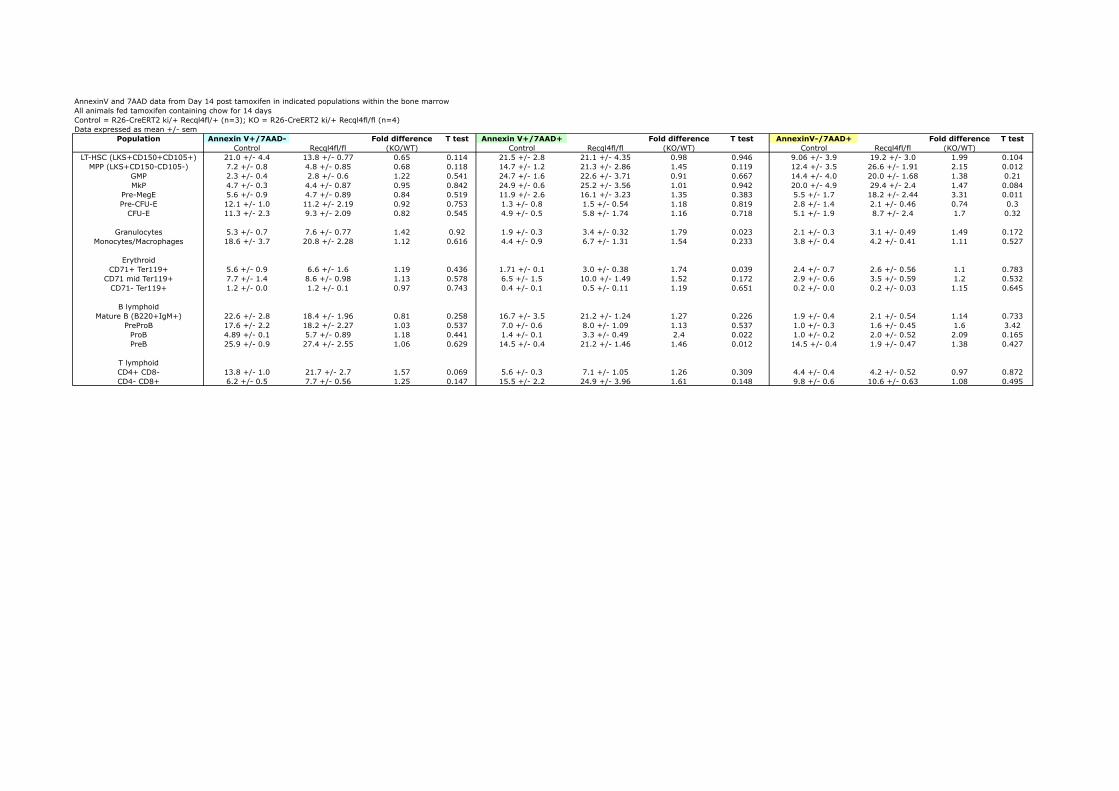
AnnexinV and 7AAD data from Day 14 post tamoxifen in indicated populations within the bone marrowAll animals fed tamoxifen containing chow for 14 daysControl = R26-CreERT2 ki/+ Recql4fl/+ (n=3); KO = R26-CreERT2 ki/+ Recql4fl/fl (n=4)Data expressed as mean +/- sem
Population Annexin V+/7AAD- Fold difference T test Annexin V+/7AAD+ Fold difference T test AnnexinV-/7AAD+ Fold difference T testControl Recql4fl/fl (KO/WT) Control Recql4fl/fl (KO/WT) Control Recql4fl/fl (KO/WT)
LT-HSC (LKS+CD150+CD105+) 21.0 +/- 4.4 13.8 +/- 0.77 0.65 0.114 21.5 +/- 2.8 21.1 +/- 4.35 0.98 0.946 9.06 +/- 3.9 19.2 +/- 3.0 1.99 0.104MPP (LKS+CD150-CD105-) 7.2 +/- 0.8 4.8 +/- 0.85 0.68 0.118 14.7 +/- 1.2 21.3 +/- 2.86 1.45 0.119 12.4 +/- 3.5 26.6 +/- 1.91 2.15 0.012
GMP 2.3 +/- 0.4 2.8 +/- 0.6 1.22 0.541 24.7 +/- 1.6 22.6 +/- 3.71 0.91 0.667 14.4 +/- 4.0 20.0 +/- 1.68 1.38 0.21MkP 4.7 +/- 0.3 4.4 +/- 0.87 0.95 0.842 24.9 +/- 0.6 25.2 +/- 3.56 1.01 0.942 20.0 +/- 4.9 29.4 +/- 2.4 1.47 0.084
Pre-MegE 5.6 +/- 0.9 4.7 +/- 0.89 0.84 0.519 11.9 +/- 2.6 16.1 +/- 3.23 1.35 0.383 5.5 +/- 1.7 18.2 +/- 2.44 3.31 0.011Pre-CFU-E 12.1 +/- 1.0 11.2 +/- 2.19 0.92 0.753 1.3 +/- 0.8 1.5 +/- 0.54 1.18 0.819 2.8 +/- 1.4 2.1 +/- 0.46 0.74 0.3
CFU-E 11.3 +/- 2.3 9.3 +/- 2.09 0.82 0.545 4.9 +/- 0.5 5.8 +/- 1.74 1.16 0.718 5.1 +/- 1.9 8.7 +/- 2.4 1.7 0.32
Granulocytes 5.3 +/- 0.7 7.6 +/- 0.77 1.42 0.92 1.9 +/- 0.3 3.4 +/- 0.32 1.79 0.023 2.1 +/- 0.3 3.1 +/- 0.49 1.49 0.172Monocytes/Macrophages 18.6 +/- 3.7 20.8 +/- 2.28 1.12 0.616 4.4 +/- 0.9 6.7 +/- 1.31 1.54 0.233 3.8 +/- 0.4 4.2 +/- 0.41 1.11 0.527
ErythroidCD71+ Ter119+ 5.6 +/- 0.9 6.6 +/- 1.6 1.19 0.436 1.71 +/- 0.1 3.0 +/- 0.38 1.74 0.039 2.4 +/- 0.7 2.6 +/- 0.56 1.1 0.783
CD71 mid Ter119+ 7.7 +/- 1.4 8.6 +/- 0.98 1.13 0.578 6.5 +/- 1.5 10.0 +/- 1.49 1.52 0.172 2.9 +/- 0.6 3.5 +/- 0.59 1.2 0.532CD71- Ter119+ 1.2 +/- 0.0 1.2 +/- 0.1 0.97 0.743 0.4 +/- 0.1 0.5 +/- 0.11 1.19 0.651 0.2 +/- 0.0 0.2 +/- 0.03 1.15 0.645
B lymphoidMature B (B220+IgM+) 22.6 +/- 2.8 18.4 +/- 1.96 0.81 0.258 16.7 +/- 3.5 21.2 +/- 1.24 1.27 0.226 1.9 +/- 0.4 2.1 +/- 0.54 1.14 0.733
PreProB 17.6 +/- 2.2 18.2 +/- 2.27 1.03 0.537 7.0 +/- 0.6 8.0 +/- 1.09 1.13 0.537 1.0 +/- 0.3 1.6 +/- 0.45 1.6 3.42ProB 4.89 +/- 0.1 5.7 +/- 0.89 1.18 0.441 1.4 +/- 0.1 3.3 +/- 0.49 2.4 0.022 1.0 +/- 0.2 2.0 +/- 0.52 2.09 0.165PreB 25.9 +/- 0.9 27.4 +/- 2.55 1.06 0.629 14.5 +/- 0.4 21.2 +/- 1.46 1.46 0.012 14.5 +/- 0.4 1.9 +/- 0.47 1.38 0.427
T lymphoidCD4+ CD8- 13.8 +/- 1.0 21.7 +/- 2.7 1.57 0.069 5.6 +/- 0.3 7.1 +/- 1.05 1.26 0.309 4.4 +/- 0.4 4.2 +/- 0.52 0.97 0.872CD4- CD8+ 6.2 +/- 0.5 7.7 +/- 0.56 1.25 0.147 15.5 +/- 2.2 24.9 +/- 3.96 1.61 0.148 9.8 +/- 0.6 10.6 +/- 0.63 1.08 0.495
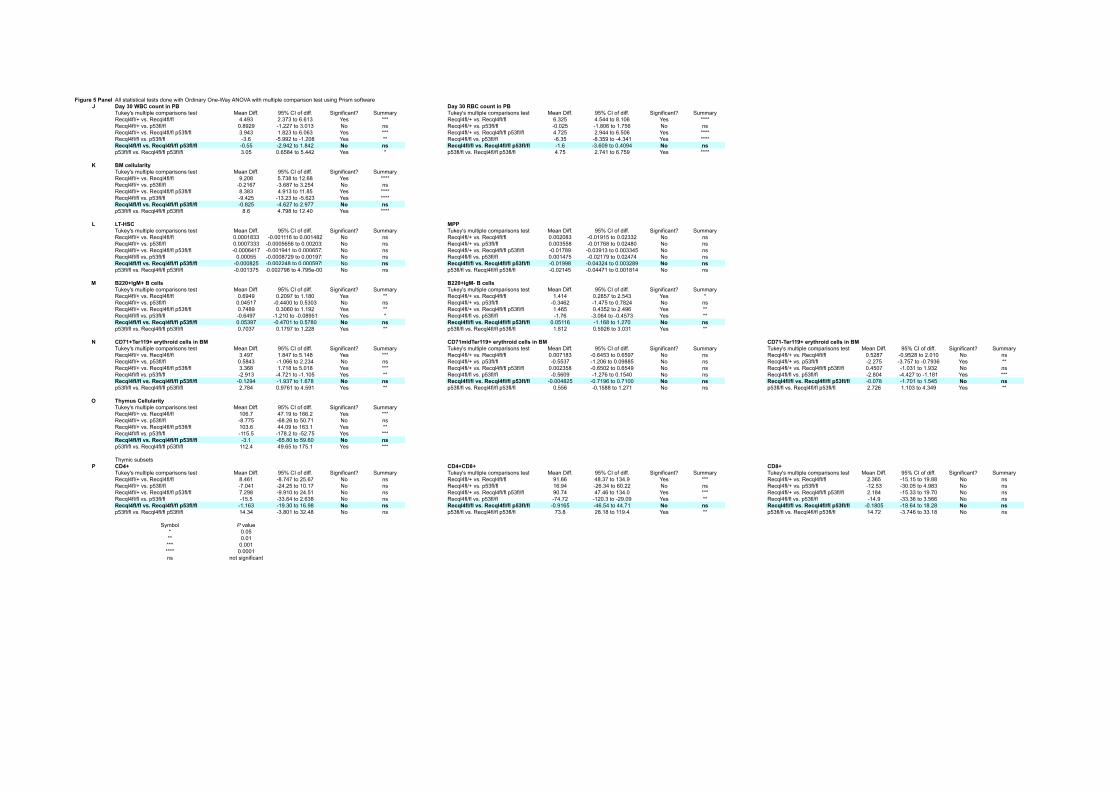
Figure 5 Panel All statistical tests done with Ordinary One-Way ANOVA with multiple comparison test using Prism softwareJ Day 30 WBC count in PB Day 30 RBC count in PB
Tukey's multiple comparisons test Mean Diff. 95% CI of diff. Significant? Summary Tukey's multiple comparisons test Mean Diff. 95% CI of diff. Significant? SummaryRecql4fl/+ vs. Recql4fl/fl 4.493 2.373 to 6.613 Yes *** Recql4fl/+ vs. Recql4fl/fl 6.325 4.544 to 8.106 Yes ****Recql4fl/+ vs. p53fl/fl 0.8929 -1.227 to 3.013 No ns Recql4fl/+ vs. p53fl/fl -0.025 -1.806 to 1.756 No nsRecql4fl/+ vs. Recql4fl/fl p53fl/fl 3.943 1.823 to 6.063 Yes *** Recql4fl/+ vs. Recql4fl/fl p53fl/fl 4.725 2.944 to 6.506 Yes ****Recql4fl/fl vs. p53fl/fl -3.6 -5.992 to -1.208 Yes ** Recql4fl/fl vs. p53fl/fl -6.35 -8.359 to -4.341 Yes ****Recql4fl/fl vs. Recql4fl/fl p53fl/fl -0.55 -2.942 to 1.842 No ns Recql4fl/fl vs. Recql4fl/fl p53fl/fl -1.6 -3.609 to 0.4094 No nsp53fl/fl vs. Recql4fl/fl p53fl/fl 3.05 0.6584 to 5.442 Yes * p53fl/fl vs. Recql4fl/fl p53fl/fl 4.75 2.741 to 6.759 Yes ****
K BM cellularityTukey's multiple comparisons test Mean Diff. 95% CI of diff. Significant? SummaryRecql4fl/+ vs. Recql4fl/fl 9.208 5.738 to 12.68 Yes ****Recql4fl/+ vs. p53fl/fl -0.2167 -3.687 to 3.254 No nsRecql4fl/+ vs. Recql4fl/fl p53fl/fl 8.383 4.913 to 11.85 Yes ****Recql4fl/fl vs. p53fl/fl -9.425 -13.23 to -5.623 Yes ****Recql4fl/fl vs. Recql4fl/fl p53fl/fl -0.825 -4.627 to 2.977 No nsp53fl/fl vs. Recql4fl/fl p53fl/fl 8.6 4.798 to 12.40 Yes ****
L LT-HSC MPPTukey's multiple comparisons test Mean Diff. 95% CI of diff. Significant? Summary Tukey's multiple comparisons test Mean Diff. 95% CI of diff. Significant? SummaryRecql4fl/+ vs. Recql4fl/fl 0.0001833 -0.001116 to 0.001482 No ns Recql4fl/+ vs. Recql4fl/fl 0.002083 -0.01915 to 0.02332 No nsRecql4fl/+ vs. p53fl/fl 0.0007333 -0.0005656 to 0.002032 No ns Recql4fl/+ vs. p53fl/fl 0.003558 -0.01768 to 0.02480 No nsRecql4fl/+ vs. Recql4fl/fl p53fl/fl -0.0006417 -0.001941 to 0.0006573 No ns Recql4fl/+ vs. Recql4fl/fl p53fl/fl -0.01789 -0.03913 to 0.003345 No nsRecql4fl/fl vs. p53fl/fl 0.00055 -0.0008729 to 0.001973 No ns Recql4fl/fl vs. p53fl/fl 0.001475 -0.02179 to 0.02474 No nsRecql4fl/fl vs. Recql4fl/fl p53fl/fl -0.000825 -0.002248 to 0.0005979 No ns Recql4fl/fl vs. Recql4fl/fl p53fl/fl -0.01998 -0.04324 to 0.003289 No nsp53fl/fl vs. Recql4fl/fl p53fl/fl -0.001375 -0.002798 to 4.795e-005 No ns p53fl/fl vs. Recql4fl/fl p53fl/fl -0.02145 -0.04471 to 0.001814 No ns
M B220+IgM+ B cells B220+IgM- B cellsTukey's multiple comparisons test Mean Diff. 95% CI of diff. Significant? Summary Tukey's multiple comparisons test Mean Diff. 95% CI of diff. Significant? SummaryRecql4fl/+ vs. Recql4fl/fl 0.6949 0.2097 to 1.180 Yes ** Recql4fl/+ vs. Recql4fl/fl 1.414 0.2857 to 2.543 Yes *Recql4fl/+ vs. p53fl/fl 0.04517 -0.4400 to 0.5303 No ns Recql4fl/+ vs. p53fl/fl -0.3462 -1.475 to 0.7824 No nsRecql4fl/+ vs. Recql4fl/fl p53fl/fl 0.7489 0.3060 to 1.192 Yes ** Recql4fl/+ vs. Recql4fl/fl p53fl/fl 1.465 0.4352 to 2.496 Yes **Recql4fl/fl vs. p53fl/fl -0.6497 -1.210 to -0.08951 Yes * Recql4fl/fl vs. p53fl/fl -1.76 -3.064 to -0.4573 Yes **Recql4fl/fl vs. Recql4fl/fl p53fl/fl 0.05397 -0.4701 to 0.5780 No ns Recql4fl/fl vs. Recql4fl/fl p53fl/fl 0.05116 -1.168 to 1.270 No nsp53fl/fl vs. Recql4fl/fl p53fl/fl 0.7037 0.1797 to 1.228 Yes ** p53fl/fl vs. Recql4fl/fl p53fl/fl 1.812 0.5926 to 3.031 Yes **
N CD71+Ter119+ erythroid cells in BM CD71midTer119+ erythroid cells in BM CD71-Ter119+ erythroid cells in BMTukey's multiple comparisons test Mean Diff. 95% CI of diff. Significant? Summary Tukey's multiple comparisons test Mean Diff. 95% CI of diff. Significant? Summary Tukey's multiple comparisons test Mean Diff. 95% CI of diff. Significant? SummaryRecql4fl/+ vs. Recql4fl/fl 3.497 1.847 to 5.148 Yes *** Recql4fl/+ vs. Recql4fl/fl 0.007183 -0.6453 to 0.6597 No ns Recql4fl/+ vs. Recql4fl/fl 0.5287 -0.9528 to 2.010 No nsRecql4fl/+ vs. p53fl/fl 0.5843 -1.066 to 2.234 No ns Recql4fl/+ vs. p53fl/fl -0.5537 -1.206 to 0.09885 No ns Recql4fl/+ vs. p53fl/fl -2.275 -3.757 to -0.7936 Yes **Recql4fl/+ vs. Recql4fl/fl p53fl/fl 3.368 1.718 to 5.018 Yes *** Recql4fl/+ vs. Recql4fl/fl p53fl/fl 0.002358 -0.6502 to 0.6549 No ns Recql4fl/+ vs. Recql4fl/fl p53fl/fl 0.4507 -1.031 to 1.932 No nsRecql4fl/fl vs. p53fl/fl -2.913 -4.721 to -1.105 Yes ** Recql4fl/fl vs. p53fl/fl -0.5609 -1.276 to 0.1540 No ns Recql4fl/fl vs. p53fl/fl -2.804 -4.427 to -1.181 Yes ***Recql4fl/fl vs. Recql4fl/fl p53fl/fl -0.1294 -1.937 to 1.678 No ns Recql4fl/fl vs. Recql4fl/fl p53fl/fl -0.004825 -0.7196 to 0.7100 No ns Recql4fl/fl vs. Recql4fl/fl p53fl/fl -0.078 -1.701 to 1.545 No nsp53fl/fl vs. Recql4fl/fl p53fl/fl 2.784 0.9761 to 4.591 Yes ** p53fl/fl vs. Recql4fl/fl p53fl/fl 0.556 -0.1588 to 1.271 No ns p53fl/fl vs. Recql4fl/fl p53fl/fl 2.726 1.103 to 4.349 Yes **
O Thymus CellularityTukey's multiple comparisons test Mean Diff. 95% CI of diff. Significant? SummaryRecql4fl/+ vs. Recql4fl/fl 106.7 47.19 to 166.2 Yes ***Recql4fl/+ vs. p53fl/fl -8.775 -68.26 to 50.71 No nsRecql4fl/+ vs. Recql4fl/fl p53fl/fl 103.6 44.09 to 163.1 Yes **Recql4fl/fl vs. p53fl/fl -115.5 -178.2 to -52.75 Yes ***Recql4fl/fl vs. Recql4fl/fl p53fl/fl -3.1 -65.80 to 59.60 No nsp53fl/fl vs. Recql4fl/fl p53fl/fl 112.4 49.65 to 175.1 Yes ***
Thymic subsetsP CD4+ CD4+CD8+ CD8+
Tukey's multiple comparisons test Mean Diff. 95% CI of diff. Significant? Summary Tukey's multiple comparisons test Mean Diff. 95% CI of diff. Significant? Summary Tukey's multiple comparisons test Mean Diff. 95% CI of diff. Significant? SummaryRecql4fl/+ vs. Recql4fl/fl 8.461 -8.747 to 25.67 No ns Recql4fl/+ vs. Recql4fl/fl 91.66 48.37 to 134.9 Yes *** Recql4fl/+ vs. Recql4fl/fl 2.365 -15.15 to 19.88 No nsRecql4fl/+ vs. p53fl/fl -7.041 -24.25 to 10.17 No ns Recql4fl/+ vs. p53fl/fl 16.94 -26.34 to 60.22 No ns Recql4fl/+ vs. p53fl/fl -12.53 -30.05 to 4.983 No nsRecql4fl/+ vs. Recql4fl/fl p53fl/fl 7.298 -9.910 to 24.51 No ns Recql4fl/+ vs. Recql4fl/fl p53fl/fl 90.74 47.46 to 134.0 Yes *** Recql4fl/+ vs. Recql4fl/fl p53fl/fl 2.184 -15.33 to 19.70 No nsRecql4fl/fl vs. p53fl/fl -15.5 -33.64 to 2.638 No ns Recql4fl/fl vs. p53fl/fl -74.72 -120.3 to -29.09 Yes ** Recql4fl/fl vs. p53fl/fl -14.9 -33.36 to 3.566 No nsRecql4fl/fl vs. Recql4fl/fl p53fl/fl -1.163 -19.30 to 16.98 No ns Recql4fl/fl vs. Recql4fl/fl p53fl/fl -0.9165 -46.54 to 44.71 No ns Recql4fl/fl vs. Recql4fl/fl p53fl/fl -0.1805 -18.64 to 18.28 No nsp53fl/fl vs. Recql4fl/fl p53fl/fl 14.34 -3.801 to 32.48 No ns p53fl/fl vs. Recql4fl/fl p53fl/fl 73.8 28.18 to 119.4 Yes ** p53fl/fl vs. Recql4fl/fl p53fl/fl 14.72 -3.746 to 33.18 No ns
Symbol P value* 0.05** 0.01*** 0.001**** 0.0001ns not significant
1 2 3 9 1087654 11 12 13 14-15 16 17 18 19 20 21 22
ATP dependent DNA Helicase RecQ domain
Mfsd3Lrrc14
OsteosarcomaLymphoma
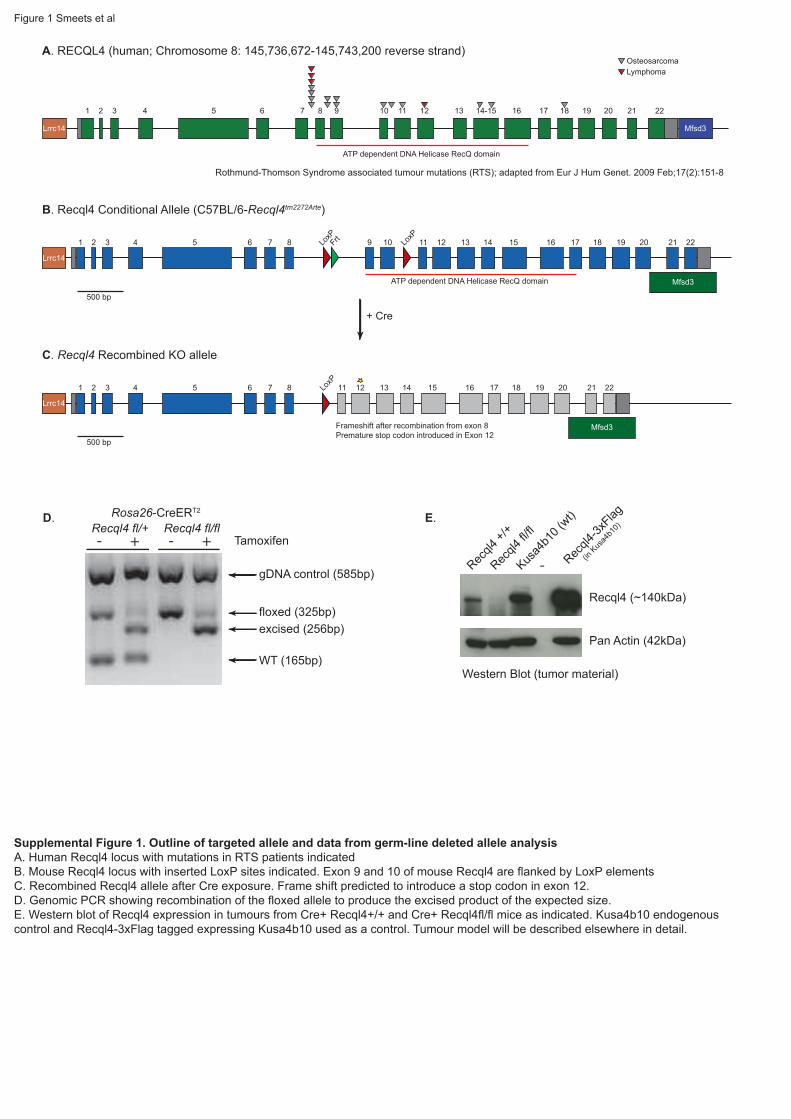
A. RECQL4 (human; Chromosome 8: 145,736,672-145,743,200 reverse strand)
Rothmund-Thomson Syndrome associated tumour mutations (RTS); adapted from Eur J Hum Genet. 2009 Feb;17(2):151-8
1 2 3 87654 11 12 13 14 15 16 17 18 19 20 21 22
Mfsd3
500 bp
C. Recql4 Recombined KO allele
Lrrc14
LoxP
Frameshift after recombination from exon 8Premature stop codon introduced in Exon 12
1 2 3 9 1087654 11 12 13 14 15 16 17 18 19 20 21 22
Mfsd3
500 bp
B. Recql4 Conditional Allele (C57BL/6-Recql4tm2272Arte)
Lrrc14
LoxP
LoxP
Frt
ATP dependent DNA Helicase RecQ domain
+ Cre
WT (165bp)
floxed (325bp)excised (256bp)
- + - +
Rosa26-CreERT2D. E.
Recql4 fl/+ Recql4 fl/flTamoxifen
Figure 1 Smeets et al
gDNA control (585bp) Recql4
fl/fl
Pan Actin (42kDa)
Recql4 (~140kDa)
Recql4
+/+
Kusa4
b10 (
wt)
Recql4
-3xFlag
(in K
usa4
b10)
-
Western Blot (tumor material)
Supplemental Figure 1. Outline of targeted allele and data from germ-line deleted allele analysisA. Human Recql4 locus with mutations in RTS patients indicatedB. Mouse Recql4 locus with inserted LoxP sites indicated. Exon 9 and 10 of mouse Recql4 are flanked by LoxP elementsC. Recombined Recql4 allele after Cre exposure. Frame shift predicted to introduce a stop codon in exon 12.D. Genomic PCR showing recombination of the floxed allele to produce the excised product of the expected size.E. Western blot of Recql4 expression in tumours from Cre+ Recql4+/+ and Cre+ Recql4fl/fl mice as indicated. Kusa4b10 endogenouscontrol and Recql4-3xFlag tagged expressing Kusa4b10 used as a control. Tumour model will be described elsewhere in detail.
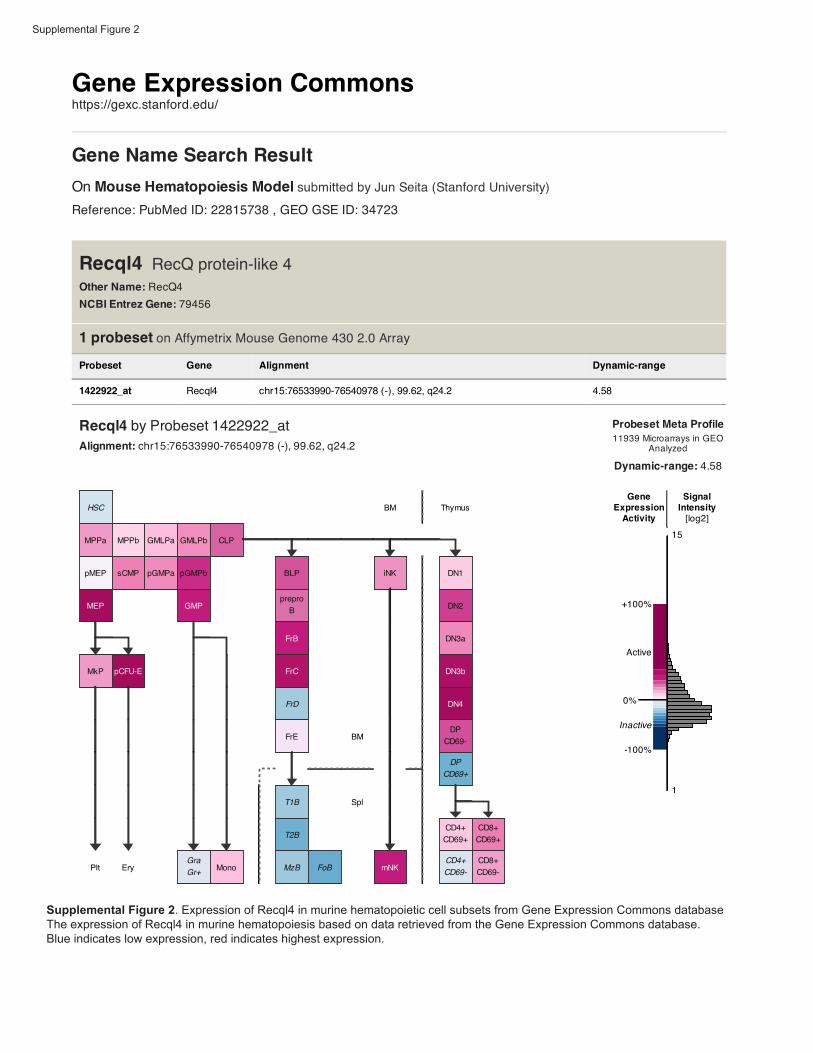
Supplemental Figure 2
Supplemental Figure 2. Expression of Recql4 in murine hematopoietic cell subsets from Gene Expression Commons databaseThe expression of Recql4 in murine hematopoiesis based on data retrieved from the Gene Expression Commons database.Blue indicates low expression, red indicates highest expression.
Supplemental Figure 3
0.0
0.2
0.4
0.6
0.8
1.0
0
50
100
150
200
+/+ fl/flGenotype
Leuk
ocyt
es p
er s
plee
n (x
106 )
A.
0
1
2
3
4
Cel
ls p
er s
plee
n (x
106 )
+/+ fl/fl
Granulocytes
+/+ fl/fl
Macrophages
B.
0
10
20
30
40
C.
Cel
ls p
er s
plee
n (x
106 )
+/+ fl/fl
CD71+Ter119+
+/+ fl/fl
CD71mid
Ter119+
+/+ fl/fl
CD71-Ter119+
P<0.001
0
20
40
60
80
100
+/+ fl/fl
B220+IgM+
Cel
ls p
er s
plee
n (x
106 )
D.
Cel
ls p
er fe
mur
(x10
6 )
+/+ fl/fl
CD4+ T cells
+/+ fl/fl
CD8+ve T cells
P=0.05
0
5
10
15
20
25 P=0.01
Cel
ls p
er s
plee
n (x
106 )
+/+ fl/fl
CD4+ T cells
+/+ fl/fl
CD8+ve T cells
CD4
CD8
CD4+ve TCRβ
CD8+ve TCRβ
R26-CreERT2 ki/+
Recql4+/+
R26-CreERT2 ki/+
Recql4fl/fl
CD4
CD8
CD4+ve TCRβ
CD8+ve TCRβ
+/+ fl/fl
DN1
+/+ fl/fl
CD4+CD8+
+/+
CD8+
fl/fl +/+ fl/fl
DN2
+/+ fl/fl
DN3
+/+ fl/fl
DN4
10-1
100
101
102
103
P<0.01P<0.01
Cel
ls p
er th
ymus
(x10
6 )
0.00.10.20.30.40.5
2468
P=0.05
P<0.01
Cel
ls p
er th
ymus
(x10
6 )
+/+
CD4+
fl/fl
Spl
een
Spl
een
T ce
llsB
M T
cel
ls
Thym
us T
cel
ls
E.
F. G. H.
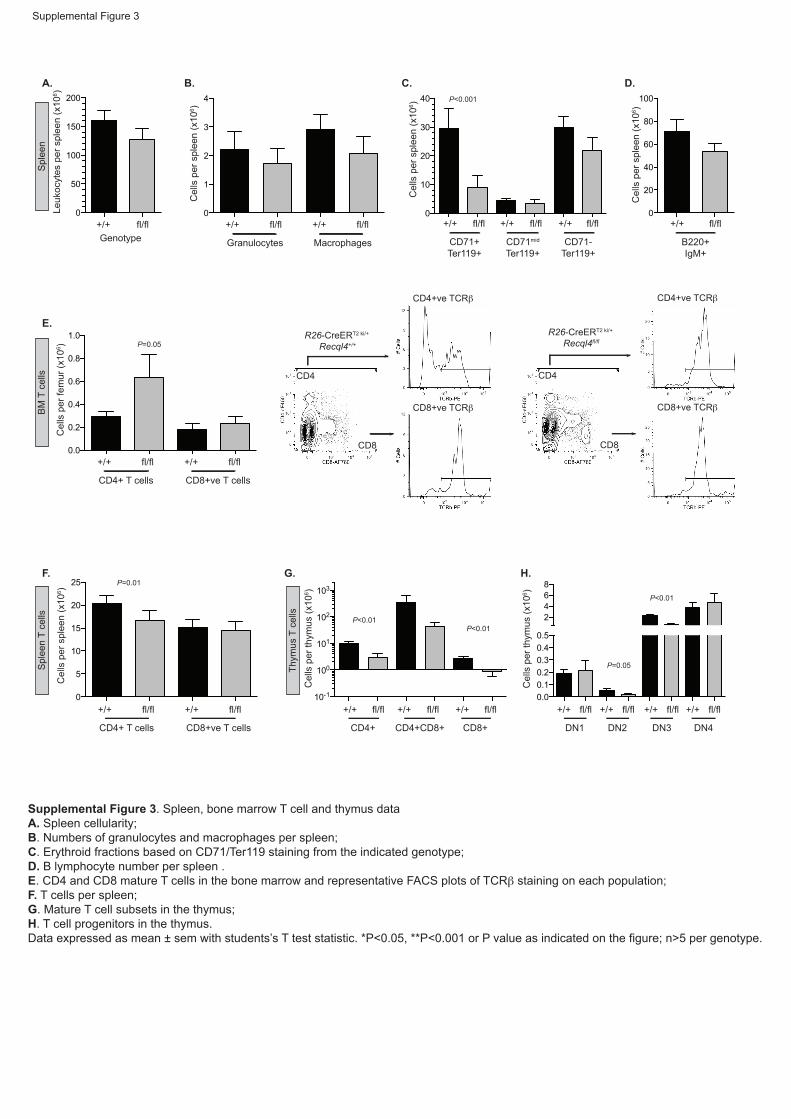
Supplemental Figure 3. Spleen, bone marrow T cell and thymus dataA. Spleen cellularity; B. Numbers of granulocytes and macrophages per spleen; C. Erythroid fractions based on CD71/Ter119 staining from the indicated genotype; D. B lymphocyte number per spleen .E. CD4 and CD8 mature T cells in the bone marrow and representative FACS plots of TCRβ staining on each population;F. T cells per spleen;G. Mature T cell subsets in the thymus;H. T cell progenitors in the thymus.Data expressed as mean ± sem with students’s T test statistic. *P<0.05, **P<0.001 or P value as indicated on the figure; n>5 per genotype.
10
100
1000
10000
+/+ fl/fl
CFU-GEMM
+/+ fl/fl
BFU-E
+/+ fl/fl+/+ fl/fl
CFU-M
+/+ fl/fl
CFU-G
+/+ fl/fl
CFU-GM
Col
onie
s pe
r fem
ur
Supp figure 4
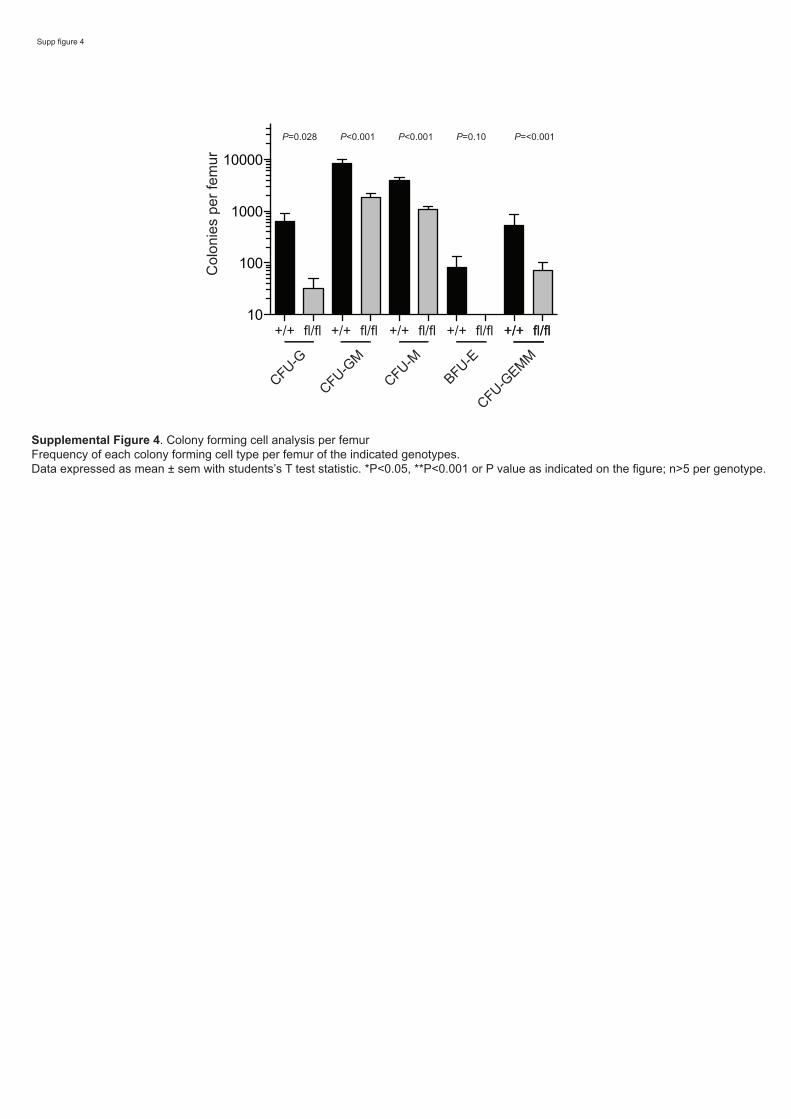
P=0.028 P<0.001 P<0.001 P=0.10 P=<0.001
Supplemental Figure 4. Colony forming cell analysis per femurFrequency of each colony forming cell type per femur of the indicated genotypes.Data expressed as mean ± sem with students’s T test statistic. *P<0.05, **P<0.001 or P value as indicated on the figure; n>5 per genotype.
A.
Tamoxifen food30 days
Bone marrow transplant
R26-CreERT2 ki/+ Recql4+/+
R26-CreERT2 ki/+ Recql4fl/+
R26-CreERT2 ki/+ Recql4fl/fl
Congenic CD45.1
>20wk
0
5
10
15
20
25
7 weeks 15 weeks 24 weeks
Time post transplant
% M
ac-1
+ve
of C
D45
.2+v
e in
PB
fl/+fl/fl
+/+
0
20
40
60
80
100
% C
D45
.2+v
e in
PB
7 weeks 15 weeks 24 weeks
Time post transplant
fl/+fl/fl
+/+
BM CD45.2+
fl/flfl/+
+/Δ
con
trol
flΔWT
Supplementary Figure 5
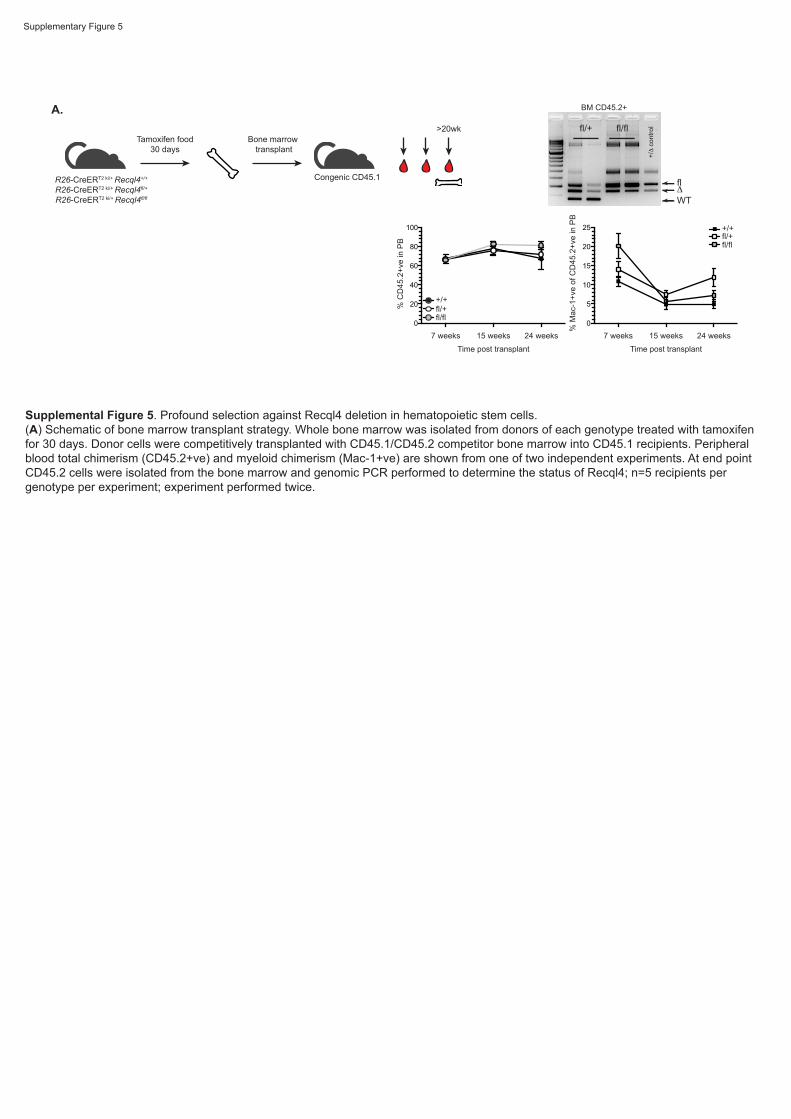
Supplemental Figure 5. Profound selection against Recql4 deletion in hematopoietic stem cells.(A) Schematic of bone marrow transplant strategy. Whole bone marrow was isolated from donors of each genotype treated with tamoxifen for 30 days. Donor cells were competitively transplanted with CD45.1/CD45.2 competitor bone marrow into CD45.1 recipients. Peripheral blood total chimerism (CD45.2+ve) and myeloid chimerism (Mac-1+ve) are shown from one of two independent experiments. At end point CD45.2 cells were isolated from the bone marrow and genomic PCR performed to determine the status of Recql4; n=5 recipients per genotype per experiment; experiment performed twice.
R26-CreERT2 ki/+
Recql4+/+R26-CreERT2 ki/+
Recql4fl/fl
OP9
OP9-DL1
R26-CreERT2 ki/+
Recql4+/+R26-CreERT2 ki/+
Recql4fl/fl
OP9
OP9-DL1
A. B.
C.
Day 0 Day 7 Day 14 Day 210.1
1
10
100
1000 +/+fl/fl
OP9-DL1
Days in Culture
Fold
Incr
ease
Cel
l Num
ber
Day 0 Day 7 Day 14 Day 210.1
1
10
100
1000
OP9
Fold
Incr
ease
Cel
l Num
ber
Days in Culture
+/+fl/fl
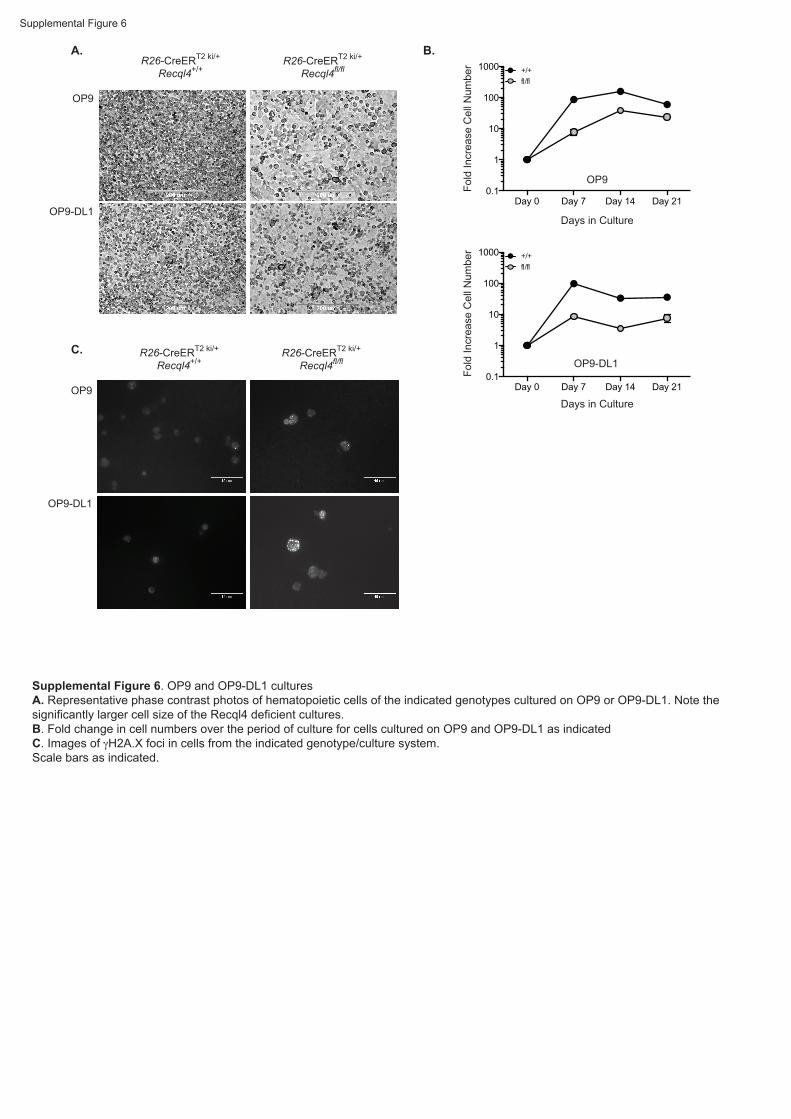
Supplemental Figure 6. OP9 and OP9-DL1 culturesA. Representative phase contrast photos of hematopoietic cells of the indicated genotypes cultured on OP9 or OP9-DL1. Note thesignificantly larger cell size of the Recql4 deficient cultures.B. Fold change in cell numbers over the period of culture for cells cultured on OP9 and OP9-DL1 as indicatedC. Images of γH2A.X foci in cells from the indicated genotype/culture system.Scale bars as indicated.
Supplemental Figure 6
+/+ fl/fl
+/+ W
T
fl/fl W
T
+/+ K50
8A
fl/fl K
508A
+/+ W
T
fl/fl W
T
+/+ K50
8A
fl/fl K
508A
0
50
100
150Fold expansion on OP9-DL1
GFP- GFP+
+/+ fl/fl
+/+ W
T
fl/fl W
T
+/+ K50
8A
fl/fl K
508A
+/+ W
T
fl/fl W
T
+/+ K50
8A
fl/fl K
508A
0
200
400
600Fold expansion on OP9
GFP- GFP+
+/+ fl/fl
+/+ W
T
fl/fl W
T
+/+ K50
8A
fl/fl K
508A
+/+ W
T
fl/fl W
T
+/+ K50
8A
fl/fl K
508A
0
2 106
4 106
6 106
8 106Total cell number on OP9-DL1
GFP- GFP+
+/+ fl/fl
+/+ W
T
fl/fl W
T
+/+ K50
8A
fl/fl K
508A
+/+ W
T
fl/fl W
T
+/+ K50
8A
fl/fl K
508A
0.0
5.0 106
1.0 107
1.5 107Total cell number on OP9
GFP- GFP+
A.
B.
C.
GFP
Control R26-CreERT2ki/+ Recql4+/+ R26-CreERT2ki/+ Recql4fl/fl
GFP-RECQL4 WT GFP-RECQL4K508A GFP-RECQL4 WT GFP-RECQL4K508A
ITD Day 7 Day 14 Day 210
1
2
3
4
5
Fold
cha
nge
in G
FP
OP9 cultures - WT RECQL4
ITD Day 7 Day 14 Day 210
1
2
3
4
5
Fold
cha
nge
in G
FP
OP9 cultures RECQL4K508A
Supplemental Figure 7
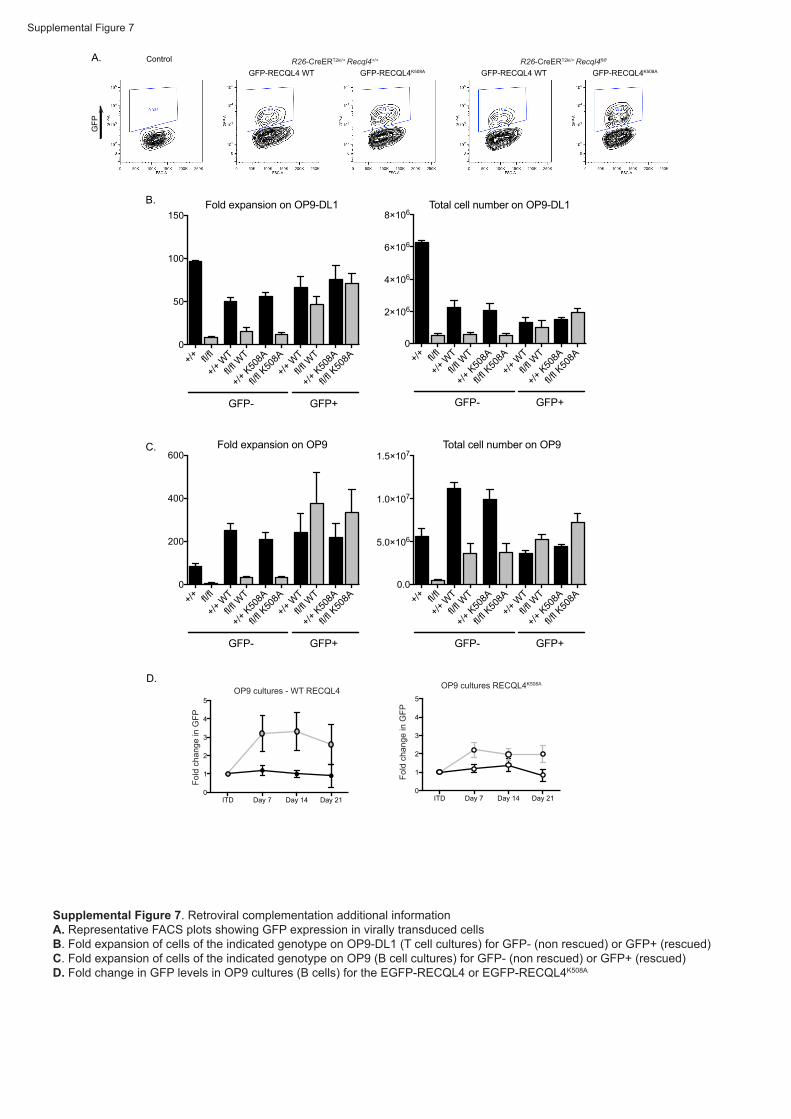
Supplemental Figure 7. Retroviral complementation additional informationA. Representative FACS plots showing GFP expression in virally transduced cellsB. Fold expansion of cells of the indicated genotype on OP9-DL1 (T cell cultures) for GFP- (non rescued) or GFP+ (rescued)C. Fold expansion of cells of the indicated genotype on OP9 (B cell cultures) for GFP- (non rescued) or GFP+ (rescued)D. Fold change in GFP levels in OP9 cultures (B cells) for the EGFP-RECQL4 or EGFP-RECQL4K508A
D.