Embed Size (px)
Citation preview
1
-Supplementary Information-
In-depth serum proteomics reveals biomarkers of psoriasis severity and
response to traditional Chinese medicine
Supplemental Tables
Supplemental
Table S1
List of plasma/serum proteins identified by literature mining for
psoriasis.
Supplemental
Table S2
ClueGO functional analysis of psoriasis proteins identified by
literature mining.
Supplemental
Table S3
List of psoriasis-associated proteins identified by
psoriasis-specific antibody microarrays.
Supplemental
Table S4
List of psoriasis-associated proteins identified by DIA-MS.
Supplemental
Table S5
List of protein concentrations obtained from the human plasma
proteome database.
Supplemental
Table S6
Correlation analysis between the serum proteome, clinical data
and psoriasis index.
Supplemental
Table S7
List of biomarkers predicting the effectiveness of YinXieLing to
treat psoriasis identified with our in-depth serum proteomics
platform.
Supplemental Figures
2
Supplemental
Figure S1
Literature mining of psoriasis serum/plasma proteins and
biomarkers in PubMed database.
Supplemental
Figure S2
Functional analysis of proteins identified by text mining using
Cytoscape and ClueGO.
Supplemental
Figure S3
Selection of antibodies for fabricating a psoriasis-specific
antibody microarray.
Supplemental
Figure S4
Reproducibility of psoriasis antibody microarrays with serum
samples.
Supplemental
Figure S5
Distribution of protein expression in serum samples detected by
psoriasis antibody microarrays.
Supplemental
Figure S6
Validation of TNF and IL17A antibodies using protein arrays.
Supplemental
Figure S7
Venn diagram analysis of differentially-expressed proteins
identified by DIA-MS and psoriasis antibody microarrays.
Supplemental
Figure S8
Functional GO analysis of psoriasis-associated serum proteins
identified with DIA-MS and antibody microarrays.
Supplemental
Figure S9
KEGG analysis of psoriasis-associated proteins and their
cytokine-chemokine pathways.
Supplemental
Figure S10
KEGG analysis of psoriasis-associated proteins and their
coagulation and complement pathways.
Supplemental
Figure S11
Functional annotation of psoriasis-associated proteins using
in-depth serum proteomics.
3
Supplemental
Figure S12
Correlation interaction of neutrophils to the serum proteome
and psoriasis area and severity index (PASI).
Supplemental
Figure S13
Correlation of differentially expressed proteins, CD14 and
TNFRSF8, in psoriatic patients with the visual analog scale
(VAS).
Supplemental
Figure S14
Validation of the correlation between PI3 and CCL22 protein
expression with the PASI score by ELISA.
Supplemental
Figure S15
Non-biased hierarchical clustering analysis of the serum
proteome and clinical serum samples.
Supplemental
Figure S16
Validation of differentially expressed proteins in psoriasis,
CCL22 and CD14, by ELISA.
Supplemental
Figure S17
Principle component analysis distinguishing responders and
non-responders to YinXieLing treatment.
4
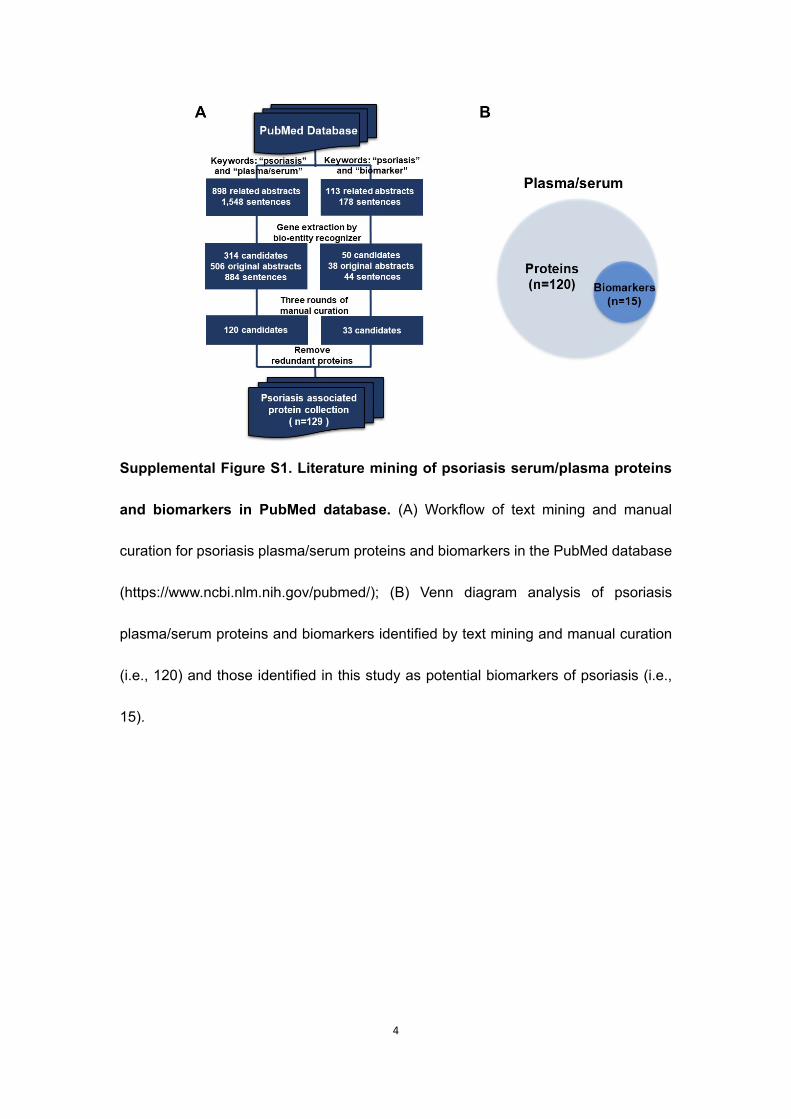
Supplemental Figure S1. Literature mining of psoriasis serum/plasma proteins
and biomarkers in PubMed database. (A) Workflow of text mining and manual
curation for psoriasis plasma/serum proteins and biomarkers in the PubMed database
(https://www.ncbi.nlm.nih.gov/pubmed/); (B) Venn diagram analysis of psoriasis
plasma/serum proteins and biomarkers identified by text mining and manual curation
(i.e., 120) and those identified in this study as potential biomarkers of psoriasis (i.e.,
15).
5
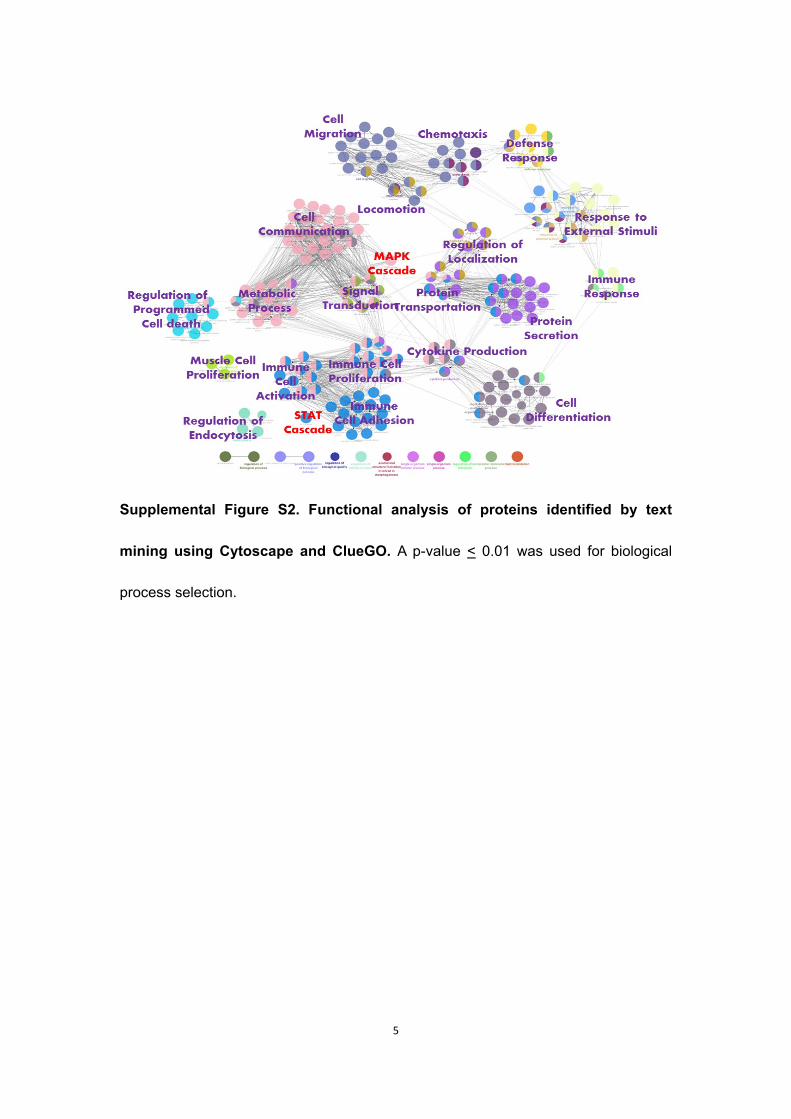
Supplemental Figure S2. Functional analysis of proteins identified by text
mining using Cytoscape and ClueGO. A p-value < 0.01 was used for biological
process selection.
6
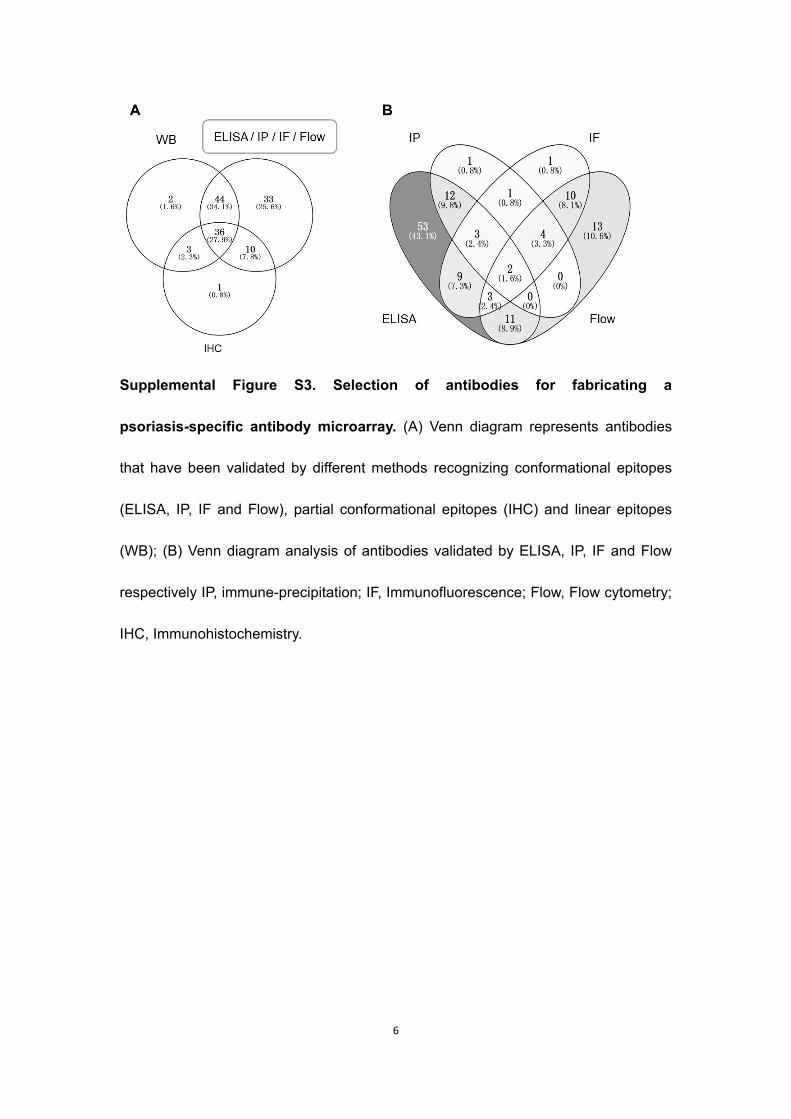
Supplemental Figure S3. Selection of antibodies for fabricating a
psoriasis-specific antibody microarray. (A) Venn diagram represents antibodies
that have been validated by different methods recognizing conformational epitopes
(ELISA, IP, IF and Flow), partial conformational epitopes (IHC) and linear epitopes
(WB); (B) Venn diagram analysis of antibodies validated by ELISA, IP, IF and Flow
respectively IP, immune-precipitation; IF, Immunofluorescence; Flow, Flow cytometry;
IHC, Immunohistochemistry.
7
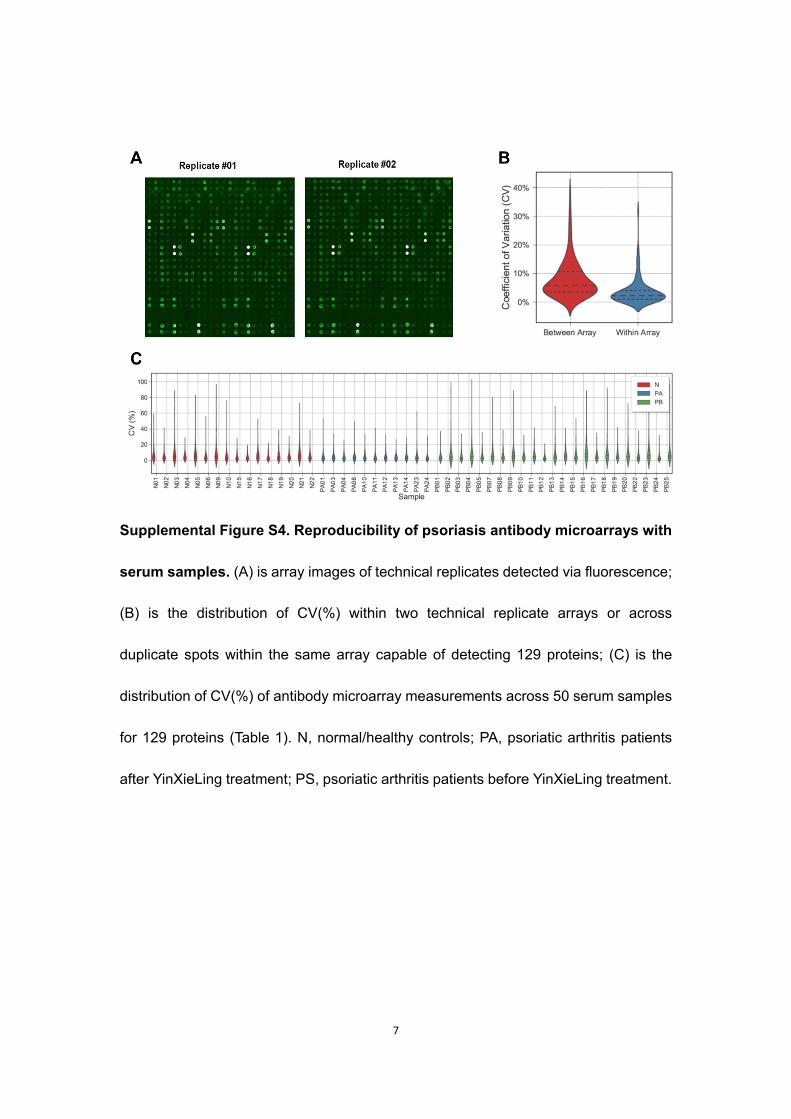
Supplemental Figure S4. Reproducibility of psoriasis antibody microarrays with
serum samples. (A) is array images of technical replicates detected via fluorescence;
(B) is the distribution of CV(%) within two technical replicate arrays or across
duplicate spots within the same array capable of detecting 129 proteins; (C) is the
distribution of CV(%) of antibody microarray measurements across 50 serum samples
for 129 proteins (Table 1). N, normal/healthy controls; PA, psoriatic arthritis patients
after YinXieLing treatment; PS, psoriatic arthritis patients before YinXieLing treatment.
8
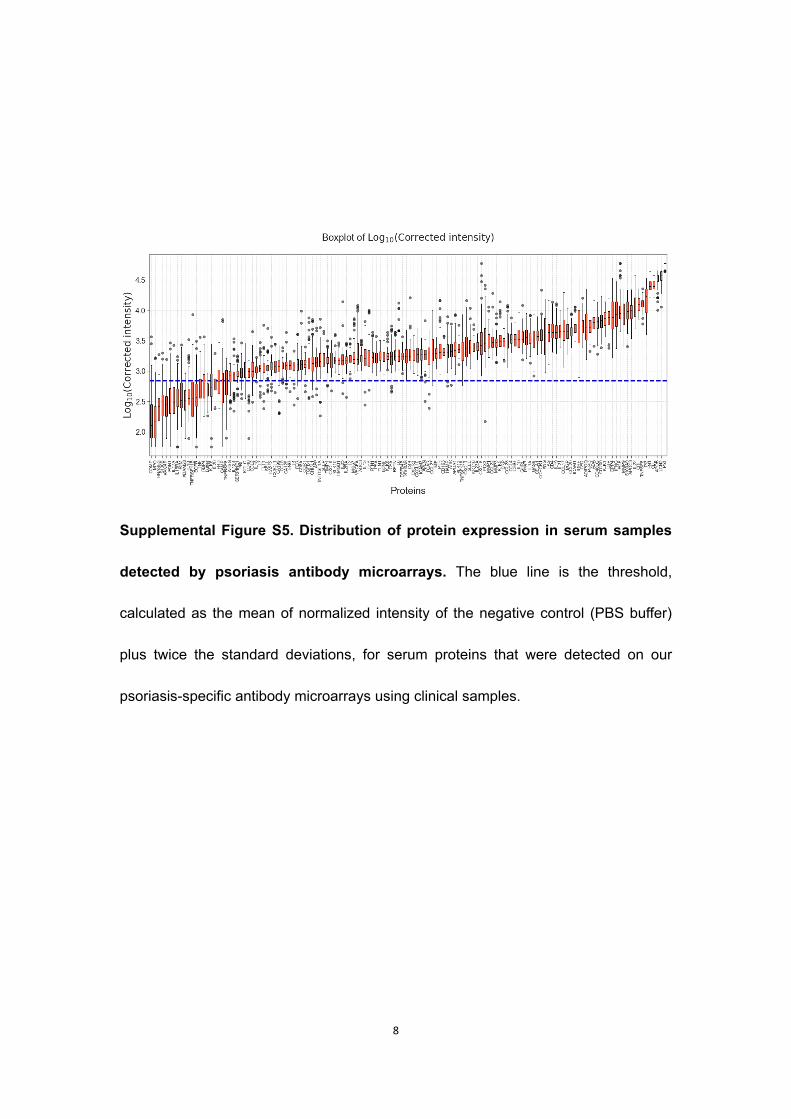
Supplemental Figure S5. Distribution of protein expression in serum samples
detected by psoriasis antibody microarrays. The blue line is the threshold,
calculated as the mean of normalized intensity of the negative control (PBS buffer)
plus twice the standard deviations, for serum proteins that were detected on our
psoriasis-specific antibody microarrays using clinical samples.
9
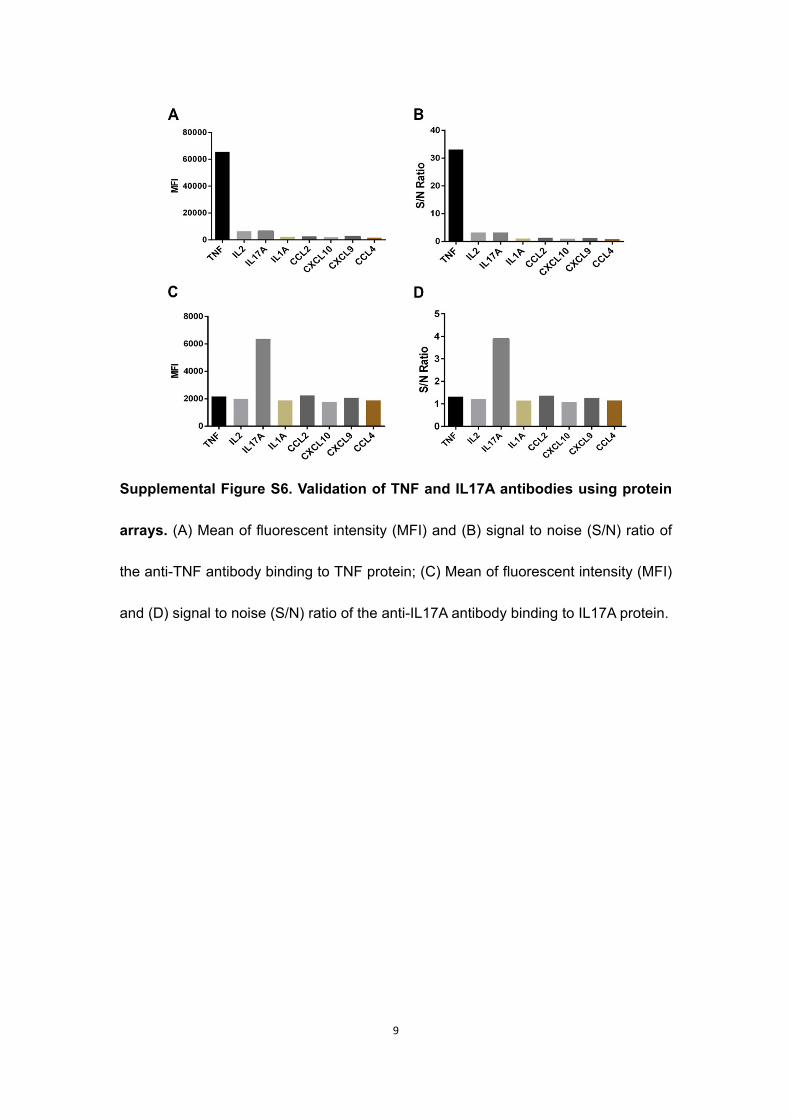
Supplemental Figure S6. Validation of TNF and IL17A antibodies using protein
arrays. (A) Mean of fluorescent intensity (MFI) and (B) signal to noise (S/N) ratio of
the anti-TNF antibody binding to TNF protein; (C) Mean of fluorescent intensity (MFI)
and (D) signal to noise (S/N) ratio of the anti-IL17A antibody binding to IL17A protein.
10
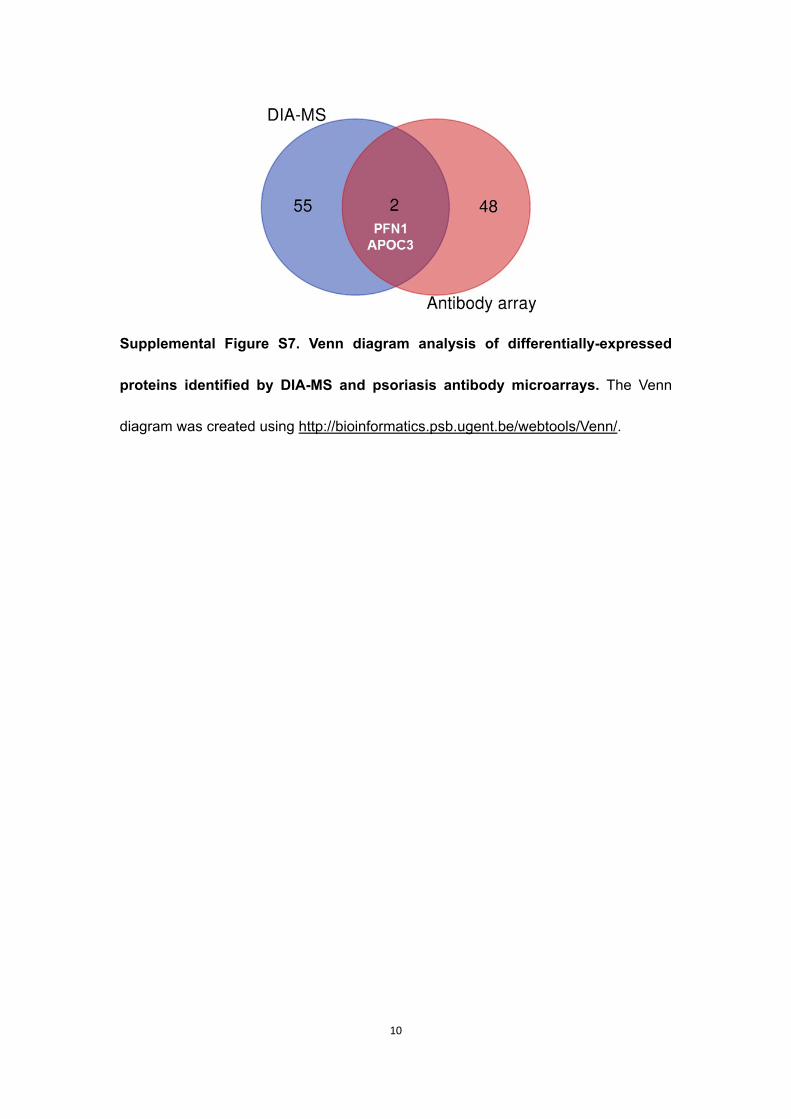
Supplemental Figure S7. Venn diagram analysis of differentially-expressed
proteins identified by DIA-MS and psoriasis antibody microarrays. The Venn
diagram was created using http://bioinformatics.psb.ugent.be/webtools/Venn/.
11
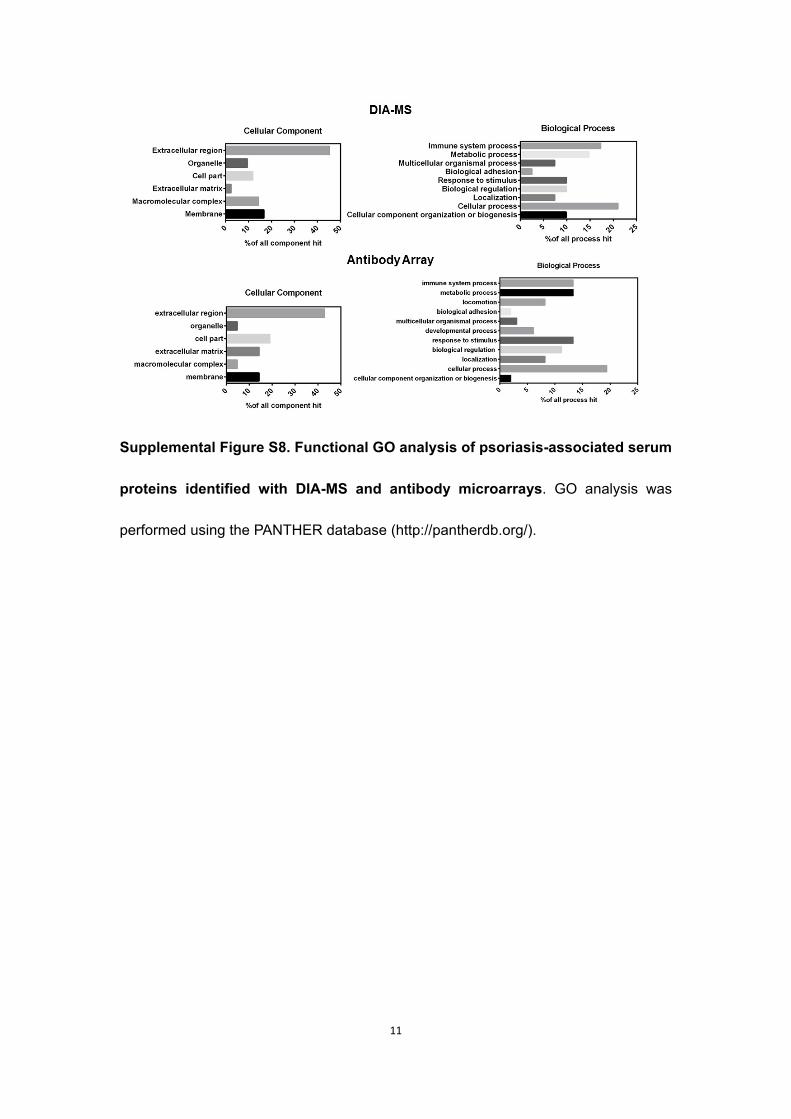
Supplemental Figure S8. Functional GO analysis of psoriasis-associated serum
proteins identified with DIA-MS and antibody microarrays. GO analysis was
performed using the PANTHER database (http://pantherdb.org/).
12
A
B
13
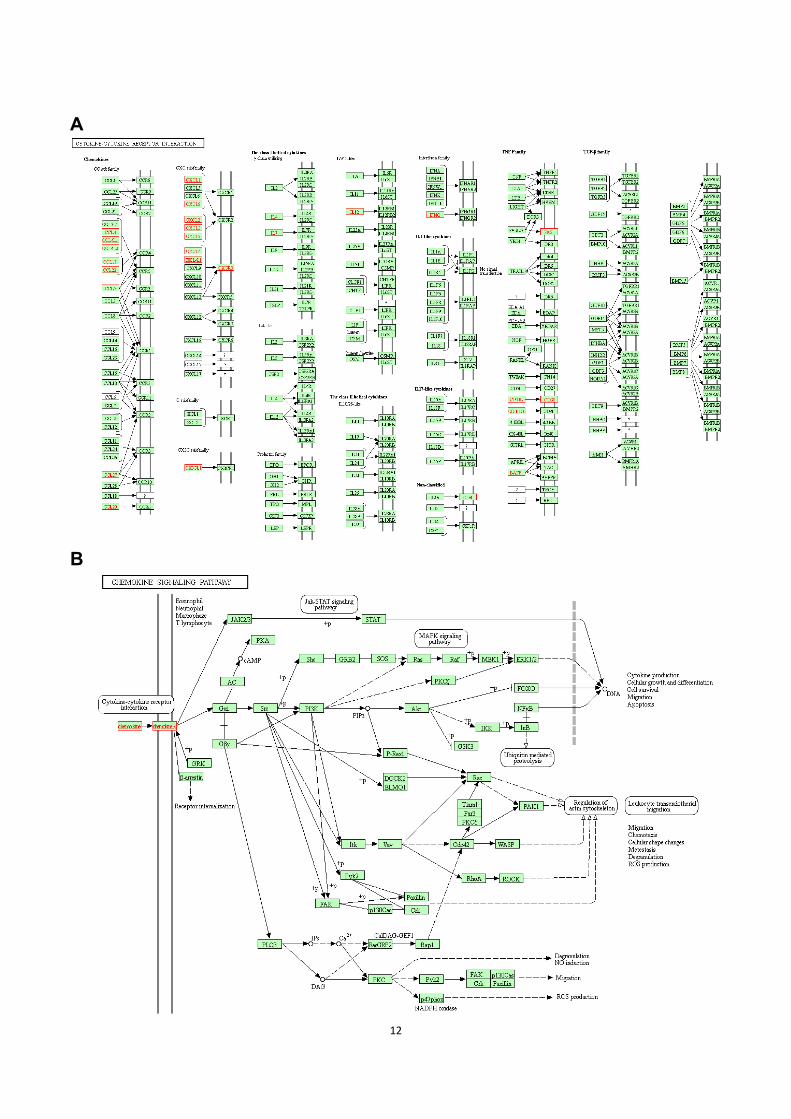
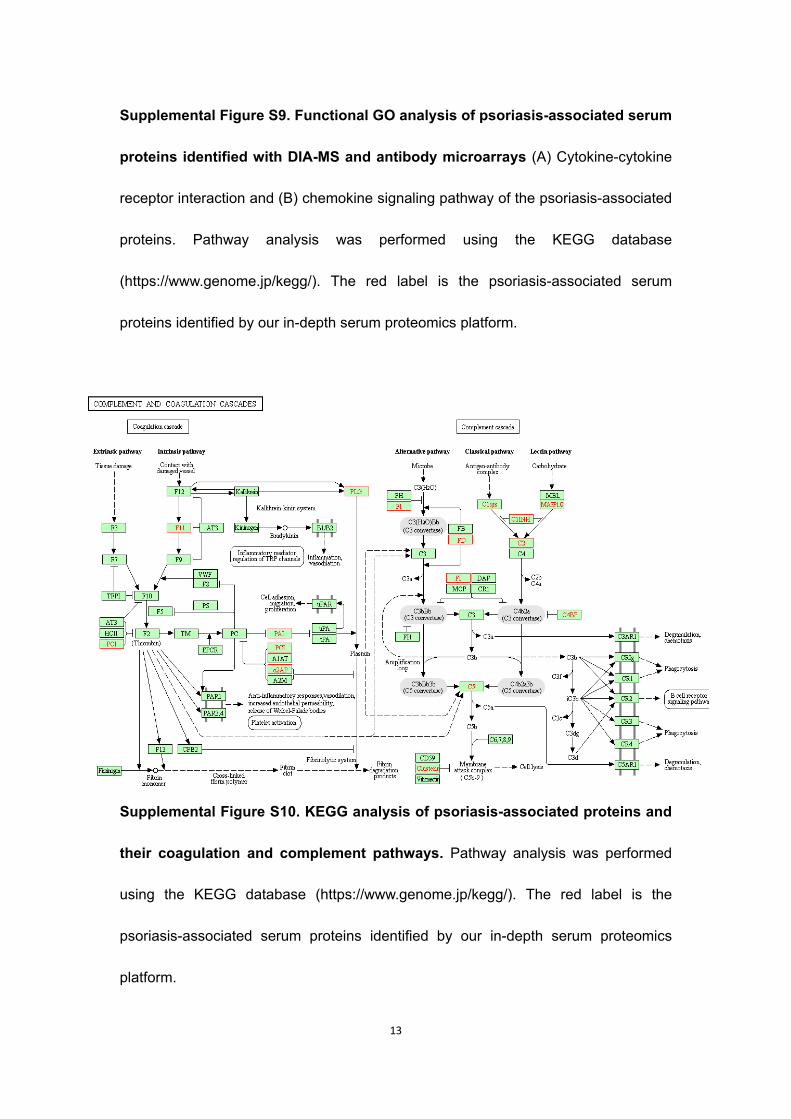
Supplemental Figure S9. Functional GO analysis of psoriasis-associated serum
proteins identified with DIA-MS and antibody microarrays (A) Cytokine-cytokine
receptor interaction and (B) chemokine signaling pathway of the psoriasis-associated
proteins. Pathway analysis was performed using the KEGG database
(https://www.genome.jp/kegg/). The red label is the psoriasis-associated serum
proteins identified by our in-depth serum proteomics platform.
Supplemental Figure S10. KEGG analysis of psoriasis-associated proteins and
their coagulation and complement pathways. Pathway analysis was performed
using the KEGG database (https://www.genome.jp/kegg/). The red label is the
psoriasis-associated serum proteins identified by our in-depth serum proteomics
platform.
14
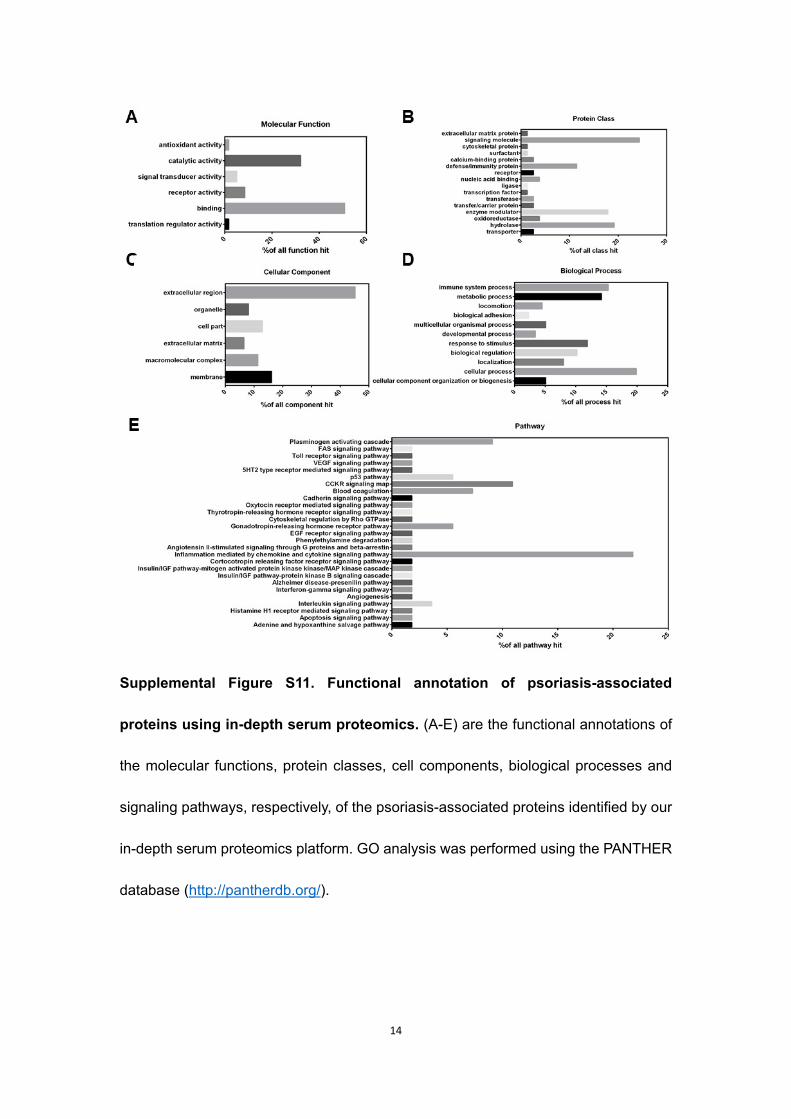
Supplemental Figure S11. Functional annotation of psoriasis-associated
proteins using in-depth serum proteomics. (A-E) are the functional annotations of
the molecular functions, protein classes, cell components, biological processes and
signaling pathways, respectively, of the psoriasis-associated proteins identified by our
in-depth serum proteomics platform. GO analysis was performed using the PANTHER
database (http://pantherdb.org/).
15
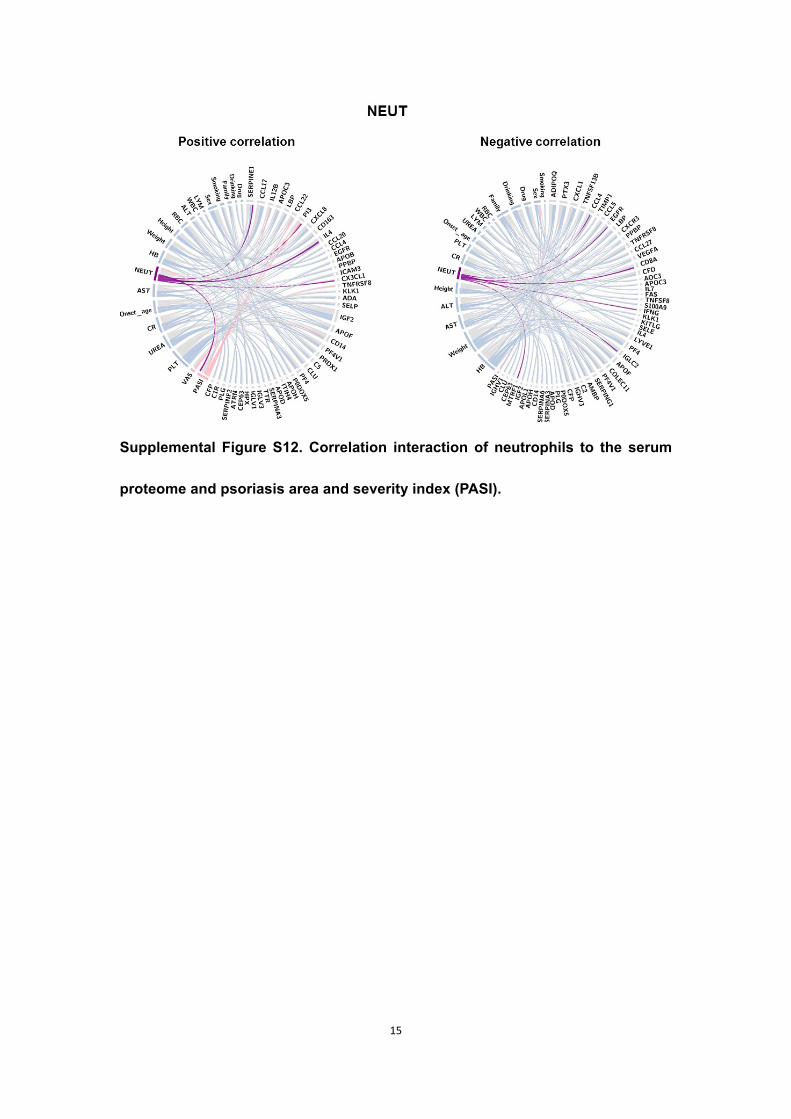
Supplemental Figure S12. Correlation interaction of neutrophils to the serum
proteome and psoriasis area and severity index (PASI).
16
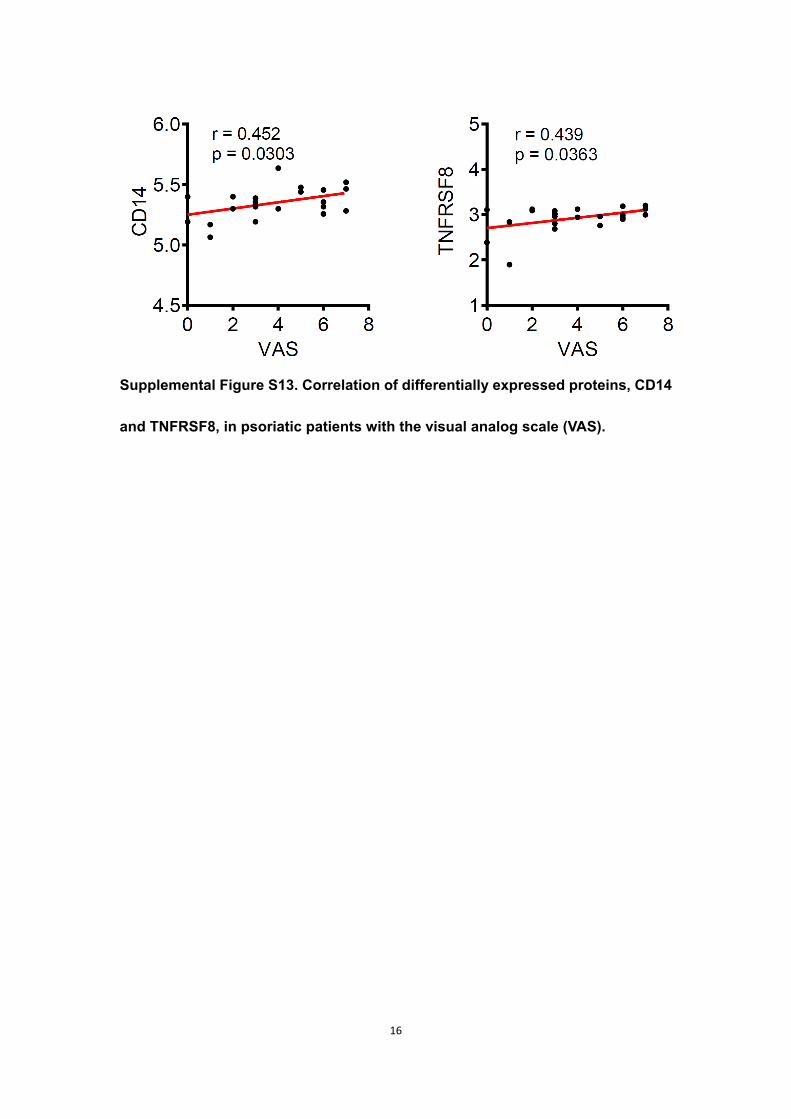
Supplemental Figure S13. Correlation of differentially expressed proteins, CD14
and TNFRSF8, in psoriatic patients with the visual analog scale (VAS).
17
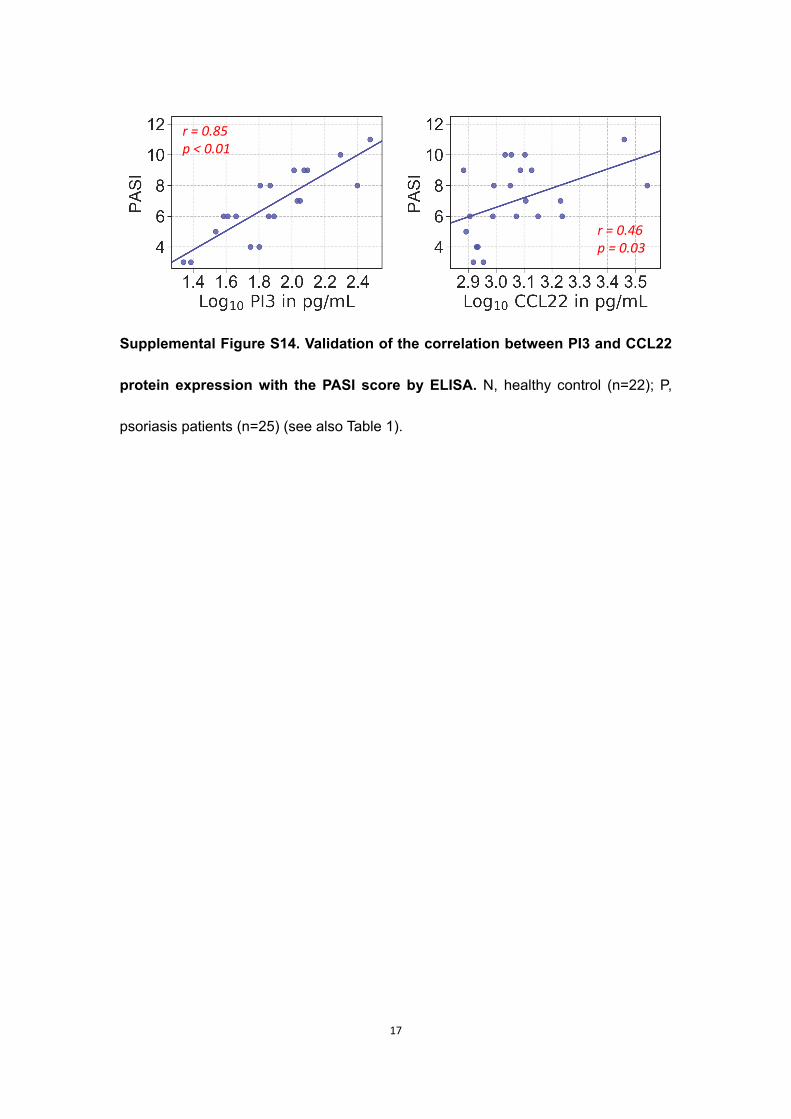
Supplemental Figure S14. Validation of the correlation between PI3 and CCL22
protein expression with the PASI score by ELISA. N, healthy control (n=22); P,
psoriasis patients (n=25) (see also Table 1).
r = 0.85p < 0.01
r = 0.46p = 0.03
18
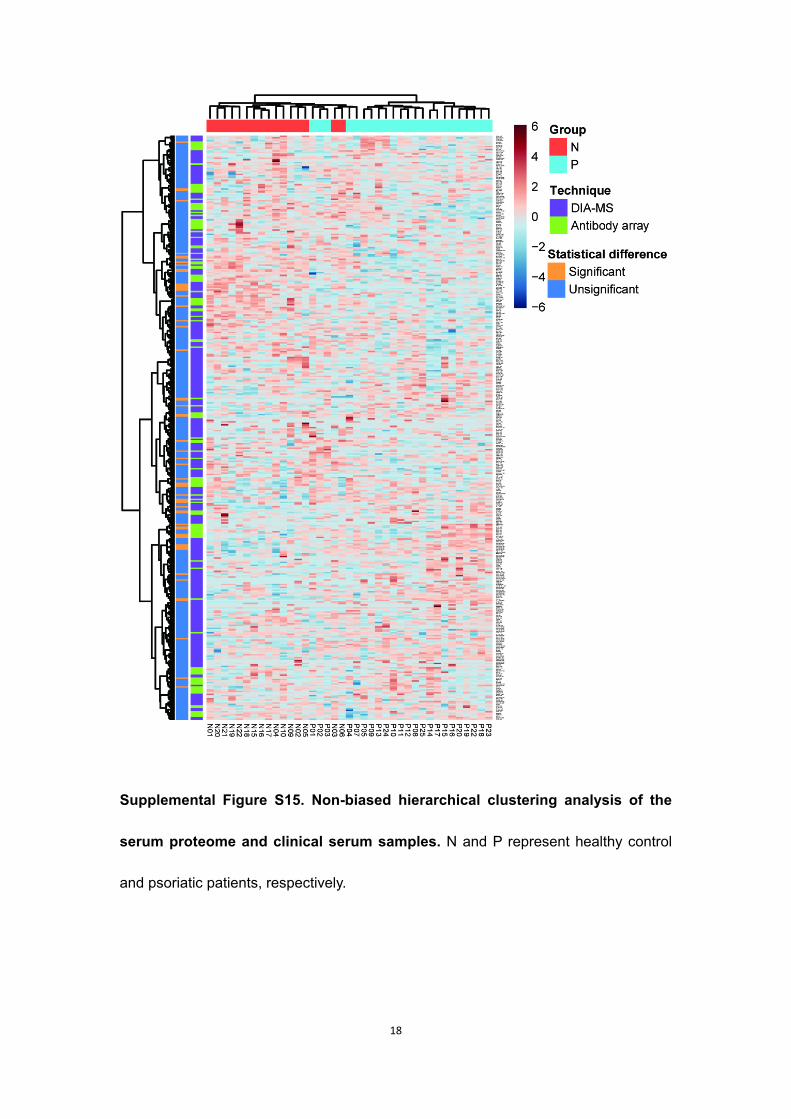
Supplemental Figure S15. Non-biased hierarchical clustering analysis of the
serum proteome and clinical serum samples. N and P represent healthy control
and psoriatic patients, respectively.
19
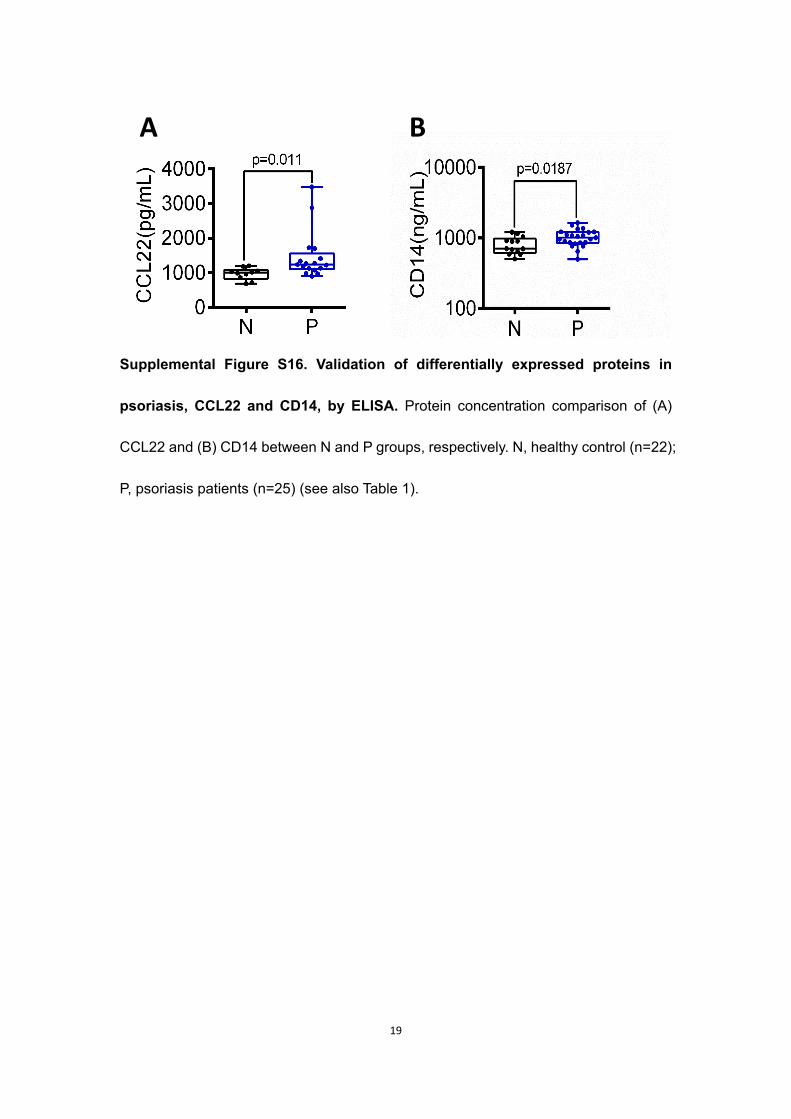
Supplemental Figure S16. Validation of differentially expressed proteins in
psoriasis, CCL22 and CD14, by ELISA. Protein concentration comparison of (A)
CCL22 and (B) CD14 between N and P groups, respectively. N, healthy control (n=22);
P, psoriasis patients (n=25) (see also Table 1).
A B
20
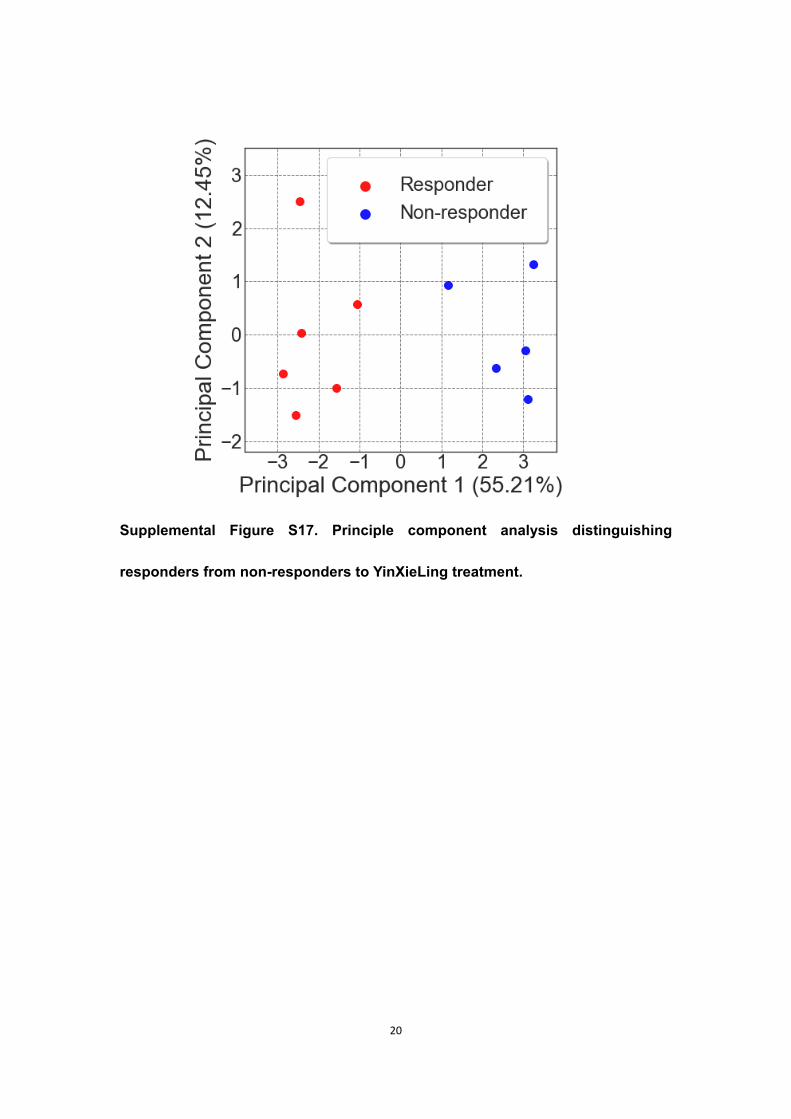
Supplemental Figure S17. Principle component analysis distinguishing
responders from non-responders to YinXieLing treatment.