Embed Size (px)
Citation preview
advances.sciencemag.org/cgi/content/full/5/1/eaau8355/DC1
Supplementary Materials for
FDISCO: Advanced solvent-based clearing method for imaging whole organs
Yisong Qi, Tingting Yu, Jianyi Xu, Peng Wan, Yilin Ma, Jingtan Zhu, Yusha Li, Hui Gong, Qingming Luo, Dan Zhu*
*Corresponding author. Email: [email protected]
Published 11 January 2019, Sci. Adv. 5, eaau8355 (2019)
DOI: 10.1126/sciadv.aau8355
The PDF file includes:
Fig. S1. Comparison of fluorescence preservation of FPs and chemical fluorescent tracers between FDISCO and other clearing methods. Fig. S2. Applicability of low temperature for increasing the endogenous fluorescence preservation of the BABB and uDISCO methods. Fig. S3. Clearing performance of FDISCO for whole organs and whole body. Fig. S4. Fluorescence imaging of the spinal cord after FDISCO, 3DISCO, and uDISCO clearing in Thy1-GFP-M mice. Fig. S5. Comparison of whole-brain imaging for Thy1-YFP-H mouse brains after FDISCO, 3DISCO, and uDISCO clearing. Fig. S6. LSFM imaging of the tdTomato-labeled whole brain after FDISCO clearing. Fig. S7. Fluorescence of RV-DsRed–labeled mouse brains cleared by FDISCO, 3DISCO, and uDISCO. Fig. S8. 3D visualization of the PRV-labeled neuronal projections in the brain by FDISCO clearing and LSFM imaging. Fig. S9. 3D visualization of AAV-labeled descending motor axons from the primary motor cortex by FDISCO clearing. Table S1. FDISCO protocols for various tissues. Legends for movies S1 to S6
Other Supplementary Material for this manuscript includes the following: (available at advances.sciencemag.org/cgi/content/full/5/1/eaau8355/DC1)
Movie S1 (.mp4 format). Imaging of FDISCO-cleared mouse brain (Thy1-GFP-M). Movie S2 (.mp4 format). 3D reconstruction and rendering of nerve branches and motor endplates in the gastrocnemius muscle. Movie S3 (.mp4 format). 3D visualization of the vasculature in the whole brain. Movie S4 (.mp4 format). Reconstruction of the glomeruli in the intact kidney. Movie S5 (.mp4 format). 3D visualization of the neurons projecting to VTA by RV injection.

Movie S6 (.mp4 format). Tracing of descending motor axons from both the left and right primary motor cortices by AAV labeling.
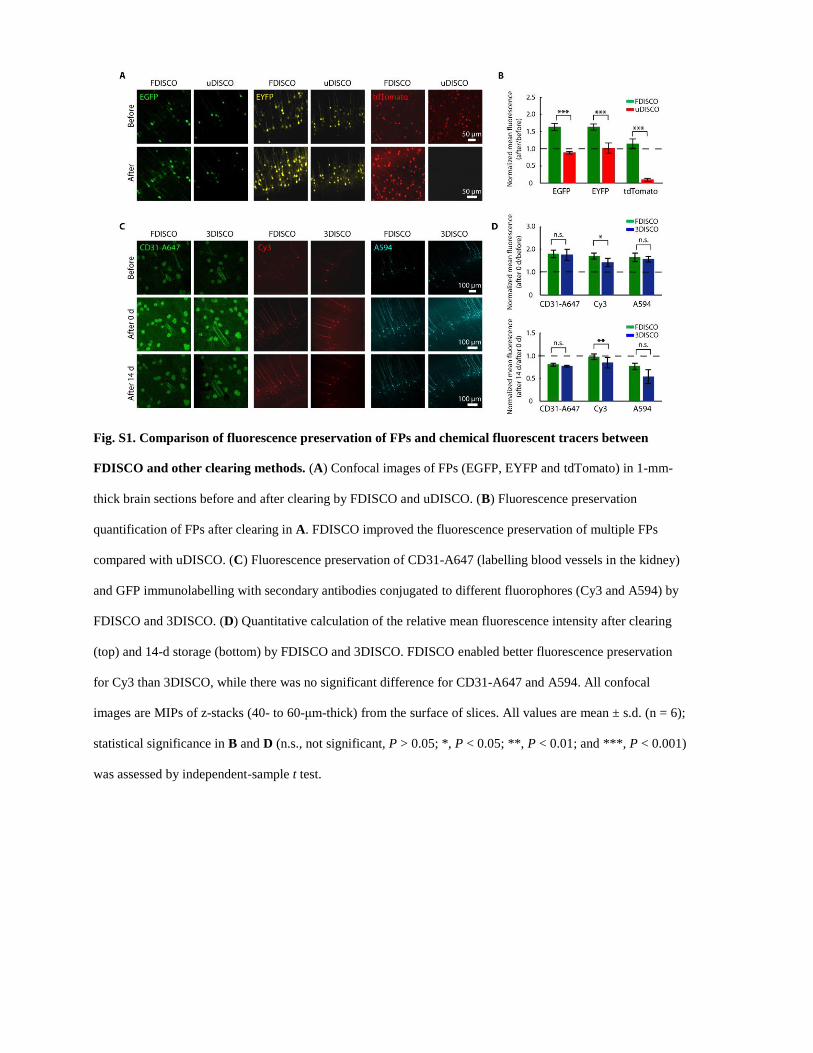
Fig. S1. Comparison of fluorescence preservation of FPs and chemical fluorescent tracers between
FDISCO and other clearing methods. (A) Confocal images of FPs (EGFP, EYFP and tdTomato) in 1-mm-
thick brain sections before and after clearing by FDISCO and uDISCO. (B) Fluorescence preservation
quantification of FPs after clearing in A. FDISCO improved the fluorescence preservation of multiple FPs
compared with uDISCO. (C) Fluorescence preservation of CD31-A647 (labelling blood vessels in the kidney)
and GFP immunolabelling with secondary antibodies conjugated to different fluorophores (Cy3 and A594) by
FDISCO and 3DISCO. (D) Quantitative calculation of the relative mean fluorescence intensity after clearing
(top) and 14-d storage (bottom) by FDISCO and 3DISCO. FDISCO enabled better fluorescence preservation
for Cy3 than 3DISCO, while there was no significant difference for CD31-A647 and A594. All confocal
images are MIPs of z-stacks (40- to 60-μm-thick) from the surface of slices. All values are mean ± s.d. (n = 6);
statistical significance in B and D (n.s., not significant, P > 0.05; *, P < 0.05; **, P < 0.01; and ***, P < 0.001)
was assessed by independent-sample t test.
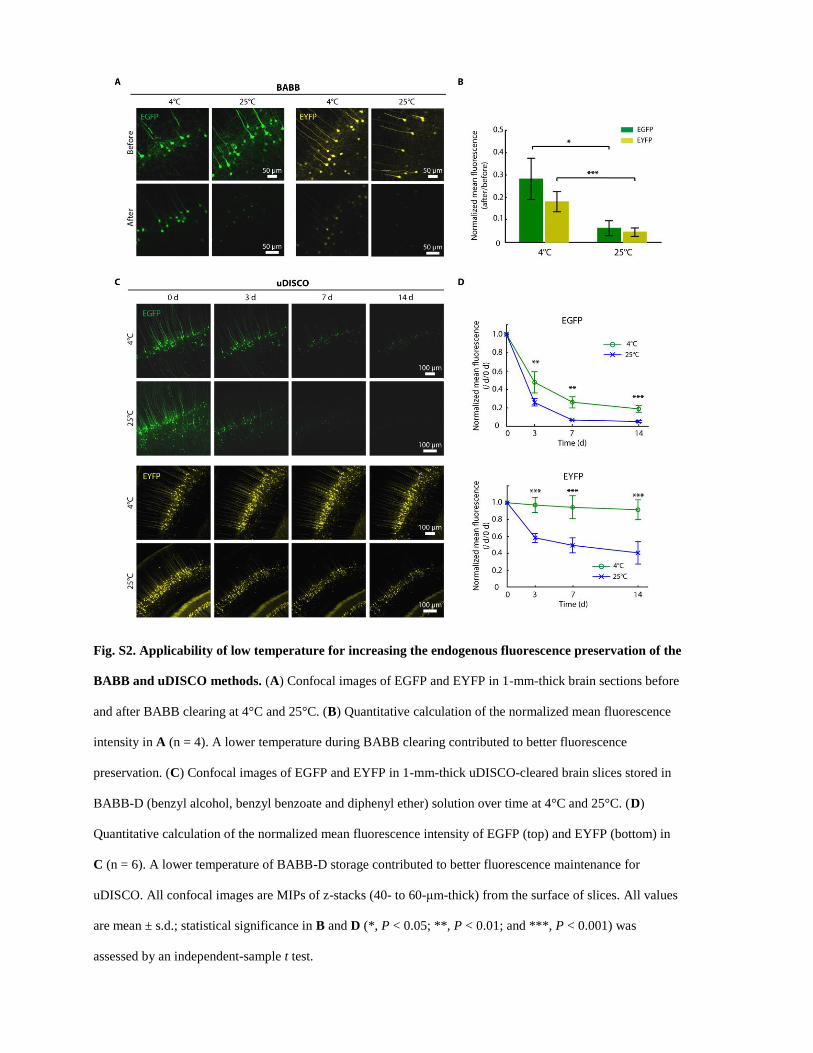
Fig. S2. Applicability of low temperature for increasing the endogenous fluorescence preservation of the
BABB and uDISCO methods. (A) Confocal images of EGFP and EYFP in 1-mm-thick brain sections before
and after BABB clearing at 4°C and 25°C. (B) Quantitative calculation of the normalized mean fluorescence
intensity in A (n = 4). A lower temperature during BABB clearing contributed to better fluorescence
preservation. (C) Confocal images of EGFP and EYFP in 1-mm-thick uDISCO-cleared brain slices stored in
BABB-D (benzyl alcohol, benzyl benzoate and diphenyl ether) solution over time at 4°C and 25°C. (D)
Quantitative calculation of the normalized mean fluorescence intensity of EGFP (top) and EYFP (bottom) in
C (n = 6). A lower temperature of BABB-D storage contributed to better fluorescence maintenance for
uDISCO. All confocal images are MIPs of z-stacks (40- to 60-μm-thick) from the surface of slices. All values
are mean ± s.d.; statistical significance in B and D (*, P < 0.05; **, P < 0.01; and ***, P < 0.001) was
assessed by an independent-sample t test.
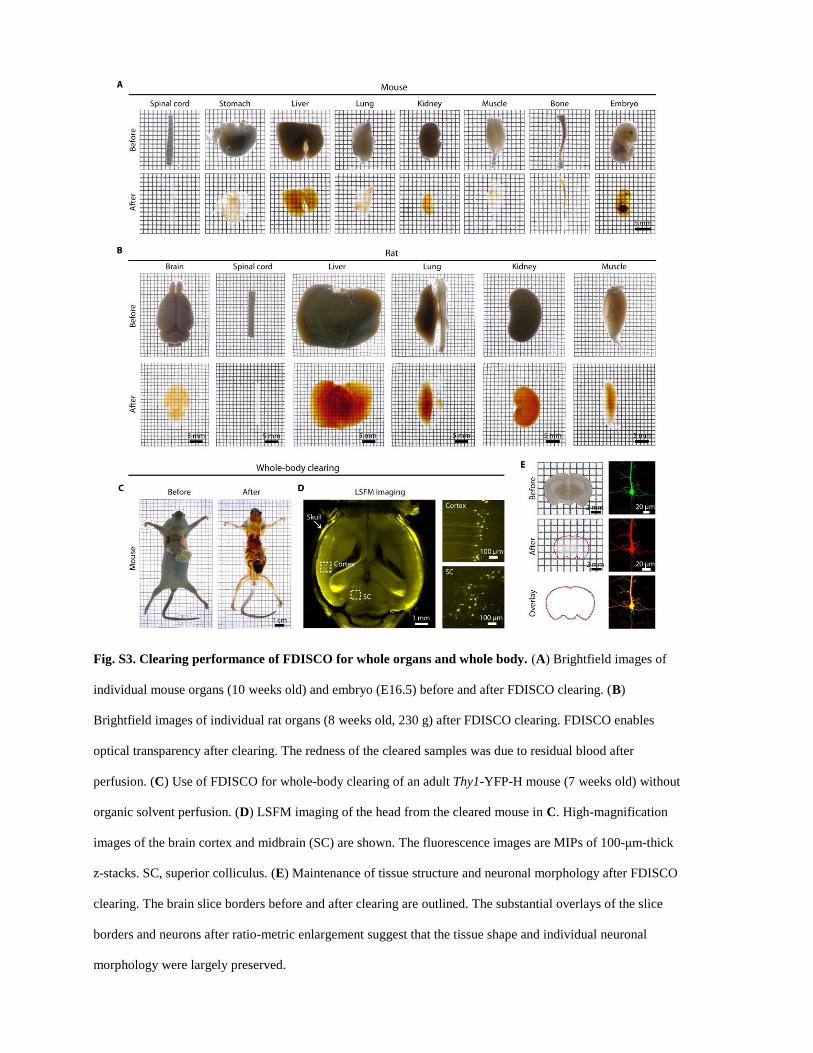
Fig. S3. Clearing performance of FDISCO for whole organs and whole body. (A) Brightfield images of
individual mouse organs (10 weeks old) and embryo (E16.5) before and after FDISCO clearing. (B)
Brightfield images of individual rat organs (8 weeks old, 230 g) after FDISCO clearing. FDISCO enables
optical transparency after clearing. The redness of the cleared samples was due to residual blood after
perfusion. (C) Use of FDISCO for whole-body clearing of an adult Thy1-YFP-H mouse (7 weeks old) without
organic solvent perfusion. (D) LSFM imaging of the head from the cleared mouse in C. High-magnification
images of the brain cortex and midbrain (SC) are shown. The fluorescence images are MIPs of 100-μm-thick
z-stacks. SC, superior colliculus. (E) Maintenance of tissue structure and neuronal morphology after FDISCO
clearing. The brain slice borders before and after clearing are outlined. The substantial overlays of the slice
borders and neurons after ratio-metric enlargement suggest that the tissue shape and individual neuronal
morphology were largely preserved.
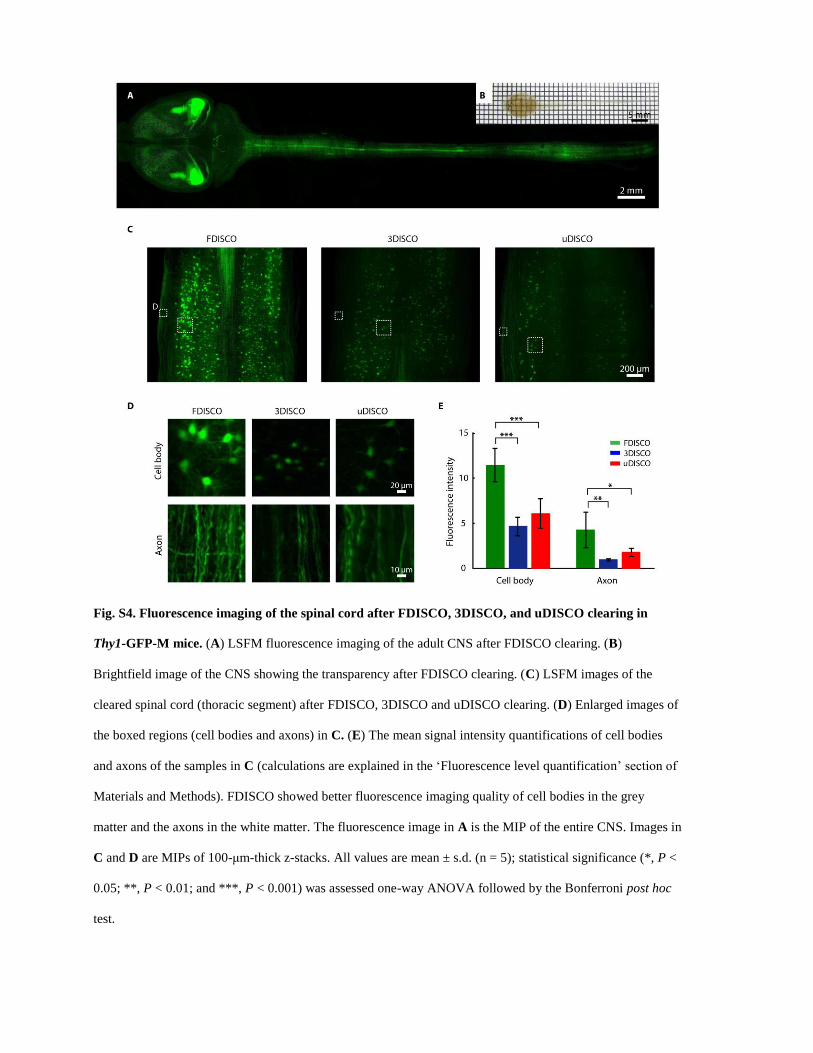
Fig. S4. Fluorescence imaging of the spinal cord after FDISCO, 3DISCO, and uDISCO clearing in
Thy1-GFP-M mice. (A) LSFM fluorescence imaging of the adult CNS after FDISCO clearing. (B)
Brightfield image of the CNS showing the transparency after FDISCO clearing. (C) LSFM images of the
cleared spinal cord (thoracic segment) after FDISCO, 3DISCO and uDISCO clearing. (D) Enlarged images of
the boxed regions (cell bodies and axons) in C. (E) The mean signal intensity quantifications of cell bodies
and axons of the samples in C (calculations are explained in the ‘Fluorescence level quantification’ section of
Materials and Methods). FDISCO showed better fluorescence imaging quality of cell bodies in the grey
matter and the axons in the white matter. The fluorescence image in A is the MIP of the entire CNS. Images in
C and D are MIPs of 100-μm-thick z-stacks. All values are mean ± s.d. (n = 5); statistical significance (*, P <
0.05; **, P < 0.01; and ***, P < 0.001) was assessed one-way ANOVA followed by the Bonferroni post hoc
test.
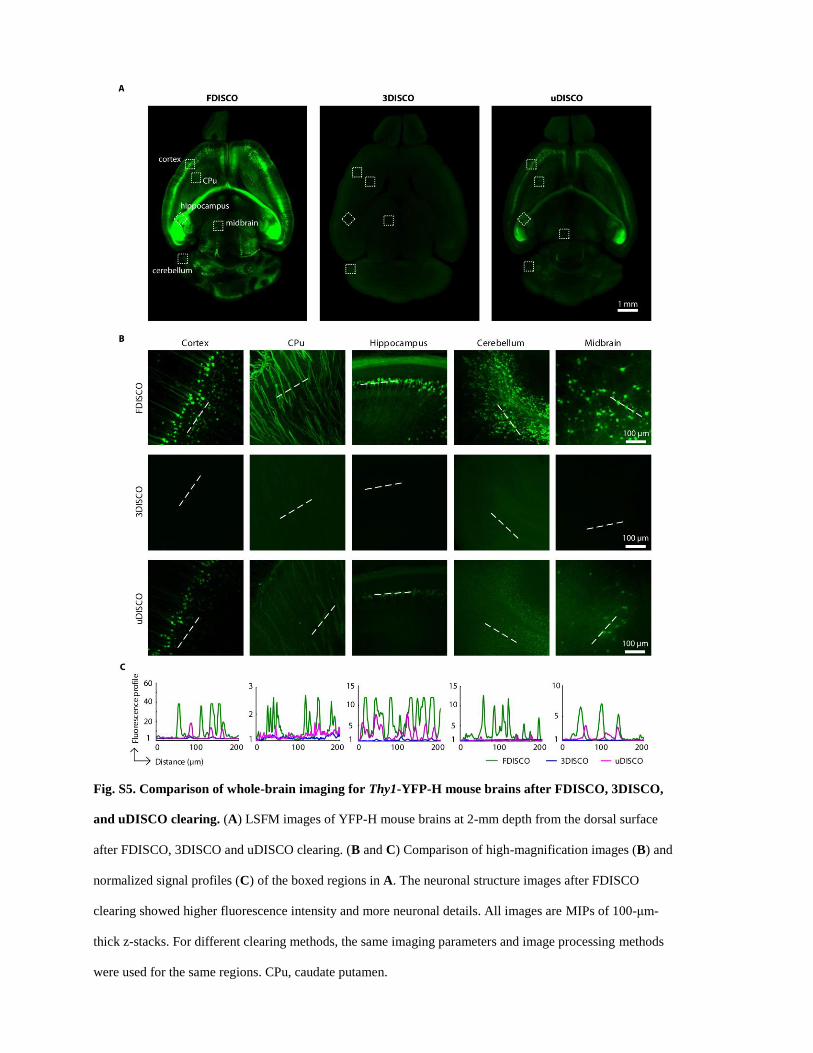
Fig. S5. Comparison of whole-brain imaging for Thy1-YFP-H mouse brains after FDISCO, 3DISCO,
and uDISCO clearing. (A) LSFM images of YFP-H mouse brains at 2-mm depth from the dorsal surface
after FDISCO, 3DISCO and uDISCO clearing. (B and C) Comparison of high-magnification images (B) and
normalized signal profiles (C) of the boxed regions in A. The neuronal structure images after FDISCO
clearing showed higher fluorescence intensity and more neuronal details. All images are MIPs of 100-μm-
thick z-stacks. For different clearing methods, the same imaging parameters and image processing methods
were used for the same regions. CPu, caudate putamen.
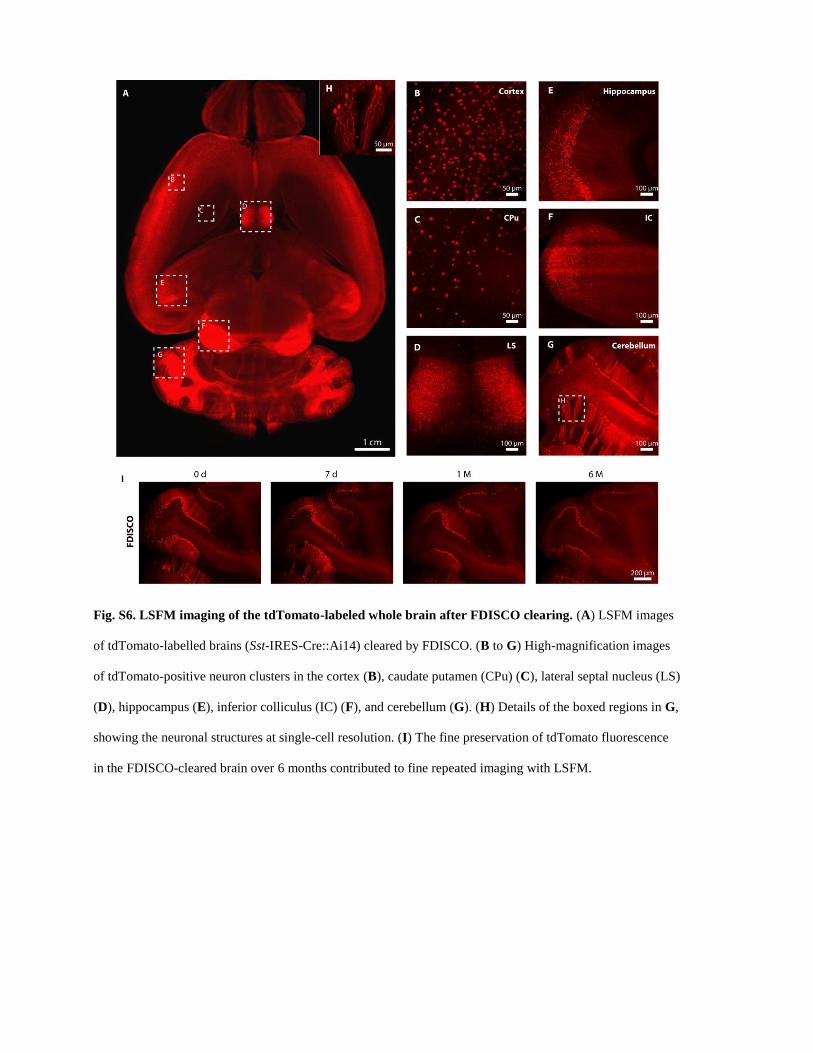
Fig. S6. LSFM imaging of the tdTomato-labeled whole brain after FDISCO clearing. (A) LSFM images
of tdTomato-labelled brains (Sst-IRES-Cre::Ai14) cleared by FDISCO. (B to G) High-magnification images
of tdTomato-positive neuron clusters in the cortex (B), caudate putamen (CPu) (C), lateral septal nucleus (LS)
(D), hippocampus (E), inferior colliculus (IC) (F), and cerebellum (G). (H) Details of the boxed regions in G,
showing the neuronal structures at single-cell resolution. (I) The fine preservation of tdTomato fluorescence
in the FDISCO-cleared brain over 6 months contributed to fine repeated imaging with LSFM.
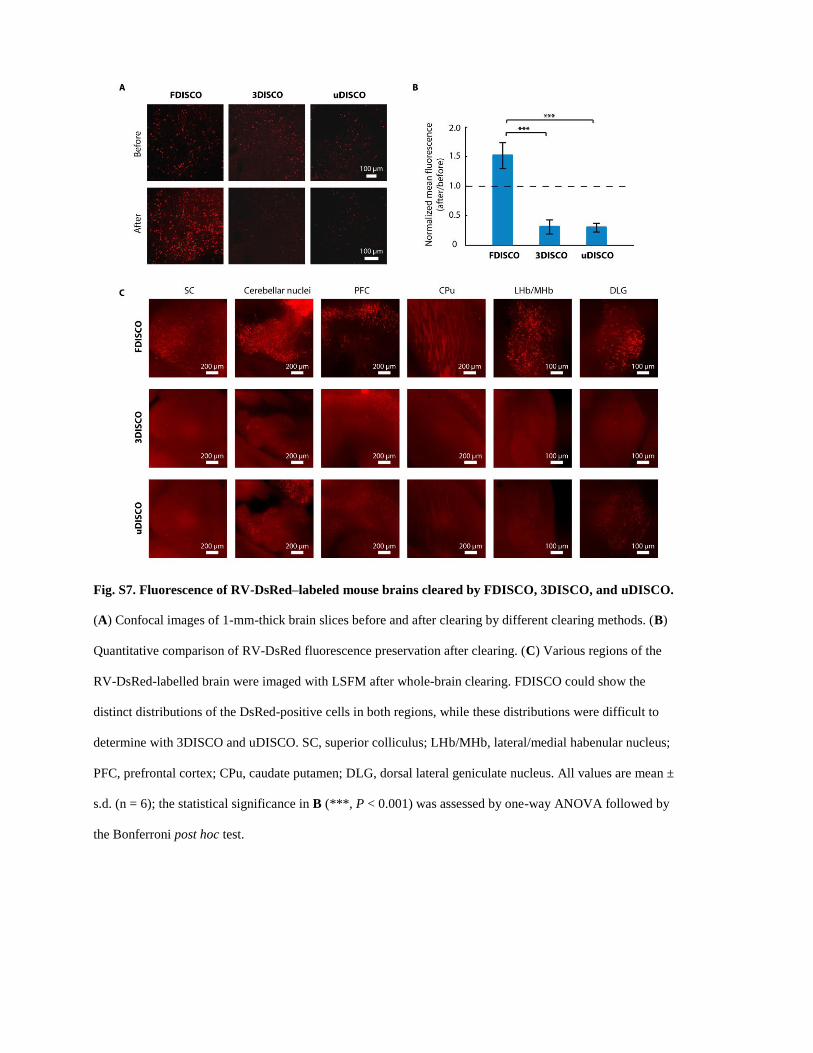
Fig. S7. Fluorescence of RV-DsRed–labeled mouse brains cleared by FDISCO, 3DISCO, and uDISCO.
(A) Confocal images of 1-mm-thick brain slices before and after clearing by different clearing methods. (B)
Quantitative comparison of RV-DsRed fluorescence preservation after clearing. (C) Various regions of the
RV-DsRed-labelled brain were imaged with LSFM after whole-brain clearing. FDISCO could show the
distinct distributions of the DsRed-positive cells in both regions, while these distributions were difficult to
determine with 3DISCO and uDISCO. SC, superior colliculus; LHb/MHb, lateral/medial habenular nucleus;
PFC, prefrontal cortex; CPu, caudate putamen; DLG, dorsal lateral geniculate nucleus. All values are mean ±
s.d. (n = 6); the statistical significance in B (***, P < 0.001) was assessed by one-way ANOVA followed by
the Bonferroni post hoc test.
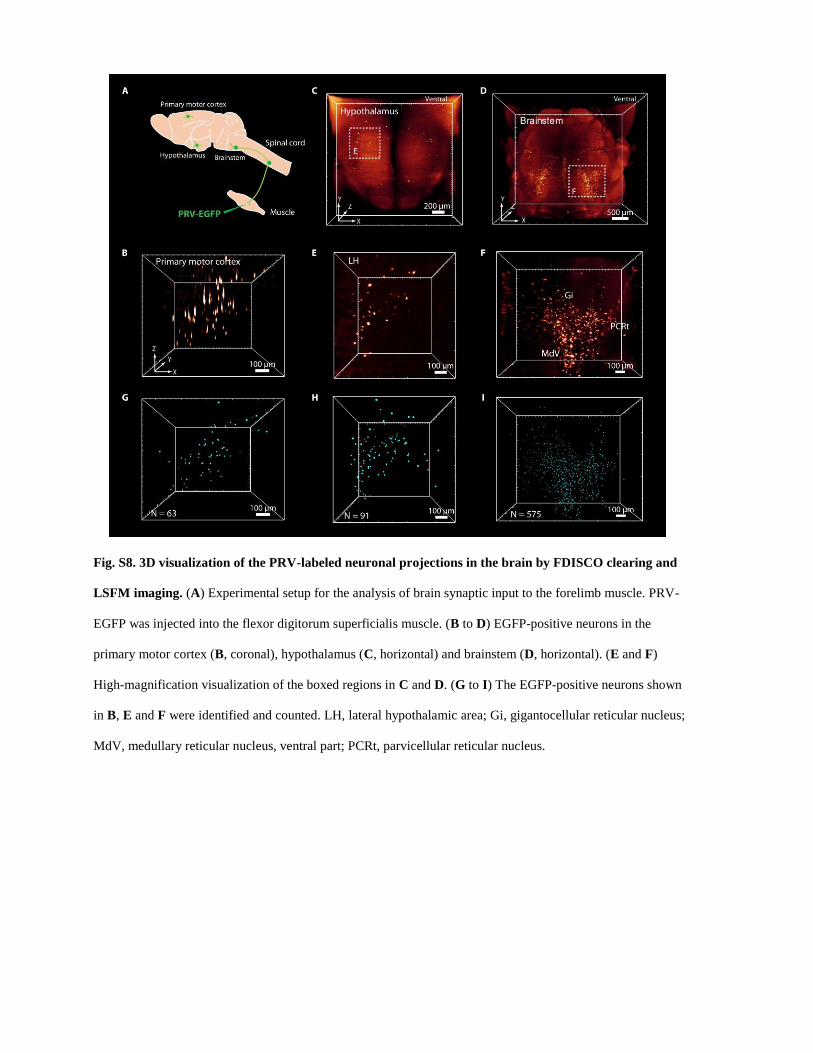
Fig. S8. 3D visualization of the PRV-labeled neuronal projections in the brain by FDISCO clearing and
LSFM imaging. (A) Experimental setup for the analysis of brain synaptic input to the forelimb muscle. PRV-
EGFP was injected into the flexor digitorum superficialis muscle. (B to D) EGFP-positive neurons in the
primary motor cortex (B, coronal), hypothalamus (C, horizontal) and brainstem (D, horizontal). (E and F)
High-magnification visualization of the boxed regions in C and D. (G to I) The EGFP-positive neurons shown
in B, E and F were identified and counted. LH, lateral hypothalamic area; Gi, gigantocellular reticular nucleus;
MdV, medullary reticular nucleus, ventral part; PCRt, parvicellular reticular nucleus.
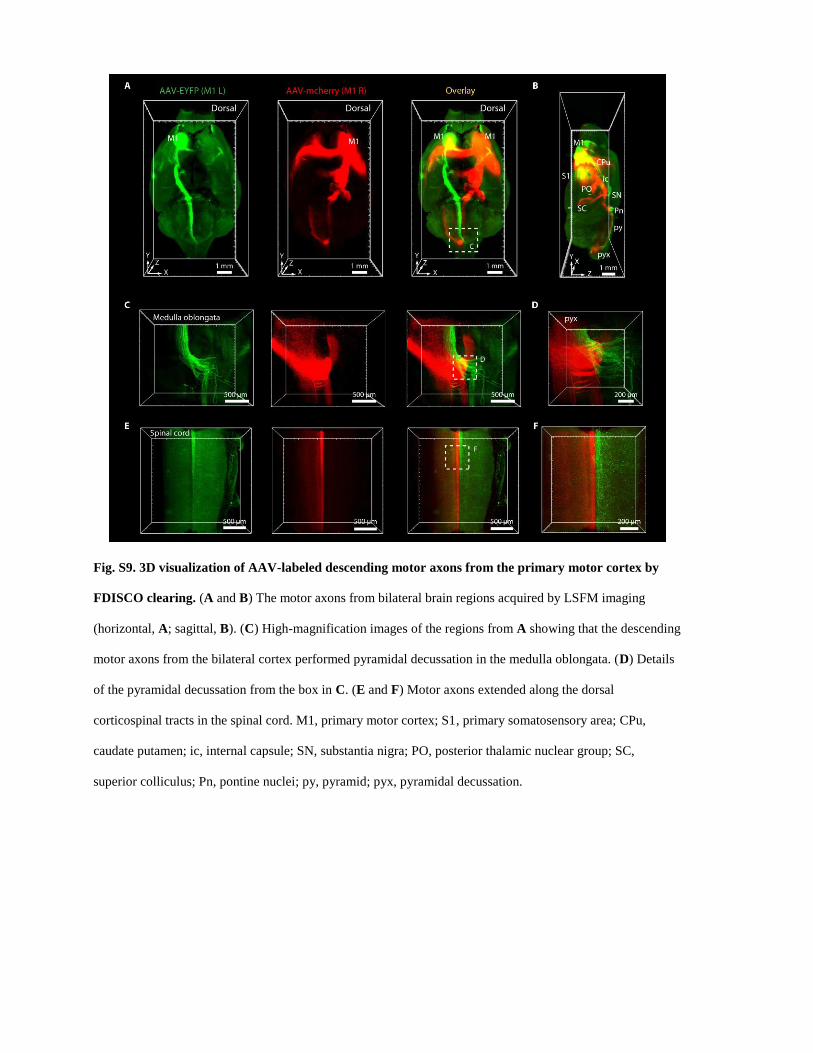
Fig. S9. 3D visualization of AAV-labeled descending motor axons from the primary motor cortex by
FDISCO clearing. (A and B) The motor axons from bilateral brain regions acquired by LSFM imaging
(horizontal, A; sagittal, B). (C) High-magnification images of the regions from A showing that the descending
motor axons from the bilateral cortex performed pyramidal decussation in the medulla oblongata. (D) Details
of the pyramidal decussation from the box in C. (E and F) Motor axons extended along the dorsal
corticospinal tracts in the spinal cord. M1, primary motor cortex; S1, primary somatosensory area; CPu,
caudate putamen; ic, internal capsule; SN, substantia nigra; PO, posterior thalamic nuclear group; SC,
superior colliculus; Pn, pontine nuclei; py, pyramid; pyx, pyramidal decussation.
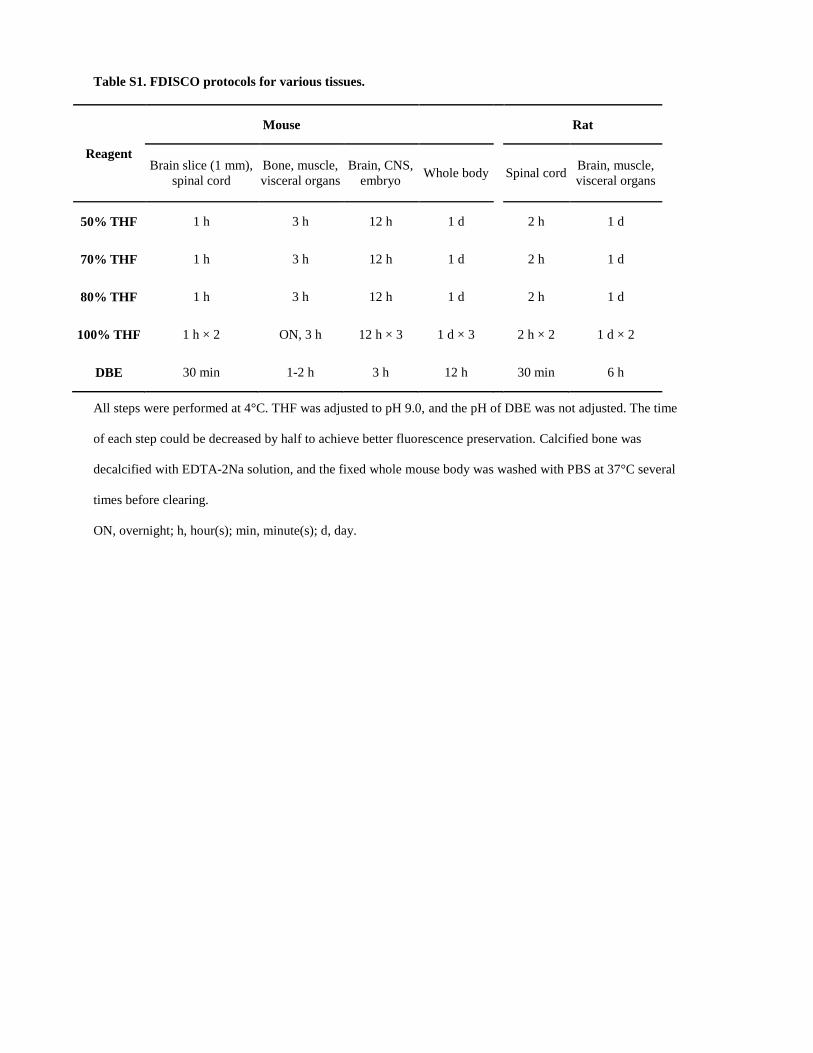
Table S1. FDISCO protocols for various tissues.
Reagent
Mouse Rat
Brain slice (1 mm),
spinal cord
Bone, muscle,
visceral organs
Brain, CNS,
embryo Whole body Spinal cord
Brain, muscle,
visceral organs
50% THF 1 h 3 h 12 h 1 d 2 h 1 d
70% THF 1 h 3 h 12 h 1 d 2 h 1 d
80% THF 1 h 3 h 12 h 1 d 2 h 1 d
100% THF 1 h × 2 ON, 3 h 12 h × 3 1 d × 3 2 h × 2 1 d × 2
DBE 30 min 1-2 h 3 h 12 h 30 min 6 h
All steps were performed at 4°C. THF was adjusted to pH 9.0, and the pH of DBE was not adjusted. The time
of each step could be decreased by half to achieve better fluorescence preservation. Calcified bone was
decalcified with EDTA-2Na solution, and the fixed whole mouse body was washed with PBS at 37°C several
times before clearing.
ON, overnight; h, hour(s); min, minute(s); d, day.
Movie S1. Imaging of FDISCO-cleared mouse brain (Thy1-GFP-M). Data correspond to Fig. 4
Movie S2. 3D reconstruction and rendering of nerve branches and motor endplates in the
gastrocnemius muscle. Data correspond to Fig. 4
Movie S3. 3D visualization of the vasculature in the whole brain. Data correspond to Fig. 5
Movie S4. Reconstruction of the glomeruli in the intact kidney. Data correspond to Fig. 5
Movie S5. 3D visualization of the neurons projecting to VTA by RV injection. Data correspond to Fig. 6
Movie S6. Tracing of descending motor axons from both the left and right primary motor cortices by
AAV labelling. Data correspond to fig. S9