Embed Size (px)
Citation preview
Basel III Introduction, including Basel III Implementation Pages 1 - 2
Regulatory Capital - Highlights Page 3
Regulatory Capital - Definition of Capital Components Page 4
Consolidated Balance Sheet: Source of Definition of Capital Components Page 5
Balance Sheet Asset Categories Cross-Referenced to Credit Risk Exposures Page 6
Flow Statement for Regulatory Capital Page 7
Regulatory Capital - Prior Periods Page 8
Risk-weighted Assets and Capital Ratios Page 9
Movement of Risk-weighted Assets by Risk Type (All-in Basis) Page 10
Risk-weighted Assets Arising from the Activities of the Bank's Businesses Page 11
Exposure at Default and Risk-weighted Assets for Credit Risk Portfolios Pages 12 - 13
Credit Risk Exposures by Geography Page 14
AIRB Credit Risk Exposures by Maturity Page 15
Standardized Credit Risk Exposures by Risk-weight Page 16
Risk Assessment of Credit Risk Exposures - Non-retail AIRB Portfolio Pages 17 - 18
Risk Assessment of Credit Risk Exposures - Retail AIRB Portfolio Pages 19 - 20
AIRB Credit Losses Page 21
Estimated and Actual Loss Parameters - Non-retail and Retail AIRB Portfolios Page 22
Credit Risk Mitigation Page 23
Derivatives - Counterparty Credit Risk Page 24
Risk-weighted Assets for Securitization Exposures - Banking Book Pages 25 - 26
Total Market Risk-weighted Assets Pages 27
Leverage Ratio and Exposures Pages 28 - 30
Glossary Pages 31
SUPPLEMENTARY REGULATORY CAPITAL DISCLOSURE
January 31, 2016
Table of Contents
For further information contact: Jake Lawrence - (416) 866-5712 or Steven Hung - (416) 933-8774
BASEL III INTRODUCTION
Effective November 1, 2012, Canadian banks are subject to the revised capital adequacy requirements as published by the Basel Committee on Banking Supervision (BCBS) and commonly referred to as Basel III. Basel lII builds on the “International Convergence of Capital Measurement and Capital Standards: A Revised Framework” (Basel II). Refer to page 2 "Basel III Implementation" for further details. The Basel III Framework is composed of three Pillars: • Pillar 1 – the actual methodologies that must be applied to calculate the minimum capital
requirements. • Pillar 2 – the requirement that banks have internal processes to assess their capital adequacy
in relation to their strategies, risk appetite and actual risk profile. Regulators are expected to review these internal capital adequacy assessments.
• Pillar 3 – reflects the market disclosures required by banks to assist users of the information to better understand the risk profile.
This Appendix reflects the Pillar 3 market disclosures based on information gathered as part of the Pillar 1 process, and should assist users in understanding the changes to the risk-weighted assets and capital requirements. Basel III classifies risk into three broad categories: credit risk, market risk and operational risk. Under Pillar 1 of the Basel III Framework, minimum capital for these three risks is calculated using one of the following approaches: • Credit risk capital – Internal Ratings Based Approach (Advanced or Foundation) or
Standardized Approach. • Operational risk capital – Advanced Measurement Approach (AMA), Standardized Approach
or Basic Indicator Approach. • Market risk capital - Internal models or Standardized Approach. Credit Risk The credit risk component consists of on- and off- balance sheet claims. The Basel III rules are not applied to traditional balance sheet categories but to categories of on- and off- balance sheet exposures which represent general classes of assets/exposures (Corporate, Sovereign, Bank, Retail and Equity) based on their different underlying risk characteristics. Generally, while calculating capital requirements, exposure types such as Corporate, Sovereign, Bank, Retail and Equity are analyzed by the following credit risk exposure sub-types: Drawn, Undrawn, Repo-style Transactions, Over-the-counter (OTC) Derivatives, Exchange Traded Derivatives and Other Off-balance Sheet claims. The Bank uses the Advanced Internal Ratings Based (AIRB) approach, for credit risk in its material Canadian, US and European portfolios and for a significant portion of international corporate and commercial portfolios. The Bank uses internal estimates, based on historical experience, for probability of default (PD), loss given default (LGD) and exposure at default (EAD).
• Under the AIRB approach, credit risk risk-weighted assets (RWA) are calculated by multiplying the capital
requirement (K) by EAD times 12.5, where K is a function of the PD, LGD, maturity and prescribed correlation factors. This results in the capital calculations being more sensitive to underlying risks.
• Risk-weights for exposures which fall under the securitization framework are computed under the Ratings-Based Approach (RBA). Risk-weights depend on the external rating grades given by two of the external credit assessment institutions (ECAI): S&P, Moody's and DBRS.
• A multiplier of 1.25 is applied to the correlation parameter of all exposures to all unregulated Financial Institutions, and regulated Financial Institutions with assets of at least US$100 billion.
• Exchange-traded derivatives which previously were excluded from the capital calculation under Basel II are risk-weighted under Basel III.
• An overall scaling factor of 6% is added to the credit risk RWA for all AIRB portfolios. For the remaining portfolios, the Standardized Approach is used to compute credit risk.
• The Standardized Approach applies regulator prescribed risk weight factors to credit exposures based on the external credit assessments (public ratings), where available, and also considers other additional factors (e.g. provision levels for defaulted exposures, loan-to-value for retail, eligible collateral, etc.).
Operational Risk The Bank uses the Standardized Approach for operational risk, where the capital charge is based on a fixed percentage of the average of the previous three years’ gross income. The fixed percentages range from 12% - 18% and are based on the type of business, with retail banking activities at the low end of the range and investment banking and capital markets activities at the high end. Market Risk The Bank uses both internal models and standardized approaches to calculate market risk capital. Commencing Q1 2012, the Bank implemented additional market risk measures in accordance with Basel's Revisions of the Basel III market risk framework (July 2009). Additional measures include stressed value-at-risk, incremental risk charge and comprehensive risk measure. IFRS Effective Q1 2012, all amounts reflect the adoption of IFRS. Effective Q1 2014, all amounts reflect the adoption of new accounting standards, IFRS10 (Consolidated Financial Statements) and IAS19R (Employee Benefits). Prior period amounts have not been restated for IFRS, Basel III and IFRS10/IAS19R as they represent the actual amounts reported in that period for regulatory purposes. This "Supplementary Regulatory Capital Disclosure" has been updated to reflect OSFI’s Advisory, “Required Public Disclosure Requirements related to Basel III Pillar 3” (issued July 2, 2013), effective Q3 2013 for all D-SIBs. The main features template that sets out a summary of information on the terms and conditions of the main features of all capital instruments is posted on the Bank's website as follows: http://www.scotiabank.com/ca/en/0,,3066,00.htm
Page 1
BASEL III IMPLEMENTATION
Canadian banks are subject to the revised capital adequacy requirements as published by the Basel Committee on Banking Supervision (BCBS) - commonly referred to as Basel III - effective November 1, 2012. Basel lII builds on the “International Convergence of Capital Measurement and Capital Standards: A Revised Framework” (Basel II). The Office of the Superintendent of Financial Institutions (OSFI) has issued guidelines, reporting requirements and disclosure guidance which are consistent with the Basel III reforms (except for implementation dates described below). As compared to previous standards, Basel III places a greater emphasis on common equity by introducing a new category of capital, Common Equity Tier 1 (CET1), which consists primarily of common shareholders equity net of regulatory adjustments. These regulatory adjustments include goodwill, intangible assets, deferred tax assets, pension assets and investments in financial institutions over certain thresholds. Overall, the Basel III rules increase the level of regulatory deductions relative to Basel II. Basel III also increases the level of risk-weighted assets for significant investments and deferred tax amounts due to temporary timing differences under defined thresholds, exposures to large or unregulated financial institutions meeting specific criteria, exposures to centralized counterparties and exposures that give rise to wrong way risk. To enable banks to meet the new standards, Basel III contains transitional arrangements commencing January 1, 2013, through January 1, 2019. Transitional requirements result in a phase-in of new deductions to common equity over 5 years. Under the transitional rules, all CET1 deductions are multiplied by a factor during the transitional period, beginning with 0% in 2013, 20% in 2014, 40% in 2015, 60% in 2016, etc.; through to 100% in 2018. The portion of the CET1 regulatory adjustments not deducted during the transitional period will continue to be subject to Basel II treatment. In addition, non-qualifying capital instruments will be phased-out over 10 years and the capital conservation buffer will be phased in over 4 years. As of January 2019, the banks will be required to meet new minimum requirements related to risk-weighted assets of: Common Equity Tier 1 ratio of 4.5% plus a capital conservation buffer of 2.5%, collectively 7%. Including the capital conservation buffer, the minimum Tier 1 ratio will be 8.5%, and the Total capital ratio will be 10.5%. OSFI required Canadian deposit-taking institutions to fully implement the 2019 Basel III reforms in 2013, without the transitional phase-in provisions for capital deductions, and achieve a minimum 7% common equity target, by the first quarter of 2013 along with a minimum Tier 1 ratio of 7% and Total capital ratio of 10%. Since the first quarter of 2014, the minimum Tier 1 ratio rose to 8.5% and the Total capital ratio rose to 10.5%. The BCBS issued the rules on the assessment methodology for global systemically important banks (G-SIBs) and their additional loss absorbency requirements. In their view, additional policy measures for G-SIBs are required due to negative externalities (i.e., adverse side effects) created by systemically important banks which are not fully addressed by current regulatory policies. The assessment methodology for G-SIBs is based on an indicator-based approach and comprises five broad categories: size, interconnectedness, lack of readily available substitutes, global (cross-jurisdictional) activity and complexity. Additional loss absorbency requirements may range from 1% to 3.5% Common Equity Tier 1 depending upon a bank’s systemic importance and will be introduced in parallel with the Basel III capital conservation and countercyclical buffers from 2016 through to 2019. Scotiabank is not designated as a G-SIB. Since similar externalities can apply at a domestic level, the BCBS extended the G-SIBs framework to domestic systemically important banks (D-SIBs) focusing on the impact that a distress or failure would have on a domestic economy. Given that the D-SIB framework complements the G-SIB framework, the Committee considers that it would be appropriate if banks identified as D-SIBs by their national authorities are required by those authorities to comply with the principles in line with phase-in arrangements for the G-SIB framework, i.e., January 2016. In a March 2013 advisory letter, OSFI designated the 6 largest banks in Canada as domestic systemically important banks (D-SIBs), increasing their minimum capital ratio requirements by 1% for the identified D-SIBs. This 1% surcharge is applicable to all minimum capital ratio requirements for CET1, Tier 1 and Total Capital, by no later than January 1, 2016, in line with the requirements for global systemically important banks.
As of January 2016, the Scotiabank and other Canadian D-SIB banks are also required to meet new D-SIB minimum requirements; a minimum Common Equity Tier 1 ratio of 8.0%, Tier 1 ratio of 9.5% and a Total capital ratio of 11.5%. In December 2013, OSFI announced its decision to implement the phase-in (over 5 years) of the regulatory capital for Credit Valuation Adjustment (CVA) on Bilateral OTC Derivatives effective Q1 2014. In accordance with OSFI's requirements, a scalar for CVA risk-weighted assets (RWA) of 0.57 was used in the first two quarters of 2014. For the third and fourth quarters of 2014, CVA RWA were calculated using scalars of 0.57, 0.65, and 0.77 to compute the CET1 capital ratio, Tier 1 capital ratio and Total capital ratio, respectively. In 2015 and 2016, these scalars are 0.64, 0.71 and 0.77, respectively. Risk-weighted assets are computed on an all-in Basel III basis unless otherwise indicated. All-in is defined as capital calculated to include all of the regulatory adjustments that will be required by 2019 but retaining the phase -out rules for non-qualifying capital instruments. As at January 31, 2013, all of the Bank’s preferred shares, capital instruments and subordinated debentures did not meet these additional criteria and are subject to phase-out commencing January 2013. Certain innovative Tier 1 capital instruments issued by the Bank contain regulatory event redemption rights. The Bank has no present intention of invoking any regulatory event redemption features in these capital instruments . However, the Bank
reserves the right to redeem, call or repurchase any capital instruments within the terms of each offering at any time in the future. Commencing in 2015 and continuing in 2016, the Bank issued subordinated debentures and preferred shares which contain non-viability contingent capital (NVCC) provisions necessary for the debentures and preferred shares to qualify as Tier 1 or Tier 2 regulatory capital. Under the NVCC provisions, the debentures are convertible into a variable number of common shares upon: (i) the public announcement by OSFI that the Bank has ceased, or is about to cease, to be viable; or (ii) by a federal or provincial government of Canada that the Bank accepted or agreed to accept a capital injection. In addition to risk-based capital requirements, the Basel III reforms introduced a simpler, non risk-based Leverage ratio requirement to act as a supplementary measure to its risk-based capital requirements. The Leverage ratio is defined as a ratio of Basel III Tier 1 capital to a leverage exposure measure which includes on-balance sheet assets and off-balance sheet commitments, derivatives and securities financing transactions, as defined within the requirements. In January 2014, the BCBS issued revisions to the Basel III Leverage ratio framework. Revisions to the framework relate primarily to the exposure measure, i.e. the denominator of the ratio, and consist mainly of: lower credit conversion factors for certain off-balance sheet commitments; further clarification on the treatment for derivatives, related collateral, and securities financing transactions; additional requirements for written credit derivatives; and, minimum public disclosure requirements commencing January 2015. The final calibration will be completed by 2017, with a view to migrating to a Pillar 1 (minimum capital requirement) treatment by January 2018. As a member of the BCBS, OSFI intends to adopt the Basel requirements as part of its domestic requirements for banks, bank holding companies, federally regulated trust and loan companies in Canada. In October 2014, OSFI released its Leverage Requirements Guideline which outlines the application of the Basel III Leverage ratio in Canada and the replacement of the former Assets-to-Capital Multiple (ACM), effective Q1 2015. Institutions are expected to maintain a material operating buffer above the 3% minimum. The Bank meets OSFI's authorized leverage ratio. Commencing Q1 2015, disclosure in accordance with OSFI's September 2014 Public Disclosure Requirements related to Basel III Leverage ratio has been made in the Supplementary Regulatory Capital Disclosure on pages 28-30. Prior period amounts have not been restated for Basel III as they represent the actual amounts reported in that period for regulatory purposes.
Page 2
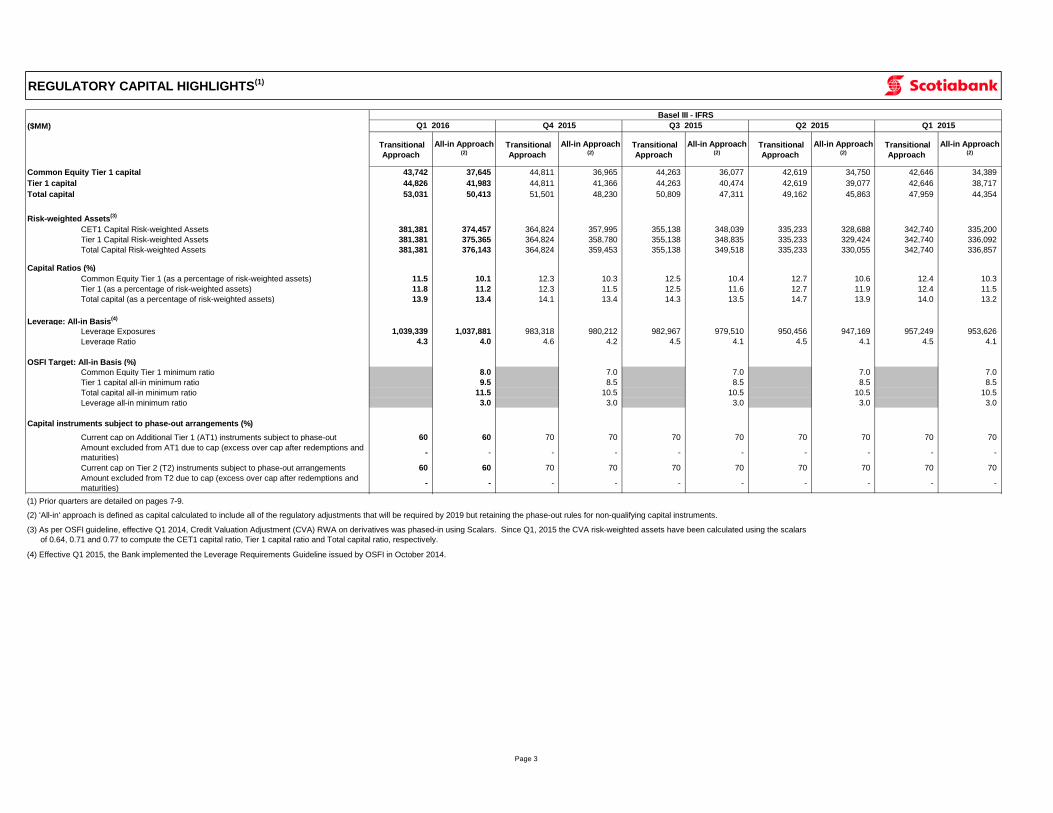
REGULATORY CAPITAL HIGHLIGHTS(1)
($MM)
Transitional
Approach
All-in Approach (2)
Transitional
Approach
All-in Approach (2)
Transitional
Approach
All-in Approach (2)
Transitional
Approach
All-in Approach (2)
Transitional
Approach
All-in Approach (2)
Common Equity Tier 1 capital 43,742 37,645 44,811 36,965 44,263 36,077 42,619 34,750 42,646 34,389
Tier 1 capital 44,826 41,983 44,811 41,366 44,263 40,474 42,619 39,077 42,646 38,717
Total capital 53,031 50,413 51,501 48,230 50,809 47,311 49,162 45,863 47,959 44,354
Risk-weighted Assets(3)
CET1 Capital Risk-weighted Assets 381,381 374,457 364,824 357,995 355,138 348,039 335,233 328,688 342,740 335,200
Tier 1 Capital Risk-weighted Assets 381,381 375,365 364,824 358,780 355,138 348,835 335,233 329,424 342,740 336,092
Total Capital Risk-weighted Assets 381,381 376,143 364,824 359,453 355,138 349,518 335,233 330,055 342,740 336,857
Capital Ratios (%)
Common Equity Tier 1 (as a percentage of risk-weighted assets) 11.5 10.1 12.3 10.3 12.5 10.4 12.7 10.6 12.4 10.3
Tier 1 (as a percentage of risk-weighted assets) 11.8 11.2 12.3 11.5 12.5 11.6 12.7 11.9 12.4 11.5
Total capital (as a percentage of risk-weighted assets) 13.9 13.4 14.1 13.4 14.3 13.5 14.7 13.9 14.0 13.2
Leverage: All-in Basis(4)
Leverage Exposures 1,039,339 1,037,881 983,318 980,212 982,967 979,510 950,456 947,169 957,249 953,626
Leverage Ratio 4.3 4.0 4.6 4.2 4.5 4.1 4.5 4.1 4.5 4.1
OSFI Target: All-in Basis (%)
Common Equity Tier 1 minimum ratio 8.0 7.0 7.0 7.0 7.0
Tier 1 capital all-in minimum ratio 9.5 8.5 8.5 8.5 8.5
Total capital all-in minimum ratio 11.5 10.5 10.5 10.5 10.5
Leverage all-in minimum ratio 3.0 3.0 3.0 3.0 3.0
Capital instruments subject to phase-out arrangements (%)
Current cap on Additional Tier 1 (AT1) instruments subject to phase-out
arrangements
60 60 70 70 70 70 70 70 70 70
Amount excluded from AT1 due to cap (excess over cap after redemptions and
maturities)- - - - - - - - - -
Current cap on Tier 2 (T2) instruments subject to phase-out arrangements 60 60 70 70 70 70 70 70 70 70
Amount excluded from T2 due to cap (excess over cap after redemptions and
maturities)- - - - - - - - - -
(1) Prior quarters are detailed on pages 7-9.
(2) 'All-in' approach is defined as capital calculated to include all of the regulatory adjustments that will be required by 2019 but retaining the phase-out rules for non-qualifying capital instruments.
(3) As per OSFI guideline, effective Q1 2014, Credit Valuation Adjustment (CVA) RWA on derivatives was phased-in using Scalars. Since Q1, 2015 the CVA risk-weighted assets have been calculated using the scalars
of 0.64, 0.71 and 0.77 to compute the CET1 capital ratio, Tier 1 capital ratio and Total capital ratio, respectively.
(4) Effective Q1 2015, the Bank implemented the Leverage Requirements Guideline issued by OSFI in October 2014.
Basel III - IFRS
Q1 2016 Q4 2015 Q3 2015 Q2 2015 Q1 2015
Page 3
Cross-
Reference(1)
All-in
Q1 2016
All-in
Q4 2015
Cross-
Reference(1)
All-in
Q1 2016
All-in
Q4 2015
Common Equity Tier 1 Capital: Instruments and Reserves
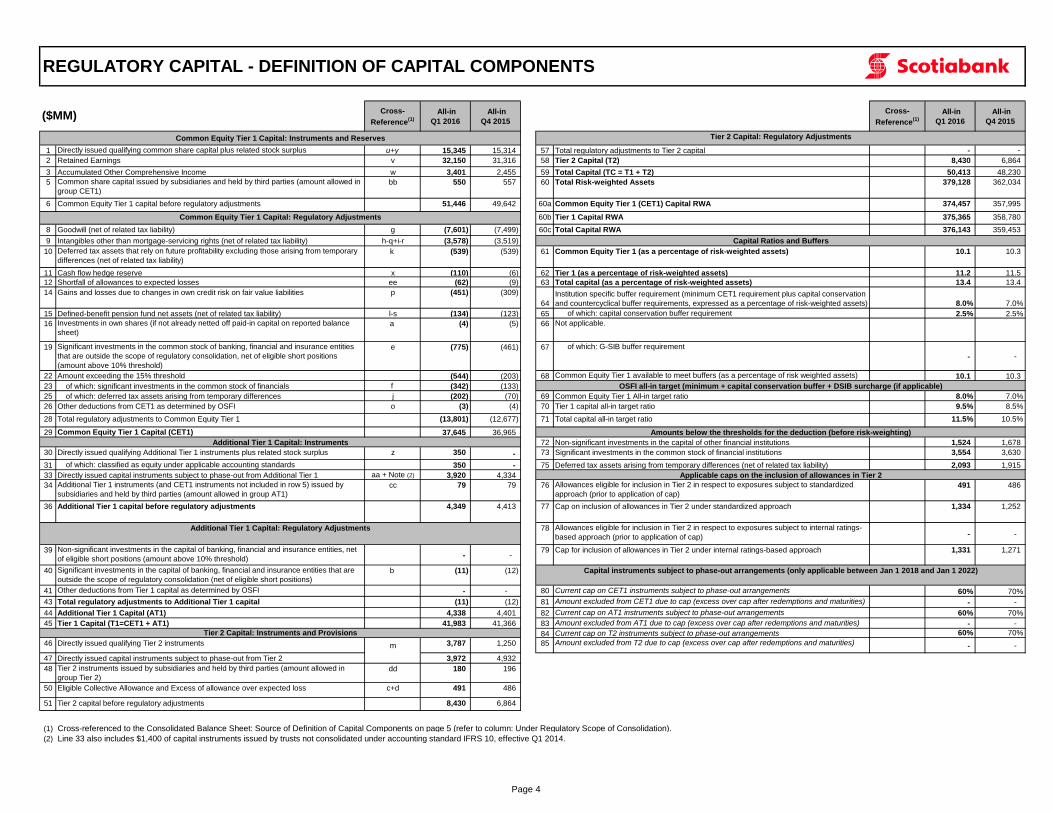
1 u+y 15,345 15,314 57 Total regulatory adjustments to Tier 2 capital - -
2 v 32,150 31,316 58 Tier 2 Capital (T2) 8,430 6,864
3 w 3,401 2,455 59 Total Capital (TC = T1 + T2) 50,413 48,230
5 bb 550 557 60 Total Risk-weighted Assets 379,128 362,034
6 Common Equity Tier 1 capital before regulatory adjustments 51,446 49,642 60a Common Equity Tier 1 (CET1) Capital RWA 374,457 357,995
60b Tier 1 Capital RWA 375,365 358,780
8 g (7,601) (7,499) 60c Total Capital RWA 376,143 359,453
9 h-q+i-r (3,578) (3,519)
10 k (539) (539) 61 10.1 10.3
11 x (110) (6) 62 11.2 11.5
12 ee (62) (9) 63 13.4 13.4
14 p (451) (309)
64 8.0% 7.0%
15 l-s (134) (123) 65 2.5% 2.5%
16 a (4) (5) 66
19 e (775) (461) 67
- -
22 (544) (203) 68 10.1 10.3
23 f (342) (133)
25 j (202) (70) 69 8.0% 7.0%
26 Other deductions from CET1 as determined by OSFI o (3) (4) 70 9.5% 8.5%
28 Total regulatory adjustments to Common Equity Tier 1 (13,801) (12,677) 71 11.5% 10.5%
29 Common Equity Tier 1 Capital (CET1) 37,645 36,965
72 1,524 1,678
30 z 350 - 73 3,554 3,630
31 350 - 75 2,093 1,915
33 aa + Note (2) 3,920 4,334
34 cc 79 79 76 491 486
36 Additional Tier 1 capital before regulatory adjustments 4,349 4,413 77 1,334 1,252
78 - -
39 - -
79 1,331 1,271
40 b (11) (12)
41 - - 80 60% 70%
43 (11) (12) 81 - -
44 4,338 4,401 82 60% 70%
45 41,983 41,366 83 - -
84 60% 70%
46 m 3,787 1,250 85 - -
47 3,972 4,932
48 dd 180 196
50 c+d 491 486
51 8,430 6,864
(1) Cross-referenced to the Consolidated Balance Sheet: Source of Definition of Capital Components on page 5 (refer to column: Under Regulatory Scope of Consolidation).
(2) Line 33 also includes $1,400 of capital instruments issued by trusts not consolidated under accounting standard IFRS 10, effective Q1 2014.
Deferred tax assets that rely on future profitability excluding those arising from temporary
differences (net of related tax liability)Common Equity Tier 1 (as a percentage of risk-weighted assets)
REGULATORY CAPITAL - DEFINITION OF CAPITAL COMPONENTS
($MM)
Tier 2 Capital: Regulatory Adjustments
Directly issued qualifying common share capital plus related stock surplus
Retained Earnings
Accumulated Other Comprehensive Income
Common share capital issued by subsidiaries and held by third parties (amount allowed in
group CET1)
Common Equity Tier 1 Capital: Regulatory Adjustments
Goodwill (net of related tax liability)
Intangibles other than mortgage-servicing rights (net of related tax liability) Capital Ratios and Buffers
Cash flow hedge reserve Tier 1 (as a percentage of risk-weighted assets)
Shortfall of allowances to expected losses Total capital (as a percentage of risk-weighted assets)
Gains and losses due to changes in own credit risk on fair value liabilities Institution specific buffer requirement (minimum CET1 requirement plus capital conservation
and countercyclical buffer requirements, expressed as a percentage of risk-weighted assets)
Defined-benefit pension fund net assets (net of related tax liability) of which: capital conservation buffer requirement
Investments in own shares (if not already netted off paid-in capital on reported balance
sheet)
Not applicable.
Significant investments in the common stock of banking, financial and insurance entities
that are outside the scope of regulatory consolidation, net of eligible short positions
(amount above 10% threshold)
of which: G-SIB buffer requirement
Directly issued qualifying Additional Tier 1 instruments plus related stock surplus Significant investments in the common stock of financial institutions
Amount exceeding the 15% threshold Common Equity Tier 1 available to meet buffers (as a percentage of risk weighted assets)
of which: significant investments in the common stock of financials OSFI all-in target (minimum + capital conservation buffer + DSIB surcharge (if applicable)
of which: deferred tax assets arising from temporary differences Common Equity Tier 1 All-in target ratio
Tier 1 capital all-in target ratio
Total capital all-in target ratio
Amounts below the thresholds for the deduction (before risk-weighting)
Additional Tier 1 Capital: Instruments Non-significant investments in the capital of other financial institutions
Current cap on CET1 instruments subject to phase-out arrangements
of which: classified as equity under applicable accounting standards Deferred tax assets arising from temporary differences (net of related tax liability)
Applicable caps on the inclusion of allowances in Tier 2
Allowances eligible for inclusion in Tier 2 in respect to exposures subject to standardized
approach (prior to application of cap)
Cap on inclusion of allowances in Tier 2 under standardized approach
Allowances eligible for inclusion in Tier 2 in respect to exposures subject to internal ratings-
based approach (prior to application of cap)
Non-significant investments in the capital of banking, financial and insurance entities, net
of eligible short positions (amount above 10% threshold)Cap for inclusion of allowances in Tier 2 under internal ratings-based approach
Capital instruments subject to phase-out arrangements (only applicable between Jan 1 2018 and Jan 1 2022)
Additional Tier 1 instruments (and CET1 instruments not included in row 5) issued by
subsidiaries and held by third parties (amount allowed in group AT1)
Directly issued capital instruments subject to phase-out from Additional Tier 1
Significant investments in the capital of banking, financial and insurance entities that are
outside the scope of regulatory consolidation (net of eligible short positions)
Other deductions from Tier 1 capital as determined by OSFI
Additional Tier 1 Capital: Regulatory Adjustments
Amount excluded from T2 due to cap (excess over cap after redemptions and maturities)
Directly issued capital instruments subject to phase-out from Tier 2
Tier 2 instruments issued by subsidiaries and held by third parties (amount allowed in
group Tier 2)
Amount excluded from CET1 due to cap (excess over cap after redemptions and maturities)
Current cap on AT1 instruments subject to phase-out arrangements
Tier 1 Capital (T1=CET1 + AT1) Amount excluded from AT1 due to cap (excess over cap after redemptions and maturities)
Current cap on T2 instruments subject to phase-out arrangements
Eligible Collective Allowance and Excess of allowance over expected loss
Tier 2 capital before regulatory adjustments
Tier 2 Capital: Instruments and Provisions
Total regulatory adjustments to Additional Tier 1 capital
Additional Tier 1 Capital (AT1)
Directly issued qualifying Tier 2 instruments
Page 4
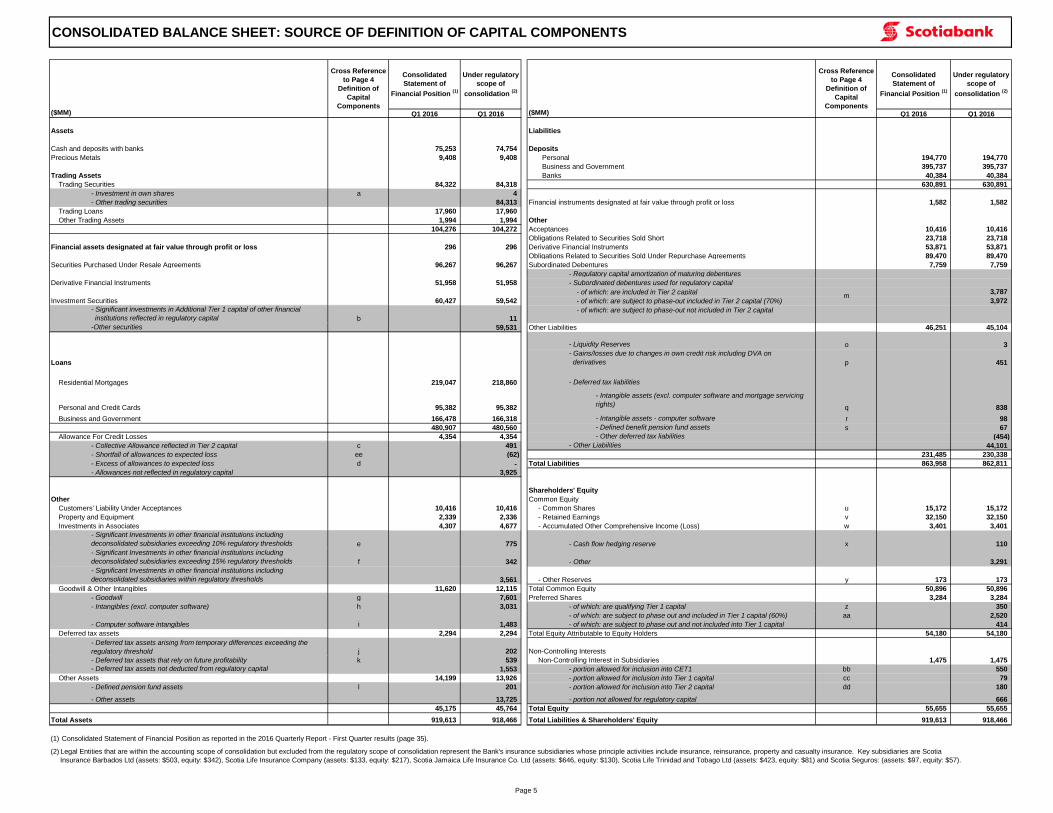
CONSOLIDATED BALANCE SHEET: SOURCE OF DEFINITION OF CAPITAL COMPONENTS
($MM) Q1 2016 Q1 2016 ($MM) Q1 2016 Q1 2016
Assets Liabilities
Cash and deposits with banks 75,253 74,754 Deposits
Precious Metals 9,408 9,408 Personal 194,770 194,770
Business and Government 395,737 395,737
Trading Assets Banks 40,384 40,384
Trading Securities 84,322 84,318 630,891 630,891
- Investment in own shares a 4
- Other trading securities 84,313 Financial instruments designated at fair value through profit or loss 1,582 1,582
Trading Loans 17,960 17,960
Other Trading Assets 1,994 1,994 Other
104,276 104,272 Acceptances 10,416 10,416
Obligations Related to Securities Sold Short 23,718 23,718
Financial assets designated at fair value through profit or loss 296 296 Derivative Financial Instruments 53,871 53,871
Obligations Related to Securities Sold Under Repurchase Agreements 89,470 89,470
Securities Purchased Under Resale Agreements 96,267 96,267 Subordinated Debentures 7,759 7,759
- Regulatory capital amortization of maturing debentures
Derivative Financial Instruments 51,958 51,958 - Subordinated debentures used for regulatory capital
- of which: are included in Tier 2 capital 3,787
Investment Securities 60,427 59,542 - of which: are subject to phase-out included in Tier 2 capital (70%) 3,972
- Significant investments in Additional Tier 1 capital of other financial
institutions reflected in regulatory capital b 11
- of which: are subject to phase-out not included in Tier 2 capital
-Other securities 59,531 Other Liabilities 46,251 45,104
- Liquidity Reserves o 3
Loans
- Gains/losses due to changes in own credit risk including DVA on
derivatives p 451
Residential Mortgages 219,047 218,860 - Deferred tax liabilities
Personal and Credit Cards 95,382 95,382
- Intangible assets (excl. computer software and mortgage servicing
rights)q 838
Business and Government 166,478 166,318 - Intangible assets - computer software r 98
480,907 480,560 - Defined benefit pension fund assets s 67
Allowance For Credit Losses 4,354 4,354 - Other deferred tax liabilities (454)
- Collective Allowance reflected in Tier 2 capital c 491 - Other Liabilities 44,101
- Shortfall of allowances to expected loss ee (62) 231,485 230,338
- Excess of allowances to expected loss d - Total Liabilities 863,958 862,811
- Allowances not reflected in regulatory capital 3,925
Shareholders' Equity
Other Common Equity
Customers' Liability Under Acceptances 10,416 10,416 - Common Shares u 15,172 15,172
Property and Equipment 2,339 2,336 - Retained Earnings v 32,150 32,150
Investments in Associates 4,307 4,677 - Accumulated Other Comprehensive Income (Loss) w 3,401 3,401
- Significant Investments in other financial institutions including
deconsolidated subsidiaries exceeding 10% regulatory thresholds e 775 - Cash flow hedging reserve x 110
- Significant Investments in other financial institutions including
deconsolidated subsidiaries exceeding 15% regulatory thresholds f 342 - Other 3,291
- Significant Investments in other financial institutions including
deconsolidated subsidiaries within regulatory thresholds 3,561 - Other Reserves y 173 173
Goodwill & Other Intangibles 11,620 12,115 Total Common Equity 50,896 50,896
- Goodwill g 7,601 Preferred Shares 3,284 3,284
- Intangibles (excl. computer software) h 3,031 - of which: are qualifying Tier 1 capital z 350
- of which: are subject to phase out and included in Tier 1 capital (60%) aa 2,520
- Computer software intangibles i 1,483 - of which: are subject to phase out and not included into Tier 1 capital 414
Deferred tax assets 2,294 2,294 Total Equity Attributable to Equity Holders 54,180 54,180
- Deferred tax assets arising from temporary differences exceeding the
regulatory threshold j 202 Non-Controlling Interests
- Deferred tax assets that rely on future profitability k 539 Non-Controlling Interest in Subsidiaries 1,475 1,475
- Deferred tax assets not deducted from regulatory capital 1,553 - portion allowed for inclusion into CET1 bb 550
Other Assets 14,199 13,926 - portion allowed for inclusion into Tier 1 capital cc 79
- Defined pension fund assets l 201 - portion allowed for inclusion into Tier 2 capital dd 180
- Other assets 13,725 - portion not allowed for regulatory capital 666
45,175 45,764 Total Equity 55,655 55,655
Total Assets 919,613 918,466 Total Liabilities & Shareholders' Equity 919,613 918,466 TRUE FALSE
m
(1) Consolidated Statement of Financial Position as reported in the 2016 Quarterly Report - First Quarter results (page 35).
(2) Legal Entities that are within the accounting scope of consolidation but excluded from the regulatory scope of consolidation represent the Bank's insurance subsidiaries whose principle activities include insurance, reinsurance, property and casualty insurance. Key subsidiaries are Scotia
Insurance Barbados Ltd (assets: $503, equity: $342), Scotia Life Insurance Company (assets: $133, equity: $217), Scotia Jamaica Life Insurance Co. Ltd (assets: $646, equity: $130), Scotia Life Trinidad and Tobago Ltd (assets: $423, equity: $81) and Scotia Seguros: (assets: $97, equity: $57).
Cross Reference
to Page 4
Definition of
Capital
Components
Consolidated
Statement of
Financial Position (1)
Under regulatory
scope of
consolidation (2)
Cross Reference
to Page 4
Definition of
Capital
Components
Consolidated
Statement of
Financial Position (1)
Under regulatory
scope of
consolidation (2)
Page 5
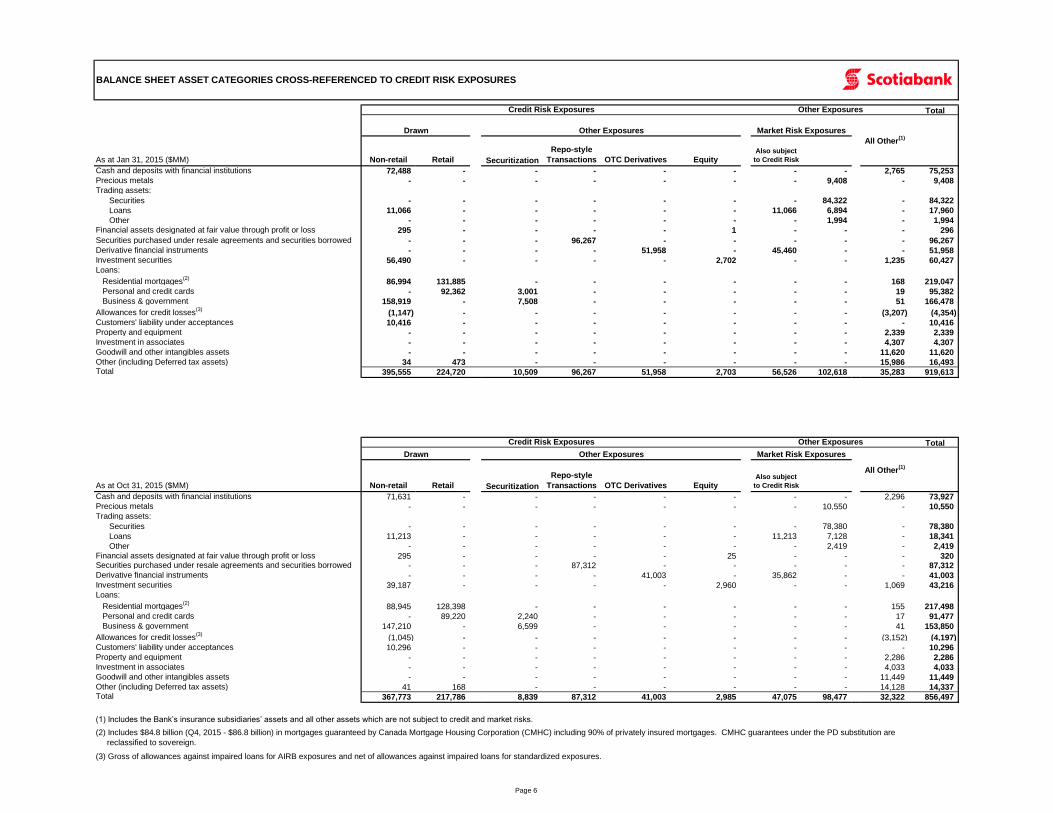
Total
As at Jan 31, 2015 ($MM) Non-retail Retail Securitization
Repo-style
Transactions OTC Derivatives EquityAlso subject
to Credit Risk
Cash and deposits with financial institutions 72,488 - - - - - - - 2,765 75,253
Precious metals - - - - - - - 9,408 - 9,408
Trading assets:
Securities - - - - - - - 84,322 - 84,322
Loans 11,066 - - - - - 11,066 6,894 - 17,960
Other - - - - - - - 1,994 - 1,994
Financial assets designated at fair value through profit or loss 295 - - - - 1 - - - 296
Securities purchased under resale agreements and securities borrowed - - - 96,267 - - - - - 96,267
Derivative financial instruments - - - - 51,958 - 45,460 - - 51,958
Investment securities 56,490 - - - - 2,702 - - 1,235 60,427
Loans:
Residential mortgages(2)
86,994 131,885 - - - - - - 168 219,047
Personal and credit cards - 92,362 3,001 - - - - - 19 95,382
Business & government 158,919 - 7,508 - - - - - 51 166,478
Allowances for credit losses(3)
(1,147) - - - - - - - (3,207) (4,354)
Customers' liability under acceptances 10,416 - - - - - - - - 10,416
Property and equipment - - - - - - - - 2,339 2,339
Investment in associates - - - - - - - - 4,307 4,307
Goodwill and other intangibles assets - - - - - - - - 11,620 11,620
Other (including Deferred tax assets) 34 473 - - - - - - 15,986 16,493 Total 395,555 224,720 10,509 96,267 51,958 2,703 56,526 102,618 35,283 919,613
Total
As at Oct 31, 2015 ($MM) Non-retail Retail Securitization
Repo-style
Transactions OTC Derivatives EquityAlso subject
to Credit Risk
Cash and deposits with financial institutions 71,631 - - - - - - - 2,296 73,927
Precious metals - - - - - - - 10,550 - 10,550
Trading assets:
Securities - - - - - - - 78,380 - 78,380
Loans 11,213 - - - - - 11,213 7,128 - 18,341
Other - - - - - - - 2,419 - 2,419
Financial assets designated at fair value through profit or loss 295 - - - - 25 - - - 320 Securities purchased under resale agreements and securities borrowed - - - 87,312 - - - - - 87,312
Derivative financial instruments - - - - 41,003 - 35,862 - - 41,003
Investment securities 39,187 - - - - 2,960 - - 1,069 43,216
Loans:
Residential mortgages(2)
88,945 128,398 - - - - - - 155 217,498
Personal and credit cards - 89,220 2,240 - - - - - 17 91,477
Business & government 147,210 - 6,599 - - - - - 41 153,850
Allowances for credit losses(3)
(1,045) - - - - - - - (3,152) (4,197)
Customers' liability under acceptances 10,296 - - - - - - - - 10,296
Property and equipment - - - - - - - - 2,286 2,286
Investment in associates - - - - - - - - 4,033 4,033
Goodwill and other intangibles assets - - - - - - - - 11,449 11,449
Other (including Deferred tax assets) 41 168 - - - - - - 14,128 14,337 Total 367,773 217,786 8,839 87,312 41,003 2,985 47,075 98,477 32,322 856,497
(1) Includes the Bank’s insurance subsidiaries’ assets and all other assets which are not subject to credit and market risks.
(3) Gross of allowances against impaired loans for AIRB exposures and net of allowances against impaired loans for standardized exposures.
BALANCE SHEET ASSET CATEGORIES CROSS-REFERENCED TO CREDIT RISK EXPOSURES
Credit Risk Exposures Other Exposures
Drawn Other Exposures Market Risk Exposures
All Other(1)
(2) Includes $84.8 billion (Q4, 2015 - $86.8 billion) in mortgages guaranteed by Canada Mortgage Housing Corporation (CMHC) including 90% of privately insured mortgages. CMHC guarantees under the PD substitution are
reclassified to sovereign.
Credit Risk Exposures Other Exposures
Drawn Other Exposures Market Risk Exposures
All Other(1)
Page 6
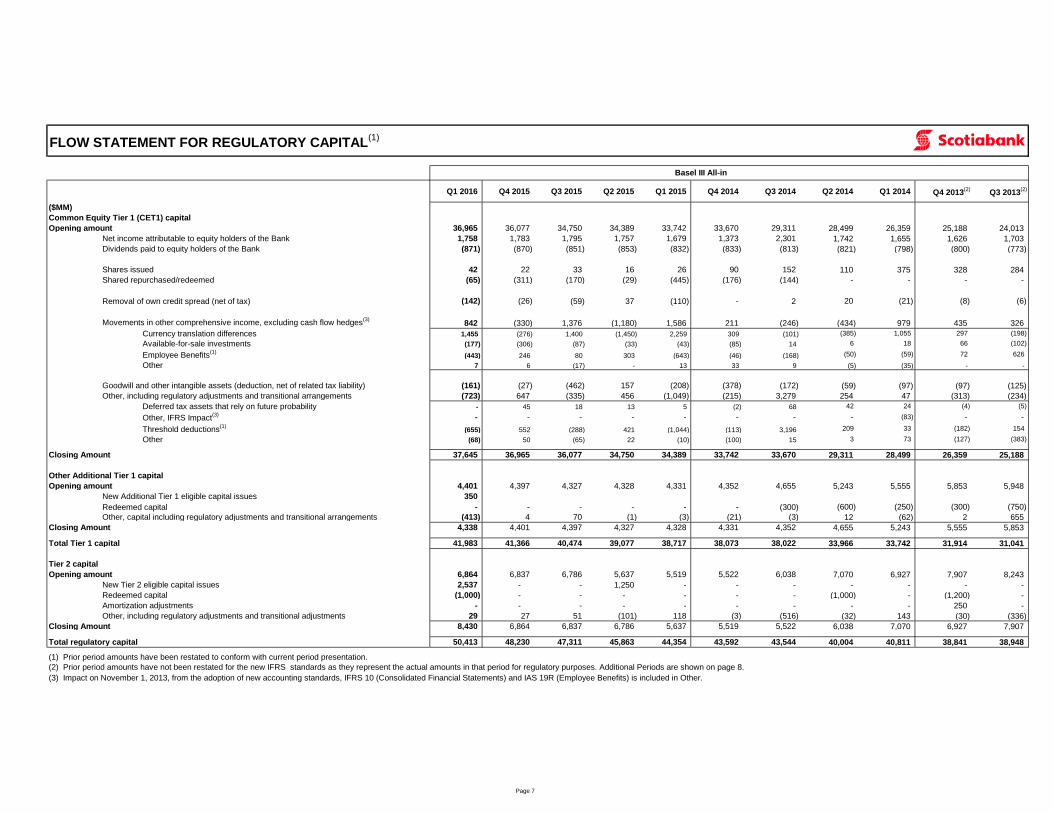
FLOW STATEMENT FOR REGULATORY CAPITAL(1)
Q1 2016 Q4 2015 Q3 2015 Q2 2015 Q1 2015 Q4 2014 Q3 2014 Q2 2014 Q1 2014 Q4 2013(2)
Q3 2013(2)
($MM)
Common Equity Tier 1 (CET1) capital
Opening amount 36,965 36,077 34,750 34,389 33,742 33,670 29,311 28,499 26,359 25,188 24,013
Net income attributable to equity holders of the Bank 1,758 1,783 1,795 1,757 1,679 1,373 2,301 1,742 1,655 1,626 1,703
Dividends paid to equity holders of the Bank (871) (870) (851) (853) (832) (833) (813) (821) (798) (800) (773)
Shares issued 42 22 33 16 26 90 152 110 375 328 284
Shared repurchased/redeemed (65) (311) (170) (29) (445) (176) (144) - - - -
Removal of own credit spread (net of tax) (142) (26) (59) 37 (110) - 2 20 (21) (8) (6)
Movements in other comprehensive income, excluding cash flow hedges(3)
842 (330) 1,376 (1,180) 1,586 211 (246) (434) 979 435 326
Currency translation differences 1,455 (276) 1,400 (1,450) 2,259 309 (101) (385) 1,055 297 (198)
Available-for-sale investments (177) (306) (87) (33) (43) (85) 14 6 18 66 (102)
Employee Benefits(1)
(443) 246 80 303 (643) (46) (168) (50) (59) 72 626
Other 7 6 (17) - 13 33 9 (5) (35) - -
Goodwill and other intangible assets (deduction, net of related tax liability) (161) (27) (462) 157 (208) (378) (172) (59) (97) (97) (125)
Other, including regulatory adjustments and transitional arrangements (723) 647 (335) 456 (1,049) (215) 3,279 254 47 (313) (234)
Deferred tax assets that rely on future probability - 45 18 13 5 (2) 68 42 24 (4) (5)
Other, IFRS Impact(3) - - - - - - - - (83) - -
Threshold deductions(1)
(655) 552 (288) 421 (1,044) (113) 3,196 209 33 (182) 154
Other (68) 50 (65) 22 (10) (100) 15 3 73 (127) (383)
Closing Amount 37,645 36,965 36,077 34,750 34,389 33,742 33,670 29,311 28,499 26,359 25,188
Other Additional Tier 1 capital
Opening amount 4,401 4,397 4,327 4,328 4,331 4,352 4,655 5,243 5,555 5,853 5,948
New Additional Tier 1 eligible capital issues 350
Redeemed capital - - - - - - (300) (600) (250) (300) (750)
Other, capital including regulatory adjustments and transitional arrangements (413) 4 70 (1) (3) (21) (3) 12 (62) 2 655
Closing Amount 4,338 4,401 4,397 4,327 4,328 4,331 4,352 4,655 5,243 5,555 5,853
Total Tier 1 capital 41,983 41,366 40,474 39,077 38,717 38,073 38,022 33,966 33,742 31,914 31,041
Tier 2 capital
Opening amount 6,864 6,837 6,786 5,637 5,519 5,522 6,038 7,070 6,927 7,907 8,243
New Tier 2 eligible capital issues 2,537 - - 1,250 - - - - - - -
Redeemed capital (1,000) - - - - - - (1,000) - (1,200) -
Amortization adjustments - - - - - - - - - 250 -
Other, including regulatory adjustments and transitional adjustments 29 27 51 (101) 118 (3) (516) (32) 143 (30) (336)
Closing Amount 8,430 6,864 6,837 6,786 5,637 5,519 5,522 6,038 7,070 6,927 7,907
Total regulatory capital 50,413 48,230 47,311 45,863 44,354 43,592 43,544 40,004 40,811 38,841 38,948
Basel III All-in
(1) Prior period amounts have been restated to conform with current period presentation.
(2) Prior period amounts have not been restated for the new IFRS standards as they represent the actual amounts in that period for regulatory purposes. Additional Periods are shown on page 8.
(3) Impact on November 1, 2013, from the adoption of new accounting standards, IFRS 10 (Consolidated Financial Statements) and IAS 19R (Employee Benefits) is included in Other.
Page 7
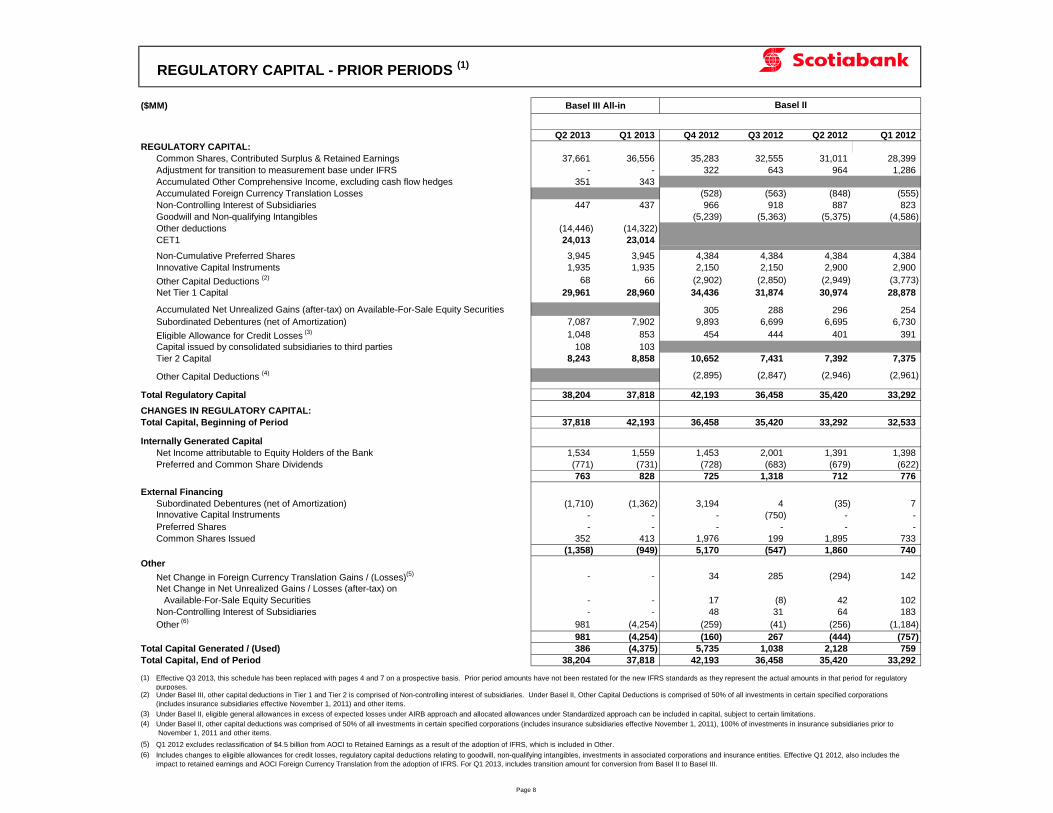
REGULATORY CAPITAL - PRIOR PERIODS (1)
($MM)
Q2 2013 Q1 2013 Q4 2012 Q3 2012 Q2 2012 Q1 2012
REGULATORY CAPITAL:
Common Shares, Contributed Surplus & Retained Earnings 37,661 36,556 35,283 32,555 31,011 28,399
Adjustment for transition to measurement base under IFRS - - 322 643 964 1,286
Accumulated Other Comprehensive Income, excluding cash flow hedges 351 343
Accumulated Foreign Currency Translation Losses (528) (563) (848) (555)
Non-Controlling Interest of Subsidiaries 447 437 966 918 887 823
Goodwill and Non-qualifying Intangibles (5,239) (5,363) (5,375) (4,586)
Other deductions (14,446) (14,322)
CET1 24,013 23,014
Non-Cumulative Preferred Shares 3,945 3,945 4,384 4,384 4,384 4,384
Innovative Capital Instruments 1,935 1,935 2,150 2,150 2,900 2,900
Other Capital Deductions (2) 68 66 (2,902) (2,850) (2,949) (3,773)
Net Tier 1 Capital 29,961 28,960 34,436 31,874 30,974 28,878
Accumulated Net Unrealized Gains (after-tax) on Available-For-Sale Equity Securities 305 288 296 254
Subordinated Debentures (net of Amortization) 7,087 7,902 9,893 6,699 6,695 6,730
Eligible Allowance for Credit Losses (3) 1,048 853 454 444 401 391
Capital issued by consolidated subsidiaries to third parties 108 103
Tier 2 Capital 8,243 8,858 10,652 7,431 7,392 7,375
Other Capital Deductions (4) (2,895) (2,847) (2,946) (2,961)
Total Regulatory Capital 38,204 37,818 42,193 36,458 35,420 33,292
CHANGES IN REGULATORY CAPITAL:
Total Capital, Beginning of Period 37,818 42,193 36,458 35,420 33,292 32,533
Internally Generated Capital
Net Income attributable to Equity Holders of the Bank 1,534 1,559 1,453 2,001 1,391 1,398
Preferred and Common Share Dividends (771) (731) (728) (683) (679) (622)
763 828 725 1,318 712 776
External Financing
Subordinated Debentures (net of Amortization) (1,710) (1,362) 3,194 4 (35) 7
Innovative Capital Instruments - - - (750) - -
Preferred Shares - - - - - -
Common Shares Issued 352 413 1,976 199 1,895 733
(1,358) (949) 5,170 (547) 1,860 740
Other
Net Change in Foreign Currency Translation Gains / (Losses)(5) - - 34 285 (294) 142
Net Change in Net Unrealized Gains / Losses (after-tax) on
Available-For-Sale Equity Securities - - 17 (8) 42 102
Non-Controlling Interest of Subsidiaries - - 48 31 64 183
Other (6)
981 (4,254) (259) (41) (256) (1,184)
981 (4,254) (160) 267 (444) (757)
Total Capital Generated / (Used) 386 (4,375) 5,735 1,038 2,128 759
Total Capital, End of Period 38,204 37,818 42,193 36,458 35,420 33,292
(1)
(2)
(3)
(4)
(5)
(6)
Under Basel II, other capital deductions was comprised of 50% of all investments in certain specified corporations (includes insurance subsidiaries effective November 1, 2011), 100% of investments in insurance subsidiaries prior to
November 1, 2011 and other items.
Q1 2012 excludes reclassification of $4.5 billion from AOCI to Retained Earnings as a result of the adoption of IFRS, which is included in Other.
Includes changes to eligible allowances for credit losses, regulatory capital deductions relating to goodwill, non-qualifying intangibles, investments in associated corporations and insurance entities. Effective Q1 2012, also includes the
impact to retained earnings and AOCI Foreign Currency Translation from the adoption of IFRS. For Q1 2013, includes transition amount for conversion from Basel II to Basel III.
Basel III All-in Basel II
Effective Q3 2013, this schedule has been replaced with pages 4 and 7 on a prospective basis. Prior period amounts have not been restated for the new IFRS standards as they represent the actual amounts in that period for regulatory
purposes.Under Basel III, other capital deductions in Tier 1 and Tier 2 is comprised of Non-controlling interest of subsidiaries. Under Basel II, Other Capital Deductions is comprised of 50% of all investments in certain specified corporations
(includes insurance subsidiaries effective November 1, 2011) and other items.
Under Basel II, eligible general allowances in excess of expected losses under AIRB approach and allocated allowances under Standardized approach can be included in capital, subject to certain limitations.
Page 8
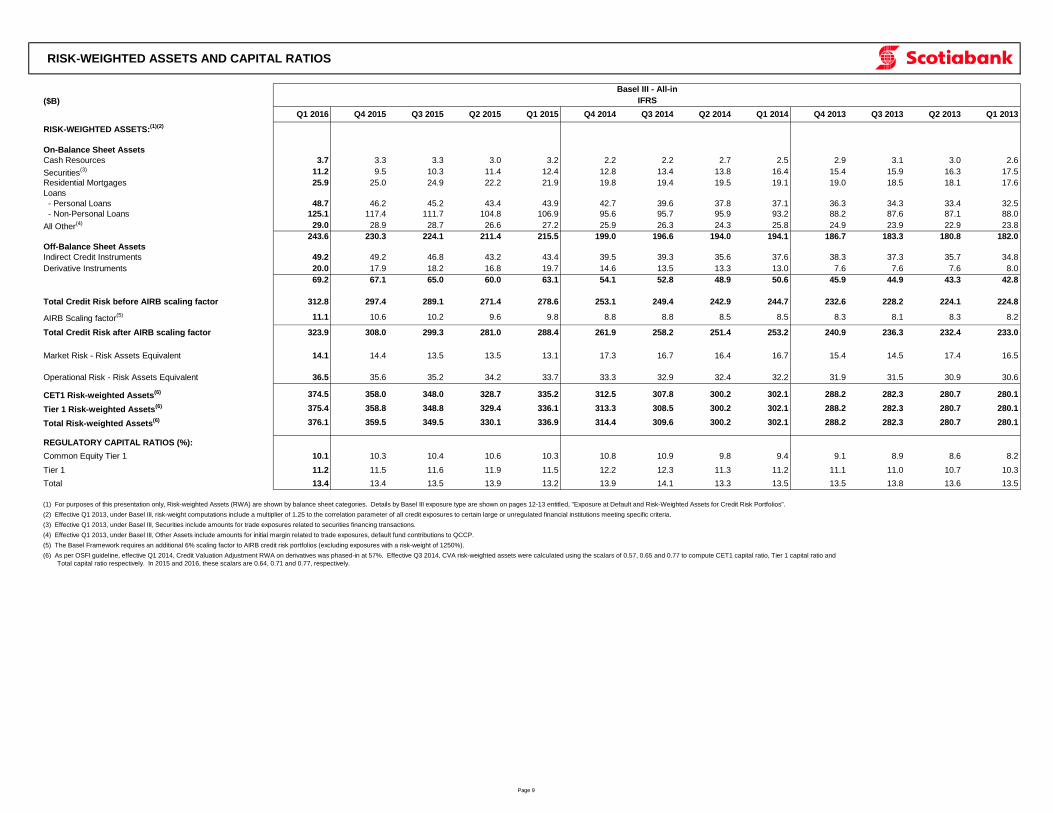
($B)
Q1 2016 Q4 2015 Q3 2015 Q2 2015 Q1 2015 Q4 2014 Q3 2014 Q2 2014 Q1 2014 Q4 2013 Q3 2013 Q2 2013 Q1 2013
RISK-WEIGHTED ASSETS:(1)(2)
On-Balance Sheet Assets
Cash Resources 3.7 3.3 3.3 3.0 3.2 2.2 2.2 2.7 2.5 2.9 3.1 3.0 2.6
Securities(3) 11.2 9.5 10.3 11.4 12.4 12.8 13.4 13.8 16.4 15.4 15.9 16.3 17.5
Residential Mortgages 25.9 25.0 24.9 22.2 21.9 19.8 19.4 19.5 19.1 19.0 18.5 18.1 17.6
Loans
- Personal Loans 48.7 46.2 45.2 43.4 43.9 42.7 39.6 37.8 37.1 36.3 34.3 33.4 32.5
- Non-Personal Loans 125.1 117.4 111.7 104.8 106.9 95.6 95.7 95.9 93.2 88.2 87.6 87.1 88.0
All Other(4) 29.0 28.9 28.7 26.6 27.2 25.9 26.3 24.3 25.8 24.9 23.9 22.9 23.8
243.6 230.3 224.1 211.4 215.5 199.0 196.6 194.0 194.1 186.7 183.3 180.8 182.0
Off-Balance Sheet Assets
Indirect Credit Instruments 49.2 49.2 46.8 43.2 43.4 39.5 39.3 35.6 37.6 38.3 37.3 35.7 34.8
Derivative Instruments 20.0 17.9 18.2 16.8 19.7 14.6 13.5 13.3 13.0 7.6 7.6 7.6 8.0
69.2 67.1 65.0 60.0 63.1 54.1 52.8 48.9 50.6 45.9 44.9 43.3 42.8
Total Credit Risk before AIRB scaling factor 312.8 297.4 289.1 271.4 278.6 253.1 249.4 242.9 244.7 232.6 228.2 224.1 224.8
AIRB Scaling factor(5) 11.1 10.6 10.2 9.6 9.8 8.8 8.8 8.5 8.5 8.3 8.1 8.3 8.2
Total Credit Risk after AIRB scaling factor 323.9 308.0 299.3 281.0 288.4 261.9 258.2 251.4 253.2 240.9 236.3 232.4 233.0
Market Risk - Risk Assets Equivalent 14.1 14.4 13.5 13.5 13.1 17.3 16.7 16.4 16.7 15.4 14.5 17.4 16.5
Operational Risk - Risk Assets Equivalent 36.5 35.6 35.2 34.2 33.7 33.3 32.9 32.4 32.2 31.9 31.5 30.9 30.6
CET1 Risk-weighted Assets(6) 374.5 358.0 348.0 328.7 335.2 312.5 307.8 300.2 302.1 288.2 282.3 280.7 280.1
Tier 1 Risk-weighted Assets(6) 375.4 358.8 348.8 329.4 336.1 313.3 308.5 300.2 302.1 288.2 282.3 280.7 280.1
Total Risk-weighted Assets(6) 376.1 359.5 349.5 330.1 336.9 314.4 309.6 300.2 302.1 288.2 282.3 280.7 280.1
REGULATORY CAPITAL RATIOS (%):
Common Equity Tier 1 10.1 10.3 10.4 10.6 10.3 10.8 10.9 9.8 9.4 9.1 8.9 8.6 8.2
Tier 1 11.2 11.5 11.6 11.9 11.5 12.2 12.3 11.3 11.2 11.1 11.0 10.7 10.3
Total 13.4 13.4 13.5 13.9 13.2 13.9 14.1 13.3 13.5 13.5 13.8 13.6 13.5
(4) Effective Q1 2013, under Basel III, Other Assets include amounts for initial margin related to trade exposures, default fund contributions to QCCP.
(5) The Basel Framework requires an additional 6% scaling factor to AIRB credit risk portfolios (excluding exposures with a risk-weight of 1250%).
(6) As per OSFI guideline, effective Q1 2014, Credit Valuation Adjustment RWA on derivatives was phased-in at 57%. Effective Q3 2014, CVA risk-weighted assets were calculated using the scalars of 0.57, 0.65 and 0.77 to compute CET1 capital ratio, Tier 1 capital ratio and
Total capital ratio respectively. In 2015 and 2016, these scalars are 0.64, 0.71 and 0.77, respectively.
RISK-WEIGHTED ASSETS AND CAPITAL RATIOS
Basel III - All-in
IFRS
(1) For purposes of this presentation only, Risk-weighted Assets (RWA) are shown by balance sheet categories. Details by Basel III exposure type are shown on pages 12-13 entitled, "Exposure at Default and Risk-Weighted Assets for Credit Risk Portfolios".
(2) Effective Q1 2013, under Basel III, risk-weight computations include a multiplier of 1.25 to the correlation parameter of all credit exposures to certain large or unregulated financial institutions meeting specific criteria.
(3) Effective Q1 2013, under Basel III, Securities include amounts for trade exposures related to securities financing transactions.
Page 9
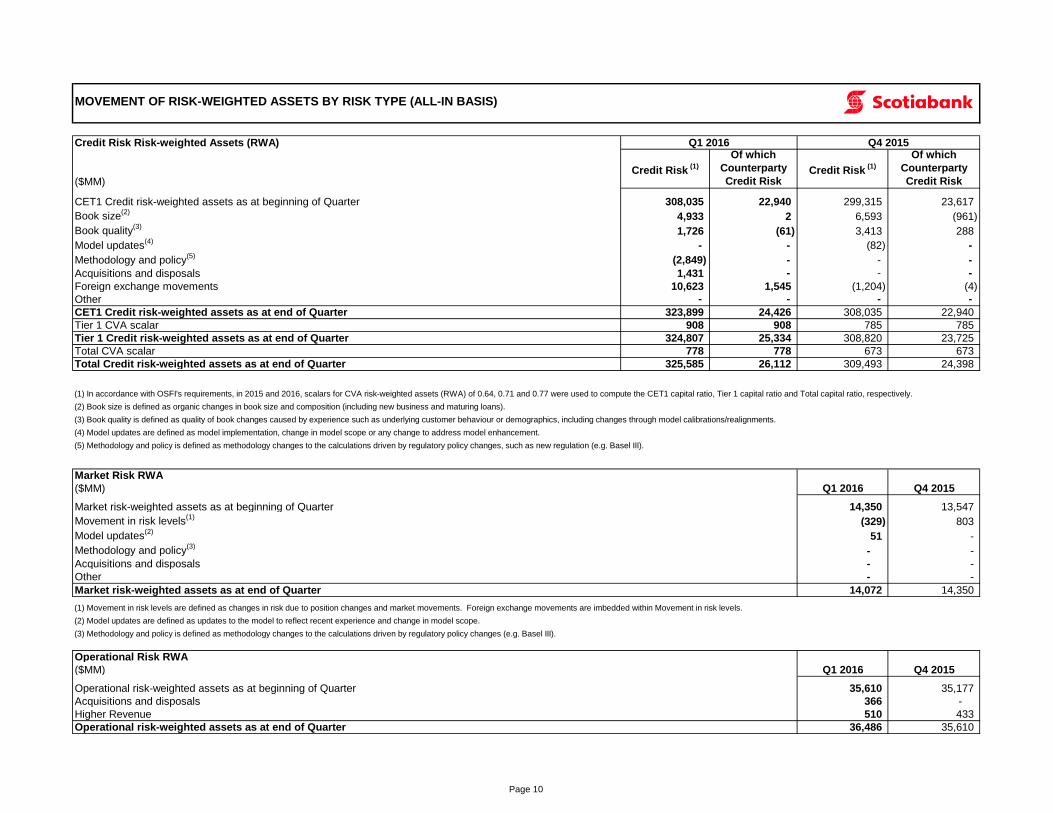
MOVEMENT OF RISK-WEIGHTED ASSETS BY RISK TYPE (ALL-IN BASIS)
Credit Risk Risk-weighted Assets (RWA)
($MM)Credit Risk
(1)
Of which
Counterparty
Credit RiskCredit Risk
(1)
Of which
Counterparty
Credit Risk
CET1 Credit risk-weighted assets as at beginning of Quarter 308,035 22,940 299,315 23,617
Book size(2)
4,933 2 6,593 (961)
Book quality(3)
1,726 (61) 3,413 288
Model updates(4)
- - (82) -
Methodology and policy(5)
(2,849) - - -
Acquisitions and disposals 1,431 - - -
Foreign exchange movements 10,623 1,545 (1,204) (4)
Other - - - -
CET1 Credit risk-weighted assets as at end of Quarter 323,899 24,426 308,035 22,940
Tier 1 CVA scalar 908 908 785 785
Tier 1 Credit risk-weighted assets as at end of Quarter 324,807 25,334 308,820 23,725
Total CVA scalar 778 778 673 673
Total Credit risk-weighted assets as at end of Quarter 325,585 26,112 309,493 24,398
(2) Book size is defined as organic changes in book size and composition (including new business and maturing loans).
(3) Book quality is defined as quality of book changes caused by experience such as underlying customer behaviour or demographics, including changes through model calibrations/realignments.
(4) Model updates are defined as model implementation, change in model scope or any change to address model enhancement.
(5) Methodology and policy is defined as methodology changes to the calculations driven by regulatory policy changes, such as new regulation (e.g. Basel III).
Market Risk RWA
($MM) Q1 2016 Q4 2015
Market risk-weighted assets as at beginning of Quarter 14,350 13,547
Movement in risk levels(1)
(329) 803
Model updates(2)
51 -
Methodology and policy(3)
- -
Acquisitions and disposals - -
Other - -
Market risk-weighted assets as at end of Quarter 14,072 14,350
(1) Movement in risk levels are defined as changes in risk due to position changes and market movements. Foreign exchange movements are imbedded within Movement in risk levels.
(2) Model updates are defined as updates to the model to reflect recent experience and change in model scope.
(3) Methodology and policy is defined as methodology changes to the calculations driven by regulatory policy changes (e.g. Basel III).
Operational Risk RWA
($MM) Q1 2016 Q4 2015
Operational risk-weighted assets as at beginning of Quarter 35,610 35,177
Acquisitions and disposals 366 -
Higher Revenue 510 433
Operational risk-weighted assets as at end of Quarter 36,486 35,610
Q1 2016 Q4 2015
(1) In accordance with OSFI's requirements, in 2015 and 2016, scalars for CVA risk-weighted assets (RWA) of 0.64, 0.71 and 0.77 were used to compute the CET1 capital ratio, Tier 1 capital ratio and Total capital ratio, respectively.
Page 10
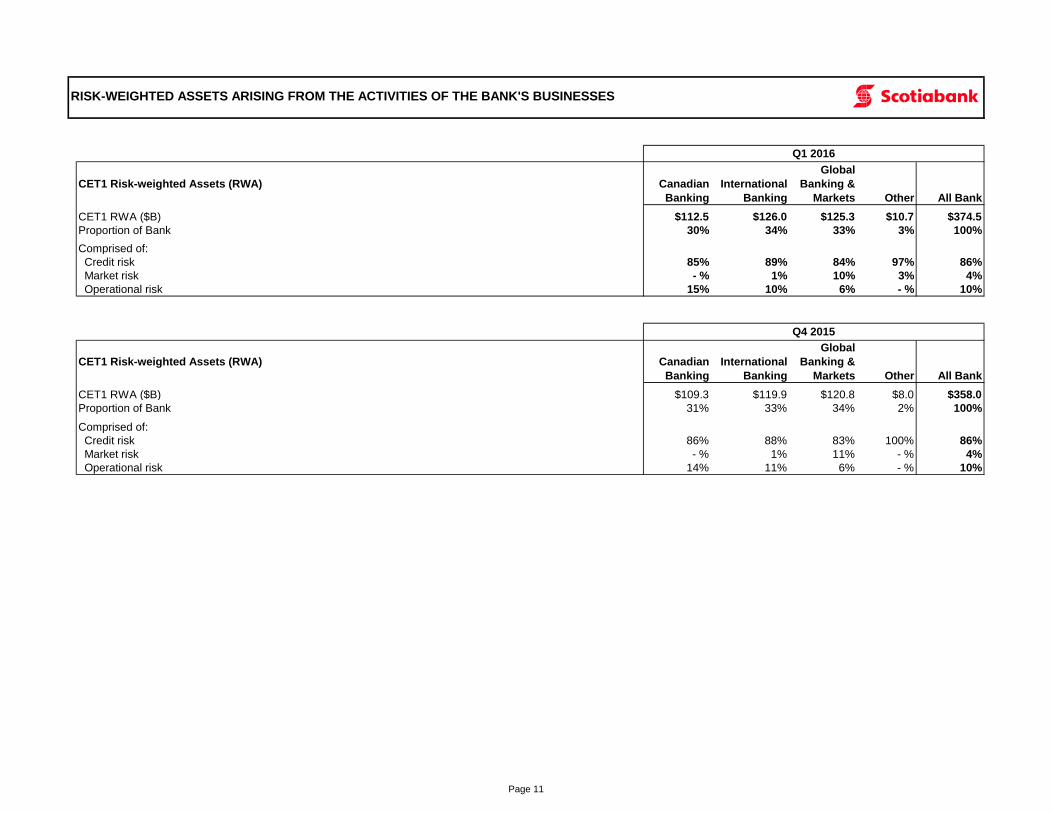
CET1 Risk-weighted Assets (RWA)
CET1 RWA ($B) $112.5 $126.0 $125.3 $10.7 $374.5
Proportion of Bank 30% 34% 33% 3% 100%
Comprised of:
Credit risk 85% 89% 84% 97% 86%
Market risk - % 1% 10% 3% 4%
Operational risk 15% 10% 6% - % 10%
CET1 Risk-weighted Assets (RWA)
CET1 RWA ($B) $109.3 $119.9 $120.8 $8.0 $358.0
Proportion of Bank 31% 33% 34% 2% 100%
Comprised of:
Credit risk 86% 88% 83% 100% 86%
Market risk - % 1% 11% - % 4%
Operational risk 14% 11% 6% - % 10%
RISK-WEIGHTED ASSETS ARISING FROM THE ACTIVITIES OF THE BANK'S BUSINESSES
Q1 2016
Canadian
Banking
International
Banking
Global
Banking &
Markets Other All Bank
Q4 2015
Canadian
Banking
International
Banking
Global
Banking &
Markets Other All Bank
Page 11
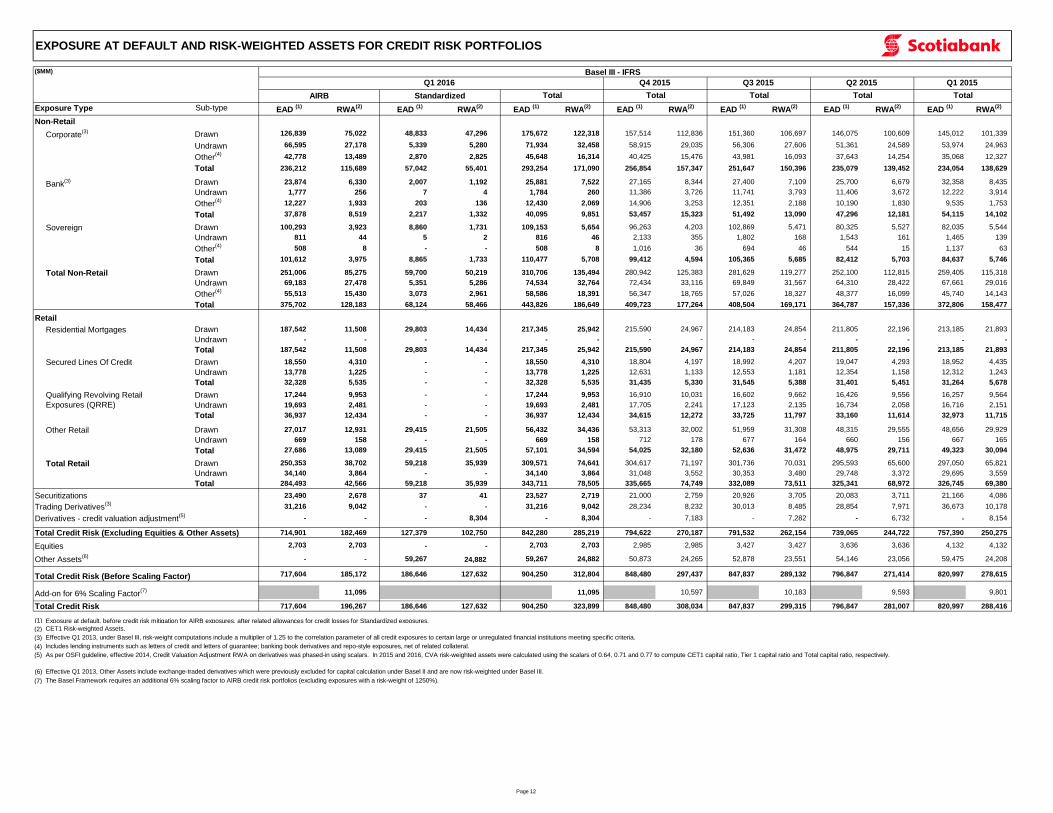
($MM) Basel III - IFRS
Sub-type EAD (1)
RWA(2)
EAD (1)
RWA(2)
EAD (1)
RWA(2)
EAD (1)
RWA(2)
EAD (1)
RWA(2)
Non-Retail
Drawn 126,839 75,022 48,833 47,296 175,672 122,318 157,514 112,836 151,360 106,697 146,075 100,609 145,012 101,339
Undrawn 66,595 27,178 5,339 5,280 71,934 32,458 58,915 29,035 56,306 27,606 51,361 24,589 53,974 24,963
Other(4) 42,778 13,489 2,870 2,825 45,648 16,314 40,425 15,476 43,981 16,093 37,643 14,254 35,068 12,327
Total 236,212 115,689 57,042 55,401 293,254 171,090 256,854 157,347 251,647 150,396 235,079 139,452 234,054 138,629
Drawn 23,874 6,330 2,007 1,192 25,881 7,522 27,165 8,344 27,400 7,109 25,700 6,679 32,358 8,435
Undrawn 1,777 256 7 4 1,784 260 11,386 3,726 11,741 3,793 11,406 3,672 12,222 3,914
Other(4) 12,227 1,933 203 136 12,430 2,069 14,906 3,253 12,351 2,188 10,190 1,830 9,535 1,753
Total 37,878 8,519 2,217 1,332 40,095 9,851 53,457 15,323 51,492 13,090 47,296 12,181 54,115 14,102
Drawn 100,293 3,923 8,860 1,731 109,153 5,654 96,263 4,203 102,869 5,471 80,325 5,527 82,035 5,544
Undrawn 811 44 5 2 816 46 2,133 355 1,802 168 1,543 161 1,465 139
Other(4) 508 8 - - 508 8 1,016 36 694 46 544 15 1,137 63
Total 101,612 3,975 8,865 1,733 110,477 5,708 99,412 4,594 105,365 5,685 82,412 5,703 84,637 5,746 - - -
Drawn 251,006 85,275 59,700 50,219 310,706 135,494 280,942 125,383 281,629 119,277 252,100 112,815 259,405 115,318
Undrawn 69,183 27,478 5,351 5,286 74,534 32,764 72,434 33,116 69,849 31,567 64,310 28,422 67,661 29,016
Other(4) 55,513 15,430 3,073 2,961 58,586 18,391 56,347 18,765 57,026 18,327 48,377 16,099 45,740 14,143
Total 375,702 128,183 68,124 58,466 443,826 186,649 409,723 177,264 408,504 169,171 364,787 157,336 372,806 158,477 -
Retail
Drawn 187,542 11,508 29,803 14,434 217,345 25,942 215,590 24,967 214,183 24,854 211,805 22,196 213,185 21,893
Undrawn - - - - - - - - - - - - - -
Total 187,542 11,508 29,803 14,434 217,345 25,942 215,590 24,967 214,183 24,854 211,805 22,196 213,185 21,893
Drawn 18,550 4,310 - - 18,550 4,310 18,804 4,197 18,992 4,207 19,047 4,293 18,952 4,435
Undrawn 13,778 1,225 - - 13,778 1,225 12,631 1,133 12,553 1,181 12,354 1,158 12,312 1,243
Total 32,328 5,535 - - 32,328 5,535 31,435 5,330 31,545 5,388 31,401 5,451 31,264 5,678
Drawn 17,244 9,953 - - 17,244 9,953 16,910 10,031 16,602 9,662 16,426 9,556 16,257 9,564
Undrawn 19,693 2,481 - - 19,693 2,481 17,705 2,241 17,123 2,135 16,734 2,058 16,716 2,151
Total 36,937 12,434 - - 36,937 12,434 34,615 12,272 33,725 11,797 33,160 11,614 32,973 11,715
Drawn 27,017 12,931 29,415 21,505 56,432 34,436 53,313 32,002 51,959 31,308 48,315 29,555 48,656 29,929
Undrawn 669 158 - - 669 158 712 178 677 164 660 156 667 165
Total 27,686 13,089 29,415 21,505 57,101 34,594 54,025 32,180 52,636 31,472 48,975 29,711 49,323 30,094
Drawn 250,353 38,702 59,218 35,939 309,571 74,641 304,617 71,197 301,736 70,031 295,593 65,600 297,050 65,821
Undrawn 34,140 3,864 - - 34,140 3,864 31,048 3,552 30,353 3,480 29,748 3,372 29,695 3,559
Total 284,493 42,566 59,218 35,939 343,711 78,505 335,665 74,749 332,089 73,511 325,341 68,972 326,745 69,380
Securitizations 23,490 2,678 37 41 23,527 2,719 21,000 2,759 20,926 3,705 20,083 3,711 21,166 4,086
Trading Derivatives(3) 31,216 9,042 - - 31,216 9,042 28,234 8,232 30,013 8,485 28,854 7,971 36,673 10,178
Derivatives - credit valuation adjustment(5) - - - 8,304 - 8,304 - 7,183 - 7,282 - 6,732 - 8,154
Total Credit Risk (Excluding Equities & Other Assets) 714,901 182,469 127,379 102,750 842,280 285,219 794,622 270,187 791,532 262,154 739,065 244,722 757,390 250,275
Equities 2,703 2,703 - - 2,703 2,703 2,985 2,985 3,427 3,427 3,636 3,636 4,132 4,132
Other Assets(6) - - 59,267 24,882 59,267 24,882 50,873 24,265 52,878 23,551 54,146 23,056 59,475 24,208
Total Credit Risk (Before Scaling Factor) 717,604 185,172 186,646 127,632 904,250 312,804 848,480 297,437 847,837 289,132 796,847 271,414 820,997 278,615
Add-on for 6% Scaling Factor(7) 11,095 11,095 10,597 10,183 9,593 9,801
Total Credit Risk 717,604 196,267 186,646 127,632 904,250 323,899 848,480 308,034 847,837 299,315 796,847 281,007 820,997 288,416
(1) Exposure at default, before credit risk mitigation for AIRB exposures, after related allowances for credit losses for Standardized exposures.
(2) CET1 Risk-weighted Assets.
(3) Effective Q1 2013, under Basel III, risk-weight computations include a multiplier of 1.25 to the correlation parameter of all credit exposures to certain large or unregulated financial institutions meeting specific criteria.
(4)
(5)
(6) Effective Q1 2013, Other Assets include exchange-traded derivatives which were previously excluded for capital calculation under Basel II and are now risk-weighted under Basel III.
(7) The Basel Framework requires an additional 6% scaling factor to AIRB credit risk portfolios (excluding exposures with a risk-weight of 1250%).
Total Non-Retail
Exposure Type
EXPOSURE AT DEFAULT AND RISK-WEIGHTED ASSETS FOR CREDIT RISK PORTFOLIOS
Q1 2016 Q3 2015 Q2 2015
EAD (1)
RWA(2)
EAD (1)
RWA(2)
Corporate(3)
Q4 2015
Total
Q1 2015
As per OSFI guideline, effective 2014, Credit Valuation Adjustment RWA on derivatives was phased-in using scalars. In 2015 and 2016, CVA risk-weighted assets were calculated using the scalars of 0.64, 0.71 and 0.77 to compute CET1 capital ratio, Tier 1 capital ratio and Total capital ratio, respectively.
Residential Mortgages
Qualifying Revolving Retail
Exposures (QRRE)
Other Retail
Total Retail
Includes lending instruments such as letters of credit and letters of guarantee; banking book derivatives and repo-style exposures, net of related collateral.
Secured Lines Of Credit
TotalAIRB Standardized Total Total Total
Bank(3)
Sovereign
Page 12
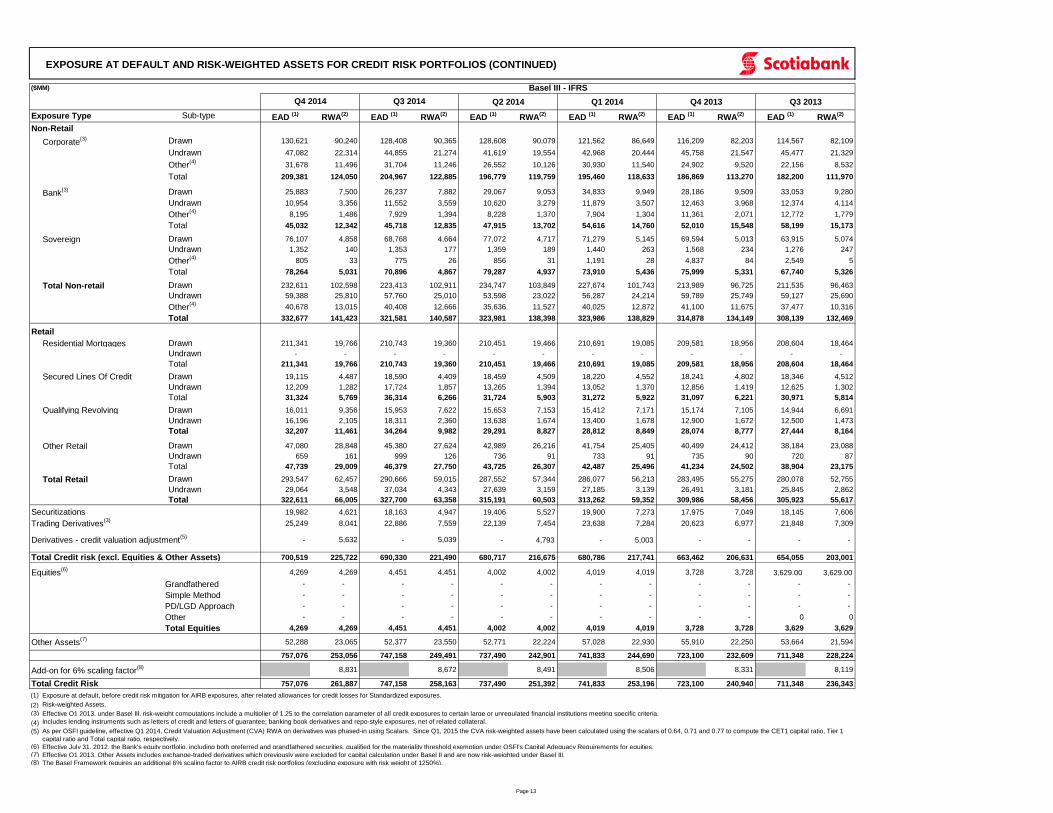
EXPOSURE AT DEFAULT AND RISK-WEIGHTED ASSETS FOR CREDIT RISK PORTFOLIOS (CONTINUED)
($MM)
Q2 2014 Q1 2014 Q4 2013 Q3 2013
Exposure Type Sub-type EAD (1)
RWA(2)
EAD (1)
RWA(2)
EAD (1)
RWA(2)
EAD (1)
RWA(2)
EAD (1)
RWA(2)
EAD (1)
RWA(2)
Non-Retail
Corporate(3) Drawn 130,621 90,240 128,408 90,365 128,608 90,079 121,562 86,649 116,209 82,203 114,567 82,109
Undrawn 47,082 22,314 44,855 21,274 41,619 19,554 42,968 20,444 45,758 21,547 45,477 21,329
Other(4)
31,678 11,496 31,704 11,246 26,552 10,126 30,930 11,540 24,902 9,520 22,156 8,532
Total 209,381 124,050 204,967 122,885 196,779 119,759 195,460 118,633 186,869 113,270 182,200 111,970
Bank(3) Drawn 25,883 7,500 26,237 7,882 29,067 9,053 34,833 9,949 28,186 9,509 33,053 9,280
Undrawn 10,954 3,356 11,552 3,559 10,620 3,279 11,879 3,507 12,463 3,968 12,374 4,114
Other(4)
8,195 1,486 7,929 1,394 8,228 1,370 7,904 1,304 11,361 2,071 12,772 1,779
Total 45,032 12,342 45,718 12,835 47,915 13,702 54,616 14,760 52,010 15,548 58,199 15,173
Sovereign Drawn 76,107 4,858 68,768 4,664 77,072 4,717 71,279 5,145 69,594 5,013 63,915 5,074
Undrawn 1,352 140 1,353 177 1,359 189 1,440 263 1,568 234 1,276 247
Other(4)
805 33 775 26 856 31 1,191 28 4,837 84 2,549 5
Total 78,264 5,031 70,896 4,867 79,287 4,937 73,910 5,436 75,999 5,331 67,740 5,326
Total Non-retail Drawn 232,611 102,598 223,413 102,911 234,747 103,849 227,674 101,743 213,989 96,725 211,535 96,463
Undrawn 59,388 25,810 57,760 25,010 53,598 23,022 56,287 24,214 59,789 25,749 59,127 25,690
Other(4)
40,678 13,015 40,408 12,666 35,636 11,527 40,025 12,872 41,100 11,675 37,477 10,316
Total 332,677 141,423 321,581 140,587 323,981 138,398 323,986 138,829 314,878 134,149 308,139 132,469
Retail
Residential Mortgages Drawn 211,341 19,766 210,743 19,360 210,451 19,466 210,691 19,085 209,581 18,956 208,604 18,464
Undrawn - - - - - - - - - - - -
Total 211,341 19,766 210,743 19,360 210,451 19,466 210,691 19,085 209,581 18,956 208,604 18,464
Secured Lines Of Credit Drawn 19,115 4,487 18,590 4,409 18,459 4,509 18,220 4,552 18,241 4,802 18,346 4,512
Undrawn 12,209 1,282 17,724 1,857 13,265 1,394 13,052 1,370 12,856 1,419 12,625 1,302
Total 31,324 5,769 36,314 6,266 31,724 5,903 31,272 5,922 31,097 6,221 30,971 5,814
Qualifying Revolving
Retail Exposures
Drawn 16,011 9,356 15,953 7,622 15,653 7,153 15,412 7,171 15,174 7,105 14,944 6,691
Undrawn 16,196 2,105 18,311 2,360 13,638 1,674 13,400 1,678 12,900 1,672 12,500 1,473
Total 32,207 11,461 34,264 9,982 29,291 8,827 28,812 8,849 28,074 8,777 27,444 8,164
Other Retail Drawn 47,080 28,848 45,380 27,624 42,989 26,216 41,754 25,405 40,499 24,412 38,184 23,088
Undrawn 659 161 999 126 736 91 733 91 735 90 720 87
Total 47,739 29,009 46,379 27,750 43,725 26,307 42,487 25,496 41,234 24,502 38,904 23,175
Total Retail Drawn 293,547 62,457 290,666 59,015 287,552 57,344 286,077 56,213 283,495 55,275 280,078 52,755
Undrawn 29,064 3,548 37,034 4,343 27,639 3,159 27,185 3,139 26,491 3,181 25,845 2,862
Total 322,611 66,005 327,700 63,358 315,191 60,503 313,262 59,352 309,986 58,456 305,923 55,617
Securitizations 19,982 4,621 18,163 4,947 19,406 5,527 19,900 7,273 17,975 7,049 18,145 7,606
Trading Derivatives(3)
25,249 8,041 22,886 7,559 22,139 7,454 23,638 7,284 20,623 6,977 21,848 7,309
Derivatives - credit valuation adjustment(5)
- 5,632 - 5,039 - 4,793 - 5,003 - - - -
Total Credit risk (excl. Equities & Other Assets) 700,519 225,722 690,330 221,490 680,717 216,675 680,786 217,741 663,462 206,631 654,055 203,001
Equities(6) 4,269 4,269 4,451 4,451 4,002 4,002 4,019 4,019 3,728 3,728 3,629.00 3,629.00
Grandfathered - - - - - - - - - - - -
Simple Method - - - - - - - - - - - -
PD/LGD Approach - - - - - - - - - - - -
Other - - - - - - - - - - 0 0
Total Equities 4,269 4,269 4,451 4,451 4,002 4,002 4,019 4,019 3,728 3,728 3,629 3,629
Other Assets(7) 52,288 23,065 52,377 23,550 52,771 22,224 57,028 22,930 55,910 22,250 53,664 21,594
757,076 253,056 747,158 249,491 737,490 242,901 741,833 244,690 723,100 232,609 711,348 228,224
Add-on for 6% scaling factor(8) 8,831 8,672 8,491 8,506 8,331 8,119
Total Credit Risk 757,076 261,887 747,158 258,163 737,490 251,392 741,833 253,196 723,100 240,940 711,348 236,343
(1) Exposure at default, before credit risk mitigation for AIRB exposures, after related allowances for credit losses for Standardized exposures.
(2) Risk-weighted Assets.
(3) Effective Q1 2013, under Basel III, risk-weight computations include a multiplier of 1.25 to the correlation parameter of all credit exposures to certain large or unregulated financial institutions meeting specific criteria.
(4) Includes lending instruments such as letters of credit and letters of guarantee; banking book derivatives and repo-style exposures, net of related collateral.
(5)
(6) Effective July 31, 2012, the Bank's equity portfolio, including both preferred and grandfathered securities, qualified for the materiality threshold exemption under OSFI's Capital Adequacy Requirements for equities.(7) Effective Q1 2013, Other Assets includes exchange-traded derivatives which previously were excluded for capital calculation under Basel II and are now risk-weighted under Basel III.(8) The Basel Framework requires an additional 6% scaling factor to AIRB credit risk portfolios (excluding exposure with risk weight of 1250%).
Q4 2014
As per OSFI guideline, effective Q1 2014, Credit Valuation Adjustment (CVA) RWA on derivatives was phased-in using Scalars. Since Q1, 2015 the CVA risk-weighted assets have been calculated using the scalars of 0.64, 0.71 and 0.77 to compute the CET1 capital ratio, Tier 1
capital ratio and Total capital ratio, respectively.
Q3 2014
Basel III - IFRS
Page 13
Exposure at Default
Basel III - IFRS
($MM)
Drawn Undrawn Other (3) Drawn Undrawn Other
(3)
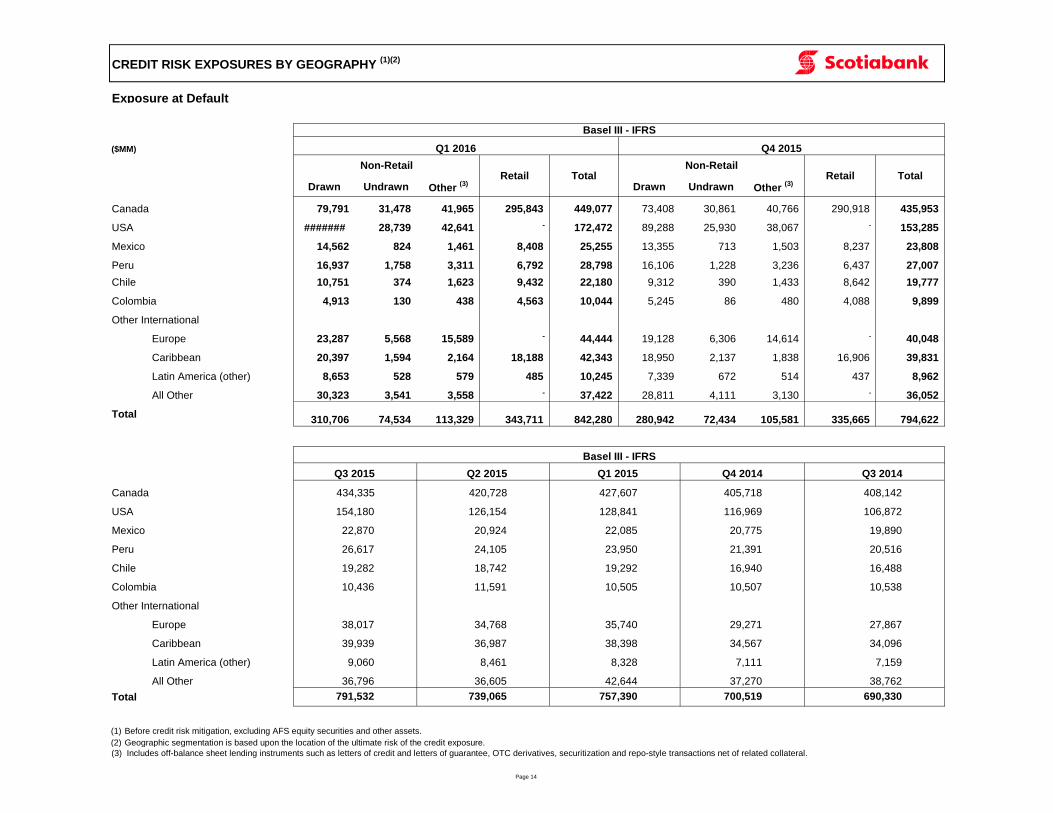
Canada 79,791 31,478 41,965 295,843 449,077 73,408 30,861 40,766 290,918 435,953
USA ####### 28,739 42,641 - 172,472 89,288 25,930 38,067 - 153,285
Mexico 14,562 824 1,461 8,408 25,255 13,355 713 1,503 8,237 23,808
Peru 16,937 1,758 3,311 6,792 28,798 16,106 1,228 3,236 6,437 27,007
Chile 10,751 374 1,623 9,432 22,180 9,312 390 1,433 8,642 19,777
Colombia 4,913 130 438 4,563 10,044 5,245 86 480 4,088 9,899
Other International
Europe 23,287 5,568 15,589 - 44,444 19,128 6,306 14,614 - 40,048
Caribbean 20,397 1,594 2,164 18,188 42,343 18,950 2,137 1,838 16,906 39,831
Latin America (other) 8,653 528 579 485 10,245 7,339 672 514 437 8,962
All Other 30,323 3,541 3,558 - 37,422 28,811 4,111 3,130 - 36,052
Total310,706 74,534 113,329 343,711 842,280 280,942 72,434 105,581 335,665 794,622
Basel III - IFRS
Canada
USA
Mexico
Peru
Chile
Colombia
Other International
Europe
Caribbean
Latin America (other)
All Other
Total
CREDIT RISK EXPOSURES BY GEOGRAPHY (1)(2)
Q1 2016 Q4 2015
Non-RetailRetail Total
Non-RetailRetail Total
434,335 420,728 427,607 405,718 408,142
Q3 2015 Q2 2015 Q1 2015 Q4 2014 Q3 2014
22,870 20,924 22,085 20,775 19,890
154,180 126,154 128,841 116,969 106,872
38,017 34,768 35,740 29,271 27,867
9,060 8,461 8,328 7,111 7,159
39,939 36,987 38,398 34,567 34,096
(1) Before credit risk mitigation, excluding AFS equity securities and other assets.
(2) Geographic segmentation is based upon the location of the ultimate risk of the credit exposure.
(3) Includes off-balance sheet lending instruments such as letters of credit and letters of guarantee, OTC derivatives, securitization and repo-style transactions net of related collateral.
36,796 36,605 42,644 37,270 38,762
791,532 739,065 757,390 700,519 690,330
26,617 24,105 23,950 21,391 20,516
19,282 18,742 19,292 16,940 16,488
10,436 11,591 10,505 10,507 10,538
Page 14
NON-RETAIL AND RETAIL PORTFOLIO EXPOSURE AT DEFAULT
Basel III - IFRS
($MM)
Drawn Undrawn Other (3) Total Drawn Undrawn Other
(3) Total
Non-Retail
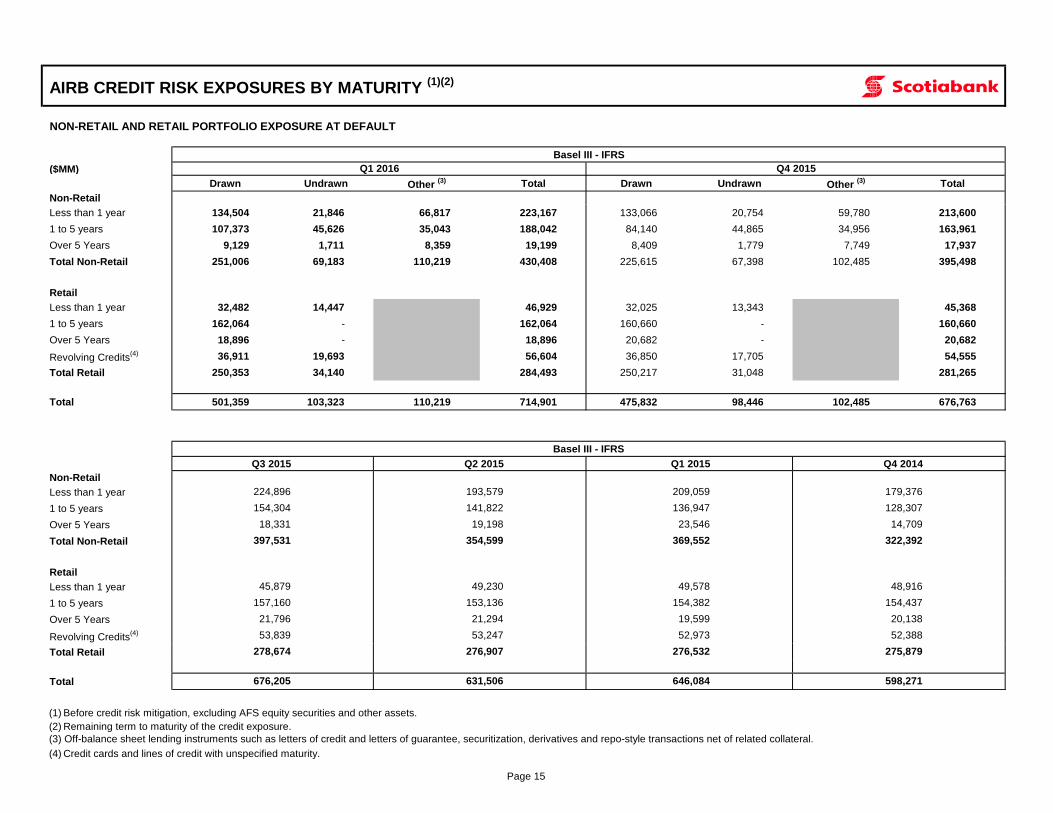
Less than 1 year 134,504 21,846 66,817 223,167 133,066 20,754 59,780 213,600
1 to 5 years 107,373 45,626 35,043 188,042 84,140 44,865 34,956 163,961
Over 5 Years 9,129 1,711 8,359 19,199 8,409 1,779 7,749 17,937
Total Non-Retail 251,006 69,183 110,219 430,408 225,615 67,398 102,485 395,498
Retail
Less than 1 year 32,482 14,447 46,929 32,025 13,343 45,368
1 to 5 years 162,064 - 162,064 160,660 - 160,660
Over 5 Years 18,896 - 18,896 20,682 - 20,682
Revolving Credits(4) 36,911 19,693 56,604 36,850 17,705 54,555
Total Retail 250,353 34,140 284,493 250,217 31,048 281,265
Total 501,359 103,323 110,219 714,901 475,832 98,446 102,485 676,763
Non-Retail
Less than 1 year
1 to 5 years
Over 5 Years
Total Non-Retail
Retail
Less than 1 year
1 to 5 years
Over 5 Years
Revolving Credits(4)
Total Retail
Total
Q3 2015 Q2 2015 Q1 2015 Q4 2014
AIRB CREDIT RISK EXPOSURES BY MATURITY (1)(2)
Q1 2016 Q4 2015
Basel III - IFRS
224,896 193,579 209,059 179,376
154,304 141,822 136,947 128,307
18,331 19,198 23,546 14,709
397,531 354,599 369,552 322,392
45,879 49,230 49,578 48,916
157,160 153,136 154,382 154,437
21,796 21,294 19,599 20,138
53,839 53,247 52,973 52,388
278,674 276,907 276,532 275,879
676,205 631,506 646,084 598,271
(1) Before credit risk mitigation, excluding AFS equity securities and other assets.
(2) Remaining term to maturity of the credit exposure.
(3) Off-balance sheet lending instruments such as letters of credit and letters of guarantee, securitization, derivatives and repo-style transactions net of related collateral.
(4) Credit cards and lines of credit with unspecified maturity.
Page 15
EXPOSURE AT DEFAULT(1)
Basel III - IFRS
($MM)
Corporate Bank Sovereign Total Res Mtgs Other Retail Total Corporate Bank Sovereign Total Res Mtgs Other Retail Total
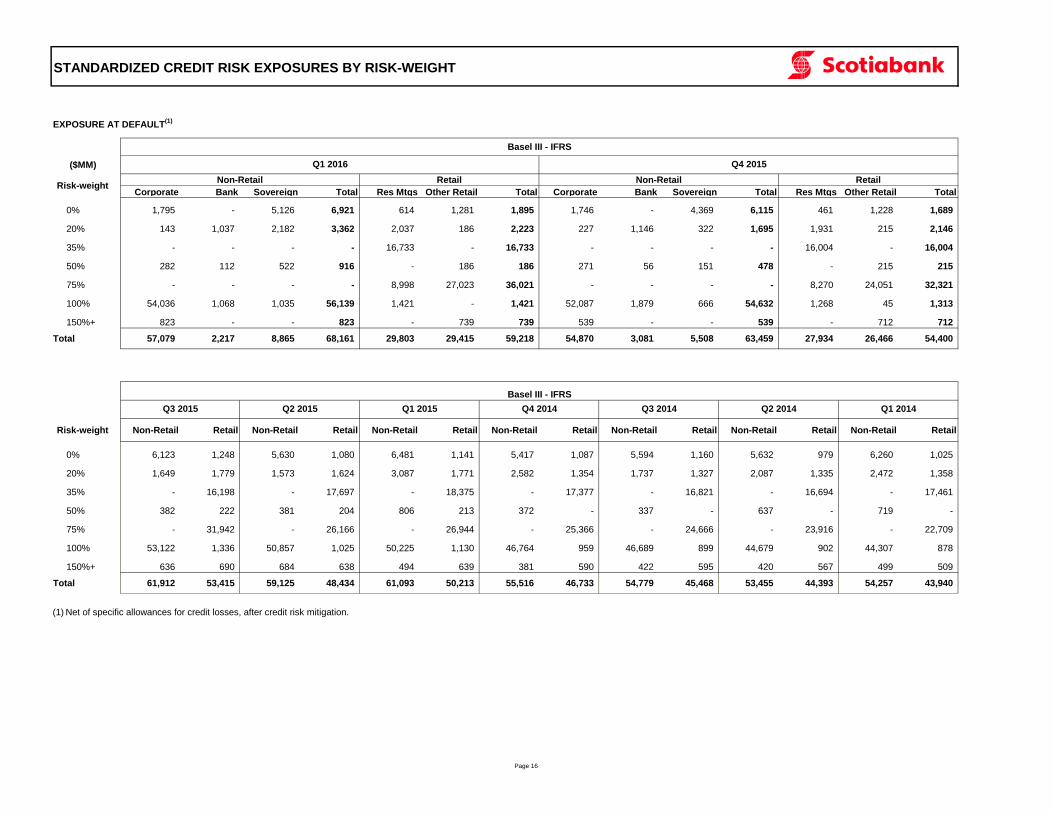
0% 1,795 - 5,126 6,921 614 1,281 1,895 1,746 - 4,369 6,115 461 1,228 1,689
20% 143 1,037 2,182 3,362 2,037 186 2,223 227 1,146 322 1,695 1,931 215 2,146
35% - - - - 16,733 - 16,733 - - - - 16,004 - 16,004
50% 282 112 522 916 - 186 186 271 56 151 478 - 215 215
75% - - - - 8,998 27,023 36,021 - - - - 8,270 24,051 32,321
100% 54,036 1,068 1,035 56,139 1,421 - 1,421 52,087 1,879 666 54,632 1,268 45 1,313
150%+ 823 - - 823 - 739 739 539 - - 539 - 712 712
Total 57,079 2,217 8,865 68,161 29,803 29,415 59,218 54,870 3,081 5,508 63,459 27,934 26,466 54,400
- - - - - - -
0% 6,123 1,248 5,630 1,080 6,481 1,141 5,417 1,087 5,594 1,160 5,632 979 6,260 1,025
20% 1,649 1,779 1,573 1,624 3,087 1,771 2,582 1,354 1,737 1,327 2,087 1,335 2,472 1,358
35% - 16,198 - 17,697 - 18,375 - 17,377 - 16,821 - 16,694 - 17,461
50% 382 222 381 204 806 213 372 - 337 - 637 - 719 -
75% - 31,942 - 26,166 - 26,944 - 25,366 - 24,666 - 23,916 - 22,709
100% 53,122 1,336 50,857 1,025 50,225 1,130 46,764 959 46,689 899 44,679 902 44,307 878
150%+ 636 690 684 638 494 639 381 590 422 595 420 567 499 509
Total 61,912 53,415 59,125 48,434 61,093 50,213 55,516 46,733 54,779 45,468 53,455 44,393 54,257 43,940
(1) Net of specific allowances for credit losses, after credit risk mitigation.
STANDARDIZED CREDIT RISK EXPOSURES BY RISK-WEIGHT
Q1 2016 Q4 2015
Risk-weightNon-Retail Retail Non-Retail Retail
Non-Retail
Basel III - IFRS
Q3 2015 Q2 2015 Q1 2015 Q4 2014 Q3 2014 Q2 2014 Q1 2014
Risk-weight Non-Retail Retail Non-Retail Retail Retail Non-Retail Retail Non-Retail Retail Non-Retail Retail Non-Retail Retail
Page 16
NON-RETAIL AIRB PORTFOLIO - CREDIT QUALITY
Basel III - IFRS
($MM)
Category external ratings (1) Internal
gradesPD bands
(2) Drawn Exposure
at Default(3)
Undrawn
Exposure at
Default(3)
Other Exposure
at Default(3)
Total Exposure
at Default(3) RWA
(8)
Weighted
Average
PD(4)(7)
Weighted
Average
LGD(5)(7)
Weighted
Average
RW(6)(7)
Total Exposure
at Default(3) RWA
(8)
Weighted
Average
PD(4)(7)
Weighted
Average
LGD(5)(7)
Weighted
Average
RW(6)(7)
$ $ $ $ $ % % % $ $ % % %
Investment Grade
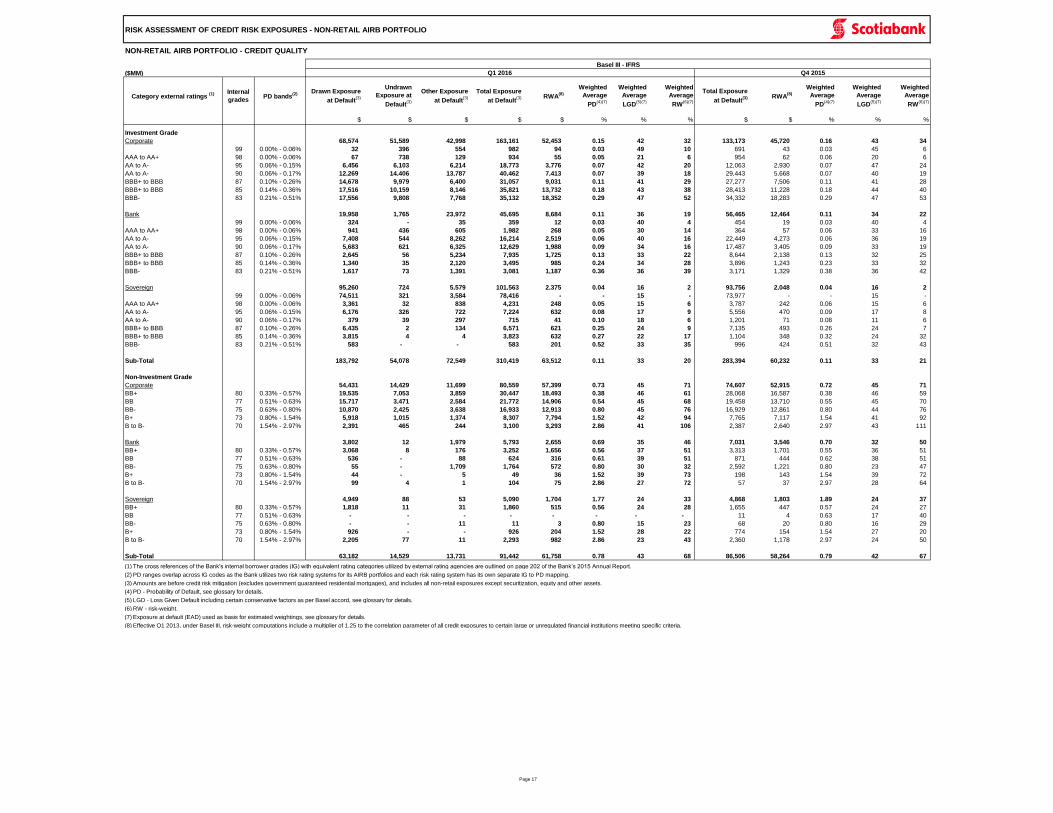
Corporate 68,574 51,589 42,998 163,161 52,453 0.15 42 32 133,173 45,720 0.16 43 34
99 0.00% - 0.06% 32 396 554 982 94 0.03 49 10 691 43 0.03 45 6
AAA to AA+ 98 0.00% - 0.06% 67 738 129 934 55 0.05 21 6 954 62 0.06 20 6
AA to A- 95 0.06% - 0.15% 6,456 6,103 6,214 18,773 3,776 0.07 42 20 12,063 2,930 0.07 47 24
AA to A- 90 0.06% - 0.17% 12,269 14,406 13,787 40,462 7,413 0.07 39 18 29,443 5,668 0.07 40 19
BBB+ to BBB 87 0.10% - 0.26% 14,678 9,979 6,400 31,057 9,031 0.11 41 29 27,277 7,506 0.11 41 28
BBB+ to BBB 85 0.14% - 0.36% 17,516 10,159 8,146 35,821 13,732 0.18 43 38 28,413 11,228 0.18 44 40
BBB- 83 0.21% - 0.51% 17,556 9,808 7,768 35,132 18,352 0.29 47 52 34,332 18,283 0.29 47 53
Bank 19,958 1,765 23,972 45,695 8,684 0.11 36 19 56,465 12,464 0.11 34 22
99 0.00% - 0.06% 324 - 35 359 12 0.03 40 4 454 19 0.03 40 4
AAA to AA+ 98 0.00% - 0.06% 941 436 605 1,982 268 0.05 30 14 364 57 0.06 33 16
AA to A- 95 0.06% - 0.15% 7,408 544 8,262 16,214 2,519 0.06 40 16 22,449 4,273 0.06 36 19
AA to A- 90 0.06% - 0.17% 5,683 621 6,325 12,629 1,988 0.09 34 16 17,487 3,405 0.09 33 19
BBB+ to BBB 87 0.10% - 0.26% 2,645 56 5,234 7,935 1,725 0.13 33 22 8,644 2,138 0.13 32 25
BBB+ to BBB 85 0.14% - 0.36% 1,340 35 2,120 3,495 985 0.24 34 28 3,896 1,243 0.23 33 32
BBB- 83 0.21% - 0.51% 1,617 73 1,391 3,081 1,187 0.36 36 39 3,171 1,329 0.38 36 42
Sovereign 95,260 724 5,579 101,563 2,375 0.04 16 2 93,756 2,048 0.04 16 2
99 0.00% - 0.06% 74,511 321 3,584 78,416 - - 15 - 73,977 - - 15 -
AAA to AA+ 98 0.00% - 0.06% 3,361 32 838 4,231 248 0.05 15 6 3,787 242 0.06 15 6
AA to A- 95 0.06% - 0.15% 6,176 326 722 7,224 632 0.08 17 9 5,556 470 0.09 17 8
AA to A- 90 0.06% - 0.17% 379 39 297 715 41 0.10 18 6 1,201 71 0.08 11 6
BBB+ to BBB 87 0.10% - 0.26% 6,435 2 134 6,571 621 0.25 24 9 7,135 493 0.26 24 7
BBB+ to BBB 85 0.14% - 0.36% 3,815 4 4 3,823 632 0.27 22 17 1,104 348 0.32 24 32
BBB- 83 0.21% - 0.51% 583 - - 583 201 0.52 33 35 996 424 0.51 32 43
Sub-Total 183,792 54,078 72,549 310,419 63,512 0.11 33 20 283,394 60,232 0.11 33 21
Non-Investment Grade
Corporate 54,431 14,429 11,699 80,559 57,399 0.73 45 71 74,607 52,915 0.72 45 71
BB+ 80 0.33% - 0.57% 19,535 7,053 3,859 30,447 18,493 0.38 46 61 28,068 16,587 0.38 46 59
BB 77 0.51% - 0.63% 15,717 3,471 2,584 21,772 14,906 0.54 45 68 19,458 13,710 0.55 45 70
BB- 75 0.63% - 0.80% 10,870 2,425 3,638 16,933 12,913 0.80 45 76 16,929 12,861 0.80 44 76
B+ 73 0.80% - 1.54% 5,918 1,015 1,374 8,307 7,794 1.52 42 94 7,765 7,117 1.54 41 92
B to B- 70 1.54% - 2.97% 2,391 465 244 3,100 3,293 2.86 41 106 2,387 2,640 2.97 43 111
Bank 3,802 12 1,979 5,793 2,655 0.69 35 46 7,031 3,546 0.70 32 50
BB+ 80 0.33% - 0.57% 3,068 8 176 3,252 1,656 0.56 37 51 3,313 1,701 0.55 36 51
BB 77 0.51% - 0.63% 536 - 88 624 316 0.61 39 51 871 444 0.62 38 51
BB- 75 0.63% - 0.80% 55 - 1,709 1,764 572 0.80 30 32 2,592 1,221 0.80 23 47
B+ 73 0.80% - 1.54% 44 - 5 49 36 1.52 39 73 198 143 1.54 39 72
B to B- 70 1.54% - 2.97% 99 4 1 104 75 2.86 27 72 57 37 2.97 28 64
Sovereign 4,949 88 53 5,090 1,704 1.77 24 33 4,868 1,803 1.89 24 37
BB+ 80 0.33% - 0.57% 1,818 11 31 1,860 515 0.56 24 28 1,655 447 0.57 24 27
BB 77 0.51% - 0.63% - - - - - - - - 11 4 0.63 17 40
BB- 75 0.63% - 0.80% - - 11 11 3 0.80 15 23 68 20 0.80 16 29
B+ 73 0.80% - 1.54% 926 - - 926 204 1.52 28 22 774 154 1.54 27 20
B to B- 70 1.54% - 2.97% 2,205 77 11 2,293 982 2.86 23 43 2,360 1,178 2.97 24 50
Sub-Total 63,182 14,529 13,731 91,442 61,758 0.78 43 68 86,506 58,264 0.79 42 67
(1) The cross references of the Bank's internal borrower grades (IG) with equivalent rating categories utilized by external rating agencies are outlined on page 202 of the Bank’s 2015 Annual Report.
(2) PD ranges overlap across IG codes as the Bank utilizes two risk rating systems for its AIRB portfolios and each risk rating system has its own separate IG to PD mapping.
(3) Amounts are before credit risk mitigation (excludes government guaranteed residential mortgages), and includes all non-retail exposures except securitization, equity and other assets.
(4) PD - Probability of Default, see glossary for details.
(5) LGD - Loss Given Default including certain conservative factors as per Basel accord, see glossary for details.
(6) RW - risk-weight.
(7) Exposure at default (EAD) used as basis for estimated weightings, see glossary for details.
(8) Effective Q1 2013, under Basel III, risk-weight computations include a multiplier of 1.25 to the correlation parameter of all credit exposures to certain large or unregulated financial institutions meeting specific criteria.
RISK ASSESSMENT OF CREDIT RISK EXPOSURES - NON-RETAIL AIRB PORTFOLIO
Q1 2016 Q4 2015
Page 17
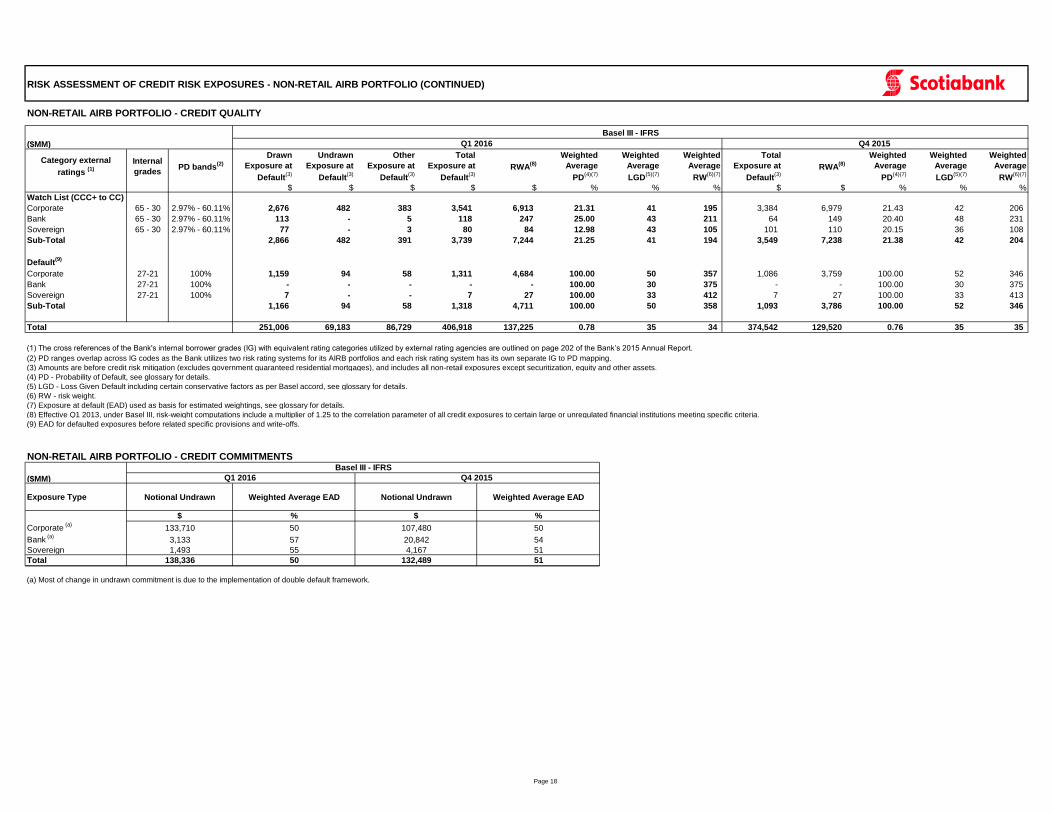
NON-RETAIL AIRB PORTFOLIO - CREDIT QUALITY
Basel III - IFRS
($MM)
Category external
ratings (1)
Internal
gradesPD bands
(2)
Drawn
Exposure at
Default(3)
Undrawn
Exposure at
Default(3)
Other
Exposure at
Default(3)
Total
Exposure at
Default(3)
RWA(8)
Weighted
Average
PD(4)(7)
Weighted
Average
LGD(5)(7)
Weighted
Average
RW(6)(7)
Total
Exposure at
Default(3)
RWA(8)
Weighted
Average
PD(4)(7)
Weighted
Average
LGD(5)(7)
Weighted
Average
RW(6)(7)
$ $ $ $ $ % % % $ $ % % %
Watch List (CCC+ to CC)
Corporate 65 - 30 2.97% - 60.11% 2,676 482 383 3,541 6,913 21.31 41 195 3,384 6,979 21.43 42 206
Bank 65 - 30 2.97% - 60.11% 113 - 5 118 247 25.00 43 211 64 149 20.40 48 231
Sovereign 65 - 30 2.97% - 60.11% 77 - 3 80 84 12.98 43 105 101 110 20.15 36 108
Sub-Total 2,866 482 391 3,739 7,244 21.25 41 194 3,549 7,238 21.38 42 204
Default(9)
Corporate 27-21 100% 1,159 94 58 1,311 4,684 100.00 50 357 1,086 3,759 100.00 52 346
Bank 27-21 100% - - - - - 100.00 30 375 - - 100.00 30 375
Sovereign 27-21 100% 7 - - 7 27 100.00 33 412 7 27 100.00 33 413
Sub-Total 1,166 94 58 1,318 4,711 100.00 50 358 1,093 3,786 100.00 52 346
Total 251,006 69,183 86,729 406,918 137,225 0.78 35 34 374,542 129,520 0.76 35 35
(1) The cross references of the Bank's internal borrower grades (IG) with equivalent rating categories utilized by external rating agencies are outlined on page 202 of the Bank’s 2015 Annual Report.
(2) PD ranges overlap across IG codes as the Bank utilizes two risk rating systems for its AIRB portfolios and each risk rating system has its own separate IG to PD mapping.
(3) Amounts are before credit risk mitigation (excludes government guaranteed residential mortgages), and includes all non-retail exposures except securitization, equity and other assets.
(4) PD - Probability of Default, see glossary for details.
(5) LGD - Loss Given Default including certain conservative factors as per Basel accord, see glossary for details.
(6) RW - risk weight.
(7) Exposure at default (EAD) used as basis for estimated weightings, see glossary for details.
(8) Effective Q1 2013, under Basel III, risk-weight computations include a multiplier of 1.25 to the correlation parameter of all credit exposures to certain large or unregulated financial institutions meeting specific criteria.
(9) EAD for defaulted exposures before related specific provisions and write-offs.
NON-RETAIL AIRB PORTFOLIO - CREDIT COMMITMENTSBasel III - IFRS
($MM)
Exposure Type Notional Undrawn Weighted Average EAD Notional Undrawn Weighted Average EAD
Corporate (a)
Bank (a)
Sovereign
Total
(a) Most of change in undrawn commitment is due to the implementation of double default framework.
RISK ASSESSMENT OF CREDIT RISK EXPOSURES - NON-RETAIL AIRB PORTFOLIO (CONTINUED)
Q1 2016 Q4 2015
133,710 107,480
$ % $ %
5050
138,336 132,489
Q1 2016 Q4 2015
3,133 20,842
1,493 4,167
57
51
51
54
55
50
Page 18
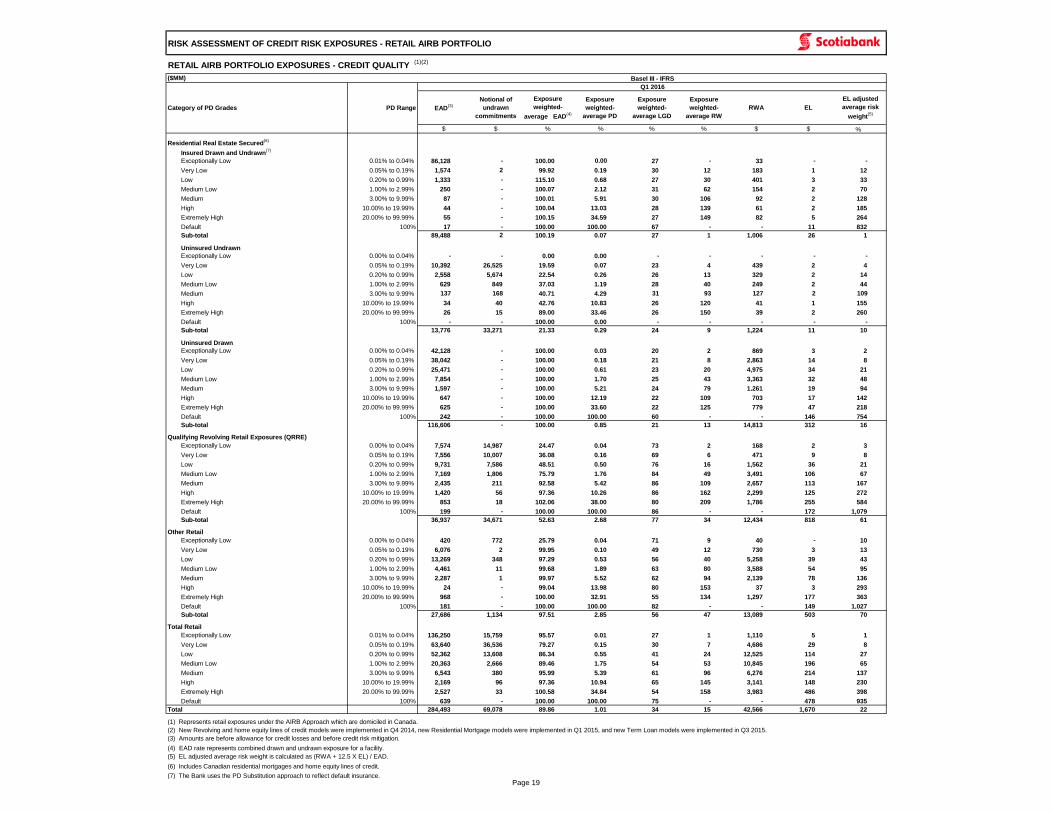
RETAIL AIRB PORTFOLIO EXPOSURES - CREDIT QUALITY (1)(2)
($MM) Basel III - IFRS
Category of PD Grades PD Range
%
Residential Real Estate Secured(6)
Insured Drawn and Undrawn(7)
Exceptionally Low 0.01% to 0.04% 86,128 - 100.00 0.00 27 - 33 - -
Very Low 0.05% to 0.19% 1,574 2 99.92 0.19 30 12 183 1 12
Low 0.20% to 0.99% 1,333 - 115.10 0.68 27 30 401 3 33
Medium Low 1.00% to 2.99% 250 - 100.07 2.12 31 62 154 2 70
Medium 3.00% to 9.99% 87 - 100.01 5.91 30 106 92 2 128
High 10.00% to 19.99% 44 - 100.04 13.03 28 139 61 2 185
Extremely High 20.00% to 99.99% 55 - 100.15 34.59 27 149 82 5 264
Default 100% 17 - 100.00 100.00 67 - - 11 832
Sub-total 89,488 2 100.19 0.07 27 1 1,006 26 1
Uninsured Undrawn
Exceptionally Low 0.00% to 0.04% - - 0.00 0.00 - - - - -
Very Low 0.05% to 0.19% 10,392 26,525 19.59 0.07 23 4 439 2 4
Low 0.20% to 0.99% 2,558 5,674 22.54 0.26 26 13 329 2 14
Medium Low 1.00% to 2.99% 629 849 37.03 1.19 28 40 249 2 44
Medium 3.00% to 9.99% 137 168 40.71 4.29 31 93 127 2 109
High 10.00% to 19.99% 34 40 42.76 10.83 26 120 41 1 155
Extremely High 20.00% to 99.99% 26 15 89.00 33.46 26 150 39 2 260
Default 100% - - 100.00 0.00 - - - - -
Sub-total 13,776 33,271 21.33 0.29 24 9 1,224 11 10
Uninsured Drawn
Exceptionally Low 0.00% to 0.04% 42,128 - 100.00 0.03 20 2 869 3 2
Very Low 0.05% to 0.19% 38,042 - 100.00 0.18 21 8 2,863 14 8
Low 0.20% to 0.99% 25,471 - 100.00 0.61 23 20 4,975 34 21
Medium Low 1.00% to 2.99% 7,854 - 100.00 1.70 25 43 3,363 32 48
Medium 3.00% to 9.99% 1,597 - 100.00 5.21 24 79 1,261 19 94
High 10.00% to 19.99% 647 - 100.00 12.19 22 109 703 17 142
Extremely High 20.00% to 99.99% 625 - 100.00 33.60 22 125 779 47 218
Default 100% 242 - 100.00 100.00 60 - - 146 754
Sub-total 116,606 - 100.00 0.85 21 13 14,813 312 16
Qualifying Revolving Retail Exposures (QRRE)
Exceptionally Low 0.00% to 0.04% 7,574 14,987 24.47 0.04 73 2 168 2 3
Very Low 0.05% to 0.19% 7,556 10,007 36.08 0.16 69 6 471 9 8
Low 0.20% to 0.99% 9,731 7,586 48.51 0.50 76 16 1,562 36 21
Medium Low 1.00% to 2.99% 7,169 1,806 75.79 1.76 84 49 3,491 106 67
Medium 3.00% to 9.99% 2,435 211 92.58 5.42 86 109 2,657 113 167
High 10.00% to 19.99% 1,420 56 97.36 10.26 86 162 2,299 125 272
Extremely High 20.00% to 99.99% 853 18 102.06 38.00 80 209 1,786 255 584
Default 100% 199 - 100.00 100.00 86 - - 172 1,079
Sub-total 36,937 34,671 52.63 2.68 77 34 12,434 818 61
Other Retail
Exceptionally Low 0.00% to 0.04% 420 772 25.79 0.04 71 9 40 - 10
Very Low 0.05% to 0.19% 6,076 2 99.95 0.10 49 12 730 3 13
Low 0.20% to 0.99% 13,269 348 97.29 0.53 56 40 5,258 39 43
Medium Low 1.00% to 2.99% 4,461 11 99.68 1.89 63 80 3,588 54 95
Medium 3.00% to 9.99% 2,287 1 99.97 5.52 62 94 2,139 78 136
High 10.00% to 19.99% 24 - 99.04 13.98 80 153 37 3 293
Extremely High 20.00% to 99.99% 968 - 100.00 32.91 55 134 1,297 177 363
Default 100% 181 - 100.00 100.00 82 - - 149 1,027
Sub-total 27,686 1,134 97.51 2.85 56 47 13,089 503 70
Total Retail
Exceptionally Low 0.01% to 0.04% 136,250 15,759 95.57 0.01 27 1 1,110 5 1
Very Low 0.05% to 0.19% 63,640 36,536 79.27 0.15 30 7 4,686 29 8
Low 0.20% to 0.99% 52,362 13,608 86.34 0.55 41 24 12,525 114 27
Medium Low 1.00% to 2.99% 20,363 2,666 89.46 1.75 54 53 10,845 196 65
Medium 3.00% to 9.99% 6,543 380 95.99 5.39 61 96 6,276 214 137
High 10.00% to 19.99% 2,169 96 97.36 10.94 65 145 3,141 148 230
Extremely High 20.00% to 99.99% 2,527 33 100.58 34.84 54 158 3,983 486 398
Default 100% 639 - 100.00 100.00 75 - - 478 935
Total 284,493 69,078 89.86 1.01 34 15 42,566 1,670 22
RISK ASSESSMENT OF CREDIT RISK EXPOSURES - RETAIL AIRB PORTFOLIO
Q1 2016
EAD(3)
Notional of
undrawn
commitments
Exposure
weighted-
average EAD(4)
Exposure
weighted-
average PD
Exposure
weighted-
average LGD
Exposure
weighted-
average RW
RWA EL
EL adjusted
average risk
weight(5)
$ $ % % % % $ $
(1) Represents retail exposures under the AIRB Approach which are domiciled in Canada.
(2) New Revolving and home equity lines of credit models were implemented in Q4 2014, new Residential Mortgage models were implemented in Q1 2015, and new Term Loan models were implemented in Q3 2015.
(3) Amounts are before allowance for credit losses and before credit risk mitigation.
(5) EL adjusted average risk weight is calculated as (RWA + 12.5 X EL) / EAD.
(6) Includes Canadian residential mortgages and home equity lines of credit.
(7) The Bank uses the PD Substitution approach to reflect default insurance.
(4)
EAD rate represents combined drawn and undrawn exposure for a facility.
Page 19
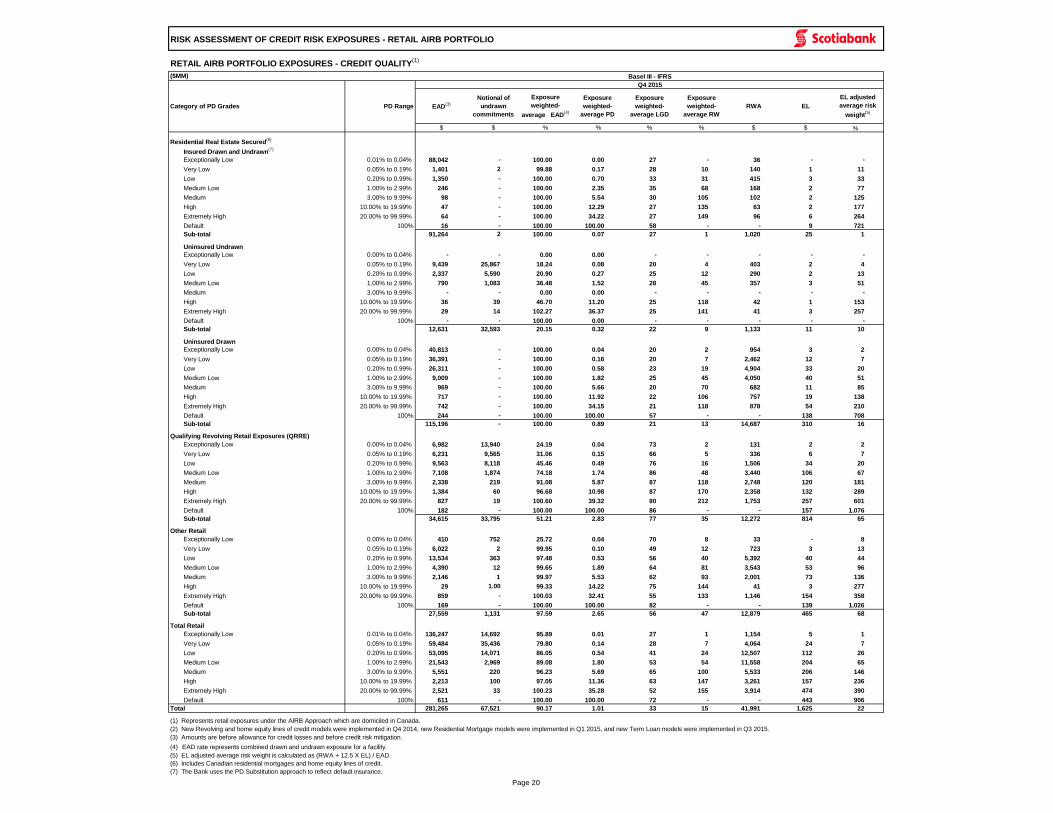
RETAIL AIRB PORTFOLIO EXPOSURES - CREDIT QUALITY(1)
($MM) Basel III - IFRS
Category of PD Grades PD Range
%
Residential Real Estate Secured(6)
Insured Drawn and Undrawn(7)
Exceptionally Low 0.01% to 0.04% 88,042 - 100.00 0.00 27 - 36 - -
Very Low 0.05% to 0.19% 1,401 2 99.88 0.17 28 10 140 1 11
Low 0.20% to 0.99% 1,350 - 100.00 0.70 33 31 415 3 33
Medium Low 1.00% to 2.99% 246 - 100.00 2.35 35 68 168 2 77
Medium 3.00% to 9.99% 98 - 100.00 5.54 30 105 102 2 125
High 10.00% to 19.99% 47 - 100.00 12.29 27 135 63 2 177
Extremely High 20.00% to 99.99% 64 - 100.00 34.22 27 149 96 6 264
Default 100% 16 - 100.00 100.00 58 - - 9 721
Sub-total 91,264 2 100.00 0.07 27 1 1,020 25 1
Uninsured Undrawn
Exceptionally Low 0.00% to 0.04% - - 0.00 0.00 - - - - -
Very Low 0.05% to 0.19% 9,439 25,867 18.24 0.08 20 4 403 2 4
Low 0.20% to 0.99% 2,337 5,590 20.90 0.27 25 12 290 2 13
Medium Low 1.00% to 2.99% 790 1,083 36.48 1.52 28 45 357 3 51
Medium 3.00% to 9.99% - - 0.00 0.00 - - - - -
High 10.00% to 19.99% 36 39 46.70 11.20 25 118 42 1 153
Extremely High 20.00% to 99.99% 29 14 102.27 36.37 25 141 41 3 257
Default 100% - - 100.00 0.00 - - - - -
Sub-total 12,631 32,593 20.15 0.32 22 9 1,133 11 10
Uninsured Drawn
Exceptionally Low 0.00% to 0.04% 40,813 - 100.00 0.04 20 2 954 3 2
Very Low 0.05% to 0.19% 36,391 - 100.00 0.16 20 7 2,462 12 7
Low 0.20% to 0.99% 26,311 - 100.00 0.58 23 19 4,904 33 20
Medium Low 1.00% to 2.99% 9,009 - 100.00 1.82 25 45 4,050 40 51
Medium 3.00% to 9.99% 969 - 100.00 5.66 20 70 682 11 85
High 10.00% to 19.99% 717 - 100.00 11.92 22 106 757 19 138
Extremely High 20.00% to 99.99% 742 - 100.00 34.15 21 118 878 54 210
Default 100% 244 - 100.00 100.00 57 - - 138 708
Sub-total 115,196 - 100.00 0.89 21 13 14,687 310 16
Qualifying Revolving Retail Exposures (QRRE)
Exceptionally Low 0.00% to 0.04% 6,982 13,940 24.19 0.04 73 2 131 2 2
Very Low 0.05% to 0.19% 6,231 9,565 31.06 0.15 66 5 336 6 7
Low 0.20% to 0.99% 9,563 8,118 45.46 0.49 76 16 1,506 34 20
Medium Low 1.00% to 2.99% 7,108 1,874 74.18 1.74 86 48 3,440 106 67
Medium 3.00% to 9.99% 2,338 219 91.08 5.87 87 118 2,748 120 181
High 10.00% to 19.99% 1,384 60 96.68 10.98 87 170 2,358 132 289
Extremely High 20.00% to 99.99% 827 19 100.60 39.32 80 212 1,753 257 601
Default 100% 182 - 100.00 100.00 86 - - 157 1,076
Sub-total 34,615 33,795 51.21 2.83 77 35 12,272 814 65
Other Retail
Exceptionally Low 0.00% to 0.04% 410 752 25.72 0.04 70 8 33 - 8
Very Low 0.05% to 0.19% 6,022 2 99.95 0.10 49 12 723 3 13
Low 0.20% to 0.99% 13,534 363 97.48 0.53 56 40 5,392 40 44
Medium Low 1.00% to 2.99% 4,390 12 99.65 1.89 64 81 3,543 53 96
Medium 3.00% to 9.99% 2,146 1 99.97 5.53 62 93 2,001 73 136
High 10.00% to 19.99% 29 1.00 99.33 14.22 75 144 41 3 277
Extremely High 20.00% to 99.99% 859 - 100.03 32.41 55 133 1,146 154 358
Default 100% 169 - 100.00 100.00 82 - - 139 1,026
Sub-total 27,559 1,131 97.59 2.65 56 47 12,879 465 68
Total Retail
Exceptionally Low 0.01% to 0.04% 136,247 14,692 95.89 0.01 27 1 1,154 5 1
Very Low 0.05% to 0.19% 59,484 35,436 79.80 0.14 28 7 4,064 24 7
Low 0.20% to 0.99% 53,095 14,071 86.05 0.54 41 24 12,507 112 26
Medium Low 1.00% to 2.99% 21,543 2,969 89.08 1.80 53 54 11,558 204 65
Medium 3.00% to 9.99% 5,551 220 96.23 5.69 65 100 5,533 206 146
High 10.00% to 19.99% 2,213 100 97.05 11.36 63 147 3,261 157 236
Extremely High 20.00% to 99.99% 2,521 33 100.23 35.28 52 155 3,914 474 390
Default 100% 611 - 100.00 100.00 72 - - 443 906
Total 281,265 67,521 90.17 1.01 33 15 41,991 1,625 22
RISK ASSESSMENT OF CREDIT RISK EXPOSURES - RETAIL AIRB PORTFOLIO
Q4 2015
EAD(3)
Notional of
undrawn
commitments
Exposure
weighted-
average EAD(4)
Exposure
weighted-
average PD
Exposure
weighted-
average LGD
Exposure
weighted-
average RW
RWA EL
EL adjusted
average risk
weight(5)
$ $ % % % % $ $
(4) EAD rate represents combined drawn and undrawn exposure for a facility.
(1) Represents retail exposures under the AIRB Approach which are domiciled in Canada.
(2) New Revolving and home equity lines of credit models were implemented in Q4 2014, new Residential Mortgage models were implemented in Q1 2015, and new Term Loan models were implemented in Q3 2015.
(3) Amounts are before allowance for credit losses and before credit risk mitigation.
(5) EL adjusted average risk weight is calculated as (RWA + 12.5 X EL) / EAD.
(6) Includes Canadian residential mortgages and home equity lines of credit.
(7) The Bank uses the PD Substitution approach to reflect default insurance.
Page 20
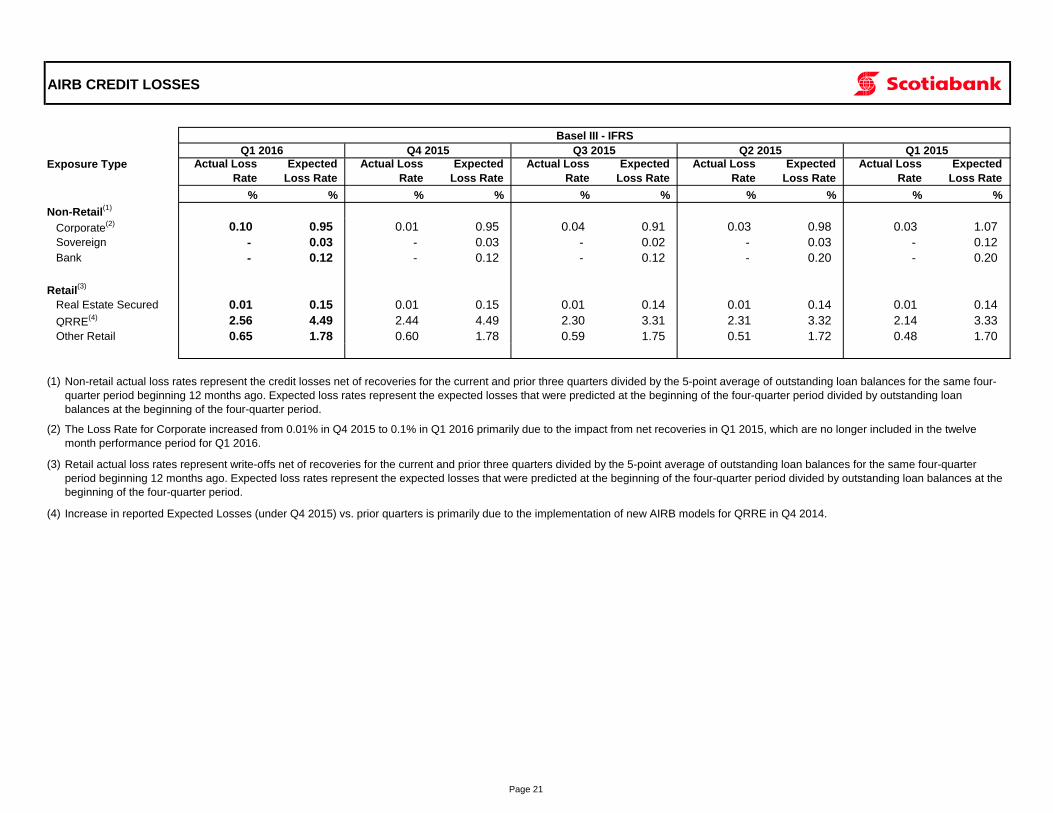
Basel III - IFRS
Actual Loss
Rate
Expected
Loss Rate
Actual Loss
Rate
Expected
Loss Rate
Actual Loss
Rate
Expected
Loss Rate
Actual Loss
Rate
Expected
Loss Rate
Actual Loss
Rate
Expected
Loss Rate
% % % % % % % % % %
Non-Retail(1)
Corporate(2) 0.10 0.95 0.01 0.95 0.04 0.91 0.03 0.98 0.03 1.07
Sovereign - 0.03 - 0.03 - 0.02 - 0.03 - 0.12
Bank - 0.12 - 0.12 - 0.12 - 0.20 - 0.20
Retail(3)
Real Estate Secured 0.01 0.15 0.01 0.15 0.01 0.14 0.01 0.14 0.01 0.14
QRRE(4) 2.56 4.49 2.44 4.49 2.30 3.31 2.31 3.32 2.14 3.33
Other Retail 0.65 1.78 0.60 1.78 0.59 1.75 0.51 1.72 0.48 1.70
(1)
(2)
(3)
(4)
Non-retail actual loss rates represent the credit losses net of recoveries for the current and prior three quarters divided by the 5-point average of outstanding loan balances for the same four-
quarter period beginning 12 months ago. Expected loss rates represent the expected losses that were predicted at the beginning of the four-quarter period divided by outstanding loan
balances at the beginning of the four-quarter period.
Retail actual loss rates represent write-offs net of recoveries for the current and prior three quarters divided by the 5-point average of outstanding loan balances for the same four-quarter
period beginning 12 months ago. Expected loss rates represent the expected losses that were predicted at the beginning of the four-quarter period divided by outstanding loan balances at the
beginning of the four-quarter period.
Increase in reported Expected Losses (under Q4 2015) vs. prior quarters is primarily due to the implementation of new AIRB models for QRRE in Q4 2014.
AIRB CREDIT LOSSES
Exposure Type
Q1 2016 Q4 2015 Q3 2015 Q2 2015 Q1 2015
The Loss Rate for Corporate increased from 0.01% in Q4 2015 to 0.1% in Q1 2016 primarily due to the impact from net recoveries in Q1 2015, which are no longer included in the twelve
month performance period for Q1 2016.
Page 21
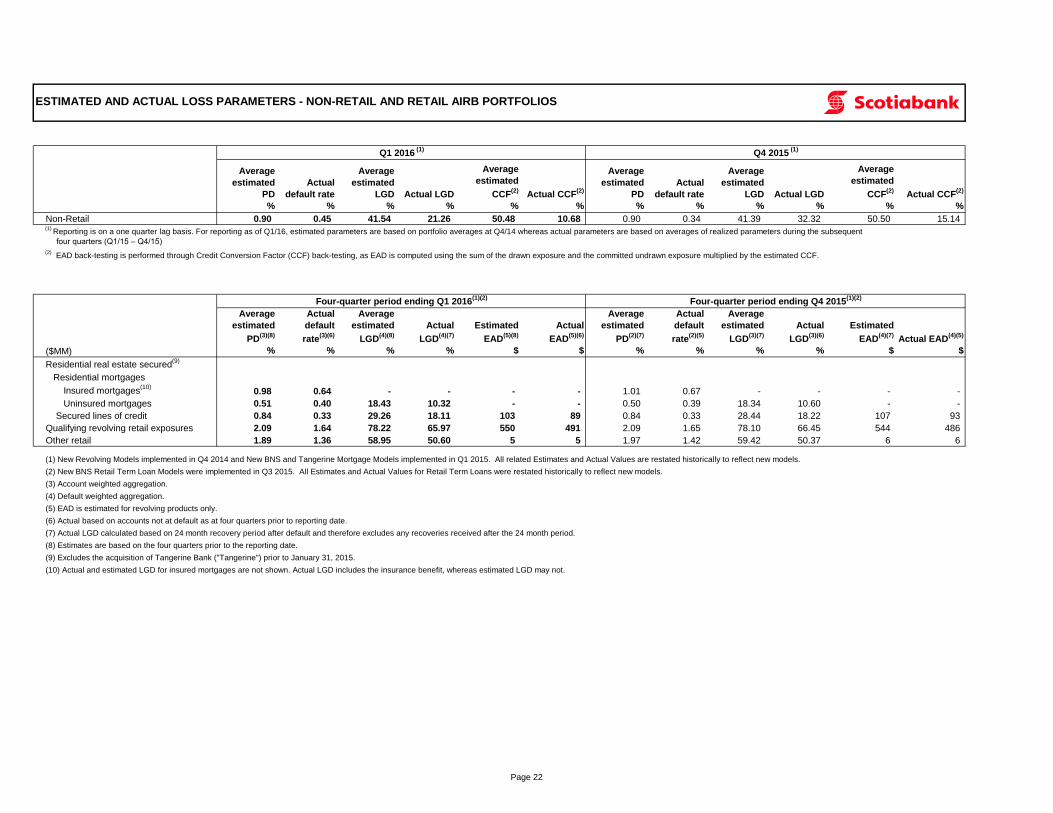
Q1 2016 (1)
Q4 2015 (1)
Average
estimated
PD
%
Actual
default rate
%
Average
estimated
LGD
%
Actual LGD
%
Average
estimated
CCF(2)
%
Actual CCF(2)
%
Average
estimated
PD
%
Actual
default rate
%
Average
estimated
LGD
%
Actual LGD
%
Average
estimated
CCF(2)
%
Actual CCF(2)
%
Non-Retail 0.90 0.45 41.54 21.26 50.48 10.68 0.90 0.34 41.39 32.32 50.50 15.14
(2) EAD back-testing is performed through Credit Conversion Factor (CCF) back-testing, as EAD is computed using the sum of the drawn exposure and the committed undrawn exposure multiplied by the estimated CCF.
Four-quarter period ending Q1 2016(1)(2)
Four-quarter period ending Q4 2015(1)(2)
($MM)
Average
estimated
PD(3)(8)
%
Actual
default
rate(3)(6)
%
Average
estimated
LGD(4)(8)
%
Actual
LGD(4)(7)
%
Estimated
EAD(5)(8)
$
Actual
EAD(5)(6)
$
Average
estimated
PD(2)(7)
%
Actual
default
rate(2)(5)
%
Average
estimated
LGD(3)(7)
%
Actual
LGD(3)(6)
%
Estimated
EAD(4)(7)
$
Actual EAD(4)(5)
$
Residential real estate secured(9)
Residential mortgages
Insured mortgages(10)
0.98 0.64 - - - - 1.01 0.67 - - - -
Uninsured mortgages 0.51 0.40 18.43 10.32 - - 0.50 0.39 18.34 10.60 - -
Secured lines of credit 0.84 0.33 29.26 18.11 103 89 0.84 0.33 28.44 18.22 107 93
Qualifying revolving retail exposures 2.09 1.64 78.22 65.97 550 491 2.09 1.65 78.10 66.45 544 486
Other retail 1.89 1.36 58.95 50.60 5 5 1.97 1.42 59.42 50.37 6 6
(1) New Revolving Models implemented in Q4 2014 and New BNS and Tangerine Mortgage Models implemented in Q1 2015. All related Estimates and Actual Values are restated historically to reflect new models.
(2) New BNS Retail Term Loan Models were implemented in Q3 2015. All Estimates and Actual Values for Retail Term Loans were restated historically to reflect new models.
(3) Account weighted aggregation.
(4) Default weighted aggregation.
(5) EAD is estimated for revolving products only.
(6) Actual based on accounts not at default as at four quarters prior to reporting date.
(7) Actual LGD calculated based on 24 month recovery period after default and therefore excludes any recoveries received after the 24 month period.
(8) Estimates are based on the four quarters prior to the reporting date.
(9) Excludes the acquisition of Tangerine Bank ("Tangerine") prior to January 31, 2015.
(10) Actual and estimated LGD for insured mortgages are not shown. Actual LGD includes the insurance benefit, whereas estimated LGD may not.
ESTIMATED AND ACTUAL LOSS PARAMETERS - NON-RETAIL AND RETAIL AIRB PORTFOLIOS
(1) Reporting is on a one quarter lag basis. For reporting as of Q1/16, estimated parameters are based on portfolio averages at Q4/14 whereas actual parameters are based on averages of realized parameters during the subsequent
four quarters (Q1/15 – Q4/15)
Page 22
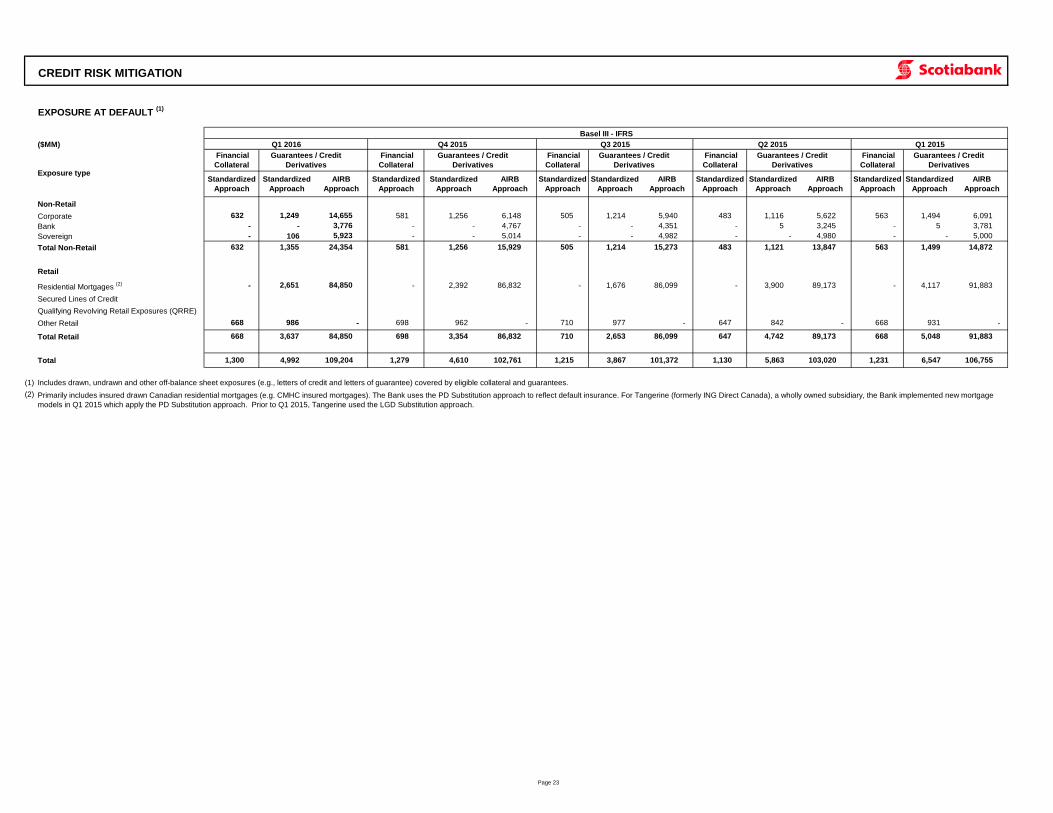
EXPOSURE AT DEFAULT (1)
Basel III - IFRS
($MM)
Non-Retail
Corporate
Bank
Sovereign
Total Non-Retail
Retail
Residential Mortgages (2)
Secured Lines of Credit
Qualifying Revolving Retail Exposures (QRRE)
Other Retail
Total Retail
Total
(1) Includes drawn, undrawn and other off-balance sheet exposures (e.g., letters of credit and letters of guarantee) covered by eligible collateral and guarantees.
(2)
698 962 -
698 3,354 86,832
1,279 4,610 102,761
Q4 2015
Financial
Collateral
Guarantees / Credit
Derivatives
Standardized
Approach
Standardized
Approach
AIRB
Approach
581 1,256 6,148
CREDIT RISK MITIGATION
Q1 2016 Q3 2015
Standardized
Approach
Standardized
Approach
AIRB
Approach
Standardized
Approach
Standardized
Approach
AIRB
Approach
Financial
Collateral
Guarantees / Credit
Derivatives
Financial
Collateral
Guarantees / Credit
Derivatives
Q2 2015 Q1 2015
Exposure type
Financial
Collateral
Guarantees / Credit
Derivatives
Financial
Collateral
Guarantees / Credit
Derivatives
Standardized
Approach
Standardized
Approach
AIRB
Approach
Standardized
Approach
Standardized
Approach
AIRB
Approach
483 1,116 5,622 563 1,494 6,091632 1,249 14,655 505 1,214 5,940
- 5 3,245 - 5 3,781 - - 3,776 - - 4,351 - - 4,767
- - 4,980 - - 5,000 - 106 5,923 - - 4,982 - - 5,014
483 1,121 13,847 563 1,499 14,872632 1,355 24,354 505 1,214 15,273581 1,256 15,929
- 2,651 84,850 - 1,676 86,099 - - 2,392 86,832 3,900 89,173 - 4,117 91,883
6,547 106,755
Primarily includes insured drawn Canadian residential mortgages (e.g. CMHC insured mortgages). The Bank uses the PD Substitution approach to reflect default insurance. For Tangerine (formerly ING Direct Canada), a wholly owned subsidiary, the Bank implemented new mortgage
models in Q1 2015 which apply the PD Substitution approach. Prior to Q1 2015, Tangerine used the LGD Substitution approach.
668 986 - 710 977 - 647 842 - 668 931 -
91,883
1,300 4,992 109,204 1,215 3,867 101,372 1,130 5,863 103,020
86,099 647 4,742 89,173 668 5,048668 3,637 84,850 710 2,653
1,231
Page 23
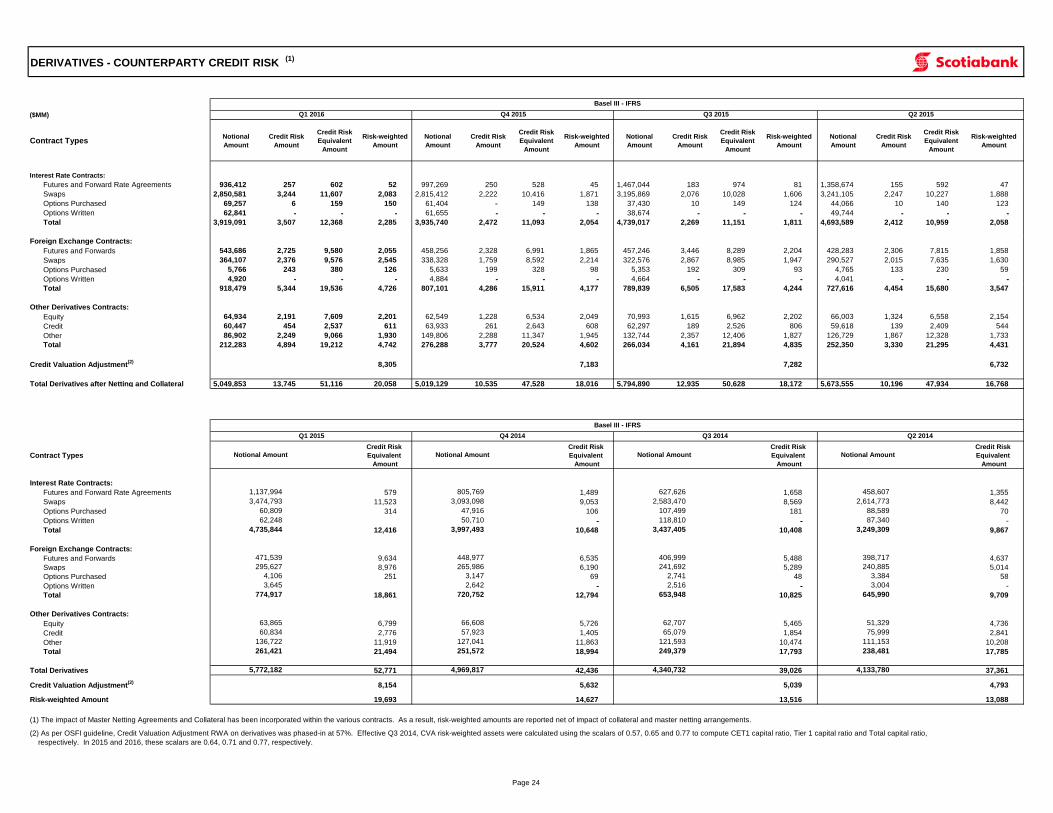
Basel III - IFRS
($MM)
Contract TypesNotional
Amount
Credit Risk
Amount
Credit Risk
Equivalent
Amount
Risk-weighted
Amount
Notional
Amount
Credit Risk
Amount
Credit Risk
Equivalent
Amount
Risk-weighted
Amount
Notional
Amount
Credit Risk
Amount
Credit Risk
Equivalent
Amount
Risk-weighted
Amount
Notional
Amount
Credit Risk
Amount
Credit Risk
Equivalent
Amount
Risk-weighted
Amount
Interest Rate Contracts:
Futures and Forward Rate Agreements 936,412 257 602 52 997,269 250 528 45 1,467,044 183 974 81 1,358,674 155 592 47
Swaps 2,850,581 3,244 11,607 2,083 2,815,412 2,222 10,416 1,871 3,195,869 2,076 10,028 1,606 3,241,105 2,247 10,227 1,888
Options Purchased 69,257 6 159 150 61,404 - 149 138 37,430 10 149 124 44,066 10 140 123
Options Written 62,841 - - - 61,655 - - - 38,674 - - - 49,744 - - -
Total 3,919,091 3,507 12,368 2,285 3,935,740 2,472 11,093 2,054 4,739,017 2,269 11,151 1,811 4,693,589 2,412 10,959 2,058
Foreign Exchange Contracts:
Futures and Forwards 543,686 2,725 9,580 2,055 458,256 2,328 6,991 1,865 457,246 3,446 8,289 2,204 428,283 2,306 7,815 1,858
Swaps 364,107 2,376 9,576 2,545 338,328 1,759 8,592 2,214 322,576 2,867 8,985 1,947 290,527 2,015 7,635 1,630
Options Purchased 5,766 243 380 126 5,633 199 328 98 5,353 192 309 93 4,765 133 230 59
Options Written 4,920 - - - 4,884 - - - 4,664 - - - 4,041 - - -
Total 918,479 5,344 19,536 4,726 807,101 4,286 15,911 4,177 789,839 6,505 17,583 4,244 727,616 4,454 15,680 3,547
Other Derivatives Contracts:
Equity 64,934 2,191 7,609 2,201 62,549 1,228 6,534 2,049 70,993 1,615 6,962 2,202 66,003 1,324 6,558 2,154
Credit 60,447 454 2,537 611 63,933 261 2,643 608 62,297 189 2,526 806 59,618 139 2,409 544
Other 86,902 2,249 9,066 1,930 149,806 2,288 11,347 1,945 132,744 2,357 12,406 1,827 126,729 1,867 12,328 1,733
Total 212,283 4,894 19,212 4,742 276,288 3,777 20,524 4,602 266,034 4,161 21,894 4,835 252,350 3,330 21,295 4,431
Credit Valuation Adjustment(2)
8,305 7,183 7,282 6,732
Total Derivatives after Netting and Collateral 5,049,853 13,745 51,116 20,058 5,019,129 10,535 47,528 18,016 5,794,890 12,935 50,628 18,172 5,673,555 10,196 47,934 16,768
Contract Types
Credit Risk
Equivalent
Amount
Credit Risk
Equivalent
Amount
Credit Risk
Equivalent
Amount
Credit Risk
Equivalent
Amount
Interest Rate Contracts:
Futures and Forward Rate Agreements 579 1,489 1,658 1,355
Swaps 11,523 9,053 8,569 8,442
Options Purchased 314 106 181 70
Options Written
- - - -
Total 12,416 10,648 10,408 9,867
Foreign Exchange Contracts:
Futures and Forwards 9,634 6,535 5,488 4,637
Swaps 8,976 6,190 5,289 5,014
Options Purchased 251 69 48 58
Options Written
- - - -
Total 18,861 12,794 10,825 9,709
Other Derivatives Contracts:
Equity 6,799 5,726 5,465 4,736
Credit 2,776 1,405 1,854 2,841
Other 11,919 11,863 10,474 10,208
Total 21,494 18,994 17,793 17,785
Total Derivatives 52,771 42,436 39,026 37,361
Credit Valuation Adjustment(2)
8,154 5,632 5,039 4,793
Risk-weighted Amount 19,693 14,627 13,516 13,088
Basel III - IFRS
DERIVATIVES - COUNTERPARTY CREDIT RISK (1)
Q1 2016 Q4 2015 Q3 2015 Q2 2015
Q1 2015 Q4 2014 Q3 2014 Q2 2014
Notional Amount Notional Amount Notional Amount Notional Amount
1,137,994 805,769 627,626 458,607
3,474,793 3,093,098 2,583,470 2,614,773
60,809 47,916 107,499 88,589
62,248 50,710 118,810 87,340
4,735,844 3,997,493 3,437,405 3,249,309
471,539 448,977 406,999 398,717
295,627 265,986 241,692 240,885
4,106 3,147 2,741 3,384
60,834 57,923 65,079 75,999
3,645 2,642 2,516 3,004
774,917 720,752 653,948 645,990
63,865 66,608 62,707 51,329
(2) As per OSFI guideline, Credit Valuation Adjustment RWA on derivatives was phased-in at 57%. Effective Q3 2014, CVA risk-weighted assets were calculated using the scalars of 0.57, 0.65 and 0.77 to compute CET1 capital ratio, Tier 1 capital ratio and Total capital ratio,
respectively. In 2015 and 2016, these scalars are 0.64, 0.71 and 0.77, respectively.
136,722 127,041 121,593 111,153
261,421 251,572 249,379 238,481
5,772,182 4,969,817 4,340,732 4,133,780
(1) The impact of Master Netting Agreements and Collateral has been incorporated within the various contracts. As a result, risk-weighted amounts are reported net of impact of collateral and master netting arrangements.
Page 24
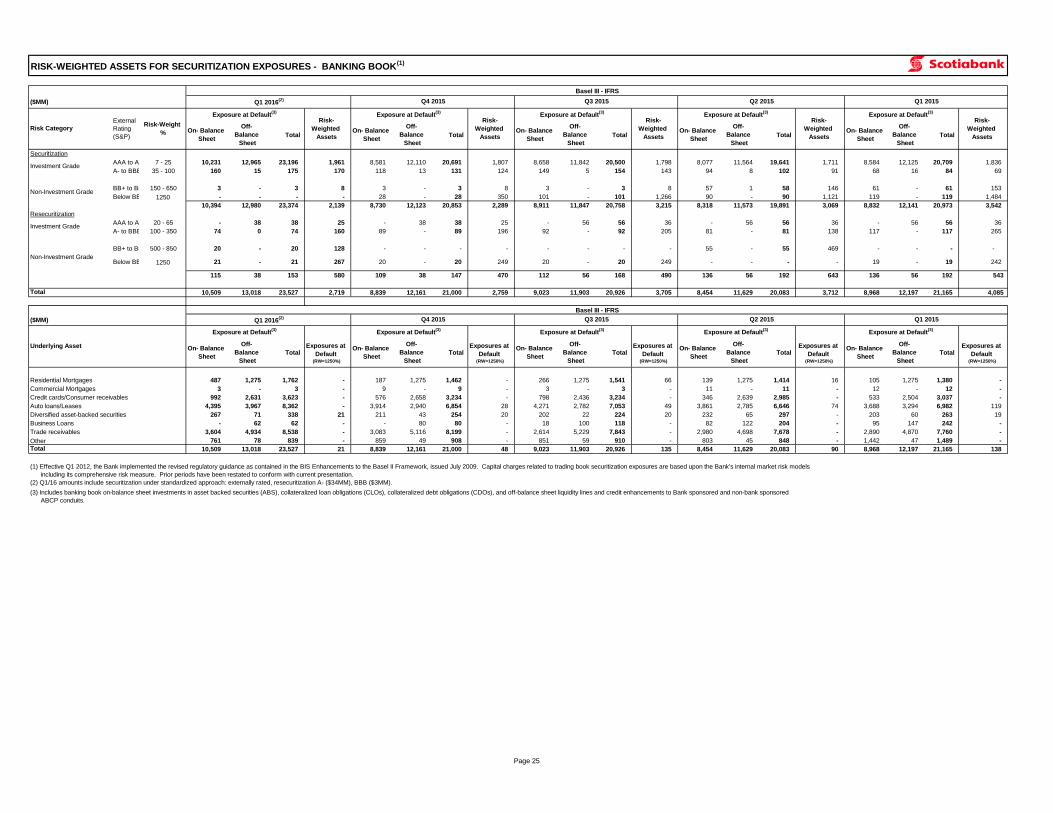
Basel III - IFRS
($MM)
Total Total Total Total Total
Securitization
AAA to A 7 - 25 10,231 12,965 23,196 1,961 8,581 12,110 20,691 1,807 8,658 11,842 20,500 1,798 8,077 11,564 19,641 1,711 8,584 12,125 20,709 1,836
A- to BBB- 35 - 100 160 15 175 170 118 13 131 124 149 5 154 143 94 8 102 91 68 16 84 69
BB+ to BB- 150 - 650 3 - 3 8 3 - 3 8 3 - 3 8 57 1 58 146 61 - 61 153
Below BB- 1250 - - - - 28 - 28 350 101 - 101 1,266 90 - 90 1,121 119 - 119 1,484
10,394 12,980 23,374 2,139 8,730 12,123 20,853 2,289 8,911 11,847 20,758 3,215 8,318 11,573 19,891 3,069 8,832 12,141 20,973 3,542
Resecuritization
AAA to A 20 - 65 - 38 38 25 - 38 38 25 - 56 56 36 - 56 56 36 - 56 56 36
A- to BBB- 100 - 350 74 0 74 160 89 - 89 196 92 - 92 205 81 - 81 138 117 - 117 265
BB+ to BB- 500 - 850 20 - 20 128 - - - - - - - - 55 - 55 469 - - - -
Below BB- 1250 21 - 21 267 20 - 20 249 20 - 20 249 - - - - 19 - 19 242
115 38 153 580 109 38 147 470 112 56 168 490 136 56 192 643 136 56 192 543
10,509 13,018 23,527 2,719 8,839 12,161 21,000 2,759 9,023 11,903 20,926 3,705 8,454 11,629 20,083 3,712 8,968 12,197 21,165 4,085
($MM)
TotalExposures at
Default (RW=1250%)
TotalExposures at
Default (RW=1250%)
TotalExposures at
Default (RW=1250%)
TotalExposures at
Default (RW=1250%)
TotalExposures at
Default (RW=1250%)
Residential Mortgages 487 1,275 1,762 - 187 1,275 1,462 - 266 1,275 1,541 66 139 1,275 1,414 16 105 1,275 1,380 -
Commercial Mortgages 3 - 3 - 9 - 9 - 3 - 3 - 11 - 11 - 12 - 12 -
Credit cards/Consumer receivables 992 2,631 3,623 - 576 2,658 3,234 - 798 2,436 3,234 - 346 2,639 2,985 - 533 2,504 3,037 -
Auto loans/Leases 4,395 3,967 8,362 - 3,914 2,940 6,854 28 4,271 2,782 7,053 49 3,861 2,785 6,646 74 3,688 3,294 6,982 119
Diversified asset-backed securities 267 71 338 21 211 43 254 20 202 22 224 20 232 65 297 - 203 60 263 19
Business Loans - 62 62 - - 80 80 - 18 100 118 - 82 122 204 - 95 147 242 -
Trade receivables 3,604 4,934 8,538 - 3,083 5,116 8,199 - 2,614 5,229 7,843 - 2,980 4,698 7,678 - 2,890 4,870 7,760 -
Other 761 78 839 - 859 49 908 - 851 59 910 - 803 45 848 - 1,442 47 1,489 -
10,509 13,018 23,527 21 8,839 12,161 21,000 48 9,023 11,903 20,926 135 8,454 11,629 20,083 90 8,968 12,197 21,165 138
Off-
Balance
Sheet
On- Balance
Sheet
Off-
Balance
Sheet
Risk-
Weighted
Assets
Exposure at Default(3)
Risk-
Weighted
Assets
Exposure at Default(3)
Risk-
Weighted
Assets
Exposure at Default(3)
On- Balance
Sheet
Off-
Balance
Sheet
RISK-WEIGHTED ASSETS FOR SECURITIZATION EXPOSURES - BANKING BOOK(1)
Q1 2016(2) Q3 2015 Q2 2015 Q1 2015Q4 2015
Risk-
Weighted
AssetsOn- Balance
Sheet
Off-
Balance
Sheet
On- Balance
Sheet
Investment Grade
Exposure at Default(3)
Investment Grade
Non-Investment Grade
Risk Category
External
Rating
(S&P)
Risk-Weight
%
Exposure at Default(3)
Risk-
Weighted
AssetsOn- Balance
Sheet
Off-
Balance
Sheet
Non-Investment Grade
Total
Q1 2016(2) Q3 2015Q4 2015
Basel III - IFRS
Q2 2015 Q1 2015
Underlying Asset
Exposure at Default(3)
Exposure at Default(3)
Total
(1) Effective Q1 2012, the Bank implemented the revised regulatory guidance as contained in the BIS Enhancements to the Basel II Framework, issued July 2009. Capital charges related to trading book securitization exposures are based upon the Bank's internal market risk models
including its comprehensive risk measure. Prior periods have been restated to conform with current presentation.
(2) Q1/16 amounts include securitization under standardized approach: externally rated, resecuritization A- ($34MM), BBB ($3MM).
(3) Includes banking book on-balance sheet investments in asset backed securities (ABS), collateralized loan obligations (CLOs), collateralized debt obligations (CDOs), and off-balance sheet liquidity lines and credit enhancements to Bank sponsored and non-bank sponsored
ABCP conduits.
Exposure at Default(3)
On- Balance
Sheet
Off-
Balance
Sheet
On- Balance
Sheet
Off-
Balance
Sheet
On- Balance
Sheet
Off-
Balance
Sheet
On- Balance
Sheet
Off-
Balance
Sheet
Exposure at Default(3)
On- Balance
Sheet
Off-
Balance
Sheet
Exposure at Default(3)
Page 25
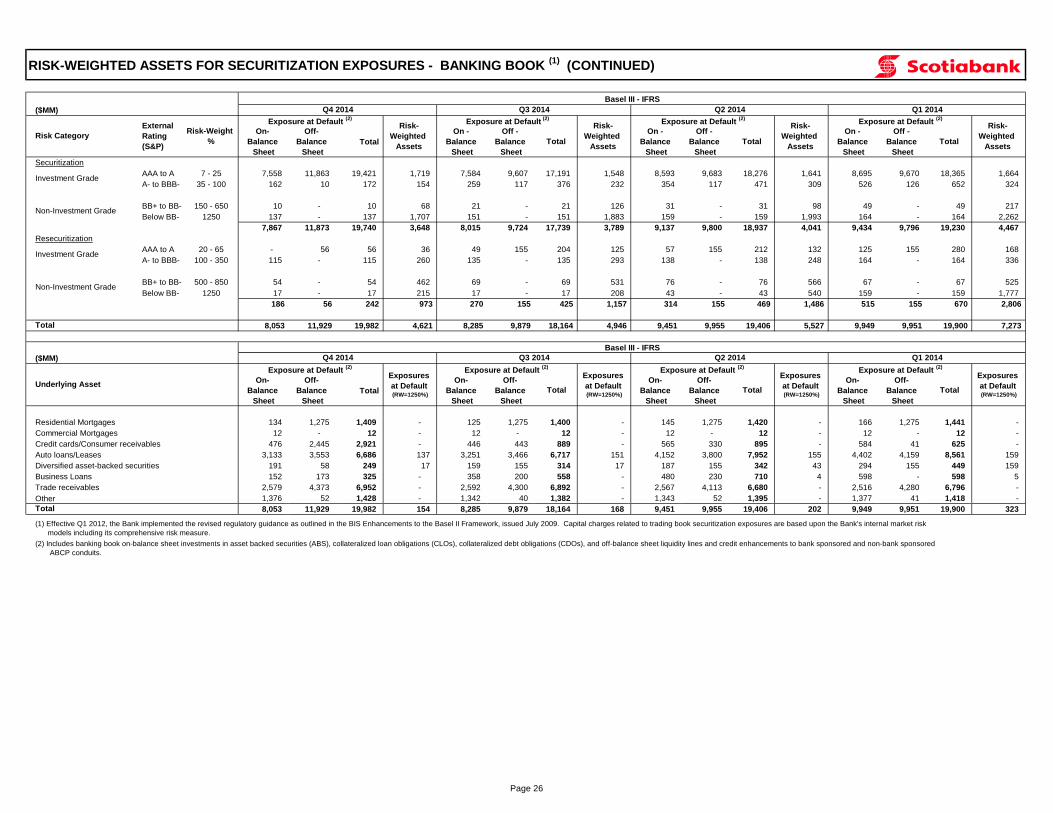
($MM)
Total
Securitization
AAA to A 7 - 25 7,558 11,863 19,421 1,719 7,584 9,607 17,191 1,548 8,593 9,683 18,276 1,641 8,695 9,670 18,365 1,664
A- to BBB- 35 - 100 162 10 172 154 259 117 376 232 354 117 471 309 526 126 652 324
BB+ to BB- 150 - 650 10 - 10 68 21 - 21 126 31 - 31 98 49 - 49 217
Below BB- 1250 137 - 137 1,707 151 - 151 1,883 159 - 159 1,993 164 - 164 2,262
7,867 11,873 19,740 3,648 8,015 9,724 17,739 3,789 9,137 9,800 18,937 4,041 9,434 9,796 19,230 4,467
Resecuritization
AAA to A 20 - 65 - 56 56 36 49 155 204 125 57 155 212 132 125 155 280 168
A- to BBB- 100 - 350 115 - 115 260 135 - 135 293 138 - 138 248 164 - 164 336
BB+ to BB- 500 - 850 54 - 54 462 69 - 69 531 76 - 76 566 67 - 67 525
Below BB- 1250 17 - 17 215 17 - 17 208 43 - 43 540 159 - 159 1,777
186 56 242 973 270 155 425 1,157 314 155 469 1,486 515 155 670 2,806
8,053 11,929 19,982 4,621 8,285 9,879 18,164 4,946 9,451 9,955 19,406 5,527 9,949 9,951 19,900 7,273
($MM)
Total
Residential Mortgages 134 1,275 1,409 - 125 1,275 1,400 - 145 1,275 1,420 - 166 1,275 1,441 -
Commercial Mortgages 12 - 12 - 12 - 12 - 12 - 12 - 12 - 12 -
Credit cards/Consumer receivables 476 2,445 2,921 - 446 443 889 - 565 330 895 - 584 41 625 -
Auto loans/Leases 3,133 3,553 6,686 137 3,251 3,466 6,717 151 4,152 3,800 7,952 155 4,402 4,159 8,561 159
Diversified asset-backed securities 191 58 249 17 159 155 314 17 187 155 342 43 294 155 449 159
Business Loans 152 173 325 - 358 200 558 - 480 230 710 4 598 - 598 5
Trade receivables 2,579 4,373 6,952 - 2,592 4,300 6,892 - 2,567 4,113 6,680 - 2,516 4,280 6,796 -
Other 1,376 52 1,428 - 1,342 40 1,382 - 1,343 52 1,395 - 1,377 41 1,418 -
8,053 11,929 19,982 154 8,285 9,879 18,164 168 9,451 9,955 19,406 202 9,949 9,951 19,900 323
RISK-WEIGHTED ASSETS FOR SECURITIZATION EXPOSURES - BANKING BOOK (1)
(CONTINUED)
Basel III - IFRS
Q4 2014 Q3 2014 Q2 2014 Q1 2014
TotalRisk Category
External
Rating
(S&P)
Risk-Weight
%
Exposure at Default (2)
Risk-
Weighted
Assets
Exposure at Default (2)
Basel III - IFRS
On -
Balance
Sheet
Off -
Balance
Sheet
Total
On -
Balance
Sheet
Off -
Balance
Sheet
Total
Risk-
Weighted
Assets
Exposure at Default (2)
Risk-
Weighted
Assets
Exposure at Default (2)
Risk-
Weighted
Assets
On-
Balance
Sheet
Off-
Balance
Sheet
On -
Balance
Sheet
Off -
Balance
Sheet
Investment Grade
Non-Investment Grade
Investment Grade
Non-Investment Grade
Total
Q4 2014 Q3 2014 Q2 2014 Q1 2014
Underlying Asset
Exposure at Default (2)
Exposures
at Default (RW=1250%)
Exposure at Default (2)
Exposures
at Default (RW=1250%)
On-
Balance
Sheet
Off-
Balance
Sheet
On-
Balance
Sheet
Off-
Balance
Sheet
Total Total
Exposures
at Default (RW=1250%)
Exposure at Default (2)
Exposures
at Default (RW=1250%)
Exposure at Default (2)
On-
Balance
Sheet
Off-
Balance
Sheet
Total
On-
Balance
Sheet
Off-
Balance
Sheet
Total
(1) Effective Q1 2012, the Bank implemented the revised regulatory guidance as outlined in the BIS Enhancements to the Basel II Framework, issued July 2009. Capital charges related to trading book securitization exposures are based upon the Bank's internal market risk
models including its comprehensive risk measure.
(2) Includes banking book on-balance sheet investments in asset backed securities (ABS), collateralized loan obligations (CLOs), collateralized debt obligations (CDOs), and off-balance sheet liquidity lines and credit enhancements to bank sponsored and non-bank sponsored
ABCP conduits.
Page 26
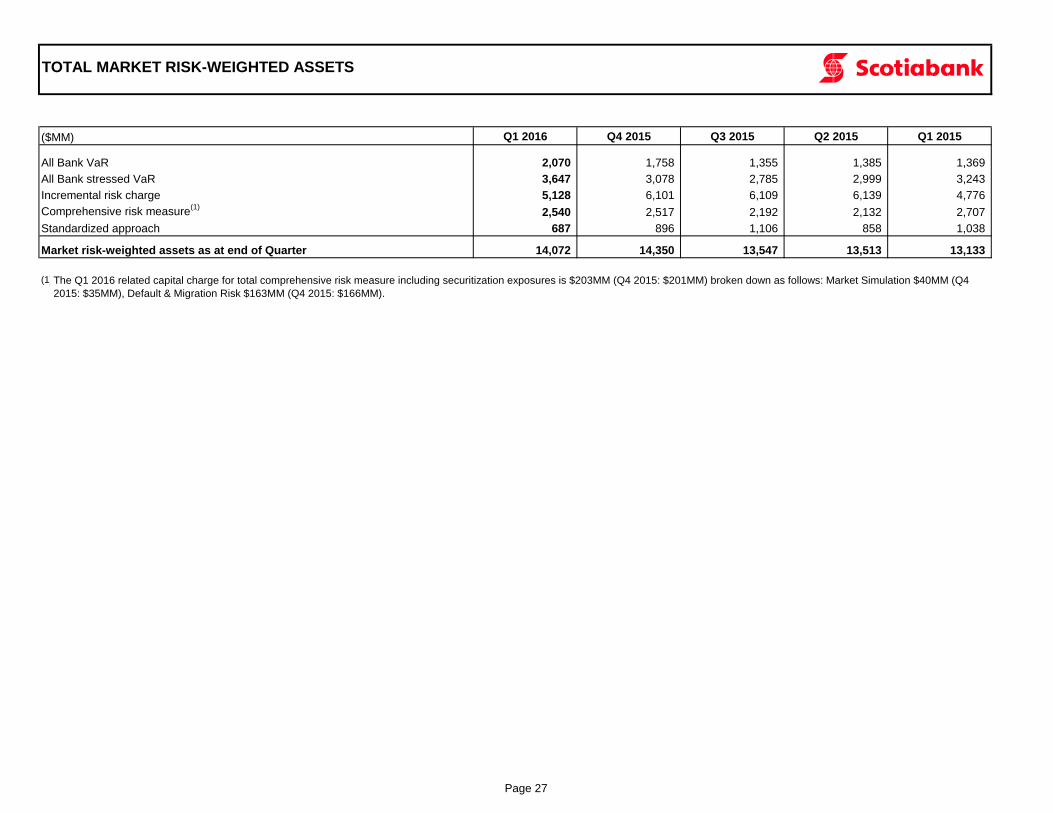
TOTAL MARKET RISK-WEIGHTED ASSETS
($MM) Q1 2016 Q4 2015 Q3 2015 Q2 2015 Q1 2015
All Bank VaR 2,070 1,758 1,355 1,385 1,369
All Bank stressed VaR 3,647 3,078 2,785 2,999 3,243
Incremental risk charge 5,128 6,101 6,109 6,139 4,776
Comprehensive risk measure(1)
2,540 2,517 2,192 2,132 2,707
Standardized approach 687 896 1,106 858 1,038
Market risk-weighted assets as at end of Quarter 14,072 14,350 13,547 13,513 13,133
(1)The Q1 2016 related capital charge for total comprehensive risk measure including securitization exposures is $203MM (Q4 2015: $201MM) broken down as follows: Market Simulation $40MM (Q4
2015: $35MM), Default & Migration Risk $163MM (Q4 2015: $166MM).
Page 27
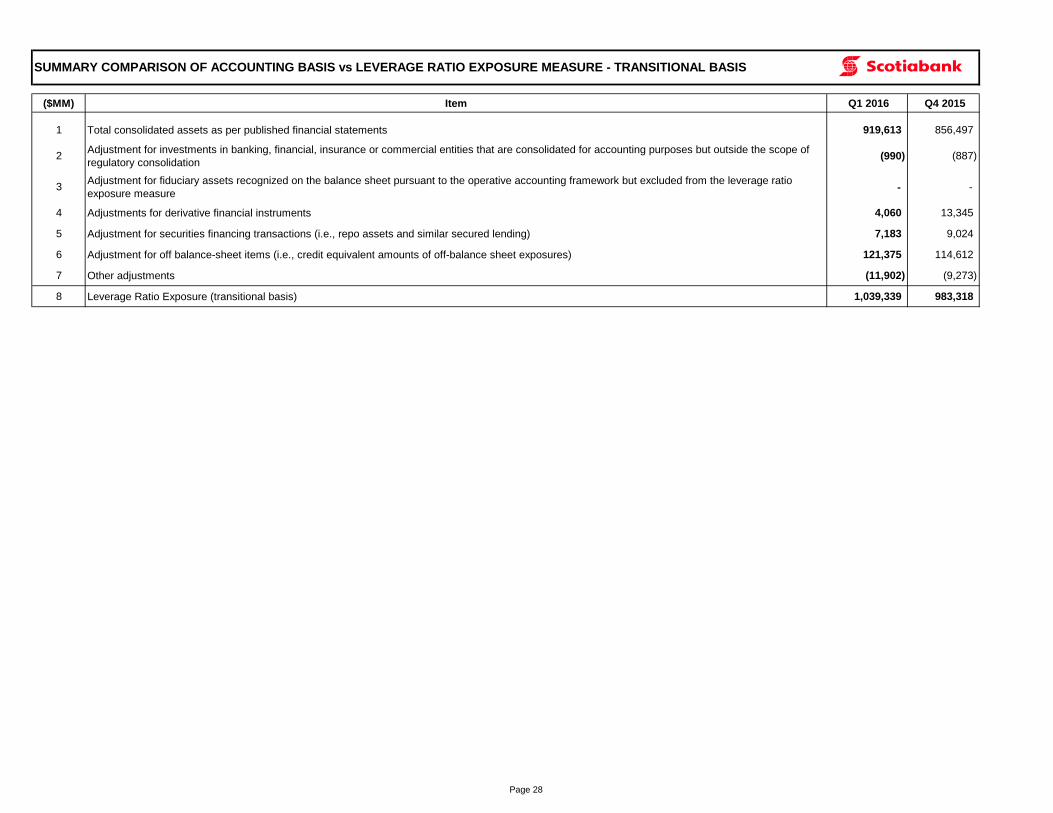
($MM) Item Q1 2016 Q4 2015
1 Total consolidated assets as per published financial statements 919,613 856,497
2Adjustment for investments in banking, financial, insurance or commercial entities that are consolidated for accounting purposes but outside the scope of
regulatory consolidation(990) (887)
3Adjustment for fiduciary assets recognized on the balance sheet pursuant to the operative accounting framework but excluded from the leverage ratio
exposure measure - -
4 Adjustments for derivative financial instruments 4,060 13,345
5 Adjustment for securities financing transactions (i.e., repo assets and similar secured lending) 7,183 9,024
6 Adjustment for off balance-sheet items (i.e., credit equivalent amounts of off-balance sheet exposures) 121,375 114,612
7 Other adjustments (11,902) (9,273)
8 Leverage Ratio Exposure (transitional basis) 1,039,339 983,318
SUMMARY COMPARISON OF ACCOUNTING BASIS vs LEVERAGE RATIO EXPOSURE MEASURE - TRANSITIONAL BASIS
Page 28
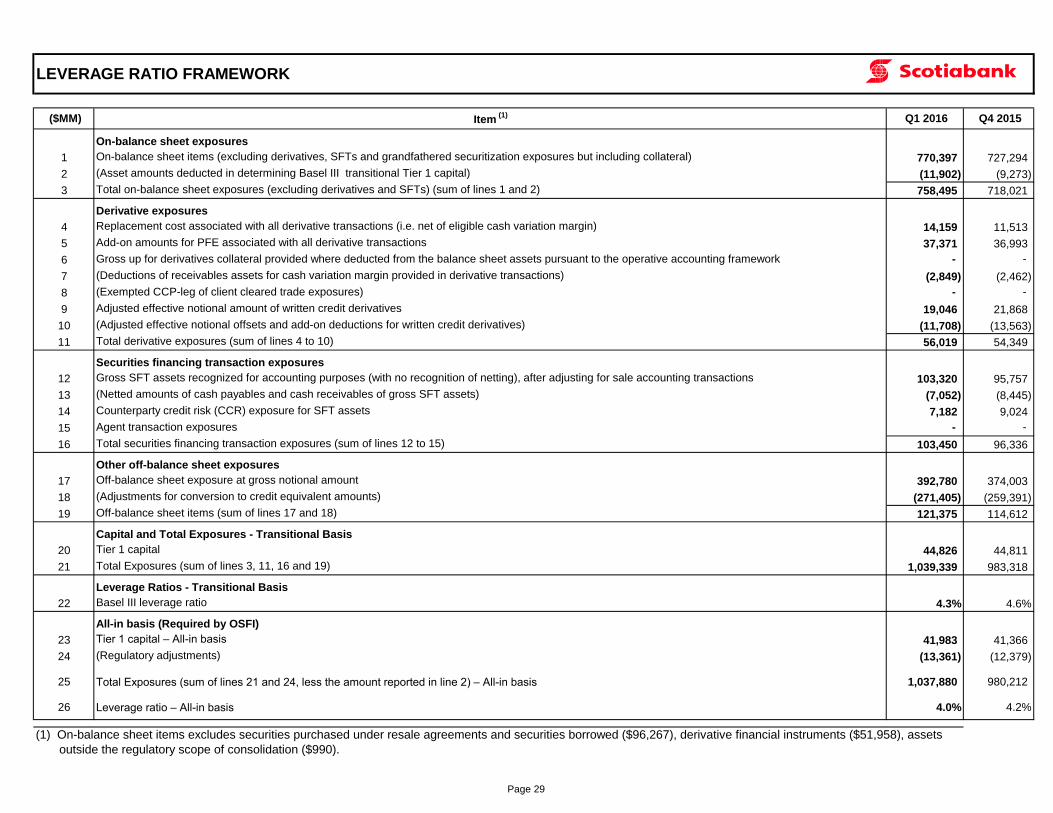
On-balance sheet exposures
1 On-balance sheet items (excluding derivatives, SFTs and grandfathered securitization exposures but including collateral) 770,397 727,294
2 (Asset amounts deducted in determining Basel III transitional Tier 1 capital) (11,902) (9,273)
3 Total on-balance sheet exposures (excluding derivatives and SFTs) (sum of lines 1 and 2) 758,495 718,021
Derivative exposures
4 Replacement cost associated with all derivative transactions (i.e. net of eligible cash variation margin) 14,159 11,513
5 Add-on amounts for PFE associated with all derivative transactions 37,371 36,993
6 Gross up for derivatives collateral provided where deducted from the balance sheet assets pursuant to the operative accounting framework - -
7 (Deductions of receivables assets for cash variation margin provided in derivative transactions) (2,849) (2,462)
8 (Exempted CCP-leg of client cleared trade exposures) - -
9 Adjusted effective notional amount of written credit derivatives 19,046 21,868
10 (Adjusted effective notional offsets and add-on deductions for written credit derivatives) (11,708) (13,563)
11 Total derivative exposures (sum of lines 4 to 10) 56,019 54,349
Securities financing transaction exposures
12 Gross SFT assets recognized for accounting purposes (with no recognition of netting), after adjusting for sale accounting transactions 103,320 95,757
13 (Netted amounts of cash payables and cash receivables of gross SFT assets) (7,052) (8,445)
14 Counterparty credit risk (CCR) exposure for SFT assets 7,182 9,024
15 Agent transaction exposures - -
16 Total securities financing transaction exposures (sum of lines 12 to 15) 103,450 96,336
Other off-balance sheet exposures
17 Off-balance sheet exposure at gross notional amount 392,780 374,003
18 (Adjustments for conversion to credit equivalent amounts) (271,405) (259,391)
19 Off-balance sheet items (sum of lines 17 and 18) 121,375 114,612
Capital and Total Exposures - Transitional Basis
20 Tier 1 capital 44,826 44,811
21 Total Exposures (sum of lines 3, 11, 16 and 19) 1,039,339 983,318
Leverage Ratios - Transitional Basis
22 Basel III leverage ratio 4.3% 4.6%
All-in basis (Required by OSFI)
23 Tier 1 capital – All-in basis 41,983 41,366
24 (Regulatory adjustments) (13,361) (12,379)
25 Total Exposures (sum of lines 21 and 24, less the amount reported in line 2) – All-in basis 1,037,880 980,212
26 Leverage ratio – All-in basis 4.0% 4.2%
Q4 2015
LEVERAGE RATIO FRAMEWORK
($MM) Item (1) Q1 2016
(1) On-balance sheet items excludes securities purchased under resale agreements and securities borrowed ($96,267), derivative financial instruments ($51,958), assets
outside the regulatory scope of consolidation ($990).
Page 29
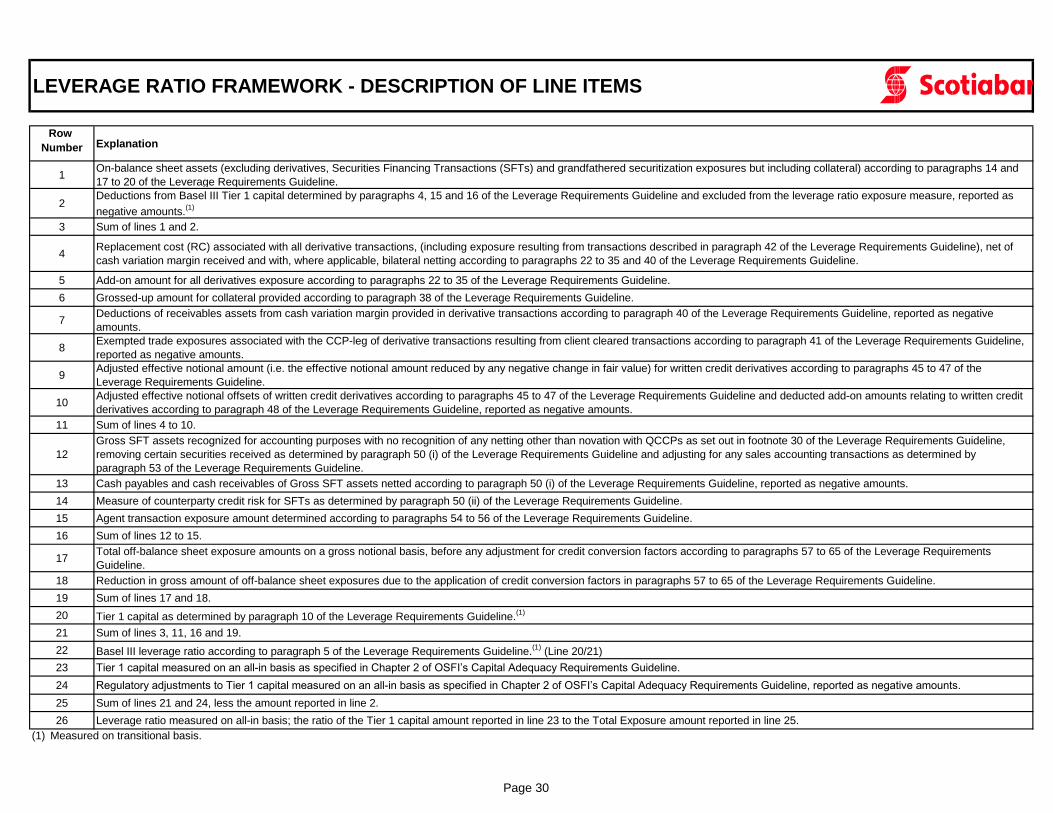
Row
Number Explanation
1On-balance sheet assets (excluding derivatives, Securities Financing Transactions (SFTs) and grandfathered securitization exposures but including collateral) according to paragraphs 14 and
17 to 20 of the Leverage Requirements Guideline.
2Deductions from Basel III Tier 1 capital determined by paragraphs 4, 15 and 16 of the Leverage Requirements Guideline and excluded from the leverage ratio exposure measure, reported as
negative amounts.(1)
3 Sum of lines 1 and 2.
4Replacement cost (RC) associated with all derivative transactions, (including exposure resulting from transactions described in paragraph 42 of the Leverage Requirements Guideline), net of
cash variation margin received and with, where applicable, bilateral netting according to paragraphs 22 to 35 and 40 of the Leverage Requirements Guideline.
5 Add-on amount for all derivatives exposure according to paragraphs 22 to 35 of the Leverage Requirements Guideline.
6 Grossed-up amount for collateral provided according to paragraph 38 of the Leverage Requirements Guideline.
7Deductions of receivables assets from cash variation margin provided in derivative transactions according to paragraph 40 of the Leverage Requirements Guideline, reported as negative
amounts.
8Exempted trade exposures associated with the CCP-leg of derivative transactions resulting from client cleared transactions according to paragraph 41 of the Leverage Requirements Guideline,
reported as negative amounts.
9Adjusted effective notional amount (i.e. the effective notional amount reduced by any negative change in fair value) for written credit derivatives according to paragraphs 45 to 47 of the
Leverage Requirements Guideline.
10Adjusted effective notional offsets of written credit derivatives according to paragraphs 45 to 47 of the Leverage Requirements Guideline and deducted add-on amounts relating to written credit
derivatives according to paragraph 48 of the Leverage Requirements Guideline, reported as negative amounts.
11 Sum of lines 4 to 10.
12
Gross SFT assets recognized for accounting purposes with no recognition of any netting other than novation with QCCPs as set out in footnote 30 of the Leverage Requirements Guideline,
removing certain securities received as determined by paragraph 50 (i) of the Leverage Requirements Guideline and adjusting for any sales accounting transactions as determined by
paragraph 53 of the Leverage Requirements Guideline.
13 Cash payables and cash receivables of Gross SFT assets netted according to paragraph 50 (i) of the Leverage Requirements Guideline, reported as negative amounts.
14 Measure of counterparty credit risk for SFTs as determined by paragraph 50 (ii) of the Leverage Requirements Guideline.
15 Agent transaction exposure amount determined according to paragraphs 54 to 56 of the Leverage Requirements Guideline.
16 Sum of lines 12 to 15.
17Total off-balance sheet exposure amounts on a gross notional basis, before any adjustment for credit conversion factors according to paragraphs 57 to 65 of the Leverage Requirements
Guideline.
18 Reduction in gross amount of off-balance sheet exposures due to the application of credit conversion factors in paragraphs 57 to 65 of the Leverage Requirements Guideline.
19 Sum of lines 17 and 18.
20 Tier 1 capital as determined by paragraph 10 of the Leverage Requirements Guideline.(1)
21 Sum of lines 3, 11, 16 and 19.
22 Basel III leverage ratio according to paragraph 5 of the Leverage Requirements Guideline.(1)
(Line 20/21)
23 Tier 1 capital measured on an all-in basis as specified in Chapter 2 of OSFI’s Capital Adequacy Requirements Guideline.
24 Regulatory adjustments to Tier 1 capital measured on an all-in basis as specified in Chapter 2 of OSFI’s Capital Adequacy Requirements Guideline, reported as negative amounts.
25 Sum of lines 21 and 24, less the amount reported in line 2.
26 Leverage ratio measured on all-in basis; the ratio of the Tier 1 capital amount reported in line 23 to the Total Exposure amount reported in line 25.
(1) Measured on transitional basis.
LEVERAGE RATIO FRAMEWORK - DESCRIPTION OF LINE ITEMS
Page 30
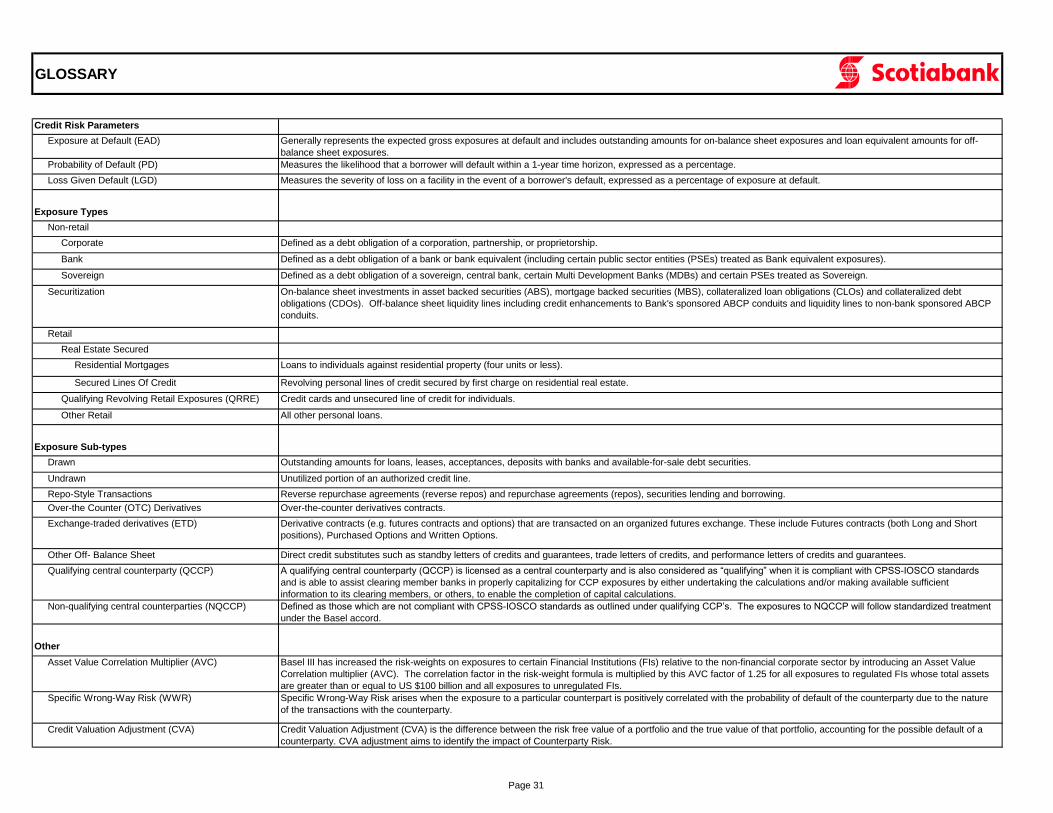
GLOSSARY
Credit Risk Parameters
Exposure at Default (EAD) Generally represents the expected gross exposures at default and includes outstanding amounts for on-balance sheet exposures and loan equivalent amounts for off-
balance sheet exposures.
Probability of Default (PD) Measures the likelihood that a borrower will default within a 1-year time horizon, expressed as a percentage.
Loss Given Default (LGD) Measures the severity of loss on a facility in the event of a borrower's default, expressed as a percentage of exposure at default.
Exposure Types
Non-retail
Corporate Defined as a debt obligation of a corporation, partnership, or proprietorship.
Bank Defined as a debt obligation of a bank or bank equivalent (including certain public sector entities (PSEs) treated as Bank equivalent exposures).
Sovereign Defined as a debt obligation of a sovereign, central bank, certain Multi Development Banks (MDBs) and certain PSEs treated as Sovereign.
Securitization On-balance sheet investments in asset backed securities (ABS), mortgage backed securities (MBS), collateralized loan obligations (CLOs) and collateralized debt
obligations (CDOs). Off-balance sheet liquidity lines including credit enhancements to Bank's sponsored ABCP conduits and liquidity lines to non-bank sponsored ABCP
conduits.
Retail
Real Estate Secured
Residential Mortgages Loans to individuals against residential property (four units or less).
Secured Lines Of Credit Revolving personal lines of credit secured by first charge on residential real estate.
Qualifying Revolving Retail Exposures (QRRE) Credit cards and unsecured line of credit for individuals.
Other Retail All other personal loans.
Exposure Sub-types
Drawn Outstanding amounts for loans, leases, acceptances, deposits with banks and available-for-sale debt securities.
Undrawn Unutilized portion of an authorized credit line.
Repo-Style Transactions Reverse repurchase agreements (reverse repos) and repurchase agreements (repos), securities lending and borrowing.
Over-the Counter (OTC) Derivatives Over-the-counter derivatives contracts.
Exchange-traded derivatives (ETD) Derivative contracts (e.g. futures contracts and options) that are transacted on an organized futures exchange. These include Futures contracts (both Long and Short
positions), Purchased Options and Written Options.
Other Off- Balance Sheet Direct credit substitutes such as standby letters of credits and guarantees, trade letters of credits, and performance letters of credits and guarantees.
Qualifying central counterparty (QCCP) A qualifying central counterparty (QCCP) is licensed as a central counterparty and is also considered as “qualifying” when it is compliant with CPSS-IOSCO standards
and is able to assist clearing member banks in properly capitalizing for CCP exposures by either undertaking the calculations and/or making available sufficient
information to its clearing members, or others, to enable the completion of capital calculations.
Non-qualifying central counterparties (NQCCP) Defined as those which are not compliant with CPSS-IOSCO standards as outlined under qualifying CCP’s. The exposures to NQCCP will follow standardized treatment
under the Basel accord.
Other
Asset Value Correlation Multiplier (AVC) Basel III has increased the risk-weights on exposures to certain Financial Institutions (FIs) relative to the non-financial corporate sector by introducing an Asset Value
Correlation multiplier (AVC). The correlation factor in the risk-weight formula is multiplied by this AVC factor of 1.25 for all exposures to regulated FIs whose total assets
are greater than or equal to US $100 billion and all exposures to unregulated FIs.
Specific Wrong-Way Risk (WWR) Specific Wrong-Way Risk arises when the exposure to a particular counterpart is positively correlated with the probability of default of the counterparty due to the nature
of the transactions with the counterparty.
Credit Valuation Adjustment (CVA) Credit Valuation Adjustment (CVA) is the difference between the risk free value of a portfolio and the true value of that portfolio, accounting for the possible default of a
counterparty. CVA adjustment aims to identify the impact of Counterparty Risk.
Page 31